Embed Size (px)
Citation preview
CFA Institute Market Intelligence 1 1
CFA Institute Member Survey: XBRL
December 2011
CFA Institute Market Intelligence 2 2
Contents Executive Summary........................................................................................................................................ 3
XBRL Related Questions .............................................................................................................................. 3
General Financial Analysis Questions ......................................................................................................... 4
About the Survey ........................................................................................................................................ 4
Results ............................................................................................................................................................ 6
XBRL Related Questions .............................................................................................................................. 6
Awareness of XBRL ................................................................................................................................. 6
XBRL Usage by Source (of those aware of XBRL) .................................................................................... 8
XBRL Expected Benefits (of those aware of XBRL) ................................................................................. 9
XBRL Extensions (of those aware of XBRL) ........................................................................................... 10
Audits of XBRL Data (of those aware of XBRL) ..................................................................................... 11
XBRL Comparability (of those aware of XBRL) ...................................................................................... 12
XBRL Data Set Importance .................................................................................................................... 13
Importance of XBRL Data Set ................................................................................................................ 14
Number of countries for which XBRL information is accessed ............................................................ 15
General Financial Analysis Questions ....................................................................................................... 16
How members obtain companies’ financial data/information for use in evaluation & analysis ......... 16
Importance of source documents to analysis and evaluation ............................................................. 17
Methodology ................................................................................................................................................ 20
Questionnaire Development ..................................................................................................................... 20
Sampling ................................................................................................................................................... 20
Distribution ............................................................................................................................................... 20
Analysis and Reporting ............................................................................................................................. 20
Response Rate and Demographics ........................................................................................................... 21
Appendix: ..................................................................................................................................................... 24
Appendix A: Open Ended Responses ........................................................................................................ 24
CFA Institute Market Intelligence 3 3
Executive Summary
XBRL Related Questions Awareness of XBRL rises once again with the results of our 2011 survey with 47 percent of respondents with some level of XBRL awareness; 38 percent are aware of XBRL but not up-to-date on its usage in financial reporting, and 9 percent are aware of it and of plans for its usage in financial reporting. This overall awareness compares to 45 percent in 2009 and 41 percent in 2007. Awareness is significantly lower among members in Asia Pacific and EMEA than it is among those in the Americas. In EMEA, 34 percent are aware of XBRL and in Asia Pacific, 35 percent are aware. Conversely, in the Americas, 47 percent are aware of XBRL. In aggregate, and within regions, awareness is significantly lower among new CFA charterholders (those who have had their charter less than two years) and non-charterholder members (28 percent and 43 percent are aware, respectively) than among more tenured charterholders (59 percent of those with the CFA for 2-10 years are aware, up 10 percentage points from 2009 and 66 percent of those with the CFA for more than 10 years are aware, the same as in 2009). With regard to occupations, academics have the highest awareness (66 percent aware), followed by credit analysts (54 percent aware), portfolio managers (53 percent aware), research analysts (47 percent aware), investment banking analysts (36 percent aware), and financial advisors (36 percent aware).
45 percent think that individually tagging all reported information for a company allows the user to determine the importance of the item to a fair valuation of the company. 34 percent of respondents think that individually tagging will make it easier for the data aggregators to integrate the information into their normalized databases.
82 percent said it is important to have tagged information available for all companies across a meaningful set of annual and interim periods and 75 percent of respondents said it is important to have tagged information available for all sections of annual reports across a meaningful set of periods.
The majority of respondents indicated that they would prefer improved resources to import and/or analyze information available from third party vendors or regulators for free. A significantly higher proportion of respondents in EMEA compared to APAC and AMER indicated high importance to improved resources to import and/or analyze information available from third party vendors or the regulator for a price.
As in 2007 and 2009, respondents indicate the use of XBRL tagged interactive data will have the largest effect or improvement on uploading company data into financial analysis models, accessing companies data regarding the level of timeliness and making comparisons between companies and/or industries. Unlike in 2007 and 2009 those obtaining most or all of their information from 3rd party data providers do not indicate a higher effect/improvement than those manually extracting most or all of their data from source documents.
60 percent think that companies should have limited ability to create new tags in order to reflect unique business activities or transactions not defined by the current XBRL taxonomy (tags are predefined according to current financial reporting standards), down from 67 percent in 2009 and 28 percent think
CFA Institute Market Intelligence 4 4
companies should not be able to create new tags (only current XBRL taxonomy or list of tags should be used and tags are predefined according to current financial reporting standards).
48 percent of those aware of XBRL think incorporation of the XBRL report into the standard financial statement audit as to the appropriateness of XBRL tagging of reported amounts in accordance with the GAAP defined tags is necessary, increasing from 41 percent in 2009. 19 percent think a separate audit by an independent auditor is necessary (down from 27 percent in 2009).
General Financial Analysis Questions Similar to 2007 and 2009, the majority of respondents obtain companies’ financial data/information used in their evaluation and analysis either mostly from 3rd party data providers with some limited amount of data extracted manually from source documents (34 percent) or mostly extracted manually from source documents with limited data obtained from 3rd party data providers (36 percent). 18 percent indicate they manually extract all the data/information from source documents, down slightly from 21 percent in 2009. Regionally 52 percent in AMER (up 6 percentage points from 2009) obtain most or all of the data/information used in their evaluation & analysis of companies’ performance & evaluation from 3rd party data providers, compared to only 41 percent in APAC (up 9 percentage points from 2009) and 30 percent in EMEA (down 4 percentage points from 2009).
Annual reports, interim reports, and quarterly earnings releases are rated as the most important source documents in members’ analysis and evaluation of companies’ financial condition and performance, the same as 2007 and 2009. The importance of each of the following source documents is significantly higher among respondents who indicate most or all of their data/information used in analysis & evaluation is manually extracted from source documents than among those who get most or all of their information from 3rd party data providers: interim reports, annual reports, special events reports, periodic supplements/fact books, and prospectus/registration statements for initial public offerings
About the Survey The purpose of this poll was to obtain CFA Institute member feedback on issues relating to eXtensible Business Reporting Language (XBRL) tagged data.
The objectives of this survey were:
• To obtain CFA Institute member feedback on issues relating to XBRL tagged data— to ensure a broad view of the “end user” of financial reports and other disclosures,
• To gain inputs on key areas involving the development and implementation of XBRL tagged data for financial reporting to the capital markets, and to know the factors that are important to members in accessing and analyzing companies’ financial data.
• To compare results from December 2011 survey with the XBRL surveys conducted in June 2007 and November 2009 to measure current awareness levels and determine whether usage levels of XBRL data have changed from previous years.
CFA Institute Market Intelligence 5 5
An e-mail invitation with a link to a web-based survey was sent to 3,000 members on 28 November with a full distribution to approximately 14,000 members on 29 November and a reminder was sent on 6 December 2011. The survey closed on midnight (PST) on 16 December 2011. The survey questionnaire consisted of eleven questions, all of which were similar to the 2007 and 2009 XBRL member survey with three additional questions. 527 valid responses were received, for an overall response rate of 3.2%. The margin of error (based on the sampling frame population) is ±4.25 % at the 95 percent confidence level. Margin of error will vary by question, as the number of respondents varies by question.
Note: Many questions gave participants the option to respond “no opinion”; these have been excluded from the calculations on those particular questions and noted throughout the report.
CFA Institute Market Intelligence 6 6
Results
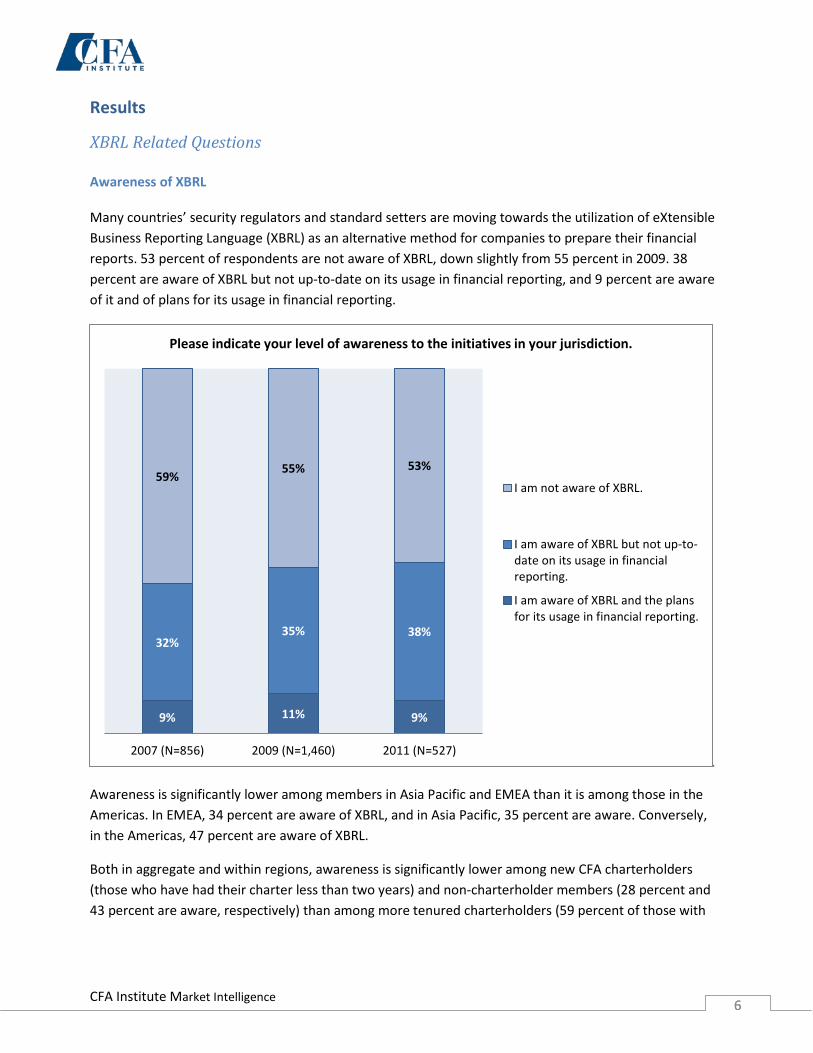
XBRL Related Questions Awareness of XBRL Many countries’ security regulators and standard setters are moving towards the utilization of eXtensible Business Reporting Language (XBRL) as an alternative method for companies to prepare their financial reports. 53 percent of respondents are not aware of XBRL, down slightly from 55 percent in 2009. 38 percent are aware of XBRL but not up-to-date on its usage in financial reporting, and 9 percent are aware of it and of plans for its usage in financial reporting.
Awareness is significantly lower among members in Asia Pacific and EMEA than it is among those in the Americas. In EMEA, 34 percent are aware of XBRL, and in Asia Pacific, 35 percent are aware. Conversely, in the Americas, 47 percent are aware of XBRL.
Both in aggregate and within regions, awareness is significantly lower among new CFA charterholders (those who have had their charter less than two years) and non-charterholder members (28 percent and 43 percent are aware, respectively) than among more tenured charterholders (59 percent of those with
9% 11% 9%
32% 35% 38%
59% 55% 53%
2007 (N=856) 2009 (N=1,460) 2011 (N=527)
Please indicate your level of awareness to the initiatives in your jurisdiction.
I am not aware of XBRL.
I am aware of XBRL but not up-to-date on its usage in financialreporting.
I am aware of XBRL and the plansfor its usage in financial reporting.
CFA Institute Market Intelligence 7 7
the CFA for 2-10 years are aware, up from 49 percent in 2009 and 66 percent of those with the CFA for more than 10 years are aware, the same as in 2009).
With regard to occupations, academics have the highest awareness (66 percent aware), followed by credit analysts (54 percent aware), portfolio managers (53 percent aware), research analysts (47 percent aware), investment banking analysts (36 percent aware), and financial advisor (36 percent aware).
CFA Institute Market Intelligence 8 8
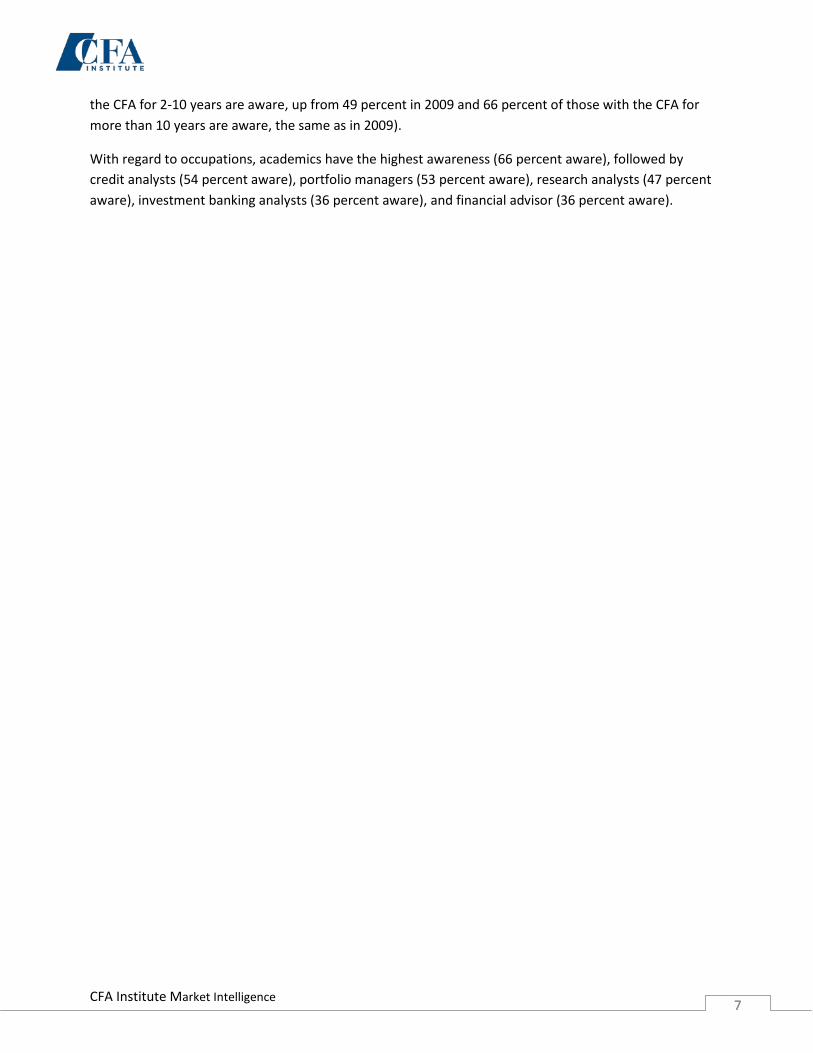
XBRL Usage by Source (of those aware of XBRL) Of those aware of XBRL, the use of XBRL tagged information remains limited according to the survey results. Using information through an XBRL instance document reader/viewer is slightly higher than it was in 2009, and extracting/importing data is consistent with 2007 and 2009 findings.
10%
16% 17%
8% 9% 9% 8%
13% 15%
5% 4% 4%
9%
11%
15%
4% 4% 3%
9%
11%
15%
5% 5% 4%
2007 2009 2011 2007 2009 2011
Use information through an XBRL instance documentreader/viewer
Extract or import XBRL tagged data directly intofinancial analysis models
Please indicate whether you currently use and/or extract XBRL tagged data from the following source documents.
Based on respondents aware of XBRL (2007, N=354 / 2009, N=664 / 2011, N=246)
Periodic reports filed with national stock exchanges or securities regulators
IPO psospectuses or other capital offering registration statements filed with national stock exchanges or securities regulators
Special event reports filed with national stock exchanges or securities regulators
Periodic reports or documents filed with prudential regulators
CFA Institute Market Intelligence 9 9
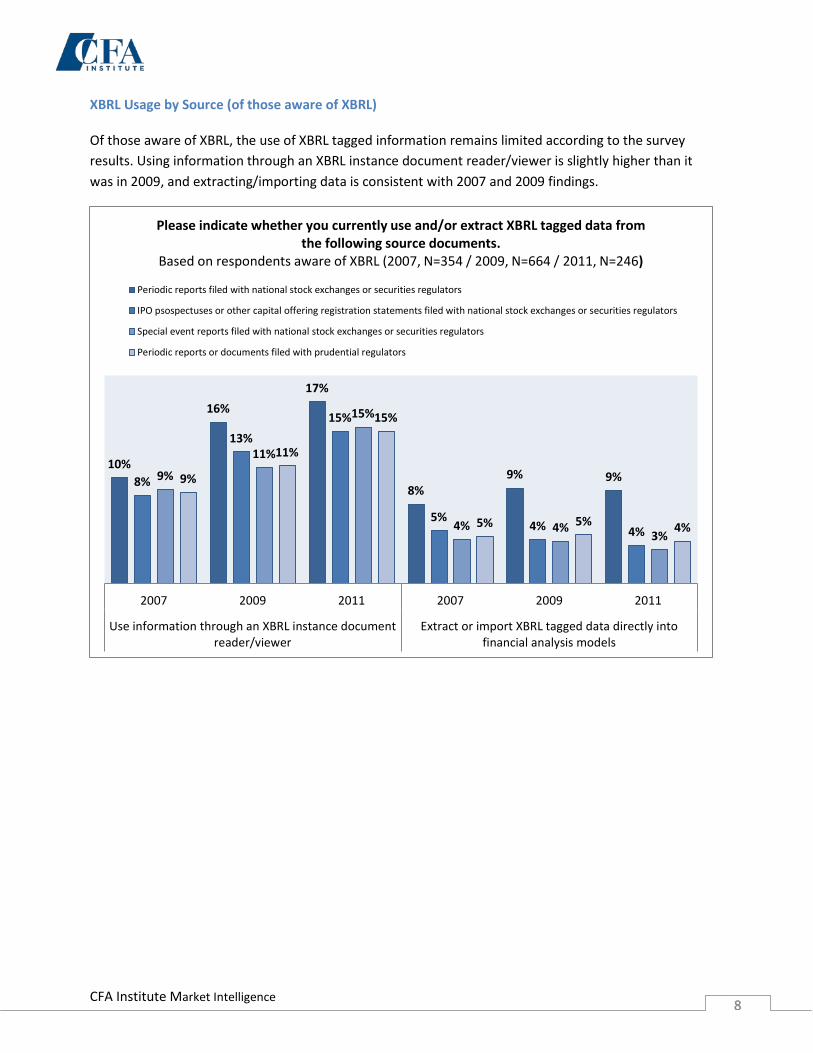
XBRL Expected Benefits (of those aware of XBRL) As in 2007 and 2009, respondents indicate the use of XBRL tagged interactive data will have the largest effect or improvement on uploading company data into financial analysis models, accessing companies data regarding the level of timeliness and making comparisons between companies and/or industries.
Those obtaining most or all of their information from 3rd party data providers do not indicate a higher effect/improvement than do those manually extracting most or all of their data from source documents.
12%
13%
13%
9%
10%
14%
13%
14%
16%
17%
16%
8%
15%
17%
19%
23%
19%
25%
19%
19%
21%
23%
25%
22%
27%
28%
26%
29%
30%
27%
31%
29%
27%
26%
29%
31%
70%
68%
66%
68%
65%
64%
59%
58%
59%
53%
54%
64%
54%
54%
54%
51%
52%
44%
2007
2009
2011
2007
2009
2011
2007
2009
2011
2007
2009
2011
2007
2009
2011
2007
2009
2011
Upl
oad
com
pany
data
into
your
fina
ncia
lm
odel
s
Mak
eco
mpa
rison
sbe
twee
nco
mpa
nies
and/
orin
dust
ries
Anal
yze
com
pani
es'
perf
orm
ance
Incr
ease
the
timel
ines
s of
the
valu
atio
npr
oces
s
Acce
ssco
mpa
nies
'da
ta a
t ade
eper
leve
lof
disa
ggre
gatio
n or
gran
ular
ity
Rely
on
data
used
in y
our
anal
ysis
Indicate how the use of XBRL tagged interactive data, which is computer readable, will most likely affect your ability to do the following aspects of
your review and evaluation of companies' financial reports and other corporate disclosures.
Low effect/improvement (1+2) 3 High effect/improvement (4+5)
Note: “No-opinion” response not included.
Scale: 1 (No effect/improvement) to 5 (Significant effect/improvement); no opinion
CFA Institute Market Intelligence 10 10
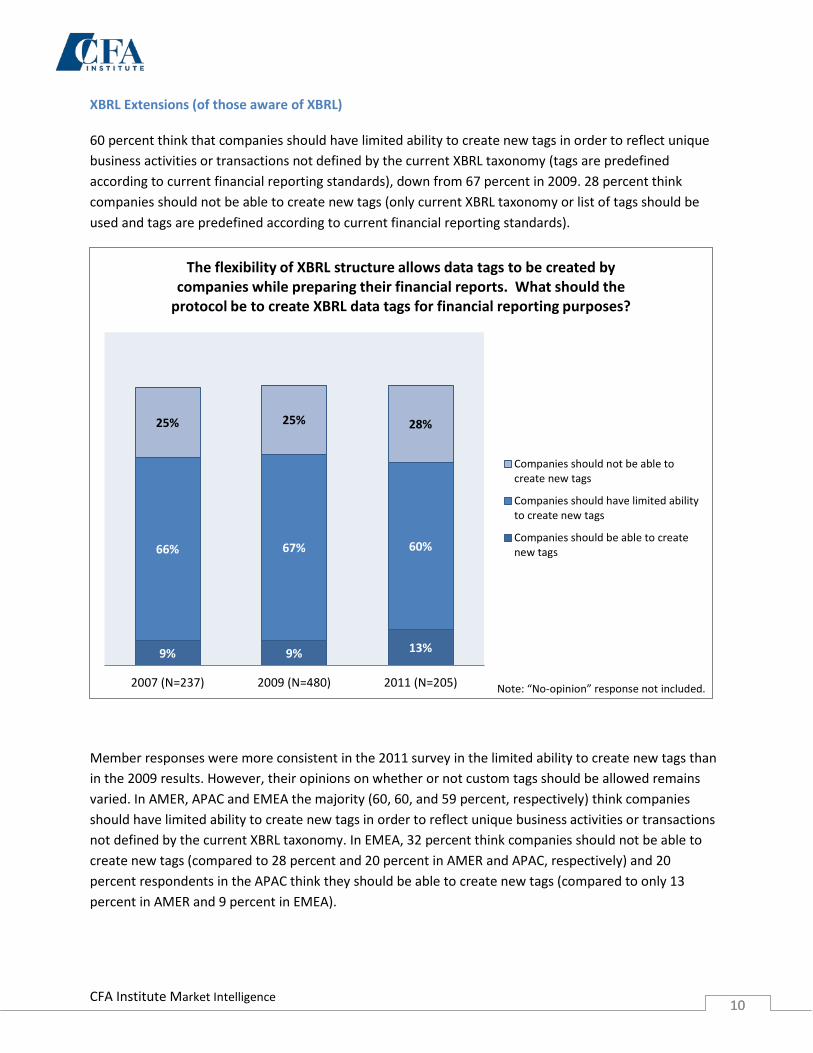
XBRL Extensions (of those aware of XBRL) 60 percent think that companies should have limited ability to create new tags in order to reflect unique business activities or transactions not defined by the current XBRL taxonomy (tags are predefined according to current financial reporting standards), down from 67 percent in 2009. 28 percent think companies should not be able to create new tags (only current XBRL taxonomy or list of tags should be used and tags are predefined according to current financial reporting standards).
Member responses were more consistent in the 2011 survey in the limited ability to create new tags than in the 2009 results. However, their opinions on whether or not custom tags should be allowed remains varied. In AMER, APAC and EMEA the majority (60, 60, and 59 percent, respectively) think companies should have limited ability to create new tags in order to reflect unique business activities or transactions not defined by the current XBRL taxonomy. In EMEA, 32 percent think companies should not be able to create new tags (compared to 28 percent and 20 percent in AMER and APAC, respectively) and 20 percent respondents in the APAC think they should be able to create new tags (compared to only 13 percent in AMER and 9 percent in EMEA).
9% 9% 13%
66% 67% 60%
25% 25% 28%
2007 (N=237) 2009 (N=480) 2011 (N=205)
The flexibility of XBRL structure allows data tags to be created by companies while preparing their financial reports. What should the
protocol be to create XBRL data tags for financial reporting purposes?
Companies should not be able tocreate new tags
Companies should have limited abilityto create new tags
Companies should be able to createnew tags
Note: “No-opinion” response not included.
CFA Institute Market Intelligence 11 11
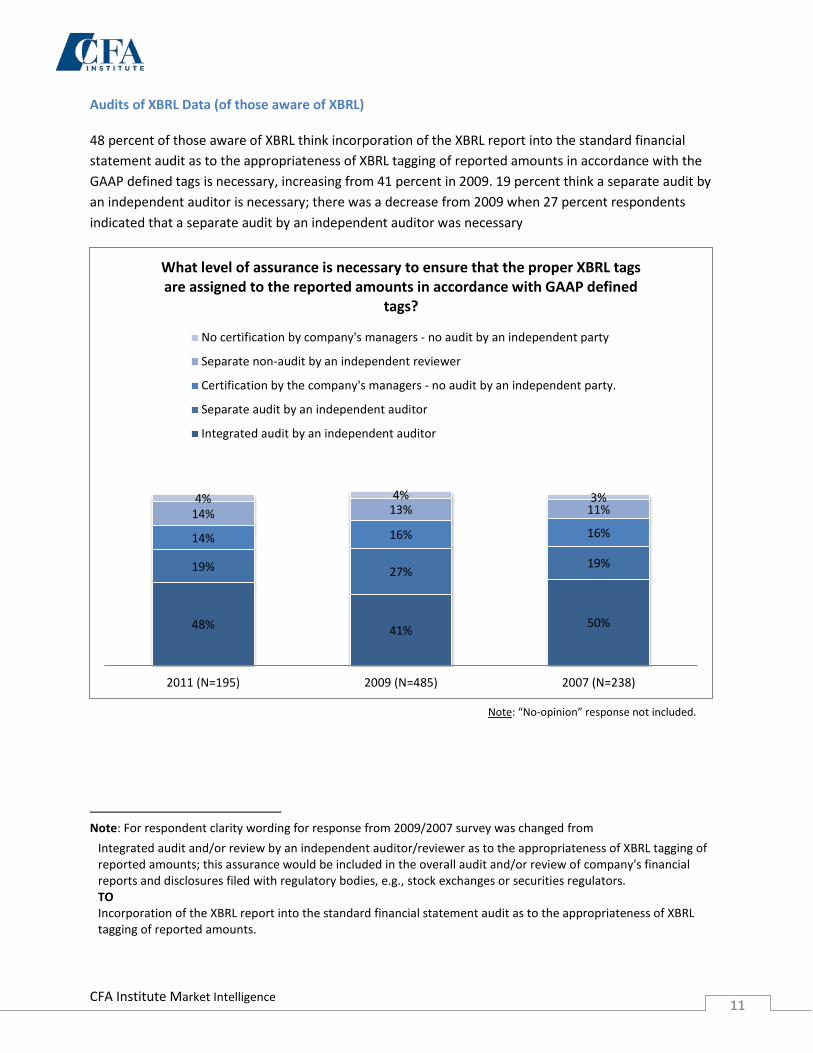
Audits of XBRL Data (of those aware of XBRL) 48 percent of those aware of XBRL think incorporation of the XBRL report into the standard financial statement audit as to the appropriateness of XBRL tagging of reported amounts in accordance with the GAAP defined tags is necessary, increasing from 41 percent in 2009. 19 percent think a separate audit by an independent auditor is necessary; there was a decrease from 2009 when 27 percent respondents indicated that a separate audit by an independent auditor was necessary
1
Note: For respondent clarity wording for response from 2009/2007 survey was changed from Integrated audit and/or review by an independent auditor/reviewer as to the appropriateness of XBRL tagging of reported amounts; this assurance would be included in the overall audit and/or review of company's financial reports and disclosures filed with regulatory bodies, e.g., stock exchanges or securities regulators. TO Incorporation of the XBRL report into the standard financial statement audit as to the appropriateness of XBRL tagging of reported amounts.
48% 41% 50%
19% 27% 19%
14% 16% 16% 14% 13% 11% 4% 4% 3%
2011 (N=195) 2009 (N=485) 2007 (N=238)
What level of assurance is necessary to ensure that the proper XBRL tags are assigned to the reported amounts in accordance with GAAP defined
tags?
No certification by company's managers - no audit by an independent party
Separate non-audit by an independent reviewer
Certification by the company's managers - no audit by an independent party.
Separate audit by an independent auditor
Integrated audit by an independent auditor
Note: “No-opinion” response not included.
CFA Institute Market Intelligence 12 12
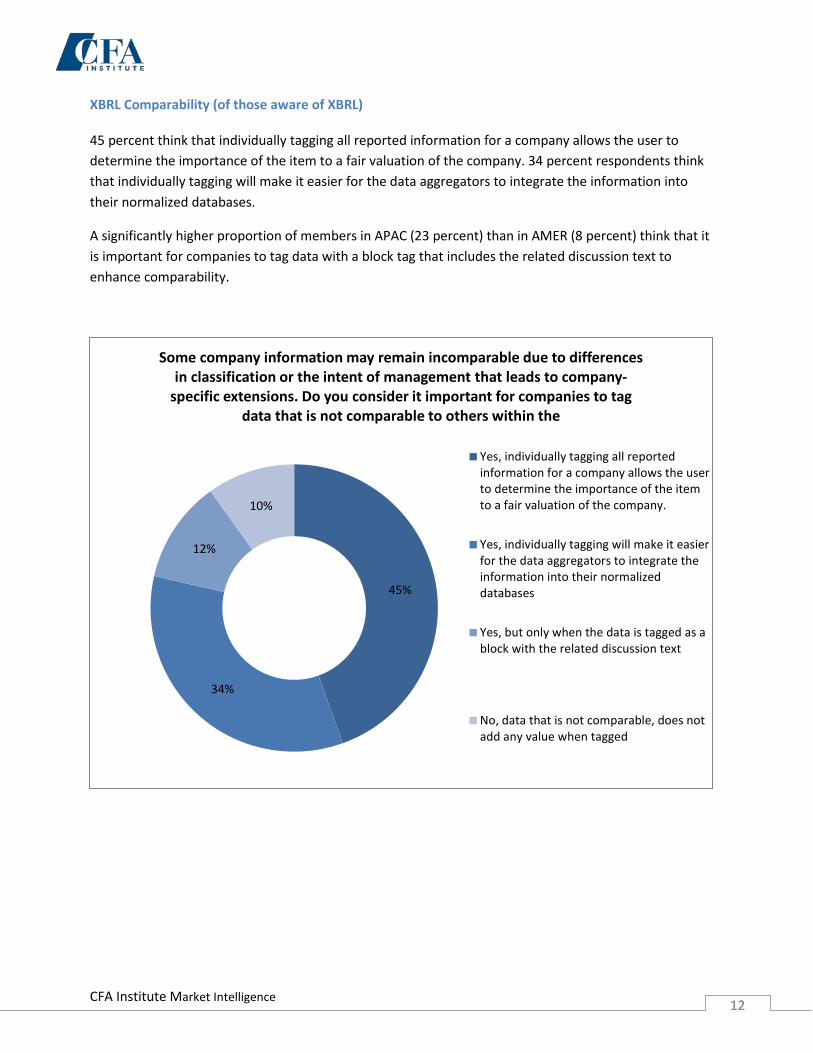
XBRL Comparability (of those aware of XBRL) 45 percent think that individually tagging all reported information for a company allows the user to determine the importance of the item to a fair valuation of the company. 34 percent respondents think that individually tagging will make it easier for the data aggregators to integrate the information into their normalized databases.
A significantly higher proportion of members in APAC (23 percent) than in AMER (8 percent) think that it is important for companies to tag data with a block tag that includes the related discussion text to enhance comparability.
45%
34%
12%
10%
Some company information may remain incomparable due to differences in classification or the intent of management that leads to company-
specific extensions. Do you consider it important for companies to tag data that is not comparable to others within the
Yes, individually tagging all reportedinformation for a company allows the userto determine the importance of the itemto a fair valuation of the company.
Yes, individually tagging will make it easierfor the data aggregators to integrate theinformation into their normalizeddatabases
Yes, but only when the data is tagged as ablock with the related discussion text
No, data that is not comparable, does notadd any value when tagged
CFA Institute Market Intelligence 13 13
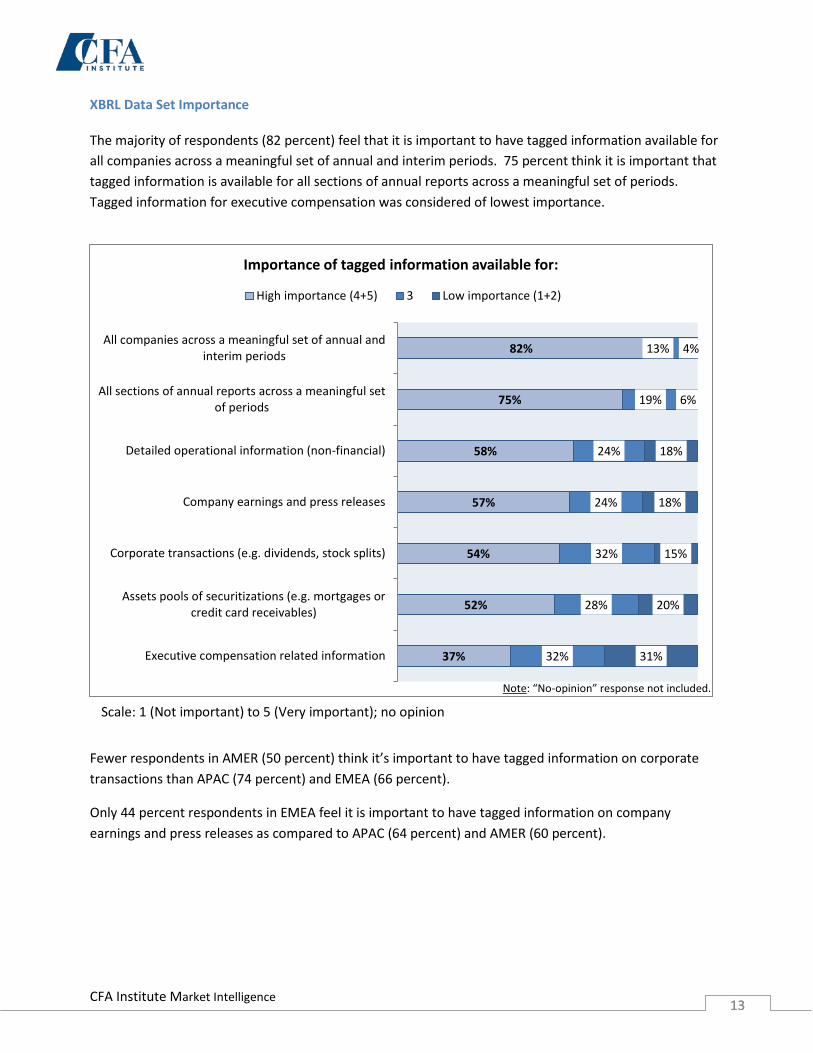
XBRL Data Set Importance The majority of respondents (82 percent) feel that it is important to have tagged information available for all companies across a meaningful set of annual and interim periods. 75 percent think it is important that tagged information is available for all sections of annual reports across a meaningful set of periods. Tagged information for executive compensation was considered of lowest importance.
Fewer respondents in AMER (50 percent) think it’s important to have tagged information on corporate transactions than APAC (74 percent) and EMEA (66 percent).
Only 44 percent respondents in EMEA feel it is important to have tagged information on company earnings and press releases as compared to APAC (64 percent) and AMER (60 percent).
82%
75%
58%
57%
54%
52%
37%
13%
19%
24%
24%
32%
28%
32%
4%
6%
18%
18%
15%
20%
31%
All companies across a meaningful set of annual andinterim periods
All sections of annual reports across a meaningful setof periods
Detailed operational information (non-financial)
Company earnings and press releases
Corporate transactions (e.g. dividends, stock splits)
Assets pools of securitizations (e.g. mortgages orcredit card receivables)
Executive compensation related information
Importance of tagged information available for:
High importance (4+5) 3 Low importance (1+2)
Note: “No-opinion” response not included.
Scale: 1 (Not important) to 5 (Very important); no opinion
CFA Institute Market Intelligence 14 14
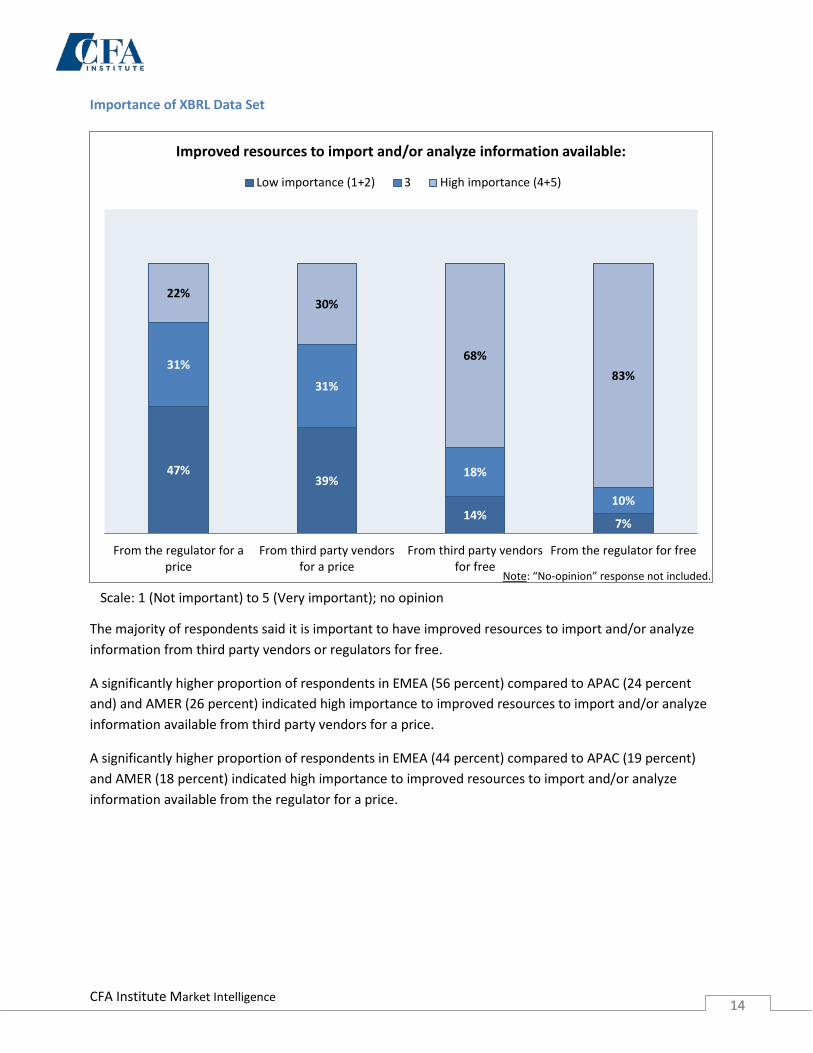
Importance of XBRL Data Set
The majority of respondents said it is important to have improved resources to import and/or analyze information from third party vendors or regulators for free.
A significantly higher proportion of respondents in EMEA (56 percent) compared to APAC (24 percent and) and AMER (26 percent) indicated high importance to improved resources to import and/or analyze information available from third party vendors for a price.
A significantly higher proportion of respondents in EMEA (44 percent) compared to APAC (19 percent) and AMER (18 percent) indicated high importance to improved resources to import and/or analyze information available from the regulator for a price.
47% 39%
14% 7%
31%
31%
18%
10%
22% 30%
68% 83%
From the regulator for aprice
From third party vendorsfor a price
From third party vendorsfor free
From the regulator for free
Improved resources to import and/or analyze information available:
Low importance (1+2) 3 High importance (4+5)
Note: “No-opinion” response not included.
Scale: 1 (Not important) to 5 (Very important); no opinion
CFA Institute Market Intelligence 15 15
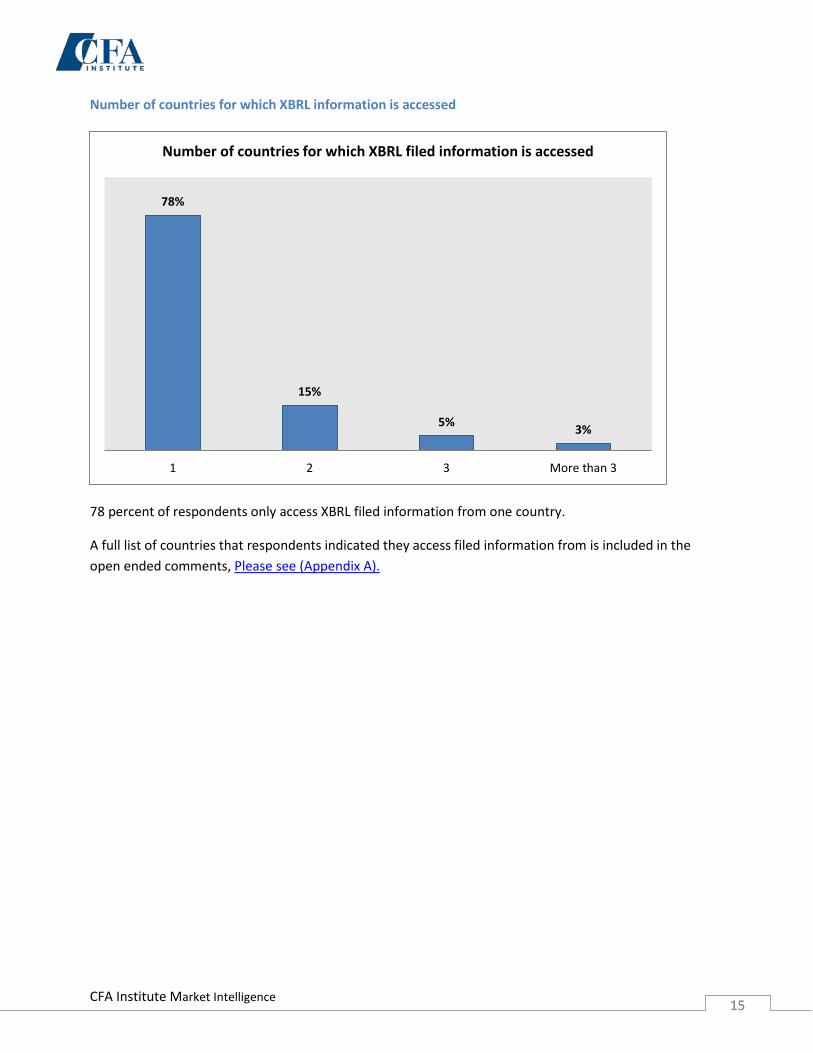
Number of countries for which XBRL information is accessed
78 percent of respondents only access XBRL filed information from one country.
A full list of countries that respondents indicated they access filed information from is included in the open ended comments, Please see (Appendix A).
78%
15%
5% 3%
1 2 3 More than 3
Number of countries for which XBRL filed information is accessed
CFA Institute Market Intelligence 16 16
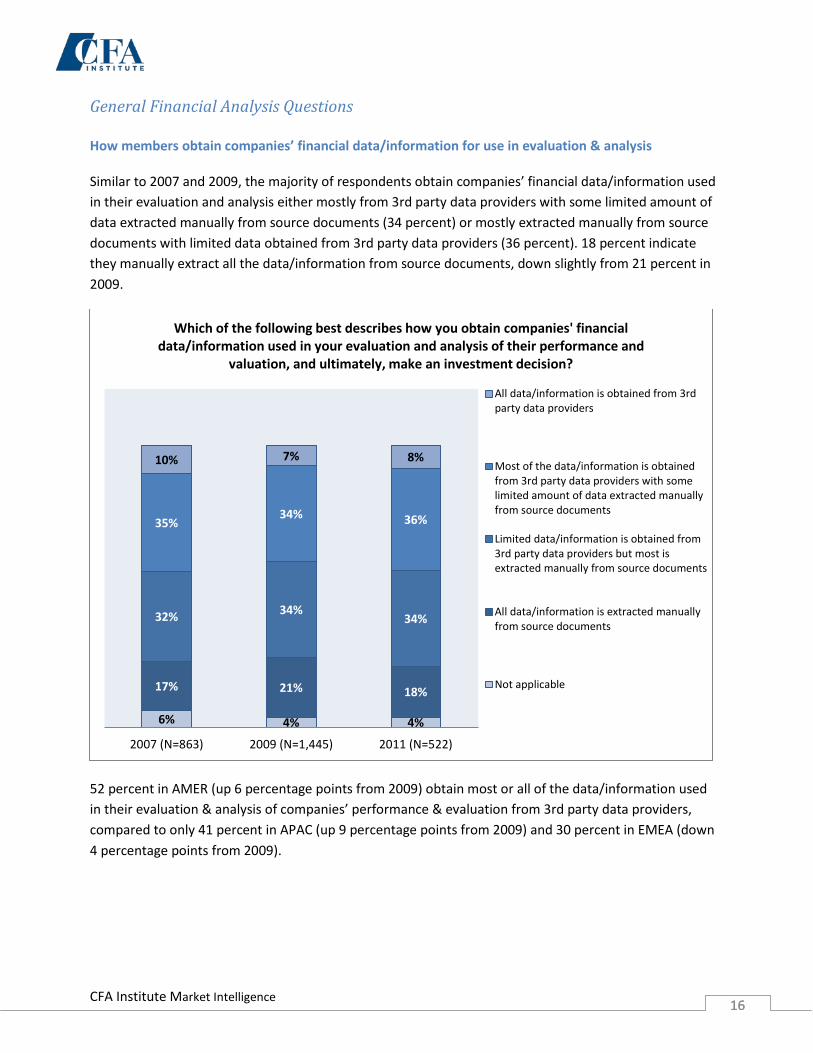
General Financial Analysis Questions How members obtain companies’ financial data/information for use in evaluation & analysis Similar to 2007 and 2009, the majority of respondents obtain companies’ financial data/information used in their evaluation and analysis either mostly from 3rd party data providers with some limited amount of data extracted manually from source documents (34 percent) or mostly extracted manually from source documents with limited data obtained from 3rd party data providers (36 percent). 18 percent indicate they manually extract all the data/information from source documents, down slightly from 21 percent in 2009.
52 percent in AMER (up 6 percentage points from 2009) obtain most or all of the data/information used in their evaluation & analysis of companies’ performance & evaluation from 3rd party data providers, compared to only 41 percent in APAC (up 9 percentage points from 2009) and 30 percent in EMEA (down 4 percentage points from 2009).
6% 4% 4%
17% 21% 18%
32% 34% 34%
35% 34% 36%
10% 7% 8%
2007 (N=863) 2009 (N=1,445) 2011 (N=522)
Which of the following best describes how you obtain companies' financial data/information used in your evaluation and analysis of their performance and
valuation, and ultimately, make an investment decision?
All data/information is obtained from 3rdparty data providers
Most of the data/information is obtainedfrom 3rd party data providers with somelimited amount of data extracted manuallyfrom source documents
Limited data/information is obtained from3rd party data providers but most isextracted manually from source documents
All data/information is extracted manuallyfrom source documents
Not applicable
CFA Institute Market Intelligence 17 17
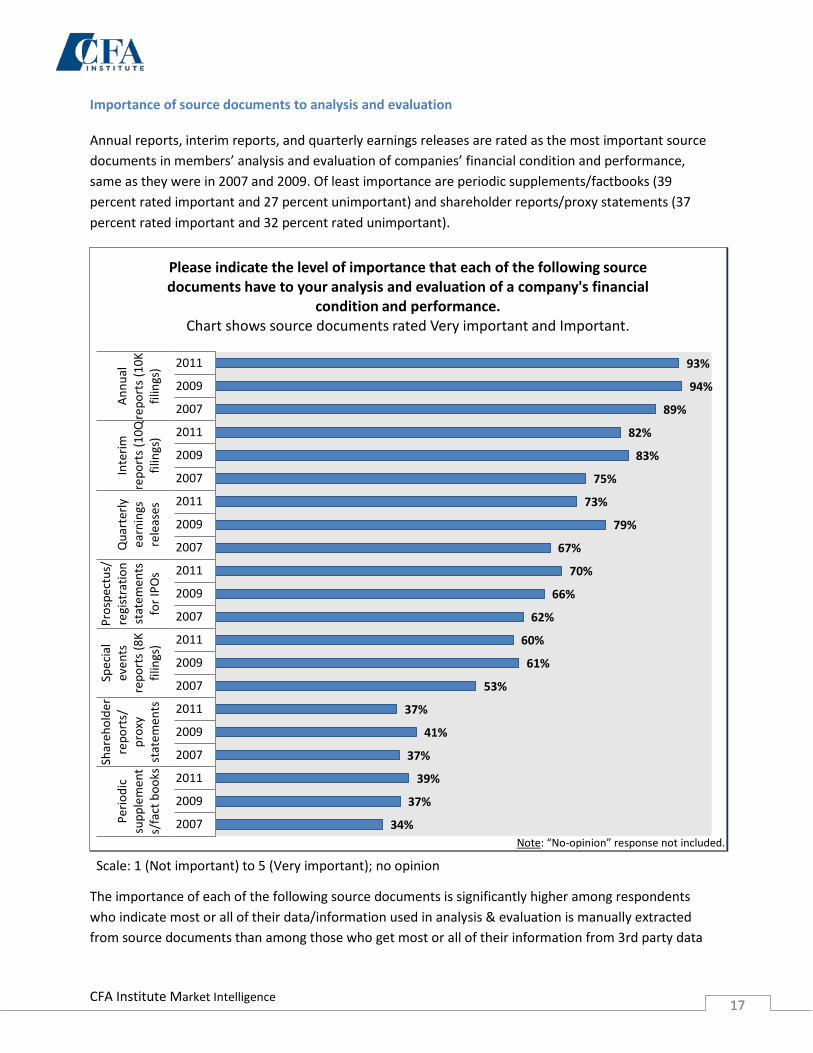
Importance of source documents to analysis and evaluation Annual reports, interim reports, and quarterly earnings releases are rated as the most important source documents in members’ analysis and evaluation of companies’ financial condition and performance, same as they were in 2007 and 2009. Of least importance are periodic supplements/factbooks (39 percent rated important and 27 percent unimportant) and shareholder reports/proxy statements (37 percent rated important and 32 percent rated unimportant).
The importance of each of the following source documents is significantly higher among respondents who indicate most or all of their data/information used in analysis & evaluation is manually extracted from source documents than among those who get most or all of their information from 3rd party data
93%
94%
89%
82%
83%
75%
73%
79%
67%
70%
66%
62%
60%
61%
53%
37%
41%
37%
39%
37%
34%
2011
2009
2007
2011
2009
2007
2011
2009
2007
2011
2009
2007
2011
2009
2007
2011
2009
2007
2011
2009
2007
Annu
alre
port
s (10
Kfil
ings
)
Inte
rimre
port
s (10
Qfil
ings
)
Qua
rter
lyea
rnin
gsre
leas
es
Pros
pect
us/
regi
stra
tion
stat
emen
tsfo
r IPO
s
Spec
ial
even
tsre
port
s (8K
filin
gs)
Shar
ehol
der
repo
rts/
prox
yst
atem
ents
Perio
dic
supp
lem
ent
s/fa
ct b
ooks
Please indicate the level of importance that each of the following source documents have to your analysis and evaluation of a company's financial
condition and performance. Chart shows source documents rated Very important and Important.
Note: “No-opinion” response not included.
Scale: 1 (Not important) to 5 (Very important); no opinion
CFA Institute Market Intelligence 18 18
providers: interim reports, annual reports, special events reports, periodic supplements/fact books, and prospectus/registration statements for initial public offerings. The importance of source document prospectus/registration statements for initial public offerings is significantly high in APAC (83%) and EMEA (74%) compared to AMER (64%).
CFA Institute Market Intelligence 19 19
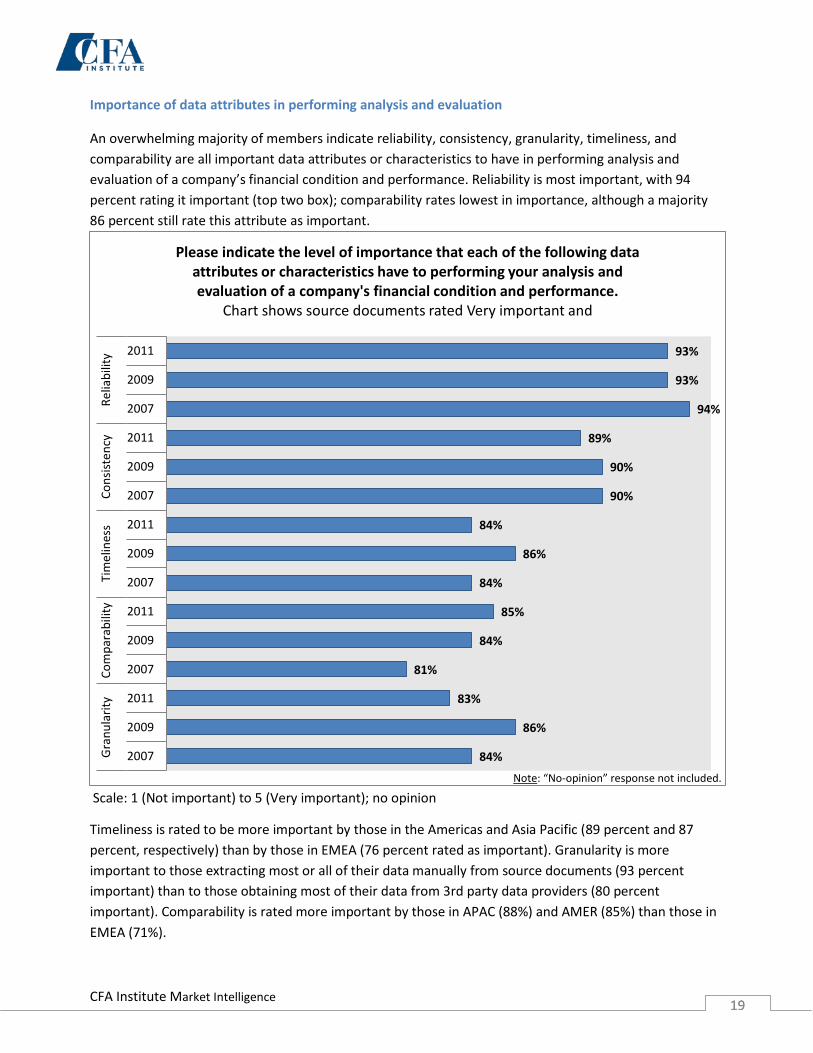
Importance of data attributes in performing analysis and evaluation
An overwhelming majority of members indicate reliability, consistency, granularity, timeliness, and comparability are all important data attributes or characteristics to have in performing analysis and evaluation of a company’s financial condition and performance. Reliability is most important, with 94 percent rating it important (top two box); comparability rates lowest in importance, although a majority 86 percent still rate this attribute as important.
Timeliness is rated to be more important by those in the Americas and Asia Pacific (89 percent and 87 percent, respectively) than by those in EMEA (76 percent rated as important). Granularity is more important to those extracting most or all of their data manually from source documents (93 percent important) than to those obtaining most of their data from 3rd party data providers (80 percent important). Comparability is rated more important by those in APAC (88%) and AMER (85%) than those in EMEA (71%).
93%
93%
94%
89%
90%
90%
84%
86%
84%
85%
84%
81%
83%
86%
84%
2011
2009
2007
2011
2009
2007
2011
2009
2007
2011
2009
2007
2011
2009
2007
Relia
bilit
yCo
nsist
ency
Tim
elin
ess
Com
para
bilit
yG
ranu
larit
y
Please indicate the level of importance that each of the following data attributes or characteristics have to performing your analysis and evaluation of a company's financial condition and performance.
Chart shows source documents rated Very important and
Scale: 1 (Not important) to 5 (Very important); no opinion Note: “No-opinion” response not included.
CFA Institute Market Intelligence 20 20
Methodology
Questionnaire Development The questionnaire was developed from the 2007 and 2009 XBRL survey. All repeated questions were kept exactly the same from the prior survey (except for one question) and three questions were added to the survey.
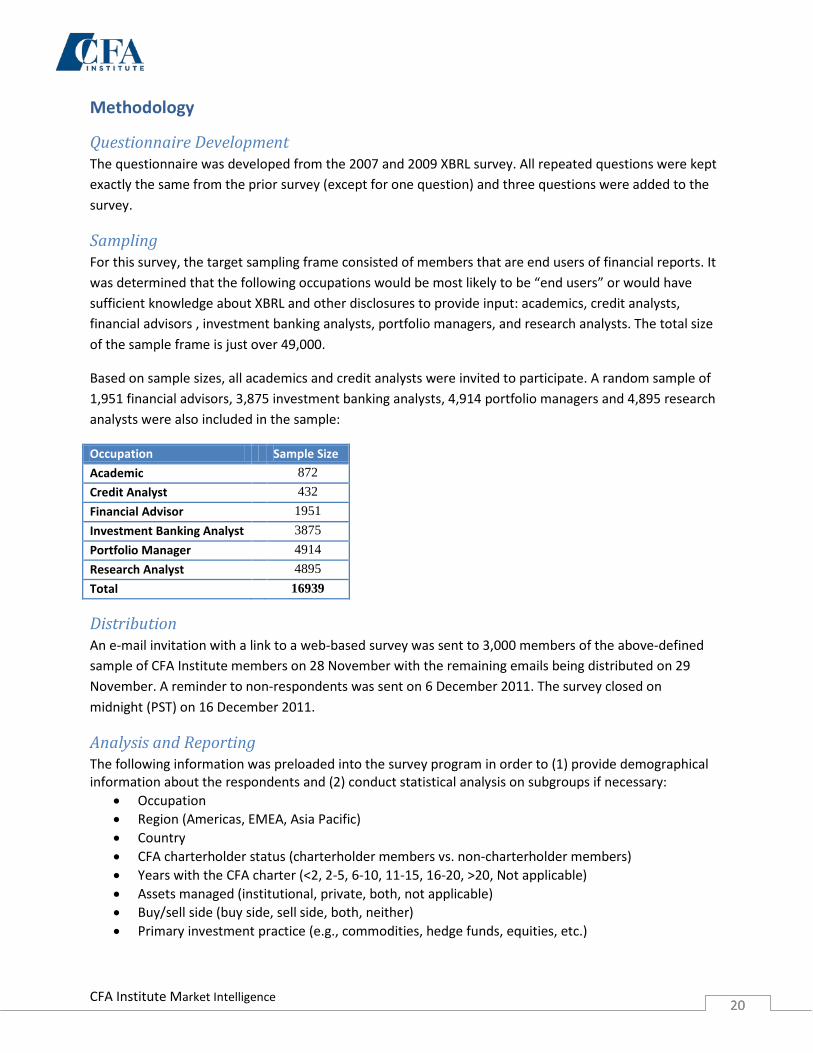
Sampling For this survey, the target sampling frame consisted of members that are end users of financial reports. It was determined that the following occupations would be most likely to be “end users” or would have sufficient knowledge about XBRL and other disclosures to provide input: academics, credit analysts, financial advisors , investment banking analysts, portfolio managers, and research analysts. The total size of the sample frame is just over 49,000.
Based on sample sizes, all academics and credit analysts were invited to participate. A random sample of 1,951 financial advisors, 3,875 investment banking analysts, 4,914 portfolio managers and 4,895 research analysts were also included in the sample:
Occupation Sample Size Academic 872 Credit Analyst 432 Financial Advisor 1951 Investment Banking Analyst 3875 Portfolio Manager 4914 Research Analyst 4895 Total 16939
Distribution An e-mail invitation with a link to a web-based survey was sent to 3,000 members of the above-defined sample of CFA Institute members on 28 November with the remaining emails being distributed on 29 November. A reminder to non-respondents was sent on 6 December 2011. The survey closed on midnight (PST) on 16 December 2011.
Analysis and Reporting The following information was preloaded into the survey program in order to (1) provide demographical information about the respondents and (2) conduct statistical analysis on subgroups if necessary:
• Occupation • Region (Americas, EMEA, Asia Pacific) • Country • CFA charterholder status (charterholder members vs. non-charterholder members) • Years with the CFA charter (<2, 2-5, 6-10, 11-15, 16-20, >20, Not applicable) • Assets managed (institutional, private, both, not applicable) • Buy/sell side (buy side, sell side, both, neither) • Primary investment practice (e.g., commodities, hedge funds, equities, etc.)
CFA Institute Market Intelligence 21 21
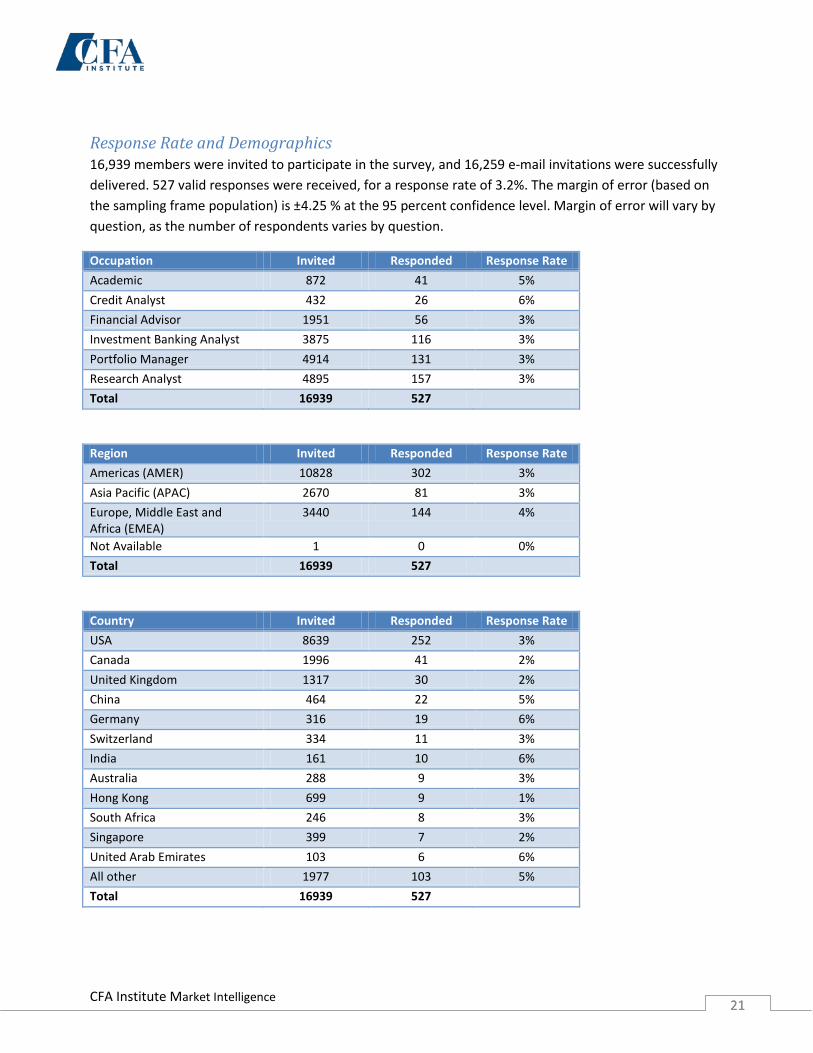
Response Rate and Demographics 16,939 members were invited to participate in the survey, and 16,259 e-mail invitations were successfully delivered. 527 valid responses were received, for a response rate of 3.2%. The margin of error (based on the sampling frame population) is ±4.25 % at the 95 percent confidence level. Margin of error will vary by question, as the number of respondents varies by question.
Occupation Invited Responded Response Rate Academic 872 41 5% Credit Analyst 432 26 6% Financial Advisor 1951 56 3% Investment Banking Analyst 3875 116 3% Portfolio Manager 4914 131 3% Research Analyst 4895 157 3% Total 16939 527
Region Invited Responded Response Rate Americas (AMER) 10828 302 3% Asia Pacific (APAC) 2670 81 3% Europe, Middle East and Africa (EMEA)
3440 144 4%
Not Available 1 0 0% Total 16939 527
Country Invited Responded Response Rate USA 8639 252 3% Canada 1996 41 2% United Kingdom 1317 30 2% China 464 22 5% Germany 316 19 6% Switzerland 334 11 3% India 161 10 6% Australia 288 9 3% Hong Kong 699 9 1% South Africa 246 8 3% Singapore 399 7 2% United Arab Emirates 103 6 6% All other 1977 103 5% Total 16939 527
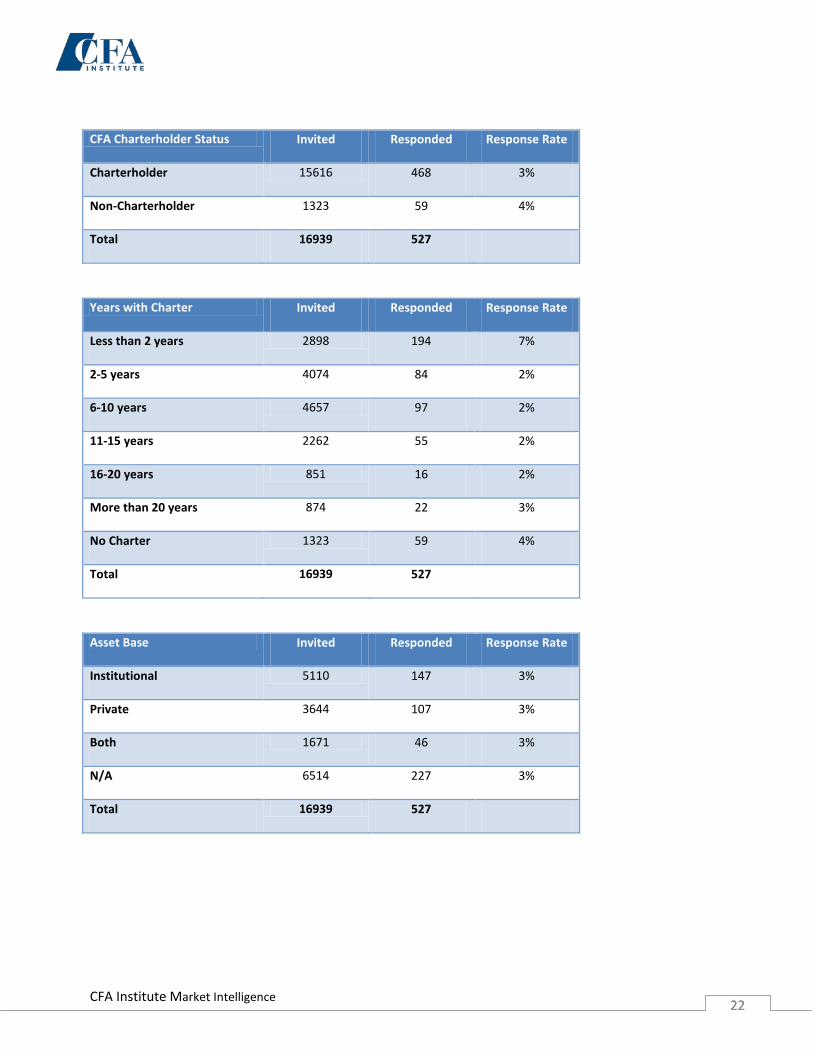
CFA Institute Market Intelligence 22 22
CFA Charterholder Status Invited Responded Response Rate
Charterholder 15616 468 3%
Non-Charterholder 1323 59 4%
Total 16939 527
Years with Charter Invited Responded Response Rate
Less than 2 years 2898 194 7%
2-5 years 4074 84 2%
6-10 years 4657 97 2%
11-15 years 2262 55 2%
16-20 years 851 16 2%
More than 20 years 874 22 3%
No Charter 1323 59 4%
Total 16939 527
Asset Base Invited Responded Response Rate
Institutional 5110 147 3%
Private 3644 107 3%
Both 1671 46 3%
N/A 6514 227 3%
Total 16939 527
CFA Institute Market Intelligence 23 23
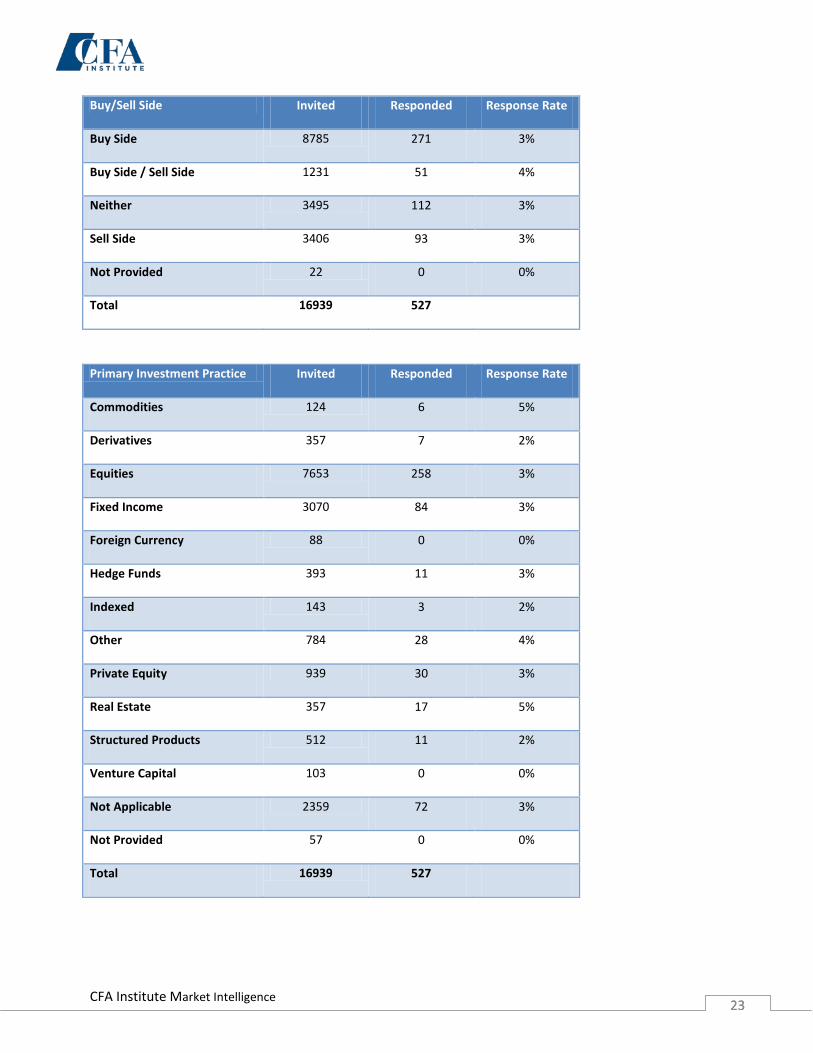
Buy/Sell Side Invited Responded Response Rate
Buy Side 8785 271 3%
Buy Side / Sell Side 1231 51 4%
Neither 3495 112 3%
Sell Side 3406 93 3%
Not Provided 22 0 0%
Total 16939 527
Primary Investment Practice Invited Responded Response Rate
Commodities 124 6 5%
Derivatives 357 7 2%
Equities 7653 258 3%
Fixed Income 3070 84 3%
Foreign Currency 88 0 0%
Hedge Funds 393 11 3%
Indexed 143 3 2%
Other 784 28 4%
Private Equity 939 30 3%
Real Estate 357 17 5%
Structured Products 512 11 2%
Venture Capital 103 0 0%
Not Applicable 2359 72 3%
Not Provided 57 0 0%
Total 16939 527

CFA Institute Market Intelligence 24 24
Appendix:
Appendix A: Open Ended Responses