Embed Size (px)
Citation preview
Study Session 16Fixed Income: Analysis and Valuation
CFA Level 1 Vol 2 Workbook.indb 337 10/28/2010 8:45:50 AM
338 Study Session 16 Fixed Income: Analysis and Valuation
Study Session 16Fi d IFixed Income:
Analysis and Valuation 65. Introduction to the Valuation of Debt Securities66. Yield Measures, Spot Rates, and Forward
Fixed Income Investments
Rates67. Introduction to the Measurement of Interest
Rate Risk
Fixed Income:Fixed Income:Analysis and Valuation
• Introduction to the
Fixed Income Investments
Valuation of Debt Securities
CFA Level 1 Vol 2 Workbook.indb 338 10/28/2010 8:45:50 AM
339Study Session 16 Fixed Income: Analysis and Valuation
SS#16 Fixed Income: Analysis and Valuation
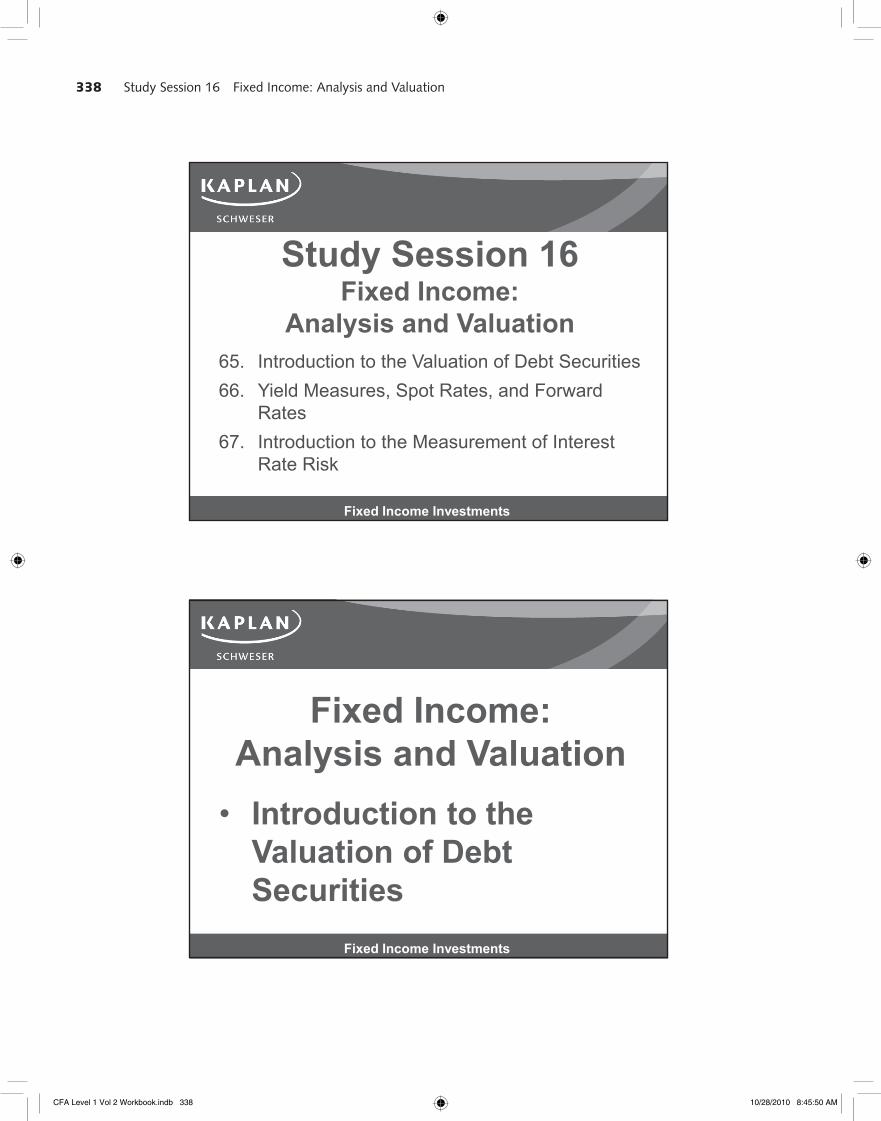
3-Step Bond Valuation ProcessBond value = present value of future cash flows, coupons and principal repayment
LOS 65.a, CFAI Vol. 5 p. 488 Valuation of Debt Securities
coupons, and principal repayment1. Estimate cash flows2. Determine the appropriate discount rate
The risk factors in SS15 all require increases in yield, including liquidity risk, interest rate risk,
2
call/prepayment risk, credit risk/default risk, etc.3. Calculate present values of promised cash flows
SS#16 Fixed Income: Analysis and Valuation
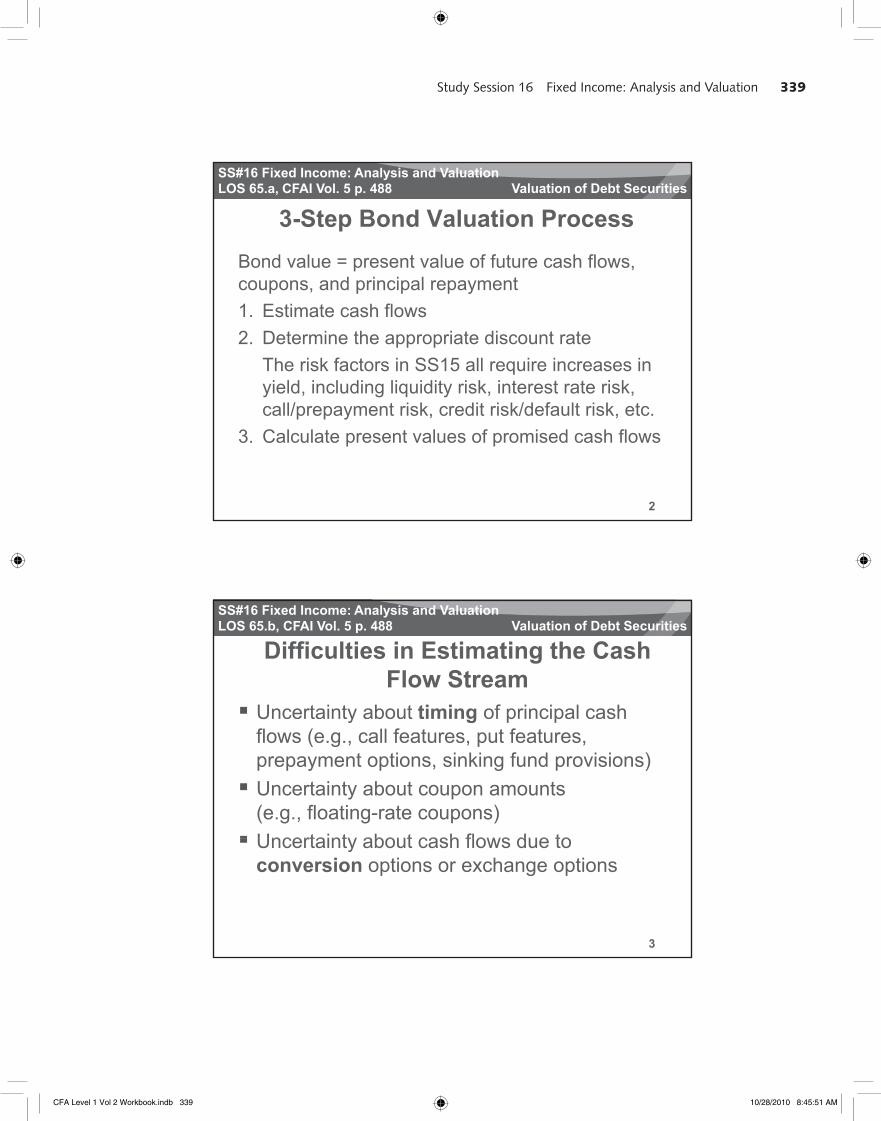
Difficulties in Estimating the Cash Flow Stream
Uncertainty about timing of principal cash
LOS 65.b, CFAI Vol. 5 p. 488 Valuation of Debt Securities
U y g p pflows (e.g., call features, put features, prepayment options, sinking fund provisions)Uncertainty about coupon amounts (e.g., floating-rate coupons)Uncertainty about cash flows due to
3
Uncertainty about cash flows due toconversion options or exchange options
CFA Level 1 Vol 2 Workbook.indb 339 10/28/2010 8:45:51 AM
340 Study Session 16 Fixed Income: Analysis and Valuation
SS#16 Fixed Income: Analysis and Valuation
Valuing an Annual-Pay Bond Using a Single Discount Rate
Term to maturity = 3 years
LOS 65.c, CFAI Vol. 5 p. 490 Valuation of Debt Securities
y 3 yPar = $1,000Coupon = 8% annual couponDiscount rate 12%
4
SS#16 Fixed Income: Analysis and Valuation
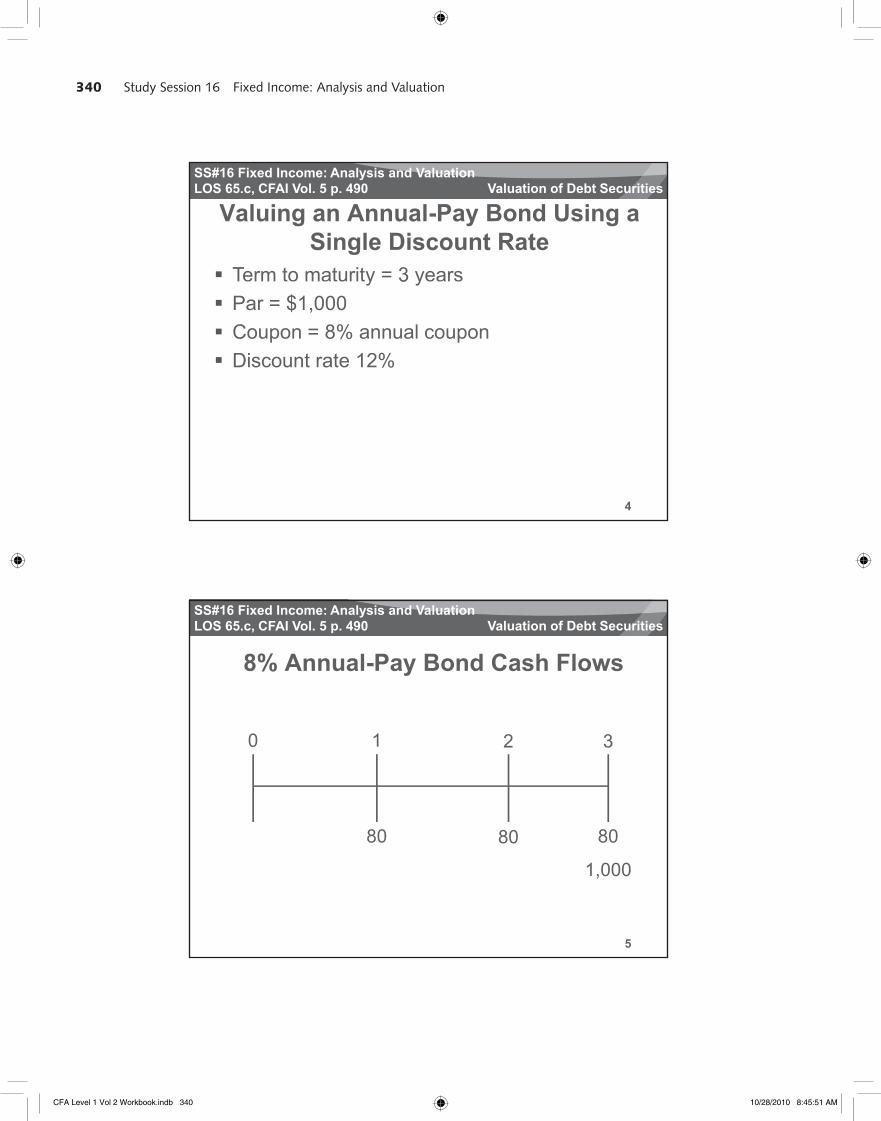
8% Annual-Pay Bond Cash FlowsLOS 65.c, CFAI Vol. 5 p. 490 Valuation of Debt Securities
0 1 2 3
80 80 80
5
80 80 80
1,000
CFA Level 1 Vol 2 Workbook.indb 340 10/28/2010 8:45:51 AM
341Study Session 16 Fixed Income: Analysis and Valuation
SS#16 Fixed Income: Analysis and Valuation
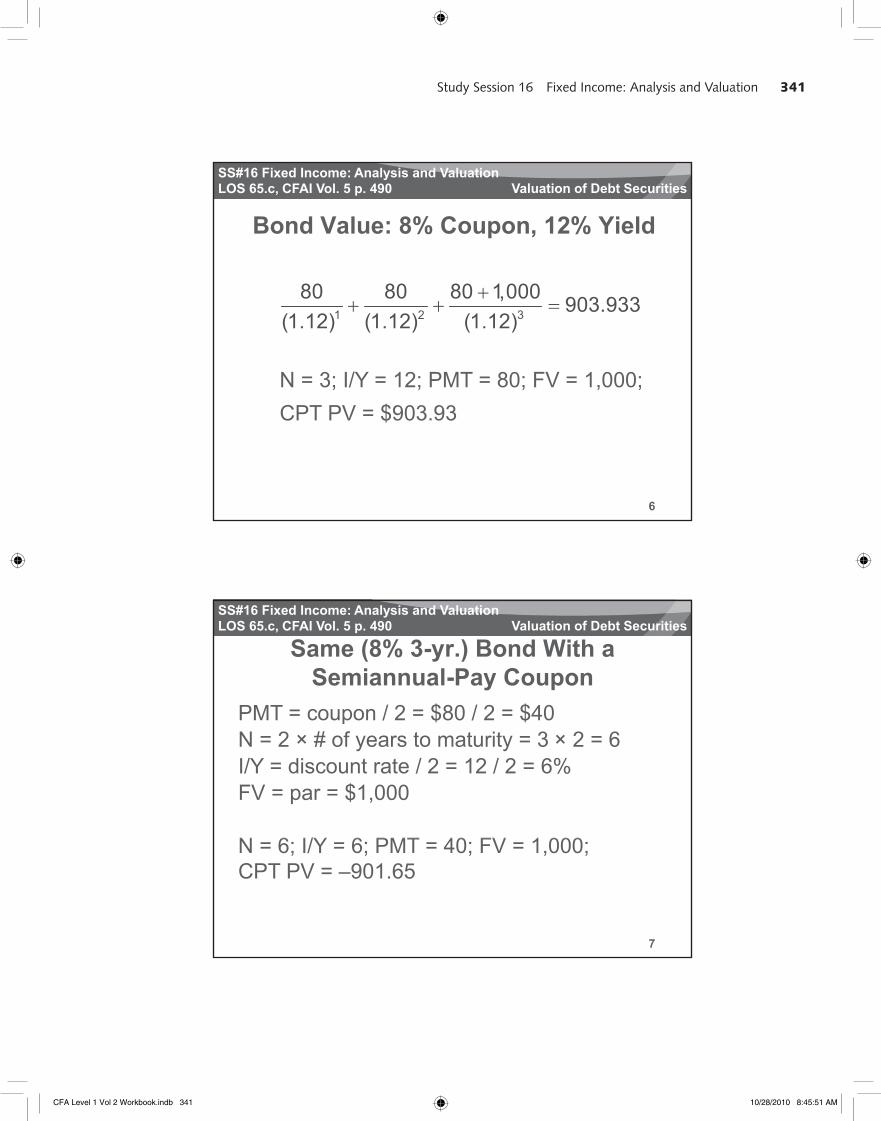
Bond Value: 8% Coupon, 12% YieldLOS 65.c, CFAI Vol. 5 p. 490 Valuation of Debt Securities
N = 3; I/Y = 12; PMT = 80; FV = 1,000;
1 2 3
80 80 80 1,000 903.933(1.12) (1.12) (1.12)
6
CPT PV = $903.93
SS#16 Fixed Income: Analysis and Valuation
Same (8% 3-yr.) Bond With a Semiannual-Pay Coupon
PMT = coupon / 2 = $80 / 2 = $40
LOS 65.c, CFAI Vol. 5 p. 490 Valuation of Debt Securities
PMT coupon / 2 $80 / 2 $40N = 2 × # of years to maturity = 3 × 2 = 6I/Y = discount rate / 2 = 12 / 2 = 6%FV = par = $1,000
N 6 I/Y 6 PMT 40 FV 1 000
7
N = 6; I/Y = 6; PMT = 40; FV = 1,000;CPT PV = –901.65
CFA Level 1 Vol 2 Workbook.indb 341 10/28/2010 8:45:51 AM
342 Study Session 16 Fixed Income: Analysis and Valuation
SS#16 Fixed Income: Analysis and Valuation
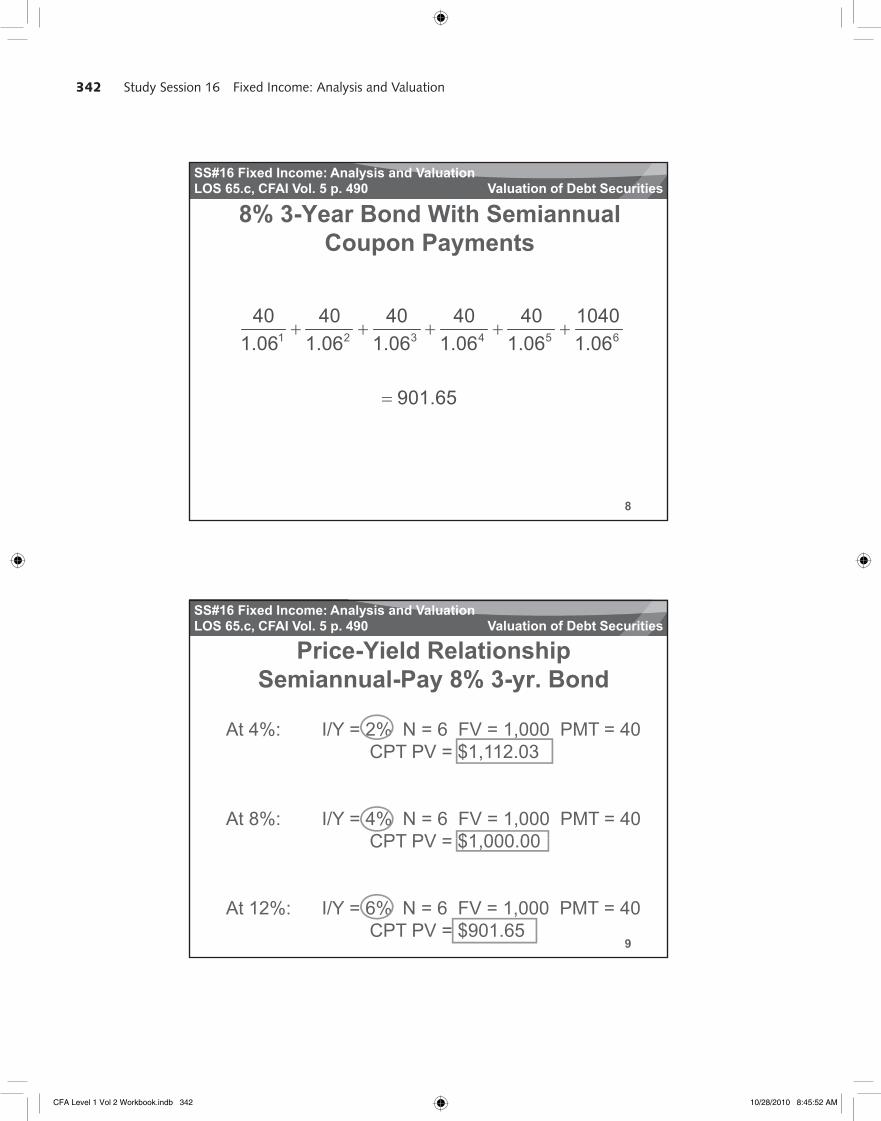
8% 3-Year Bond With Semiannual Coupon Payments
LOS 65.c, CFAI Vol. 5 p. 490 Valuation of Debt Securities
1 2 3 4 5 6
40 40 40 40 40 10401.06 1.06 1.06 1.06 1.06 1.06
901 65
8
901.65
SS#16 Fixed Income: Analysis and Valuation
Price-Yield RelationshipSemiannual-Pay 8% 3-yr. Bond
LOS 65.c, CFAI Vol. 5 p. 490 Valuation of Debt Securities
At 4%: I/Y = 2% N = 6 FV = 1,000 PMT = 40 CPT PV = $1,112.03
At 8%: I/Y = 4% N = 6 FV = 1,000 PMT = 40 CPT PV = $1 000 00
9
CPT PV = $1,000.00
At 12%: I/Y = 6% N = 6 FV = 1,000 PMT = 40 CPT PV = $901.65
CFA Level 1 Vol 2 Workbook.indb 342 10/28/2010 8:45:52 AM
343Study Session 16 Fixed Income: Analysis and Valuation
SS#16 Fixed Income: Analysis and Valuation
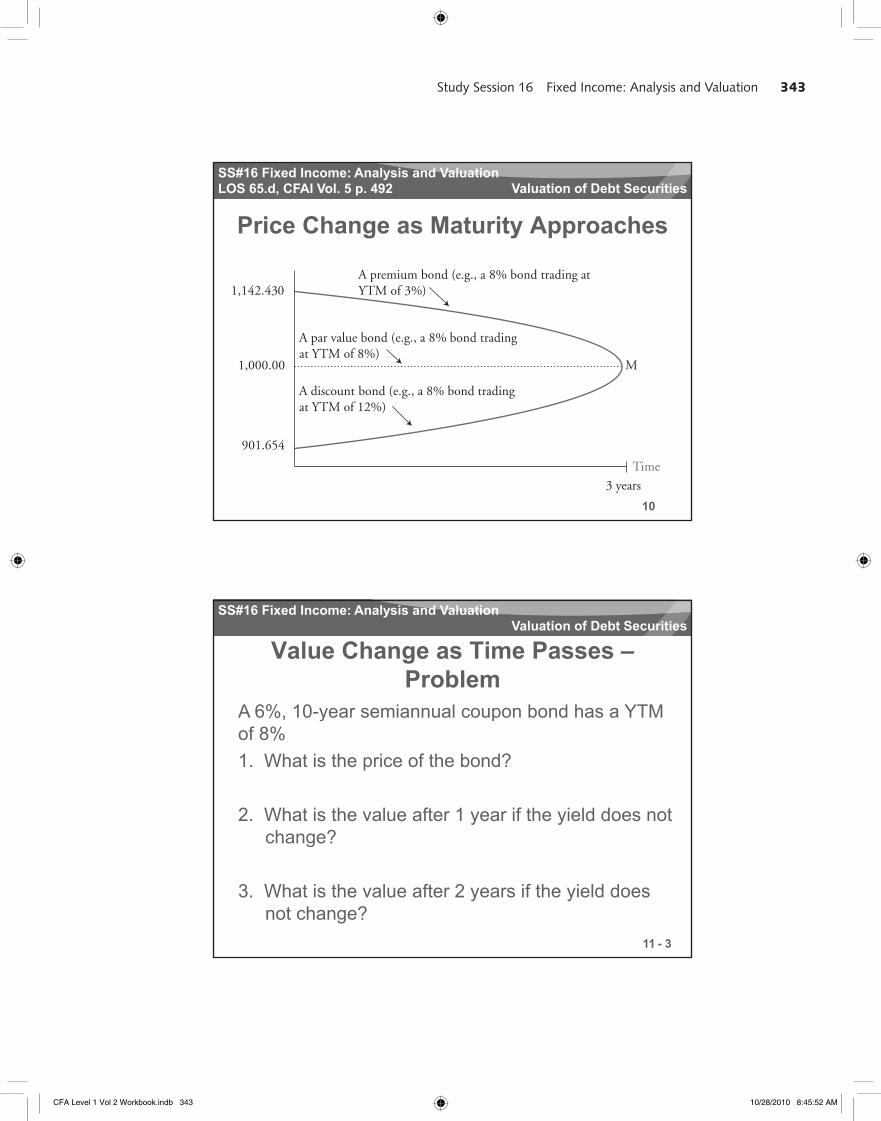
Price Change as Maturity Approaches
A premium bond (e.g., a 8% bond trading at
LOS 65.d, CFAI Vol. 5 p. 492 Valuation of Debt Securities
1,142.430
1,000.00 M
p g gYTM of 3%)
A par value bond (e.g., a 8% bond tradingat YTM of 8%)
A discount bond (e.g., a 8% bond trading
10
901.654
3 years
Time
at YTM of 12%)
SS#16 Fixed Income: Analysis and Valuation
Value Change as Time Passes –Problem
A 6%, 10-year semiannual coupon bond has a YTM
Valuation of Debt Securities
, y pof 8%1. What is the price of the bond?
2. What is the value after 1 year if the yield does not change?
N = 20, PMT = –30, FV = –1,000, I/Y = 4% PV = 864.10
11
change?
3. What is the value after 2 years if the yield does not change?
N = 18, PMT = –30, FV = –1,000, I/Y = 4% PV = 873.41
N = 16, PMT = –30, FV = –1,000, I/Y = 4% PV = 883.480- 3
CFA Level 1 Vol 2 Workbook.indb 343 10/28/2010 8:45:52 AM
344 Study Session 16 Fixed Income: Analysis and Valuation
SS#16 Fixed Income: Analysis and Valuation
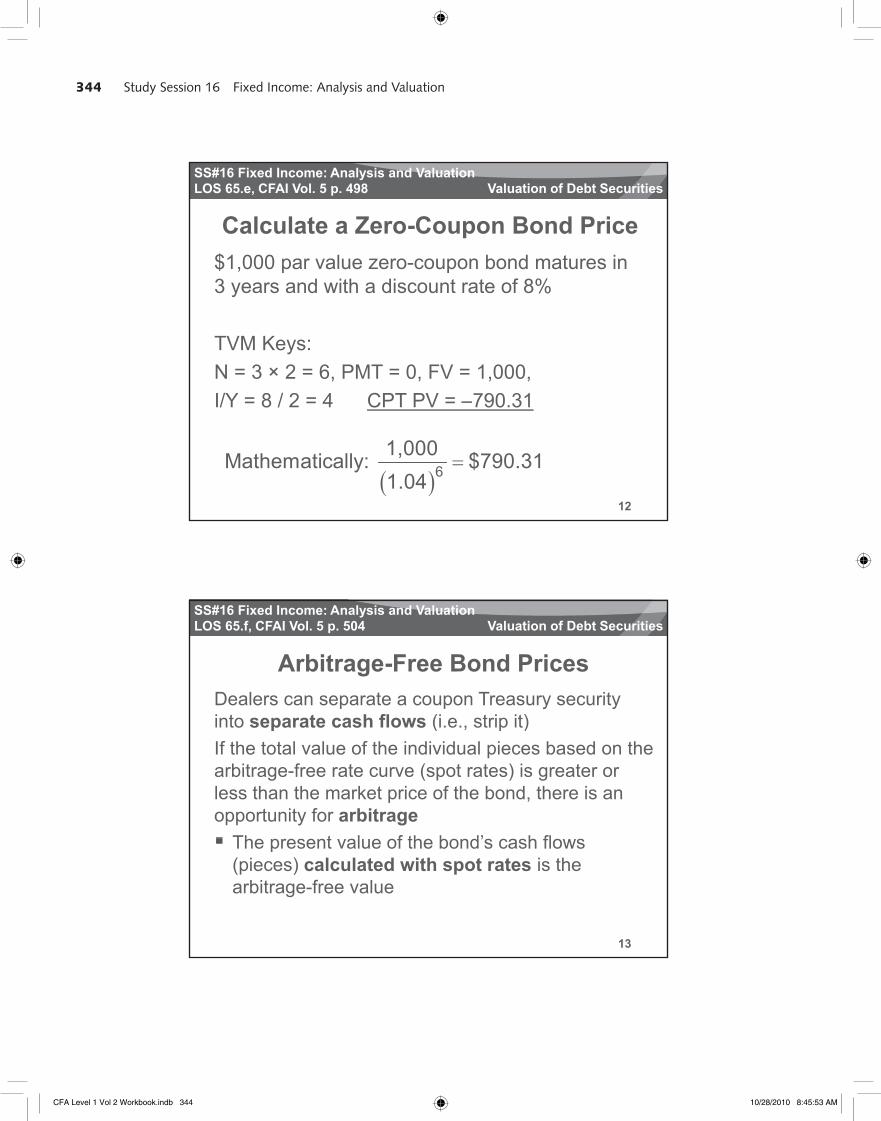
Calculate a Zero-Coupon Bond Price$1,000 par value zero-coupon bond matures in 3 d ith di t t f 8%
LOS 65.e, CFAI Vol. 5 p. 498 Valuation of Debt Securities
3 years and with a discount rate of 8%
TVM Keys:N = 3 × 2 = 6, PMT = 0, FV = 1,000, I/Y = 8 / 2 = 4 CPT PV = 790 31
12
I/Y = 8 / 2 = 4 CPT PV = –790.31
61,000Mathematically: $790.311.04
SS#16 Fixed Income: Analysis and Valuation
Arbitrage-Free Bond PricesDealers can separate a coupon Treasury security into separate cash flows (i e strip it)
LOS 65.f, CFAI Vol. 5 p. 504 Valuation of Debt Securities
into separate cash flows (i.e., strip it)If the total value of the individual pieces based on the arbitrage-free rate curve (spot rates) is greater or less than the market price of the bond, there is an opportunity for arbitrage
The present al e of the bond’s cash flo s
13
The present value of the bond’s cash flows(pieces) calculated with spot rates is the arbitrage-free value
CFA Level 1 Vol 2 Workbook.indb 344 10/28/2010 8:45:53 AM
345Study Session 16 Fixed Income: Analysis and Valuation
SS#16 Fixed Income: Analysis and Valuation
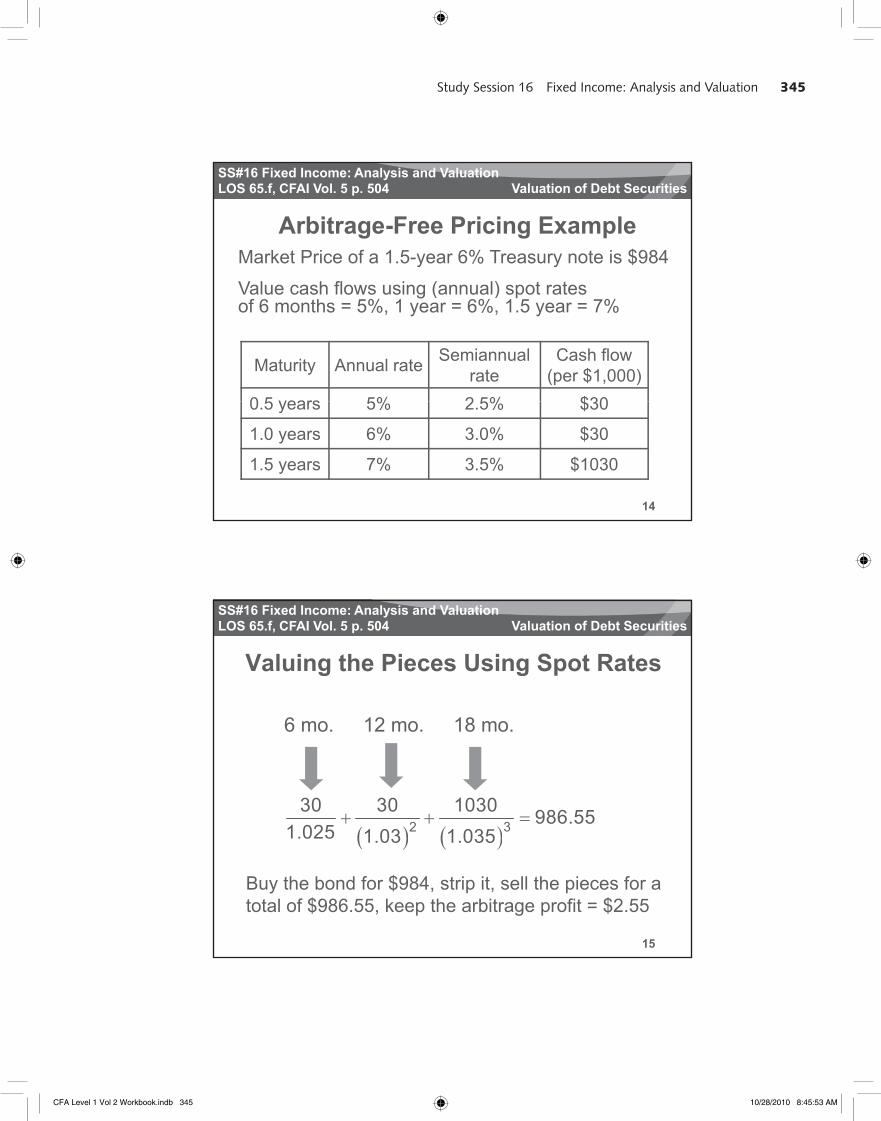
Arbitrage-Free Pricing ExampleMarket Price of a 1.5-year 6% Treasury note is $984
V l h fl i ( l) t t
LOS 65.f, CFAI Vol. 5 p. 504 Valuation of Debt Securities
Value cash flows using (annual) spot ratesof 6 months = 5%, 1 year = 6%, 1.5 year = 7%
Maturity Annual rate Semiannualrate
Cash flow (per $1,000)
0 5 years 5% 2 5% $30
14
0.5 years 5% 2.5% $30
1.0 years 6% 3.0% $30
1.5 years 7% 3.5% $1030
SS#16 Fixed Income: Analysis and Valuation
Valuing the Pieces Using Spot Rates
6 12 18
LOS 65.f, CFAI Vol. 5 p. 504 Valuation of Debt Securities
6 mo. 12 mo. 18 mo.
2 330 30 1030 986.55
1.025 1 03 1 035
15
1.03 1.035
Buy the bond for $984, strip it, sell the pieces for a total of $986.55, keep the arbitrage profit = $2.55
CFA Level 1 Vol 2 Workbook.indb 345 10/28/2010 8:45:53 AM
346 Study Session 16 Fixed Income: Analysis and Valuation
SS#16 Fixed Income: Analysis and Valuation
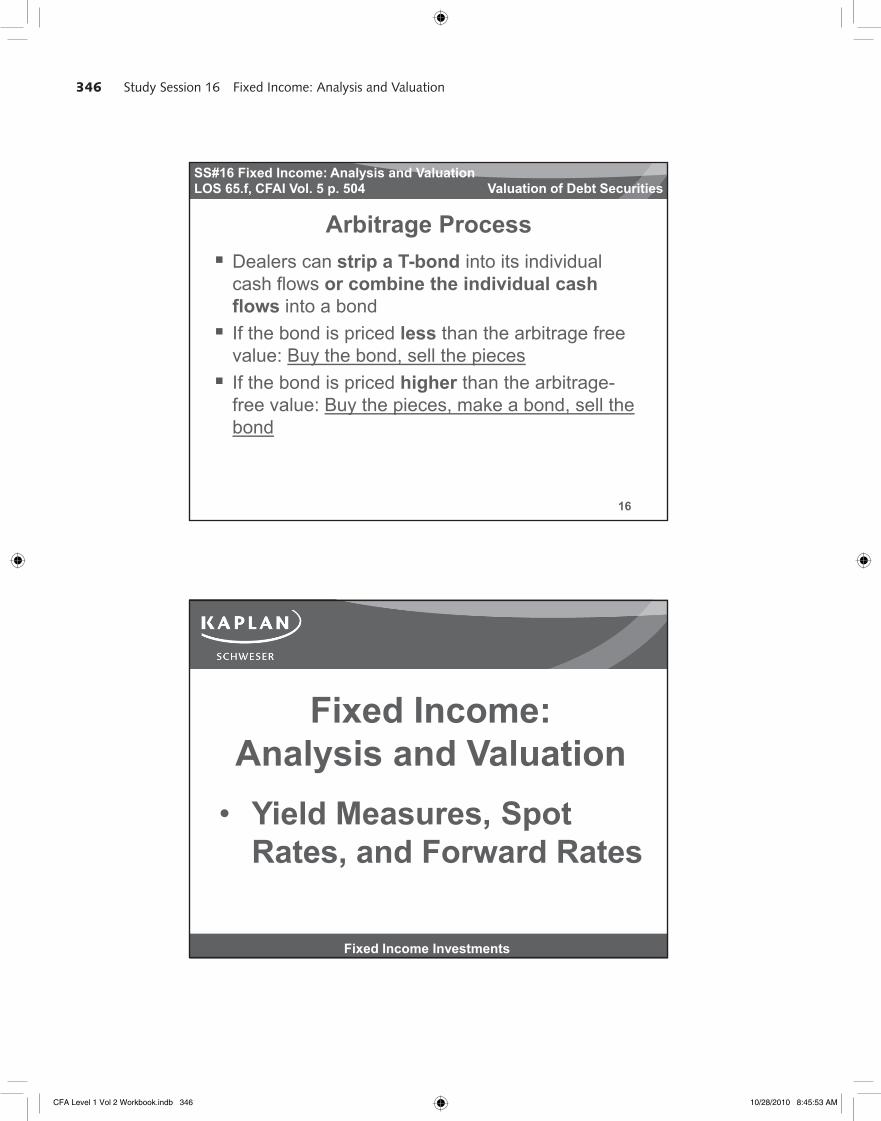
Arbitrage ProcessDealers can strip a T-bond into its individual cash flows or combine the individual cash
LOS 65.f, CFAI Vol. 5 p. 504 Valuation of Debt Securities
cash flows or combine the individual cashflows into a bondIf the bond is priced less than the arbitrage free value: Buy the bond, sell the piecesIf the bond is priced higher than the arbitrage-free al e B the pieces make a bond sell the
16
free value: Buy the pieces, make a bond, sell thebond
Fixed Income:Fixed Income:Analysis and Valuation
• Yield Measures, Spot
Fixed Income Investments
Rates, and Forward Rates
CFA Level 1 Vol 2 Workbook.indb 346 10/28/2010 8:45:53 AM
347Study Session 16 Fixed Income: Analysis and Valuation
SS#16 Fixed Income: Analysis and Valuation
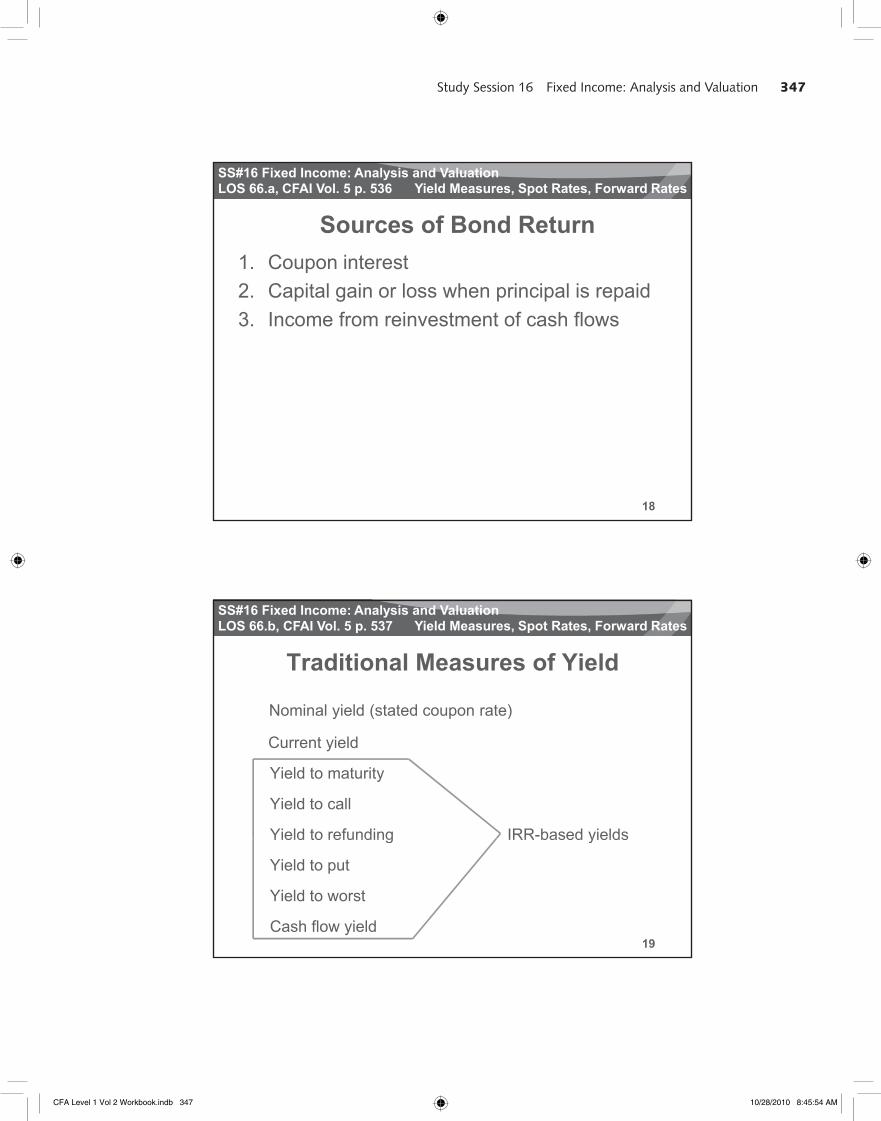
Sources of Bond Return1. Coupon interest
LOS 66.a, CFAI Vol. 5 p. 536 Yield Measures, Spot Rates, Forward Rates
2. Capital gain or loss when principal is repaid3. Income from reinvestment of cash flows
18
SS#16 Fixed Income: Analysis and Valuation
Traditional Measures of Yield
Nominal yield (stated coupon rate)
LOS 66.b, CFAI Vol. 5 p. 537 Yield Measures, Spot Rates, Forward Rates
Current yield
Yield to maturity
Yield to call
Yield to refunding IRR-based yields
19
Yield to refunding IRR based yields
Yield to put
Yield to worst
Cash flow yield
CFA Level 1 Vol 2 Workbook.indb 347 10/28/2010 8:45:54 AM
348 Study Session 16 Fixed Income: Analysis and Valuation
SS#16 Fixed Income: Analysis and Valuation
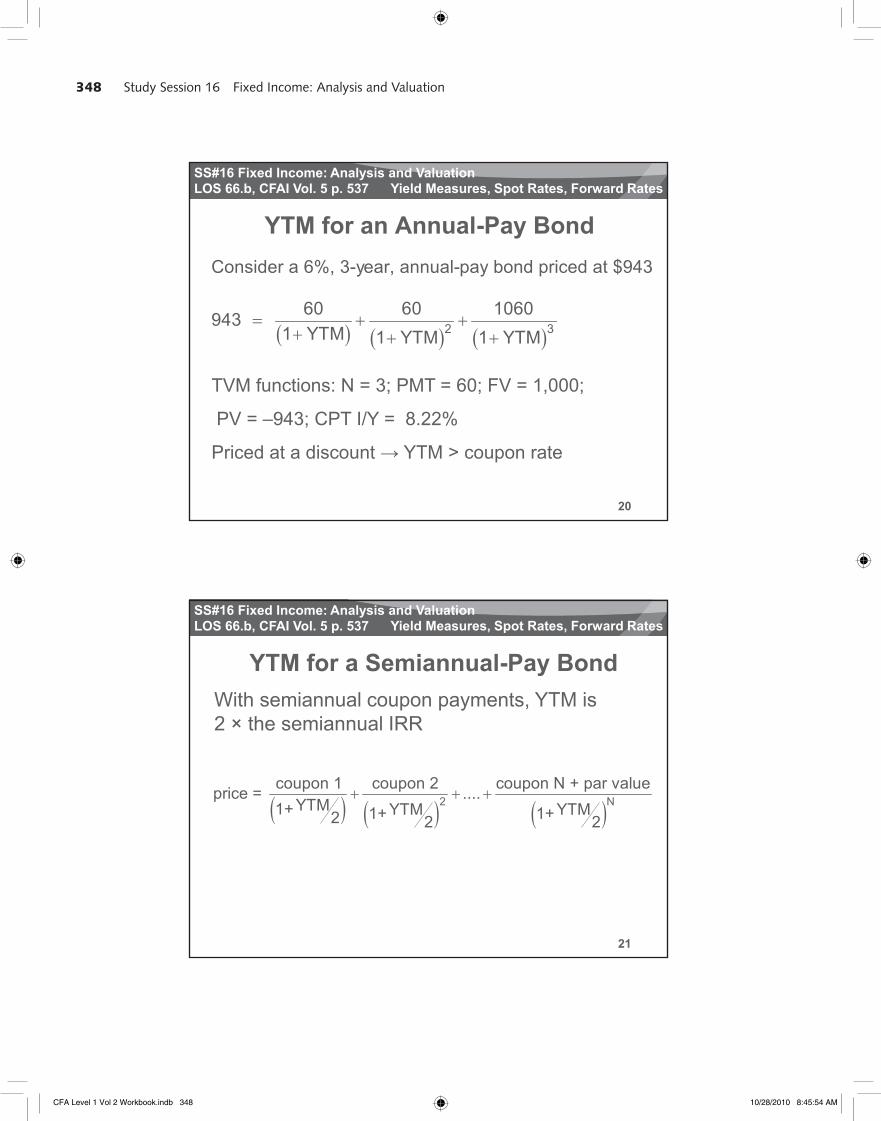
YTM for an Annual-Pay BondConsider a 6%, 3-year, annual-pay bond priced at $943
LOS 66.b, CFAI Vol. 5 p. 537 Yield Measures, Spot Rates, Forward Rates
2 360 60 1060943
1 YTM 1 YTM 1 YTM
TVM functions: N = 3; PMT = 60; FV = 1,000;
20
PV = –943; CPT I/Y = 8.22%
Priced at a discount YTM > coupon rate
SS#16 Fixed Income: Analysis and Valuation
YTM for a Semiannual-Pay BondWith semiannual coupon payments, YTM is 2 × th i l IRR
LOS 66.b, CFAI Vol. 5 p. 537 Yield Measures, Spot Rates, Forward Rates
2 × the semiannual IRR
2 Ncoupon 1 coupon 2 coupon N + par valueprice = ....
YTM1+ YTM YTM1+ 1+2 2 2
21
CFA Level 1 Vol 2 Workbook.indb 348 10/28/2010 8:45:54 AM
349Study Session 16 Fixed Income: Analysis and Valuation
SS#16 Fixed Income: Analysis and Valuation
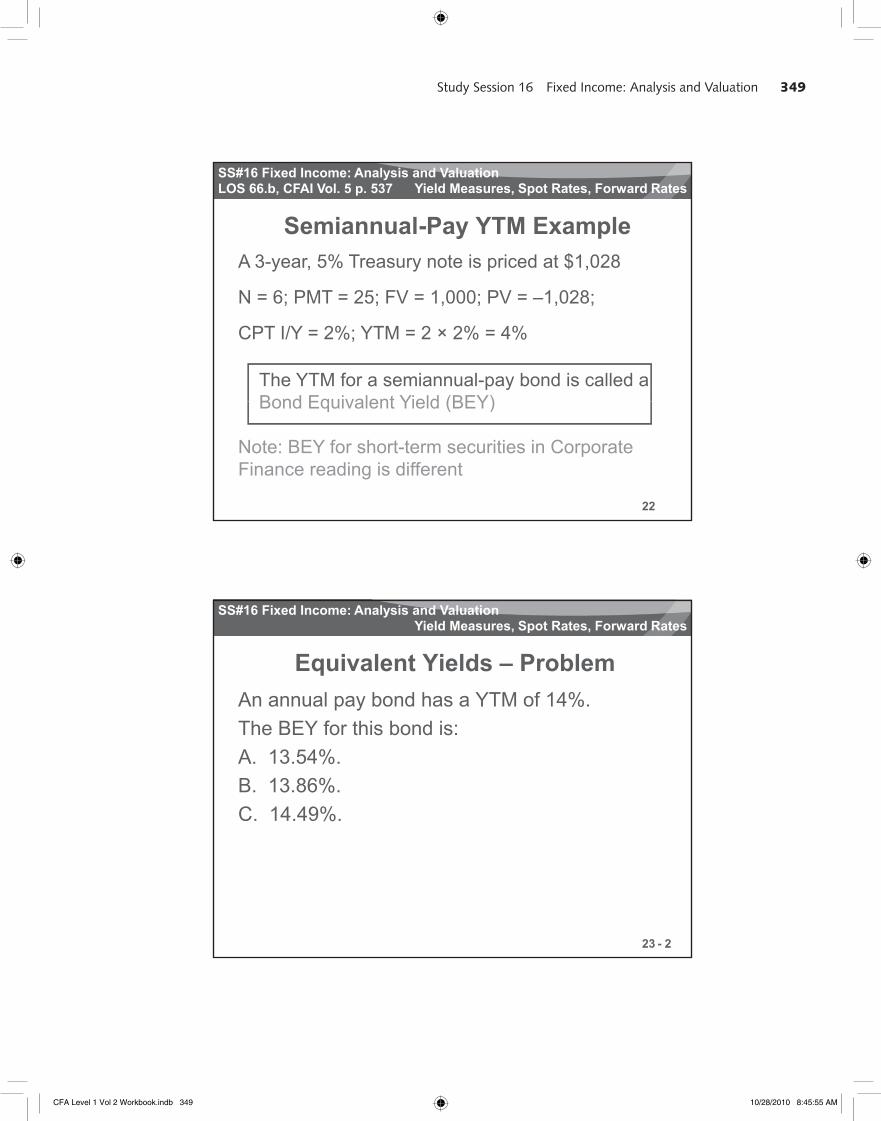
Semiannual-Pay YTM ExampleA 3-year, 5% Treasury note is priced at $1,028
LOS 66.b, CFAI Vol. 5 p. 537 Yield Measures, Spot Rates, Forward Rates
N = 6; PMT = 25; FV = 1,000; PV = –1,028;
CPT I/Y = 2%; YTM = 2 × 2% = 4%
The YTM for a semiannual-pay bond is called a Bond Equivalent Yield (BEY)
22
Bond Equivalent Yield (BEY)
Note: BEY for short-term securities in Corporate Finance reading is different
SS#16 Fixed Income: Analysis and Valuation
Equivalent Yields – ProblemAn annual pay bond has a YTM of 14%.
Yield Measures, Spot Rates, Forward Rates
The BEY for this bond is:A. 13.54%.B. 13.86%.C. 14.49%.
23 - 2
CFA Level 1 Vol 2 Workbook.indb 349 10/28/2010 8:45:55 AM
350 Study Session 16 Fixed Income: Analysis and Valuation
SS#16 Fixed Income: Analysis and Valuation
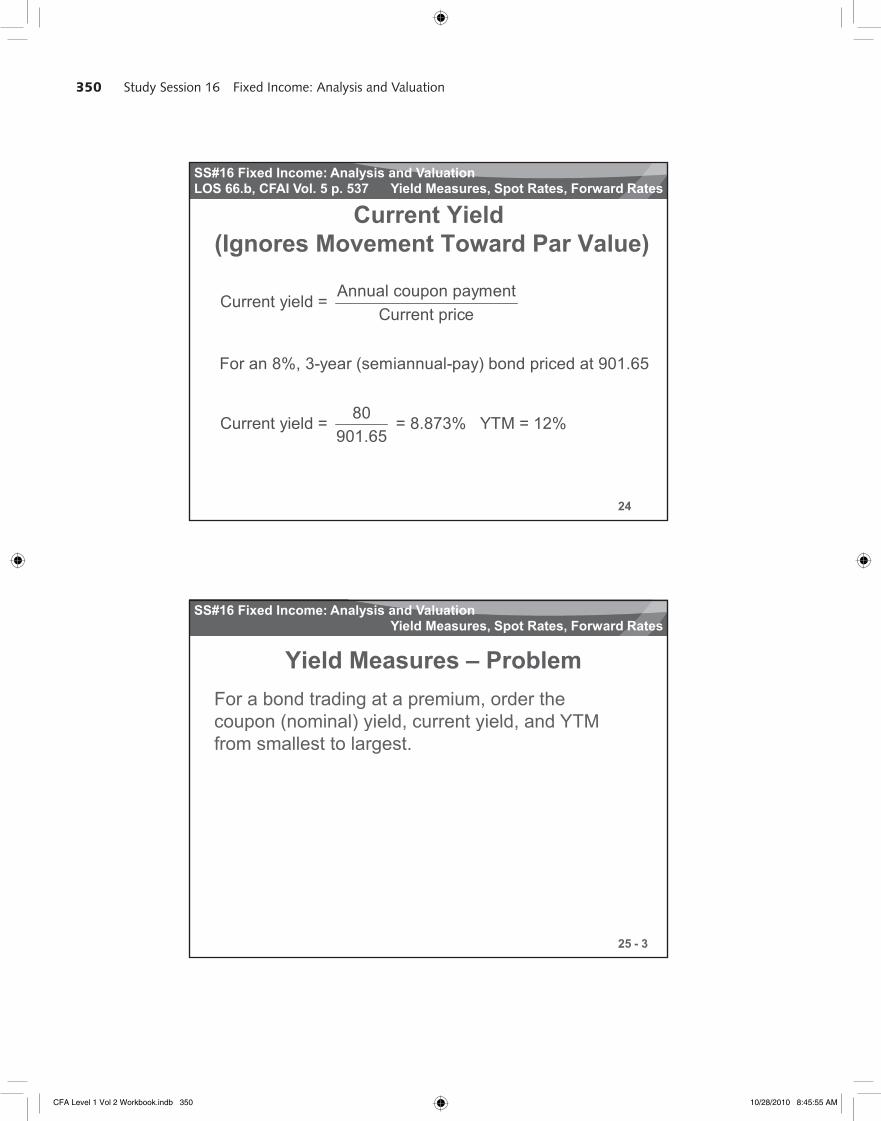
Current Yield(Ignores Movement Toward Par Value)
LOS 66.b, CFAI Vol. 5 p. 537 Yield Measures, Spot Rates, Forward Rates
Annual coupon paymentCurrent yield = Current price
For an 8%, 3-year (semiannual-pay) bond priced at 901.65
24
80Current yield = = 8.873% YTM = 12%901.65
SS#16 Fixed Income: Analysis and Valuation
Yield Measures – ProblemFor a bond trading at a premium, order the coupon (nominal) yield current yield and YTM
Yield Measures, Spot Rates, Forward Rates
coupon (nominal) yield, current yield, and YTMfrom smallest to largest.
C t i ld i l th ( i l) i ld
25 - 3
Current yield is less than coupon (nominal) yield
YTM is less than current yield for premium bond (movement towards par is negative)
CFA Level 1 Vol 2 Workbook.indb 350 10/28/2010 8:45:55 AM
351Study Session 16 Fixed Income: Analysis and Valuation
SS#16 Fixed Income: Analysis and Valuation
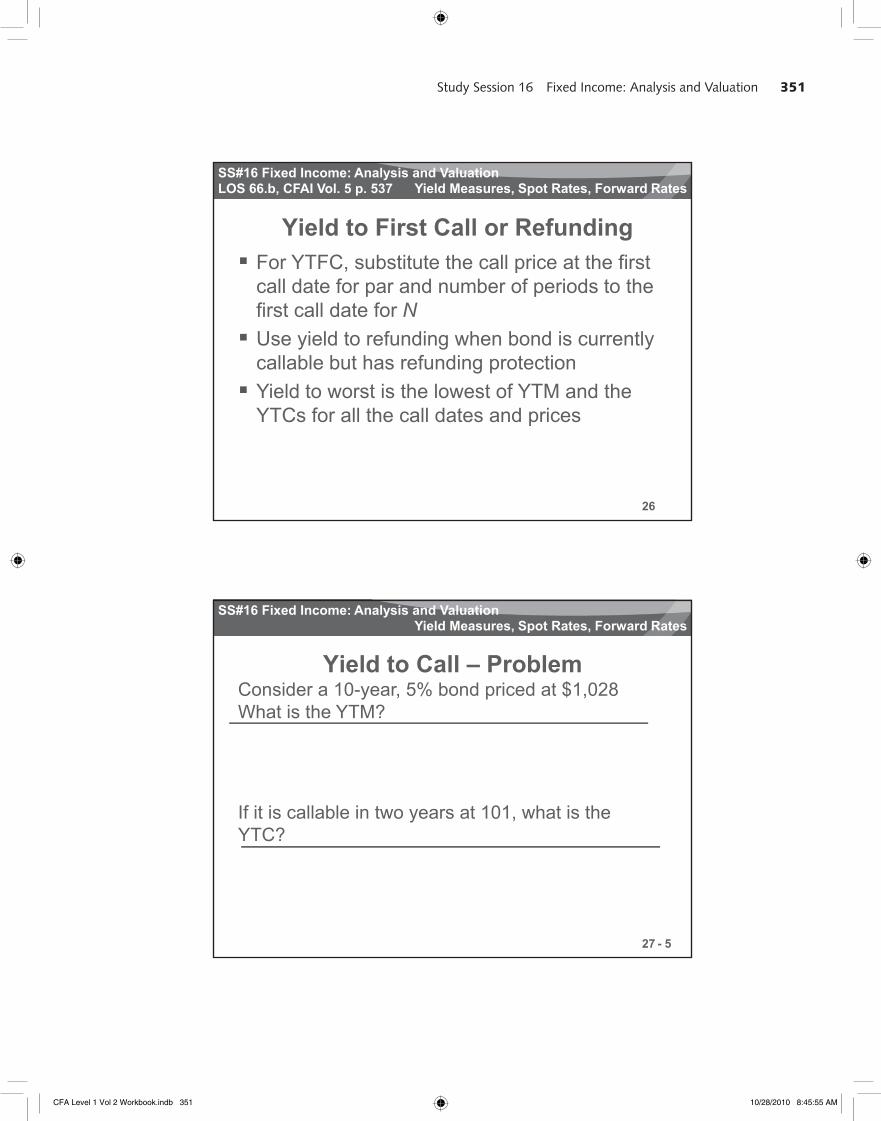
Yield to First Call or RefundingFor YTFC, substitute the call price at the first
ll d t f d b f i d t th
LOS 66.b, CFAI Vol. 5 p. 537 Yield Measures, Spot Rates, Forward Rates
call date for par and number of periods to thefirst call date for NUse yield to refunding when bond is currently callable but has refunding protectionYield to worst is the lowest of YTM and the
26
YTCs for all the call dates and prices
SS#16 Fixed Income: Analysis and Valuation
Yield to Call – ProblemConsider a 10-year, 5% bond priced at $1,028What is the YTM?
Yield Measures, Spot Rates, Forward Rates
N = 20 PMT = 25 FV = 1,000 PV = –1,028CPT I/Y = 2.323% × 2 = 4.646% = YTM
If it is callable in two years at 101, what is the YTC?
27
N = 4 PMT = 25 FV = 1,010
YTC?
CPT I/Y = 2.007% × 2 = 4.014% = YTCPV = –1,028
- 5
CFA Level 1 Vol 2 Workbook.indb 351 10/28/2010 8:45:55 AM
352 Study Session 16 Fixed Income: Analysis and Valuation
SS#16 Fixed Income: Analysis and Valuation
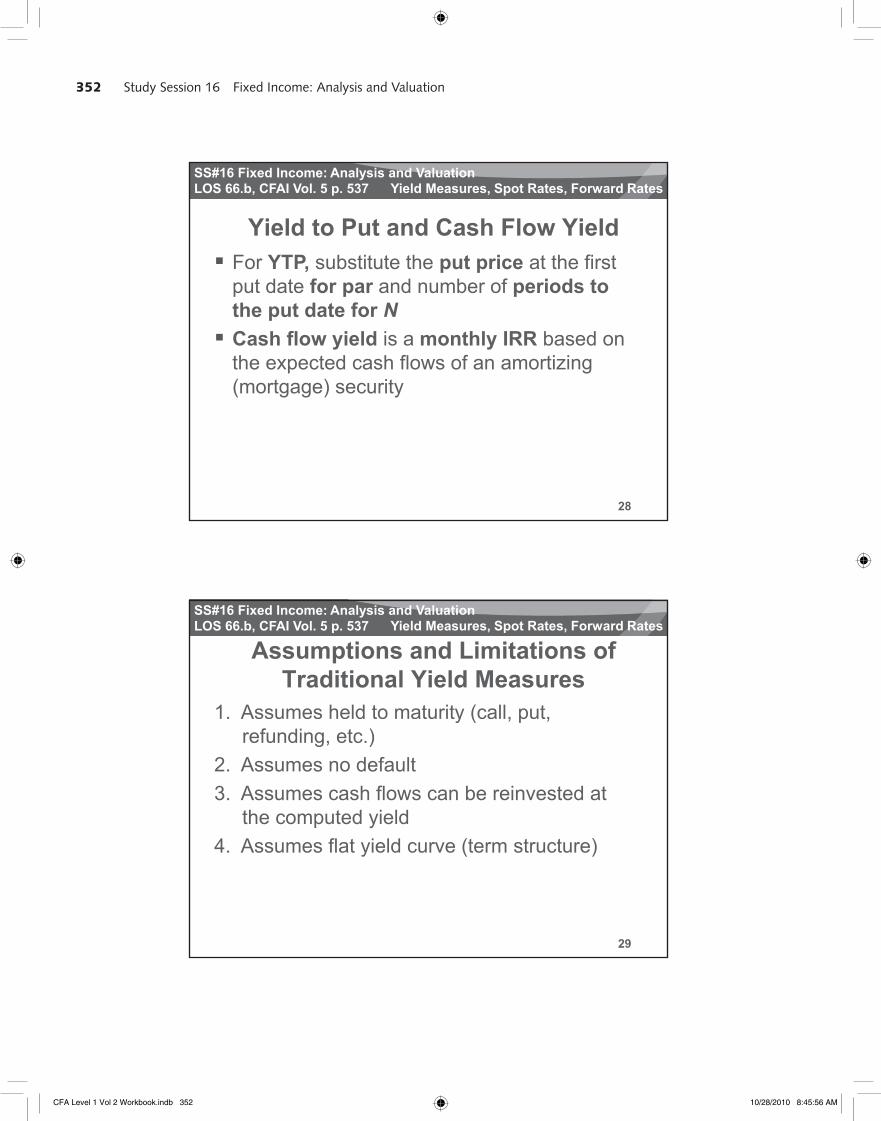
Yield to Put and Cash Flow YieldFor YTP, substitute the put price at the first
t d t f d b f i d t
LOS 66.b, CFAI Vol. 5 p. 537 Yield Measures, Spot Rates, Forward Rates
put date for par and number of periods tothe put date for NCash flow yield is a monthly IRR based on the expected cash flows of an amortizing (mortgage) security
28
SS#16 Fixed Income: Analysis and Valuation
Assumptions and Limitations of Traditional Yield Measures
1. Assumes held to maturity (call, put,
LOS 66.b, CFAI Vol. 5 p. 537 Yield Measures, Spot Rates, Forward Rates
y ( , p ,refunding, etc.)
2. Assumes no default3. Assumes cash flows can be reinvested at
the computed yield4 A fl t i ld (t t t )
29
4. Assumes flat yield curve (term structure)
CFA Level 1 Vol 2 Workbook.indb 352 10/28/2010 8:45:56 AM
353Study Session 16 Fixed Income: Analysis and Valuation
SS#16 Fixed Income: Analysis and Valuation
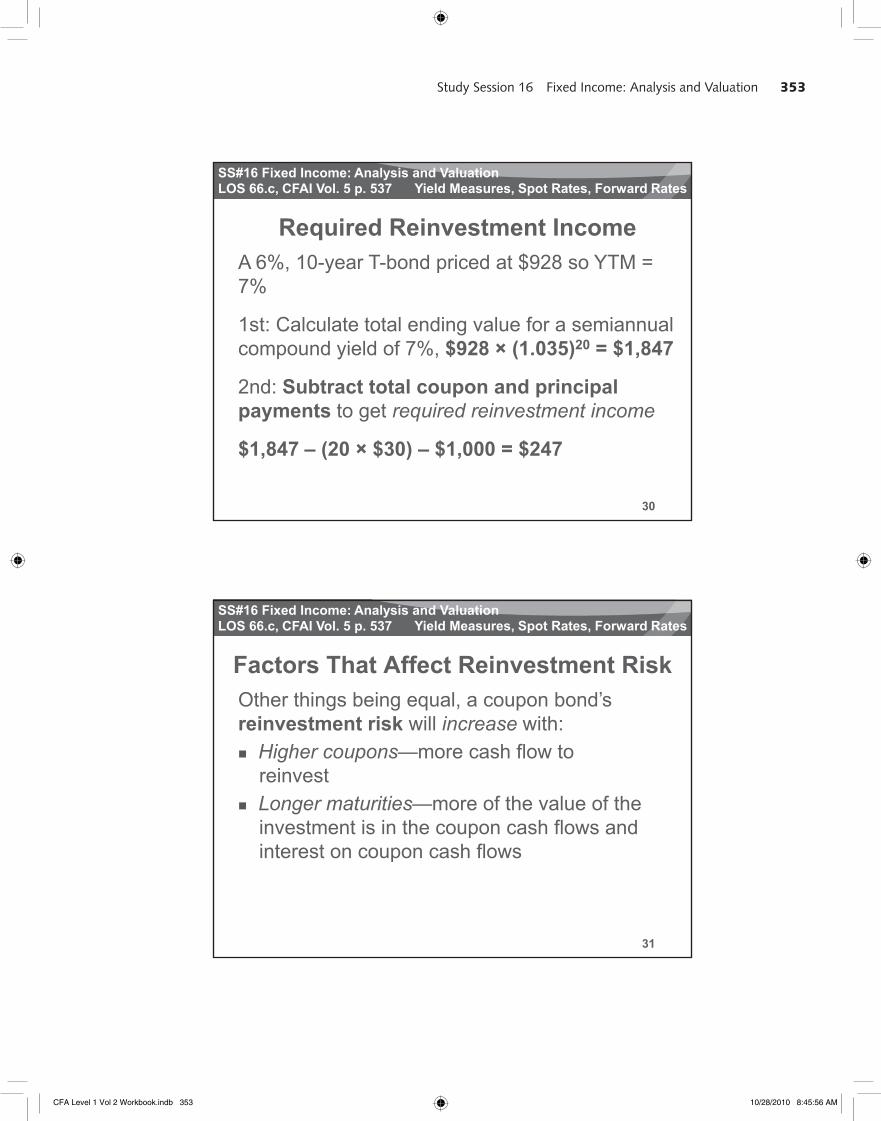
Required Reinvestment IncomeA 6%, 10-year T-bond priced at $928 so YTM = 7%
LOS 66.c, CFAI Vol. 5 p. 537 Yield Measures, Spot Rates, Forward Rates
7%
1st: Calculate total ending value for a semiannual compound yield of 7%, $928 × (1.035)20 = $1,847
2nd: Subtract total coupon and principal
30
payments to get required reinvestment income
$1,847 – (20 × $30) – $1,000 = $247
SS#16 Fixed Income: Analysis and Valuation
Factors That Affect Reinvestment RiskOther things being equal, a coupon bond’s
i t t i k ill i ith
LOS 66.c, CFAI Vol. 5 p. 537 Yield Measures, Spot Rates, Forward Rates
reinvestment risk will increase with:Higher coupons—more cash flow to reinvestLonger maturities—more of the value of the investment is in the coupon cash flows and
31
interest on coupon cash flows
CFA Level 1 Vol 2 Workbook.indb 353 10/28/2010 8:45:56 AM
354 Study Session 16 Fixed Income: Analysis and Valuation
SS#16 Fixed Income: Analysis and Valuation
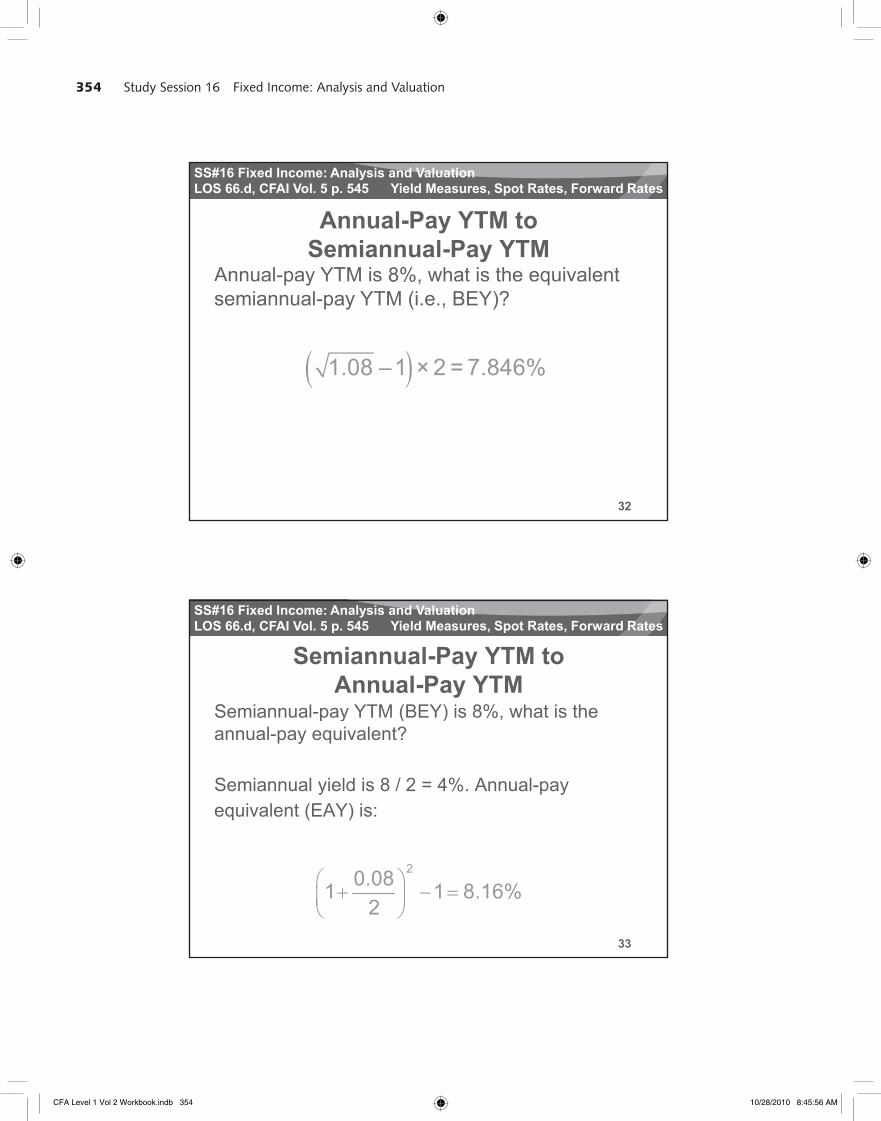
Annual-Pay YTM to Semiannual-Pay YTM
Annual-pay YTM is 8%, what is the equivalent
LOS 66.d, CFAI Vol. 5 p. 545 Yield Measures, Spot Rates, Forward Rates
p y 8%, qsemiannual-pay YTM (i.e., BEY)?
1.08 –1 × 2 = 7.846%
32
SS#16 Fixed Income: Analysis and Valuation
Semiannual-Pay YTM toAnnual-Pay YTM
Semiannual-pay YTM (BEY) is 8%, what is the
LOS 66.d, CFAI Vol. 5 p. 545 Yield Measures, Spot Rates, Forward Rates
p y ( ) ,annual-pay equivalent?
Semiannual yield is 8 / 2 = 4%. Annual-pay equivalent (EAY) is:
33
20.081 1 8.16%2
CFA Level 1 Vol 2 Workbook.indb 354 10/28/2010 8:45:56 AM
355Study Session 16 Fixed Income: Analysis and Valuation
SS#16 Fixed Income: Analysis and Valuation
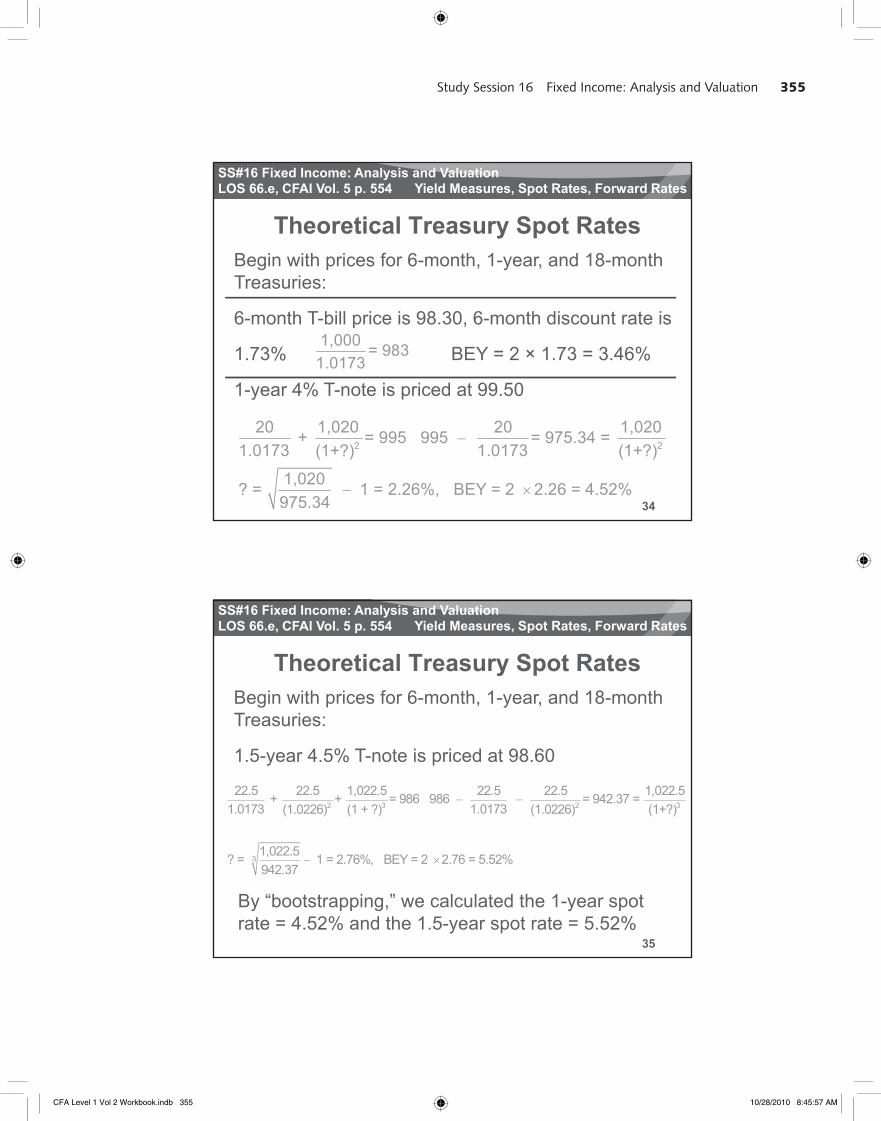
Begin with prices for 6-month, 1-year, and 18-month Treasuries:
Theoretical Treasury Spot RatesLOS 66.e, CFAI Vol. 5 p. 554 Yield Measures, Spot Rates, Forward Rates
Treasuries:
6-month T-bill price is 98.30, 6-month discount rate is
1.73% BEY = 2 × 1.73 = 3.46%
1-year 4% T-note is priced at 99.50
1,000 = 9831.0173
34
2 2
20 1,020 20 1,020 + = 995 995 = 975.34 = 1.0173 1.0173(1+?) (1+?)
1,020? = 1 = 2.26%, BEY = 2 2.26 = 4.52%975.34
SS#16 Fixed Income: Analysis and Valuation
Theoretical Treasury Spot RatesBegin with prices for 6-month, 1-year, and 18-month Treasuries:
LOS 66.e, CFAI Vol. 5 p. 554 Yield Measures, Spot Rates, Forward Rates
Treasuries:
1.5-year 4.5% T-note is priced at 98.60
2 3 2 3
22.5 22.5 1,022.5 22.5 22.5 1,022.5 + + = 986 986 = 942.37 = 1.0173 1.0173(1.0226) (1 + ?) (1.0226) (1+?)
35
31,022.5? = 1 = 2.76%, BEY = 2 2.76 = 5.52%942.37
By “bootstrapping,” we calculated the 1-year spot rate = 4.52% and the 1.5-year spot rate = 5.52%
CFA Level 1 Vol 2 Workbook.indb 355 10/28/2010 8:45:57 AM
356 Study Session 16 Fixed Income: Analysis and Valuation
SS#16 Fixed Income: Analysis and Valuation
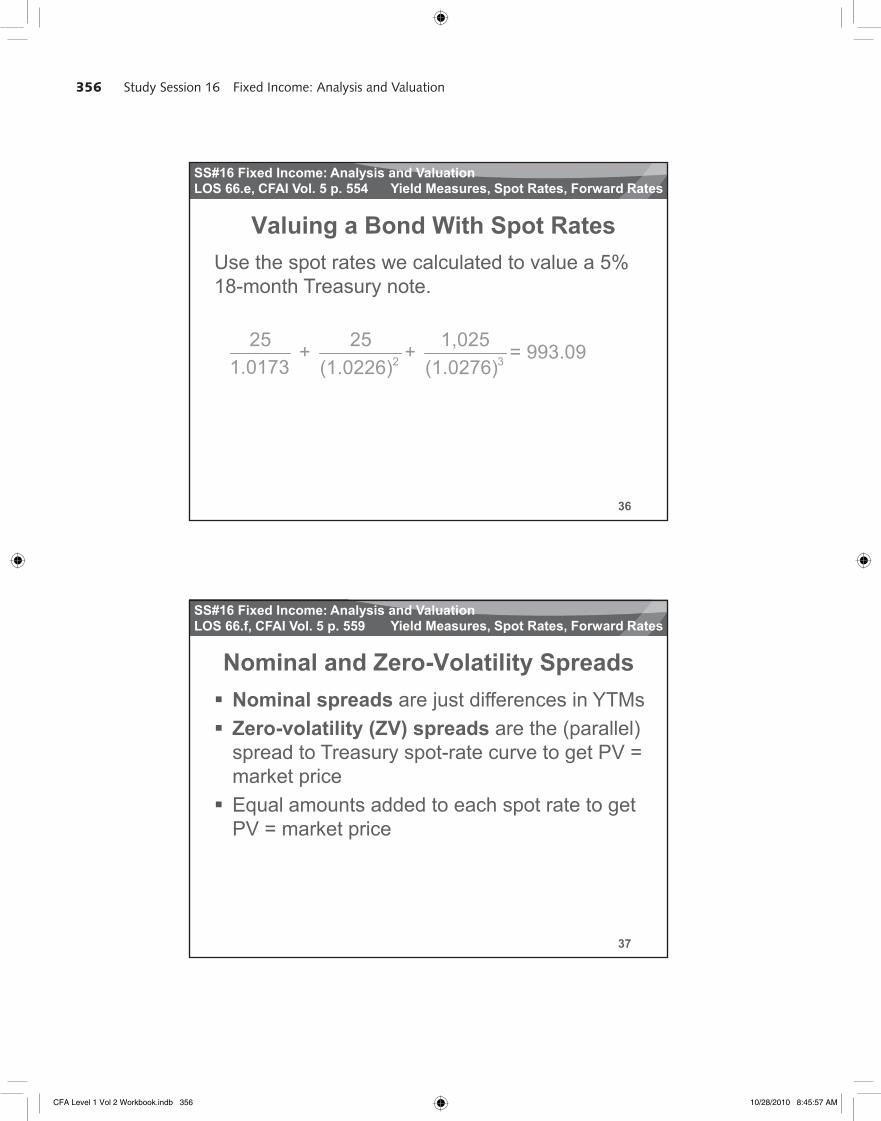
Valuing a Bond With Spot RatesUse the spot rates we calculated to value a 5% 18 th T t
LOS 66.e, CFAI Vol. 5 p. 554 Yield Measures, Spot Rates, Forward Rates
18-month Treasury note.
2 3
25 25 1,025 + + = 993.091.0173 (1.0226) (1.0276)
36
SS#16 Fixed Income: Analysis and Valuation
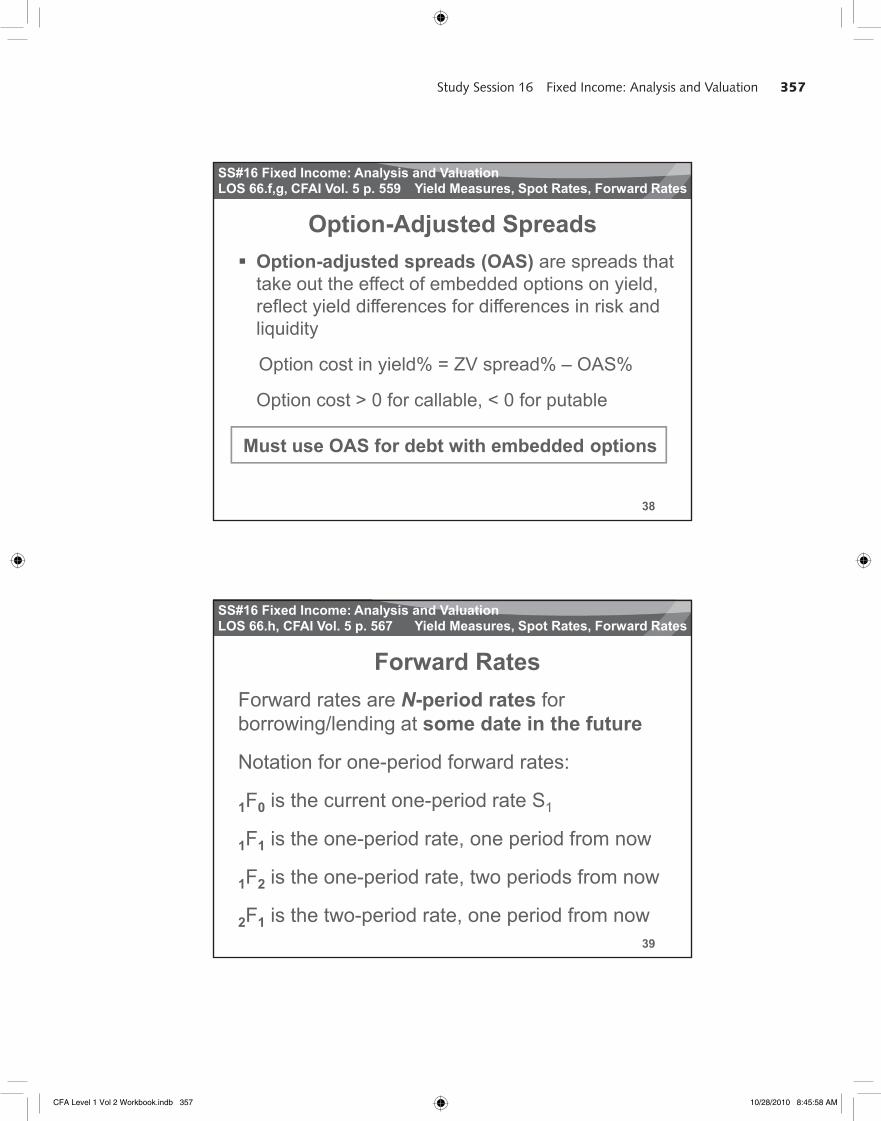
Nominal and Zero-Volatility SpreadsNominal spreads are just differences in YTMs
LOS 66.f, CFAI Vol. 5 p. 559 Yield Measures, Spot Rates, Forward Rates
Zero-volatility (ZV) spreads are the (parallel) spread to Treasury spot-rate curve to get PV = market priceEqual amounts added to each spot rate to get PV = market price
37
p
CFA Level 1 Vol 2 Workbook.indb 356 10/28/2010 8:45:57 AM
357Study Session 16 Fixed Income: Analysis and Valuation
SS#16 Fixed Income: Analysis and Valuation
Option-Adjusted SpreadsOption-adjusted spreads (OAS) are spreads that take out the effect of embedded options on yield
LOS 66.f,g, CFAI Vol. 5 p. 559 Yield Measures, Spot Rates, Forward Rates
take out the effect of embedded options on yield,reflect yield differences for differences in risk and liquidity
Option cost in yield% = ZV spread% – OAS%
Option cost > 0 for callable < 0 for putable
38
Option cost > 0 for callable, < 0 for putable
Must use OAS for debt with embedded options
SS#16 Fixed Income: Analysis and Valuation
Forward RatesForward rates are N-period rates forb i /l di t d t i th f t
LOS 66.h, CFAI Vol. 5 p. 567 Yield Measures, Spot Rates, Forward Rates
borrowing/lending at some date in the future
Notation for one-period forward rates:
1F0 is the current one-period rate S1
F is the one period rate one period from now
39
1F1 is the one-period rate, one period from now
1F2 is the one-period rate, two periods from now
2F1 is the two-period rate, one period from now
CFA Level 1 Vol 2 Workbook.indb 357 10/28/2010 8:45:58 AM
358 Study Session 16 Fixed Income: Analysis and Valuation
SS#16 Fixed Income: Analysis and Valuation
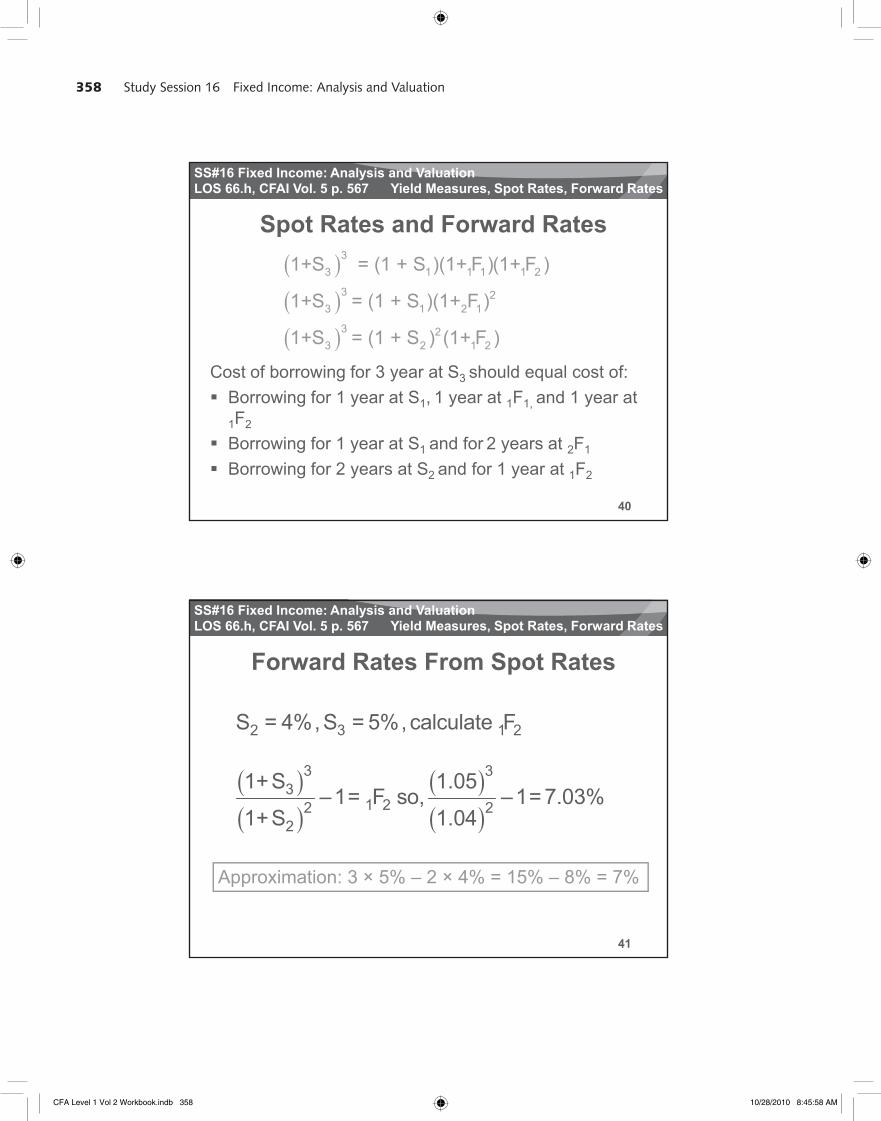
Spot Rates and Forward Rates3
3 1 1 1 1 21+S = (1 + S )(1+ F )(1+ F )
LOS 66.h, CFAI Vol. 5 p. 567 Yield Measures, Spot Rates, Forward Rates
Cost of borrowing for 3 year at S3 should equal cost of:Borrowing for 1 year at S1 1 year at 1F1 and 1 year at
3 23 1 2 1
3 23 2 1 2
1+S = (1 + S )(1+ F )
1+S = (1 + S ) (1+ F )
40
Borrowing for 1 year at S1, 1 year at 1F1, and 1 year at1F2
Borrowing for 1 year at S1 and for 2 years at 2F1
Borrowing for 2 years at S2 and for 1 year at 1F2
SS#16 Fixed Income: Analysis and Valuation
Forward Rates From Spot Rates
S = 4% S = 5% calculate F
LOS 66.h, CFAI Vol. 5 p. 567 Yield Measures, Spot Rates, Forward Rates
2 3 1 2
3 33
1 22 22
S = 4% , S = 5% , calculate F
1+S 1.05–1= F so, –1= 7.03%
1+S 1.04
41
Approximation: 3 × 5% – 2 × 4% = 15% – 8% = 7%
CFA Level 1 Vol 2 Workbook.indb 358 10/28/2010 8:45:58 AM
359Study Session 16 Fixed Income: Analysis and Valuation
SS#16 Fixed Income: Analysis and Valuation
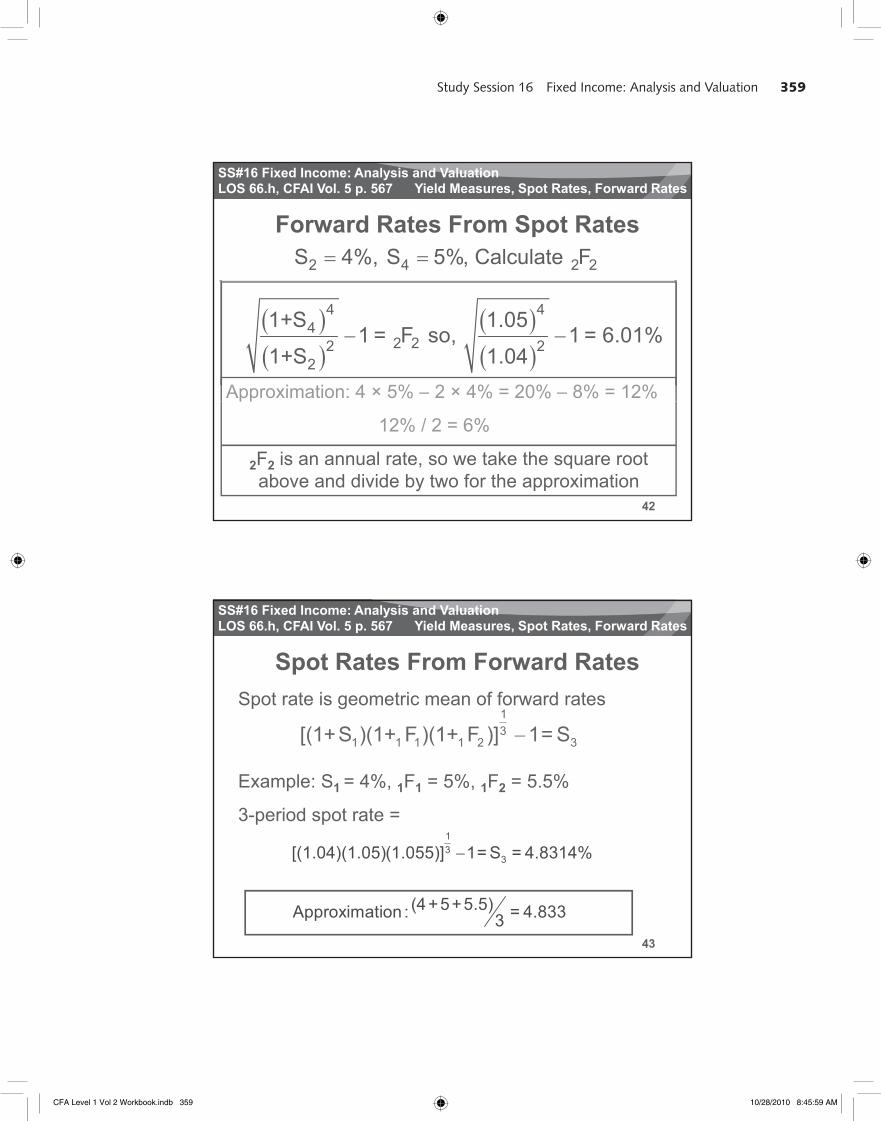
Forward Rates From Spot Rates2 4 2 2 S 4%, S 5%, Calculate F
LOS 66.h, CFAI Vol. 5 p. 567 Yield Measures, Spot Rates, Forward Rates
4 44
2 22 22
1+S 1.051 = F so, 1 = 6.01%
1+S 1.04Approximation: 4 × 5% – 2 × 4% = 20% – 8% = 12%
42
pp
12% / 2 = 6%
2F2 is an annual rate, so we take the square root above and divide by two for the approximation
SS#16 Fixed Income: Analysis and Valuation
Spot Rates From Forward Rates
1Spot rate is geometric mean of forward rates
LOS 66.h, CFAI Vol. 5 p. 567 Yield Measures, Spot Rates, Forward Rates
31 1 1 1 2 3[(1+S )(1+ F )(1+ F )] 1 = S
Example: S1 = 4%, 1F1 = 5%, 1F2 = 5.5%
3-period spot rate = 1
43
13
3[(1.04)(1.05)(1.055)] 1 = S = 4.8314%
(4+5+5.5)Approximation : = 4.8333
CFA Level 1 Vol 2 Workbook.indb 359 10/28/2010 8:45:59 AM
360 Study Session 16 Fixed Income: Analysis and Valuation
SS#16 Fixed Income: Analysis and Valuation
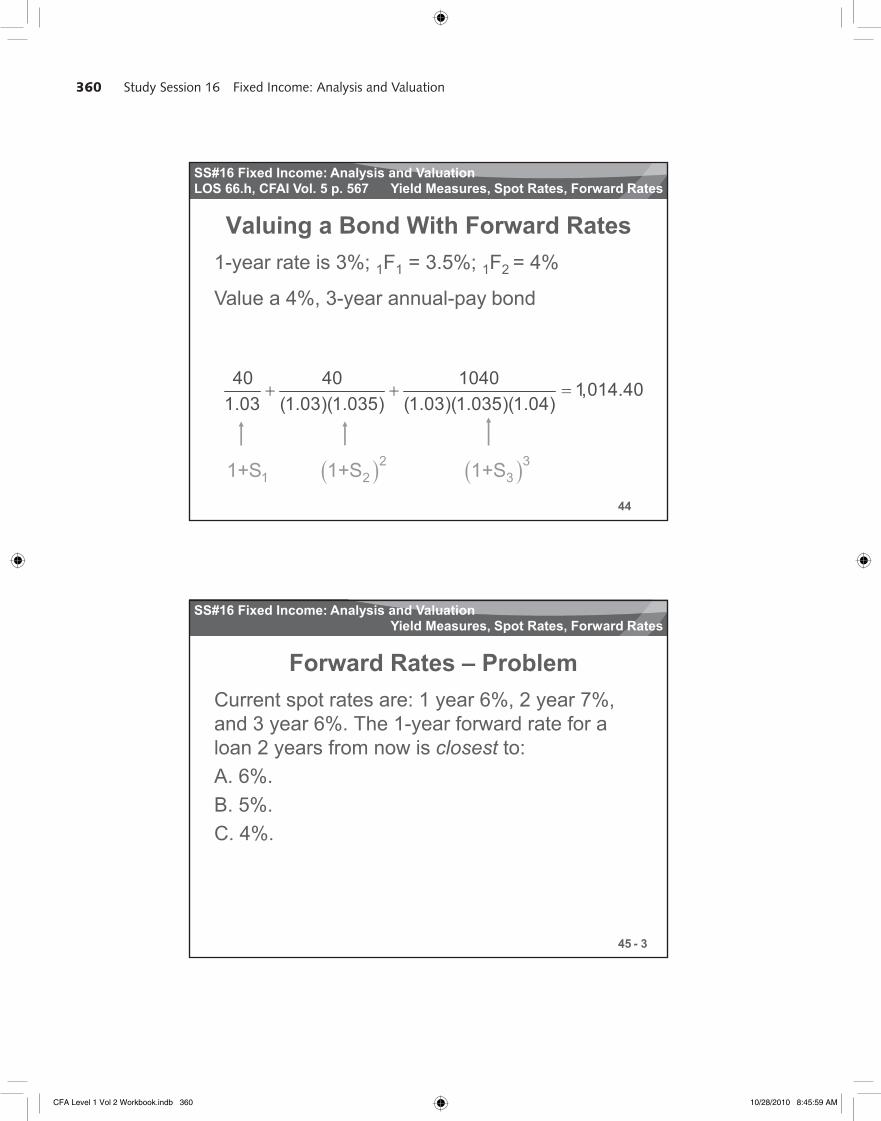
Valuing a Bond With Forward Rates1-year rate is 3%; 1F1 = 3.5%; 1F2 = 4%
LOS 66.h, CFAI Vol. 5 p. 567 Yield Measures, Spot Rates, Forward Rates
Value a 4%, 3-year annual-pay bond
40 40 1040 1,014.401 03 (1 03)(1 035) (1 03)(1 035)(1 04)
44
2 31 2 31+S 1+S 1+S
1.03 (1.03)(1.035) (1.03)(1.035)(1.04)
SS#16 Fixed Income: Analysis and Valuation
Forward Rates – ProblemCurrent spot rates are: 1 year 6%, 2 year 7%,
d 3 6% Th 1 f d t f
Yield Measures, Spot Rates, Forward Rates
and 3 year 6%. The 1-year forward rate for a loan 2 years from now is closest to:A. 6%.B. 5%.C. 4%.
45
C. 4%.
- 3
CFA Level 1 Vol 2 Workbook.indb 360 10/28/2010 8:45:59 AM
361Study Session 16 Fixed Income: Analysis and Valuation
Fixed Income:Fixed Income:Analysis and Valuation
• Introduction to the
Fixed Income Investments
Measurement of Interest Rate Risk
SS#16 Fixed Income: Analysis and Valuation
Measuring Interest Rate RiskFull valuation approach: Re-value every bond based on an interest rate change scenario
LOS 67.a, CFAI Vol. 5 p. 608 Measurement of Interest Rate Risk
interest rate change scenarioGood valuation models provide precise valuesCan deal with parallel and non-parallel shiftsTime consuming; many different scenarios
Duration/convexity approach: Gives an approximate
47
Duration/convexity approach: Gives an approximatesensitivity of bond/portfolio values to changes in YTM
Limited scenarios (parallel yield curve shifts)Provides a simple summary measure of interest rate risk
CFA Level 1 Vol 2 Workbook.indb 361 10/28/2010 8:45:59 AM
362 Study Session 16 Fixed Income: Analysis and Valuation
SS#16 Fixed Income: Analysis and Valuation
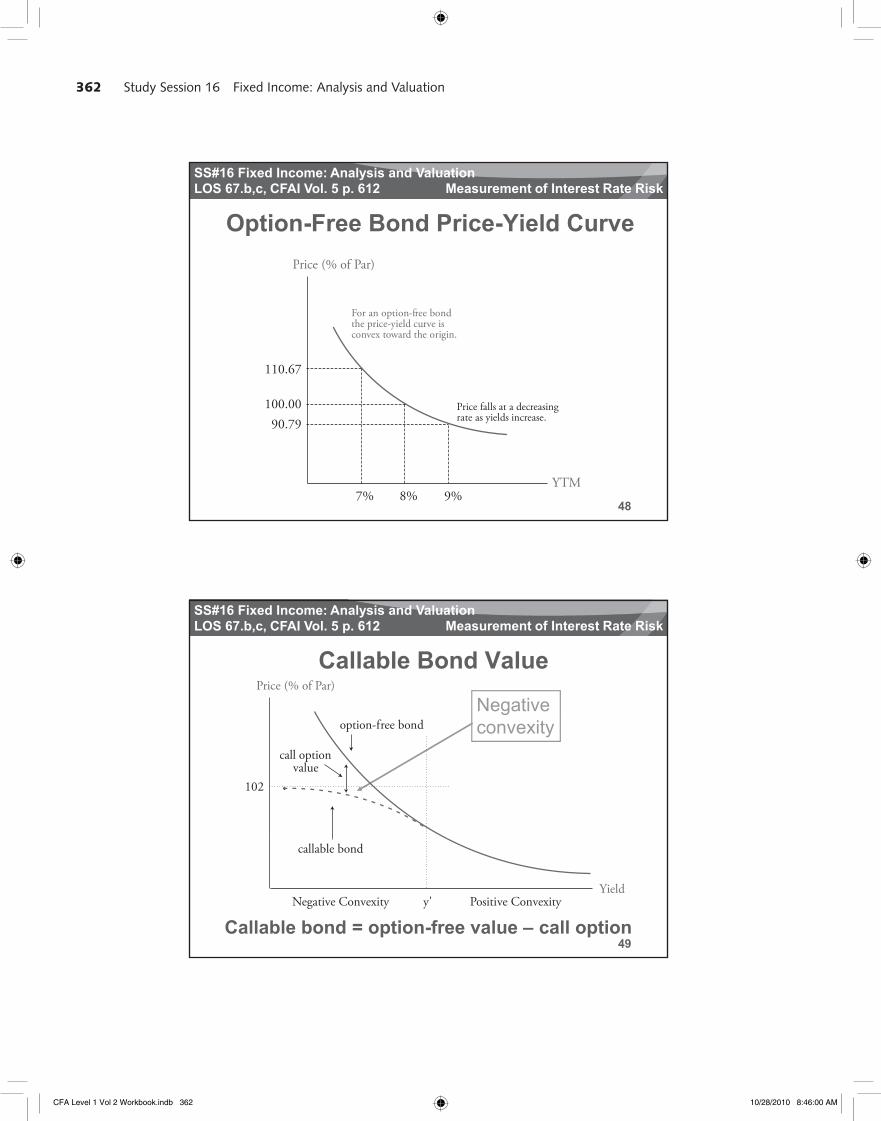
Option-Free Bond Price-Yield CurvePrice (% of Par)
LOS 67.b,c, CFAI Vol. 5 p. 612 Measurement of Interest Rate Risk
110.67
100 00
For an option-free bondthe price-yield curve isconvex toward the origin.
48
100.00
90.79Price falls at a decreasingrate as yields increase.
YTM7% 8% 9%
SS#16 Fixed Income: Analysis and Valuation
Callable Bond Value
NegativePrice (% of Par)
LOS 67.b,c, CFAI Vol. 5 p. 612 Measurement of Interest Rate Risk
convexityoption-free bond
call optionvalue
102
49Callable bond = option-free value – call option
callable bond
Yieldy' Positive ConvexityNegative Convexity
CFA Level 1 Vol 2 Workbook.indb 362 10/28/2010 8:46:00 AM
363Study Session 16 Fixed Income: Analysis and Valuation
SS#16 Fixed Income: Analysis and Valuation
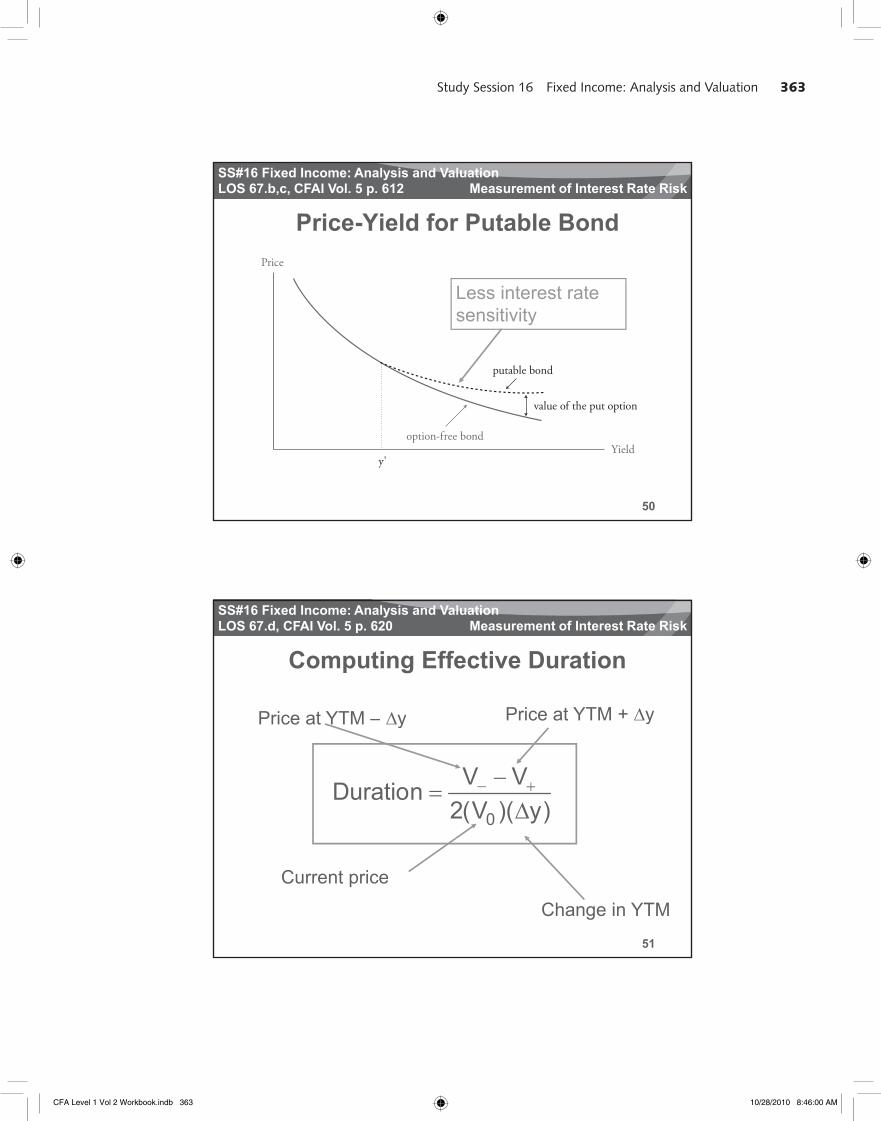
Price-Yield for Putable BondPrice
LOS 67.b,c, CFAI Vol. 5 p. 612 Measurement of Interest Rate Risk
Less interest rate sensitivity
putable bond
l f h
50
option-free bondYield
y'
value of the put option
SS#16 Fixed Income: Analysis and Valuation
Computing Effective Duration
Price at YTM – y Price at YTM + y
LOS 67.d, CFAI Vol. 5 p. 620 Measurement of Interest Rate Risk
Price at YTM – y Price at YTM y
0
V VDuration2(V )( y)
51
Current price
Change in YTM
CFA Level 1 Vol 2 Workbook.indb 363 10/28/2010 8:46:00 AM
364 Study Session 16 Fixed Income: Analysis and Valuation
SS#16 Fixed Income: Analysis and Valuation
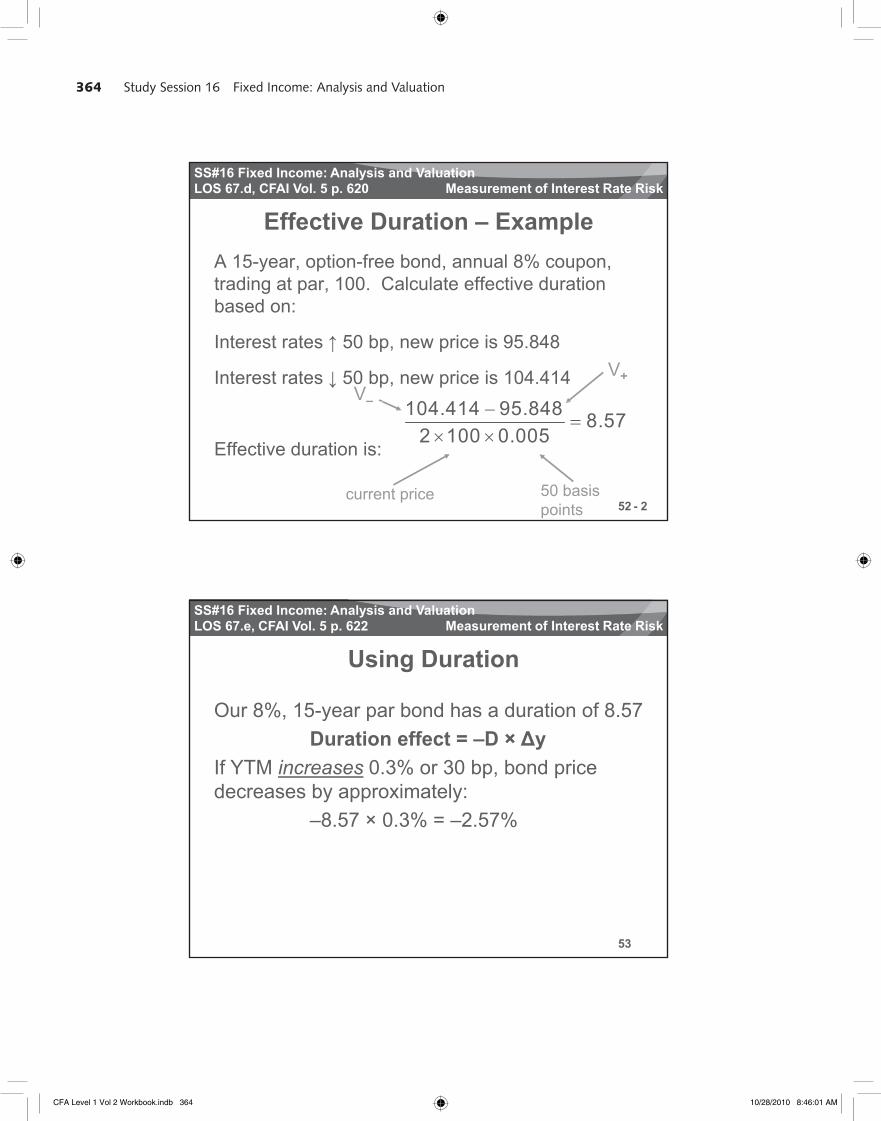
Effective Duration – ExampleA 15-year, option-free bond, annual 8% coupon, trading at par 100 Calculate effective duration
LOS 67.d, CFAI Vol. 5 p. 620 Measurement of Interest Rate Risk
trading at par, 100. Calculate effective durationbased on:
Interest rates 50 bp, new price is 95.848
Interest rates 50 bp, new price is 104.414
104 414 95 848V–
V+
52
Effective duration is:
104.414 95.848 8.572 100 0.005
50 basis points
current price
–
- 2
SS#16 Fixed Income: Analysis and Valuation
Using Duration
Our 8%, 15-year par bond has a duration of 8.57
LOS 67.e, CFAI Vol. 5 p. 622 Measurement of Interest Rate Risk
, y pDuration effect = –D × y
If YTM increases 0.3% or 30 bp, bond price decreases by approximately:
–8.57 × 0.3% = –2.57%
53
CFA Level 1 Vol 2 Workbook.indb 364 10/28/2010 8:46:01 AM
365Study Session 16 Fixed Income: Analysis and Valuation
SS#16 Fixed Income: Analysis and Valuation
Duration MeasuresMacaulay duration is in years
LOS 67.f, CFAI Vol. 5 p. 628 Measurement of Interest Rate Risk
Duration of a 5-year, zero-coupon bond is 5 1% change in yield, 5% change in price
Modified duration adjusts Macaulay duration for market yield, yield up duration downEffective duration allows for cash flow
54
Effective duration allows for cash flowchanges as yield changes, must be used for bonds with embedded options
SS#16 Fixed Income: Analysis and Valuation
Effective DurationBoth Macaulay duration and modified duration are based on the promised cash flows and ignore call
LOS 67.f, CFAI Vol. 5 p. 628 Measurement of Interest Rate Risk
based on the promised cash flows and ignore call,put, and prepayment optionsEffective duration can be calculated using prices from a valuation model that includes the effects of embedded options (e.g., call feature) For option free bonds effecti e d ration is er
55
For option-free bonds, effective duration is veryclose to modified duration For bonds with embedded options, effective duration must be used
CFA Level 1 Vol 2 Workbook.indb 365 10/28/2010 8:46:01 AM
366 Study Session 16 Fixed Income: Analysis and Valuation
SS#16 Fixed Income: Analysis and Valuation
Duration InterpretationPV-weighted average of the number of years
til d i i l h fl t b
LOS 67.f, CFAI Vol. 5 p. 628 Measurement of Interest Rate Risk
until coupon and principal cash flows are to bereceivedSlope of the price-yield curve (i.e., first derivative of the price-yield function with respect to yield)
56
Approximate percentage price change for a 1% change in YTM: The best interpretation!
SS#16 Fixed Income: Analysis and Valuation
Bond Portfolio DurationDuration of a portfolio of bonds is a portfolio-
l i ht d f th d ti f
LOS 67.g, CFAI Vol. 5 p. 632 Measurement of Interest Rate Risk
value-weighted average of the durations ofthe individual bonds
DP = W1D1 + W2D2 +……+WnDn
Problems arise because the YTM does not change equally for every bond in the portfolio
57
g q y y p
CFA Level 1 Vol 2 Workbook.indb 366 10/28/2010 8:46:02 AM
367Study Session 16 Fixed Income: Analysis and Valuation
SS#16 Fixed Income: Analysis and Valuation
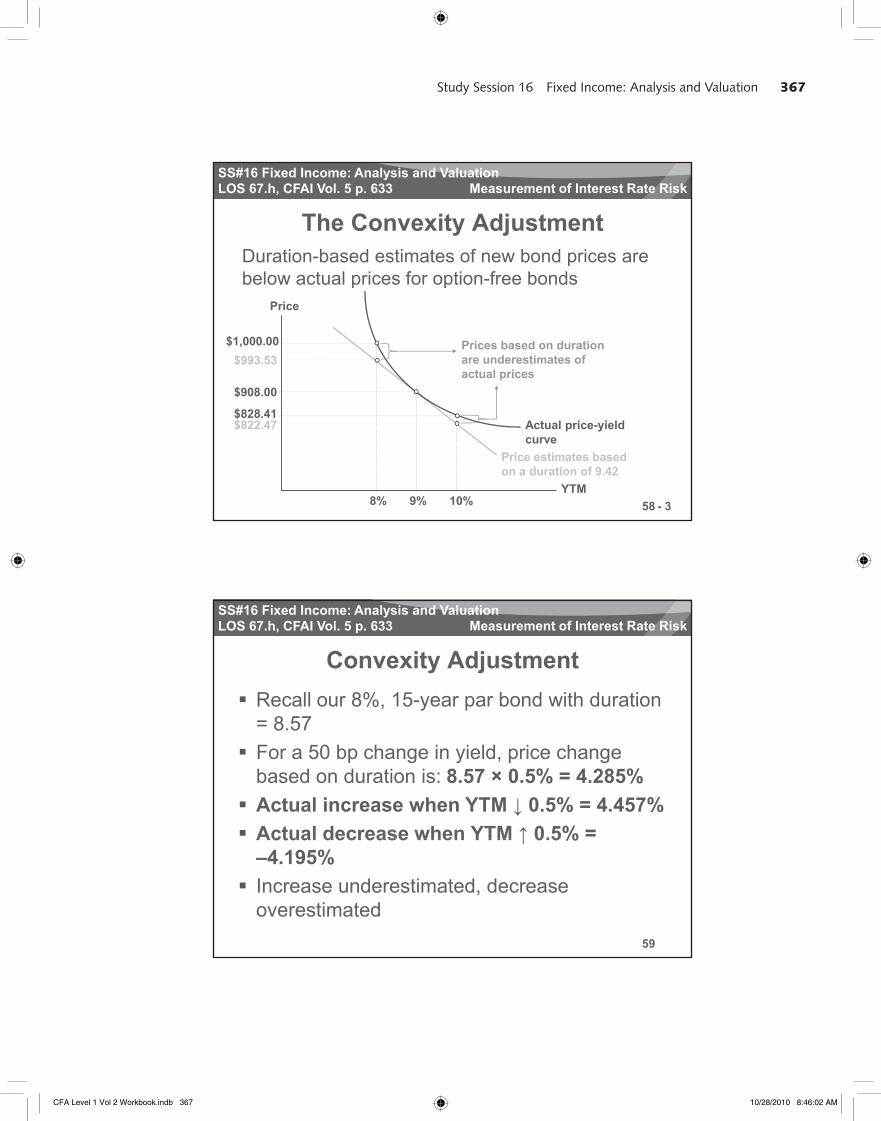
The Convexity AdjustmentDuration-based estimates of new bond prices are below actual prices for option-free bonds
LOS 67.h, CFAI Vol. 5 p. 633 Measurement of Interest Rate Risk
below actual prices for option free bondsPrice
$1,000.00$993.53
$908.00
Prices based on duration are underestimates of actual prices
58YTM
$828.41$822.47
8% 9% 10%
Price estimates based on a duration of 9.42
Actual price-yield curve
- 3
SS#16 Fixed Income: Analysis and Valuation
Convexity AdjustmentRecall our 8%, 15-year par bond with duration
8 57
LOS 67.h, CFAI Vol. 5 p. 633 Measurement of Interest Rate Risk
= 8.57For a 50 bp change in yield, price change based on duration is: 8.57 × 0.5% = 4.285%Actual increase when YTM 0.5% = 4.457%Actual decrease when YTM 0.5% =
59
Actual decrease when YTM 0.5%–4.195%Increase underestimated, decrease overestimated
CFA Level 1 Vol 2 Workbook.indb 367 10/28/2010 8:46:02 AM
368 Study Session 16 Fixed Income: Analysis and Valuation
SS#16 Fixed Income: Analysis and Valuation
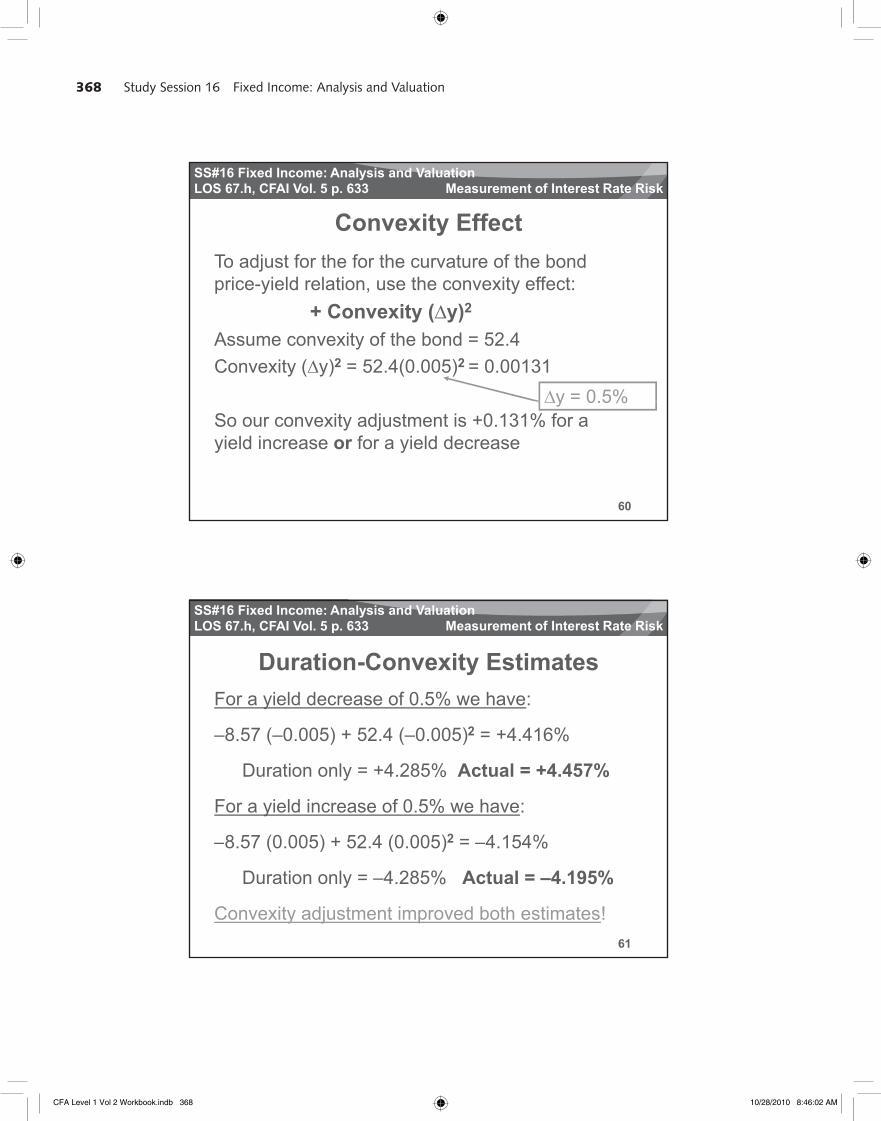
Convexity EffectTo adjust for the for the curvature of the bond price yield relation use the convexity effect:
LOS 67.h, CFAI Vol. 5 p. 633 Measurement of Interest Rate Risk
price-yield relation, use the convexity effect:+ Convexity ( y)2
Assume convexity of the bond = 52.4 Convexity ( y)2 = 52.4(0.005)2 = 0.00131
y = 0.5%
60
So our convexity adjustment is +0.131% for a yield increase or for a yield decrease
y 0.5%
SS#16 Fixed Income: Analysis and Valuation
Duration-Convexity EstimatesFor a yield decrease of 0.5% we have:
LOS 67.h, CFAI Vol. 5 p. 633 Measurement of Interest Rate Risk
–8.57 (–0.005) + 52.4 (–0.005)2 = +4.416%
Duration only = +4.285% Actual = +4.457%
For a yield increase of 0.5% we have:
8 57 (0 005) + 52 4 (0 005)2 = 4 154%
61
–8.57 (0.005) + 52.4 (0.005)2 = –4.154%
Duration only = –4.285% Actual = –4.195%
Convexity adjustment improved both estimates!
CFA Level 1 Vol 2 Workbook.indb 368 10/28/2010 8:46:02 AM
369Study Session 16 Fixed Income: Analysis and Valuation
SS#16 Fixed Income: Analysis and Valuation
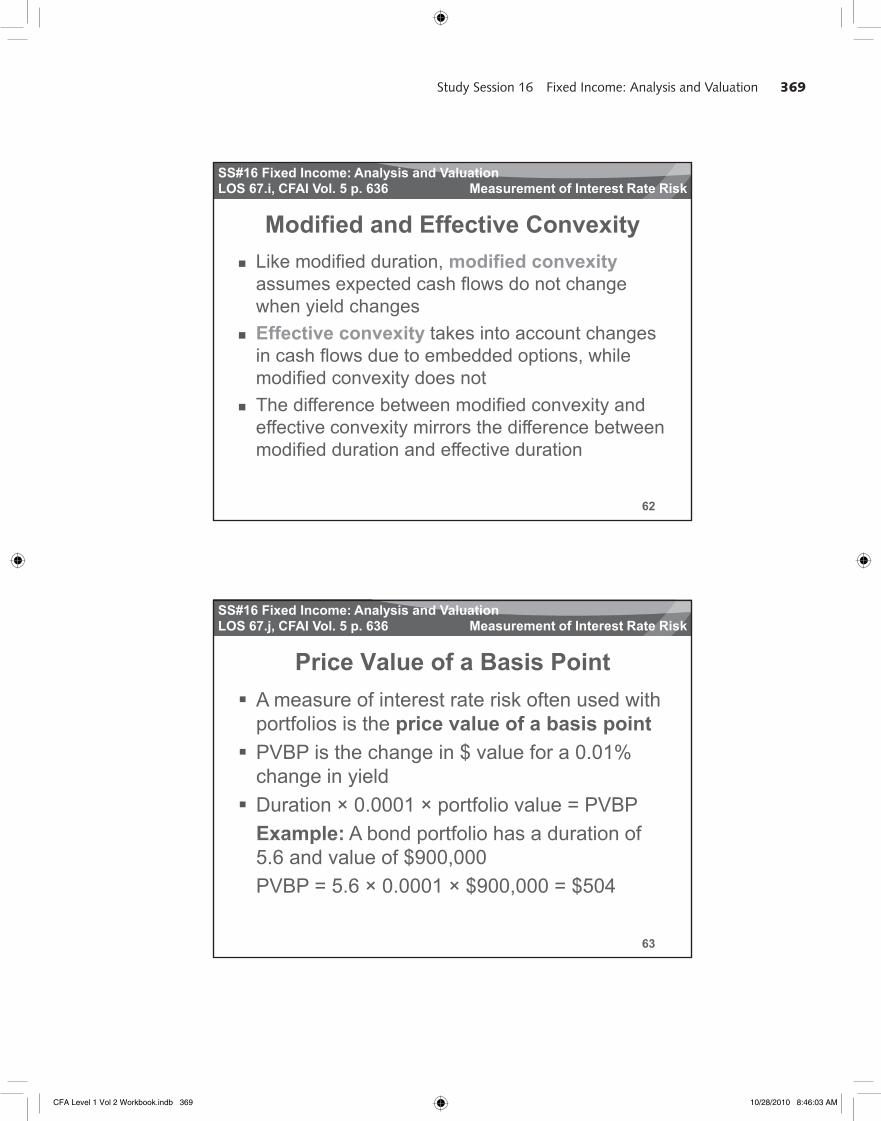
Modified and Effective ConvexityLike modified duration, modified convexityassumes expected cash flows do not change
LOS 67.i, CFAI Vol. 5 p. 636 Measurement of Interest Rate Risk
assumes expected cash flows do not changewhen yield changesEffective convexity takes into account changes in cash flows due to embedded options, while modified convexity does notThe difference bet een modified con e it and
62
The difference between modified convexity andeffective convexity mirrors the difference between modified duration and effective duration
SS#16 Fixed Income: Analysis and Valuation
Price Value of a Basis PointA measure of interest rate risk often used with
tf li i th i l f b i i t
LOS 67.j, CFAI Vol. 5 p. 636 Measurement of Interest Rate Risk
portfolios is the price value of a basis pointPVBP is the change in $ value for a 0.01% change in yieldDuration × 0.0001 × portfolio value = PVBPExample: A bond portfolio has a duration of
63
Example: A bond portfolio has a duration of5.6 and value of $900,000PVBP = 5.6 × 0.0001 × $900,000 = $504
CFA Level 1 Vol 2 Workbook.indb 369 10/28/2010 8:46:03 AM
370 Study Session 16 Fixed Income: Analysis and Valuation
SS#16 Fixed Income: Analysis and Valuation
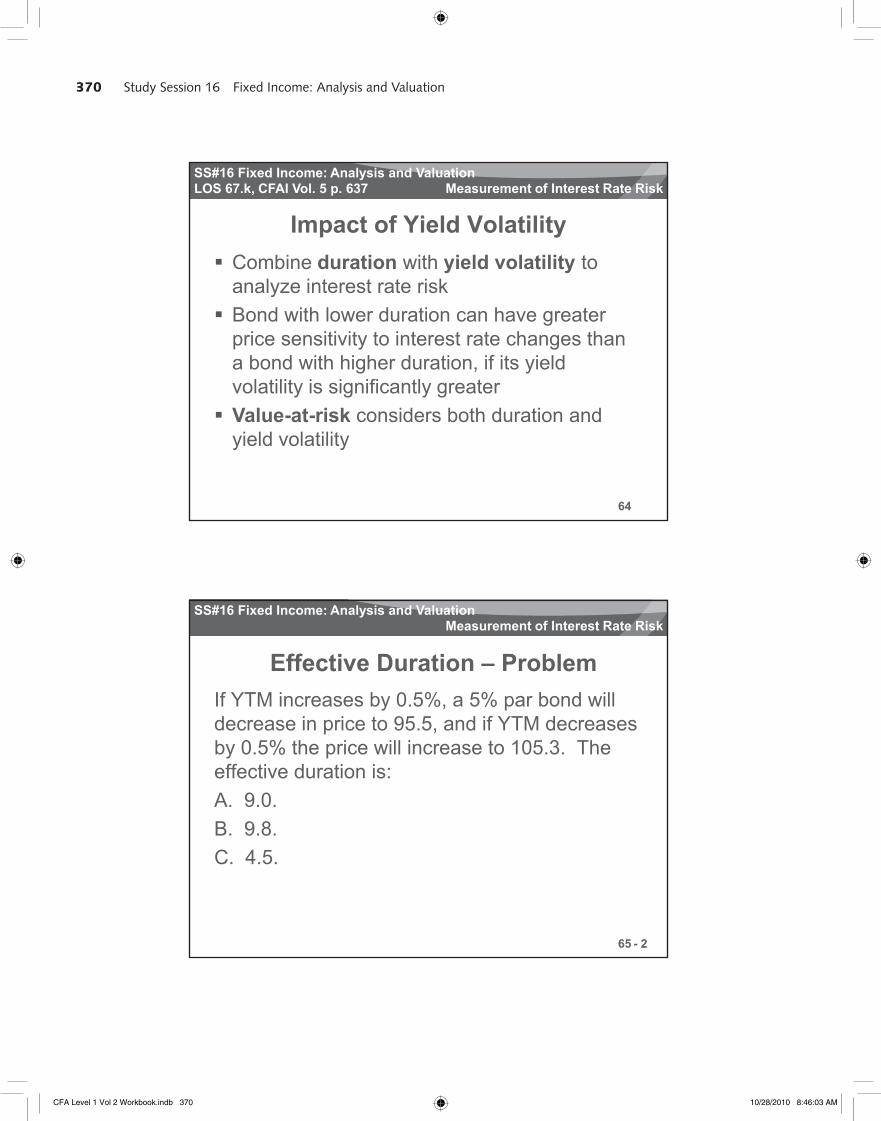
Impact of Yield VolatilityCombine duration with yield volatility to
l i t t t i k
LOS 67.k, CFAI Vol. 5 p. 637 Measurement of Interest Rate Risk
analyze interest rate riskBond with lower duration can have greater price sensitivity to interest rate changes than a bond with higher duration, if its yield volatility is significantly greater
64
Value-at-risk considers both duration and yield volatility
SS#16 Fixed Income: Analysis and Valuation
Effective Duration – ProblemIf YTM increases by 0.5%, a 5% par bond will d i i t 95 5 d if YTM d
Measurement of Interest Rate Risk
decrease in price to 95.5, and if YTM decreasesby 0.5% the price will increase to 105.3. The effective duration is:A. 9.0.B. 9.8.
65
C. 4.5.
- 2
CFA Level 1 Vol 2 Workbook.indb 370 10/28/2010 8:46:03 AM
371Study Session 16 Fixed Income: Analysis and Valuation
SS#16 Fixed Income: Analysis and Valuation
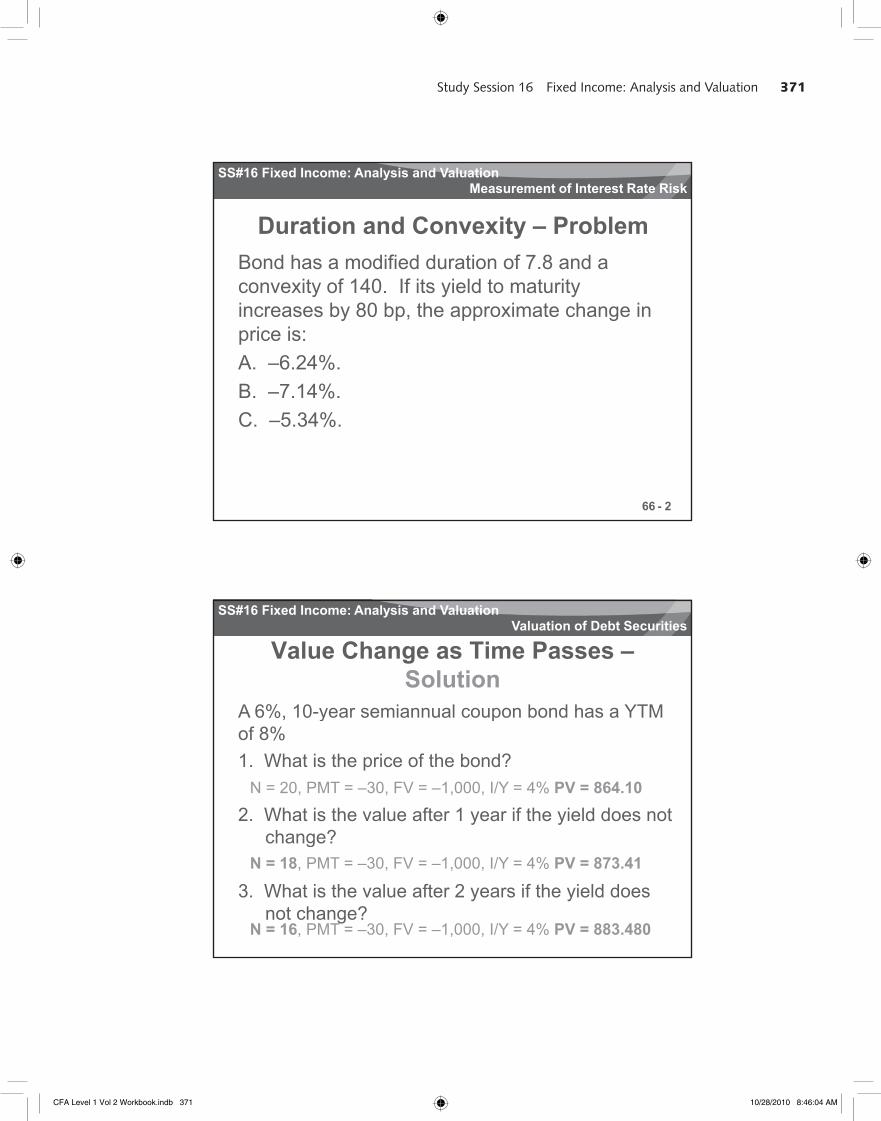
Duration and Convexity – ProblemBond has a modified duration of 7.8 and a
it f 140 If it i ld t t it
Measurement of Interest Rate Risk
convexity of 140. If its yield to maturityincreases by 80 bp, the approximate change in price is:A. –6.24%.B. –7.14%.
66
C. –5.34%.
- 2
SS#16 Fixed Income: Analysis and Valuation
Value Change as Time Passes –Solution
A 6%, 10-year semiannual coupon bond has a YTM
Valuation of Debt Securities
, y pof 8%1. What is the price of the bond?
2. What is the value after 1 year if the yield does not change?
N = 20, PMT = –30, FV = –1,000, I/Y = 4% PV = 864.10
67
change?
3. What is the value after 2 years if the yield does not change?
N = 18, PMT = –30, FV = –1,000, I/Y = 4% PV = 873.41
N = 16, PMT = –30, FV = –1,000, I/Y = 4% PV = 883.480
CFA Level 1 Vol 2 Workbook.indb 371 10/28/2010 8:46:04 AM
372 Study Session 16 Fixed Income: Analysis and Valuation
SS#16 Fixed Income: Analysis and Valuation
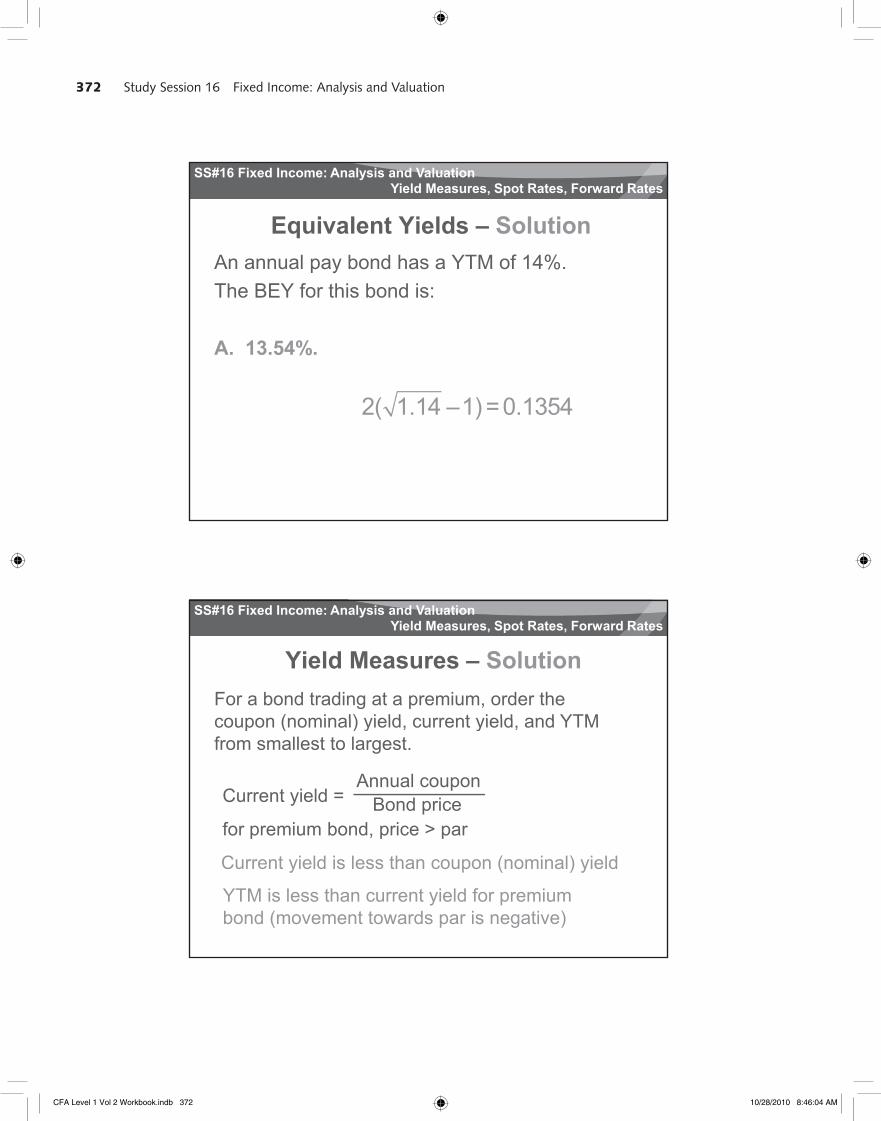
Equivalent Yields – SolutionAn annual pay bond has a YTM of 14%.
Yield Measures, Spot Rates, Forward Rates
The BEY for this bond is:
A. 13.54%.
2( 1 14 1) 0 1354
68
2( 1.14 –1) =0.1354
SS#16 Fixed Income: Analysis and Valuation
Yield Measures – SolutionFor a bond trading at a premium, order the coupon (nominal) yield current yield and YTM
Yield Measures, Spot Rates, Forward Rates
coupon (nominal) yield, current yield, and YTMfrom smallest to largest.
Current yield =
for premium bond, price > par
Annual couponBond price
69
Current yield is less than coupon (nominal) yield
YTM is less than current yield for premium bond (movement towards par is negative)
p p p
CFA Level 1 Vol 2 Workbook.indb 372 10/28/2010 8:46:04 AM
373Study Session 16 Fixed Income: Analysis and Valuation
SS#16 Fixed Income: Analysis and Valuation
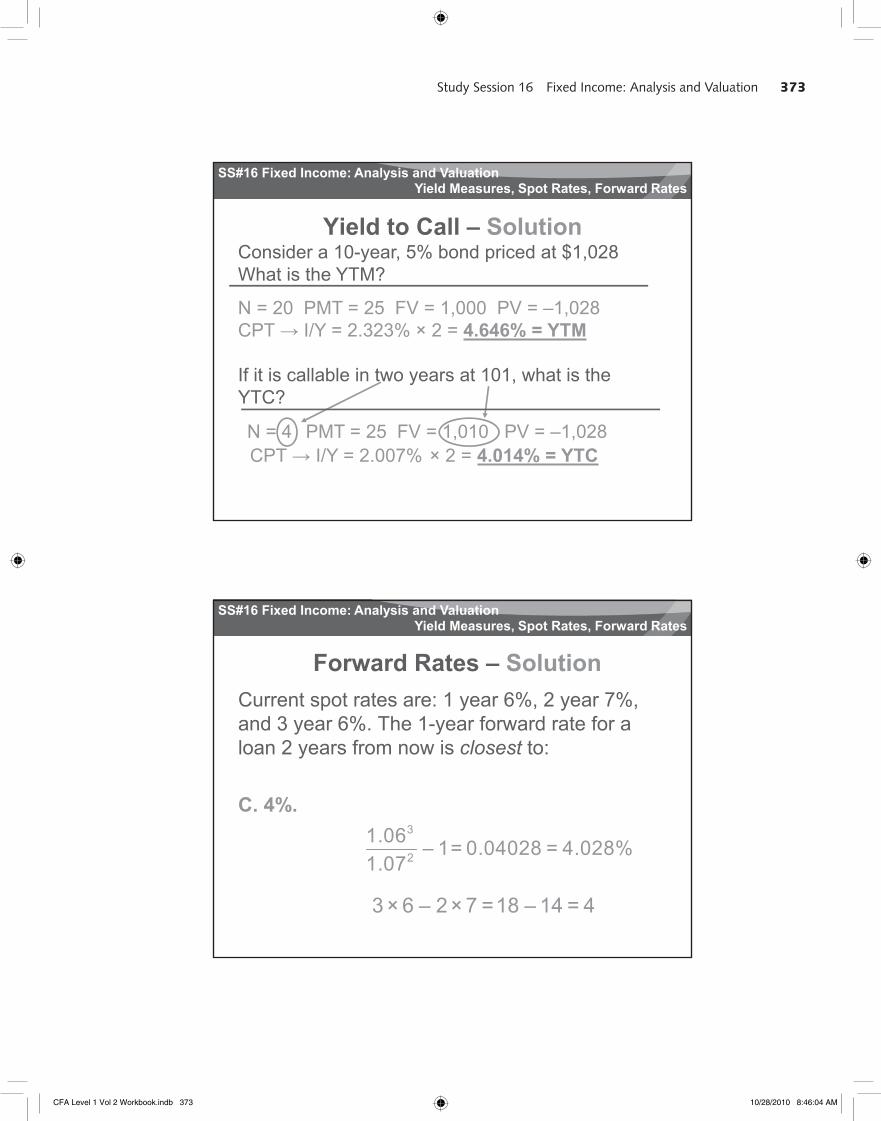
Yield to Call – SolutionConsider a 10-year, 5% bond priced at $1,028What is the YTM?
Yield Measures, Spot Rates, Forward Rates
N = 20 PMT = 25 FV = 1,000 PV = –1,028CPT I/Y = 2.323% × 2 = 4.646% = YTM
If it is callable in two years at 101, what is the YTC?
70
N = 4 PMT = 25 FV = 1,010
YTC?
CPT I/Y = 2.007% × 2 = 4.014% = YTCPV = –1,028
SS#16 Fixed Income: Analysis and Valuation
Forward Rates – SolutionCurrent spot rates are: 1 year 6%, 2 year 7%,
d 3 6% Th 1 f d t f
Yield Measures, Spot Rates, Forward Rates
and 3 year 6%. The 1-year forward rate for a loan 2 years from now is closest to:
C. 4%. 31 06
71
2
1.06 – 1 = 0.04028 = 4.028%1.07
3 × 6 – 2 × 7 = 18 – 14 = 4
CFA Level 1 Vol 2 Workbook.indb 373 10/28/2010 8:46:04 AM
374 Study Session 16 Fixed Income: Analysis and Valuation
SS#16 Fixed Income: Analysis and Valuation
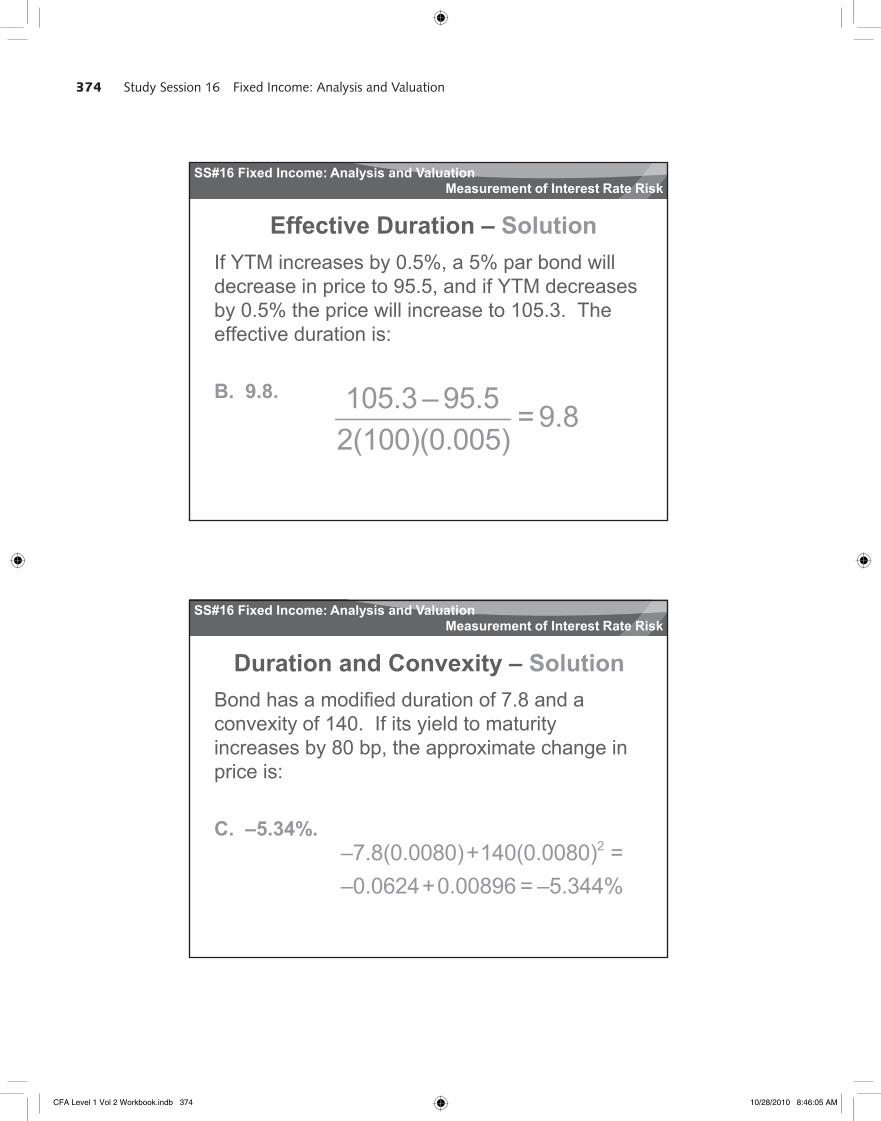
Effective Duration – SolutionIf YTM increases by 0.5%, a 5% par bond will d i i t 95 5 d if YTM d
Measurement of Interest Rate Risk
decrease in price to 95.5, and if YTM decreasesby 0.5% the price will increase to 105.3. The effective duration is:
B. 9.8. 105 3 – 95 5
72
105.3 – 95.5 = 9.82(100)(0.005)
SS#16 Fixed Income: Analysis and Valuation
Duration and Convexity – SolutionBond has a modified duration of 7.8 and a
it f 140 If it i ld t t it
Measurement of Interest Rate Risk
convexity of 140. If its yield to maturityincreases by 80 bp, the approximate change in price is:
C. –5.34%.
73
2–7.8(0.0080)+140(0.0080) =–0.0624+0.00896 = –5.344%
CFA Level 1 Vol 2 Workbook.indb 374 10/28/2010 8:46:05 AM