Embed Size (px)
Citation preview
CFD Analysis to Evaluate a Passive Ventilation System for a Building in Hot and Humid Climate – Auroville Language Laboratory, India.
Santi Qirko - Transsolar Academy 6 - Transsolar Energietechnik GmbH - 2019
Abstract This paper explains the process of using a steady state CFD analysis in OpenFOAM to simulate pressure
coefficient (Cp) data for evaluating a passive ventilation system in an existing building in Auroville,
India. Three external points on the building are analyzed in this study: The inlet tower, the exhaust
shaft, and a room window. The major finding of the study is that the proximity of dense vegetation
close to the building has a dominating influence on the pattern of the wind flow around the building.
In addition, the position of the evaluation points in relation to the wind direction i.e. windward or
leeward, plays an important role in affecting the Cp values. Four wind directions are simulated based
on the weather data. In all the cases, a pressure drop between the inlet tower and the exhaust shaft
is observed. These results serve to indicate that there is a potential for air flow in the ventilation system
in the desired direction. It is also found that the impact of the exact geometry & location of the inlet
in the inlet tower is negligible compared to the impact of the turbulence caused by the surrounding
vegetation. These findings help to identify and understand the primary factors that affect the Cp values
in the building. These data are further used as input in a separate network flow simulation software
(TRNFLOW) to further evaluate the dynamic annual performance of the passive ventilation system,
which is discussed in another paper.
Introduction The language laboratory in Auroville, India is a building that has a passive ventilation system composed
of three air inlet towers, coupled with an underground tunnel and exhaust shafts. When fully complete,
there will be a constant flow of pre-cooled and dehumidified air throughout the building. The pre-
cooled air will come from 3 wide air inlet towers located outside the main building. It will be distributed
throughout the building to every room through a network of wide underground air channels and
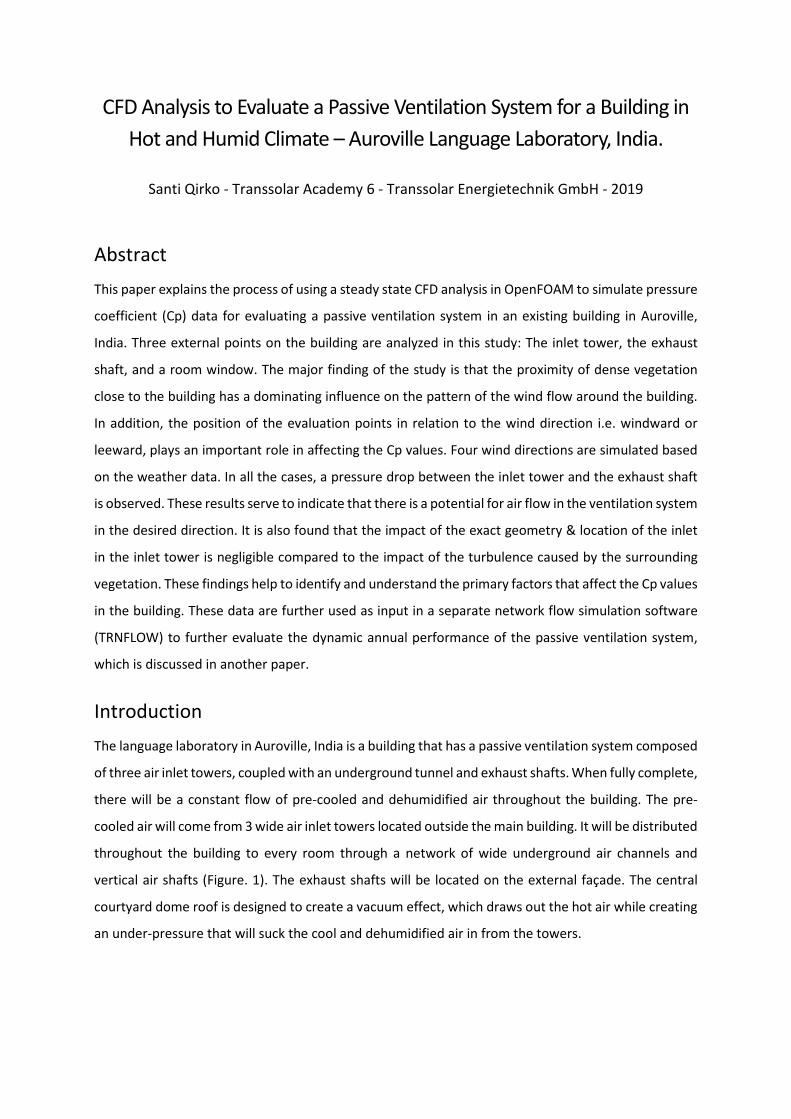
vertical air shafts (Figure. 1). The exhaust shafts will be located on the external façade. The central
courtyard dome roof is designed to create a vacuum effect, which draws out the hot air while creating
an under-pressure that will suck the cool and dehumidified air in from the towers.
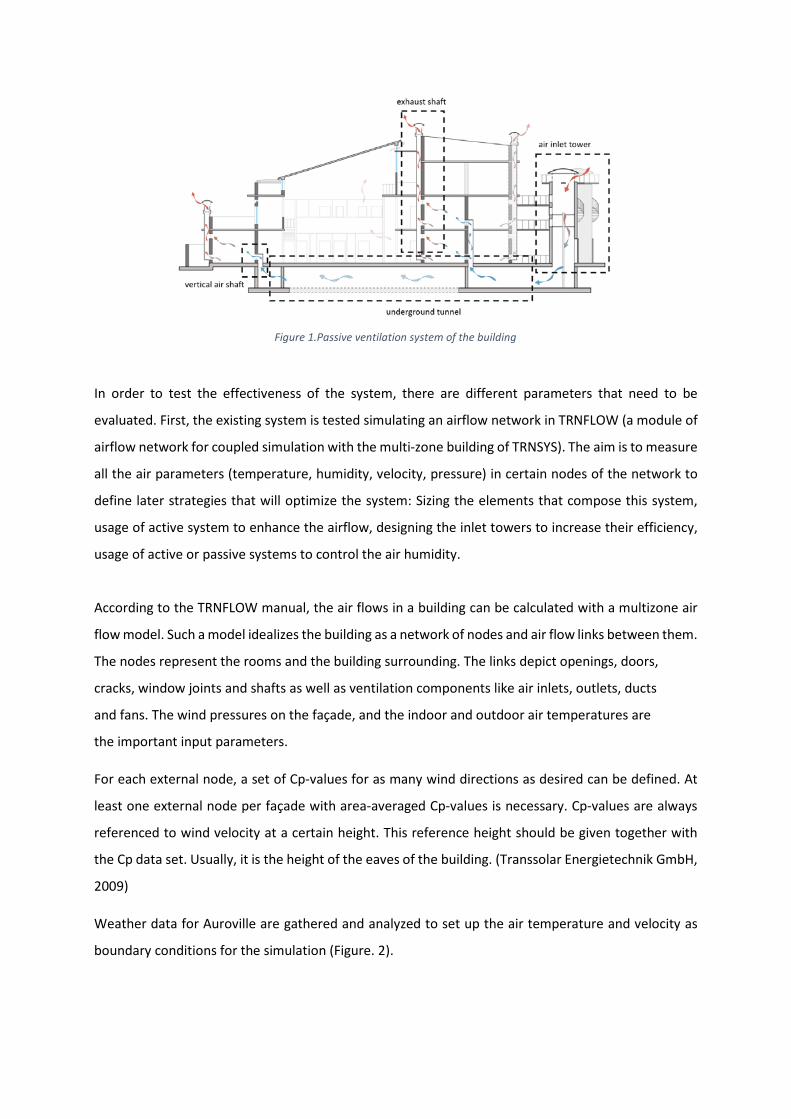
Figure 1.Passive ventilation system of the building
In order to test the effectiveness of the system, there are different parameters that need to be
evaluated. First, the existing system is tested simulating an airflow network in TRNFLOW (a module of
airflow network for coupled simulation with the multi-zone building of TRNSYS). The aim is to measure
all the air parameters (temperature, humidity, velocity, pressure) in certain nodes of the network to
define later strategies that will optimize the system: Sizing the elements that compose this system,
usage of active system to enhance the airflow, designing the inlet towers to increase their efficiency,
usage of active or passive systems to control the air humidity.
According to the TRNFLOW manual, the air flows in a building can be calculated with a multizone air
flow model. Such a model idealizes the building as a network of nodes and air flow links between them.
The nodes represent the rooms and the building surrounding. The links depict openings, doors,
cracks, window joints and shafts as well as ventilation components like air inlets, outlets, ducts
and fans. The wind pressures on the façade, and the indoor and outdoor air temperatures are
the important input parameters.
For each external node, a set of Cp-values for as many wind directions as desired can be defined. At
least one external node per façade with area-averaged Cp-values is necessary. Cp-values are always
referenced to wind velocity at a certain height. This reference height should be given together with
the Cp data set. Usually, it is the height of the eaves of the building. (Transsolar Energietechnik GmbH,
2009)
Weather data for Auroville are gathered and analyzed to set up the air temperature and velocity as
boundary conditions for the simulation (Figure. 2).
Figure 2. Yearly wind rose
According to the climate analysis, the most wind comes from the southwest and southeast directions,
however, there are high levels of wind in all directions yearly, with an average wind speed of 2.5 m/s.
Wind speeds at night are more common from Northwest and Southwest. The average wind speed is
also 2.5 m/s.
To calculate the Cp values for the boundary conditions in TRNFLOW, a CFD simulation is made using
OpenFOAM.
Creating the 3D Model and the Surrounding Vegetation The 3d model of the building is created using 2d draftings and pictures that are provided by the client.
The model is created using the 3d software Rhinoceros (Figure. 2).
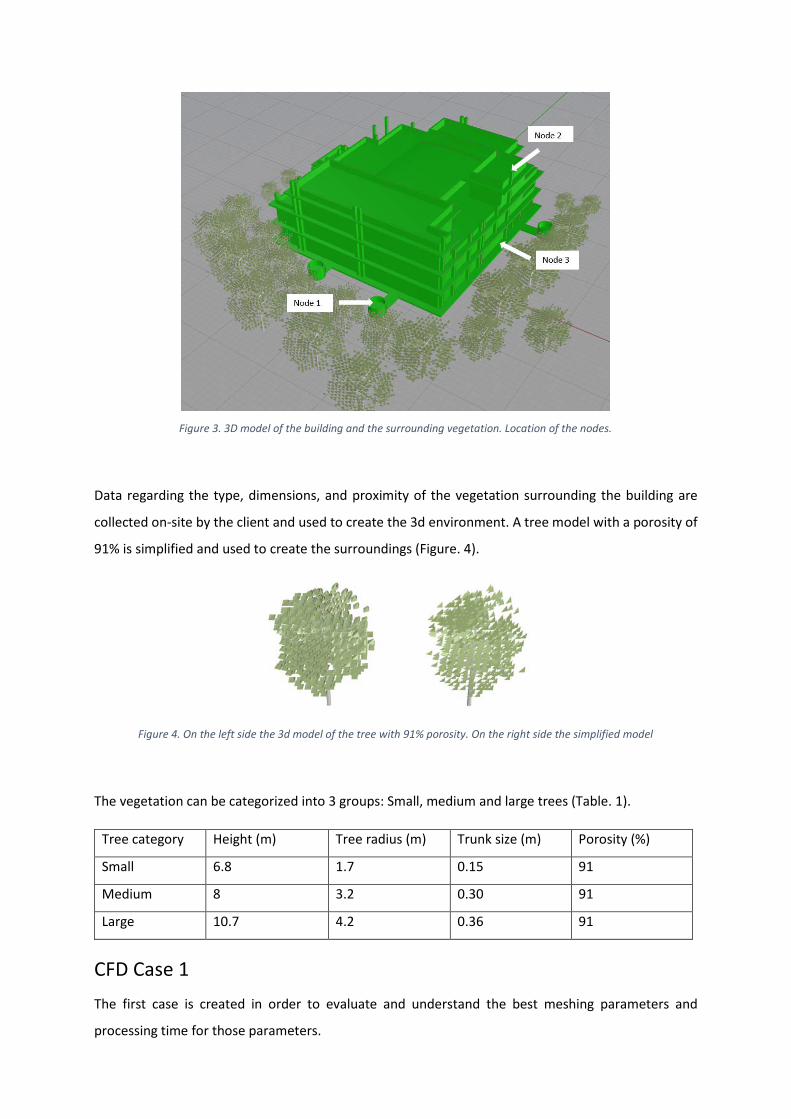
Figure 3. 3D model of the building and the surrounding vegetation. Location of the nodes.
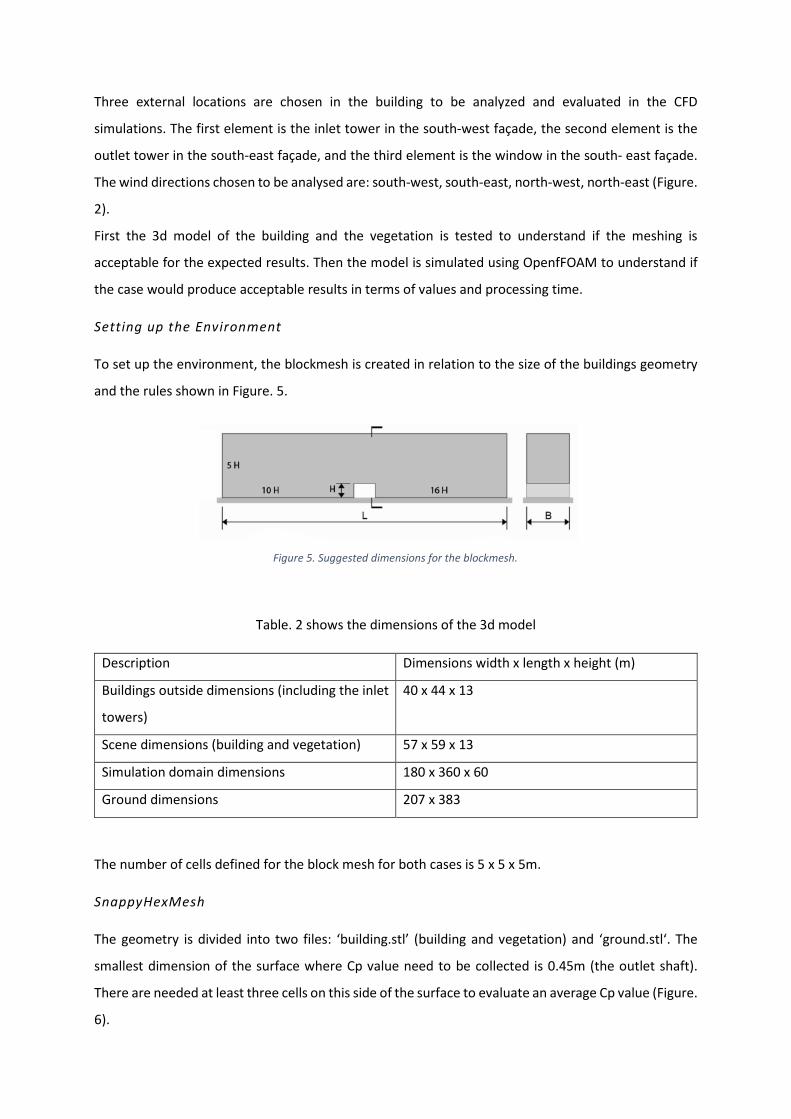
Data regarding the type, dimensions, and proximity of the vegetation surrounding the building are
collected on-site by the client and used to create the 3d environment. A tree model with a porosity of
91% is simplified and used to create the surroundings (Figure. 4).
Figure 4. On the left side the 3d model of the tree with 91% porosity. On the right side the simplified model
The vegetation can be categorized into 3 groups: Small, medium and large trees (Table. 1).
Tree category Height (m) Tree radius (m) Trunk size (m) Porosity (%)
Small 6.8 1.7 0.15 91
Medium 8 3.2 0.30 91
Large 10.7 4.2 0.36 91
CFD Case 1 The first case is created in order to evaluate and understand the best meshing parameters and
processing time for those parameters.
Three external locations are chosen in the building to be analyzed and evaluated in the CFD
simulations. The first element is the inlet tower in the south-west façade, the second element is the
outlet tower in the south-east façade, and the third element is the window in the south- east façade.
The wind directions chosen to be analysed are: south-west, south-east, north-west, north-east (Figure.
2).
First the 3d model of the building and the vegetation is tested to understand if the meshing is
acceptable for the expected results. Then the model is simulated using OpenfFOAM to understand if
the case would produce acceptable results in terms of values and processing time.
Setting up the Environment
To set up the environment, the blockmesh is created in relation to the size of the buildings geometry
and the rules shown in Figure. 5.
Figure 5. Suggested dimensions for the blockmesh.
Table. 2 shows the dimensions of the 3d model
Description Dimensions width x length x height (m)
Buildings outside dimensions (including the inlet
towers)
40 x 44 x 13
Scene dimensions (building and vegetation) 57 x 59 x 13
Simulation domain dimensions 180 x 360 x 60
Ground dimensions 207 x 383
The number of cells defined for the block mesh for both cases is 5 x 5 x 5m.
SnappyHexMesh
The geometry is divided into two files: ‘building.stl’ (building and vegetation) and ‘ground.stl‘. The
smallest dimension of the surface where Cp value need to be collected is 0.45m (the outlet shaft).
There are needed at least three cells on this side of the surface to evaluate an average Cp value (Figure.
6).
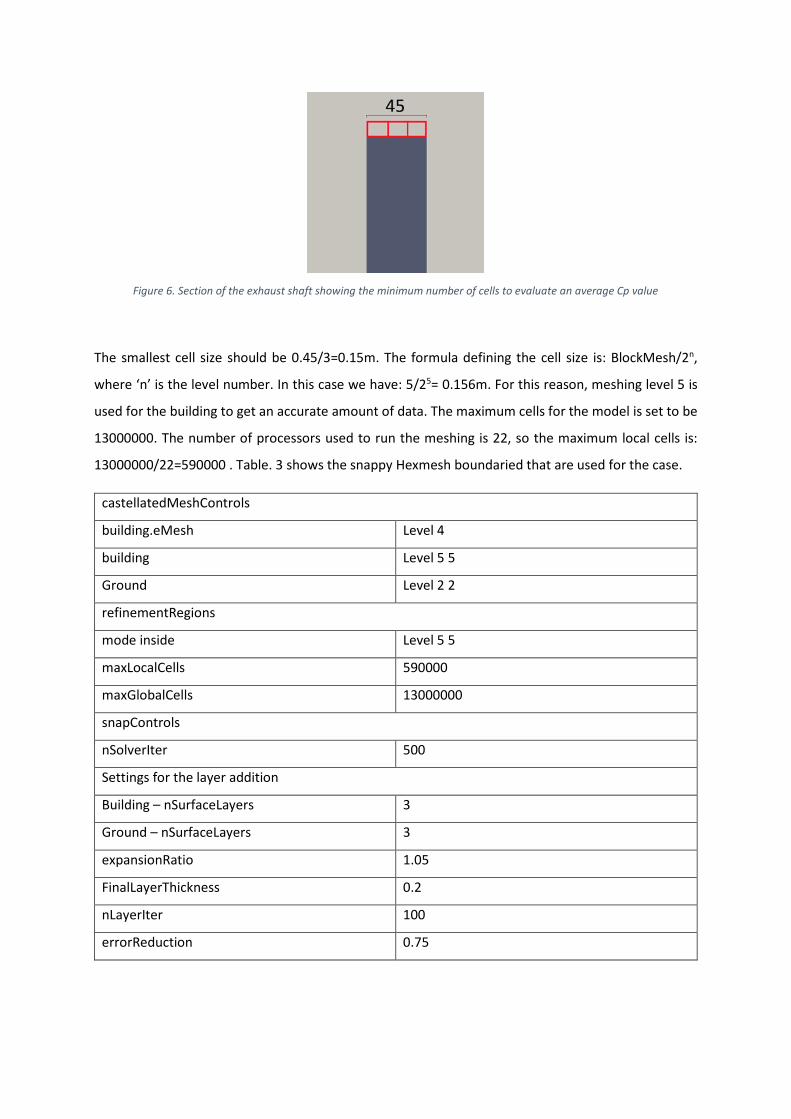
Figure 6. Section of the exhaust shaft showing the minimum number of cells to evaluate an average Cp value
The smallest cell size should be 0.45/3=0.15m. The formula defining the cell size is: BlockMesh/2n,
where ‘n’ is the level number. In this case we have: 5/25= 0.156m. For this reason, meshing level 5 is
used for the building to get an accurate amount of data. The maximum cells for the model is set to be
13000000. The number of processors used to run the meshing is 22, so the maximum local cells is:
13000000/22=590000 . Table. 3 shows the snappy Hexmesh boundaried that are used for the case.
castellatedMeshControls
building.eMesh Level 4
building Level 5 5
Ground Level 2 2
refinementRegions
mode inside Level 5 5
maxLocalCells 590000
maxGlobalCells 13000000
snapControls
nSolverIter 500
Settings for the layer addition
Building – nSurfaceLayers 3
Ground – nSurfaceLayers 3
expansionRatio 1.05
FinalLayerThickness 0.2
nLayerIter 100
errorReduction 0.75
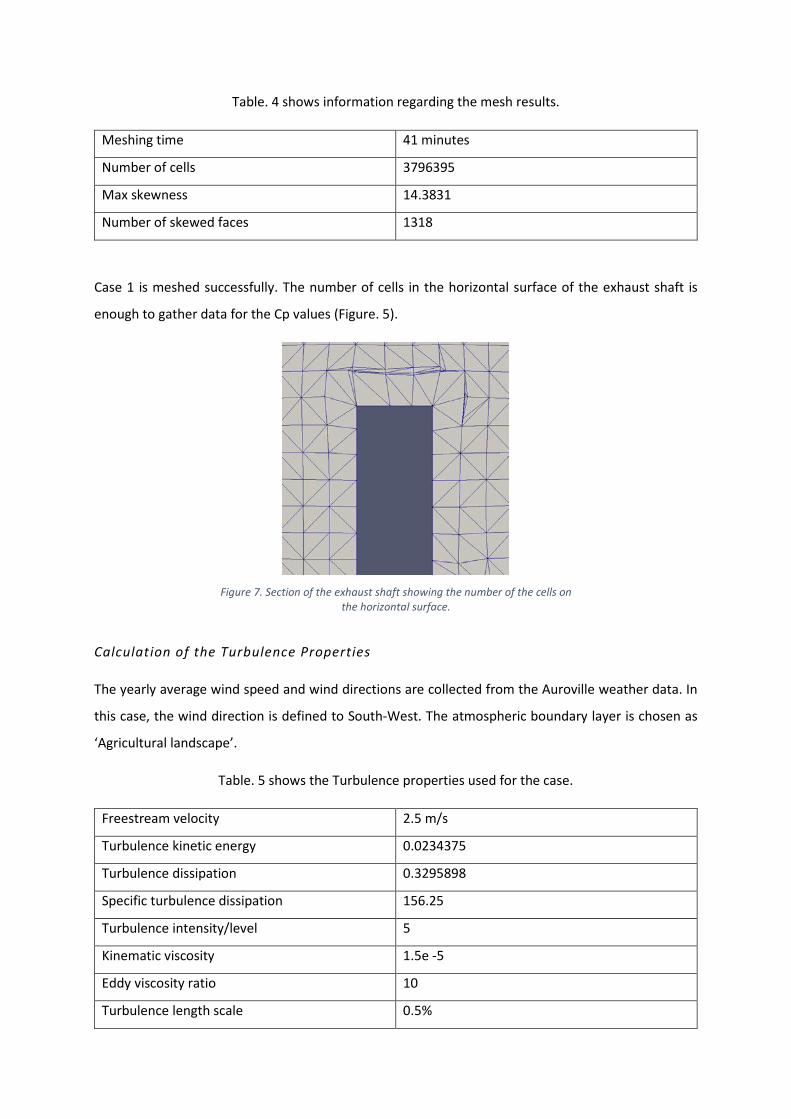
Table. 4 shows information regarding the mesh results.
Meshing time 41 minutes
Number of cells 3796395
Max skewness 14.3831
Number of skewed faces 1318
Case 1 is meshed successfully. The number of cells in the horizontal surface of the exhaust shaft is
enough to gather data for the Cp values (Figure. 5).
Figure 7. Section of the exhaust shaft showing the number of the cells on
the horizontal surface.
Calculation of the Turbulence Properties
The yearly average wind speed and wind directions are collected from the Auroville weather data. In
this case, the wind direction is defined to South-West. The atmospheric boundary layer is chosen as
‘Agricultural landscape’.
Table. 5 shows the Turbulence properties used for the case.
Freestream velocity 2.5 m/s
Turbulence kinetic energy 0.0234375
Turbulence dissipation 0.3295898
Specific turbulence dissipation 156.25
Turbulence intensity/level 5
Kinematic viscosity 1.5e -5
Eddy viscosity ratio 10
Turbulence length scale 0.5%
CFD Simulation
Table. 6 shows the parameters set for the simulation.
Number of iterations 2000
fvSolution
P tolerance 1e -9
U tolerance 1e -8
K tolerance 1e -8
Epsilon tolerance 1e -8
Omega tolerance 1e -8
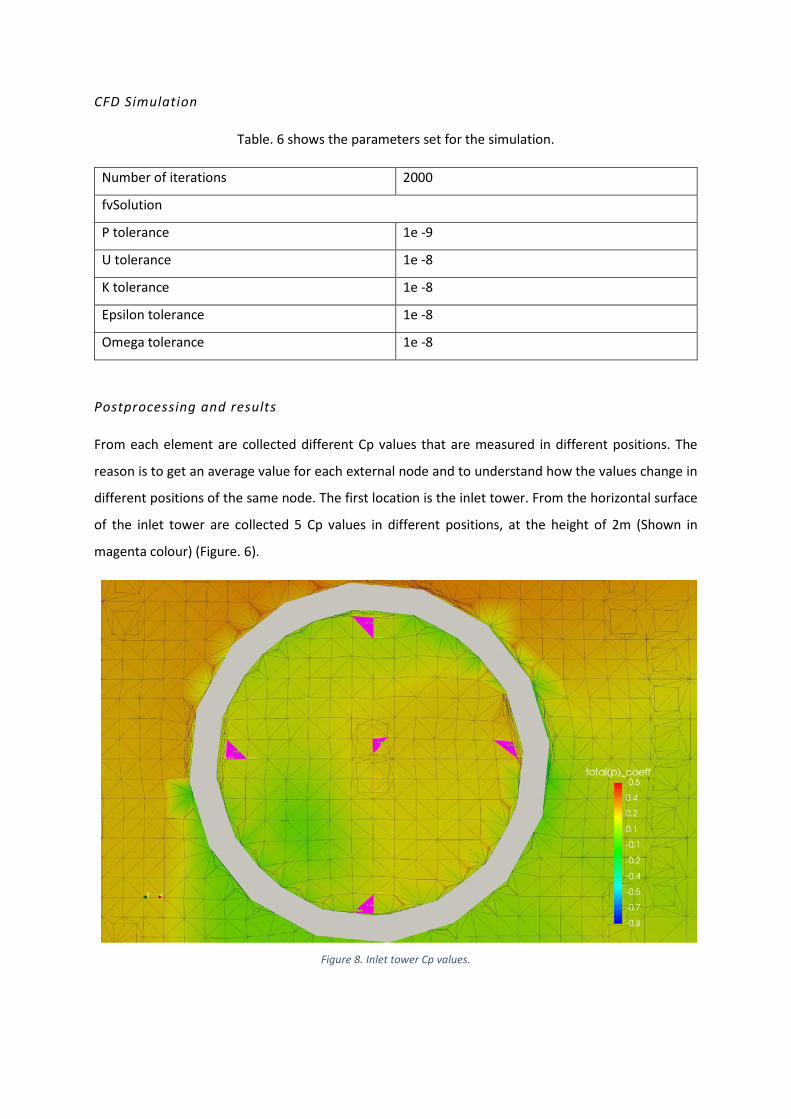
Postprocessing and results
From each element are collected different Cp values that are measured in different positions. The
reason is to get an average value for each external node and to understand how the values change in
different positions of the same node. The first location is the inlet tower. From the horizontal surface
of the inlet tower are collected 5 Cp values in different positions, at the height of 2m (Shown in
magenta colour) (Figure. 6).
Figure 8. Inlet tower Cp values.
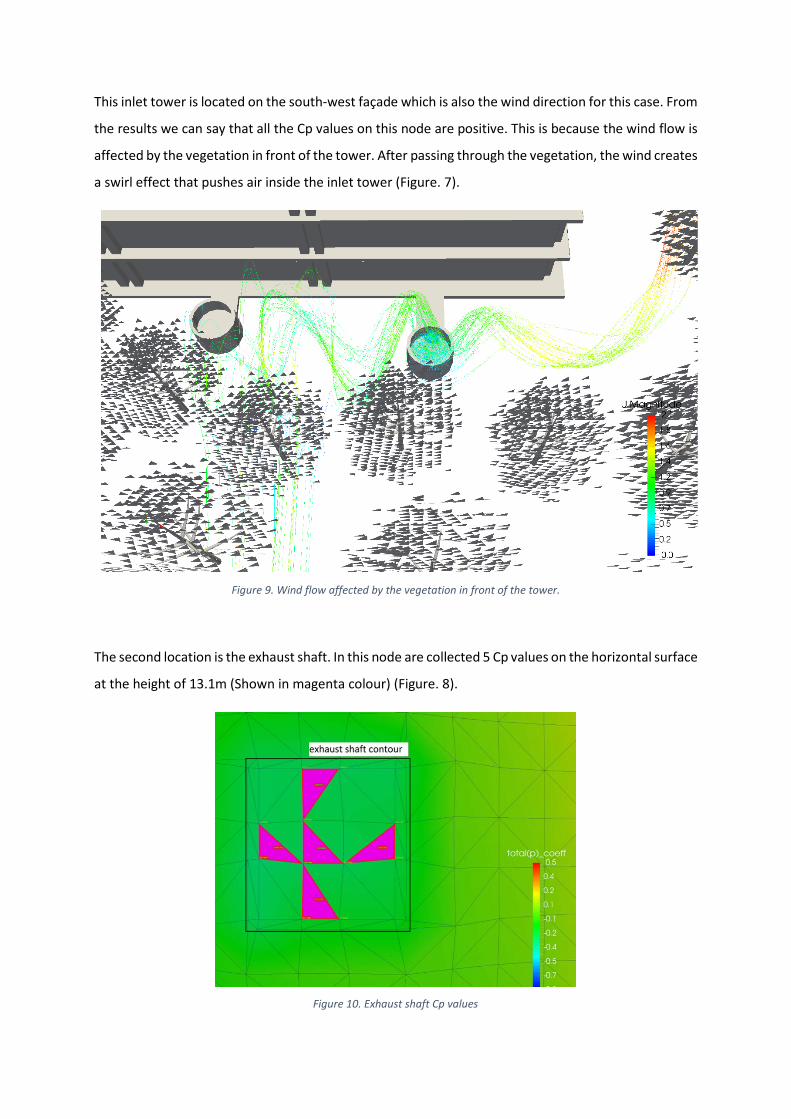
This inlet tower is located on the south-west façade which is also the wind direction for this case. From
the results we can say that all the Cp values on this node are positive. This is because the wind flow is
affected by the vegetation in front of the tower. After passing through the vegetation, the wind creates
a swirl effect that pushes air inside the inlet tower (Figure. 7).
Figure 9. Wind flow affected by the vegetation in front of the tower.
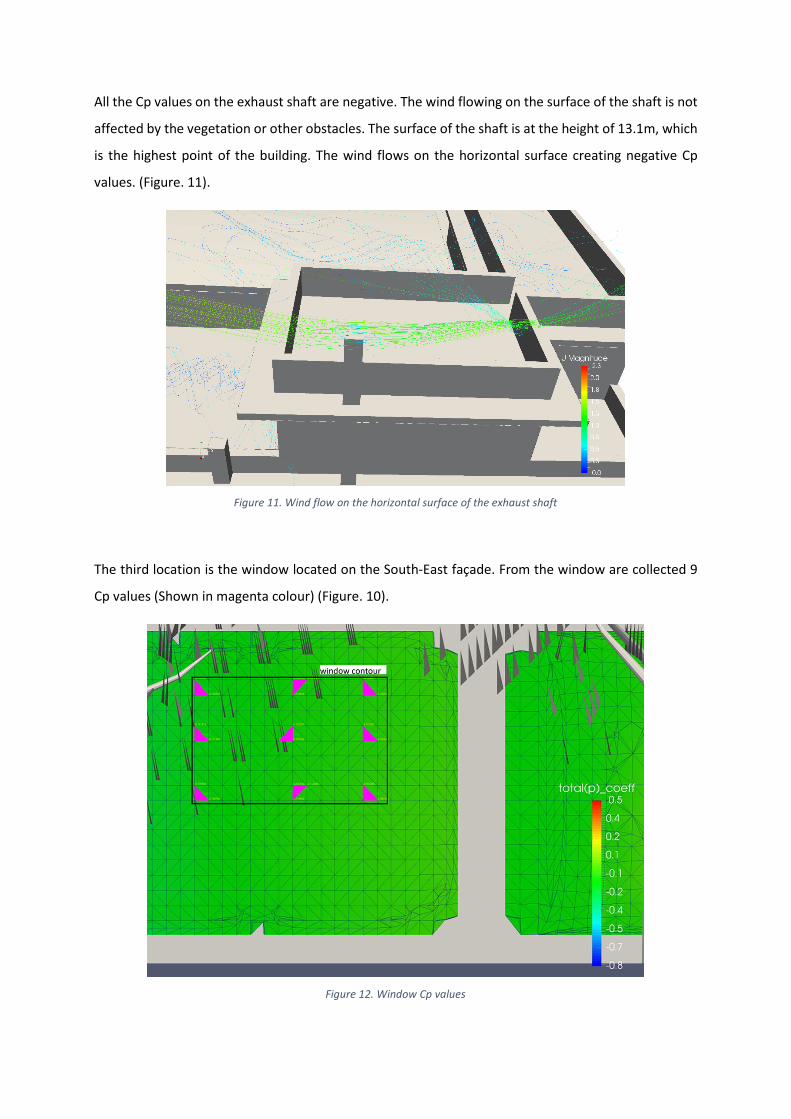
The second location is the exhaust shaft. In this node are collected 5 Cp values on the horizontal surface
at the height of 13.1m (Shown in magenta colour) (Figure. 8).
Figure 10. Exhaust shaft Cp values
All the Cp values on the exhaust shaft are negative. The wind flowing on the surface of the shaft is not
affected by the vegetation or other obstacles. The surface of the shaft is at the height of 13.1m, which
is the highest point of the building. The wind flows on the horizontal surface creating negative Cp
values. (Figure. 11).
Figure 11. Wind flow on the horizontal surface of the exhaust shaft
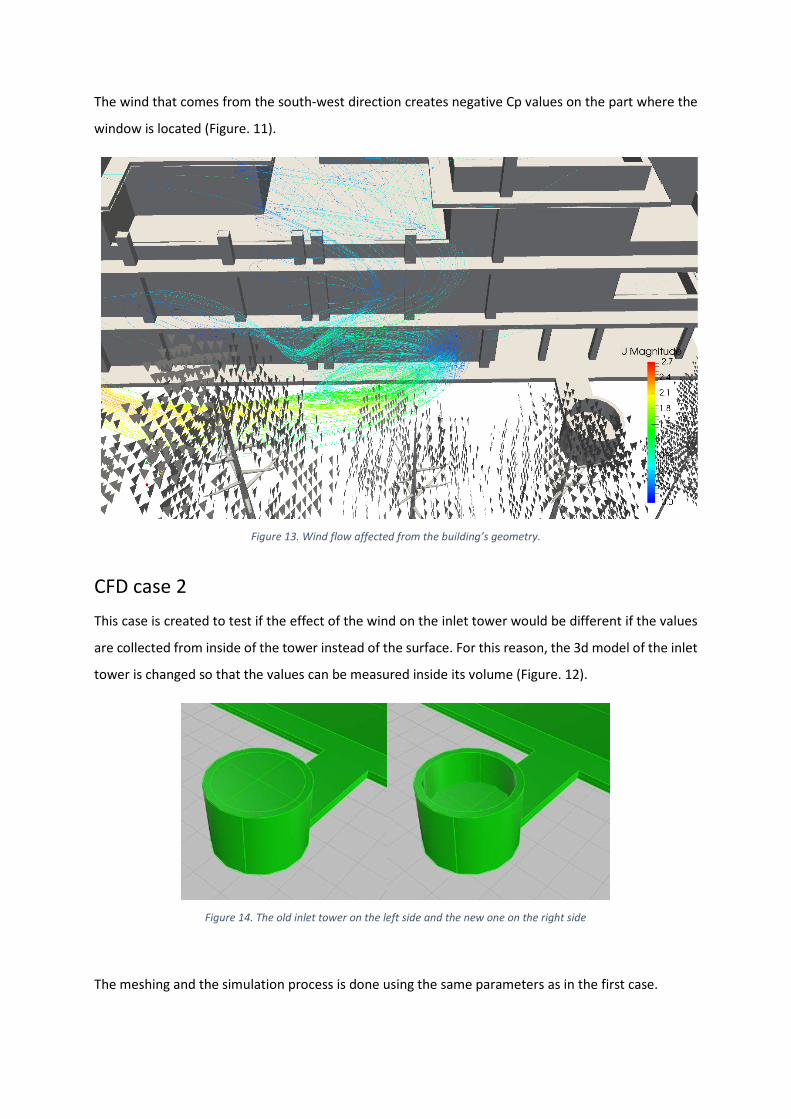
The third location is the window located on the South-East façade. From the window are collected 9
Cp values (Shown in magenta colour) (Figure. 10).
Figure 12. Window Cp values
The wind that comes from the south-west direction creates negative Cp values on the part where the
window is located (Figure. 11).
Figure 13. Wind flow affected from the building’s geometry.
CFD case 2 This case is created to test if the effect of the wind on the inlet tower would be different if the values
are collected from inside of the tower instead of the surface. For this reason, the 3d model of the inlet
tower is changed so that the values can be measured inside its volume (Figure. 12).
Figure 14. The old inlet tower on the left side and the new one on the right side
The meshing and the simulation process is done using the same parameters as in the first case.
Postprocessing and Results
The Cp values for the inlet tower are collected at the height of 1.8m (or 0.2m inside the tower).
Table. 7 shows a comparison between the Cp values of case 1 and case 2.
The results show that even though there is a small difference between the Cp values (due to the height
difference of the collected valus), the effect of the wind flow in case 2 is the same as in case 1 because
it is affected by the vegetation and not by the shape of the tower. After this conclusion, the other
scenarios were the wind changes direction, are simulated using the 3D model of case 2.
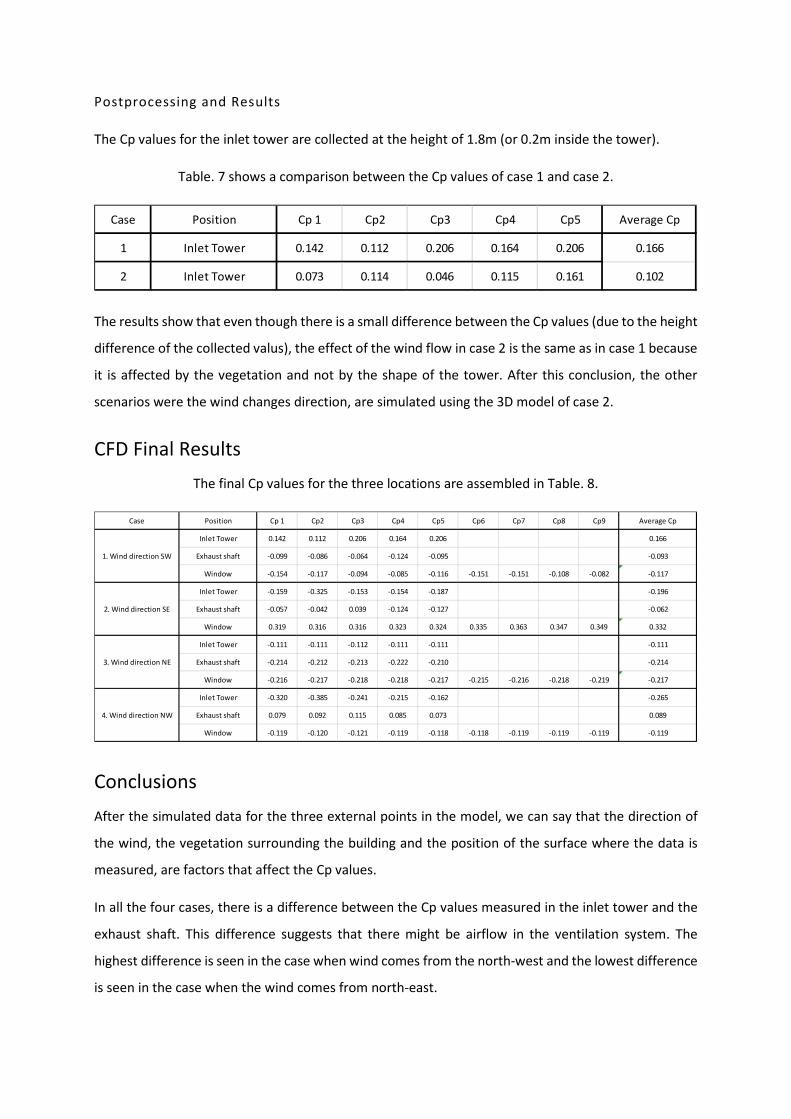
CFD Final Results The final Cp values for the three locations are assembled in Table. 8.
Conclusions After the simulated data for the three external points in the model, we can say that the direction of
the wind, the vegetation surrounding the building and the position of the surface where the data is
measured, are factors that affect the Cp values.
In all the four cases, there is a difference between the Cp values measured in the inlet tower and the
exhaust shaft. This difference suggests that there might be airflow in the ventilation system. The
highest difference is seen in the case when wind comes from the north-west and the lowest difference
is seen in the case when the wind comes from north-east.
Case Position Cp 1 Cp2 Cp3 Cp4 Cp5 Average Cp
1 Inlet Tower 0.142 0.112 0.206 0.164 0.206 0.166
2 Inlet Tower 0.073 0.114 0.046 0.115 0.161 0.102
Case Position Cp 1 Cp2 Cp3 Cp4 Cp5 Cp6 Cp7 Cp8 Cp9 Average Cp
Inlet Tower 0.142 0.112 0.206 0.164 0.206 0.166
Exhaust shaft -0.099 -0.086 -0.064 -0.124 -0.095 -0.093
Window -0.154 -0.117 -0.094 -0.085 -0.116 -0.151 -0.151 -0.108 -0.082 -0.117
Inlet Tower -0.159 -0.325 -0.153 -0.154 -0.187 -0.196
Exhaust shaft -0.057 -0.042 0.039 -0.124 -0.127 -0.062
Window 0.319 0.316 0.316 0.323 0.324 0.335 0.363 0.347 0.349 0.332
Inlet Tower -0.111 -0.111 -0.112 -0.111 -0.111 -0.111
Exhaust shaft -0.214 -0.212 -0.213 -0.222 -0.210 -0.214
Window -0.216 -0.217 -0.218 -0.218 -0.217 -0.215 -0.216 -0.218 -0.219 -0.217
Inlet Tower -0.320 -0.385 -0.241 -0.215 -0.162 -0.265
Exhaust shaft 0.079 0.092 0.115 0.085 0.073 0.089
Window -0.119 -0.120 -0.121 -0.119 -0.118 -0.118 -0.119 -0.119 -0.119 -0.119
1. Wind direction SW
2. Wind direction SE
3. Wind direction NE
4. Wind direction NW
The inlet tower has positive Cp values when is facing the wind direction in the south-west. This is
because the wind creates a swirl effect from the vegetation in front of the tower. This effect pushes
the wind in the tower, creating positive Cp values (Figure. 9). The lowest Cp values for this point are
collected when the wind comes on the opposite direction.
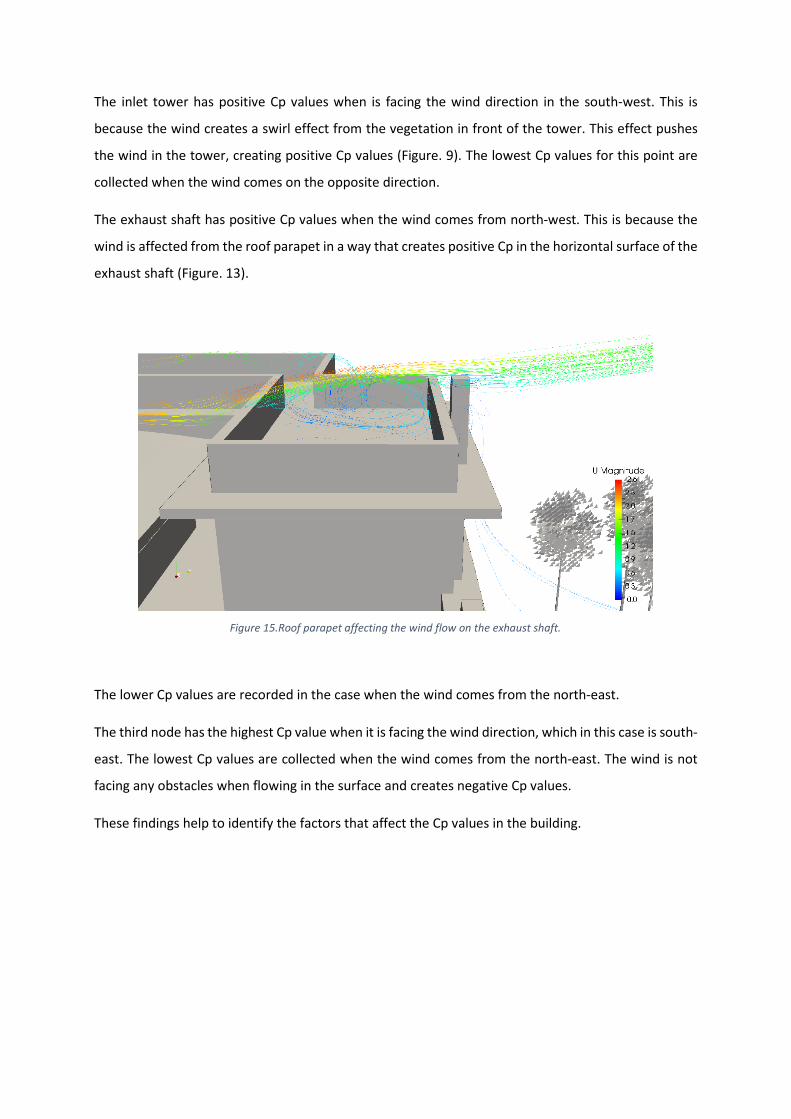
The exhaust shaft has positive Cp values when the wind comes from north-west. This is because the
wind is affected from the roof parapet in a way that creates positive Cp in the horizontal surface of the
exhaust shaft (Figure. 13).
Figure 15.Roof parapet affecting the wind flow on the exhaust shaft.
The lower Cp values are recorded in the case when the wind comes from the north-east.
The third node has the highest Cp value when it is facing the wind direction, which in this case is south-
east. The lowest Cp values are collected when the wind comes from the north-east. The wind is not
facing any obstacles when flowing in the surface and creates negative Cp values.
These findings help to identify the factors that affect the Cp values in the building.

Bibliography Transsolar Energietechnik GmbH. (2009). TRNFLOW Manual. Manual, Stuttgart.
Transsolar Energietechnik GmbH. (April 2017). OpenFOAM Documentation. Stuttgart, Germany.