Embed Size (px)
DESCRIPTION
MIF Appraisal Worksheet
Citation preview
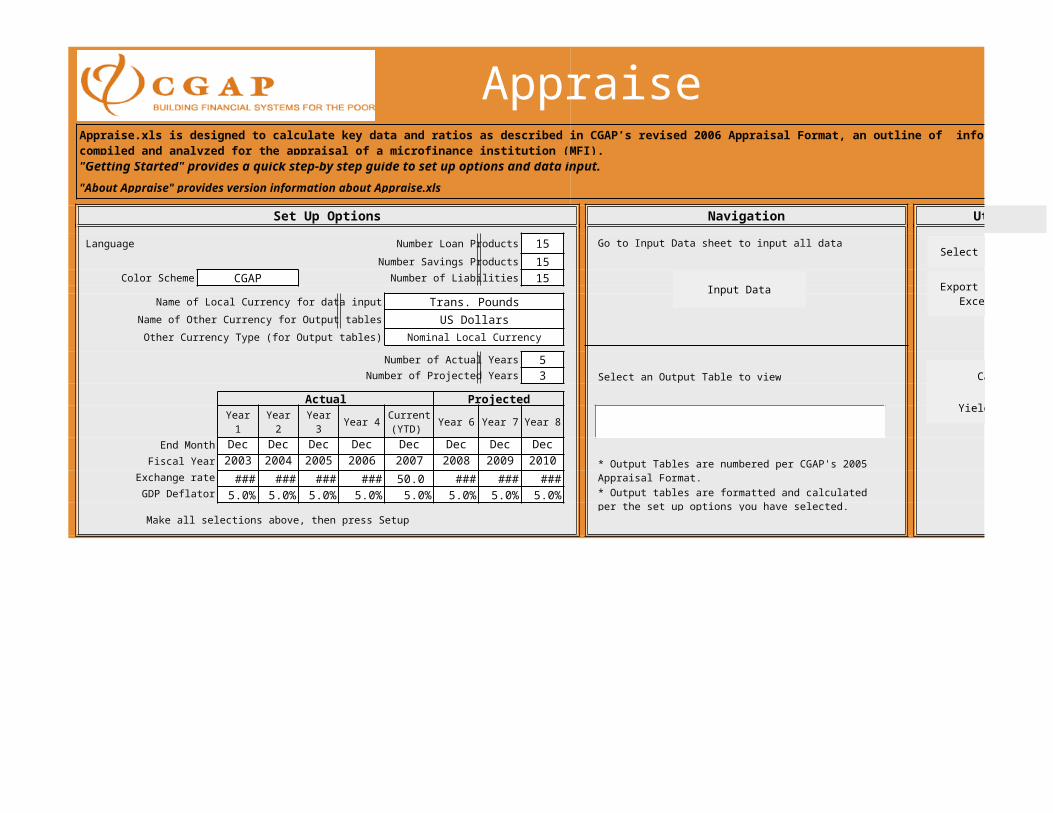
AppraiseVersion 1
"Getting Started" provides a quick step-by step guide to set up options and data input.
"About Appraise" provides version information about Appraise.xls
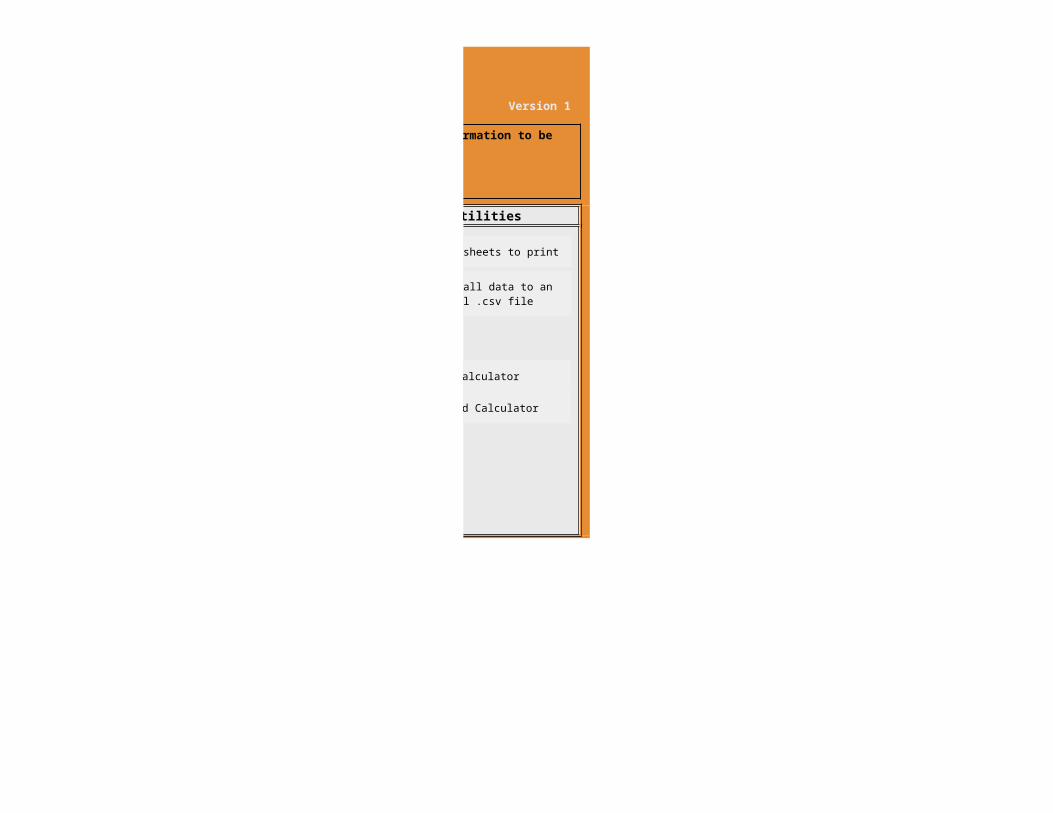
Set Up Options Navigation Utilities
Language Number Loan Products 15 Go to Input Data sheet to input all data
Number Savings Products 15Color Scheme CGAP Number of Liabilities 15
Name of Local Currency for data input Trans. Pounds
Name of Other Currency for Output tables US Dollars
Other Currency Type (for Output tables) Nominal Local Currency
Number of Actual Years 5Number of Projected Years 3 Select an Output Table to view
Actual Projected
Year 1 Year 2 Year 3 Year 4 Year 6 Year 7 Year 8
End Month Dec Dec Dec Dec Dec Dec Dec Dec
Fiscal Year 2003 2004 2005 2006 2007 2008 2009 2010
Exchange rate 50.0 50.0 50.0 50.0 50.0 48.0 48.0 48.0 GDP Deflator 5.0% 5.0% 5.0% 5.0% 5.0% 5.0% 5.0% 5.0%
Make all selections above, then press Setup
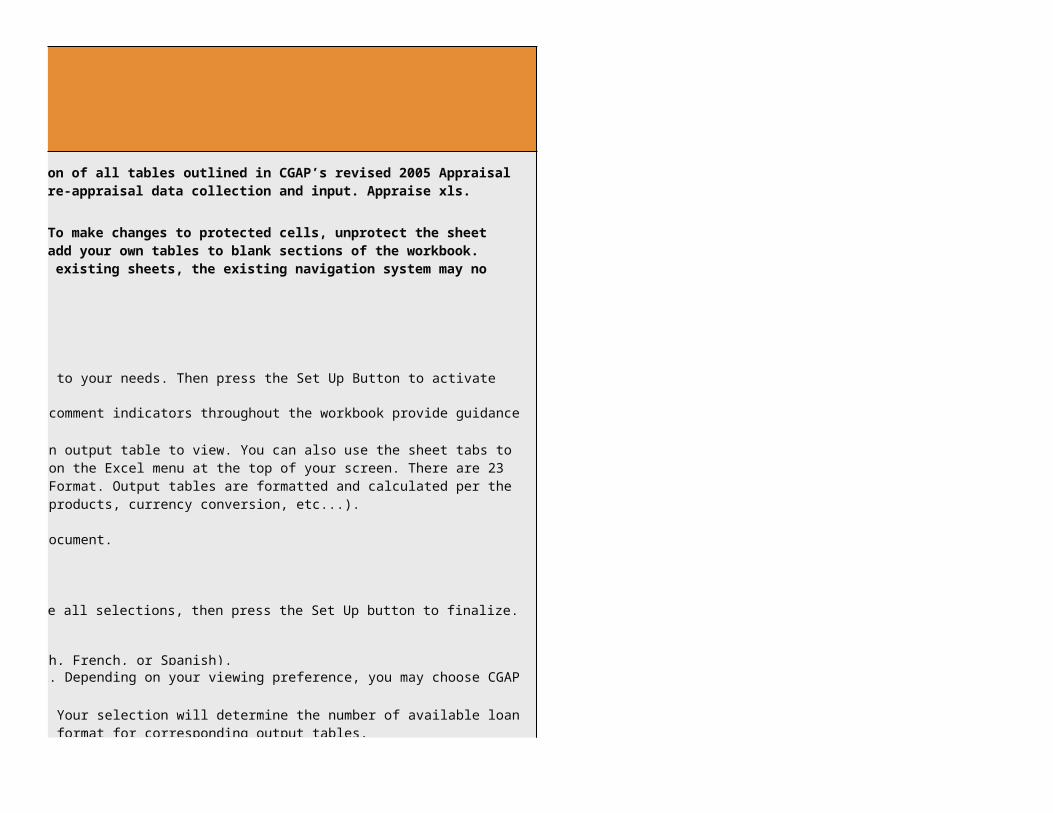
Appraise.xls is designed to calculate key data and ratios as described in CGAP’s revised 2006 Appraisal Format, an outline of information to be compiled and analyzed for the appraisal of a microfinance institution (MFI).
Current (YTD)
* Output Tables are numbered per CGAP's 2005 Appraisal Format.
* Output tables are formatted and calculated per the set up options you have selected.
Input Data
Select sheets to print
Export all data to an Excel .csv file
Calculator
Yield Calculator
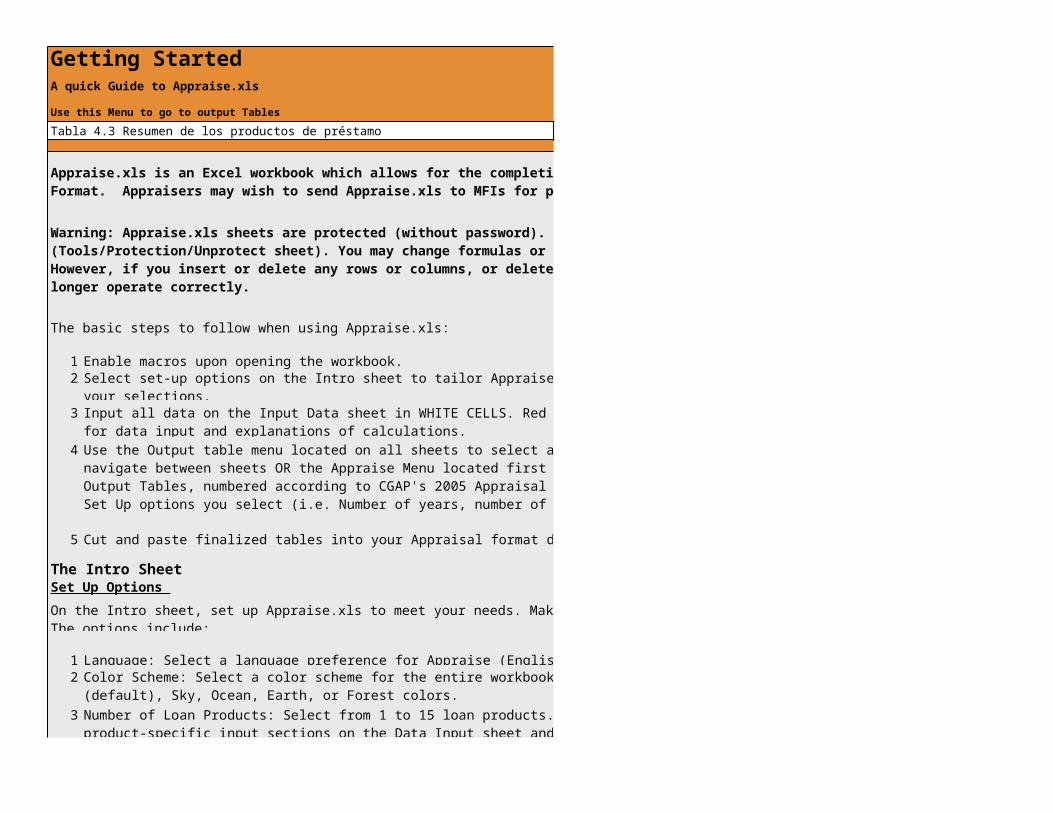
Getting StartedA quick Guide to Appraise.xls
Use this Menu to go to output Tables
Tabla 4.3 Resumen de los productos de préstamo
The basic steps to follow when using Appraise.xls:
1 Enable macros upon opening the workbook.2 Select set-up options on the Intro sheet to tailor Appraise to your needs. Then press the Set Up Button to activate your selections.
3
4
5 Cut and paste finalized tables into your Appraisal format document.
The Intro Sheet Set Up Options
On the Intro sheet, set up Appraise.xls to meet your needs. Make all selections, then press the Set Up button to finalize. The options include:
1 Language: Select a language preference for Appraise (English, French, or Spanish).2
3
Appraise.xls is an Excel workbook which allows for the completion of all tables outlined in CGAP’s revised 2005 Appraisal Format. Appraisers may wish to send Appraise.xls to MFIs for pre-appraisal data collection and input. Appraise xls.
Warning: Appraise.xls sheets are protected (without password). To make changes to protected cells, unprotect the sheet (Tools/Protection/Unprotect sheet). You may change formulas or add your own tables to blank sections of the workbook. However, if you insert or delete any rows or columns, or delete existing sheets, the existing navigation system may no longer operate correctly.
Input all data on the Input Data sheet in WHITE CELLS. Red comment indicators throughout the workbook provide guidance for data input and explanations of calculations.
Use the Output table menu located on all sheets to select an output table to view. You can also use the sheet tabs to navigate between sheets OR the Appraise Menu located first on the Excel menu at the top of your screen. There are 23 Output Tables, numbered according to CGAP's 2005 Appraisal Format. Output tables are formatted and calculated per the Set Up options you select (i.e. Number of years, number of products, currency conversion, etc...).
Color Scheme: Select a color scheme for the entire workbook. Depending on your viewing preference, you may choose CGAP (default), Sky, Ocean, Earth, or Forest colors.
Number of Loan Products: Select from 1 to 15 loan products. Your selection will determine the number of available loan product-specific input sections on the Data Input sheet and format for corresponding output tables.
4
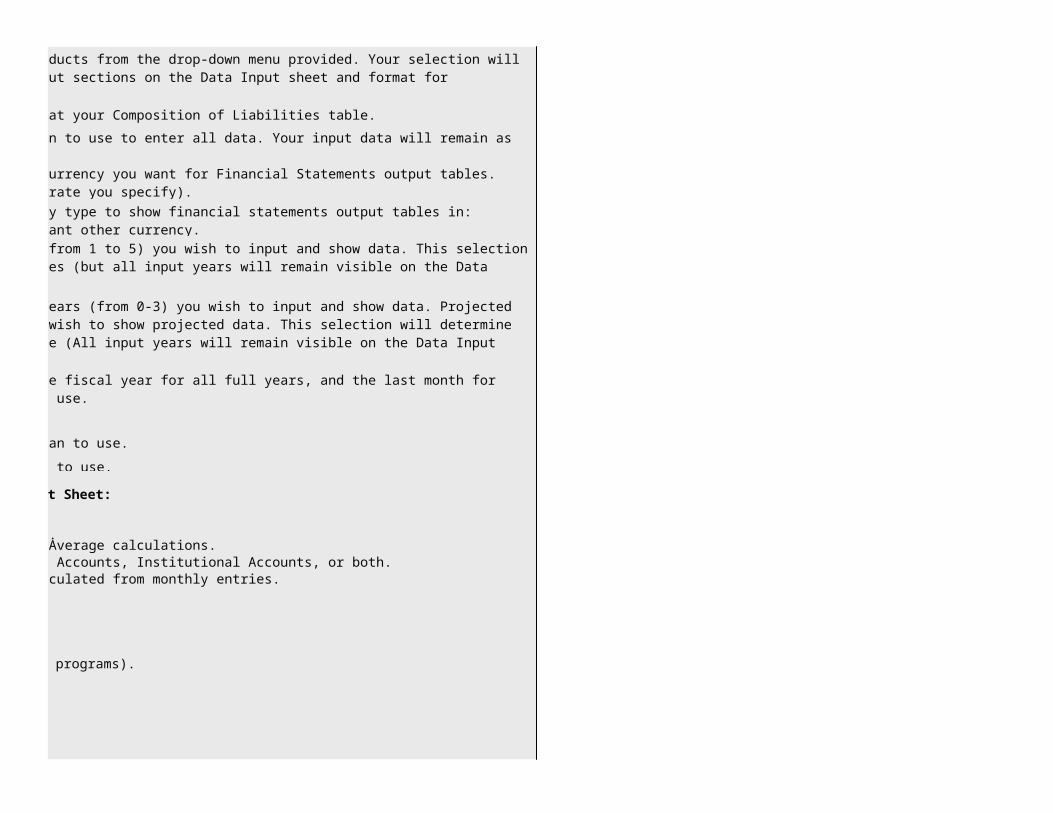
5 Number of Liabilities: Select from 1-15 Liabilities to format your Composition of Liabilities table.
6
7
8
9
10
11
12 Year: Enter the fiscal years you plan to use.
13 Exchange Rate: enter the Exchange rate for each year you plan to use.
14 GDP Deflator: enter the GDB deflator for each year you plan to use.
The following additional options are available on the Data Input Sheet:
1 Loan Classification: Over-write default to suit your needs.2 Loan Aging Categories: Overwrite default to suit your needs.3 Average (Mean or Median): Select to use Mean or Median for Average calculations.4 Institutional/Individual Accounts: Select to use Individual Accounts, Institutional Accounts, or both.5 Calculation of average annual data: Overwrite with data calculated from monthly entries.
UtilitiesThe following additional utilities are available:1. Select sheets to print.2. Export all data to an Excel .csv file (for import into other programs).3. Clear all data.4. Calculator.5. Yield calculator.6. Graph calculator.
Number of Savings Products: Select from 1 to 15 savings products from the drop-down menu provided. Your selection will determine the number of available loan product-specific input sections on the Data Input sheet and format for corresponding output tables.
Local Currency Name: Enter the name of the currency you plan to use to enter all data. Your input data will remain as entered on the Input Data sheet.
Name of Currency for output Tables: Enter the name of the currency you want for Financial Statements output tables. (Excel will calculate all output tables using the exchange rate you specify).
Other Currency Type (for Output tables): Select the currency type to show financial statements output tables in: Nominal local currency , Constant local currency , or Constant other currency.
Number of Actual years: Select the number of Actual Years (from 1 to 5) you wish to input and show data. This selection will determine the number of years shown in all output tables (but all input years will remain visible on the Data Input sheet).
Number of Projected Years: Select the number of Projected Years (from 0-3) you wish to input and show data. Projected years are those years following actual years for which you wish to show projected data. This selection will determine the number of years shown in Table 8.1 Projected Performance (All input years will remain visible on the Data Input sheet).
Month: From the drop-down menu, select the last month of the fiscal year for all full years, and the last month for which there is available data for the last year you plan to use.
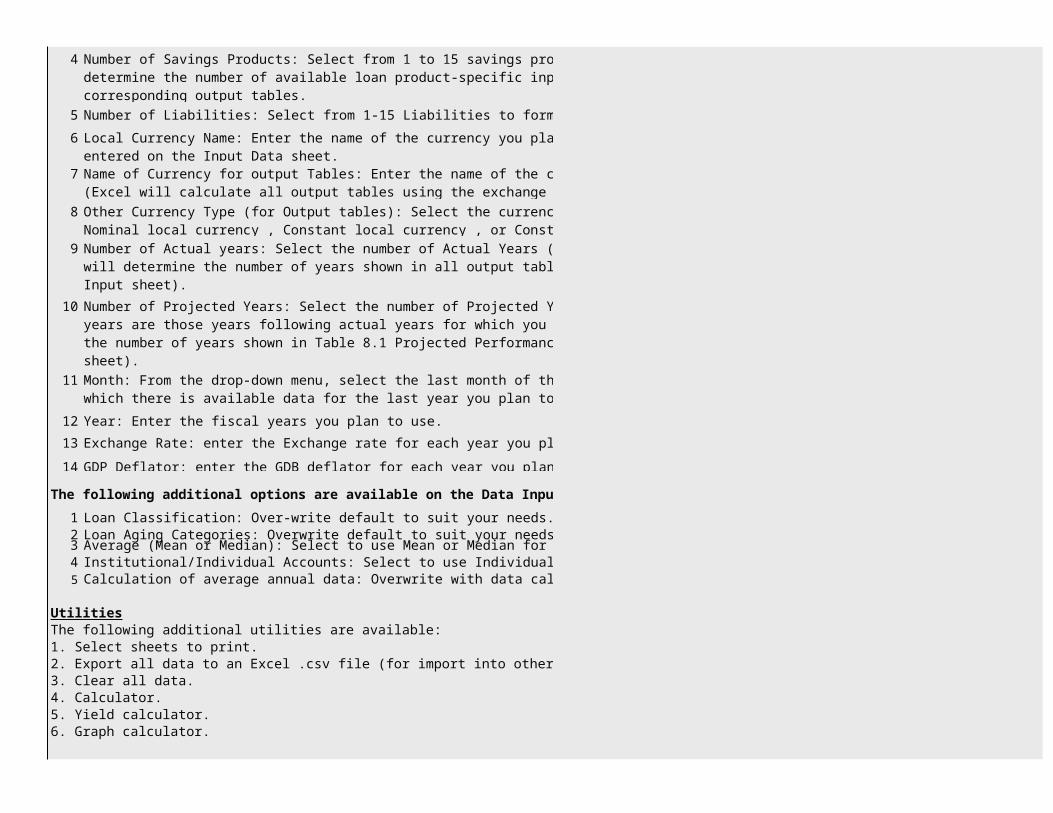
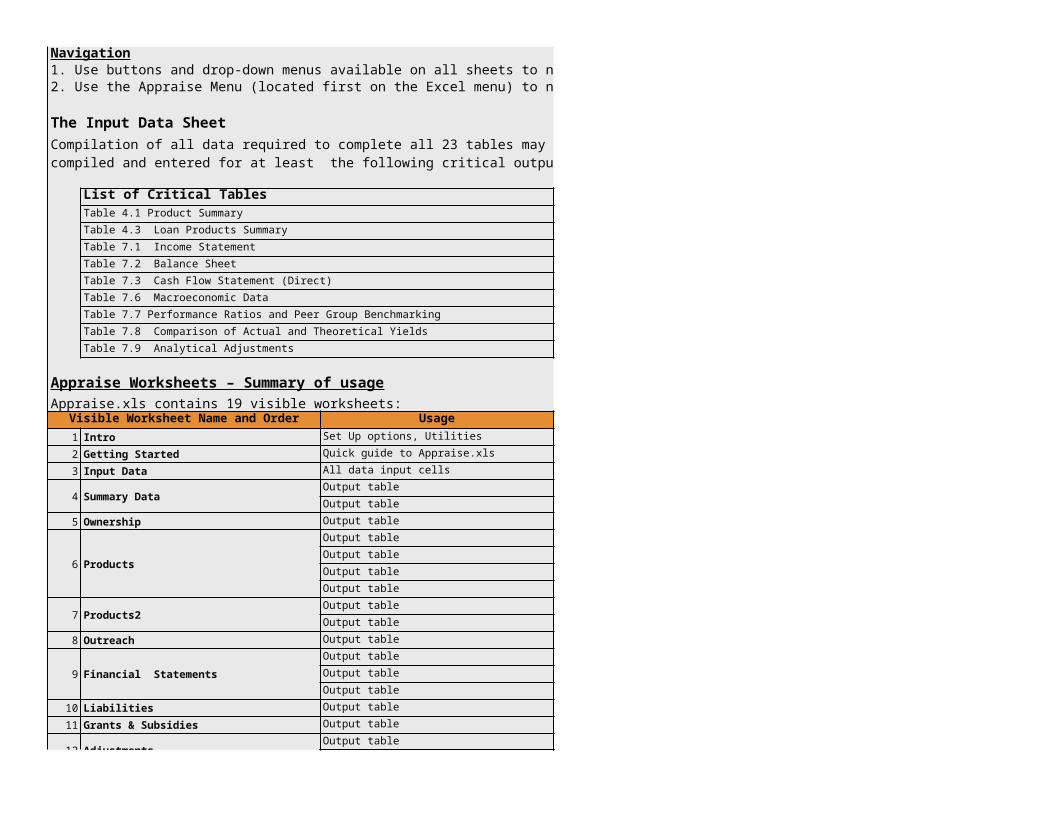
Navigation1. Use buttons and drop-down menus available on all sheets to navigate.2. Use the Appraise Menu (located first on the Excel menu) to navigate.
The Input Data Sheet
List of Critical Tables
Table 7.1 Income Statement
Table 7.2 Balance Sheet
Table 7.3 Cash Flow Statement (Direct)
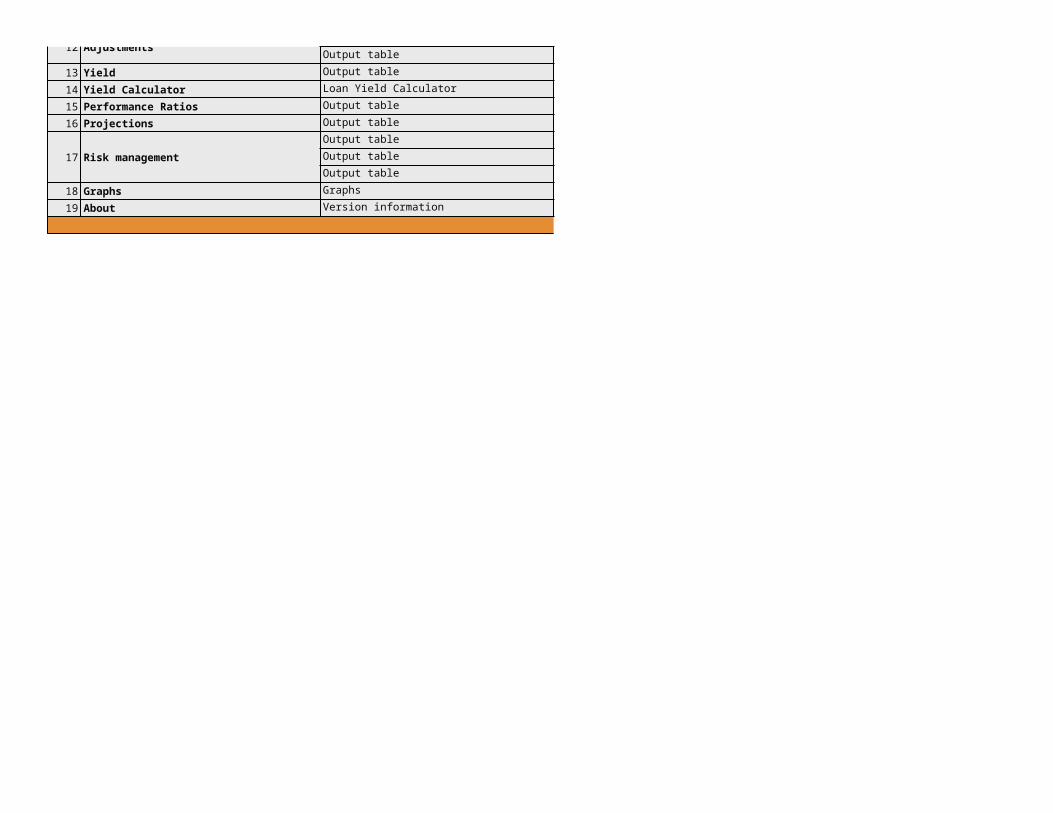
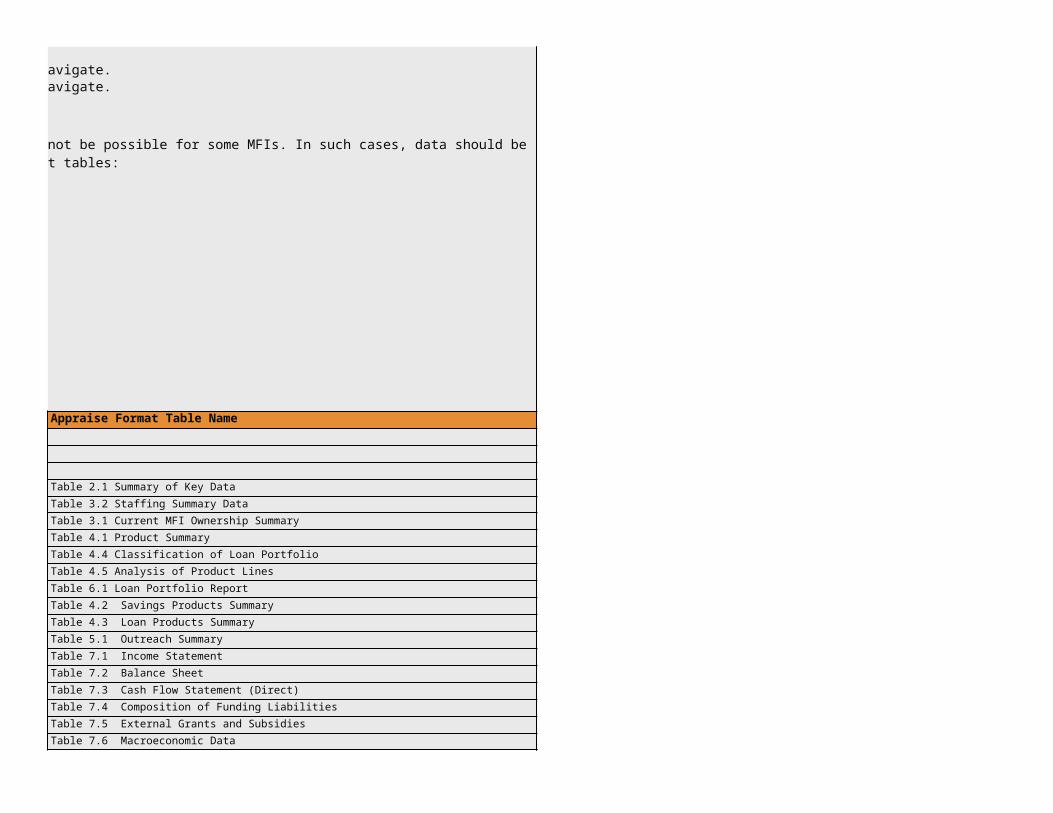
Appraise Worksheets – Summary of usageAppraise.xls contains 19 visible worksheets:
Visible Worksheet Name and Order Usage Appraise Format Table Name
1 Intro Set Up options, Utilities
2 Getting Started Quick guide to Appraise.xls
3 Input Data All data input cells
4 Summary DataOutput table Table 2.1 Summary of Key Data
Output table Table 3.2 Staffing Summary Data
5 Ownership Output table Table 3.1 Current MFI Ownership Summary
6 Products
Output table
Output table
Output table
Output table Table 6.1 Loan Portfolio Report
7 Products2Output table
Output table
8 Outreach Output table
9 Financial Statements
Output table Table 7.1 Income Statement
Output table Table 7.2 Balance Sheet
Output table Table 7.3 Cash Flow Statement (Direct)
10 Liabilities Output table
11 Grants & Subsidies Output table
12 AdjustmentsOutput table
Compilation of all data required to complete all 23 tables may not be possible for some MFIs. In such cases, data should be compiled and entered for at least the following critical output tables:
Table 4.1 Product Summary
Table 4.3 Loan Products Summary
Table 7.6 Macroeconomic Data
Table 7.7 Performance Ratios and Peer Group Benchmarking
Table 7.8 Comparison of Actual and Theoretical Yields
Table 7.9 Analytical Adjustments
Table 4.1 Product Summary
Table 4.4 Classification of Loan Portfolio
Table 4.5 Analysis of Product Lines
Table 4.2 Savings Products Summary
Table 4.3 Loan Products Summary
Table 5.1 Outreach Summary
Table 7.4 Composition of Funding Liabilities
Table 7.5 External Grants and Subsidies
Table 7.6 Macroeconomic Data
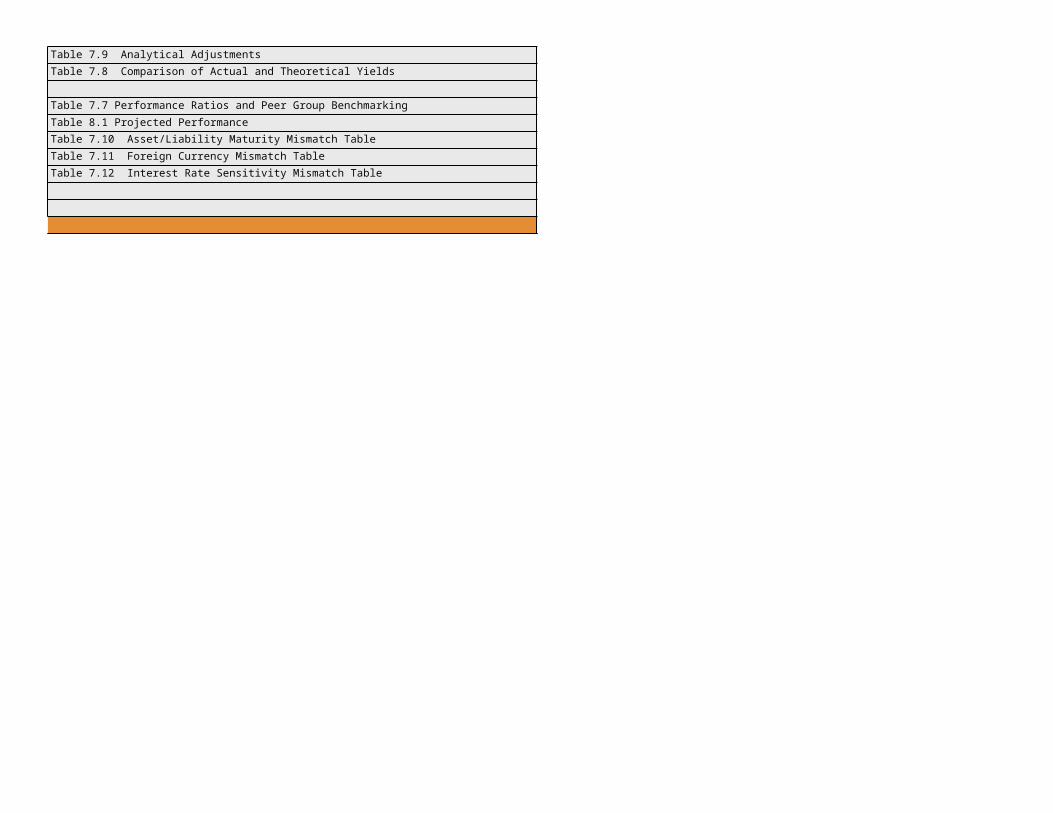
12 AdjustmentsOutput table
13 Yield Output table
14 Yield Calculator Loan Yield Calculator
15 Performance Ratios Output table
16 Projections Output table Table 8.1 Projected Performance
17 Risk management
Output table
Output table
Output table
18 Graphs Graphs
19 About Version information
Table 7.9 Analytical Adjustments
Table 7.8 Comparison of Actual and Theoretical Yields
Table 7.7 Performance Ratios and Peer Group Benchmarking
Table 7.10 Asset/Liability Maturity Mismatch Table
Table 7.11 Foreign Currency Mismatch Table
Table 7.12 Interest Rate Sensitivity Mismatch Table
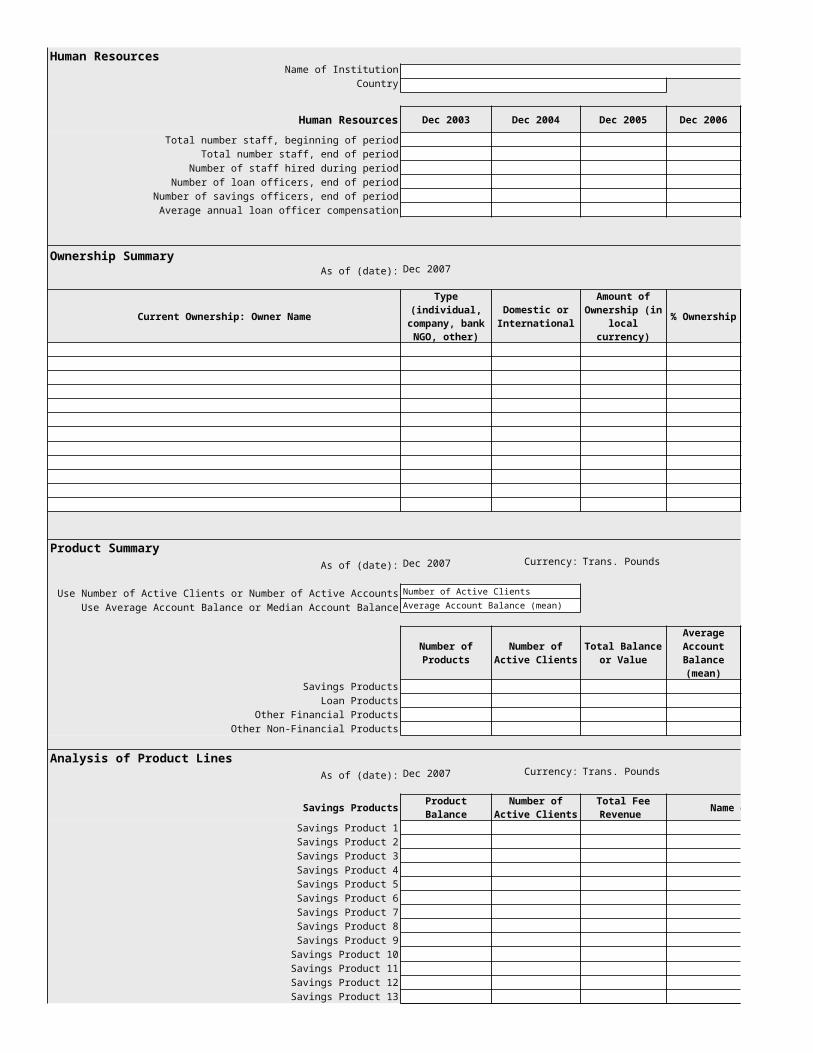
Human ResourcesName of Institution
Country
Human Resources Dec 2003 Dec 2004 Dec 2005 Dec 2006 Dec 2007
Total number staff, beginning of period
Total number staff, end of period
Number of staff hired during period
Number of loan officers, end of period
Number of savings officers, end of period
Average annual loan officer compensation
Ownership SummaryAs of (date): Dec 2007
Current Ownership: Owner Name % Ownership
Product SummaryAs of (date): Dec 2007 Currency: Trans. Pounds
Use Number of Active Clients or Number of Active Accounts Number of Active Clients
Use Average Account Balance or Median Account Balance Average Account Balance (mean)
Savings Products
Loan Products
Other Financial Products
Other Non-Financial Products
Analysis of Product LinesAs of (date): Dec 2007 Currency: Trans. Pounds
Savings Products Product Balance Name of Savings Product
Savings Product 1
Savings Product 2
Savings Product 3
Savings Product 4
Savings Product 5
Savings Product 6
Savings Product 7
Savings Product 8
Savings Product 9
Savings Product 10
Savings Product 11
Savings Product 12
Savings Product 13
Type (individual, company, bank
NGO, other)
Domestic or International
Amount of Ownership (in local currency)
Number of Products
Number of Active Clients
Total Balance or Value
Average Account Balance (mean)
Number of Active Clients
Total Fee Revenue
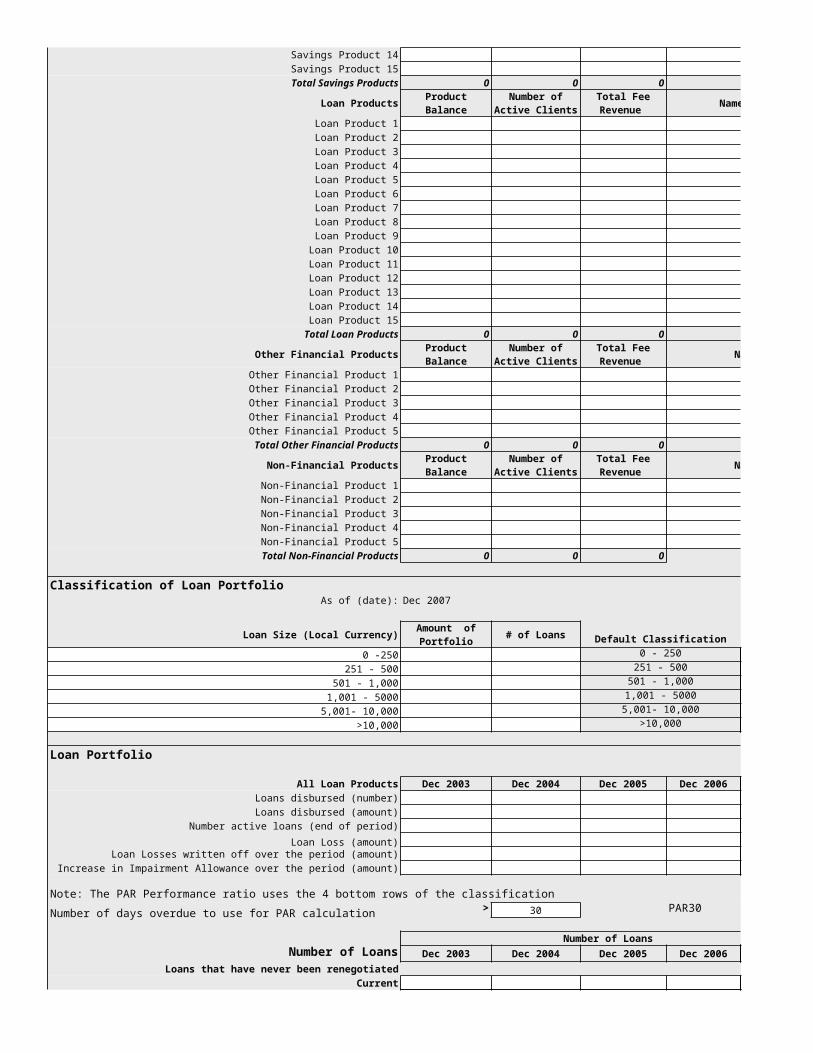
Savings Product 14
Savings Product 15
Total Savings Products 0 0 0
Loan Products Product Balance Name of Loan Product
Loan Product 1
Loan Product 2
Loan Product 3
Loan Product 4
Loan Product 5
Loan Product 6
Loan Product 7
Loan Product 8
Loan Product 9
Loan Product 10
Loan Product 11
Loan Product 12
Loan Product 13
Loan Product 14
Loan Product 15
Total Loan Products 0 0 0
Other Financial Products Product Balance Name of Product
Other Financial Product 1
Other Financial Product 2
Other Financial Product 3
Other Financial Product 4
Other Financial Product 5
Total Other Financial Products 0 0 0
Non-Financial Products Product Balance Name of Product
Non-Financial Product 1
Non-Financial Product 2
Non-Financial Product 3
Non-Financial Product 4
Non-Financial Product 5
Total Non-Financial Products 0 0 0
Classification of Loan PortfolioAs of (date): Dec 2007
Loan Size (Local Currency) # of Loans Default Classification
0 -250 0 - 250
251 - 500 251 - 500
501 - 1,000 501 - 1,000
1,001 - 5000 1,001 - 5000
5,001- 10,000 5,001- 10,000
>10,000 >10,000
Loan Portfolio
All Loan Products Dec 2003 Dec 2004 Dec 2005 Dec 2006 Dec 2007
Loans disbursed (number)
Loans disbursed (amount)
Number active loans (end of period)
Loan Loss (amount)Loan Losses written off over the period (amount)
Increase in Impairment Allowance over the period (amount)
Note: The PAR Performance ratio uses the 4 bottom rows of the classification
Number of days overdue to use for PAR calculation > 30 PAR30
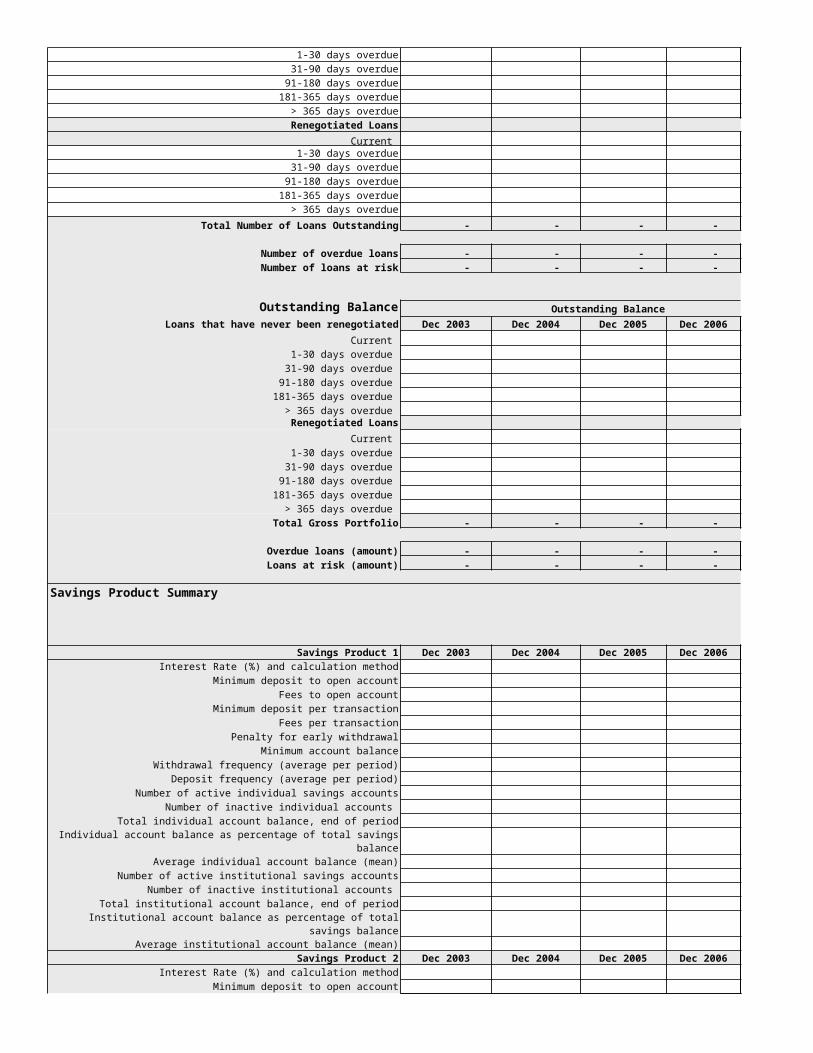
Number of Loans
Number of Loans Dec 2003 Dec 2004 Dec 2005 Dec 2006 Dec 2007
Loans that have never been renegotiated
Current
Number of Active Clients
Total Fee Revenue
Number of Active Clients
Total Fee Revenue
Number of Active Clients
Total Fee Revenue
Amount of Portfolio
1-30 days overdue
31-90 days overdue
91-180 days overdue
181-365 days overdue
> 365 days overdue
Renegotiated Loans
Current 1-30 days overdue
31-90 days overdue
91-180 days overdue
181-365 days overdue
> 365 days overdue
Total Number of Loans Outstanding - - - - -
Number of overdue loans - - - - -
Number of loans at risk - - - - -
Outstanding Balance Outstanding Balance
Loans that have never been renegotiated Dec 2003 Dec 2004 Dec 2005 Dec 2006 Dec 2007
Current
1-30 days overdue
31-90 days overdue
91-180 days overdue
181-365 days overdue
> 365 days overdue Renegotiated Loans
Current
1-30 days overdue
31-90 days overdue
91-180 days overdue
181-365 days overdue
> 365 days overdue
Total Gross Portfolio - - - - -
Overdue loans (amount) - - - - -
Loans at risk (amount) - - - - -
Savings Product Summary
Savings Product 1 Dec 2003 Dec 2004 Dec 2005 Dec 2006 Dec 2007
Interest Rate (%) and calculation method
Minimum deposit to open account
Fees to open account
Minimum deposit per transaction
Fees per transaction
Penalty for early withdrawal
Minimum account balance
Withdrawal frequency (average per period)
Deposit frequency (average per period)
Number of active individual savings accounts
Number of inactive individual accounts
Total individual account balance, end of period
Individual account balance as percentage of total savings balance
Average individual account balance (mean)
Number of active institutional savings accounts
Number of inactive institutional accounts
Total institutional account balance, end of period
Institutional account balance as percentage of total savings balance
Average institutional account balance (mean)
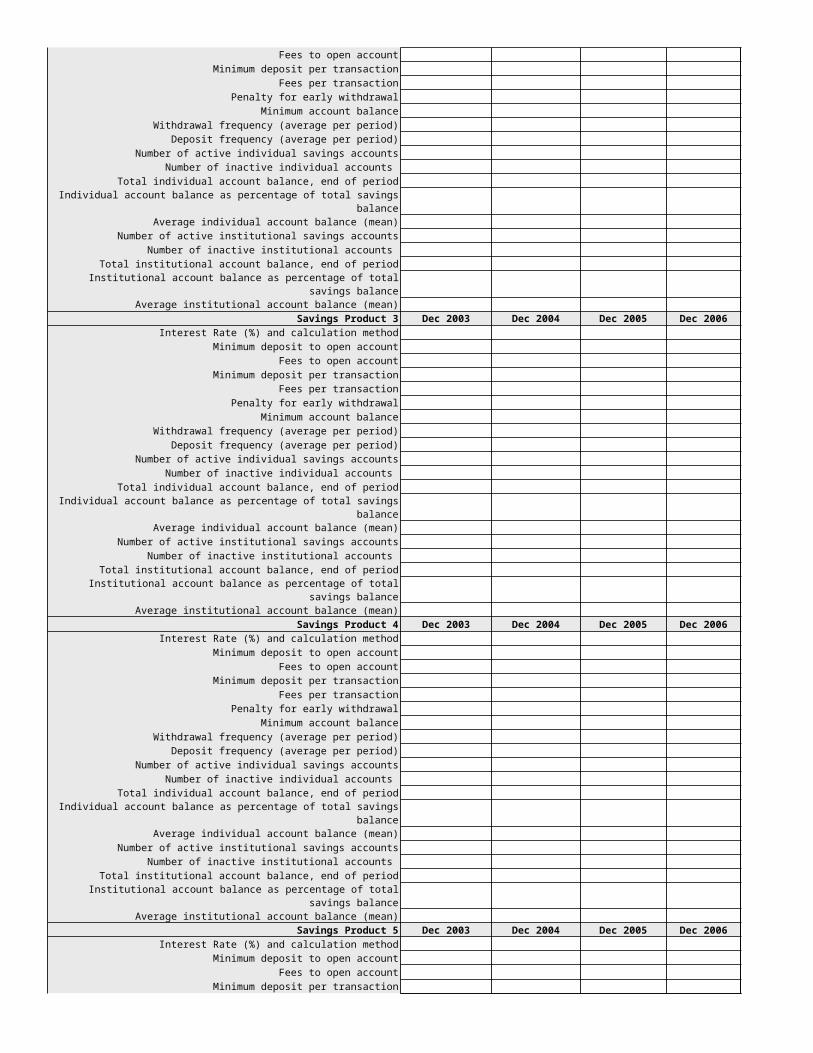
Savings Product 2 Dec 2003 Dec 2004 Dec 2005 Dec 2006 Dec 2007
Interest Rate (%) and calculation method
Minimum deposit to open account
Fees to open account
Minimum deposit per transaction
Fees per transaction
Penalty for early withdrawal
Minimum account balance
Withdrawal frequency (average per period)
Deposit frequency (average per period)
Number of active individual savings accounts
Number of inactive individual accounts
Total individual account balance, end of period
Individual account balance as percentage of total savings balance
Average individual account balance (mean)
Number of active institutional savings accounts
Number of inactive institutional accounts
Total institutional account balance, end of period
Institutional account balance as percentage of total savings balance
Average institutional account balance (mean)
Savings Product 3 Dec 2003 Dec 2004 Dec 2005 Dec 2006 Dec 2007
Interest Rate (%) and calculation method
Minimum deposit to open account
Fees to open account
Minimum deposit per transaction
Fees per transaction
Penalty for early withdrawal
Minimum account balance
Withdrawal frequency (average per period)
Deposit frequency (average per period)
Number of active individual savings accounts
Number of inactive individual accounts
Total individual account balance, end of period
Individual account balance as percentage of total savings balance
Average individual account balance (mean)
Number of active institutional savings accounts
Number of inactive institutional accounts
Total institutional account balance, end of period
Institutional account balance as percentage of total savings balance
Average institutional account balance (mean)
Savings Product 4 Dec 2003 Dec 2004 Dec 2005 Dec 2006 Dec 2007
Interest Rate (%) and calculation method
Minimum deposit to open account
Fees to open account
Minimum deposit per transaction
Fees per transaction
Penalty for early withdrawal
Minimum account balance
Withdrawal frequency (average per period)
Deposit frequency (average per period)
Number of active individual savings accounts
Number of inactive individual accounts
Total individual account balance, end of period
Individual account balance as percentage of total savings balance
Average individual account balance (mean)
Number of active institutional savings accounts
Number of inactive institutional accounts
Total institutional account balance, end of period
Institutional account balance as percentage of total savings balance
Average institutional account balance (mean)
Savings Product 5 Dec 2003 Dec 2004 Dec 2005 Dec 2006 Dec 2007
Interest Rate (%) and calculation method
Minimum deposit to open account
Fees to open account
Minimum deposit per transaction
Fees per transaction
Penalty for early withdrawal
Minimum account balance
Withdrawal frequency (average per period)
Deposit frequency (average per period)
Number of active individual savings accounts
Number of inactive individual accounts
Total individual account balance, end of period
Individual account balance as percentage of total savings balance
Average individual account balance (mean)
Number of active institutional savings accounts
Number of inactive institutional accounts
Total institutional account balance, end of period
Institutional account balance as percentage of total savings balance
Average institutional account balance (mean)
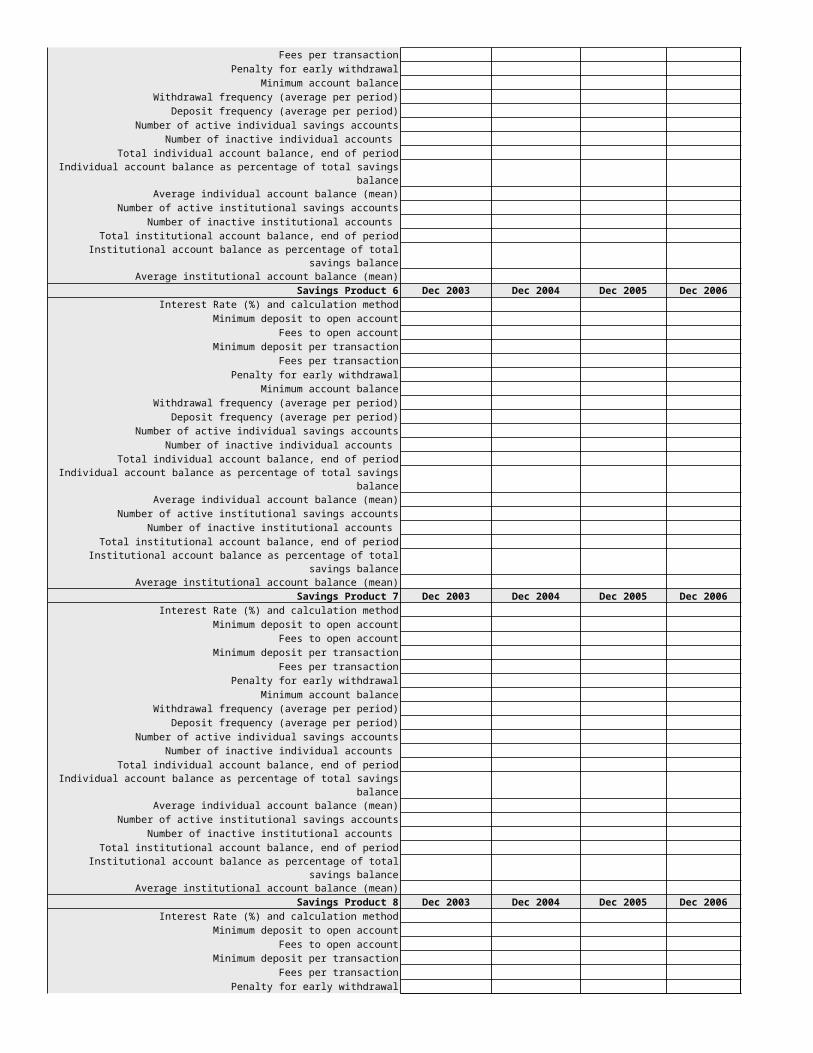
Savings Product 6 Dec 2003 Dec 2004 Dec 2005 Dec 2006 Dec 2007
Interest Rate (%) and calculation method
Minimum deposit to open account
Fees to open account
Minimum deposit per transaction
Fees per transaction
Penalty for early withdrawal
Minimum account balance
Withdrawal frequency (average per period)
Deposit frequency (average per period)
Number of active individual savings accounts
Number of inactive individual accounts
Total individual account balance, end of period
Individual account balance as percentage of total savings balance
Average individual account balance (mean)
Number of active institutional savings accounts
Number of inactive institutional accounts
Total institutional account balance, end of period
Institutional account balance as percentage of total savings balance
Average institutional account balance (mean)
Savings Product 7 Dec 2003 Dec 2004 Dec 2005 Dec 2006 Dec 2007
Interest Rate (%) and calculation method
Minimum deposit to open account
Fees to open account
Minimum deposit per transaction
Fees per transaction
Penalty for early withdrawal
Minimum account balance
Withdrawal frequency (average per period)
Deposit frequency (average per period)
Number of active individual savings accounts
Number of inactive individual accounts
Total individual account balance, end of period
Individual account balance as percentage of total savings balance
Average individual account balance (mean)
Number of active institutional savings accounts
Number of inactive institutional accounts
Total institutional account balance, end of period
Institutional account balance as percentage of total savings balance
Average institutional account balance (mean)
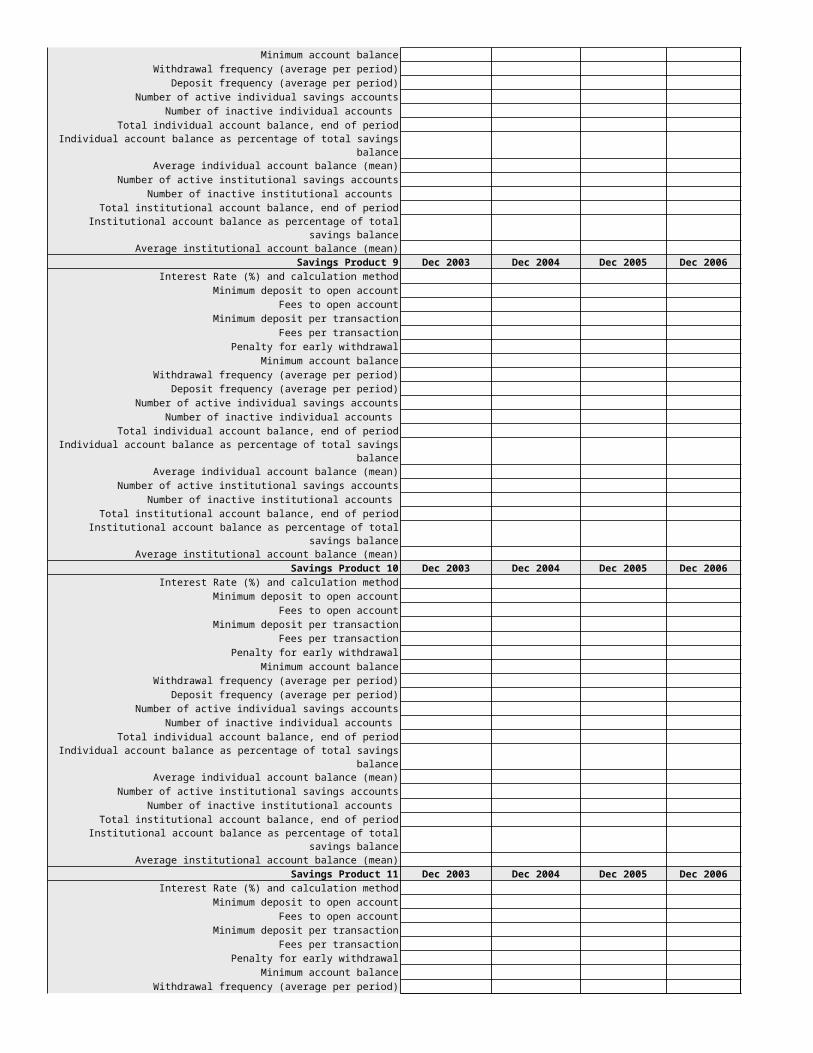
Savings Product 8 Dec 2003 Dec 2004 Dec 2005 Dec 2006 Dec 2007
Interest Rate (%) and calculation method
Minimum deposit to open account
Fees to open account
Minimum deposit per transaction
Fees per transaction
Penalty for early withdrawal
Minimum account balance
Withdrawal frequency (average per period)
Deposit frequency (average per period)
Number of active individual savings accounts
Number of inactive individual accounts
Total individual account balance, end of period
Individual account balance as percentage of total savings balance
Average individual account balance (mean)
Number of active institutional savings accounts
Number of inactive institutional accounts
Total institutional account balance, end of period
Institutional account balance as percentage of total savings balance
Average institutional account balance (mean)
Savings Product 9 Dec 2003 Dec 2004 Dec 2005 Dec 2006 Dec 2007
Interest Rate (%) and calculation method
Minimum deposit to open account
Fees to open account
Minimum deposit per transaction
Fees per transaction
Penalty for early withdrawal
Minimum account balance
Withdrawal frequency (average per period)
Deposit frequency (average per period)
Number of active individual savings accounts
Number of inactive individual accounts
Total individual account balance, end of period
Individual account balance as percentage of total savings balance
Average individual account balance (mean)
Number of active institutional savings accounts
Number of inactive institutional accounts
Total institutional account balance, end of period
Institutional account balance as percentage of total savings balance
Average institutional account balance (mean)
Savings Product 10 Dec 2003 Dec 2004 Dec 2005 Dec 2006 Dec 2007
Interest Rate (%) and calculation method
Minimum deposit to open account
Fees to open account
Minimum deposit per transaction
Fees per transaction
Penalty for early withdrawal
Minimum account balance
Withdrawal frequency (average per period)
Deposit frequency (average per period)
Number of active individual savings accounts
Number of inactive individual accounts
Total individual account balance, end of period
Individual account balance as percentage of total savings balance
Average individual account balance (mean)
Number of active institutional savings accounts
Number of inactive institutional accounts
Total institutional account balance, end of period
Institutional account balance as percentage of total savings balance
Average institutional account balance (mean)
Savings Product 11 Dec 2003 Dec 2004 Dec 2005 Dec 2006 Dec 2007
Interest Rate (%) and calculation method
Minimum deposit to open account
Fees to open account
Minimum deposit per transaction
Fees per transaction
Penalty for early withdrawal
Minimum account balance
Withdrawal frequency (average per period)
Deposit frequency (average per period)
Number of active individual savings accounts
Number of inactive individual accounts
Total individual account balance, end of period
Individual account balance as percentage of total savings balance
Average individual account balance (mean)
Number of active institutional savings accounts
Number of inactive institutional accounts
Total institutional account balance, end of period
Institutional account balance as percentage of total savings balance
Average institutional account balance (mean)
Savings Product 12 Dec 2003 Dec 2004 Dec 2005 Dec 2006 Dec 2007
Interest Rate (%) and calculation method
Minimum deposit to open account
Fees to open account
Minimum deposit per transaction
Fees per transaction
Penalty for early withdrawal
Minimum account balance
Withdrawal frequency (average per period)
Deposit frequency (average per period)
Number of active individual savings accounts
Number of inactive individual accounts
Total individual account balance, end of period
Individual account balance as percentage of total savings balance
Average individual account balance (mean)
Number of active institutional savings accounts
Number of inactive institutional accounts
Total institutional account balance, end of period
Institutional account balance as percentage of total savings balance
Average institutional account balance (mean)
Savings Product 13 Dec 2003 Dec 2004 Dec 2005 Dec 2006 Dec 2007
Interest Rate (%) and calculation method
Minimum deposit to open account
Fees to open account
Minimum deposit per transaction
Fees per transaction
Penalty for early withdrawal
Minimum account balance
Withdrawal frequency (average per period)
Deposit frequency (average per period)
Number of active individual savings accounts
Number of inactive individual accounts
Total individual account balance, end of period
Individual account balance as percentage of total savings balance
Average individual account balance (mean)
Number of active institutional savings accounts
Number of inactive institutional accounts
Total institutional account balance, end of period
Institutional account balance as percentage of total savings balance
Average institutional account balance (mean)
Savings Product 14 Dec 2003 Dec 2004 Dec 2005 Dec 2006 Dec 2007
Interest Rate (%) and calculation method
Minimum deposit to open account
Fees to open account
Minimum deposit per transaction
Fees per transaction
Penalty for early withdrawal
Minimum account balance
Withdrawal frequency (average per period)
Deposit frequency (average per period)
Number of active individual savings accounts
Number of inactive individual accounts
Total individual account balance, end of period
Individual account balance as percentage of total savings balance
Average individual account balance (mean)
Number of active institutional savings accounts
Number of inactive institutional accounts
Total institutional account balance, end of period
Institutional account balance as percentage of total savings balance
Average institutional account balance (mean)
Savings Product 15 Dec 2003 Dec 2004 Dec 2005 Dec 2006 Dec 2007
Interest Rate (%) and calculation method
Minimum deposit to open account
Fees to open account
Minimum deposit per transaction
Fees per transaction
Penalty for early withdrawal
Minimum account balance
Withdrawal frequency (average per period)
Deposit frequency (average per period)
Number of active individual savings accounts
Number of inactive individual accounts
Total individual account balance, end of period
Individual account balance as percentage of total savings balance
Average individual account balance (mean)
Number of active institutional savings accounts
Number of inactive institutional accounts
Total institutional account balance, end of period
Institutional account balance as percentage of total savings balance
Average institutional account balance (mean)
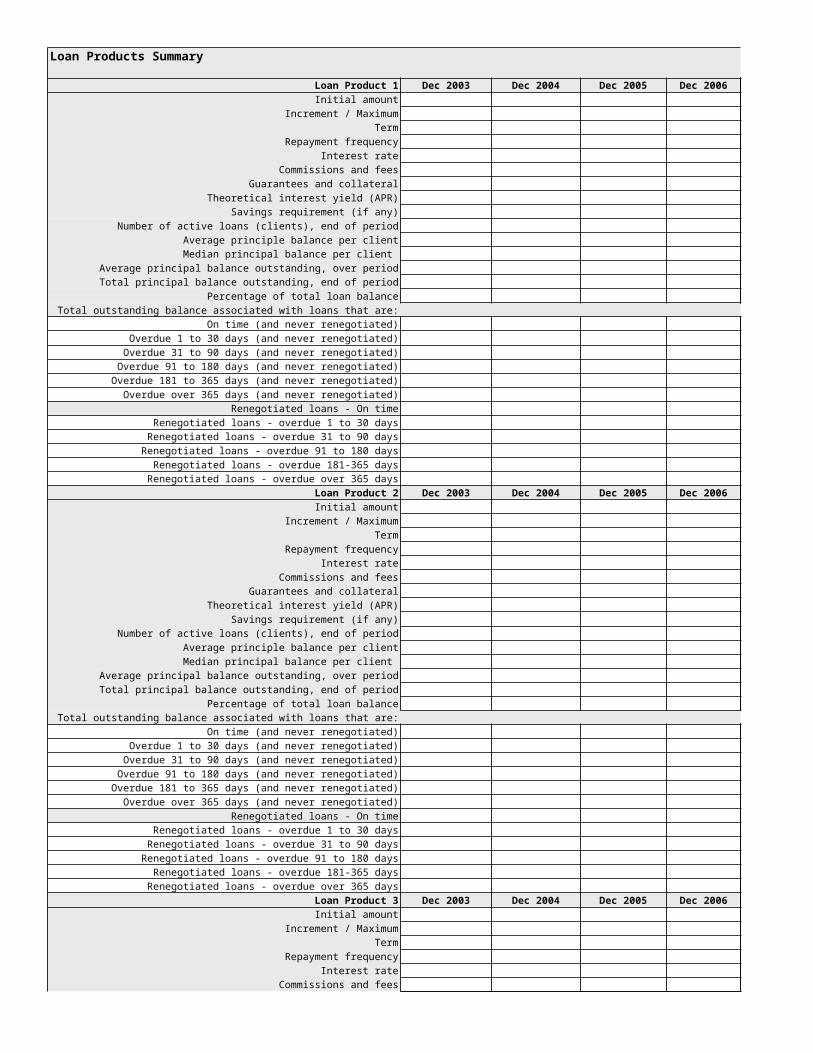
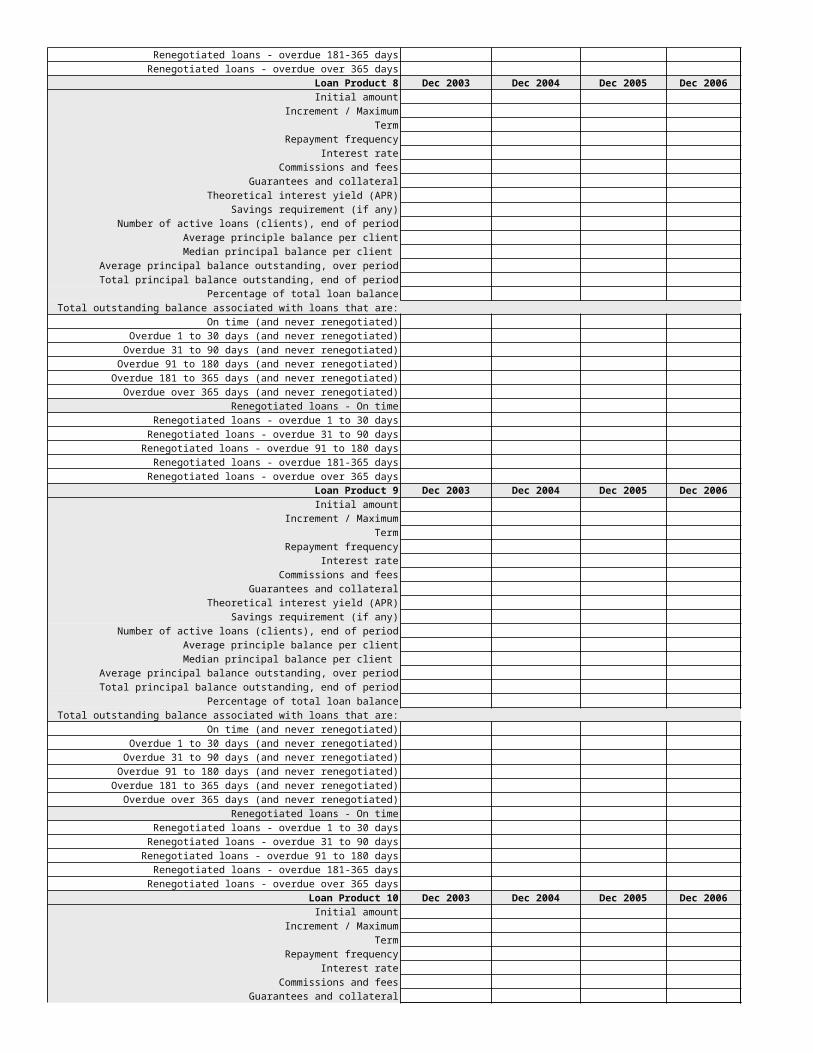
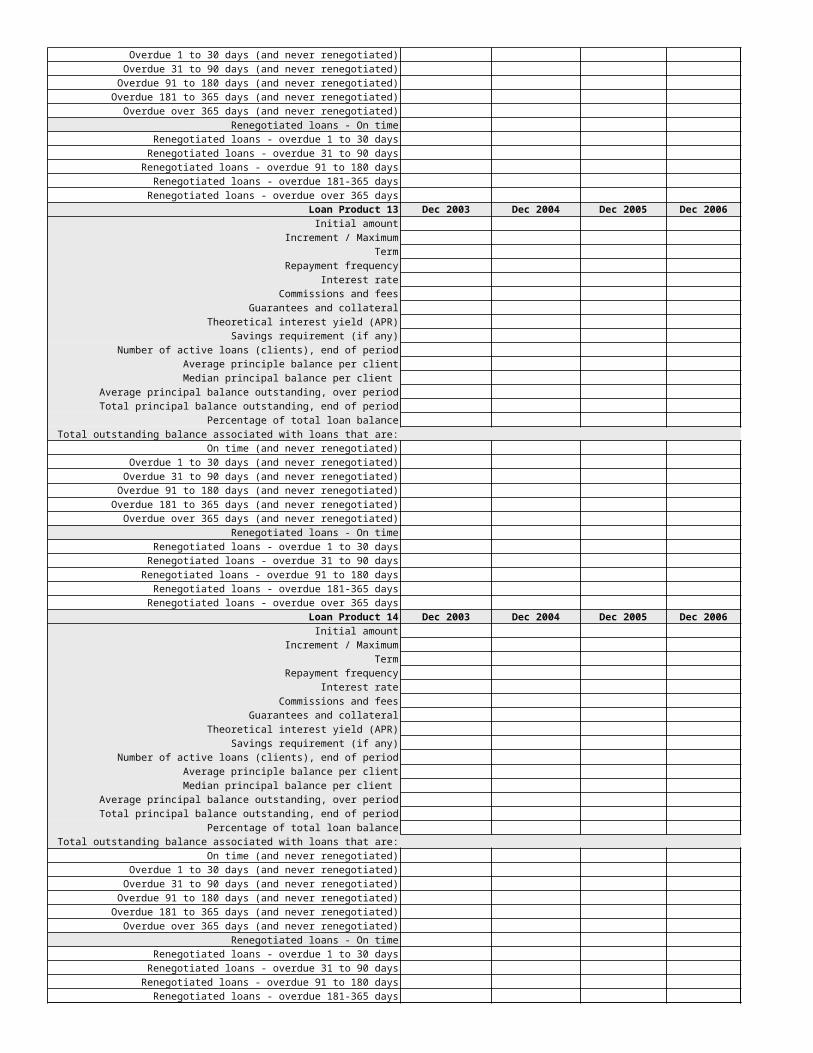
Loan Products Summary
Loan Product 1 Dec 2003 Dec 2004 Dec 2005 Dec 2006 Dec 2007
Initial amount
Increment / Maximum
Term
Repayment frequency
Interest rate
Commissions and fees
Guarantees and collateral
Theoretical interest yield (APR)
Savings requirement (if any)
Number of active loans (clients), end of period
Average principle balance per client
Median principal balance per client
Average principal balance outstanding, over period
Total principal balance outstanding, end of period
Percentage of total loan balance
Total outstanding balance associated with loans that are:
On time (and never renegotiated)
Overdue 1 to 30 days (and never renegotiated)
Overdue 31 to 90 days (and never renegotiated)
Overdue 91 to 180 days (and never renegotiated)
Overdue 181 to 365 days (and never renegotiated)
Overdue over 365 days (and never renegotiated)
Renegotiated loans - On time
Renegotiated loans - overdue 1 to 30 days
Renegotiated loans - overdue 31 to 90 days
Renegotiated loans - overdue 91 to 180 days
Renegotiated loans - overdue 181-365 days
Renegotiated loans - overdue over 365 days
Loan Product 2 Dec 2003 Dec 2004 Dec 2005 Dec 2006 Dec 2007
Initial amount
Increment / Maximum
Term
Repayment frequency
Interest rate
Commissions and fees
Guarantees and collateral
Theoretical interest yield (APR)
Savings requirement (if any)
Number of active loans (clients), end of period
Average principle balance per client
Median principal balance per client
Average principal balance outstanding, over period
Total principal balance outstanding, end of period
Percentage of total loan balance
Total outstanding balance associated with loans that are:
On time (and never renegotiated)
Overdue 1 to 30 days (and never renegotiated)
Overdue 31 to 90 days (and never renegotiated)
Overdue 91 to 180 days (and never renegotiated)
Overdue 181 to 365 days (and never renegotiated)
Overdue over 365 days (and never renegotiated)
Renegotiated loans - On time
Renegotiated loans - overdue 1 to 30 days
Renegotiated loans - overdue 31 to 90 days
Renegotiated loans - overdue 91 to 180 days
Renegotiated loans - overdue 181-365 days
Renegotiated loans - overdue over 365 days
Loan Product 3 Dec 2003 Dec 2004 Dec 2005 Dec 2006 Dec 2007
Initial amount
Increment / Maximum
Term
Repayment frequency
Interest rate
Commissions and fees
Guarantees and collateral
Theoretical interest yield (APR)
Savings requirement (if any)
Number of active loans (clients), end of period
Average principle balance per client
Median principal balance per client
Average principal balance outstanding, over period
Total principal balance outstanding, end of period
Percentage of total loan balance
Total outstanding balance associated with loans that are:
On time (and never renegotiated)
Overdue 1 to 30 days (and never renegotiated)
Overdue 31 to 90 days (and never renegotiated)
Overdue 91 to 180 days (and never renegotiated)
Overdue 181 to 365 days (and never renegotiated)
Overdue over 365 days (and never renegotiated)
Renegotiated loans - On time
Renegotiated loans - overdue 1 to 30 days
Renegotiated loans - overdue 31 to 90 days
Renegotiated loans - overdue 91 to 180 days
Renegotiated loans - overdue 181-365 days
Renegotiated loans - overdue over 365 days
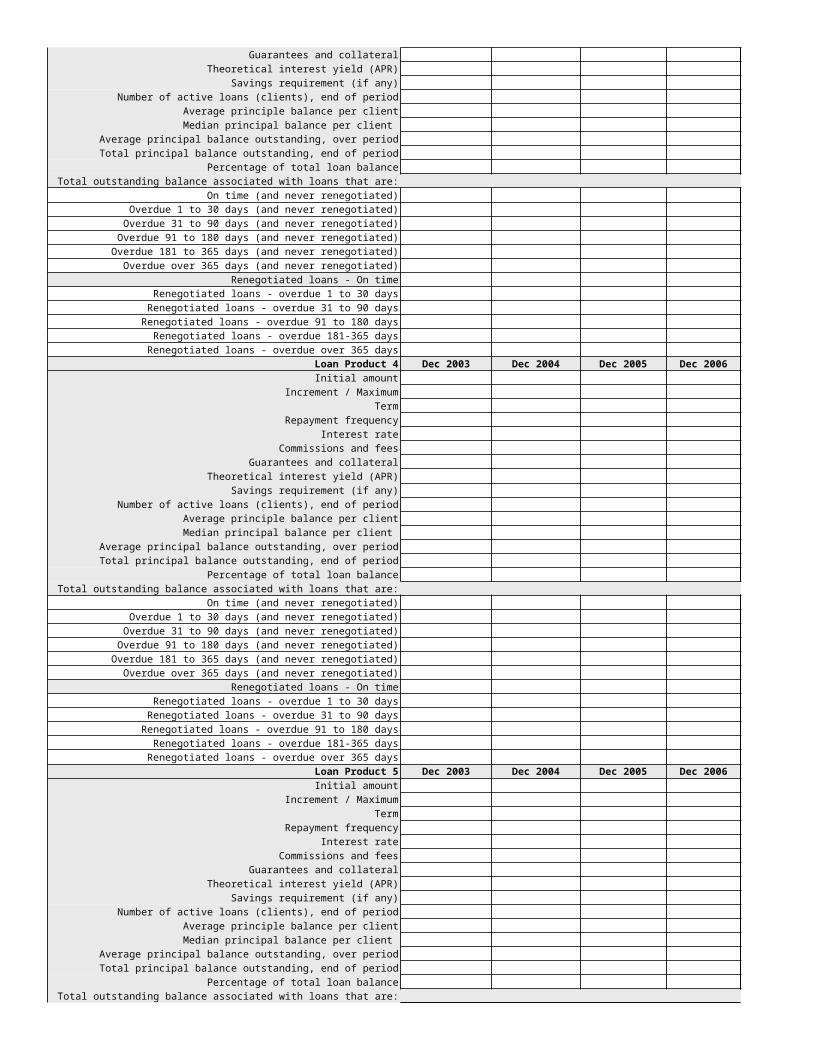
Loan Product 4 Dec 2003 Dec 2004 Dec 2005 Dec 2006 Dec 2007
Initial amount
Increment / Maximum
Term
Repayment frequency
Interest rate
Commissions and fees
Guarantees and collateral
Theoretical interest yield (APR)
Savings requirement (if any)
Number of active loans (clients), end of period
Average principle balance per client
Median principal balance per client
Average principal balance outstanding, over period
Total principal balance outstanding, end of period
Percentage of total loan balance
Total outstanding balance associated with loans that are:
On time (and never renegotiated)
Overdue 1 to 30 days (and never renegotiated)
Overdue 31 to 90 days (and never renegotiated)
Overdue 91 to 180 days (and never renegotiated)
Overdue 181 to 365 days (and never renegotiated)
Overdue over 365 days (and never renegotiated)
Renegotiated loans - On time
Renegotiated loans - overdue 1 to 30 days
Renegotiated loans - overdue 31 to 90 days
Renegotiated loans - overdue 91 to 180 days
Renegotiated loans - overdue 181-365 days
Renegotiated loans - overdue over 365 days
Loan Product 5 Dec 2003 Dec 2004 Dec 2005 Dec 2006 Dec 2007
Initial amount
Increment / Maximum
Term
Repayment frequency
Interest rate
Commissions and fees
Guarantees and collateral
Theoretical interest yield (APR)
Savings requirement (if any)
Number of active loans (clients), end of period
Average principle balance per client
Median principal balance per client
Average principal balance outstanding, over period
Total principal balance outstanding, end of period
Percentage of total loan balance
Total outstanding balance associated with loans that are:
On time (and never renegotiated)
Overdue 1 to 30 days (and never renegotiated)
Overdue 31 to 90 days (and never renegotiated)
Overdue 91 to 180 days (and never renegotiated)
Overdue 181 to 365 days (and never renegotiated)
Overdue over 365 days (and never renegotiated)
Renegotiated loans - On time
Renegotiated loans - overdue 1 to 30 days
Renegotiated loans - overdue 31 to 90 days
Renegotiated loans - overdue 91 to 180 days
Renegotiated loans - overdue 181-365 days
Renegotiated loans - overdue over 365 days
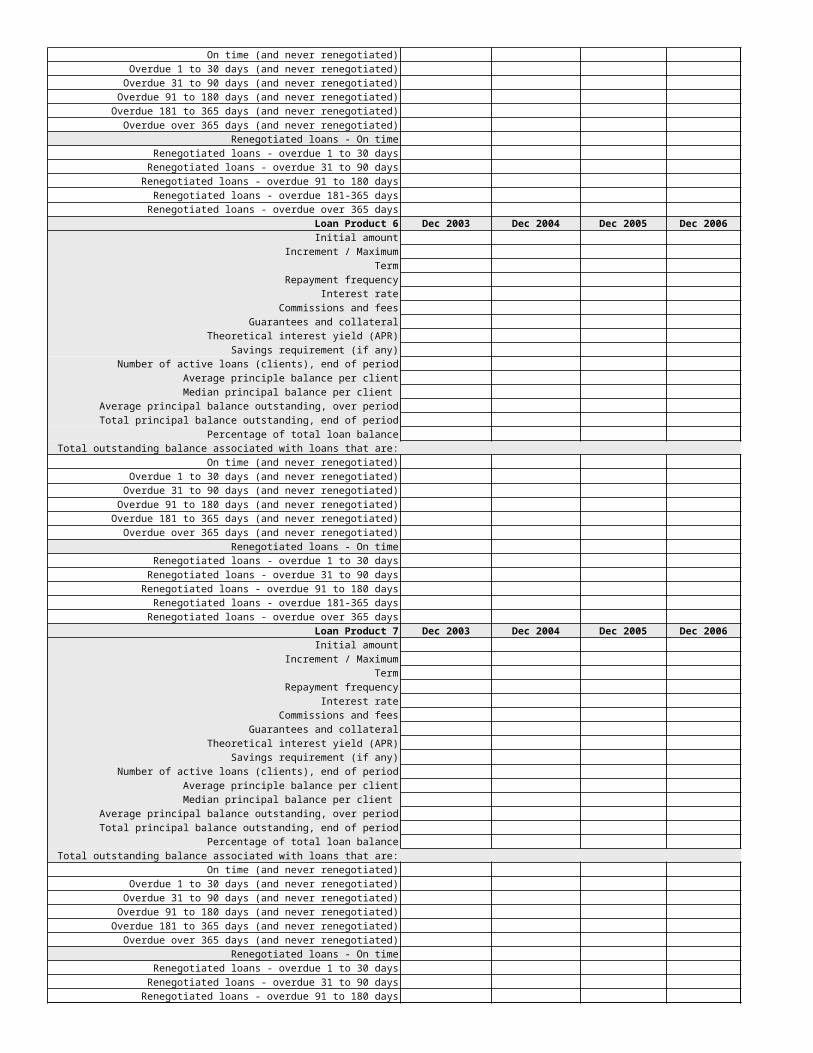
Loan Product 6 Dec 2003 Dec 2004 Dec 2005 Dec 2006 Dec 2007
Initial amount
Increment / Maximum
Term
Repayment frequency
Interest rate
Commissions and fees
Guarantees and collateral
Theoretical interest yield (APR)
Savings requirement (if any)
Number of active loans (clients), end of period
Average principle balance per client
Median principal balance per client
Average principal balance outstanding, over period
Total principal balance outstanding, end of period
Percentage of total loan balance
Total outstanding balance associated with loans that are:
On time (and never renegotiated)
Overdue 1 to 30 days (and never renegotiated)
Overdue 31 to 90 days (and never renegotiated)
Overdue 91 to 180 days (and never renegotiated)
Overdue 181 to 365 days (and never renegotiated)
Overdue over 365 days (and never renegotiated)
Renegotiated loans - On time
Renegotiated loans - overdue 1 to 30 days
Renegotiated loans - overdue 31 to 90 days
Renegotiated loans - overdue 91 to 180 days
Renegotiated loans - overdue 181-365 days
Renegotiated loans - overdue over 365 days
Loan Product 7 Dec 2003 Dec 2004 Dec 2005 Dec 2006 Dec 2007
Initial amount
Increment / Maximum
Term
Repayment frequency
Interest rate
Commissions and fees
Guarantees and collateral
Theoretical interest yield (APR)
Savings requirement (if any)
Number of active loans (clients), end of period
Average principle balance per client
Median principal balance per client
Average principal balance outstanding, over period
Total principal balance outstanding, end of period
Percentage of total loan balance
Total outstanding balance associated with loans that are:
On time (and never renegotiated)
Overdue 1 to 30 days (and never renegotiated)
Overdue 31 to 90 days (and never renegotiated)
Overdue 91 to 180 days (and never renegotiated)
Overdue 181 to 365 days (and never renegotiated)
Overdue over 365 days (and never renegotiated)
Renegotiated loans - On time
Renegotiated loans - overdue 1 to 30 days
Renegotiated loans - overdue 31 to 90 days
Renegotiated loans - overdue 91 to 180 days

Renegotiated loans - overdue 181-365 days
Renegotiated loans - overdue over 365 days
Loan Product 8 Dec 2003 Dec 2004 Dec 2005 Dec 2006 Dec 2007
Initial amount
Increment / Maximum
Term
Repayment frequency
Interest rate
Commissions and fees
Guarantees and collateral
Theoretical interest yield (APR)
Savings requirement (if any)
Number of active loans (clients), end of period
Average principle balance per client
Median principal balance per client
Average principal balance outstanding, over period
Total principal balance outstanding, end of period
Percentage of total loan balance
Total outstanding balance associated with loans that are:
On time (and never renegotiated)
Overdue 1 to 30 days (and never renegotiated)
Overdue 31 to 90 days (and never renegotiated)
Overdue 91 to 180 days (and never renegotiated)
Overdue 181 to 365 days (and never renegotiated)
Overdue over 365 days (and never renegotiated)
Renegotiated loans - On time
Renegotiated loans - overdue 1 to 30 days
Renegotiated loans - overdue 31 to 90 days
Renegotiated loans - overdue 91 to 180 days
Renegotiated loans - overdue 181-365 days
Renegotiated loans - overdue over 365 days
Loan Product 9 Dec 2003 Dec 2004 Dec 2005 Dec 2006 Dec 2007
Initial amount
Increment / Maximum
Term
Repayment frequency
Interest rate
Commissions and fees
Guarantees and collateral
Theoretical interest yield (APR)
Savings requirement (if any)
Number of active loans (clients), end of period
Average principle balance per client
Median principal balance per client
Average principal balance outstanding, over period
Total principal balance outstanding, end of period
Percentage of total loan balance
Total outstanding balance associated with loans that are:
On time (and never renegotiated)
Overdue 1 to 30 days (and never renegotiated)
Overdue 31 to 90 days (and never renegotiated)
Overdue 91 to 180 days (and never renegotiated)
Overdue 181 to 365 days (and never renegotiated)
Overdue over 365 days (and never renegotiated)
Renegotiated loans - On time
Renegotiated loans - overdue 1 to 30 days
Renegotiated loans - overdue 31 to 90 days
Renegotiated loans - overdue 91 to 180 days
Renegotiated loans - overdue 181-365 days
Renegotiated loans - overdue over 365 days
Loan Product 10 Dec 2003 Dec 2004 Dec 2005 Dec 2006 Dec 2007
Initial amount
Increment / Maximum
Term
Repayment frequency
Interest rate
Commissions and fees
Guarantees and collateral
Theoretical interest yield (APR)
Savings requirement (if any)
Number of active loans (clients), end of period
Average principle balance per client
Median principal balance per client
Average principal balance outstanding, over period
Total principal balance outstanding, end of period
Percentage of total loan balance
Total outstanding balance associated with loans that are:
On time (and never renegotiated)
Overdue 1 to 30 days (and never renegotiated)
Overdue 31 to 90 days (and never renegotiated)
Overdue 91 to 180 days (and never renegotiated)
Overdue 181 to 365 days (and never renegotiated)
Overdue over 365 days (and never renegotiated)
Renegotiated loans - On time
Renegotiated loans - overdue 1 to 30 days
Renegotiated loans - overdue 31 to 90 days
Renegotiated loans - overdue 91 to 180 days
Renegotiated loans - overdue 181-365 days
Renegotiated loans - overdue over 365 days
Loan Product 11 Dec 2003 Dec 2004 Dec 2005 Dec 2006 Dec 2007
Initial amount
Increment / Maximum
Term
Repayment frequency
Interest rate
Commissions and fees
Guarantees and collateral
Theoretical interest yield (APR)
Savings requirement (if any)
Number of active loans (clients), end of period
Average principle balance per client
Median principal balance per client
Average principal balance outstanding, over period
Total principal balance outstanding, end of period
Percentage of total loan balance
Total outstanding balance associated with loans that are:
On time (and never renegotiated)
Overdue 1 to 30 days (and never renegotiated)
Overdue 31 to 90 days (and never renegotiated)
Overdue 91 to 180 days (and never renegotiated)
Overdue 181 to 365 days (and never renegotiated)
Overdue over 365 days (and never renegotiated)
Renegotiated loans - On time
Renegotiated loans - overdue 1 to 30 days
Renegotiated loans - overdue 31 to 90 days
Renegotiated loans - overdue 91 to 180 days
Renegotiated loans - overdue 181-365 days
Renegotiated loans - overdue over 365 days
Loan Product 12 Dec 2003 Dec 2004 Dec 2005 Dec 2006 Dec 2007
Initial amount
Increment / Maximum
Term
Repayment frequency
Interest rate
Commissions and fees
Guarantees and collateral
Theoretical interest yield (APR)
Savings requirement (if any)
Number of active loans (clients), end of period
Average principle balance per client
Median principal balance per client
Average principal balance outstanding, over period
Total principal balance outstanding, end of period
Percentage of total loan balance
Total outstanding balance associated with loans that are:
On time (and never renegotiated)
Overdue 1 to 30 days (and never renegotiated)
Overdue 31 to 90 days (and never renegotiated)
Overdue 91 to 180 days (and never renegotiated)
Overdue 181 to 365 days (and never renegotiated)
Overdue over 365 days (and never renegotiated)
Renegotiated loans - On time
Renegotiated loans - overdue 1 to 30 days
Renegotiated loans - overdue 31 to 90 days
Renegotiated loans - overdue 91 to 180 days
Renegotiated loans - overdue 181-365 days
Renegotiated loans - overdue over 365 days
Loan Product 13 Dec 2003 Dec 2004 Dec 2005 Dec 2006 Dec 2007
Initial amount
Increment / Maximum
Term
Repayment frequency
Interest rate
Commissions and fees
Guarantees and collateral
Theoretical interest yield (APR)
Savings requirement (if any)
Number of active loans (clients), end of period
Average principle balance per client
Median principal balance per client
Average principal balance outstanding, over period
Total principal balance outstanding, end of period
Percentage of total loan balance
Total outstanding balance associated with loans that are:
On time (and never renegotiated)
Overdue 1 to 30 days (and never renegotiated)
Overdue 31 to 90 days (and never renegotiated)
Overdue 91 to 180 days (and never renegotiated)
Overdue 181 to 365 days (and never renegotiated)
Overdue over 365 days (and never renegotiated)
Renegotiated loans - On time
Renegotiated loans - overdue 1 to 30 days
Renegotiated loans - overdue 31 to 90 days
Renegotiated loans - overdue 91 to 180 days
Renegotiated loans - overdue 181-365 days
Renegotiated loans - overdue over 365 days
Loan Product 14 Dec 2003 Dec 2004 Dec 2005 Dec 2006 Dec 2007
Initial amount
Increment / Maximum
Term
Repayment frequency
Interest rate
Commissions and fees
Guarantees and collateral
Theoretical interest yield (APR)
Savings requirement (if any)
Number of active loans (clients), end of period
Average principle balance per client
Median principal balance per client
Average principal balance outstanding, over period
Total principal balance outstanding, end of period
Percentage of total loan balance
Total outstanding balance associated with loans that are:
On time (and never renegotiated)
Overdue 1 to 30 days (and never renegotiated)
Overdue 31 to 90 days (and never renegotiated)
Overdue 91 to 180 days (and never renegotiated)
Overdue 181 to 365 days (and never renegotiated)
Overdue over 365 days (and never renegotiated)
Renegotiated loans - On time
Renegotiated loans - overdue 1 to 30 days
Renegotiated loans - overdue 31 to 90 days
Renegotiated loans - overdue 91 to 180 days
Renegotiated loans - overdue 181-365 days
Renegotiated loans - overdue over 365 days
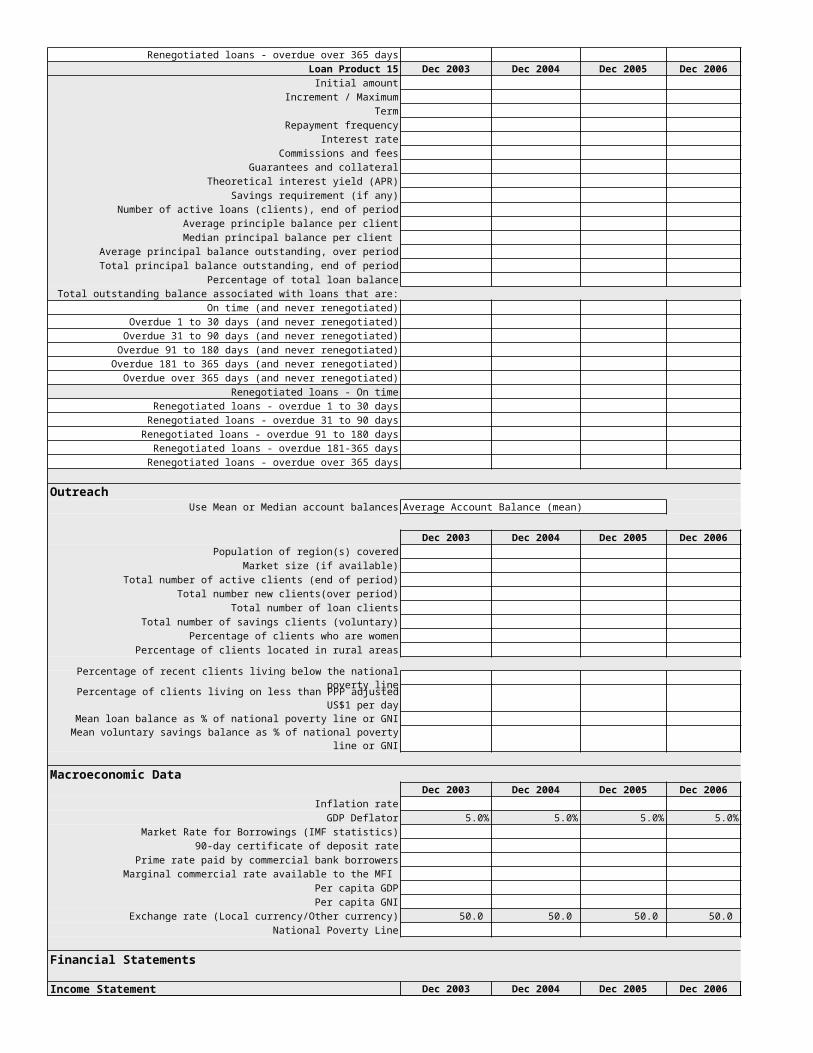
Loan Product 15 Dec 2003 Dec 2004 Dec 2005 Dec 2006 Dec 2007
Initial amount
Increment / Maximum
Term
Repayment frequency
Interest rate
Commissions and fees
Guarantees and collateral
Theoretical interest yield (APR)
Savings requirement (if any)
Number of active loans (clients), end of period
Average principle balance per client
Median principal balance per client
Average principal balance outstanding, over period
Total principal balance outstanding, end of period
Percentage of total loan balance
Total outstanding balance associated with loans that are:
On time (and never renegotiated)
Overdue 1 to 30 days (and never renegotiated)
Overdue 31 to 90 days (and never renegotiated)
Overdue 91 to 180 days (and never renegotiated)
Overdue 181 to 365 days (and never renegotiated)
Overdue over 365 days (and never renegotiated)
Renegotiated loans - On time
Renegotiated loans - overdue 1 to 30 days
Renegotiated loans - overdue 31 to 90 days
Renegotiated loans - overdue 91 to 180 days
Renegotiated loans - overdue 181-365 days
Renegotiated loans - overdue over 365 days
OutreachUse Mean or Median account balances Average Account Balance (mean)
Dec 2003 Dec 2004 Dec 2005 Dec 2006 Dec 2007
Population of region(s) covered
Market size (if available)
Total number of active clients (end of period)
Total number new clients(over period)
Total number of loan clients
Total number of savings clients (voluntary)
Percentage of clients who are women
Percentage of clients located in rural areas
Percentage of recent clients living below the national poverty line
Percentage of clients living on less than PPP adjusted US$1 per day
Mean loan balance as % of national poverty line or GNI
Mean voluntary savings balance as % of national poverty line or GNI
Macroeconomic Data Dec 2003 Dec 2004 Dec 2005 Dec 2006 Dec 2007
Inflation rate
GDP Deflator 5.0% 5.0% 5.0% 5.0% 5.0%
Market Rate for Borrowings (IMF statistics)
90-day certificate of deposit rate
Prime rate paid by commercial bank borrowers
Marginal commercial rate available to the MFI
Per capita GDP
Per capita GNI
Exchange rate (Local currency/Other currency) 50.0 50.0 50.0 50.0 50.0
National Poverty Line
Financial Statements
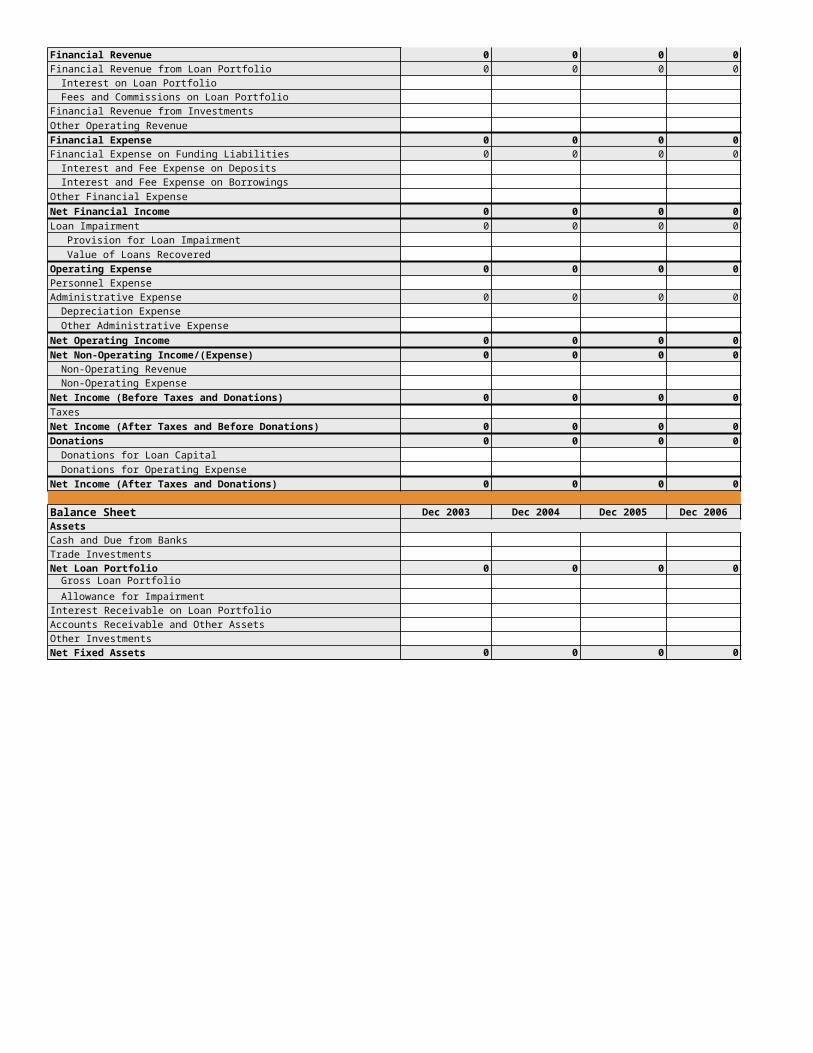
Income Statement Dec 2003 Dec 2004 Dec 2005 Dec 2006 Dec 2007
Financial Revenue 0 0 0 0 0
Financial Revenue from Loan Portfolio 0 0 0 0 0
Interest on Loan Portfolio
Fees and Commissions on Loan Portfolio
Financial Revenue from Investments
Other Operating Revenue
Financial Expense 0 0 0 0 0
Financial Expense on Funding Liabilities 0 0 0 0 0
Interest and Fee Expense on Deposits
Interest and Fee Expense on Borrowings
Other Financial Expense
Net Financial Income 0 0 0 0 0
Loan Impairment 0 0 0 0 0
Provision for Loan Impairment
Value of Loans Recovered
Operating Expense 0 0 0 0 0
Personnel Expense
Administrative Expense 0 0 0 0 0
Depreciation Expense
Other Administrative Expense
Net Operating Income 0 0 0 0 0
Net Non-Operating Income/(Expense) 0 0 0 0 0
Non-Operating Revenue
Non-Operating Expense
Net Income (Before Taxes and Donations) 0 0 0 0 0
Taxes
Net Income (After Taxes and Before Donations) 0 0 0 0 0
Donations 0 0 0 0 0
Donations for Loan Capital
Donations for Operating Expense
Net Income (After Taxes and Donations) 0 0 0 0 0
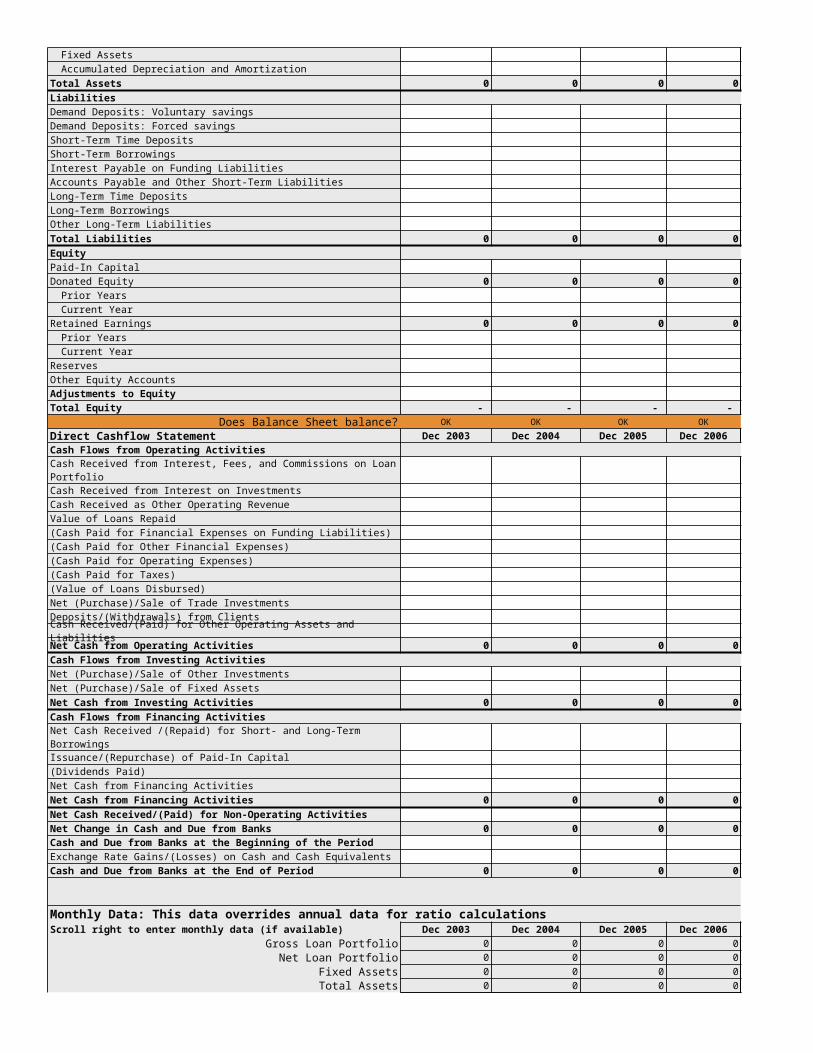
Balance Sheet Dec 2003 Dec 2004 Dec 2005 Dec 2006 Dec 2007
Assets
Cash and Due from Banks
Trade Investments
Net Loan Portfolio 0 0 0 0 0Gross Loan Portfolio
Allowance for Impairment
Interest Receivable on Loan Portfolio
Other Investments
0 0 0 0 0
Accounts Receivable and Other Assets
Net Fixed Assets
Fixed Assets
Accumulated Depreciation and Amortization
Total Assets 0 0 0 0 0
Liabilities
Demand Deposits: Voluntary savings
Demand Deposits: Forced savings
Short-Term Time Deposits
Short-Term Borrowings
Interest Payable on Funding Liabilities
Accounts Payable and Other Short-Term Liabilities
Long-Term Time Deposits
Long-Term Borrowings
Other Long-Term Liabilities
Total Liabilities 0 0 0 0 0
Equity
Paid-In Capital
Donated Equity 0 0 0 0 0
Prior Years
Current Year
Retained Earnings 0 0 0 0 0
Prior Years
Current Year
Reserves
Other Equity Accounts
Adjustments to Equity
Total Equity - - - - -
Does Balance Sheet balance? OK OK OK OK OK
Direct Cashflow Statement Dec 2003 Dec 2004 Dec 2005 Dec 2006 Dec 2007
Cash Flows from Operating Activities
Cash Received from Interest, Fees, and Commissions on Loan Portfolio
Cash Received from Interest on Investments
Cash Received as Other Operating Revenue
Value of Loans Repaid
(Cash Paid for Financial Expenses on Funding Liabilities)
(Cash Paid for Other Financial Expenses)
(Cash Paid for Operating Expenses)
(Cash Paid for Taxes)
(Value of Loans Disbursed)
Net (Purchase)/Sale of Trade Investments
Deposits/(Withdrawals) from Clients
Cash Received/(Paid) for Other Operating Assets and Liabilities
Net Cash from Operating Activities 0 0 0 0 0
Cash Flows from Investing Activities
Net (Purchase)/Sale of Other Investments
Net (Purchase)/Sale of Fixed Assets
Net Cash from Investing Activities 0 0 0 0 0
Cash Flows from Financing Activities
Net Cash Received /(Repaid) for Short- and Long-Term Borrowings
Issuance/(Repurchase) of Paid-In Capital
(Dividends Paid)
Net Cash from Financing Activities
Net Cash from Financing Activities 0 0 0 0 0
Net Cash Received/(Paid) for Non-Operating Activities
Net Change in Cash and Due from Banks 0 0 0 0 0
Cash and Due from Banks at the Beginning of the Period
Exchange Rate Gains/(Losses) on Cash and Cash Equivalents
Cash and Due from Banks at the End of Period 0 0 0 0 0
Monthly Data: This data overrides annual data for ratio calculationsScroll right to enter monthly data (if available) Dec 2003 Dec 2004 Dec 2005 Dec 2006 Dec 2007
Gross Loan Portfolio 0 0 0 0 0
Net Loan Portfolio 0 0 0 0 0
Fixed Assets 0 0 0 0 0
Total Assets 0 0 0 0 0

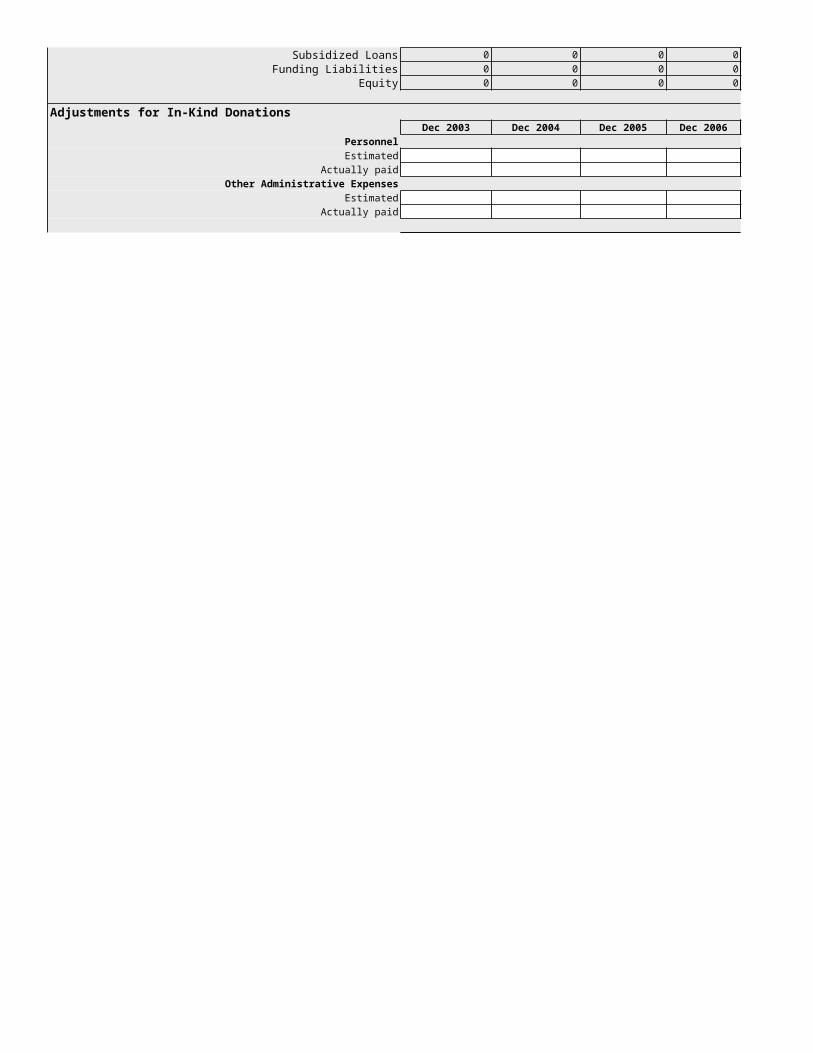
Subsidized Loans 0 0 0 0 0
Funding Liabilities 0 0 0 0 0
Equity 0 0 0 0 0
Adjustments for In-Kind DonationsDec 2003 Dec 2004 Dec 2005 Dec 2006 Dec 2007
Personnel
Estimated
Actually paid
Other Administrative Expenses
Estimated
Actually paid
Adjustments for Loan Loss Allowance Dec 2003 Dec 2004 Dec 2005 Dec 2006 Dec 2007
Portfolio Aging Schedule
Current
1-30 days overdue
31-90 days overdue
91-180 days overdue
181-365 days overdue
> 365 days overdue
Renegotiated loans - On time
Renegotiated loans- Overdue
Loan Loss Rate %
Loan Loss Rate %
Loan Loss Rate %
Loan Loss Rate %
Loan Loss Rate %
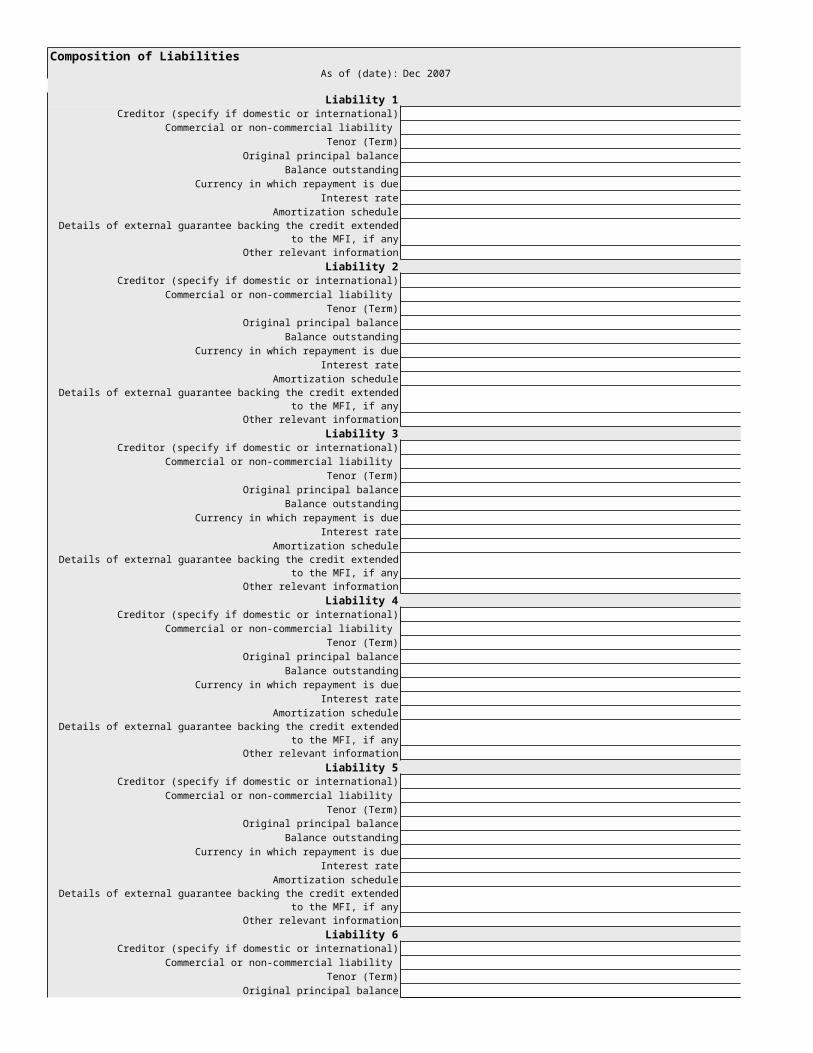
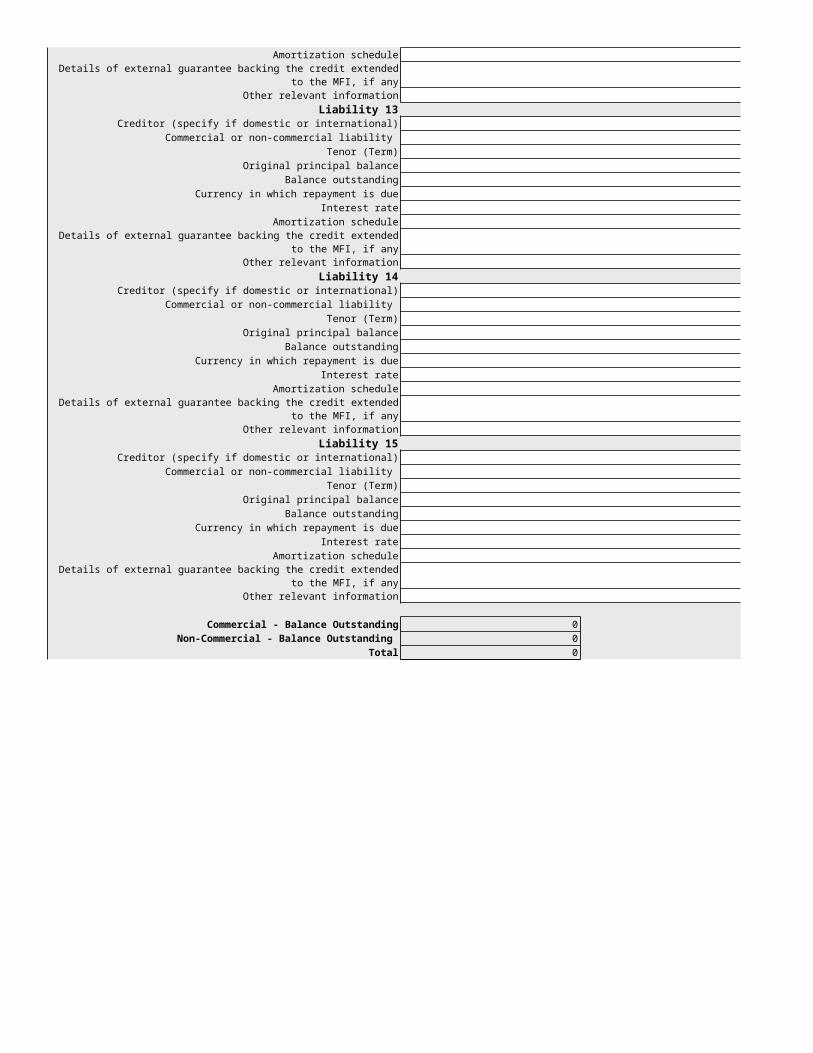
Composition of LiabilitiesAs of (date): Dec 2007
Liability 1Creditor (specify if domestic or international)
Commercial or non-commercial liability
Tenor (Term)
Original principal balance
Balance outstanding
Currency in which repayment is due
Interest rate
Amortization schedule
Other relevant information
Liability 2Creditor (specify if domestic or international)
Commercial or non-commercial liability
Tenor (Term)
Original principal balance
Balance outstanding
Currency in which repayment is due
Interest rate
Amortization schedule
Other relevant information
Liability 3Creditor (specify if domestic or international)
Commercial or non-commercial liability
Tenor (Term)
Original principal balance
Balance outstanding
Currency in which repayment is due
Interest rate
Amortization schedule
Other relevant information
Liability 4Creditor (specify if domestic or international)
Commercial or non-commercial liability
Tenor (Term)
Original principal balance
Balance outstanding
Currency in which repayment is due
Interest rate
Amortization schedule
Other relevant information
Liability 5Creditor (specify if domestic or international)
Commercial or non-commercial liability
Tenor (Term)
Original principal balance
Balance outstanding
Currency in which repayment is due
Interest rate
Amortization schedule
Other relevant information
Liability 6Creditor (specify if domestic or international)
Commercial or non-commercial liability
Tenor (Term)
Original principal balance
Details of external guarantee backing the credit extended to the MFI, if any
Details of external guarantee backing the credit extended to the MFI, if any
Details of external guarantee backing the credit extended to the MFI, if any
Details of external guarantee backing the credit extended to the MFI, if any
Details of external guarantee backing the credit extended to the MFI, if any
Balance outstanding
Currency in which repayment is due
Interest rate
Amortization schedule
Other relevant information
Details of external guarantee backing the credit extended to the MFI, if any
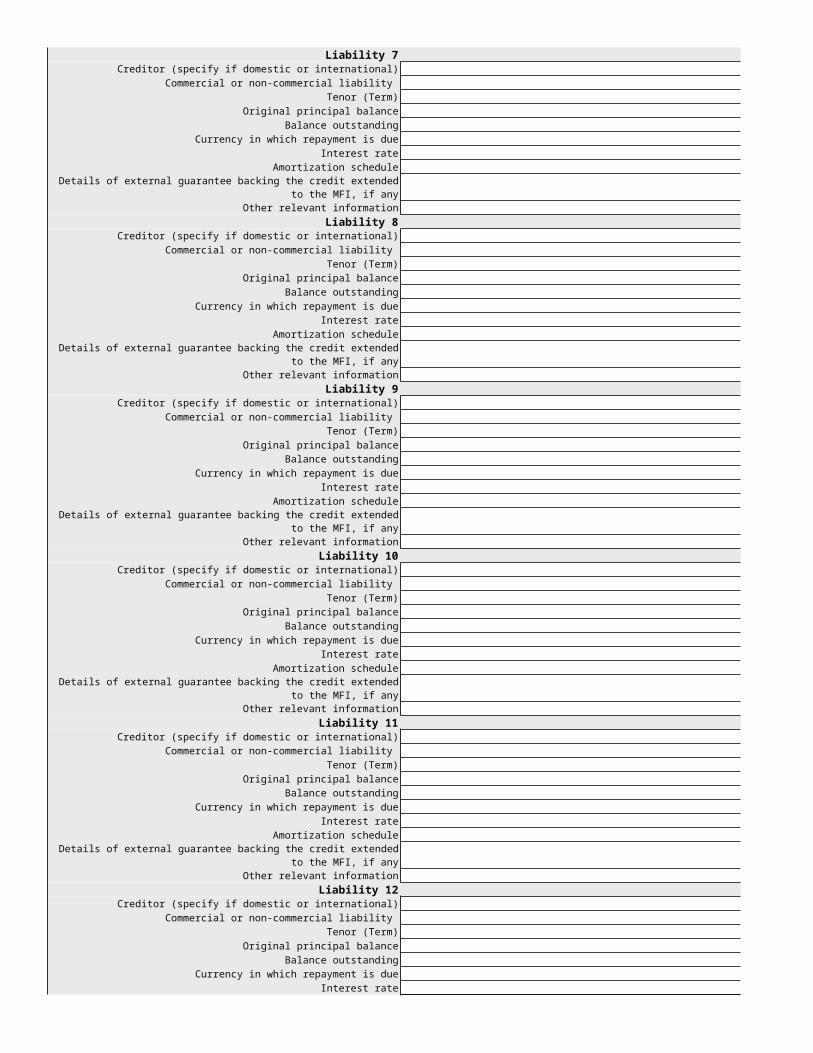
Liability 7Creditor (specify if domestic or international)
Commercial or non-commercial liability
Tenor (Term)
Original principal balance
Balance outstanding
Currency in which repayment is due
Interest rate
Amortization schedule
Other relevant information
Liability 8Creditor (specify if domestic or international)
Commercial or non-commercial liability
Tenor (Term)
Original principal balance
Balance outstanding
Currency in which repayment is due
Interest rate
Amortization schedule
Other relevant information
Liability 9Creditor (specify if domestic or international)
Commercial or non-commercial liability
Tenor (Term)
Original principal balance
Balance outstanding
Currency in which repayment is due
Interest rate
Amortization schedule
Other relevant information
Liability 10Creditor (specify if domestic or international)
Commercial or non-commercial liability
Tenor (Term)
Original principal balance
Balance outstanding
Currency in which repayment is due
Interest rate
Amortization schedule
Other relevant information
Liability 11Creditor (specify if domestic or international)
Commercial or non-commercial liability
Tenor (Term)
Original principal balance
Balance outstanding
Currency in which repayment is due
Interest rate
Amortization schedule
Other relevant information
Liability 12Creditor (specify if domestic or international)
Commercial or non-commercial liability
Tenor (Term)
Original principal balance
Balance outstanding
Currency in which repayment is due
Interest rate
Details of external guarantee backing the credit extended to the MFI, if any
Details of external guarantee backing the credit extended to the MFI, if any
Details of external guarantee backing the credit extended to the MFI, if any
Details of external guarantee backing the credit extended to the MFI, if any
Details of external guarantee backing the credit extended to the MFI, if any
Amortization schedule
Other relevant information
Liability 13Creditor (specify if domestic or international)
Commercial or non-commercial liability
Tenor (Term)
Original principal balance
Balance outstanding
Currency in which repayment is due
Interest rate
Amortization schedule
Other relevant information
Liability 14Creditor (specify if domestic or international)
Commercial or non-commercial liability
Tenor (Term)
Original principal balance
Balance outstanding
Currency in which repayment is due
Interest rate
Amortization schedule
Other relevant information
Liability 15Creditor (specify if domestic or international)
Commercial or non-commercial liability
Tenor (Term)
Original principal balance
Balance outstanding
Currency in which repayment is due
Interest rate
Amortization schedule
Other relevant information
Commercial - Balance Outstanding 0
Non-Commercial - Balance Outstanding 0
Total 0
Details of external guarantee backing the credit extended to the MFI, if any
Details of external guarantee backing the credit extended to the MFI, if any
Details of external guarantee backing the credit extended to the MFI, if any
Details of external guarantee backing the credit extended to the MFI, if any

Table 2.1 Summary of Key DataActual
Dec 2003 Dec 2004 Dec 2005 Dec 2006 Dec 2007
Clients and Products1 Number of borrowers 0 0 0 0 02 Number of active loans 0 0 0 0 03 Total gross loan portfolio 0 0 0 0 04 Number of voluntary savings clients 0 0 0 0 05 Total balance of voluntary savings accounts 0 0 0 0 0
Portfolio Quality6 Adjusted PAR30 No data No data No data No data No data7 Adjusted Write-off Ratio No previous yr No data No data No data No data8 Adjusted Risk Coverage Ratio No data No data No data No data No data
Efficiency & Productivity9 Average loan balance No data No data No data No data No data10 Average savings balance 0 0 0 0 011 Adjusted Operating Expense Ratio No previous yr No data No data No data No data12 Adjusted Cost per Active Client No previous yr No data No data No data No data13 Adjusted Average Outstanding Loan Size No data No data No data No data No data14 Client Turnover No previous yr 0.0% 0.0% 0.0% 0.0%
Profitability15 Adjusted Return on Assets (AROA) No previous yr No data No data No data No data16 Adjusted Return on Equity (AROE) No previous yr No data No data No data No data
Asset/Liability Management17 Yield on Gross Portfolio No previous yr No data No data No data No data
Macroeconomic Data 18 50.0 50.0 50.0 50.0 50.0
19 GNI per capita 0 0 0 0 0
Table 3.2 Staffing Summary Data Dec 2003 Dec 2004 Dec 2005 Dec 2006 Dec 2007
1 Total # staff 0 0 0 0 02 Total # loan officers 0 0 0 0 03 Staff turnover 0% 0% 0% 0% 0%
Staffing Efficiency4 Personnel expense/Loan portfolio 0.0% 0.0% 0.0% 0.0%5 Average Salary/GNI per capita 0% 0% 0% 0% 0%
Staffing Productivity6 Borrowers per Loan Officer 0 0 0 0 07 Borrowers per staff member 0 0 0 0 08 Clients per staff Member 0 0 0 0 09 Personnel allocation ratio (loan officers/# of personnel) 0.0% 0.0% 0.0% 0.0% 0.0%
Year-end free market exchange rate (local currency/Other currency)
Actual Projected
Dec 2008
0 0
0 0
0 0
0 0
0 0
0.0%
0.0%
0%
0
0
0.0%
0
0
0.0%
0.0%
0.0%
0.0%
48.0
0
0 0
0 0
0% 0%
0.0% 0%
0% 0%
0 0
0 0
0 0
0.0% 0%
MBB Peer Group
MBB Peer Group
Variance (between MFI and MBB peer
group)

Table 3.1 Current MFI Ownership Summary As of: Dec 2007
Owner Name % Ownership
1 2 3 4 5 6 7 8 9 10 11 12
Type (individual,
company, bank NGO, other)
Domestic or International
Amount of Ownership (in local currency)
As of (date): Dec 2007
Currency: Nominal Local Currency
1 Savings Products 0 0 0 02 Loan Products 0 0 0 03 Other Financial Products 0 0 0 04 Other Non-Financial Products 0 0 0 0
As of: Dec 2007Currency: Nominal Local Currency
Loan Size % of Portfolio # of Loans % of Loans
1 0 -250 0 0.0% 0 0.0%2 251 - 500 0 0.0% 0 0.0%3 501 - 1,000 0 0.0% 0 0.0%4 1,001 - 5000 0 0.0% 0 0.0%5 5,001- 10,000 0 0.0% 0 0.0%6 >10,000 0 0.0% 0 0.0%
0 0.0% 0 0.0%
As of: Dec 2007
Currency: Nominal Local Currency
Savings Products
1 Savings Product 1 0 0.0% 0 0.0% 0 0.0%
2 Savings Product 2 0 0.0% 0 0.0% 0 0.0%
3 Savings Product 3 0 0.0% 0 0.0% 0 0.0%
4 Savings Product 4 0 0.0% 0 0.0% 0 0.0%
5 Savings Product 5 0 0.0% 0 0.0% 0 0.0%
6 Savings Product 6 0 0.0% 0 0.0% 0 0.0%
7 Savings Product 7 0 0.0% 0 0.0% 0 0.0%
8 Savings Product 8 0 0.0% 0 0.0% 0 0.0%
9 Savings Product 9 0 0.0% 0 0.0% 0 0.0%
10 Savings Product 10 0 0.0% 0 0.0% 0 0.0%
11 Savings Product 11 0 0.0% 0 0.0% 0 0.0%
12 Savings Product 12 0 0.0% 0 0.0% 0 0.0%
13 Savings Product 13 0 0.0% 0 0.0% 0 0.0%
14 Savings Product 14 0 0.0% 0 0.0% 0 0.0%
15 Savings Product 15 0 0.0% 0 0.0% 0 0.0%
Total Savings Products 0 0.0% 0 0.0% 0 0.0%
Loan Products
1 Loan Product 1 0 0.0% 0 0.0% 0 0.0%
2 Loan Product 2 0 0.0% 0 0.0% 0 0.0%
3 Loan Product 3 0 0.0% 0 0.0% 0 0.0%
4 Loan Product 4 0 0.0% 0 0.0% 0 0.0%
5 Loan Product 5 0 0.0% 0 0.0% 0 0.0%
6 Loan Product 6 0 0.0% 0 0.0% 0 0.0%
7 Loan Product 7 0 0.0% 0 0.0% 0 0.0%
8 Loan Product 8 0 0.0% 0 0.0% 0 0.0%
9 Loan Product 9 0 0.0% 0 0.0% 0 0.0%
10 Loan Product 10 0 0.0% 0 0.0% 0 0.0%
11 Loan Product 11 0 0.0% 0 0.0% 0 0.0%
12 Loan Product 12 0 0.0% 0 0.0% 0 0.0%
13 Loan Product 13 0 0.0% 0 0.0% 0 0.0%
14 Loan Product 14 0 0.0% 0 0.0% 0 0.0%
15 Loan Product 15 0 0.0% 0 0.0% 0 0.0%
Total Loan Products 0 0.0% 0 0.0% 0 0.0%
Other Financial Products
1 Other Financial Product 1 0 0.0% 0 0.0% 0 0.0%
Table 4.1 Product Summary Number of Products
Number of Active Clients
Total Balance or Value
Average Account Balance (mean)
Table 4.4 Classification of Loan Portfolio
Amount of Portfolio
Table 4.5 Analysis of Product Lines Product Balance
% of Total Product Balance
Number of Active Clients
% of Total Clients
Total Fee Revenue
% of Total MFI Fee Revenue
2 Other Financial Product 2 0 0.0% 0 0.0% 0 0.0%
3 Other Financial Product 3 0 0.0% 0 0.0% 0 0.0%
4 Other Financial Product 4 0 0.0% 0 0.0% 0 0.0%
5 Other Financial Product 5 0 0.0% 0 0.0% 0 0.0%
Total Other Financial Products 0 0.0% 0 0.0% 0 0.0%
Non-Financial Products
1 Non-Financial Product 1 0 0.0% 0 0.0% 0 0.0%
2 Non-Financial Product 2 0 0.0% 0 0.0% 0 0.0%
3 Non-Financial Product 3 0 0.0% 0 0.0% 0 0.0%
4 Non-Financial Product 4 0 0.0% 0 0.0% 0 0.0%
5 Non-Financial Product 5 0 0.0% 0 0.0% 0 0.0%
Total Non-Financial Products 0 0.0% 0 0.0% 0 0.0%
Grand Total
% Loan Products 0.0% 0.0% 0.0% 0.0% 0.0% 0.0%
% Savings Products 0.0% 0.0% 0.0% 0.0% 0.0% 0.0%
% Other Financial Products 0.0% 0.0% 0.0% 0.0% 0.0% 0.0%
% Other Non-Financial Products 0.0% 0.0% 0.0% 0.0% 0.0% 0.0%
0.0% 0.0% 0.0% 0.0% 0.0% 0.0%
Nominal Local Currency
Savings Product 1 Dec 2003 Dec 2004 Dec 2005 Dec 2006 Dec 20071 Interest Rate (%) and calculation method 0.0% 0.0% 0.0% 0.0% 0.0%2 Minimum deposit to open account 0 0 0 0 03 Fees to open account 0 0 0 0 04 Minimum deposit per transaction 0 0 0 0 05 Fees per transaction 0 0 0 0 06 Penalty for early withdrawal 0 0 0 0 07 Minimum account balance 0 0 0 0 08 Withdrawal frequency (average per period) 0 0 0 0 0 9 Deposit frequency (average per period) 0 0 0 0 0 10 Number of active individual savings accounts 0 0 0 0 0 11 Number of inactive individual accounts 0 0 0 0 0 12 Total individual account balance, end of period 0 0 0 0 013
0.0% 0.0% 0.0% 0.0% 0.0%
14 Average individual account balance (mean) 0 0 0 0 015 Number of active institutional savings accounts 0 0 0 0 0 16 Number of inactive institutional accounts 0 0 0 0 0 17 Total institutional account balance, end of period 0 0 0 0 018
0.0% 0.0% 0.0% 0.0% 0.0%
19 Average institutional account balance (mean) 0 0 0 0 0Savings Product 2 Dec 2003 Dec 2004 Dec 2005 Dec 2006 Dec 2007
1 Interest Rate (%) and calculation method 0.0% 0.0% 0.0% 0.0% 0.0%2 Minimum deposit to open account 0 0 0 0 03 Fees to open account 0 0 0 0 04 Minimum deposit per transaction 0 0 0 0 05 Fees per transaction 0 0 0 0 06 Penalty for early withdrawal 0 0 0 0 07 Minimum account balance 0 0 0 0 08 Withdrawal frequency (average per period) 0 0 0 0 0 9 Deposit frequency (average per period) 0 0 0 0 0 10 Number of active individual savings accounts 0 0 0 0 0 11 Number of inactive individual accounts 0 0 0 0 0 12 Total individual account balance, end of period 0 0 0 0 013
0.0% 0.0% 0.0% 0.0% 0.0%
14 Average individual account balance (mean) 0 0 0 0 015 Number of active institutional savings accounts 0 0 0 0 0 16 Number of inactive institutional accounts 0 0 0 0 0 17 Total institutional account balance, end of period 0 0 0 0 018
0.0% 0.0% 0.0% 0.0% 0.0%
19 Average institutional account balance (mean) 0 0 0 0 0Savings Product 3 Dec 2003 Dec 2004 Dec 2005 Dec 2006 Dec 2007
1 Interest Rate (%) and calculation method 0.0% 0.0% 0.0% 0.0% 0.0%2 Minimum deposit to open account 0 0 0 0 03 Fees to open account 0 0 0 0 04 Minimum deposit per transaction 0 0 0 0 05 Fees per transaction 0 0 0 0 06 Penalty for early withdrawal 0 0 0 0 07 Minimum account balance 0 0 0 0 08 Withdrawal frequency (average per period) 0 0 0 0 0 9 Deposit frequency (average per period) 0 0 0 0 0 10 Number of active individual savings accounts 0 0 0 0 0 11 Number of inactive individual accounts 0 0 0 0 0 12 Total individual account balance, end of period 0 0 0 0 013
0.0% 0.0% 0.0% 0.0% 0.0%
14 Average individual account balance (mean) 0 0 0 0 015 Number of active institutional savings accounts 0 0 0 0 0 16 Number of inactive institutional accounts 0 0 0 0 0 17 Total institutional account balance, end of period 0 0 0 0 018
0.0% 0.0% 0.0% 0.0% 0.0%
19 Average institutional account balance (mean) 0 0 0 0 0
Table 4.2 Savings Products Summary
Individual account balance as percentage of total savings balance
Institutional account balance as percentage of total savings balance
Individual account balance as percentage of total savings balance
Institutional account balance as percentage of total savings balance
Individual account balance as percentage of total savings balance
Institutional account balance as percentage of total savings balance
Savings Product 4 Dec 2003 Dec 2004 Dec 2005 Dec 2006 Dec 20071 Interest Rate (%) and calculation method 0.0% 0.0% 0.0% 0.0% 0.0%2 Minimum deposit to open account 0 0 0 0 03 Fees to open account 0 0 0 0 04 Minimum deposit per transaction 0 0 0 0 05 Fees per transaction 0 0 0 0 06 Penalty for early withdrawal 0 0 0 0 07 Minimum account balance 0 0 0 0 08 Withdrawal frequency (average per period) 0 0 0 0 0 9 Deposit frequency (average per period) 0 0 0 0 0 10 Number of active individual savings accounts 0 0 0 0 0 11 Number of inactive individual accounts 0 0 0 0 0 12 Total individual account balance, end of period 0 0 0 0 013
0.0% 0.0% 0.0% 0.0% 0.0%
14 Average individual account balance (mean) 0 0 0 0 015 Number of active institutional savings accounts 0 0 0 0 0 16 Number of inactive institutional accounts 0 0 0 0 0 17 Total institutional account balance, end of period 0 0 0 0 018
0.0% 0.0% 0.0% 0.0% 0.0%
19 Average institutional account balance (mean) 0 0 0 0 0Savings Product 5 Dec 2003 Dec 2004 Dec 2005 Dec 2006 Dec 2007
1 Interest Rate (%) and calculation method 0.0% 0.0% 0.0% 0.0% 0.0%2 Minimum deposit to open account 0 0 0 0 03 Fees to open account 0 0 0 0 04 Minimum deposit per transaction 0 0 0 0 05 Fees per transaction 0 0 0 0 06 Penalty for early withdrawal 0 0 0 0 07 Minimum account balance 0 0 0 0 08 Withdrawal frequency (average per period) 0 0 0 0 0 9 Deposit frequency (average per period) 0 0 0 0 0 10 Number of active individual savings accounts 0 0 0 0 0 11 Number of inactive individual accounts 0 0 0 0 0 12 Total individual account balance, end of period 0 0 0 0 013
0.0% 0.0% 0.0% 0.0% 0.0%
14 Average individual account balance (mean) 0 0 0 0 015 Number of active institutional savings accounts 0 0 0 0 0 16 Number of inactive institutional accounts 0 0 0 0 0 17 Total institutional account balance, end of period 0 0 0 0 018
0.0% 0.0% 0.0% 0.0% 0.0%
19 Average institutional account balance (mean) 0 0 0 0 0Savings Product 6 Dec 2003 Dec 2004 Dec 2005 Dec 2006 Dec 2007
1 Interest Rate (%) and calculation method 0.0% 0.0% 0.0% 0.0% 0.0%2 Minimum deposit to open account 0 0 0 0 03 Fees to open account 0 0 0 0 04 Minimum deposit per transaction 0 0 0 0 05 Fees per transaction 0 0 0 0 06 Penalty for early withdrawal 0 0 0 0 07 Minimum account balance 0 0 0 0 08 Withdrawal frequency (average per period) 0 0 0 0 0 9 Deposit frequency (average per period) 0 0 0 0 0 10 Number of active individual savings accounts 0 0 0 0 0 11 Number of inactive individual accounts 0 0 0 0 0 12 Total individual account balance, end of period 0 0 0 0 013
0.0% 0.0% 0.0% 0.0% 0.0%
14 Average individual account balance (mean) 0 0 0 0 015 Number of active institutional savings accounts 0 0 0 0 0 16 Number of inactive institutional accounts 0 0 0 0 0 17 Total institutional account balance, end of period 0 0 0 0 018
0.0% 0.0% 0.0% 0.0% 0.0%
19 Average institutional account balance (mean) 0 0 0 0 0Savings Product 7 Dec 2003 Dec 2004 Dec 2005 Dec 2006 Dec 2007
Individual account balance as percentage of total savings balance
Institutional account balance as percentage of total savings balance
Individual account balance as percentage of total savings balance
Institutional account balance as percentage of total savings balance
Individual account balance as percentage of total savings balance
Institutional account balance as percentage of total savings balance
1 Interest Rate (%) and calculation method 0.0% 0.0% 0.0% 0.0% 0.0%2 Minimum deposit to open account 0 0 0 0 03 Fees to open account 0 0 0 0 04 Minimum deposit per transaction 0 0 0 0 05 Fees per transaction 0 0 0 0 06 Penalty for early withdrawal 0 0 0 0 07 Minimum account balance 0 0 0 0 08 Withdrawal frequency (average per period) 0 0 0 0 0 9 Deposit frequency (average per period) 0 0 0 0 0 10 Number of active individual savings accounts 0 0 0 0 0 11 Number of inactive individual accounts 0 0 0 0 0 12 Total individual account balance, end of period 0 0 0 0 013
0.0% 0.0% 0.0% 0.0% 0.0%
14 Average individual account balance (mean) 0 0 0 0 015 Number of active institutional savings accounts 0 0 0 0 0 16 Number of inactive institutional accounts 0 0 0 0 0 17 Total institutional account balance, end of period 0 0 0 0 018
0.0% 0.0% 0.0% 0.0% 0.0%
19 Average institutional account balance (mean) 0 0 0 0 0Savings Product 8 Dec 2003 Dec 2004 Dec 2005 Dec 2006 Dec 2007
1 Interest Rate (%) and calculation method 0.0% 0.0% 0.0% 0.0% 0.0%2 Minimum deposit to open account 0 0 0 0 03 Fees to open account 0 0 0 0 04 Minimum deposit per transaction 0 0 0 0 05 Fees per transaction 0 0 0 0 06 Penalty for early withdrawal 0 0 0 0 07 Minimum account balance 0 0 0 0 08 Withdrawal frequency (average per period) 0 0 0 0 0 9 Deposit frequency (average per period) 0 0 0 0 0 10 Number of active individual savings accounts 0 0 0 0 0 11 Number of inactive individual accounts 0 0 0 0 0 12 Total individual account balance, end of period 0 0 0 0 013
0.0% 0.0% 0.0% 0.0% 0.0%
14 Average individual account balance (mean) 0 0 0 0 015 Number of active institutional savings accounts 0 0 0 0 0 16 Number of inactive institutional accounts 0 0 0 0 0 17 Total institutional account balance, end of period 0 0 0 0 018
0.0% 0.0% 0.0% 0.0% 0.0%
19 Average institutional account balance (mean) 0 0 0 0 0Savings Product 9 Dec 2003 Dec 2004 Dec 2005 Dec 2006 Dec 2007
1 Interest Rate (%) and calculation method 0.0% 0.0% 0.0% 0.0% 0.0%2 Minimum deposit to open account 0 0 0 0 03 Fees to open account 0 0 0 0 04 Minimum deposit per transaction 0 0 0 0 05 Fees per transaction 0 0 0 0 06 Penalty for early withdrawal 0 0 0 0 07 Minimum account balance 0 0 0 0 08 Withdrawal frequency (average per period) 0 0 0 0 0 9 Deposit frequency (average per period) 0 0 0 0 0 10 Number of active individual savings accounts 0 0 0 0 0 11 Number of inactive individual accounts 0 0 0 0 0 12 Total individual account balance, end of period 0 0 0 0 013
0.0% 0.0% 0.0% 0.0% 0.0%
14 Average individual account balance (mean) 0 0 0 0 015 Number of active institutional savings accounts 0 0 0 0 0 16 Number of inactive institutional accounts 0 0 0 0 0 17 Total institutional account balance, end of period 0 0 0 0 018
0.0% 0.0% 0.0% 0.0% 0.0%
19 Average institutional account balance (mean) 0 0 0 0 0Savings Product 10 Dec 2003 Dec 2004 Dec 2005 Dec 2006 Dec 2007
1 Interest Rate (%) and calculation method 0.0% 0.0% 0.0% 0.0% 0.0%
Individual account balance as percentage of total savings balance
Institutional account balance as percentage of total savings balance
Individual account balance as percentage of total savings balance
Institutional account balance as percentage of total savings balance
Individual account balance as percentage of total savings balance
Institutional account balance as percentage of total savings balance

2 Minimum deposit to open account 0 0 0 0 03 Fees to open account 0 0 0 0 04 Minimum deposit per transaction 0 0 0 0 05 Fees per transaction 0 0 0 0 06 Penalty for early withdrawal 0 0 0 0 07 Minimum account balance 0 0 0 0 08 Withdrawal frequency (average per period) 0 0 0 0 0 9 Deposit frequency (average per period) 0 0 0 0 0 10 Number of active individual savings accounts 0 0 0 0 0 11 Number of inactive individual accounts 0 0 0 0 0 12 Total individual account balance, end of period 0 0 0 0 013
0.0% 0.0% 0.0% 0.0% 0.0%
14 Average individual account balance (mean) 0 0 0 0 015 Number of active institutional savings accounts 0 0 0 0 0 16 Number of inactive institutional accounts 0 0 0 0 0 17 Total institutional account balance, end of period 0 0 0 0 018
0.0% 0.0% 0.0% 0.0% 0.0%
19 Average institutional account balance (mean) 0 0 0 0 0Savings Product 11 Dec 2003 Dec 2004 Dec 2005 Dec 2006 Dec 2007
1 Interest Rate (%) and calculation method 0.0% 0.0% 0.0% 0.0% 0.0%2 Minimum deposit to open account 0 0 0 0 03 Fees to open account 0 0 0 0 04 Minimum deposit per transaction 0 0 0 0 05 Fees per transaction 0 0 0 0 06 Penalty for early withdrawal 0 0 0 0 07 Minimum account balance 0 0 0 0 08 Withdrawal frequency (average per period) 0 0 0 0 0 9 Deposit frequency (average per period) 0 0 0 0 0 10 Number of active individual savings accounts 0 0 0 0 0 11 Number of inactive individual accounts 0 0 0 0 0 12 Total individual account balance, end of period 0 0 0 0 013
0.0% 0.0% 0.0% 0.0% 0.0%
14 Average individual account balance (mean) 0 0 0 0 015 Number of active institutional savings accounts 0 0 0 0 0 16 Number of inactive institutional accounts 0 0 0 0 0 17 Total institutional account balance, end of period 0 0 0 0 018
0.0% 0.0% 0.0% 0.0% 0.0%
19 Average institutional account balance (mean) 0 0 0 0 0Savings Product 12 Dec 2003 Dec 2004 Dec 2005 Dec 2006 Dec 2007
1 Interest Rate (%) and calculation method 0.0% 0.0% 0.0% 0.0% 0.0%2 Minimum deposit to open account 0 0 0 0 03 Fees to open account 0 0 0 0 04 Minimum deposit per transaction 0 0 0 0 05 Fees per transaction 0 0 0 0 06 Penalty for early withdrawal 0 0 0 0 07 Minimum account balance 0 0 0 0 08 Withdrawal frequency (average per period) 0 0 0 0 0 9 Deposit frequency (average per period) 0 0 0 0 0 10 Number of active individual savings accounts 0 0 0 0 0 11 Number of inactive individual accounts 0 0 0 0 0 12 Total individual account balance, end of period 0 0 0 0 013
0.0% 0.0% 0.0% 0.0% 0.0%
14 Average individual account balance (mean) 0 0 0 0 015 Number of active institutional savings accounts 0 0 0 0 0 16 Number of inactive institutional accounts 0 0 0 0 0 17 Total institutional account balance, end of period 0 0 0 0 018
0.0% 0.0% 0.0% 0.0% 0.0%
19 Average institutional account balance (mean) 0 0 0 0 0Savings Product 13 Dec 2003 Dec 2004 Dec 2005 Dec 2006 Dec 2007
1 Interest Rate (%) and calculation method 0.0% 0.0% 0.0% 0.0% 0.0%2 Minimum deposit to open account 0 0 0 0 0
Individual account balance as percentage of total savings balance
Institutional account balance as percentage of total savings balance
Individual account balance as percentage of total savings balance
Institutional account balance as percentage of total savings balance
Individual account balance as percentage of total savings balance
Institutional account balance as percentage of total savings balance
3 Fees to open account 0 0 0 0 04 Minimum deposit per transaction 0 0 0 0 05 Fees per transaction 0 0 0 0 06 Penalty for early withdrawal 0 0 0 0 07 Minimum account balance 0 0 0 0 08 Withdrawal frequency (average per period) 0 0 0 0 0 9 Deposit frequency (average per period) 0 0 0 0 0 10 Number of active individual savings accounts 0 0 0 0 0 11 Number of inactive individual accounts 0 0 0 0 0 12 Total individual account balance, end of period 0 0 0 0 013
0.0% 0.0% 0.0% 0.0% 0.0%
14 Average individual account balance (mean) 0 0 0 0 015 Number of active institutional savings accounts 0 0 0 0 0 16 Number of inactive institutional accounts 0 0 0 0 0 17 Total institutional account balance, end of period 0 0 0 0 018
0.0% 0.0% 0.0% 0.0% 0.0%
19 Average institutional account balance (mean) 0 0 0 0 0Savings Product 14 Dec 2003 Dec 2004 Dec 2005 Dec 2006 Dec 2007
1 Interest Rate (%) and calculation method 0.0% 0.0% 0.0% 0.0% 0.0%2 Minimum deposit to open account 0 0 0 0 03 Fees to open account 0 0 0 0 04 Minimum deposit per transaction 0 0 0 0 05 Fees per transaction 0 0 0 0 06 Penalty for early withdrawal 0 0 0 0 07 Minimum account balance 0 0 0 0 08 Withdrawal frequency (average per period) 0 0 0 0 0 9 Deposit frequency (average per period) 0 0 0 0 0 10 Number of active individual savings accounts 0 0 0 0 0 11 Number of inactive individual accounts 0 0 0 0 0 12 Total individual account balance, end of period 0 0 0 0 013
0.0% 0.0% 0.0% 0.0% 0.0%
14 Average individual account balance (mean) 0 0 0 0 015 Number of active institutional savings accounts 0 0 0 0 0 16 Number of inactive institutional accounts 0 0 0 0 0 17 Total institutional account balance, end of period 0 0 0 0 018
0.0% 0.0% 0.0% 0.0% 0.0%
19 Average institutional account balance (mean) 0 0 0 0 0Savings Product 15 Dec 2003 Dec 2004 Dec 2005 Dec 2006 Dec 2007
1 Interest Rate (%) and calculation method 0.0% 0.0% 0.0% 0.0% 0.0%2 Minimum deposit to open account 0 0 0 0 03 Fees to open account 0 0 0 0 04 Minimum deposit per transaction 0 0 0 0 05 Fees per transaction 0 0 0 0 06 Penalty for early withdrawal 0 0 0 0 07 Minimum account balance 0 0 0 0 08 Withdrawal frequency (average per period) 0 0 0 0 0 9 Deposit frequency (average per period) 0 0 0 0 0 10 Number of active individual savings accounts 0 0 0 0 0 11 Number of inactive individual accounts 0 0 0 0 0 12 Total individual account balance, end of period 0 0 0 0 013
0.0% 0.0% 0.0% 0.0% 0.0%
14 Average individual account balance (mean) 0 0 0 0 015 Number of active institutional savings accounts 0 0 0 0 0 16 Number of inactive institutional accounts 0 0 0 0 0 17 Total institutional account balance, end of period 0 0 0 0 018
0.0% 0.0% 0.0% 0.0% 0.0%
19 Average institutional account balance (mean) 0 0 0 0 0
Loan Product 1 Dec 2003 Dec 2004 Dec 2005 Dec 2006 Dec 2007
Individual account balance as percentage of total savings balance
Institutional account balance as percentage of total savings balance
Individual account balance as percentage of total savings balance
Institutional account balance as percentage of total savings balance
Individual account balance as percentage of total savings balance
Institutional account balance as percentage of total savings balance
Table 4.3 Loan Products Summary
1 Initial amount 0 0 0 0 02 Increment / Maximum 0 0 0 0 03 Term 0 0 0 0 0 4 Repayment frequency 0 0 0 0 0 5 Interest rate 0.0% 0.0% 0.0% 0.0% 0.0%6 Commissions and fees 0 0 0 0 07 Guarantees and collateral 0 0 0 0 08 Theoretical interest yield (APR) 0% 0% 0% 0% 0%9 Savings requirement (if any) 0 0 0 0 010 Number of active loans (clients), end of period 0 0 0 0 0 11 Average principle balance per client 0 0 0 0 012 Median principal balance per client 0 0 0 0 013 Average principal balance outstanding, over period 0 0 0 0 014 Total principal balance outstanding, end of period 0 0 0 0 015 Percentage of total loan balance 0.0% 0.0% 0.0% 0.0% 0.0%16
Total outstanding balance associated with loans that are:
On time (and never renegotiated) 0 0 0 0 0
Overdue 1 to 30 days (and never renegotiated) 0 0 0 0 0
Overdue 31 to 90 days (and never renegotiated) 0 0 0 0 0
Overdue 91 to 180 days (and never renegotiated) 0 0 0 0 0
Overdue 181 to 365 days (and never renegotiated) 0 0 0 0 0
Overdue over 365 days (and never renegotiated) 0 0 0 0 0
Renegotiated loans - On time 0 0 0 0 0
Renegotiated loans - overdue 1 to 30 days 0 0 0 0 0
Renegotiated loans - overdue 31 to 90 days 0 0 0 0 0
Renegotiated loans - overdue 91 to 180 days 0 0 0 0 0
Renegotiated loans - overdue 181-365 days 0 0 0 0 0
Renegotiated loans - overdue over 365 days 0 0 0 0 0Loan Product 2 Dec 2003 Dec 2004 Dec 2005 Dec 2006 Dec 2007
1 Initial amount 0 0 0 0 02 Increment / Maximum 0 0 0 0 03 Term 0 0 0 0 0 4 Repayment frequency 0 0 0 0 0 5 Interest rate 0.0% 0.0% 0.0% 0.0% 0.0%6 Commissions and fees 0 0 0 0 07 Guarantees and collateral 0 0 0 0 08 Theoretical interest yield (APR) 0% 0% 0% 0% 0%9 Savings requirement (if any) 0 0 0 0 010 Number of active loans (clients), end of period 0 0 0 0 0 11 Average principle balance per client 0 0 0 0 012 Median principal balance per client 0 0 0 0 013 Average principal balance outstanding, over period 0 0 0 0 014 Total principal balance outstanding, end of period 0 0 0 0 015 Percentage of total loan balance 0.0% 0.0% 0.0% 0.0% 0.0%16
Total outstanding balance associated with loans that are:
On time (and never renegotiated) 0 0 0 0 0
Overdue 1 to 30 days (and never renegotiated) 0 0 0 0 0
Overdue 31 to 90 days (and never renegotiated) 0 0 0 0 0
Overdue 91 to 180 days (and never renegotiated) 0 0 0 0 0
Overdue 181 to 365 days (and never renegotiated) 0 0 0 0 0
Overdue over 365 days (and never renegotiated) 0 0 0 0 0
Renegotiated loans - On time 0 0 0 0 0
Renegotiated loans - overdue 1 to 30 days 0 0 0 0 0
Renegotiated loans - overdue 31 to 90 days 0 0 0 0 0
Renegotiated loans - overdue 91 to 180 days 0 0 0 0 0
Renegotiated loans - overdue 181-365 days 0 0 0 0 0
Renegotiated loans - overdue over 365 days 0 0 0 0 0Loan Product 3 Dec 2003 Dec 2004 Dec 2005 Dec 2006 Dec 2007
1 Initial amount 0 0 0 0 02 Increment / Maximum 0 0 0 0 03 Term 0 0 0 0 0 4 Repayment frequency 0 0 0 0 0 5 Interest rate 0.0% 0.0% 0.0% 0.0% 0.0%6 Commissions and fees 0 0 0 0 0

7 Guarantees and collateral 0 0 0 0 08 Theoretical interest yield (APR) 0% 0% 0% 0% 0%9 Savings requirement (if any) 0 0 0 0 010 Number of active loans (clients), end of period 0 0 0 0 0 11 Average principle balance per client 0 0 0 0 012 Median principal balance per client 0 0 0 0 013 Average principal balance outstanding, over period 0 0 0 0 014 Total principal balance outstanding, end of period 0 0 0 0 015 Percentage of total loan balance 0.0% 0.0% 0.0% 0.0% 0.0%16
Total outstanding balance associated with loans that are:
On time (and never renegotiated) 0 0 0 0 0
Overdue 1 to 30 days (and never renegotiated) 0 0 0 0 0
Overdue 31 to 90 days (and never renegotiated) 0 0 0 0 0
Overdue 91 to 180 days (and never renegotiated) 0 0 0 0 0
Overdue 181 to 365 days (and never renegotiated) 0 0 0 0 0
Overdue over 365 days (and never renegotiated) 0 0 0 0 0
Renegotiated loans - On time 0 0 0 0 0
Renegotiated loans - overdue 1 to 30 days 0 0 0 0 0
Renegotiated loans - overdue 31 to 90 days 0 0 0 0 0
Renegotiated loans - overdue 91 to 180 days 0 0 0 0 0
Renegotiated loans - overdue 181-365 days 0 0 0 0 0
Renegotiated loans - overdue over 365 days 0 0 0 0 0Loan Product 4 Dec 2003 Dec 2004 Dec 2005 Dec 2006 Dec 2007
1 Initial amount 0 0 0 0 02 Increment / Maximum 0 0 0 0 03 Term 0 0 0 0 0 4 Repayment frequency 0 0 0 0 0 5 Interest rate 0.0% 0.0% 0.0% 0.0% 0.0%6 Commissions and fees 0 0 0 0 07 Guarantees and collateral 0 0 0 0 08 Theoretical interest yield (APR) 0% 0% 0% 0% 0%9 Savings requirement (if any) 0 0 0 0 010 Number of active loans (clients), end of period 0 0 0 0 0 11 Average principle balance per client 0 0 0 0 012 Median principal balance per client 0 0 0 0 013 Average principal balance outstanding, over period 0 0 0 0 014 Total principal balance outstanding, end of period 0 0 0 0 015 Percentage of total loan balance 0.0% 0.0% 0.0% 0.0% 0.0%16
Total outstanding balance associated with loans that are:
On time (and never renegotiated) 0 0 0 0 0
Overdue 1 to 30 days (and never renegotiated) 0 0 0 0 0
Overdue 31 to 90 days (and never renegotiated) 0 0 0 0 0
Overdue 91 to 180 days (and never renegotiated) 0 0 0 0 0
Overdue 181 to 365 days (and never renegotiated) 0 0 0 0 0
Overdue over 365 days (and never renegotiated) 0 0 0 0 0
Renegotiated loans - On time 0 0 0 0 0
Renegotiated loans - overdue 1 to 30 days 0 0 0 0 0
Renegotiated loans - overdue 31 to 90 days 0 0 0 0 0
Renegotiated loans - overdue 91 to 180 days 0 0 0 0 0
Renegotiated loans - overdue 181-365 days 0 0 0 0 0
Renegotiated loans - overdue over 365 days 0 0 0 0 0Loan Product 5 Dec 2003 Dec 2004 Dec 2005 Dec 2006 Dec 2007
1 Initial amount 0 0 0 0 02 Increment / Maximum 0 0 0 0 03 Term 0 0 0 0 0 4 Repayment frequency 0 0 0 0 0 5 Interest rate 0.0% 0.0% 0.0% 0.0% 0.0%6 Commissions and fees 0 0 0 0 07 Guarantees and collateral 0 0 0 0 08 Theoretical interest yield (APR) 0% 0% 0% 0% 0%9 Savings requirement (if any) 0 0 0 0 010 Number of active loans (clients), end of period 0 0 0 0 0 11 Average principle balance per client 0 0 0 0 012 Median principal balance per client 0 0 0 0 0
13 Average principal balance outstanding, over period 0 0 0 0 014 Total principal balance outstanding, end of period 0 0 0 0 015 Percentage of total loan balance 0.0% 0.0% 0.0% 0.0% 0.0%16
Total outstanding balance associated with loans that are:
On time (and never renegotiated) 0 0 0 0 0
Overdue 1 to 30 days (and never renegotiated) 0 0 0 0 0
Overdue 31 to 90 days (and never renegotiated) 0 0 0 0 0
Overdue 91 to 180 days (and never renegotiated) 0 0 0 0 0
Overdue 181 to 365 days (and never renegotiated) 0 0 0 0 0
Overdue over 365 days (and never renegotiated) 0 0 0 0 0
Renegotiated loans - On time 0 0 0 0 0
Renegotiated loans - overdue 1 to 30 days 0 0 0 0 0
Renegotiated loans - overdue 31 to 90 days 0 0 0 0 0
Renegotiated loans - overdue 91 to 180 days 0 0 0 0 0
Renegotiated loans - overdue 181-365 days 0 0 0 0 0
Renegotiated loans - overdue over 365 days 0 0 0 0 0Loan Product 6 Dec 2003 Dec 2004 Dec 2005 Dec 2006 Dec 2007
1 Initial amount 0 0 0 0 02 Increment / Maximum 0 0 0 0 03 Term 0 0 0 0 0 4 Repayment frequency 0 0 0 0 0 5 Interest rate 0.0% 0.0% 0.0% 0.0% 0.0%6 Commissions and fees 0 0 0 0 07 Guarantees and collateral 0 0 0 0 08 Theoretical interest yield (APR) 0% 0% 0% 0% 0%9 Savings requirement (if any) 0 0 0 0 010 Number of active loans (clients), end of period 0 0 0 0 0 11 Average principle balance per client 0 0 0 0 012 Median principal balance per client 0 0 0 0 013 Average principal balance outstanding, over period 0 0 0 0 014 Total principal balance outstanding, end of period 0 0 0 0 015 Percentage of total loan balance 0.0% 0.0% 0.0% 0.0% 0.0%16
Total outstanding balance associated with loans that are:
On time (and never renegotiated) 0 0 0 0 0
Overdue 1 to 30 days (and never renegotiated) 0 0 0 0 0
Overdue 31 to 90 days (and never renegotiated) 0 0 0 0 0
Overdue 91 to 180 days (and never renegotiated) 0 0 0 0 0
Overdue 181 to 365 days (and never renegotiated) 0 0 0 0 0
Overdue over 365 days (and never renegotiated) 0 0 0 0 0
Renegotiated loans - On time 0 0 0 0 0
Renegotiated loans - overdue 1 to 30 days 0 0 0 0 0
Renegotiated loans - overdue 31 to 90 days 0 0 0 0 0
Renegotiated loans - overdue 91 to 180 days 0 0 0 0 0
Renegotiated loans - overdue 181-365 days 0 0 0 0 0
Renegotiated loans - overdue over 365 days 0 0 0 0 0Loan Product 7 Dec 2003 Dec 2004 Dec 2005 Dec 2006 Dec 2007
1 Initial amount 0 0 0 0 02 Increment / Maximum 0 0 0 0 03 Term 0 0 0 0 0 4 Repayment frequency 0 0 0 0 0 5 Interest rate 0.0% 0.0% 0.0% 0.0% 0.0%6 Commissions and fees 0 0 0 0 07 Guarantees and collateral 0 0 0 0 08 Theoretical interest yield (APR) 0% 0% 0% 0% 0%9 Savings requirement (if any) 0 0 0 0 010 Number of active loans (clients), end of period 0 0 0 0 0 11 Average principle balance per client 0 0 0 0 012 Median principal balance per client 0 0 0 0 013 Average principal balance outstanding, over period 0 0 0 0 014 Total principal balance outstanding, end of period 0 0 0 0 015 Percentage of total loan balance 0.0% 0.0% 0.0% 0.0% 0.0%16
Total outstanding balance associated with loans that are:
On time (and never renegotiated) 0 0 0 0 0
Overdue 1 to 30 days (and never renegotiated) 0 0 0 0 0
Overdue 31 to 90 days (and never renegotiated) 0 0 0 0 0
Overdue 91 to 180 days (and never renegotiated) 0 0 0 0 0
Overdue 181 to 365 days (and never renegotiated) 0 0 0 0 0
Overdue over 365 days (and never renegotiated) 0 0 0 0 0
Renegotiated loans - On time 0 0 0 0 0
Renegotiated loans - overdue 1 to 30 days 0 0 0 0 0
Renegotiated loans - overdue 31 to 90 days 0 0 0 0 0
Renegotiated loans - overdue 91 to 180 days 0 0 0 0 0
Renegotiated loans - overdue 181-365 days 0 0 0 0 0
Renegotiated loans - overdue over 365 days 0 0 0 0 0Loan Product 8 Dec 2003 Dec 2004 Dec 2005 Dec 2006 Dec 2007
1 Initial amount 0 0 0 0 02 Increment / Maximum 0 0 0 0 03 Term 0 0 0 0 0 4 Repayment frequency 0 0 0 0 0 5 Interest rate 0.0% 0.0% 0.0% 0.0% 0.0%6 Commissions and fees 0 0 0 0 07 Guarantees and collateral 0 0 0 0 08 Theoretical interest yield (APR) 0% 0% 0% 0% 0%9 Savings requirement (if any) 0 0 0 0 010 Number of active loans (clients), end of period 0 0 0 0 0 11 Average principle balance per client 0 0 0 0 012 Median principal balance per client 0 0 0 0 013 Average principal balance outstanding, over period 0 0 0 0 014 Total principal balance outstanding, end of period 0 0 0 0 015 Percentage of total loan balance 0.0% 0.0% 0.0% 0.0% 0.0%16
Total outstanding balance associated with loans that are:
On time (and never renegotiated) 0 0 0 0 0
Overdue 1 to 30 days (and never renegotiated) 0 0 0 0 0
Overdue 31 to 90 days (and never renegotiated) 0 0 0 0 0
Overdue 91 to 180 days (and never renegotiated) 0 0 0 0 0
Overdue 181 to 365 days (and never renegotiated) 0 0 0 0 0
Overdue over 365 days (and never renegotiated) 0 0 0 0 0
Renegotiated loans - On time 0 0 0 0 0
Renegotiated loans - overdue 1 to 30 days 0 0 0 0 0
Renegotiated loans - overdue 31 to 90 days 0 0 0 0 0
Renegotiated loans - overdue 91 to 180 days 0 0 0 0 0
Renegotiated loans - overdue 181-365 days 0 0 0 0 0
Renegotiated loans - overdue over 365 days 0 0 0 0 0Loan Product 9 Dec 2003 Dec 2004 Dec 2005 Dec 2006 Dec 2007
1 Initial amount 0 0 0 0 02 Increment / Maximum 0 0 0 0 03 Term 0 0 0 0 0 4 Repayment frequency 0 0 0 0 0 5 Interest rate 0.0% 0.0% 0.0% 0.0% 0.0%6 Commissions and fees 0 0 0 0 07 Guarantees and collateral 0 0 0 0 08 Theoretical interest yield (APR) 0% 0% 0% 0% 0%9 Savings requirement (if any) 0 0 0 0 010 Number of active loans (clients), end of period 0 0 0 0 0 11 Average principle balance per client 0 0 0 0 012 Median principal balance per client 0 0 0 0 013 Average principal balance outstanding, over period 0 0 0 0 014 Total principal balance outstanding, end of period 0 0 0 0 015 Percentage of total loan balance 0.0% 0.0% 0.0% 0.0% 0.0%16
Total outstanding balance associated with loans that are:
On time (and never renegotiated) 0 0 0 0 0
Overdue 1 to 30 days (and never renegotiated) 0 0 0 0 0
Overdue 31 to 90 days (and never renegotiated) 0 0 0 0 0
Overdue 91 to 180 days (and never renegotiated) 0 0 0 0 0
Overdue 181 to 365 days (and never renegotiated) 0 0 0 0 0
Overdue over 365 days (and never renegotiated) 0 0 0 0 0
Renegotiated loans - On time 0 0 0 0 0

Renegotiated loans - overdue 1 to 30 days 0 0 0 0 0
Renegotiated loans - overdue 31 to 90 days 0 0 0 0 0
Renegotiated loans - overdue 91 to 180 days 0 0 0 0 0
Renegotiated loans - overdue 181-365 days 0 0 0 0 0
Renegotiated loans - overdue over 365 days 0 0 0 0 0Loan Product 10 Dec 2003 Dec 2004 Dec 2005 Dec 2006 Dec 2007
1 Initial amount 0 0 0 0 02 Increment / Maximum 0 0 0 0 03 Term 0 0 0 0 0 4 Repayment frequency 0 0 0 0 0 5 Interest rate 0.0% 0.0% 0.0% 0.0% 0.0%6 Commissions and fees 0 0 0 0 07 Guarantees and collateral 0 0 0 0 08 Theoretical interest yield (APR) 0% 0% 0% 0% 0%9 Savings requirement (if any) 0 0 0 0 010 Number of active loans (clients), end of period 0 0 0 0 0 11 Average principle balance per client 0 0 0 0 012 Median principal balance per client 0 0 0 0 013 Average principal balance outstanding, over period 0 0 0 0 014 Total principal balance outstanding, end of period 0 0 0 0 015 Percentage of total loan balance 0.0% 0.0% 0.0% 0.0% 0.0%16
Total outstanding balance associated with loans that are:
On time (and never renegotiated) 0 0 0 0 0
Overdue 1 to 30 days (and never renegotiated) 0 0 0 0 0
Overdue 31 to 90 days (and never renegotiated) 0 0 0 0 0
Overdue 91 to 180 days (and never renegotiated) 0 0 0 0 0
Overdue 181 to 365 days (and never renegotiated) 0 0 0 0 0
Overdue over 365 days (and never renegotiated) 0 0 0 0 0
Renegotiated loans - On time 0 0 0 0 0
Renegotiated loans - overdue 1 to 30 days 0 0 0 0 0
Renegotiated loans - overdue 31 to 90 days 0 0 0 0 0
Renegotiated loans - overdue 91 to 180 days 0 0 0 0 0
Renegotiated loans - overdue 181-365 days 0 0 0 0 0
Renegotiated loans - overdue over 365 days 0 0 0 0 0Loan Product 11 Dec 2003 Dec 2004 Dec 2005 Dec 2006 Dec 2007
1 Initial amount 0 0 0 0 02 Increment / Maximum 0 0 0 0 03 Term 0 0 0 0 0 4 Repayment frequency 0 0 0 0 0 5 Interest rate 0.0% 0.0% 0.0% 0.0% 0.0%6 Commissions and fees 0 0 0 0 07 Guarantees and collateral 0 0 0 0 08 Theoretical interest yield (APR) 0% 0% 0% 0% 0%9 Savings requirement (if any) 0 0 0 0 010 Number of active loans (clients), end of period 0 0 0 0 0 11 Average principle balance per client 0 0 0 0 012 Median principal balance per client 0 0 0 0 013 Average principal balance outstanding, over period 0 0 0 0 014 Total principal balance outstanding, end of period 0 0 0 0 015 Percentage of total loan balance 0.0% 0.0% 0.0% 0.0% 0.0%16
Total outstanding balance associated with loans that are:
On time (and never renegotiated) 0 0 0 0 0
Overdue 1 to 30 days (and never renegotiated) 0 0 0 0 0
Overdue 31 to 90 days (and never renegotiated) 0 0 0 0 0
Overdue 91 to 180 days (and never renegotiated) 0 0 0 0 0
Overdue 181 to 365 days (and never renegotiated) 0 0 0 0 0
Overdue over 365 days (and never renegotiated) 0 0 0 0 0
Renegotiated loans - On time 0 0 0 0 0
Renegotiated loans - overdue 1 to 30 days 0 0 0 0 0
Renegotiated loans - overdue 31 to 90 days 0 0 0 0 0
Renegotiated loans - overdue 91 to 180 days 0 0 0 0 0
Renegotiated loans - overdue 181-365 days 0 0 0 0 0
Renegotiated loans - overdue over 365 days 0 0 0 0 0Loan Product 12 Dec 2003 Dec 2004 Dec 2005 Dec 2006 Dec 2007
1 Initial amount 0 0 0 0 02 Increment / Maximum 0 0 0 0 03 Term 0 0 0 0 0 4 Repayment frequency 0 0 0 0 0 5 Interest rate 0.0% 0.0% 0.0% 0.0% 0.0%6 Commissions and fees 0 0 0 0 07 Guarantees and collateral 0 0 0 0 08 Theoretical interest yield (APR) 0% 0% 0% 0% 0%9 Savings requirement (if any) 0 0 0 0 010 Number of active loans (clients), end of period 0 0 0 0 0 11 Average principle balance per client 0 0 0 0 012 Median principal balance per client 0 0 0 0 013 Average principal balance outstanding, over period 0 0 0 0 014 Total principal balance outstanding, end of period 0 0 0 0 015 Percentage of total loan balance 0.0% 0.0% 0.0% 0.0% 0.0%16
Total outstanding balance associated with loans that are:
On time (and never renegotiated) 0 0 0 0 0
Overdue 1 to 30 days (and never renegotiated) 0 0 0 0 0
Overdue 31 to 90 days (and never renegotiated) 0 0 0 0 0
Overdue 91 to 180 days (and never renegotiated) 0 0 0 0 0
Overdue 181 to 365 days (and never renegotiated) 0 0 0 0 0
Overdue over 365 days (and never renegotiated) 0 0 0 0 0
Renegotiated loans - On time 0 0 0 0 0
Renegotiated loans - overdue 1 to 30 days 0 0 0 0 0
Renegotiated loans - overdue 31 to 90 days 0 0 0 0 0
Renegotiated loans - overdue 91 to 180 days 0 0 0 0 0
Renegotiated loans - overdue 181-365 days 0 0 0 0 0
Renegotiated loans - overdue over 365 days 0 0 0 0 0Loan Product 13 Dec 2003 Dec 2004 Dec 2005 Dec 2006 Dec 2007
1 Initial amount 0 0 0 0 02 Increment / Maximum 0 0 0 0 03 Term 0 0 0 0 0 4 Repayment frequency 0 0 0 0 0 5 Interest rate 0.0% 0.0% 0.0% 0.0% 0.0%6 Commissions and fees 0 0 0 0 07 Guarantees and collateral 0 0 0 0 08 Theoretical interest yield (APR) 0% 0% 0% 0% 0%9 Savings requirement (if any) 0 0 0 0 010 Number of active loans (clients), end of period 0 0 0 0 0 11 Average principle balance per client 0 0 0 0 012 Median principal balance per client 0 0 0 0 013 Average principal balance outstanding, over period 0 0 0 0 014 Total principal balance outstanding, end of period 0 0 0 0 015 Percentage of total loan balance 0.0% 0.0% 0.0% 0.0% 0.0%16
Total outstanding balance associated with loans that are:
On time (and never renegotiated) 0 0 0 0 0
Overdue 1 to 30 days (and never renegotiated) 0 0 0 0 0
Overdue 31 to 90 days (and never renegotiated) 0 0 0 0 0
Overdue 91 to 180 days (and never renegotiated) 0 0 0 0 0
Overdue 181 to 365 days (and never renegotiated) 0 0 0 0 0
Overdue over 365 days (and never renegotiated) 0 0 0 0 0
Renegotiated loans - On time 0 0 0 0 0
Renegotiated loans - overdue 1 to 30 days 0 0 0 0 0
Renegotiated loans - overdue 31 to 90 days 0 0 0 0 0
Renegotiated loans - overdue 91 to 180 days 0 0 0 0 0
Renegotiated loans - overdue 181-365 days 0 0 0 0 0
Renegotiated loans - overdue over 365 days 0 0 0 0 0Loan Product 14 Dec 2003 Dec 2004 Dec 2005 Dec 2006 Dec 2007
1 Initial amount 0 0 0 0 02 Increment / Maximum 0 0 0 0 03 Term 0 0 0 0 0 4 Repayment frequency 0 0 0 0 0 5 Interest rate 0.0% 0.0% 0.0% 0.0% 0.0%6 Commissions and fees 0 0 0 0 0
7 Guarantees and collateral 0 0 0 0 08 Theoretical interest yield (APR) 0% 0% 0% 0% 0%9 Savings requirement (if any) 0 0 0 0 010 Number of active loans (clients), end of period 0 0 0 0 0 11 Average principle balance per client 0 0 0 0 012 Median principal balance per client 0 0 0 0 013 Average principal balance outstanding, over period 0 0 0 0 014 Total principal balance outstanding, end of period 0 0 0 0 015 Percentage of total loan balance 0.0% 0.0% 0.0% 0.0% 0.0%16
Total outstanding balance associated with loans that are:
On time (and never renegotiated) 0 0 0 0 0
Overdue 1 to 30 days (and never renegotiated) 0 0 0 0 0
Overdue 31 to 90 days (and never renegotiated) 0 0 0 0 0
Overdue 91 to 180 days (and never renegotiated) 0 0 0 0 0
Overdue 181 to 365 days (and never renegotiated) 0 0 0 0 0
Overdue over 365 days (and never renegotiated) 0 0 0 0 0
Renegotiated loans - On time 0 0 0 0 0
Renegotiated loans - overdue 1 to 30 days 0 0 0 0 0
Renegotiated loans - overdue 31 to 90 days 0 0 0 0 0
Renegotiated loans - overdue 91 to 180 days 0 0 0 0 0
Renegotiated loans - overdue 181-365 days 0 0 0 0 0
Renegotiated loans - overdue over 365 days 0 0 0 0 0Loan Product 15 Dec 2003 Dec 2004 Dec 2005 Dec 2006 Dec 2007
1 Initial amount 0 0 0 0 02 Increment / Maximum 0 0 0 0 03 Term 0 0 0 0 0 4 Repayment frequency 0 0 0 0 0 5 Interest rate 0.0% 0.0% 0.0% 0.0% 0.0%6 Commissions and fees 0 0 0 0 07 Guarantees and collateral 0 0 0 0 08 Theoretical interest yield (APR) 0% 0% 0% 0% 0%9 Savings requirement (if any) 0 0 0 0 010 Number of active loans (clients), end of period 0 0 0 0 0 11 Average principle balance per client 0 0 0 0 012 Median principal balance per client 0 0 0 0 013 Average principal balance outstanding, over period 0 0 0 0 014 Total principal balance outstanding, end of period 0 0 0 0 015 Percentage of total loan balance 0.0% 0.0% 0.0% 0.0% 0.0%16
Total outstanding balance associated with loans that are:
On time (and never renegotiated) 0 0 0 0 0
Overdue 1 to 30 days (and never renegotiated) 0 0 0 0 0
Overdue 31 to 90 days (and never renegotiated) 0 0 0 0 0
Overdue 91 to 180 days (and never renegotiated) 0 0 0 0 0
Overdue 181 to 365 days (and never renegotiated) 0 0 0 0 0
Overdue over 365 days (and never renegotiated) 0 0 0 0 0
Renegotiated loans - On time 0 0 0 0 0
Renegotiated loans - overdue 1 to 30 days 0 0 0 0 0
Renegotiated loans - overdue 31 to 90 days 0 0 0 0 0
Renegotiated loans - overdue 91 to 180 days 0 0 0 0 0
Renegotiated loans - overdue 181-365 days 0 0 0 0 0
Renegotiated loans - overdue over 365 days 0 0 0 0 0
Dec 2003 Dec 2004 % Change Dec 2005 % Change
1 Population of region(s) covered 0 0 0.0% 0 0.0%2 Market size (if available) 0 0 0.0% 0 0.0%
Breadth of Outreach3 Total number of active clients (end of period) 0 0 0.0% 0 0.0%4 Total number of loan clients 0 0 0.0% 0 0.0%5 Total number of savings clients (voluntary) 0 0 0.0% 0 0.0%6 Percentage of clients who are women 0.0% 0.0% 0.0% 0.0% 0.0%7 Percentage of clients located in rural areas 0.0% 0.0% 0.0% 0.0% 0.0%
Depth of Outreach 8a
0.0% 0.0% 0.0% 0.0% 0.0%
8b0.0% 0.0% 0.0% 0.0% 0.0%
9 Mean loan balance as % of national poverty line or GNI 0.0% 0.0% 0.0% 0.0% 0.0%
100.0% 0.0% 0.0% 0.0% 0.0%
Table 5.1 Outreach Summary
Percentage of recent clients living below the national poverty line
Percentage of clients living on less than PPP adjusted US$1 per day
Mean voluntary savings balance as % of national poverty line or GNI
Financial Statements Dec 2003 Dec 2004 Dec 2005 Dec 2006
Table 7.1 Income Statement Dec 2003 Dec 2004 Dec 2005 Dec 2006
Financial Revenue 0 0 0 0
Financial Revenue from Loan Portfolio 0 0 0 0
Interest on Loan Portfolio 0 0 0 0
Fees and Commissions on Loan Portfolio 0 0 0 0
Financial Revenue from Investments 0 0 0 0
Other Operating Revenue 0 0 0 0
Financial Expense 0 0 0 0
Financial Expense on Funding Liabilities 0 0 0 0
Interest and Fee Expense on Deposits 0 0 0 0
Interest and Fee Expense on Borrowings 0 0 0 0
Other Financial Expense 0 0 0 0
Net Financial Income 0 0 0 0
Loan Impairment 0 0 0 0
Provision for Loan Impairment 0 0 0 0
Value of Loans Recovered 0 0 0 0
Operating Expense 0 0 0 0
Personnel Expense 0 0 0 0
Administrative Expense 0 0 0 0
Depreciation Expense 0 0 0 0
Other Administrative Expense 0 0 0 0
Net Operating Income 0 0 0 0
Net Non-Operating Income/(Expense) 0 0 0 0
Non-Operating Revenue 0 0 0 0
Non-Operating Expense 0 0 0 0
Net Income (Before Taxes and Donations) 0 0 0 0
Taxes 0 0 0 0
Net Income (After Taxes and Before Donations) 0 0 0 0
Donations 0 0 0 0
Donations for Loan Capital 0 0 0 0
Donations for Operating Expense 0 0 0 0
Net Income (After Taxes and Donations) 0 0 0 0
Table 7.2 Balance Sheet Dec 2003 Dec 2004 Dec 2005 Dec 2006
Assets
Cash and Due from Banks 0 0 0 0
Trade Investments 0 0 0 0
Net Loan Portfolio 0 0 0 0
Gross Loan Portfolio 0 0 0 0
Allowance for Impairment 0 0 0 0
Interest Receivable on Loan Portfolio 0 0 0 0
0 0 0 0
Other Investments 0 0 0 0
0 0 0 0
Fixed Assets 0 0 0 0
Accumulated Depreciation and Amortization 0 0 0 0
Total Assets 0 0 0 0
Liabilities
Demand Deposits: Voluntary savings 0 0 0 0
Demand Deposits: Forced savings 0 0 0 0
Short-Term Time Deposits 0 0 0 0
Short-Term Borrowings 0 0 0 0
Interest Payable on Funding Liabilities 0 0 0 0
Accounts Payable and Other Short-Term Liabilities 0 0 0 0
Long-Term Time Deposits 0 0 0 0
Long-Term Borrowings 0 0 0 0
Other Long-Term Liabilities 0 0 0 0
Total Liabilities 0 0 0 0
Equity
Paid-In Capital 0 0 0 0
Donated Equity 0 0 0 0
Prior Years 0 0 0 0
Current Year 0 0 0 0
Retained Earnings 0 0 0 0
Prior Years 0 0 0 0
Current Year 0 0 0 0
Reserves 0 0 0 0
Accounts Receivable and Other Assets
Net Fixed Assets

Other Equity Accounts 0 0 0 0
Adjustments to Equity 0 0 0 0
Total Equity 0 0 0 0
Does Balance Sheet balance? OK OK OK OK
Table 7.3 Cash Flow Statement (Direct) Dec 2003 Dec 2004 Dec 2005 Dec 2006
Cash Flows from Operating Activities
0 0 0 0
Cash Received from Interest on Investments 0 0 0 0
Cash Received as Other Operating Revenue 0 0 0 0
Value of Loans Repaid 0 0 0 0
(Cash Paid for Financial Expenses on Funding Liabilities) 0 0 0 0
(Cash Paid for Other Financial Expenses) 0 0 0 0
(Cash Paid for Operating Expenses) 0 0 0 0
(Cash Paid for Taxes) 0 0 0 0
(Value of Loans Disbursed) 0 0 0 0
Net (Purchase)/Sale of Trade Investments 0 0 0 0
Deposits/(Withdrawals) from Clients 0 0 0 0
Cash Received/(Paid) for Other Operating Assets and Liabilities 0 0 0 0
Net Cash from Operating Activities 0 0 0 0
Cash Flows from Investing Activities
Net (Purchase)/Sale of Other Investments 0 0 0 0
Net (Purchase)/Sale of Fixed Assets 0 0 0 0
Net Cash from Investing Activities 0 0 0 0
Cash Flows from Financing Activities
Net Cash Received /(Repaid) for Short- and Long-Term Borrowings 0 0 0 0
Issuance/(Repurchase) of Paid-In Capital 0 0 0 0
(Dividends Paid) 0 0 0 0
Donated Equity 0 0 0 0
Net Cash from Financing Activities 0 0 0 0
Net Cash Received/(Paid) for Non-Operating Activities 0 0 0 0
Net Change in Cash and Due from Banks 0 0 0 0
Cash and Due from Banks at the Beginning of the Period 0 0 0 0
Exchange Rate Gains/(Losses) on Cash and Cash Equivalents 0 0 0 0
Cash and Due from Banks at the End of Period 0 0 0 0
Cash Received from Interest, Fees, and Commissions on Loan Portfolio

Table 7.3 Cash Flow Statement (Indirect) Dec 2003 Dec 2004 Dec 2005 Dec 2006
Cash Flows from Operating Activities
Net Income (Before Taxes and Donations) 0 0 0 0
Depreciation and Amortization 0 0 0 0
Loan Impairment 0 0 0 0
Cash Paid for Taxes 0 0 0 0
Value of Loans Repaid 0 0 0 0
Value of Loans Disbursed 0 0 0 0
(Increase)/Decrease in Trade Investments 0 0 0 0
Increase/(Decrease) in Deposits 0 0 0 0
(Increase)/Decrease in Receivables and Other Assets 0 0 0 0
Increase/(Decrease) in Payables and Other Liabilities 0 0 0 0
Net Cash from Operating Activities 0 0 0 0
Cash Flows from Investing Activities
(Increase)/Decrease in Other Investments 0 0 0 0
(Increase)/Decrease in Book Value of Gross Fixed Assets 0 0 0 0
Net Cash from Investing Activities 0 0 0 0
Cash Flows from Financing Activities
Increase/(Decrease) in Short- and Long-term Borrowings 0 0 0 0
Increase/(Decrease) in Paid-In Capital 0 0 0 0
(Dividends Paid) 0 0 0 0
Donated Equity 0 0 0 0
Net Cash from Financing Activities 0 0 0 0
Net Cash Received/(Paid) for Non-Operating Activities 0 0 0 0
Net Change in Cash and Due from Banks 0 0 0 0
Cash and Due from Banks at the Beginning of the Period 0 0 0 0
Exchange Rate Gains/(Losses) on Cash and Cash Equivalents 0 0 0 0
Cash and Due from Banks at the End of Period 0 0 0 0
Dec 2007
Dec 2007
0
0
0
0
0
0
0
0
0
0
0
0
0
0
0
0
0
0
0
0
0
0
0
0
0
0
0
0

0
0
0
Dec 2007
0
0
0
0
0
0
0
0
0
0
0
0
0
0
0
0
0
0
0
0
0
0
0
0
0
0
0
0
0
0

0
0
0 OK
Dec 2007
0
0
0
0
0
0
0
0
0
0
0
0
0
0
0
0
0
0
0
0
0
0
0
0
0
0

Dec 2007
0
0
0
0
0
0
0
0
0
0
0
0
0
0
0
0
0
0
0
0
0
0
0
0
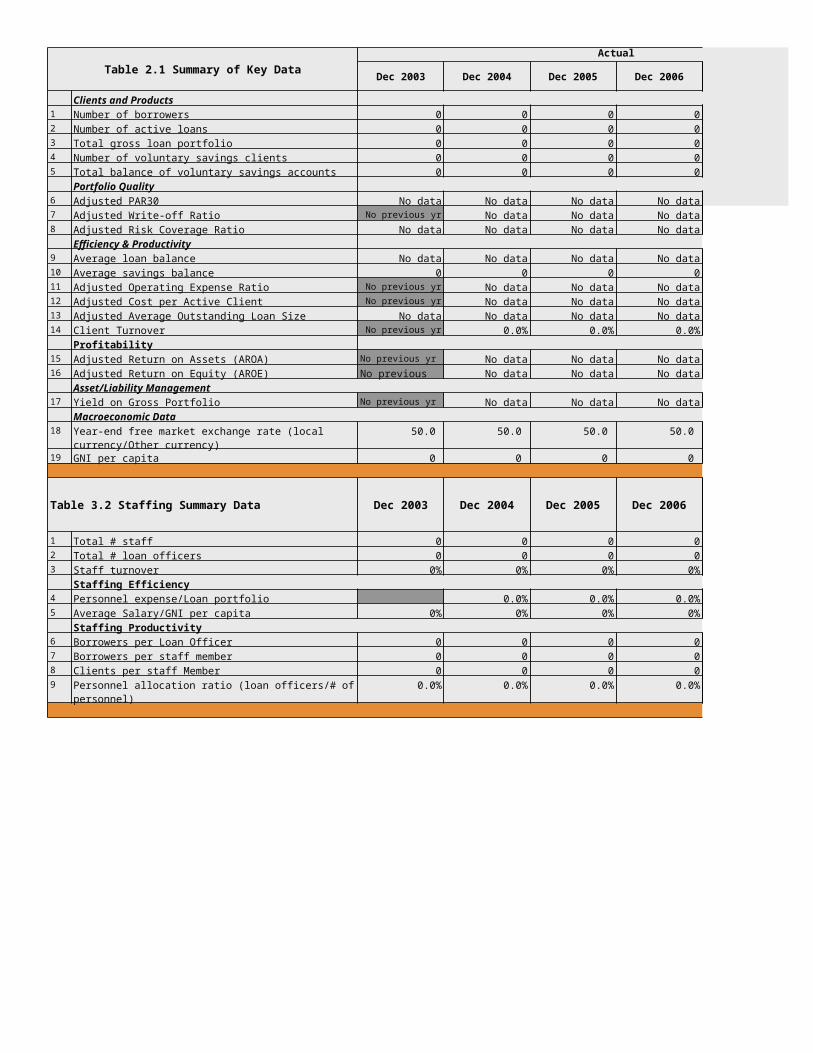
Dec 2003 Dec 2004 Dec 2005 Dec 2006 Dec 20071 Inflation rate 0.0% 0.0% 0.0% 0.0% 0.0%2 GDP Deflator 5.0% 5.0% 5.0% 5.0% 5.0%3 Market Rate for Borrowings (IMF statistics) 0.0% 0.0% 0.0% 0.0% 0.0%4 90-day certificate of deposit rate 0.0% 0.0% 0.0% 0.0% 0.0%5 Prime rate paid by commercial bank borrowers 0.0% 0.0% 0.0% 0.0% 0.0%6 Marginal commercial rate available to the MFI 0.0% 0.0% 0.0% 0.0% 0.0%7 Per capita GDP 0.0 0.0 0.0 0.0 0.0 8 Per capita GNI 0.0 0.0 0.0 0.0 0.0 9 Exchange rate (Local currency/Other currency) 50.0 50.0 50.0 50.0 50.0 10 National Poverty Line 0.0 0.0 0.0 0.0 0.0
Dec 2003 Dec 2004 Dec 2005 Dec 2006 Dec 20071 Subsidized Cost of Funds Adjustment 0 0 0 0 02 In-kind subsidy adjustment 0 0 0 0 03 Inflation Adjustment (3a minus 3b) 0 0 0 0 03a Equity accounts portion 0 0 0 0 03b Net fixed assets portion 0 0 0 0 04 Write-off Adjustment4a Portfolio at risk > 180 days 0 0 0 0 04b Number of loans > 180 days 0 0 0 0 05 Adjustment for Allowance for Impairment 0 0 0 0 0
BS and IS line items6 Unadjusted financial expense 0 0 0 0 07 Unadjusted net impairment expense 0 0 0 0 08 Unadjusted operating expense 0 0 0 0 09 Unadjusted net operating income 0 0 0 0 010 Unadjusted assets 0 0 0 0 011 Unadjusted equity 0 0 0 0 012 Unadjusted gross loan portfolio 0 0 0 0 013 Unadjusted number of loans outstanding 0 0 0 0 0
Adjusted BS and IS line items14 Adjusted financial expense 0 0 0 0 015 Adjusted net impairment expense 0 0 0 0 016 Adjusted operating expense 0 0 0 0 017 Adjusted net operating income 0 0 0 0 018 Adjusted assets 0 0 0 0 019 Adjusted equity 0 0 0 0 020 Adjusted gross loan portfolio 0 0 0 0 021 Adjusted number of loans outstanding 0 0 0 0 0
Table 7.6 Macroeconomic Data
Table 7.9 Analytical Adjustments
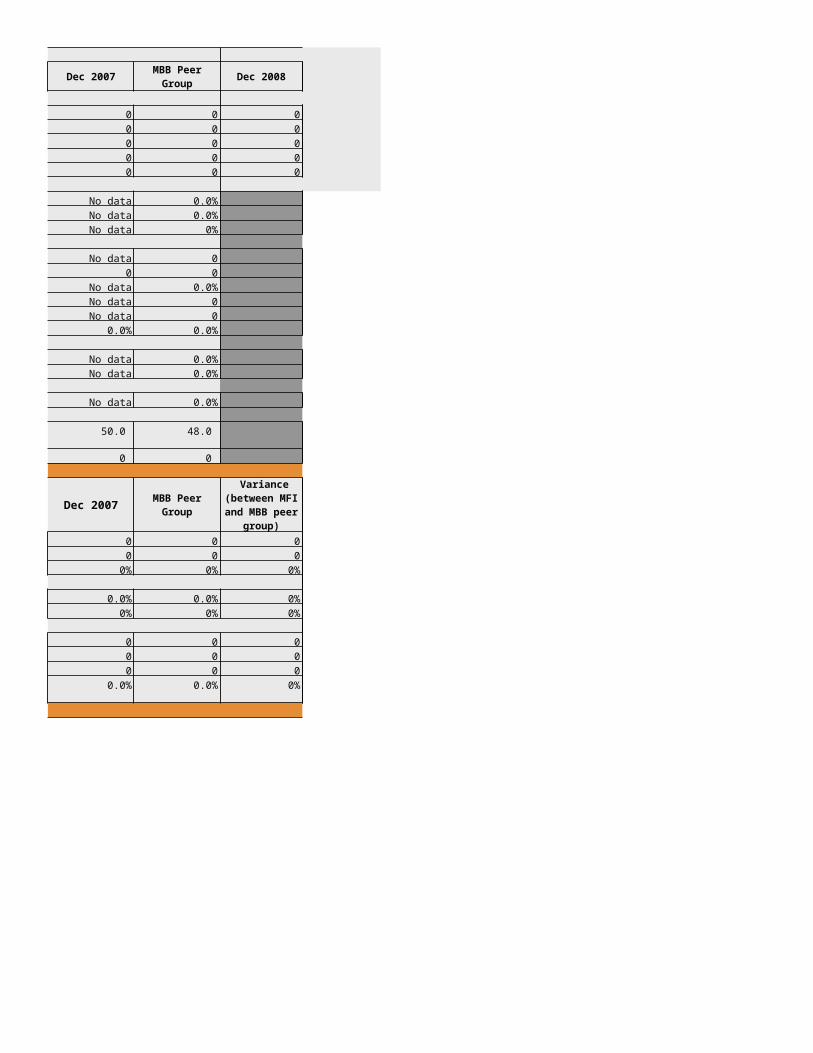
As of:Dec 2007
Liability 11 Creditor (specify if domestic or international)2 Commercial or non-commercial liability 3 Tenor (Term)4 Original principal balance 5 Balance outstanding 6 Currency in which repayment is due7 Interest rate8 Amortization schedule9
10 Other relevant informationLiability 21 Creditor (specify if domestic or international)2 Commercial or non-commercial liability 3 Tenor (Term)4 Original principal balance 5 Balance outstanding 6 Currency in which repayment is due7 Interest rate8 Amortization schedule9
10 Other relevant information
Table 7.4 Composition of Funding Liabilities
Details of external guarantee backing the credit extended to the MFI, if any
Details of external guarantee backing the credit extended to the MFI, if any
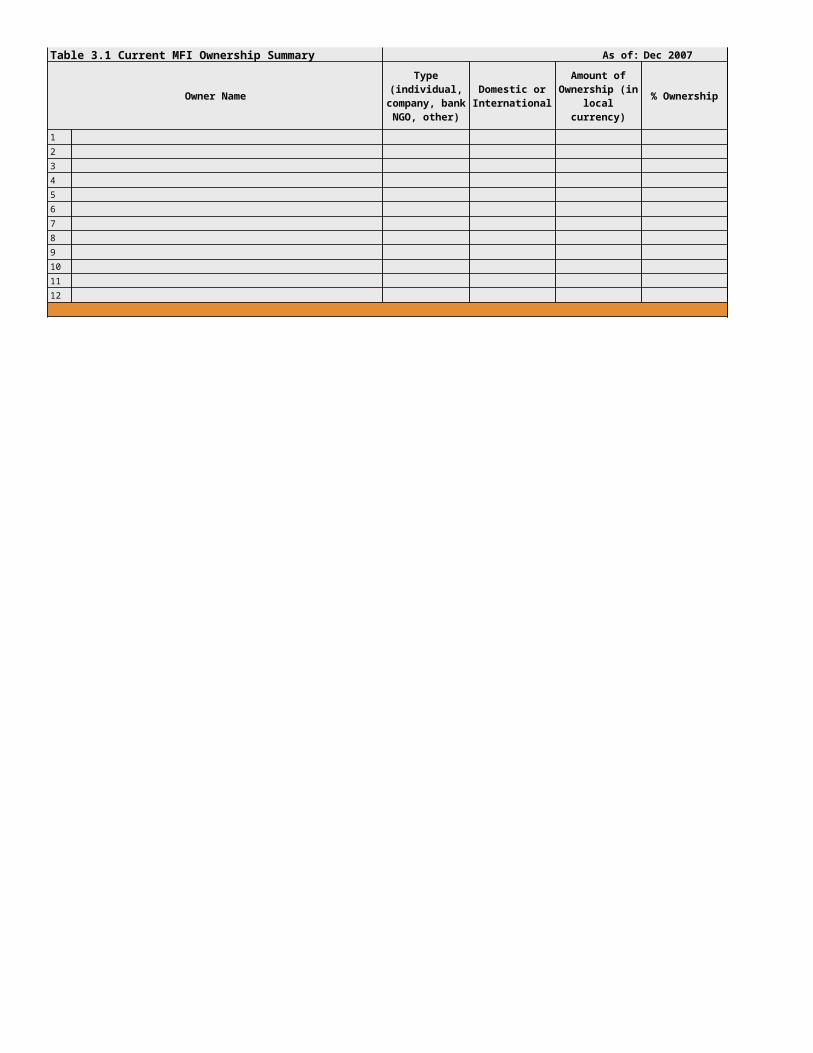
As of:
Source, Date, Terms Amount Currency: Funding Status
Grants 1
2
3
4
5
6
7
8
9
10
Table 7.5 External Grants and Subsidies
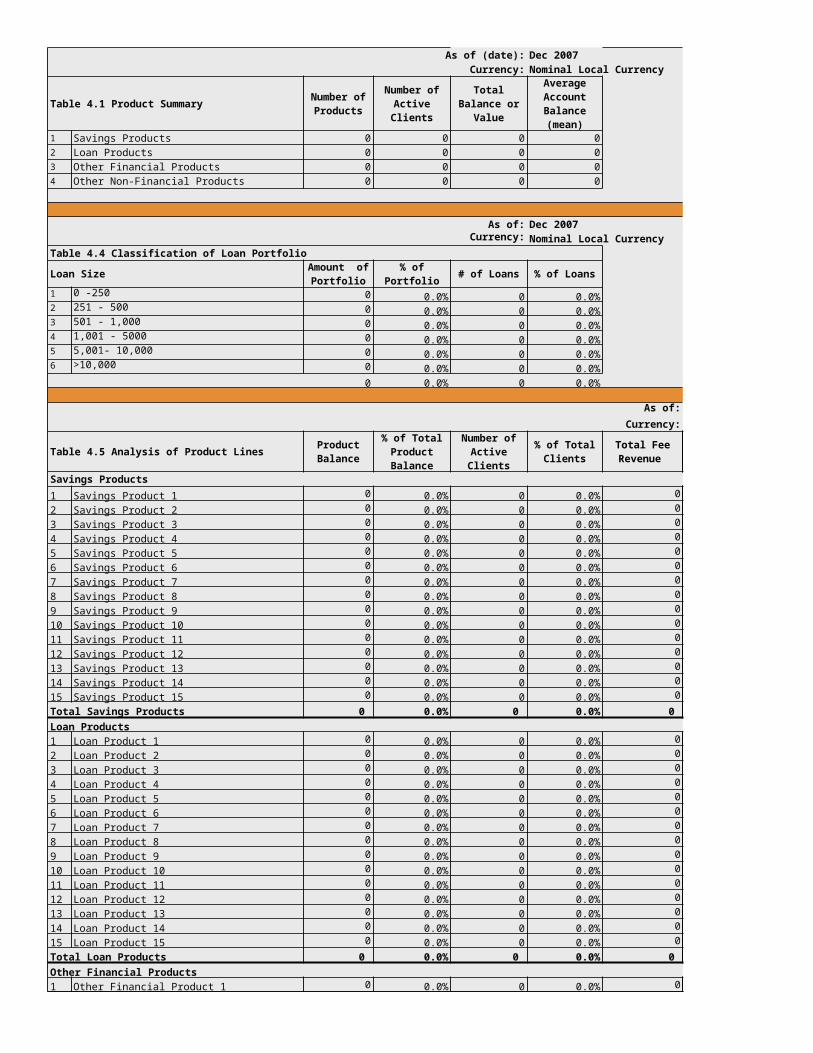
Significant In-kind Subsidies1
2
3
4
5
6
7
8
9
10
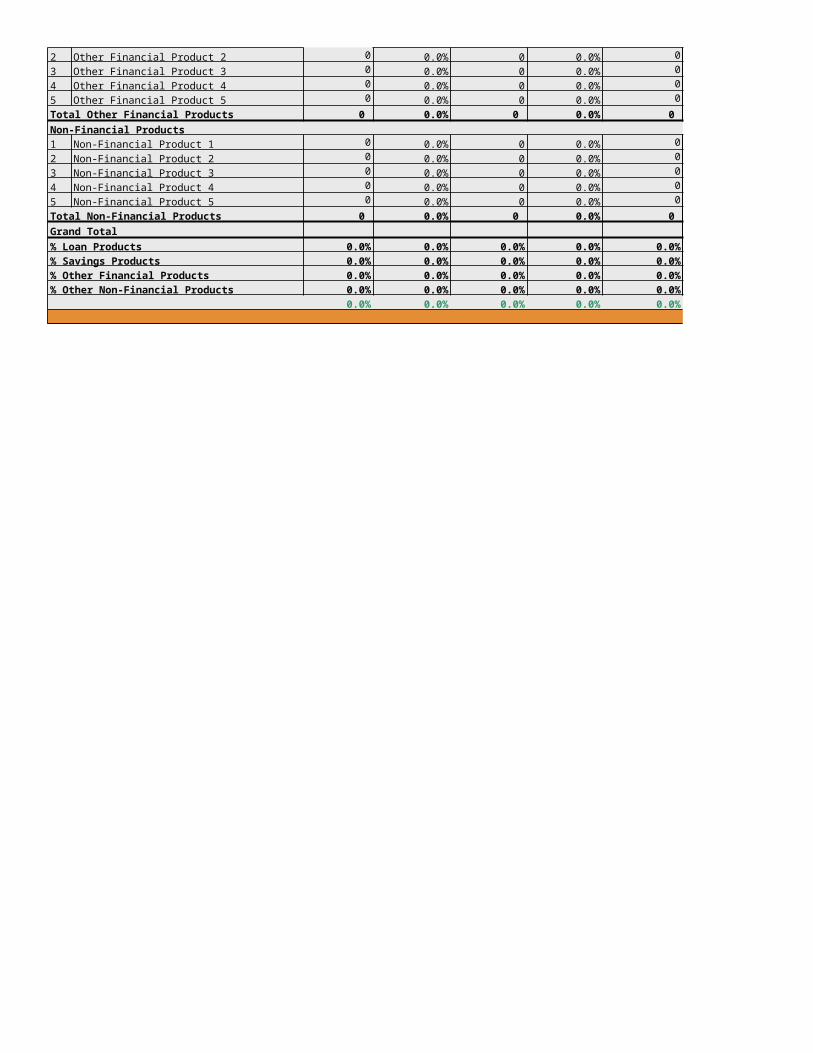
Dec 2007
Funding Status

Dec 2003 Dec 2004 Dec 20051 Loan Product 1
1. Theoretical interest yield (APR) 0.0% 0.0% 0.0%
- - -
3. Line 1 times line 2 - - - 2 Loan Product 2
1. Theoretical interest yield (APR) 0.0% 0.0% 0.0%
- - -
3. Line 1 times line 2 - - - 3 Loan Product 3
1. Theoretical interest yield (APR) 0.0% 0.0% 0.0%
- - -
3. Line 1 times line 2 - - - 4 Loan Product 4
1. Theoretical interest yield (APR) 0.0% 0.0% 0.0%
- - -
3. Line 1 times line 2 - - - 5 Loan Product 5
1. Theoretical interest yield (APR) 0.0% 0.0% 0.0%
- - -
3. Line 1 times line 2 - - - 6 Loan Product 6
1. Theoretical interest yield (APR) 0.0% 0.0% 0.0%
- - -
3. Line 1 times line 2 - - - 7 Loan Product 7
1. Theoretical interest yield (APR) 0.0% 0.0% 0.0%
- - -
3. Line 1 times line 2 - - - 8 Loan Product 8
1. Theoretical interest yield (APR) 0.0% 0.0% 0.0%
- - -
3. Line 1 times line 2 - - - 9 Loan Product 9
1. Theoretical interest yield (APR) 0.0% 0.0% 0.0%
- - -
3. Line 1 times line 2 - - - 10 Loan Product 10
1. Theoretical interest yield (APR) 0.0% 0.0% 0.0%
- - -
3. Line 1 times line 2 - - - 11 Loan Product 11
1. Theoretical interest yield (APR) 0.0% 0.0% 0.0%
- - -
3. Line 1 times line 2 - - - 12 Loan Product 12
Table 7.8 Comparison of Actual and Theoretical Yields
2. Monthly average of outstanding balance for the year (opening balance plus 12 month-end balances divided by 13).
2. Monthly average of outstanding balance for the year (opening balance plus 12 month-end balances divided by 13).
2. Monthly average of outstanding balance for the year (opening balance plus 12 month-end balances divided by 13).
2. Monthly average of outstanding balance for the year (opening balance plus 12 month-end balances divided by 13).
2. Monthly average of outstanding balance for the year (opening balance plus 12 month-end balances divided by 13).
2. Monthly average of outstanding balance for the year (opening balance plus 12 month-end balances divided by 13).
2. Monthly average of outstanding balance for the year (opening balance plus 12 month-end balances divided by 13).
2. Monthly average of outstanding balance for the year (opening balance plus 12 month-end balances divided by 13).
2. Monthly average of outstanding balance for the year (opening balance plus 12 month-end balances divided by 13).
2. Monthly average of outstanding balance for the year (opening balance plus 12 month-end balances divided by 13).
2. Monthly average of outstanding balance for the year (opening balance plus 12 month-end balances divided by 13).
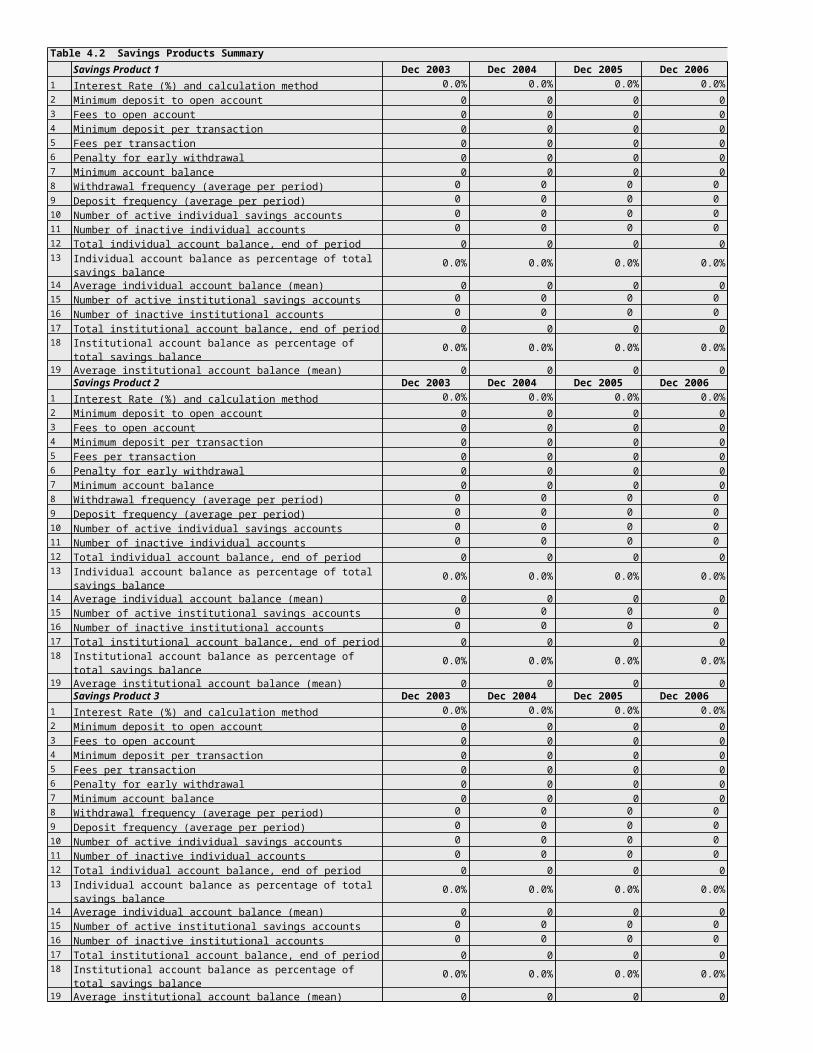
1. Theoretical interest yield (APR) 0.0% 0.0% 0.0%
- - -
3. Line 1 times line 2 - - - 13 Loan Product 13
1. Theoretical interest yield (APR) 0.0% 0.0% 0.0%
- - -
3. Line 1 times line 2 - - - 14 Loan Product 14
1. Theoretical interest yield (APR) 0.0% 0.0% 0.0%
- - -
3. Line 1 times line 2 - - - 15 Loan Product 15
1. Theoretical interest yield (APR) 0.0% 0.0% 0.0%
- - -
3. Line 1 times line 2 - - -
4. Weighted theoretical interest yield (sum of line 3 for all loan products) - - -
5. Actual yield on portfolio - - -
6. Yield gap ratio (line 5 as a percentage of line 4) 0.0% 0.0% 0.0%
2. Monthly average of outstanding balance for the year (opening balance plus 12 month-end balances divided by 13).
2. Monthly average of outstanding balance for the year (opening balance plus 12 month-end balances divided by 13).
2. Monthly average of outstanding balance for the year (opening balance plus 12 month-end balances divided by 13).
2. Monthly average of outstanding balance for the year (opening balance plus 12 month-end balances divided by 13).
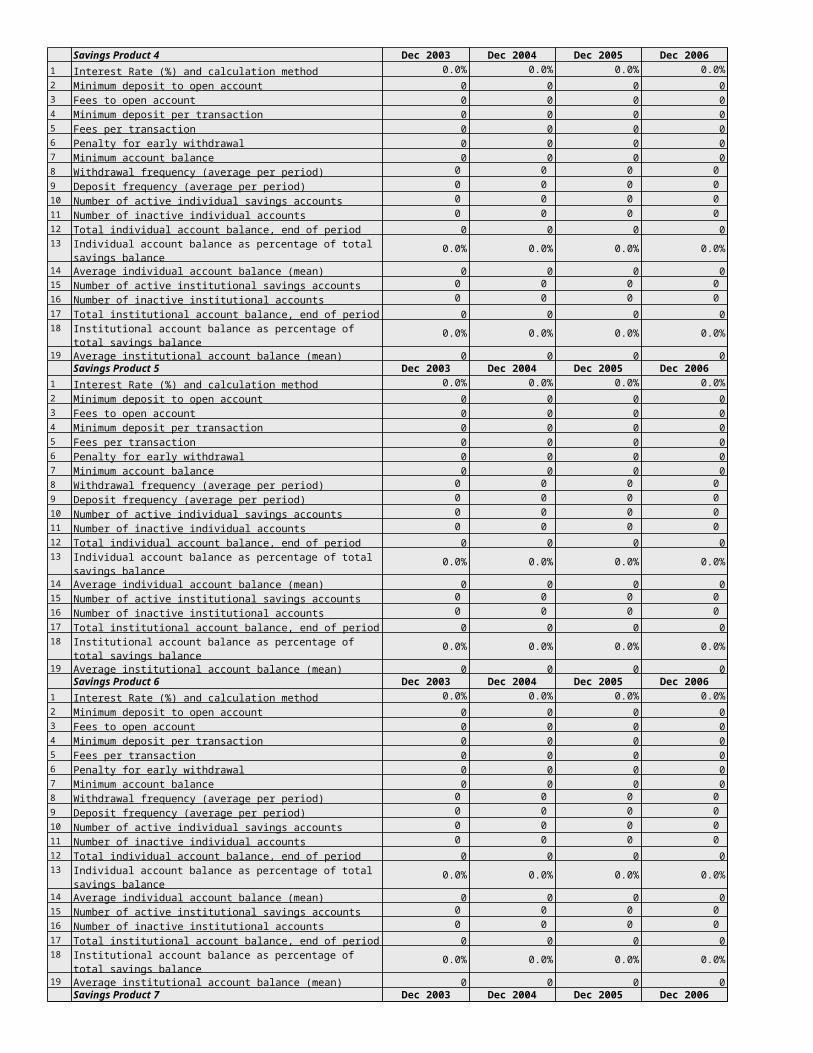
Dec 2006 Dec 2007
0.0% 0.0%
- -
- -
0.0% 0.0%
- -
- -
0.0% 0.0%
- -
- -
0.0% 0.0%
- -
- -
0.0% 0.0%
- -
- -
0.0% 0.0%
- -
- -
0.0% 0.0%
- -
- -
0.0% 0.0%
- -
- -
0.0% 0.0%
- -
- -
0.0% 0.0%
- -
- -
0.0% 0.0%
- -
- -
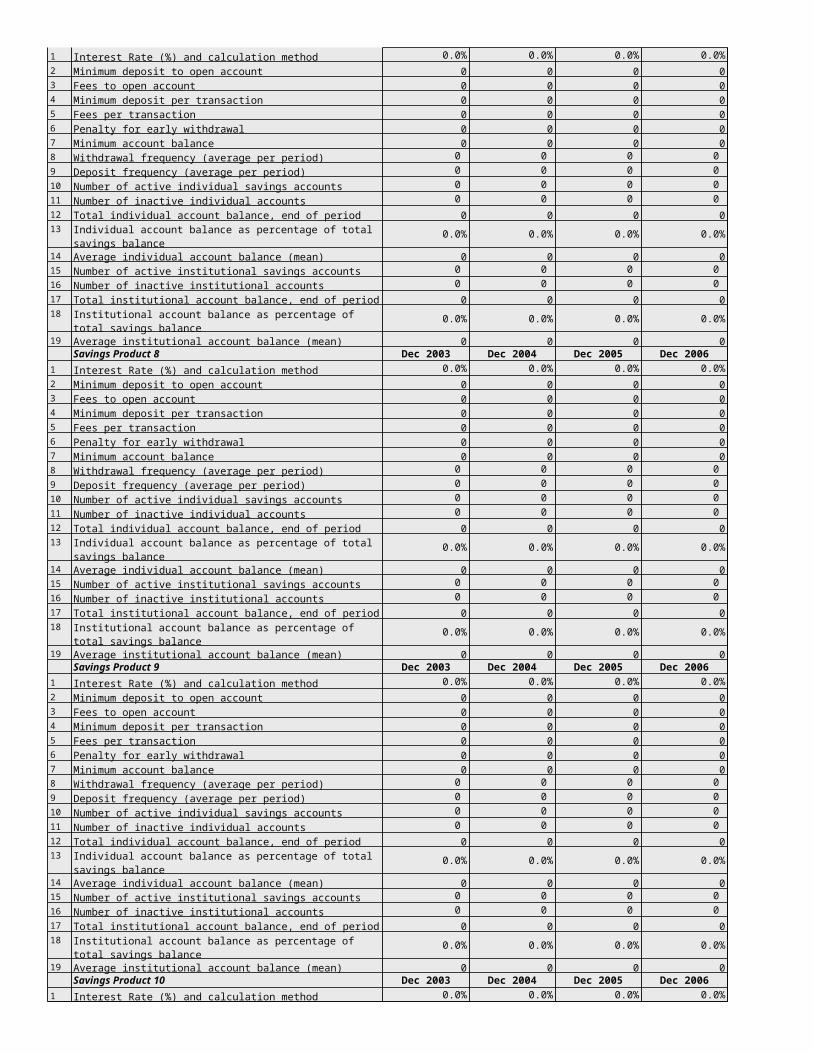
0.0% 0.0%
- -
- -
0.0% 0.0%
- -
- -
0.0% 0.0%
- -
- -
0.0% 0.0%
- -
- -
- -
- -
0.0% 0.0%
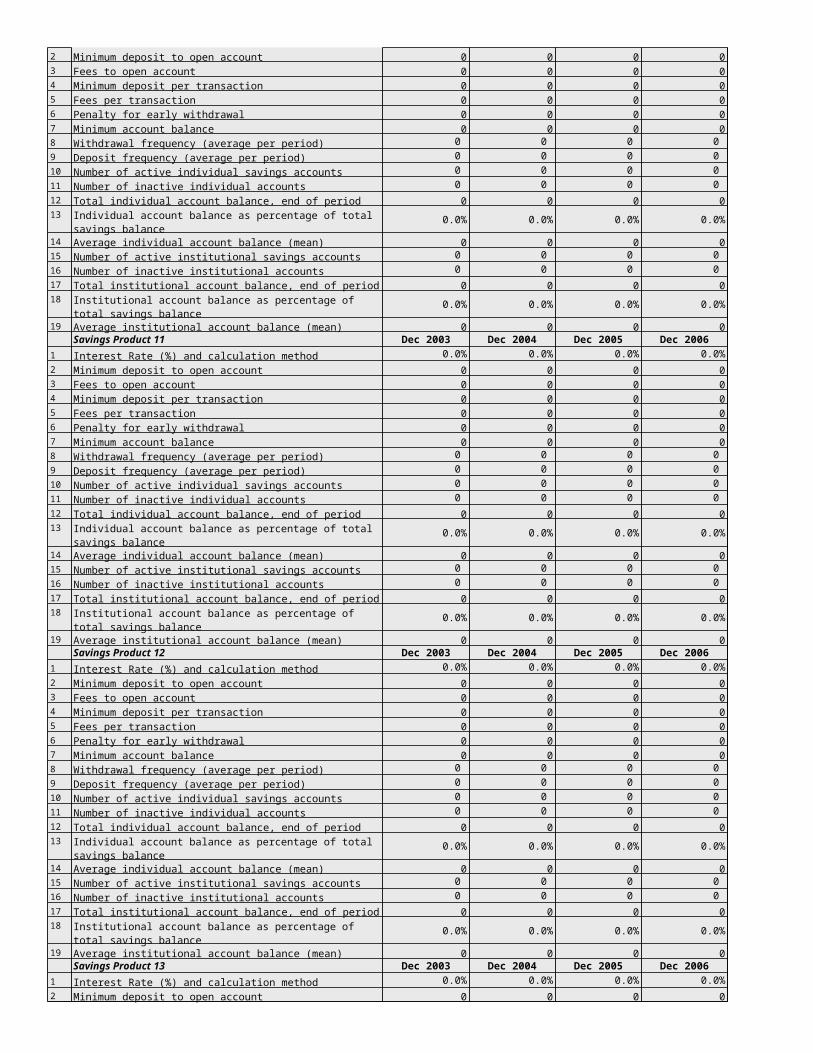
Loan Yield Calculator
* Enter into white cells, depending on terms of the loan being analyzed
* Model assumes client can withdraw savings without cost when loan is repaid. This assumption can be overridden.
* All movements or balances are assumed to be as of the end of the period for which they are shown.
Periods/Yr 12 Yield (interest + fees) on Book Portfolio 72.00%
Periods in loan 4 APR cost to client 91.99%
Average Outstanding Principal on Books 625.00
ACTUAL CASH FLOW ACCOUNTING TREATMENT
En
d o
f P
erio
d
Fee from client
0 (1,000.00) 30.00 120.00 - (850.00) 1,000.00 30.00 - -
1 250.00 50.00 - 300.00 750.00 30.00 50.00 50.00
2 250.00 50.00 - 300.00 500.00 30.00 100.00 0.50 100.50
3 250.00 50.00 - 300.00 250.00 30.00 150.00 1.00 151.50
4 250.00 50.00 (203.00) 97.00 - 30.00 200.00 1.50 203.00
5 - - - - -
6 - - - - -
7 - - - - -
8 - - - - -
9 - - - - -
10 - - - - -
11 - - - - -
12 - - - - -
13 - - - - -
14 - - - - -
15 - - - - -
16 - - - - -
17 - - - - -
18 - - - - -
19 - - - - -
20 - - - - -
21 - - - - -
22 - - - - -
23 - - - - -
24 - - - - -
25 - - - - -
26 - - - - -
27 - - - - -
28 - - - - -
29 - - - - -
30 - - - - -
31 - - - - -
32 - - - - -
33 - - - - -
34 - - - - -
35 - - - - -
36 - - - - -
37 - - - - -
38 - - - - -
39 - - - - -
40 - - - - -
41 - - - - -
42 - - - - -
43 - - - - -
44 - - - - -
45 - - - - -
46 - - - - -
47 - - - - -
48 - - - - -
49 - - - - -
50 - - - - -
51 - - - - -
52 - - - - -
120.00 150.00
* For declining-balance calculations, principal and interest for each payment can be calculated using a financial calculator, the PPMT or IPMT functions in Excel, or the Loan Manager template in Excel's "New" dialogue box.
Principal (to) from client
Interest from client
Savings from client
Savings balance paid
to client
Net cash flow
Principal balance on
books
Fee income from client,
when recognized
Interest income from client, when recognized
Savings principal balance before
payment to client
Savings interest
expense
Savings total balance before
payment to client
IntroductionGetting Started
Input DataAbout Appraise
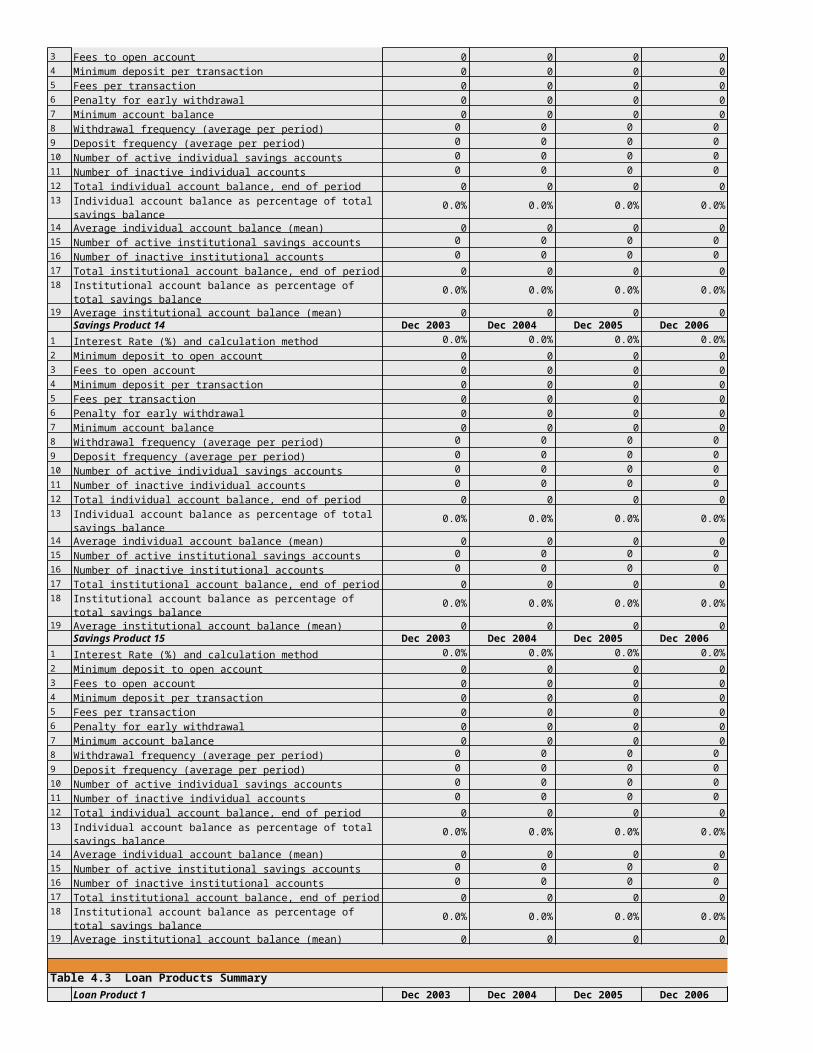
Dec 2003 Dec 2004 Dec 2005 Dec 2006 Dec 2007
Profitability & Sustainability
R1 Operational Self-sufficiency (OSS) No data No data No data No data No data
R1 Financial self-sufficiency (FSS) No data No data No data No data No data
R2 Return on Assets (ROA) No previous yr No data No data No data No data
R2 Adjusted Return on Assets (AROA) No previous yr No data No data No data No data
R3 Return on Equity (ROE) No previous yr No data No data No data No data
R3 Adjusted Return on Equity (AROE) No previous yr No data No data No data No data
Asset/Liability Management
R4 Yield on Gross Portfolio No previous yr No data No data No data No data
R5 Portfolio to Assets No data No data No data No data No data
R6 Cost of Funds Ratio No previous yr No data No data No data No data
R6 Adjusted Cost of Funds No previous yr No data No data No data No data
R7 Debt to Equity No data No data No data No data No data
R7 Adjusted Debt to Equity No data No data No data No data No data
R8 Liquid Ratio No data No data No data No data No data
Portfolio Quality
R9 Portfolio-at-risk Ratio (PAR) No data No data No data No data No data
R9 Adjusted PAR Ratio No data No data No data No data No data
R10 Write-off Ratio No previous yr No data No data No data No data
R10 Adjusted Write-off Ratio No previous yr No data No data No data No data
R11 Risk Coverage Ratio No data No data No data No data No data
R11 Adjusted Risk Coverage Ratio No data No data No data No data No data
Efficiency & Productivity
R12 Operating Expense Ratio No previous yr No data No data No data No data
R12 Adjusted Operating Expense Ratio No previous yr No data No data No data No data
R13 Cost per Active Client No previous yr No data No data No data No data
R13 Adjusted Cost per Active Client No previous yr No data No data No data No data
R14 Borrowers per Loan Officer No data No data No data No data No data
R15 Active Clients Per Staff Member No data No data No data No data No data
R16 Client Turnover No previous yr 0.0% 0.0% 0.0% 0.0%
R17 Average Outstanding Loan Size No data No data No data No data No data
R17 Adjusted Average Outstanding Loan Size No data No data No data No data No data
R18 Average Loan Disbursed No data No data No data No data No data
Other RatiosNo previous yr 0.0% 0.0% 0.0% 0.0%No previous yr - - - -
Adjusted Cost per Borrower No previous yr - - - -
No data No data No data No data No data
Savers/Total staff No data No data No data No data No data
Savings/Total staff No data No data No data No data No data
Average savings balance - - - - -
Non-earning liquid assets as a % of Total Assets No data No data No data No data No data
Total liquidity reserves - - - - -
Quick ratio No data No data No data No data No data
MBB Commercial Funding Liabilities ratio No previous yr No data No data No data No data
Funding Expense Ratio No previous yr 0.0% 0.0% 0.0% 0.0%
MBB Financial Expense Ratio No previous yr No data No data No data No data
MBB Deposits to Total Assets No data No data No data No data No data
Table 7.7 Performance Ratios and Peer Group Benchmarking
Provision Expense Ratio
Cost per Borrower
Personnel Productivity

Mature Branch
0.0% 0.0%
0.0% 0.0%
0.0% 0.0%
0.0% 0.0%
0.0% 0.0%
0.0% 0.0%
0.0% 0.0%
0.0% 0.0%
0.0% 0.0%
0.0% 0.0%
0.0% 0.0%
0.0% 0.0%
0.0% 0.0%
0.0% 0.0%
0.0% 0.0%
0.0% 0.0%
0.0% 0.0%
0.0% 0.0%
0.0% 0.0%
0.0% 0.0%
0.0% 0.0%
- -
- -
- -
- -
0.0% 0.0%
- -
- -
- -
0.0% 0.0%
- -
- -
0.0% 0.0%
- -
- -
- -
0.0% 0.0%
- -
0.0% 0.0%
0.0% 0.0%
0.0% 0.0%
0.0% 0.0%
0.0% 0.0%
MBB Peer Group
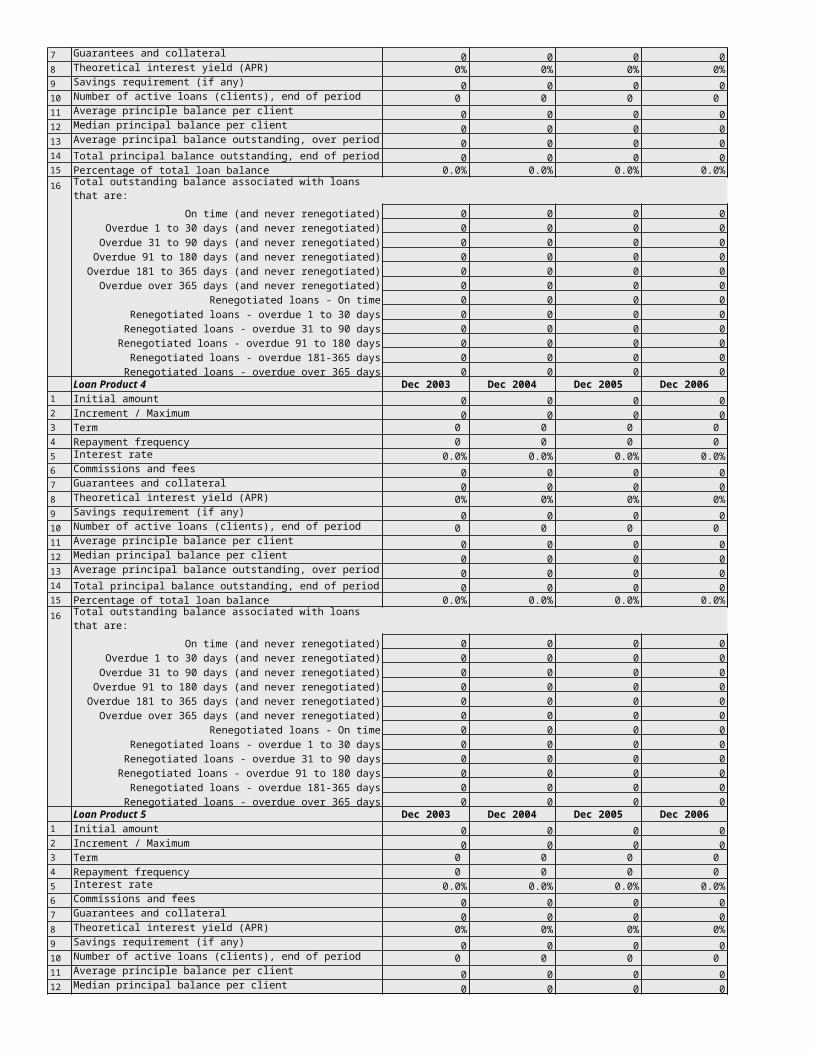
Table 8.1 Projected Performance Dec 2008 Dec 2009 Dec 20101 Total Number of clients 0 0 02 Total gross loan portfolio - - - 3 Number of active loans 0 0 0
4 - - -
5 Number of voluntary savings clients 0 0 06 Number of staff 0 0 07 Number of branch offices 0 0 08 Return on Assets (ROA) 0.0% 0.0% 0.0%9 Return on Equity (ROE) 0.0% 0.0% 0.0%
Total balance of voluntary savings accounts
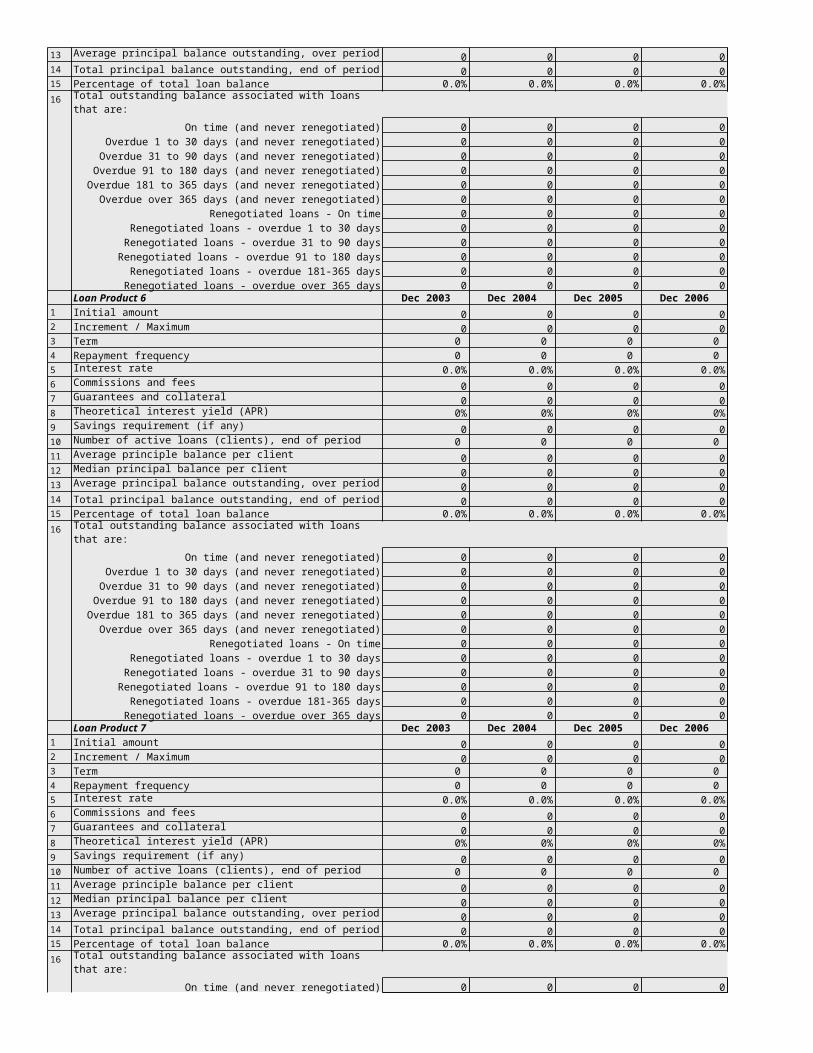
< 1 month 1-3 months >3-6 months >1-2 years
ASSETSCash and Due from Banks 0 0 0 0 0
Trade Investments 0 0 0 0 0
Net Loan Portfolio (top line only) 0 0 0 0 0
0 0 0 0 0
Other Investments 0 0 0 0 0
Net Fixed Assets (top line only) 0 0 0 0 0
Total Assets 0 0 0 0 0
Demand Deposits: Voluntary savings 0 0 0 0 0
Demand Deposits: Forced savings 0 0 0 0 0
Short-Term Time Deposits 0 0 0 0 0
Short-Term Borrowings 0 0 0 0 0
0 0 0 0 0
Long-Term Time Deposits 0 0 0 0 0
Long-Term Borrowings 0 0 0 0 0
Other Long-Term Liabilities 0 0 0 0 0
Total Liabilities 0 0 0 0 0Total Equity 0 0 0 0 0
Total Liabilities & Equity 0 0 0 0 0Asset-Liability Gap 0 0 0 0 0As % of equity 0.0% 0.0% 0.0% 0.0% 0.0%Cumulative Gap 0 0 0 0 0Cumulative Gap as % of Equity 0.0% 0.0% 0.0% 0.0% 0.0%
As of: Dec 2007
US $ EURO OTHERS Total
ASSETSCash and Due from Banks 0 0 0 0 0Trade Investments 0 0 0 0 0Net Loan Portfolio (top line only) 0 0 0 0 0
0 0 0 0 0
Other Investments 0 0 0 0 0Net Fixed Assets (top line only) 0 0 0 0 0
Total Assets 0 0 0 0 0
Demand Deposits: Voluntary savings 0 0 0 0 0Demand Deposits: Forced savings 0 0 0 0 0Short-Term Time Deposits 0 0 0 0 0Short-Term Borrowings 0 0 0 0 0
0 0 0 0 0
Long-Term Time Deposits 0 0 0 0 0Long-Term Borrowings 0 0 0 0 0Other Long-Term Liabilities 0 0 0 0 0
Total Liabilities 0 0 0 0 0Total Equity - - - - 0Total Liabilities & Equity - - - - -
Net Open Position (A-TL and Equity) 0 0 0 0 0
Net Open Position as % of Equity 0.0% 0.0% 0.0% 0.0% 0.0%
Table 7.10 Asset/Liability Maturity Mismatch Table
>6-12 months
Interest Receivable on Loan Portfolio + Accounts Receivable and Other Assets
LIABILITIES
Interest Payable on Funding Liabilities + Accounts Payable and Other Short-Term Liabilities
Table 7.11 Foreign Currency Mismatch Table LOCAL CURRENCY
Interest Receivable on Loan Portfolio + Accounts Receivable and Other Assets
LIABILITIES
Interest Payable on Funding Liabilities + Accounts Payable and Other Short-Term Liabilities
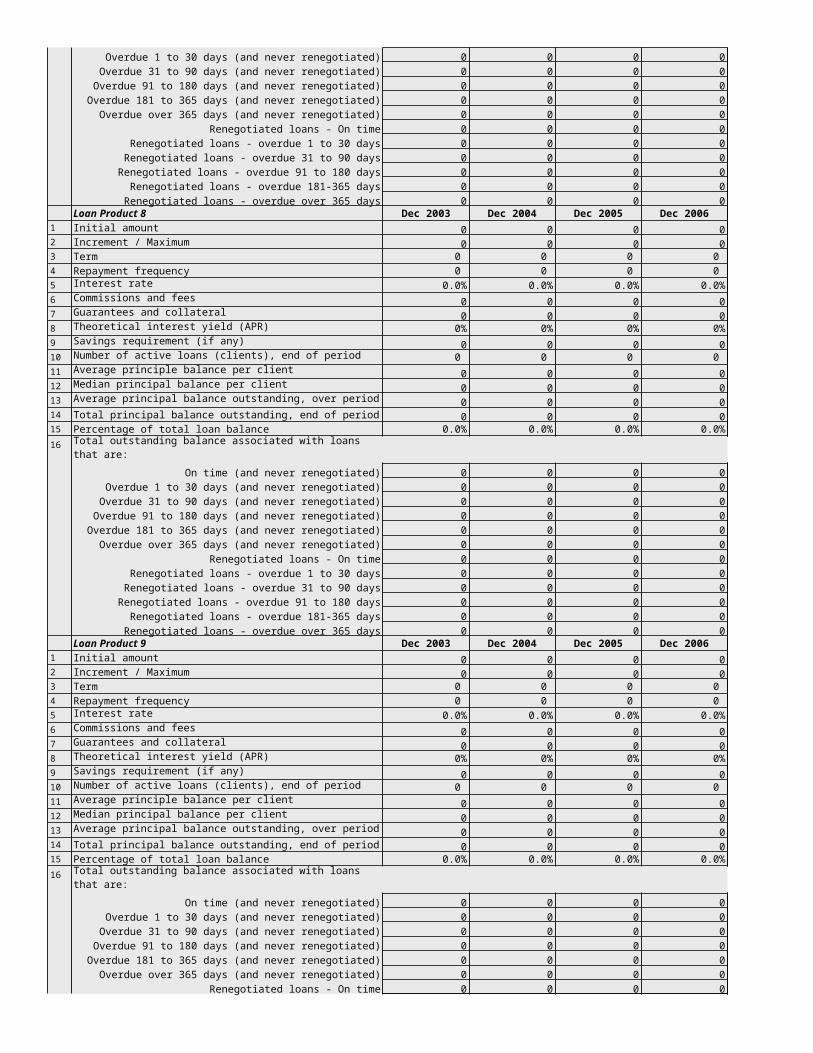
Assets/Liabilities 0.0% 0.0% 0.0% 0.0% 0.0%
As of: Dec 2007
< 1 month 1-3 months >3-6 months >1-2 years
ASSETSCash and Due from Banks 0 0 0 0 0
Trade Investments 0 0 0 0 0
Net Loan Portfolio (top line only) 0 0 0 0 0
0 0 0 0 0
Other Investments 0 0 0 0 0
Net Fixed Assets (top line only) 0 0 0 0 0
Total Assets 0 0 0 0 0
Demand Deposits: Voluntary savings 0 0 0 0 0
Demand Deposits: Forced savings 0 0 0 0 0
Short-Term Time Deposits 0 0 0 0 0
Short-Term Borrowings 0 0 0 0 0
0 0 0 0 0
Long-Term Time Deposits 0 0 0 0 0
Long-Term Borrowings 0 0 0 0 0
Other Long-Term Liabilities 0 0 0 0 0
Total Liabilities 0 0 0 0 0Total Equity 0 0 0 0 0
Total Liabilities & Equity 0 0 0 0 0Asset-Liability Gap 0 0 0 0 0As % of equity 0.0% 0.0% 0.0% 0.0% 0.0%
Table 7.12 Interest Rate Sensitivity Mismatch Table
>6-12 months
Interest Receivable on Loan Portfolio + Accounts Receivable and Other Assets
LIABILITIES
Interest Payable on Funding Liabilities + Accounts Payable and Other Short-Term Liabilities
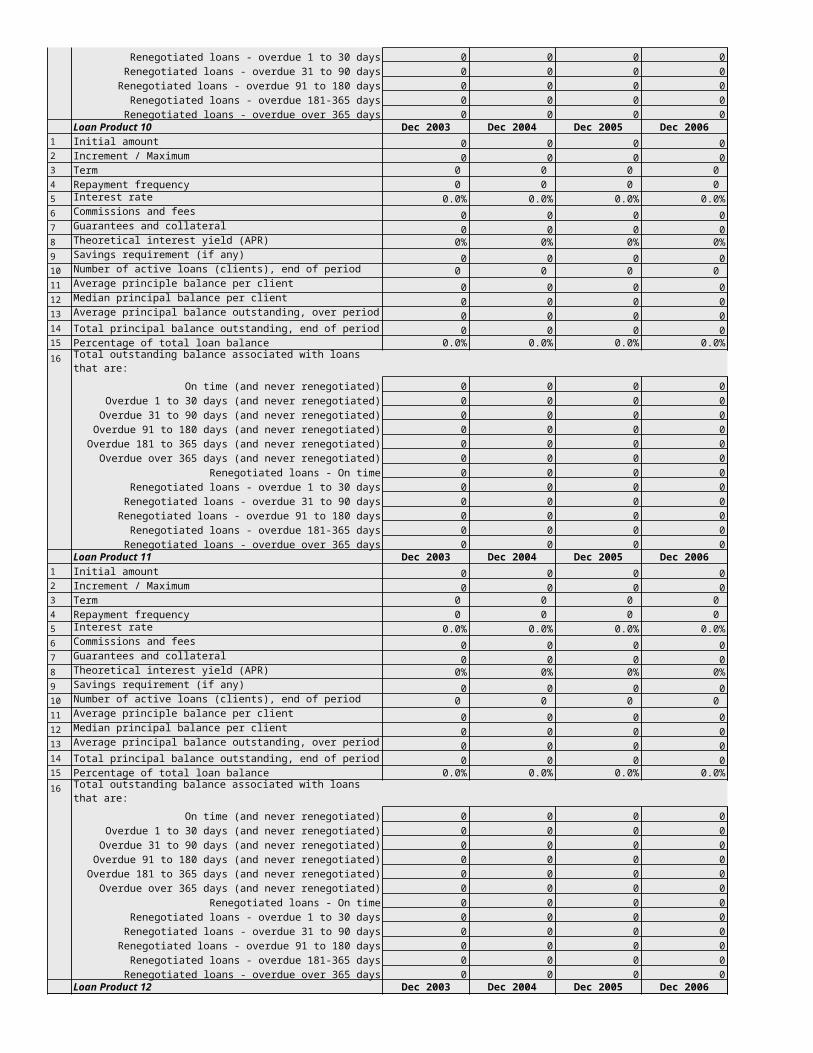
As of: Dec 2007
>2-3 years >3-4 years >4-5 years > 5 years Total
0 0 0 0 0 00 0 0 0 0 00 0 0 0 0 0
0 0 0 0 00
0 0 0 0 0 00 0 0 0 0 0
0 0 0 0 0 0
0 0 0 0 0 00 0 0 0 0 00 0 0 0 0 00 0 0 0 0 0
0 0 0 0 00
0 0 0 0 0 00 0 0 0 0 00 0 0 0 0 0
0 0 0 0 0 00 0 0 0 0 0
0 0 0 0 0 0
0 0 0 0 0 0
0.0% 0.0% 0.0% 0.0% 0.0% 0.0%
0 0 0 0 0 0
0.0% 0.0% 0.0% 0.0% 0.0% 0.0%
No Maturity or Unknown
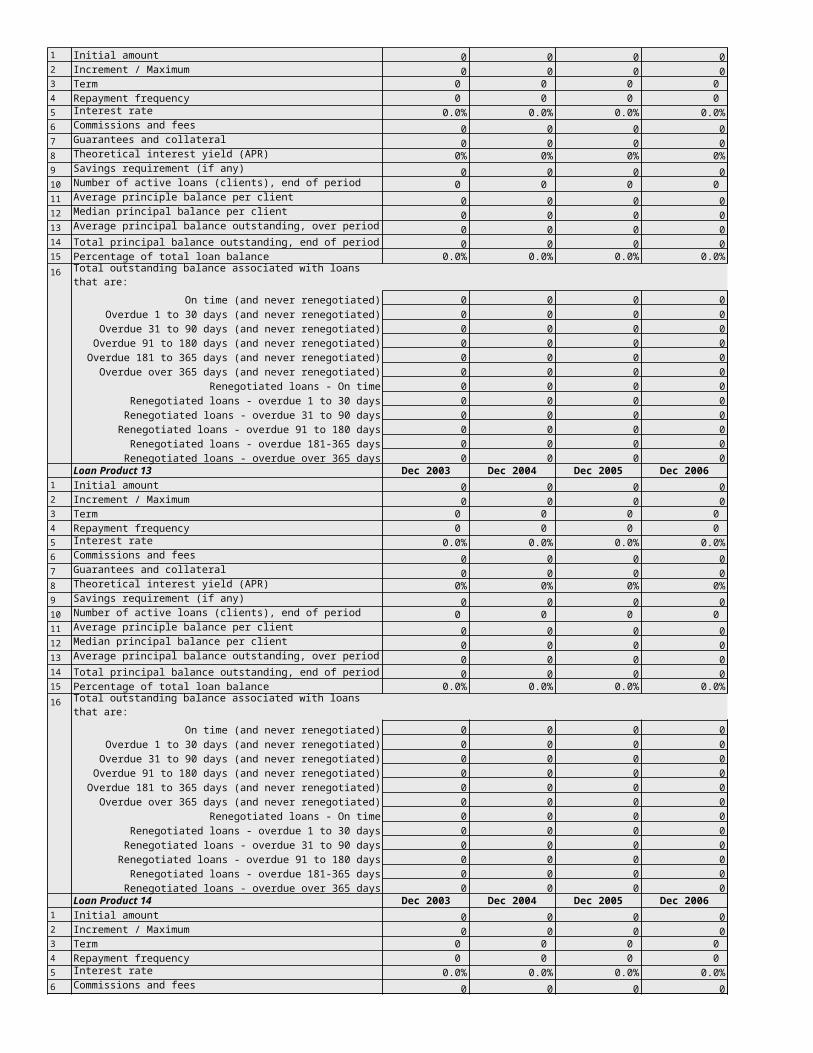
>2-3 years >3-4 years >4-5 years > 5 years Total
0 0 0 0 0 00 0 0 0 0 00 0 0 0 0 0
0 0 0 0 00
0 0 0 0 0 00 0 0 0 0 0
0 0 0 0 0 0
0 0 0 0 0 00 0 0 0 0 00 0 0 0 0 00 0 0 0 0 0
0 0 0 0 00
0 0 0 0 0 00 0 0 0 0 00 0 0 0 0 0
0 0 0 0 0 00 0 0 0 0 0
0 0 0 0 0 0
0 0 0 0 0 0
0.0% 0.0% 0.0% 0.0% 0.0% 0.0%
Non-interest Bearing
Graph Calculations
Graph 11 Portfolio Size
Gross Loan Portfolio
Number of borrowers
Value Axis Title
2003 2004 2005 2006 20070
1
1
0
1
1
Portfolio Size
Gross Loan Portfolio Number of borrowers
Th
ou
san
ds
2003 2004 2005
0 0 0
0 0 0
Thousands
About Appraise
Type Unlicensed shareware
Version Version 1
Version Date 14-03-07
Excel version in use 53bb9681a964705cf672590721dbc85eb4d0c3a2
File Name #VALUE!
Appraise has been designed for use with Excel 2000, 2002, and 2003 (release 9, 10, and 11)
Introduction
Getting Started
Input Data
About Appraise
Introduction
Getting Started
Input Data
About Appraise