Embed Size (px)
Citation preview
DEMOGRAPHICS 1 MILE 3 MILE 5 MILE
POPULATION2017 Estimated 11,906 126,803 355,8522022 Projected 12,334 130,465 365,428HOUSEHOLDS 2017 Estimated 4,633 45,655 126,7482022 Projected 4,859 47,330 131,399INCOME2017 Median HHI $43,520 $55,843 $58,5732017 Average HHI $54,132 $68,596 $74,5032017 Per Capita $21,113 $24,739 $26,641
Information provided by ESRI Business Analyst
This statement with the information it contains is given with the understanding that negotiations relating to the purchase, renting or leasing of this property shall be conducted through this office. The information while not guaranteed has been secured from sources we believe to be reliable however, it is up to the buyer, tenant or landlord to verify the information and conduct appropriate due diligence. Advisors Commercial Real Estate. 2018
2398 E. Camelback Rd. Phoenix, AZ 85016602.884.8345www.AdvisorsCommercialRE.com
PROPERTY FEATURES
SEC PRICE RD & QUEEN CREEK RD CHANDLER, AZ 85248
DOWNTOWN OCOTILLO PHASE II
ChandlerChandler
Casa GrandeCasa Grande
MaricopaMaricopa
Gila BendGila Bend
CoolidgeCoolidge
TempeTempe
TollesonTollesonAvondaleAvondale
Litchfield Park
Litchfield Park
Sun City West
GlendaleGlendale
PeoriaPeoria
Deer ValleyDeer Valley
DowntownDowntown Sky HarborAirport
Sky HarborAirport
AhwatukeeAhwatukee
Sun CitySun City
El MirageEl Mirage
SurpriseSurprise
GoodyearGoodyear
BuckeyeBuckeye
GilbertGilbert
ApacheJunctionApacheJunction
Paradise Valley
Paradise Valley
PhoenixPhoenix
South PhoenixSouth
Phoenix
San TanValley
San TanValley
Queen CreekQueen Creek
MesaMesa
ScottsdaleScottsdale
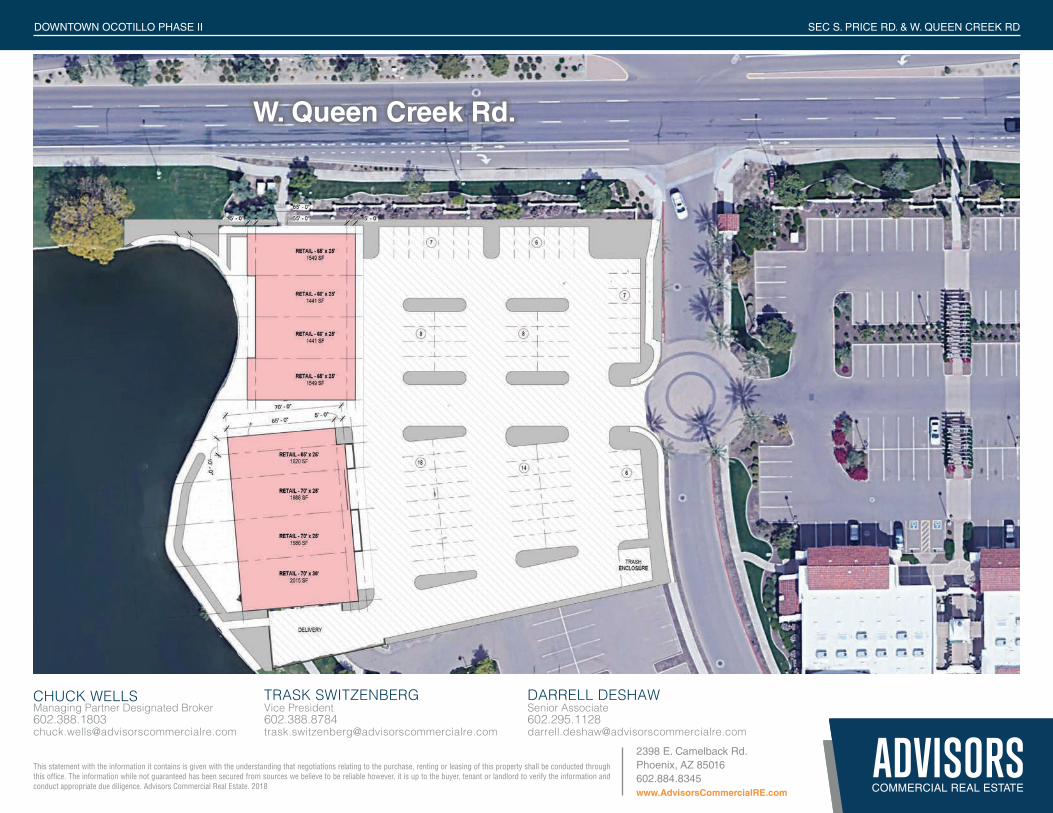
NEW DEVELOPMENT FOR LEASE
• New ±13,000 SF construction, available Q2 2019
• Servicing the Price Rd. “Silicon Desert” employment corridor (±30,000 employees within a 5 minute drive)
• Within the upscale Ocotillo Residential Community (Average HH income of $106K in 3 mile radius)
• Walking distance to ±500 Apartments/Villas and ±250 hotel rooms
• Lakeside patio space available
Senior [email protected]
DARRELL DESHAWVice [email protected]
TRASK SWITZENBERGManaging Partner Designated [email protected]
CHUCK WELLS

This statement with the information it contains is given with the understanding that negotiations relating to the purchase, renting or leasing of this property shall be conducted through this office. The information while not guaranteed has been secured from sources we believe to be reliable however, it is up to the buyer, tenant or landlord to verify the information and conduct appropriate due diligence. Advisors Commercial Real Estate. 2018
2398 E. Camelback Rd. Phoenix, AZ 85016602.884.8345www.AdvisorsCommercialRE.com
SEC S. PRICE RD. & W. QUEEN CREEK RDDOWNTOWN OCOTILLO PHASE II
Senior [email protected]
DARRELL DESHAWVice [email protected]
TRASK SWITZENBERGManaging Partner Designated [email protected]
CHUCK WELLS
W. Queen Creek Rd.
This statement with the information it contains is given with the understanding that negotiations relating to the purchase, renting or leasing of this property shall be conducted through this office. The information while not guaranteed has been secured from sources we believe to be reliable however, it is up to the buyer, tenant or landlord to verify the information and conduct appropriate due diligence. Advisors Commercial Real Estate. 2018
2398 E. Camelback Rd. Phoenix, AZ 85016602.884.8345www.AdvisorsCommercialRE.com
SEC S. PRICE RD. & W. QUEEN CREEK RDDOWNTOWN OCOTILLO PHASE II
Senior [email protected]
DARRELL DESHAWVice [email protected]
TRASK SWITZENBERGManaging Partner Designated [email protected]
CHUCK WELLS
S. P
rice
Rd
. (13
,40
0 vp
d)
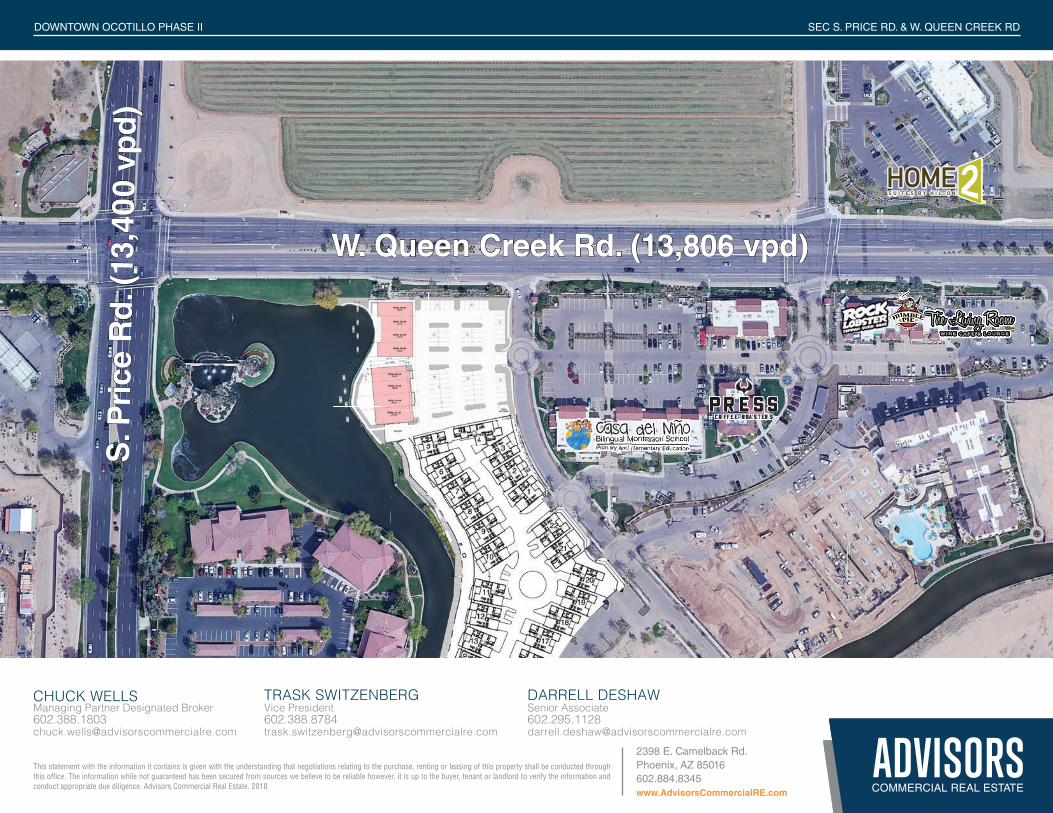
W. Queen Creek Rd. (13,806 vpd)
This statement with the information it contains is given with the understanding that negotiations relating to the purchase, renting or leasing of this property shall be conducted through this office. The information while not guaranteed has been secured from sources we believe to be reliable however, it is up to the buyer, tenant or landlord to verify the information and conduct appropriate due diligence. Advisors Commercial Real Estate. 2018
2398 E. Camelback Rd. Phoenix, AZ 85016602.884.8345www.AdvisorsCommercialRE.com
SEC S. PRICE RD. & W. QUEEN CREEK RDDOWNTOWN OCOTILLO PHASE II
Senior [email protected]
DARRELL DESHAWVice [email protected]
TRASK SWITZENBERGManaging Partner Designated [email protected]
CHUCK WELLS
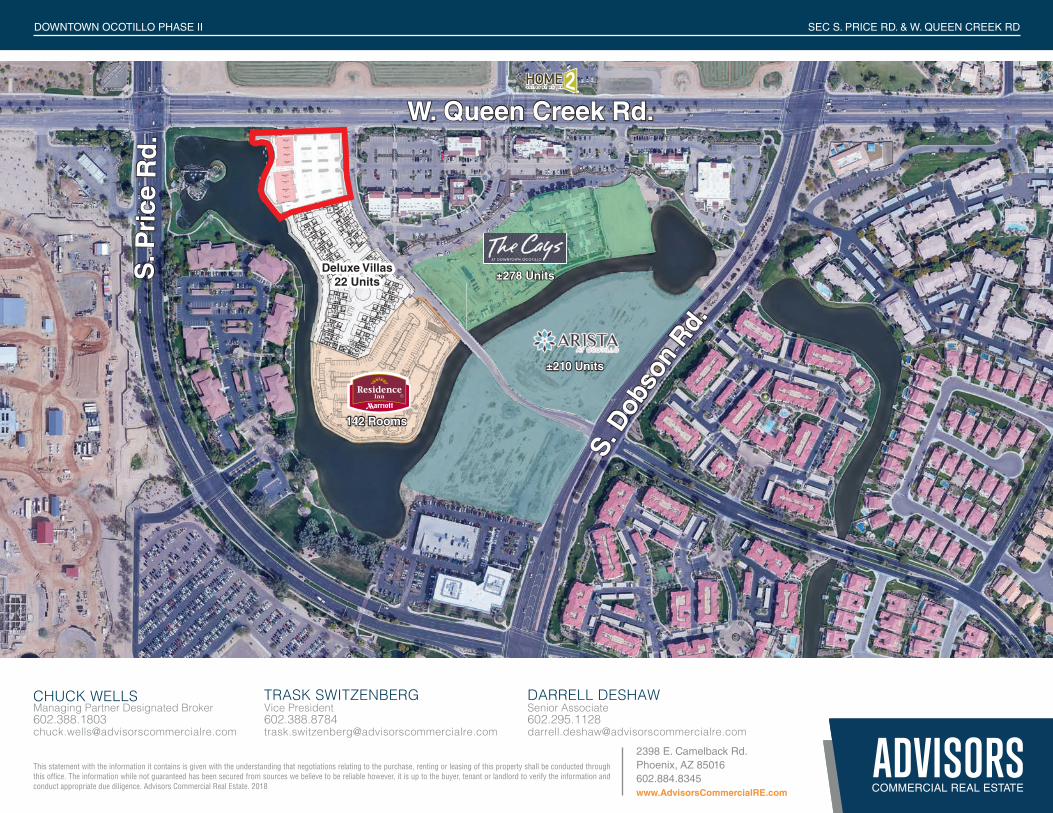
±210 Units
Deluxe Villas 22 Units
142 Rooms
±278 UnitsS. P
rice
Rd
.W. Queen Creek Rd.
S. D
obso
n Rd.
This statement with the information it contains is given with the understanding that negotiations relating to the purchase, renting or leasing of this property shall be conducted through this office. The information while not guaranteed has been secured from sources we believe to be reliable however, it is up to the buyer, tenant or landlord to verify the information and conduct appropriate due diligence. Advisors Commercial Real Estate. 2018
2398 E. Camelback Rd. Phoenix, AZ 85016602.884.8345www.AdvisorsCommercialRE.com
SEC S. PRICE RD. & W. QUEEN CREEK RDDOWNTOWN OCOTILLO PHASE II
Senior [email protected]
DARRELL DESHAWVice [email protected]
TRASK SWITZENBERGManaging Partner Designated [email protected]
CHUCK WELLS
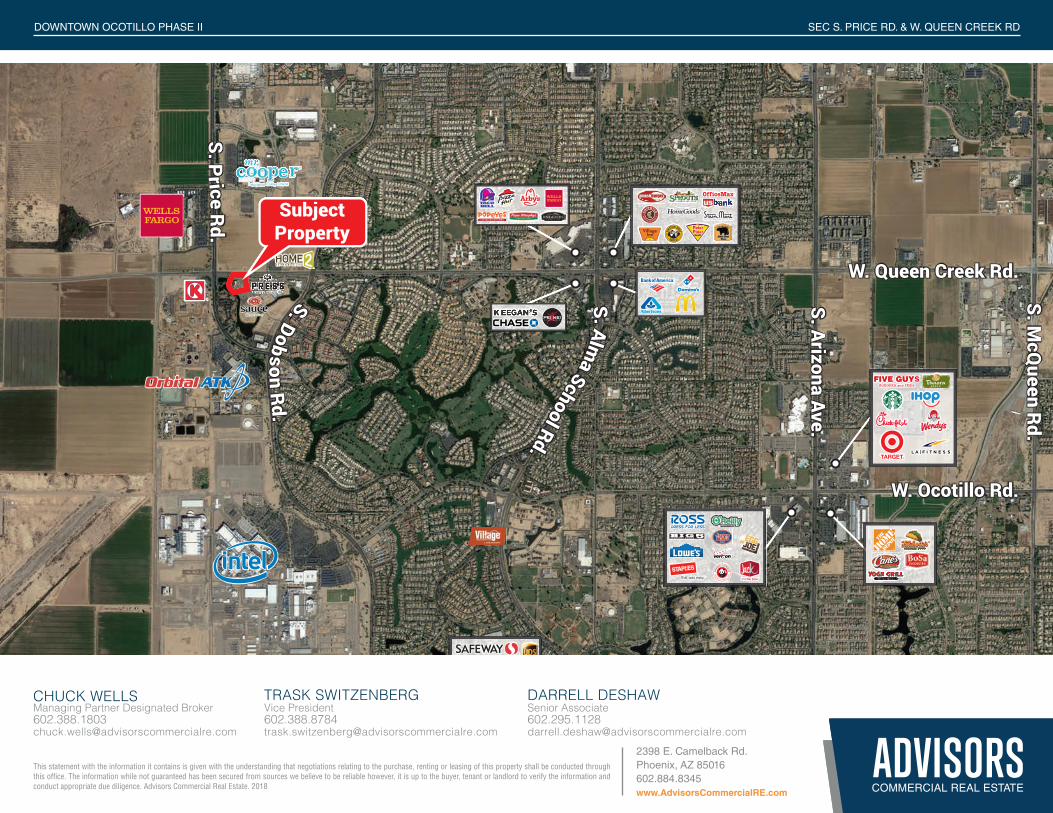
Subject Property
S. Pr i ce Rd.
S. Dobson Rd.
S. Alma School Rd.
S. Arizona Ave.
S. McQ
ueen Rd.
W. Queen Creek Rd.
W. Germann Rd.
W. Ocotillo Rd.
W. Chandler Heights Rd.
This statement with the information it contains is given with the understanding that negotiations relating to the purchase, renting or leasing of this property shall be conducted through this office. The information while not guaranteed has been secured from sources we believe to be reliable however, it is up to the buyer, tenant or landlord to verify the information and conduct appropriate due diligence. Advisors Commercial Real Estate. 2018
2398 E. Camelback Rd. Phoenix, AZ 85016602.884.8345www.AdvisorsCommercialRE.com
SEC S. PRICE RD. & W. QUEEN CREEK RDDOWNTOWN OCOTILLO PHASE II
Senior [email protected]
DARRELL DESHAWVice [email protected]
TRASK SWITZENBERGManaging Partner Designated [email protected]
CHUCK WELLS
Intel11,000 Employees
Wells Fargo 5,100 Employees
Chandler Regional Medical Center 2,100 Employees
Mr. Cooper500 Employees
CampusLogic120 Employees
Rogers Coporation590 Employees
General Motors890 Employees
Microchip1,625 Employees
PayPal 1,750 Employees
Education Management Corporation900 Employees
Safelite Auto Glass600 Employees
Infusionsoft550 Employees
Walgreens500 Employees
Bank of AmericaMortgage Processing Center3,800 Employees
CVS Health700 Employees
Orbital ATK1,650 Employees
Orbital ATK±1,200 Employees
S. Price Rd. (30,00 0 vpd)
S. Dobson R
d. (18,800 vpd)
S. Dobson Rd. (30,900 vpd)
W. Queen Creek Rd. (20,800 vpd)
S. Alma School Rd. (33,700 vpd)
W. Germann Rd. (16,400 vpd)
W. Frye Rd.
W. Pecos Rd. (11,742 vpd)
W. Chandler Blvd. (40,700 vpd)W. Chandler Blvd. (38,269 vpd)
Loop 202 (91,509 vpd)
Loop 202 (179,714 vpd)
Loop 101 (166,532 vpd)
W. Ocotill
o Rd. (11,600 vpd)
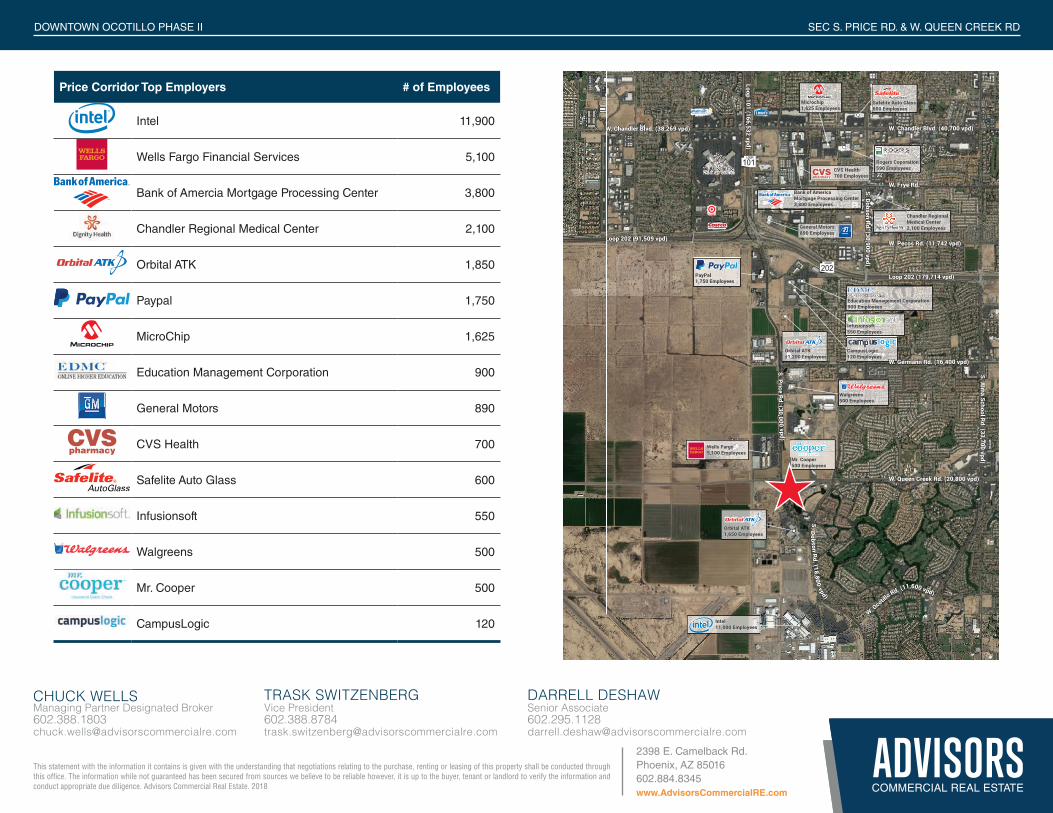
Price Corridor Top Employers # of Employees
Intel 11,900
Wells Fargo Financial Services 5,100
Bank of Amercia Mortgage Processing Center 3,800
Chandler Regional Medical Center 2,100
Orbital ATK 1,850
Paypal 1,750
MicroChip 1,625
Education Management Corporation 900
General Motors 890
CVS Health 700
Safelite Auto Glass 600
Infusionsoft 550
Walgreens 500
Mr. Cooper 500
CampusLogic 120
This statement with the information it contains is given with the understanding that negotiations relating to the purchase, renting or leasing of this property shall be conducted through this office. The information while not guaranteed has been secured from sources we believe to be reliable however, it is up to the buyer, tenant or landlord to verify the information and conduct appropriate due diligence. Advisors Commercial Real Estate. 2018
2398 E. Camelback Rd. Phoenix, AZ 85016602.884.8345www.AdvisorsCommercialRE.com
SEC S. PRICE RD. & W. QUEEN CREEK RDDOWNTOWN OCOTILLO PHASE II
Senior [email protected]
DARRELL DESHAWVice [email protected]
TRASK SWITZENBERGManaging Partner Designated [email protected]
CHUCK WELLS
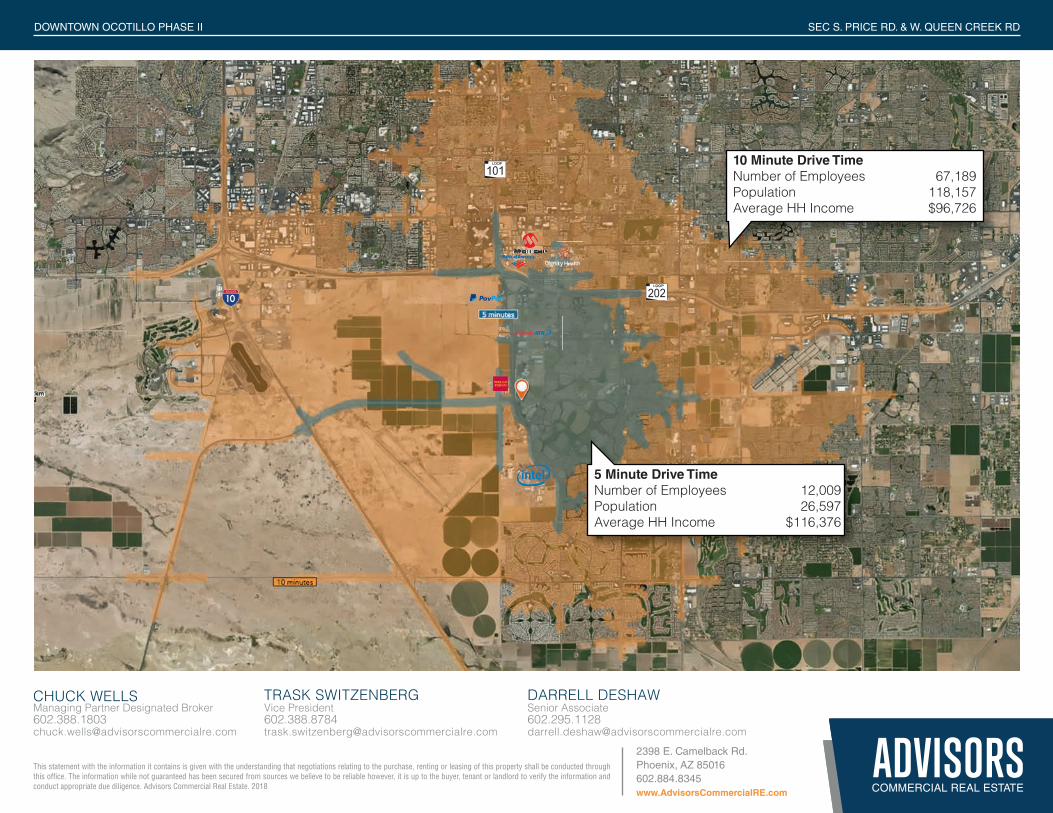
10 Minute Drive TimeNumber of Employees 67,189Population 118,157Average HH Income $96,726
5 Minute Drive TimeNumber of Employees 12,009Population 26,597Average HH Income $116,376

This statement with the information it contains is given with the understanding that negotiations relating to the purchase, renting or leasing of this property shall be conducted through this office. The information while not guaranteed has been secured from sources we believe to be reliable however, it is up to the buyer, tenant or landlord to verify the information and conduct appropriate due diligence. Advisors Commercial Real Estate. 2018
2398 E. Camelback Rd. Phoenix, AZ 85016602.884.8345www.AdvisorsCommercialRE.com
SEC S. PRICE RD. & W. QUEEN CREEK RDDOWNTOWN OCOTILLO PHASE II
Demographic and Income Profile2855 W Queen Creek Rd, Chandler, Arizona, 85248 Prepared by EsriRing: 1 mile radius Latitude: 33.26141
Longitude: -111.88686
AreaStateUSA
Trends 2017-2022Trends 2017-2022
Ann
ual R
ate
(in
perc
ent)
2.22
1.81.61.41.2
10.80.60.40.2
0Population Households Families Owner HHs Median HH Income
20172022
Population by AgePopulation by Age
Perc
ent
16
14
12
10
8
6
4
2
00-4 5-9 10-14 15-19 20-24 25-34 35-44 45-54 55-64 65-74 75-84 85+
2017 Household Income 2017 Household Income
<$15K4.4%
$15K - $24K5.0%
$25K - $34K5.2%
$35K - $49K9.1%
$50K - $74K15.4%
$75K - $99K13.9%
$100K - $149K22.1% $150K - $199K
13.0%
$200K+11.8%
2017 Population by Race2017 Population by Race
Perc
ent
70
60
50
40
30
20
10
0White Black Am. Ind. Asian Pacific Other Two+
2017 Percent Hispanic Origin: 13.5%
Source: U.S. Census Bureau, Census 2010 Summary File 1. Esri forecasts for 2017 and 2022.
May 14, 2018
©2018 Esri Page 2 of 6
Demographic and Income Profile2855 W Queen Creek Rd, Chandler, Arizona, 85248 Prepared by EsriRing: 1 mile radius Latitude: 33.26141
Longitude: -111.88686
Summary Census 2010 2017 2022Population 4,579 5,857 6,563Households 1,861 2,383 2,668Families 1,213 1,525 1,699Average Household Size 2.44 2.44 2.44Owner Occupied Housing Units 973 1,174 1,319Renter Occupied Housing Units 888 1,209 1,349Median Age 35.3 37.2 36.9
Trends: 2017 - 2022 Annual Rate Area State NationalPopulation 2.30% 1.41% 0.83%Households 2.29% 1.35% 0.79%Families 2.18% 1.27% 0.71%Owner HHs 2.36% 1.32% 0.72%Median Household Income 2.06% 1.84% 2.12%
2017 2022 Households by Income Number Percent Number Percent
<$15,000 106 4.4% 98 3.7%$15,000 - $24,999 120 5.0% 106 4.0%$25,000 - $34,999 124 5.2% 106 4.0%$35,000 - $49,999 216 9.1% 187 7.0%$50,000 - $74,999 368 15.4% 381 14.3%$75,000 - $99,999 331 13.9% 391 14.7%$100,000 - $149,999 526 22.1% 638 23.9%$150,000 - $199,999 310 13.0% 393 14.7%$200,000+ 282 11.8% 367 13.8%
Median Household Income $93,180 $103,192Average Household Income $115,536 $131,835Per Capita Income $46,908 $53,405
Census 2010 2017 2022 Population by Age Number Percent Number Percent Number Percent
0 - 4 283 6.2% 322 5.5% 370 5.6%5 - 9 318 6.9% 324 5.5% 334 5.1%10 - 14 338 7.4% 358 6.1% 341 5.2%15 - 19 330 7.2% 402 6.9% 379 5.8%20 - 24 297 6.5% 440 7.5% 519 7.9%25 - 34 703 15.3% 912 15.6% 1,174 17.9%35 - 44 753 16.4% 782 13.4% 821 12.5%45 - 54 757 16.5% 875 14.9% 822 12.5%55 - 64 501 10.9% 780 13.3% 873 13.3%65 - 74 201 4.4% 456 7.8% 618 9.4%75 - 84 76 1.7% 159 2.7% 252 3.8%
85+ 24 0.5% 46 0.8% 63 1.0%Census 2010 2017 2022
Race and Ethnicity Number Percent Number Percent Number PercentWhite Alone 3,632 79.3% 4,471 76.3% 4,817 73.4%Black Alone 238 5.2% 348 5.9% 433 6.6%American Indian Alone 42 0.9% 70 1.2% 88 1.3%Asian Alone 401 8.8% 575 9.8% 739 11.3%Pacific Islander Alone 6 0.1% 9 0.2% 12 0.2%Some Other Race Alone 131 2.9% 181 3.1% 216 3.3%Two or More Races 130 2.8% 204 3.5% 259 3.9%
Hispanic Origin (Any Race) 577 12.6% 791 13.5% 952 14.5%Data Note: Income is expressed in current dollars.
Source: U.S. Census Bureau, Census 2010 Summary File 1. Esri forecasts for 2017 and 2022.
May 14, 2018
©2018 Esri Page 1 of 6
Senior [email protected]
DARRELL DESHAWVice [email protected]
TRASK SWITZENBERGManaging Partner Designated [email protected]
CHUCK WELLS
This statement with the information it contains is given with the understanding that negotiations relating to the purchase, renting or leasing of this property shall be conducted through this office. The information while not guaranteed has been secured from sources we believe to be reliable however, it is up to the buyer, tenant or landlord to verify the information and conduct appropriate due diligence. Advisors Commercial Real Estate. 2018
2398 E. Camelback Rd. Phoenix, AZ 85016602.884.8345www.AdvisorsCommercialRE.com
SEC S. PRICE RD. & W. QUEEN CREEK RDDOWNTOWN OCOTILLO PHASE II
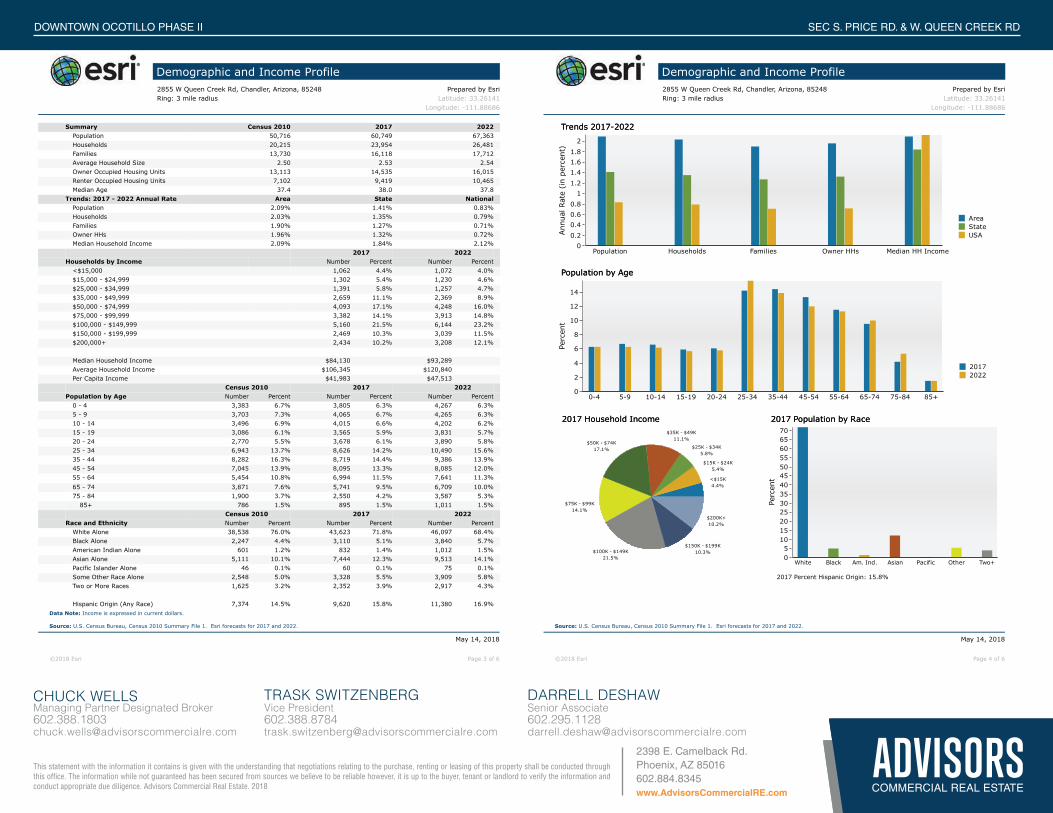
Demographic and Income Profile2855 W Queen Creek Rd, Chandler, Arizona, 85248 Prepared by EsriRing: 3 mile radius Latitude: 33.26141
Longitude: -111.88686
AreaStateUSA
Trends 2017-2022Trends 2017-2022
Ann
ual R
ate
(in
perc
ent)
21.81.61.41.2
10.80.60.40.2
0Population Households Families Owner HHs Median HH Income
20172022
Population by AgePopulation by Age
Perc
ent
14
12
10
8
6
4
2
00-4 5-9 10-14 15-19 20-24 25-34 35-44 45-54 55-64 65-74 75-84 85+
2017 Household Income 2017 Household Income
<$15K4.4%
$15K - $24K5.4%
$25K - $34K5.8%
$35K - $49K11.1%
$50K - $74K17.1%
$75K - $99K14.1%
$100K - $149K21.5%
$150K - $199K10.3%
$200K+10.2%
2017 Population by Race2017 Population by Race
Perc
ent
7065605550454035302520151050
White Black Am. Ind. Asian Pacific Other Two+
2017 Percent Hispanic Origin: 15.8%
Source: U.S. Census Bureau, Census 2010 Summary File 1. Esri forecasts for 2017 and 2022.
May 14, 2018
©2018 Esri Page 4 of 6
Demographic and Income Profile2855 W Queen Creek Rd, Chandler, Arizona, 85248 Prepared by EsriRing: 3 mile radius Latitude: 33.26141
Longitude: -111.88686
Summary Census 2010 2017 2022Population 50,716 60,749 67,363Households 20,215 23,954 26,481Families 13,730 16,118 17,712Average Household Size 2.50 2.53 2.54Owner Occupied Housing Units 13,113 14,535 16,015Renter Occupied Housing Units 7,102 9,419 10,465Median Age 37.4 38.0 37.8
Trends: 2017 - 2022 Annual Rate Area State NationalPopulation 2.09% 1.41% 0.83%Households 2.03% 1.35% 0.79%Families 1.90% 1.27% 0.71%Owner HHs 1.96% 1.32% 0.72%Median Household Income 2.09% 1.84% 2.12%
2017 2022 Households by Income Number Percent Number Percent
<$15,000 1,062 4.4% 1,072 4.0%$15,000 - $24,999 1,302 5.4% 1,230 4.6%$25,000 - $34,999 1,391 5.8% 1,257 4.7%$35,000 - $49,999 2,659 11.1% 2,369 8.9%$50,000 - $74,999 4,093 17.1% 4,248 16.0%$75,000 - $99,999 3,382 14.1% 3,913 14.8%$100,000 - $149,999 5,160 21.5% 6,144 23.2%$150,000 - $199,999 2,469 10.3% 3,039 11.5%$200,000+ 2,434 10.2% 3,208 12.1%
Median Household Income $84,130 $93,289Average Household Income $106,345 $120,840Per Capita Income $41,983 $47,513
Census 2010 2017 2022 Population by Age Number Percent Number Percent Number Percent
0 - 4 3,383 6.7% 3,805 6.3% 4,267 6.3%5 - 9 3,703 7.3% 4,065 6.7% 4,265 6.3%10 - 14 3,496 6.9% 4,015 6.6% 4,202 6.2%15 - 19 3,086 6.1% 3,565 5.9% 3,831 5.7%20 - 24 2,770 5.5% 3,678 6.1% 3,890 5.8%25 - 34 6,943 13.7% 8,626 14.2% 10,490 15.6%35 - 44 8,282 16.3% 8,719 14.4% 9,386 13.9%45 - 54 7,045 13.9% 8,095 13.3% 8,085 12.0%55 - 64 5,454 10.8% 6,994 11.5% 7,641 11.3%65 - 74 3,871 7.6% 5,741 9.5% 6,709 10.0%75 - 84 1,900 3.7% 2,550 4.2% 3,587 5.3%
85+ 786 1.5% 895 1.5% 1,011 1.5%Census 2010 2017 2022
Race and Ethnicity Number Percent Number Percent Number PercentWhite Alone 38,538 76.0% 43,623 71.8% 46,097 68.4%Black Alone 2,247 4.4% 3,110 5.1% 3,840 5.7%American Indian Alone 601 1.2% 832 1.4% 1,012 1.5%Asian Alone 5,111 10.1% 7,444 12.3% 9,513 14.1%Pacific Islander Alone 46 0.1% 60 0.1% 75 0.1%Some Other Race Alone 2,548 5.0% 3,328 5.5% 3,909 5.8%Two or More Races 1,625 3.2% 2,352 3.9% 2,917 4.3%
Hispanic Origin (Any Race) 7,374 14.5% 9,620 15.8% 11,380 16.9%Data Note: Income is expressed in current dollars.
Source: U.S. Census Bureau, Census 2010 Summary File 1. Esri forecasts for 2017 and 2022.
May 14, 2018
©2018 Esri Page 3 of 6
Senior [email protected]
DARRELL DESHAWVice [email protected]
TRASK SWITZENBERGManaging Partner Designated [email protected]
CHUCK WELLS
This statement with the information it contains is given with the understanding that negotiations relating to the purchase, renting or leasing of this property shall be conducted through this office. The information while not guaranteed has been secured from sources we believe to be reliable however, it is up to the buyer, tenant or landlord to verify the information and conduct appropriate due diligence. Advisors Commercial Real Estate. 2018
2398 E. Camelback Rd. Phoenix, AZ 85016602.884.8345www.AdvisorsCommercialRE.com
SEC S. PRICE RD. & W. QUEEN CREEK RDDOWNTOWN OCOTILLO PHASE II
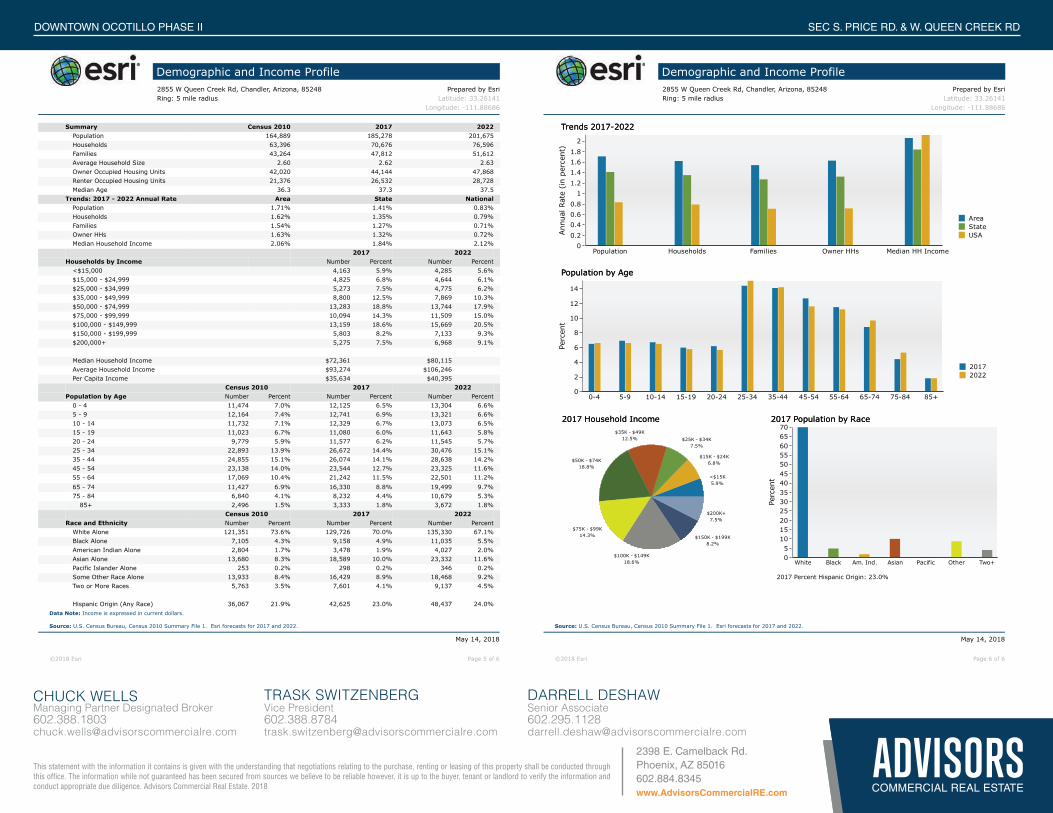
Demographic and Income Profile2855 W Queen Creek Rd, Chandler, Arizona, 85248 Prepared by EsriRing: 5 mile radius Latitude: 33.26141
Longitude: -111.88686
AreaStateUSA
Trends 2017-2022Trends 2017-2022
Ann
ual R
ate
(in
perc
ent)
21.81.61.41.2
10.80.60.40.2
0Population Households Families Owner HHs Median HH Income
20172022
Population by AgePopulation by Age
Perc
ent
14
12
10
8
6
4
2
00-4 5-9 10-14 15-19 20-24 25-34 35-44 45-54 55-64 65-74 75-84 85+
2017 Household Income 2017 Household Income
<$15K5.9%
$15K - $24K6.8%
$25K - $34K7.5%
$35K - $49K12.5%
$50K - $74K18.8%
$75K - $99K14.3%
$100K - $149K18.6%
$150K - $199K8.2%
$200K+7.5%
2017 Population by Race2017 Population by Race
Perc
ent
7065605550454035302520151050
White Black Am. Ind. Asian Pacific Other Two+
2017 Percent Hispanic Origin: 23.0%
Source: U.S. Census Bureau, Census 2010 Summary File 1. Esri forecasts for 2017 and 2022.
May 14, 2018
©2018 Esri Page 6 of 6
Demographic and Income Profile2855 W Queen Creek Rd, Chandler, Arizona, 85248 Prepared by EsriRing: 5 mile radius Latitude: 33.26141
Longitude: -111.88686
Summary Census 2010 2017 2022Population 164,889 185,278 201,675Households 63,396 70,676 76,596Families 43,264 47,812 51,612Average Household Size 2.60 2.62 2.63Owner Occupied Housing Units 42,020 44,144 47,868Renter Occupied Housing Units 21,376 26,532 28,728Median Age 36.3 37.3 37.5
Trends: 2017 - 2022 Annual Rate Area State NationalPopulation 1.71% 1.41% 0.83%Households 1.62% 1.35% 0.79%Families 1.54% 1.27% 0.71%Owner HHs 1.63% 1.32% 0.72%Median Household Income 2.06% 1.84% 2.12%
2017 2022 Households by Income Number Percent Number Percent
<$15,000 4,163 5.9% 4,285 5.6%$15,000 - $24,999 4,825 6.8% 4,644 6.1%$25,000 - $34,999 5,273 7.5% 4,775 6.2%$35,000 - $49,999 8,800 12.5% 7,869 10.3%$50,000 - $74,999 13,283 18.8% 13,744 17.9%$75,000 - $99,999 10,094 14.3% 11,509 15.0%$100,000 - $149,999 13,159 18.6% 15,669 20.5%$150,000 - $199,999 5,803 8.2% 7,133 9.3%$200,000+ 5,275 7.5% 6,968 9.1%
Median Household Income $72,361 $80,115Average Household Income $93,274 $106,246Per Capita Income $35,634 $40,395
Census 2010 2017 2022 Population by Age Number Percent Number Percent Number Percent
0 - 4 11,474 7.0% 12,125 6.5% 13,304 6.6%5 - 9 12,164 7.4% 12,741 6.9% 13,321 6.6%10 - 14 11,732 7.1% 12,329 6.7% 13,073 6.5%15 - 19 11,023 6.7% 11,080 6.0% 11,643 5.8%20 - 24 9,779 5.9% 11,577 6.2% 11,545 5.7%25 - 34 22,893 13.9% 26,672 14.4% 30,476 15.1%35 - 44 24,855 15.1% 26,074 14.1% 28,638 14.2%45 - 54 23,138 14.0% 23,544 12.7% 23,325 11.6%55 - 64 17,069 10.4% 21,242 11.5% 22,501 11.2%65 - 74 11,427 6.9% 16,330 8.8% 19,499 9.7%75 - 84 6,840 4.1% 8,232 4.4% 10,679 5.3%
85+ 2,496 1.5% 3,333 1.8% 3,672 1.8%Census 2010 2017 2022
Race and Ethnicity Number Percent Number Percent Number PercentWhite Alone 121,351 73.6% 129,726 70.0% 135,330 67.1%Black Alone 7,105 4.3% 9,158 4.9% 11,035 5.5%American Indian Alone 2,804 1.7% 3,478 1.9% 4,027 2.0%Asian Alone 13,680 8.3% 18,589 10.0% 23,332 11.6%Pacific Islander Alone 253 0.2% 298 0.2% 346 0.2%Some Other Race Alone 13,933 8.4% 16,429 8.9% 18,468 9.2%Two or More Races 5,763 3.5% 7,601 4.1% 9,137 4.5%
Hispanic Origin (Any Race) 36,067 21.9% 42,625 23.0% 48,437 24.0%Data Note: Income is expressed in current dollars.
Source: U.S. Census Bureau, Census 2010 Summary File 1. Esri forecasts for 2017 and 2022.
May 14, 2018
©2018 Esri Page 5 of 6
Senior [email protected]
DARRELL DESHAWVice [email protected]
TRASK SWITZENBERGManaging Partner Designated [email protected]
CHUCK WELLS
This statement with the information it contains is given with the understanding that negotiations relating to the purchase, renting or leasing of this property shall be conducted through this office. The information while not guaranteed has been secured from sources we believe to be reliable however, it is up to the buyer, tenant or landlord to verify the information and conduct appropriate due diligence. Advisors Commercial Real Estate. 2018
2398 E. Camelback Rd. Phoenix, AZ 85016602.884.8345www.AdvisorsCommercialRE.com
SEC S. PRICE RD. & W. QUEEN CREEK RDDOWNTOWN OCOTILLO PHASE II
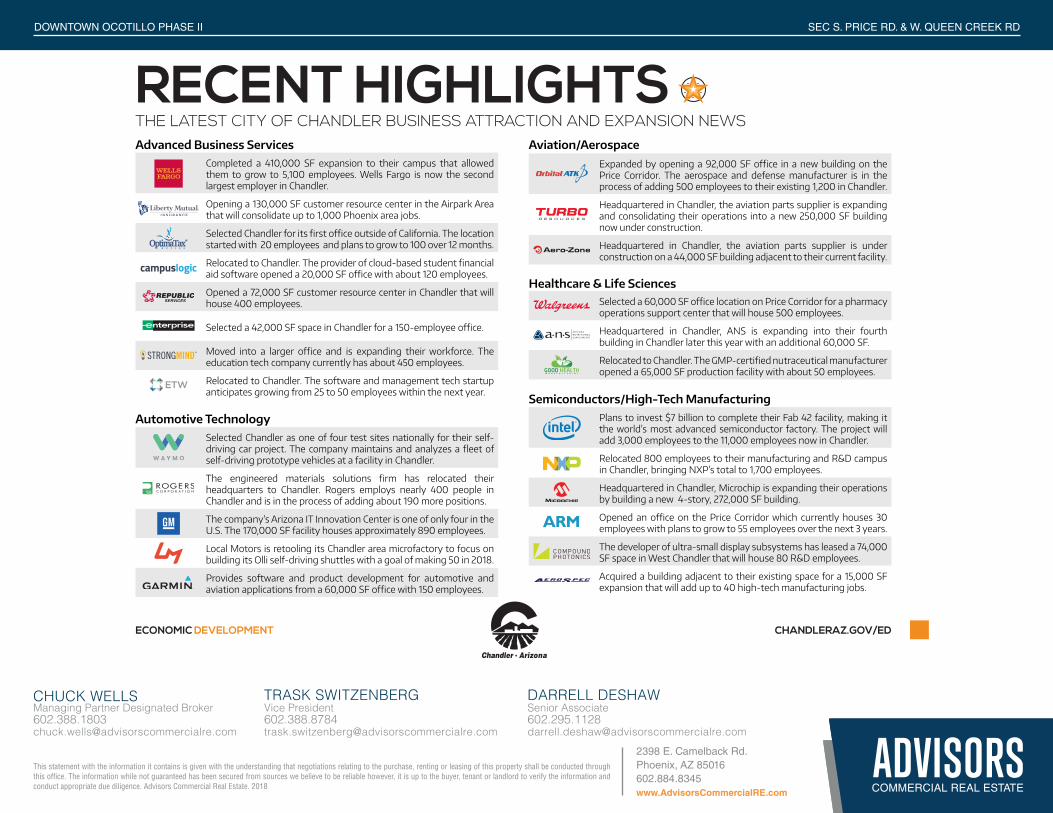
Selected Chandler as one of four test sites nationally for their self-driving car project. The company maintains and analyzes a fleet of self-driving prototype vehicles at a facility in Chandler.
The engineered materials solutions firm has relocated their headquarters to Chandler. Rogers employs nearly 400 people in Chandler and is in the process of adding about 190 more positions.
The company’s Arizona IT Innovation Center is one of only four in the U.S. The 170,000 SF facility houses approximately 890 employees.
Local Motors is retooling its Chandler area microfactory to focus on building its Olli self-driving shuttles with a goal of making 50 in 2018.
Provides software and product development for automotive and aviation applications from a 60,000 SF office with 150 employees.
ECONOMIC DEVELOPMENT CHANDLERAZ.GOV/ED
RECENT HIGHLIGHTSTHE LATEST CITY OF CHANDLER BUSINESS ATTRACTION AND EXPANSION NEWS
Semiconductors/High-Tech Manufacturing
Automotive Technology
Advanced Business Services Aviation/Aerospace
Healthcare & Life Sciences
Plans to invest $7 billion to complete their Fab 42 facility, making it the world’s most advanced semiconductor factory. The project will add 3,000 employees to the 11,000 employees now in Chandler.
Relocated 800 employees to their manufacturing and R&D campus in Chandler, bringing NXP’s total to 1,700 employees.
Headquartered in Chandler, Microchip is expanding their operations by building a new 4-story, 272,000 SF building.
Opened an office on the Price Corridor which currently houses 30 employees with plans to grow to 55 employees over the next 3 years.
The developer of ultra-small display subsystems has leased a 74,000 SF space in West Chandler that will house 80 R&D employees.
Acquired a building adjacent to their existing space for a 15,000 SF expansion that will add up to 40 high-tech manufacturing jobs.
Completed a 410,000 SF expansion to their campus that allowed them to grow to 5,100 employees. Wells Fargo is now the second largest employer in Chandler.
Opening a 130,000 SF customer resource center in the Airpark Area that will consolidate up to 1,000 Phoenix area jobs.
Selected Chandler for its first office outside of California. The location started with 20 employees and plans to grow to 100 over 12 months.
Relocated to Chandler. The provider of cloud-based student financial aid software opened a 20,000 SF office with about 120 employees.
Opened a 72,000 SF customer resource center in Chandler that will house 400 employees.
Selected a 42,000 SF space in Chandler for a 150-employee office.
Moved into a larger office and is expanding their workforce. The education tech company currently has about 450 employees.
Relocated to Chandler. The software and management tech startup anticipates growing from 25 to 50 employees within the next year.
Expanded by opening a 92,000 SF office in a new building on the Price Corridor. The aerospace and defense manufacturer is in the process of adding 500 employees to their existing 1,200 in Chandler.
Headquartered in Chandler, the aviation parts supplier is expanding and consolidating their operations into a new 250,000 SF building now under construction.
Headquartered in Chandler, the aviation parts supplier is under construction on a 44,000 SF building adjacent to their current facility.
Selected a 60,000 SF office location on Price Corridor for a pharmacy operations support center that will house 500 employees.
Headquartered in Chandler, ANS is expanding into their fourth building in Chandler later this year with an additional 60,000 SF.
Relocated to Chandler. The GMP-certified nutraceutical manufacturer opened a 65,000 SF production facility with about 50 employees.
campuslogic
Senior [email protected]
DARRELL DESHAWVice [email protected]
TRASK SWITZENBERGManaging Partner Designated [email protected]
CHUCK WELLS
This statement with the information it contains is given with the understanding that negotiations relating to the purchase, renting or leasing of this property shall be conducted through this office. The information while not guaranteed has been secured from sources we believe to be reliable however, it is up to the buyer, tenant or landlord to verify the information and conduct appropriate due diligence. Advisors Commercial Real Estate. 2018
2398 E. Camelback Rd. Phoenix, AZ 85016602.884.8345www.AdvisorsCommercialRE.com
SEC S. PRICE RD. & W. QUEEN CREEK RDDOWNTOWN OCOTILLO PHASE II
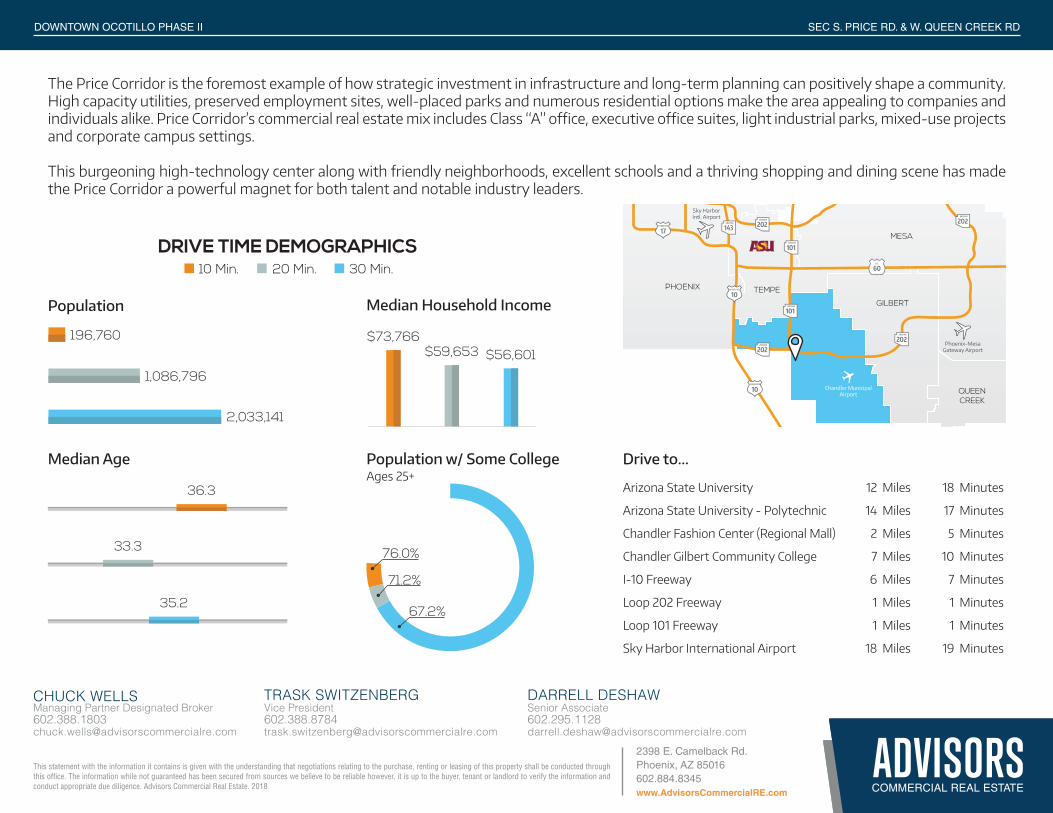
The Price Corridor is the foremost example of how strategic investment in infrastructure and long-term planning can positively shape a community. High capacity utilities, preserved employment sites, well-placed parks and numerous residential options make the area appealing to companies and individuals alike. Price Corridor’s commercial real estate mix includes Class “A” office, executive office suites, light industrial parks, mixed-use projects and corporate campus settings.
This burgeoning high-technology center along with friendly neighborhoods, excellent schools and a thriving shopping and dining scene has made the Price Corridor a powerful magnet for both talent and notable industry leaders.
PRICE CORRIDOR
ECONOMIC DEVELOPMENT CHANDLERAZ.GOV/ED
Population Median Household Income
Median Age Population w/ Some College
10 Min. 20 Min. 30 Min.
Arizona State University 12 Miles 18 Minutes
Arizona State University - Polytechnic 14 Miles 17 Minutes
Chandler Fashion Center (Regional Mall) 2 Miles 5 Minutes
Chandler Gilbert Community College 7 Miles 10 Minutes
I-10 Freeway 6 Miles 7 Minutes
Loop 202 Freeway 1 Miles 1 Minutes
Loop 101 Freeway 1 Miles 1 Minutes
Sky Harbor International Airport 18 Miles 19 Minutes
Drive to...
GILBERT
QUEENCREEK
MESA
TEMPEPHOENIX
SCOTTSDALE
PARADISEVALLEY
202ARIZONA
INTERSTATE
10
101ARIZONA
INTERSTATE
10
143ARIZONA 202
ARIZONA 202ARIZONA
202ARIZONA
101ARIZONA
51ARIZONA
60U.S.
INTERSTATE
17
Chandler MunicipalAirport
Phoenix-MesaGateway Airport
Sky HarborIntl. Airport
Data Source: ESRI Business Analyst (2017)
Ages 25+36.3
33.3
35.2
Data Source: Google Maps. Drive to distance and times are from Price Corridor’s geographic center
DRIVE TIME DEMOGRAPHICS
196,760
1,086,796
2,033,141
$73,766$59,653 $56,601
76.0%
71.2%
67.2%
Senior [email protected]
DARRELL DESHAWVice [email protected]
TRASK SWITZENBERGManaging Partner Designated [email protected]
CHUCK WELLS