Embed Size (px)
DESCRIPTION
Changing the Demographics of the Leadership Pipeline: One Woman, One State at a Time. Presented by Diana Cordova, Ph.D. Vice President, Leadership Programs American Council on Education (ACE) TWHE Conference – April 2013. The American Council on Education. - PowerPoint PPT Presentation
Citation preview
Changing the Demographics of the Leadership Pipeline:
One Woman, One State at a Time
Presented by Diana Cordova, Ph.D.
Vice President, Leadership Programs
American Council on Education (ACE)
TWHE Conference – April 2013
The American Council on Education
• ACE represents the presidents of all types of U.S. accredited degree-granting institutions, which include two- and four-year colleges, private and public universities, and non-profit and for-profit entities.
• Over 1,800 member institutions, 75 percent of which have been with ACE for more than 10 years.
• Together, ACE member institutions serve 80 percent of today’s college students.
Strategic Priority for Leadership Provide leadership programs to meet the need for diverse, skilled, and ample leadership for higher education.
ACE LeadershipFocuses on programs, research, and resources for presidents and CAOs
Focuses on programs and resources for rising administrators (dept. chairs and above)
Helps foster greater diversity and inclusion in leadership ranks
Focuses on programs and research that help senior leaders improve institutional capacity and effectiveness
ACE Leadership at-a-Glance•25+ program convenings held in 2012-2013•Over 600 total participants•Launched 4 new programs and initiatives during 2012-2013:
– ACE Institute for New Presidents (INP)– ACE Leadership Academy for Department Chairs– Spectrum Executive Leadership Program– Diversity Matters in U.S. Higher Education Issue Brief
Series•And the best is yet to come…
6
ACE’s Commitment to Advancing Women Leaders
• 1977 - National Women’s Leadership Forums• 1977 - ACE Women’s Network established
– Now in all 50 states plus Puerto Rico and DC– Over 5,000+ women leaders take part in programs
sponsored by state networks every year– Network Executive Council provides guidance to state
networks • 2003 - Regional Leadership Forums • 2012 - Moving the Needle Initiative • 2013 - Launch of Spectrum Program
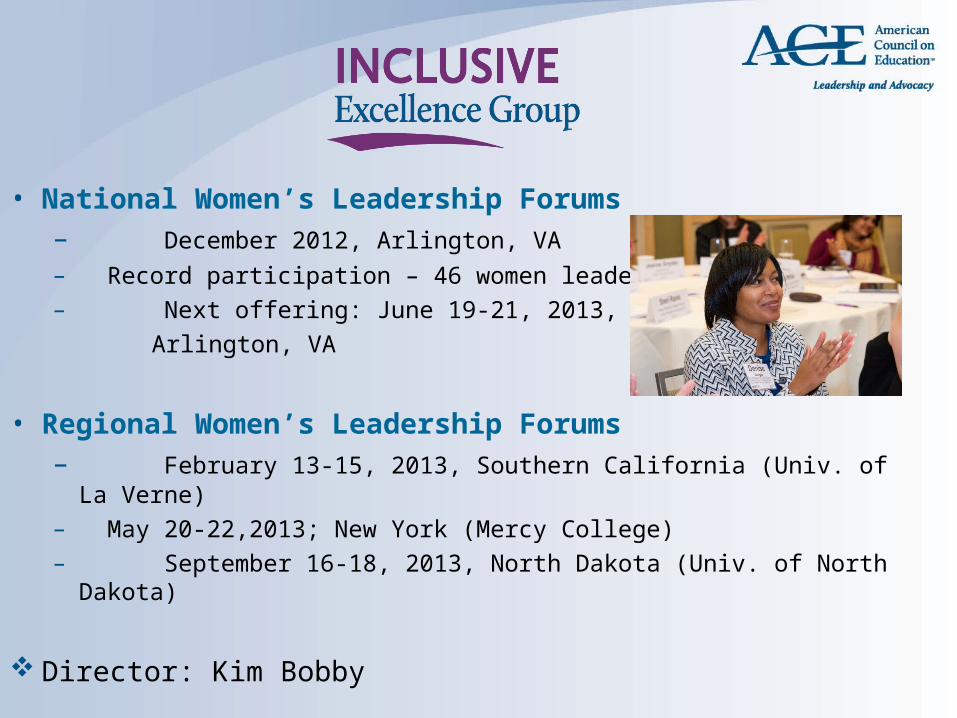
• National Women’s Leadership Forums– December 2012, Arlington, VA – Record participation – 46 women leaders– Next offering: June 19-21, 2013, Arlington, VA
• Regional Women’s Leadership Forums– February 13-15, 2013, Southern California (Univ. of La Verne)– May 20-22,2013; New York (Mercy College)– September 16-18, 2013, North Dakota (Univ. of North Dakota)
Director: Kim Bobby
• National Women’s Leadership Forum– 3-day program for senior women administrators– Held twice per year (June and December) in Washington,
DC– Curricular topics:
• Fundraising, Leading in Times of Crisis, Media Training• Developing an Effective Search Strategy• Mock Video-taped Interviews and CV/Cover Letter Review • Contract Negotiation • Financial Empowerment for Women Leaders• Transitioning to the Presidency (advice from experienced women
presidents)
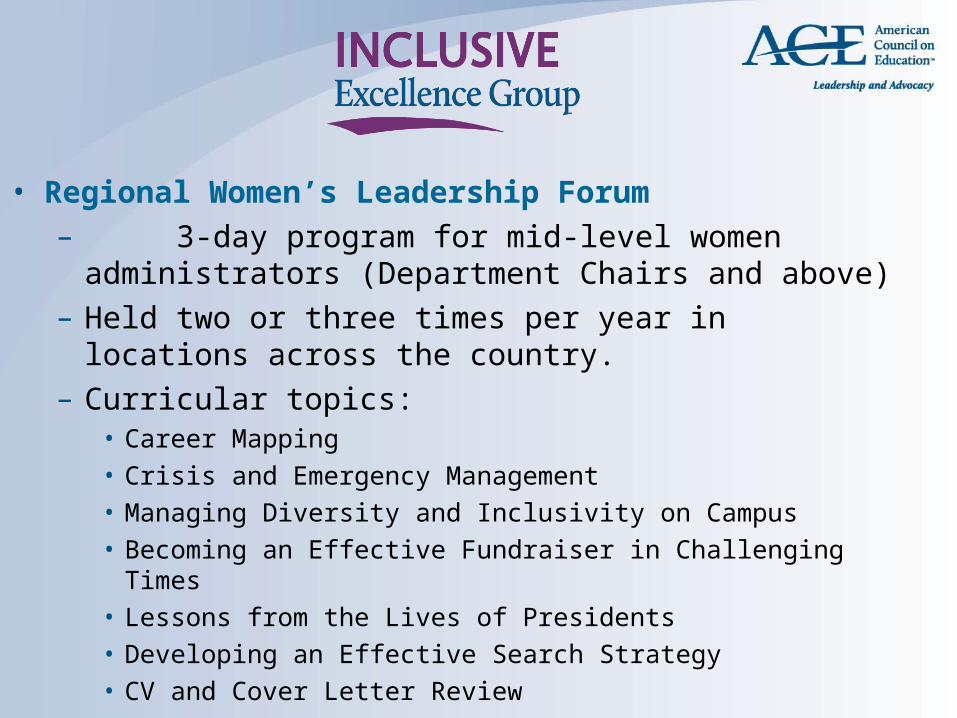
• Regional Women’s Leadership Forum– 3-day program for mid-level women administrators
(Department Chairs and above)– Held two or three times per year in locations across the
country. – Curricular topics:
• Career Mapping• Crisis and Emergency Management• Managing Diversity and Inclusivity on Campus• Becoming an Effective Fundraiser in Challenging Times• Lessons from the Lives of Presidents • Developing an Effective Search Strategy• CV and Cover Letter Review
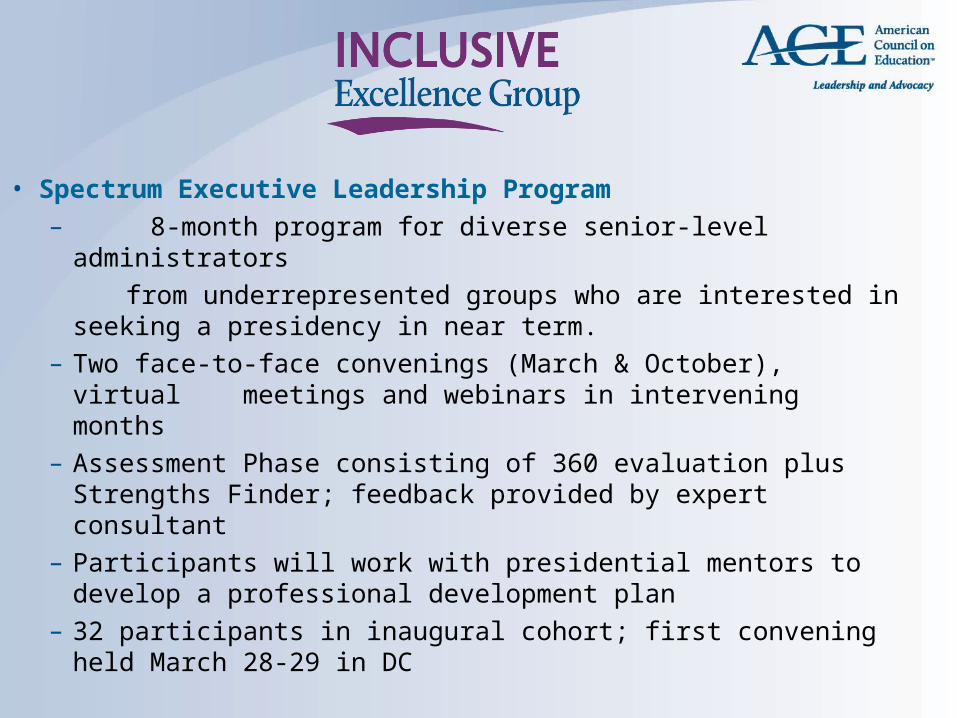
• Spectrum Executive Leadership Program– 8-month program for diverse senior-level administrators from underrepresented groups who are interested in seeking
a presidency in near term. – Two face-to-face convenings (March & October), virtual
meetings and webinars in intervening months– Assessment Phase consisting of 360 evaluation plus
Strengths Finder; feedback provided by expert consultant– Participants will work with presidential mentors to develop a
professional development plan– 32 participants in inaugural cohort; first convening held March
28-29 in DC
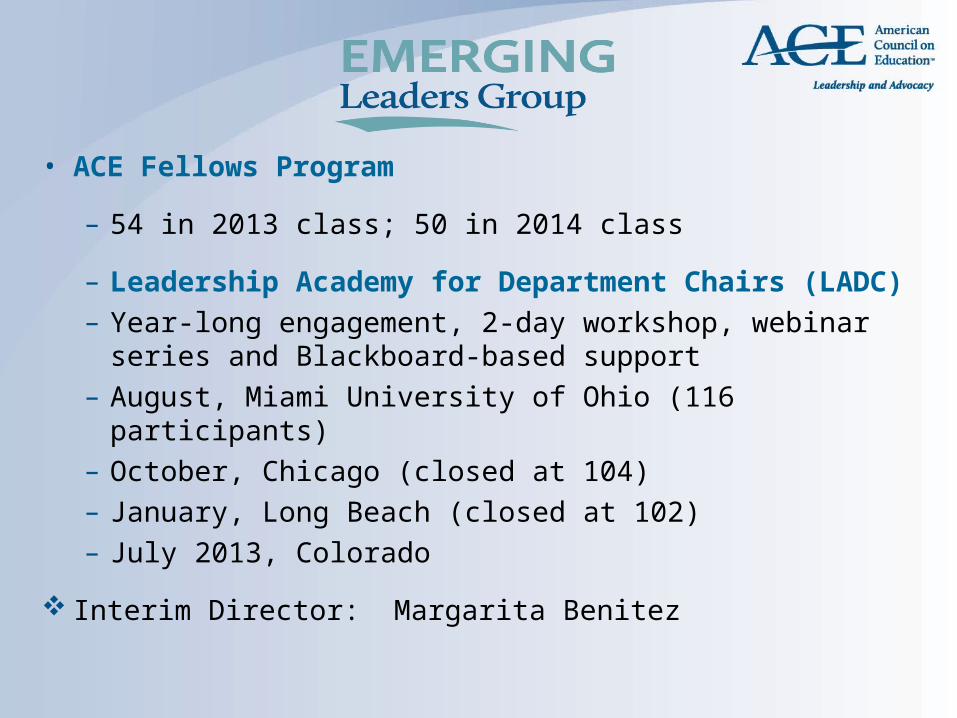
• ACE Fellows Program
– 54 in 2013 class; 50 in 2014 class
– Leadership Academy for Department Chairs (LADC)– Year-long engagement, 2-day workshop, webinar series
and Blackboard-based support – August, Miami University of Ohio (116 participants)– October, Chicago (closed at 104)– January, Long Beach (closed at 102)– July 2013, Colorado
Interim Director: Margarita Benitez
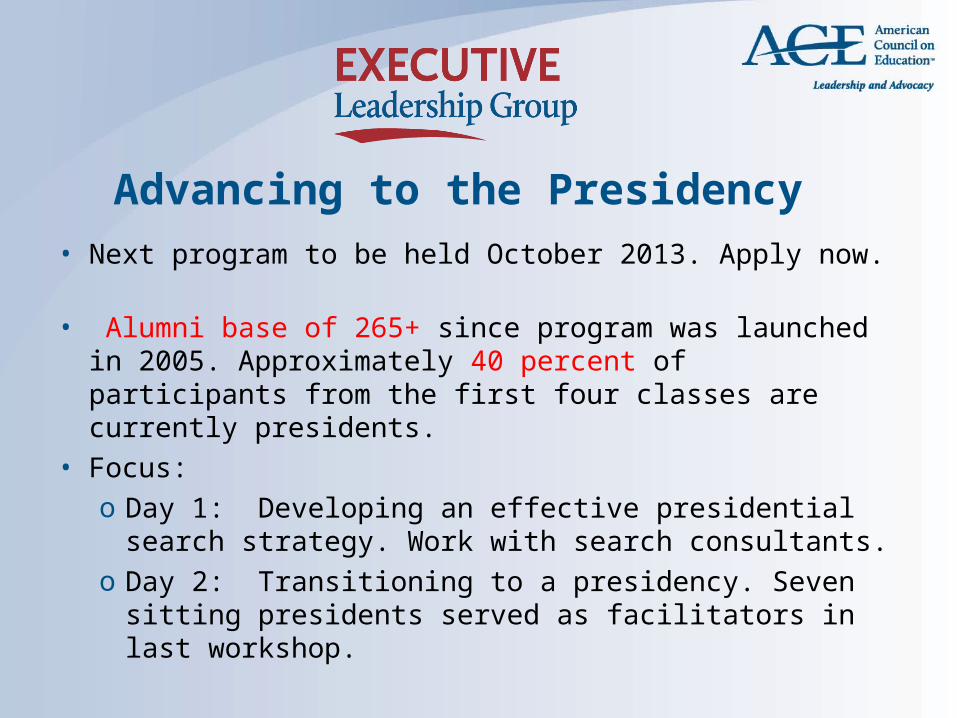
Advancing to the Presidency • Next program to be held October 2013. Apply now. • Alumni base of 265+ since program was launched in
2005. Approximately 40 percent of participants from the first four classes are currently presidents.
• Focus:o Day 1: Developing an effective presidential search
strategy. Work with search consultants. o Day 2: Transitioning to a presidency. Seven sitting
presidents served as facilitators in last workshop.
ACE Institute for New Presidents• Focus—practical executive leadership development
for presidents in their first 2 years of service• 9 months (July – March)
– Three face-to-face convenings • July, December, and March
– Webinar series• 20 participants in inaugural class• Currently soliciting applications for 2013-2014 class
ACE Institute for New Presidents•Major topics addressed:
o Governance: Working effectively with Boards o Building a high-performing executive teamo Leading in times of crisiso Developing a sound communications strategy and building relationships with the mediao Avoiding presidential traps and landmines and staying true to valueso Embarking on a capital campaigno Making smart decisions about technologyo The brand advantage: Branding the institutiono Effective use of legal counsel – developing the legal “radar”
15
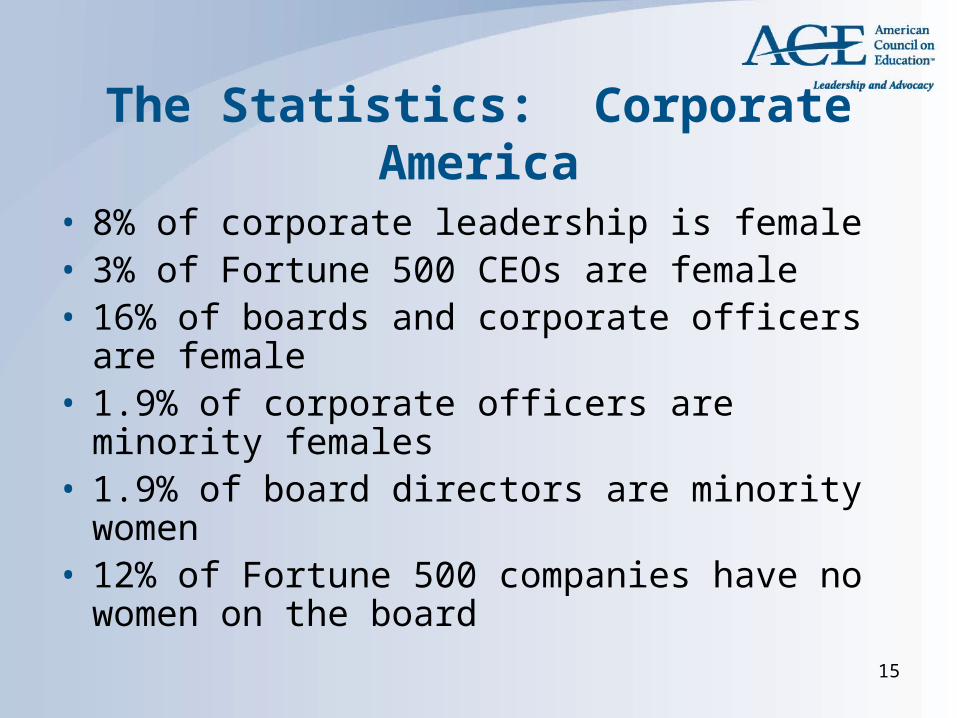
The Statistics: Corporate America• 8% of corporate leadership is female• 3% of Fortune 500 CEOs are female• 16% of boards and corporate officers are female• 1.9% of corporate officers are minority females• 1.9% of board directors are minority women• 12% of Fortune 500 companies have no women
on the board
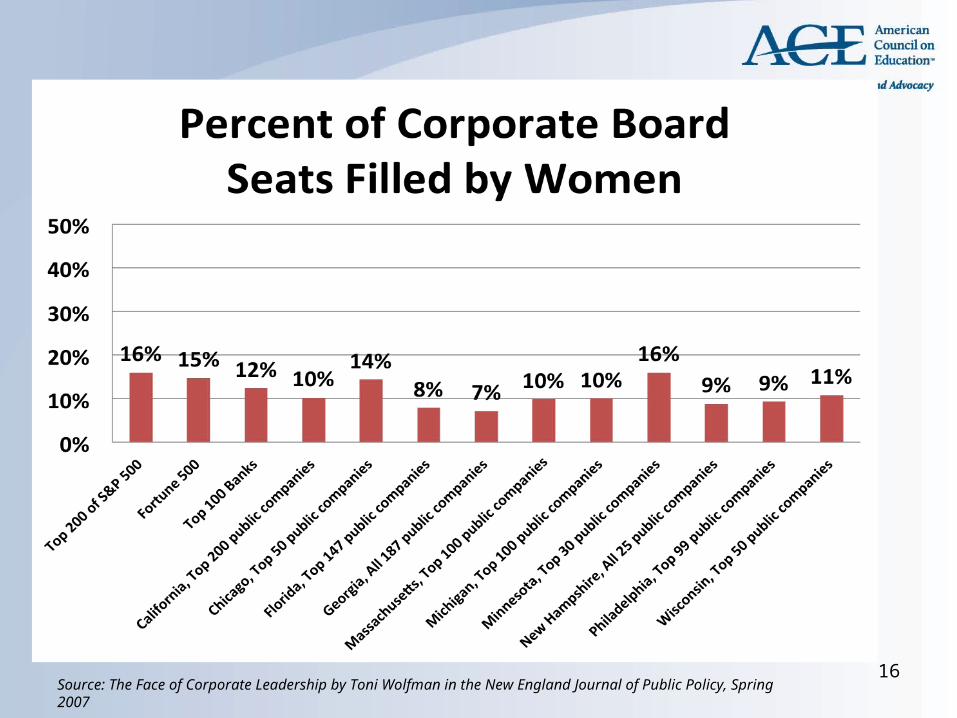
16Source: The Face of Corporate Leadership by Toni Wolfman in the New England Journal of Public Policy, Spring 2007
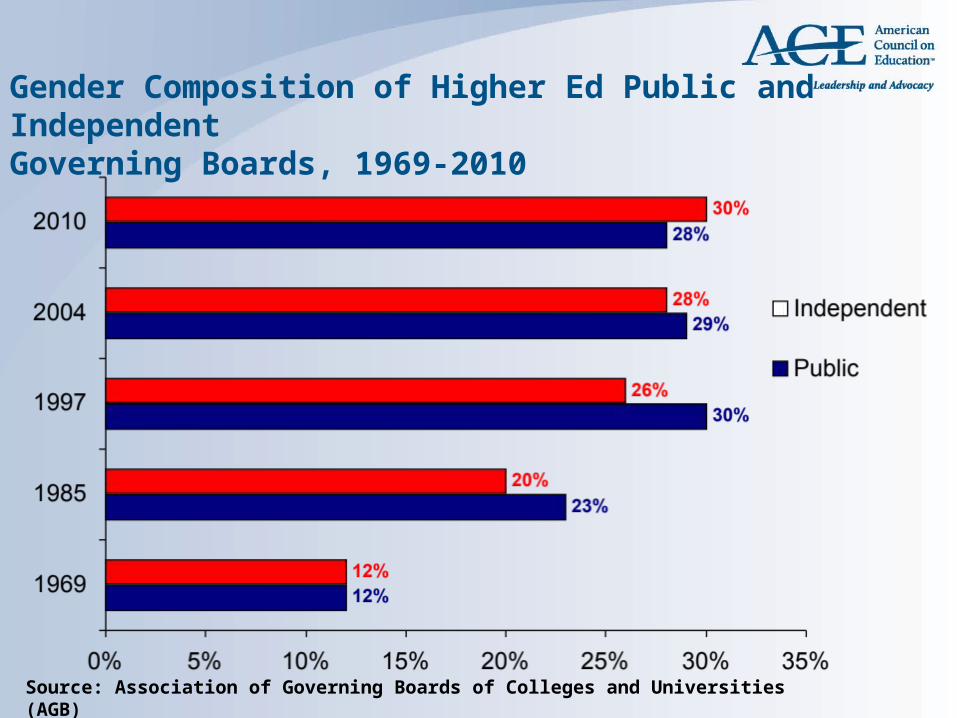
Gender Composition of Higher Ed Public and Independent Governing Boards, 1969-2010
Source: Association of Governing Boards of Colleges and Universities (AGB)
1818
Women in Law
• In 2010 women comprised:– 47% of law students– 31% of attorneys– 20% of partners at law firms
• Womens’ salaries were 77% of men’s salaries.
19
Women in Politics
• 17% of Senate and House of Representatives
• 9% of the mayors of 100 largest US cities• 24% of state legislatures• 12% of governors
20
How are We Doing in Higher Ed?
The American College President 2012 • Only study that provides a comprehensive, in-depth look
at presidents from all sectors of American higher education.
• This is the 7th report since 1986 providing a great source of longitudinal data.
• 1,662 respondents – 50% response rate for 2012 edition.
• ACE is grateful to TIAA-CREF Institute for their support of this report.
ACPS 2012: Women and the Presidency
• Share of women presidents has increased from 23 percent to 26 percent since 2006 (13 percent in 1986).
• Most of the recent growth among White women. Only 4 percent of presidents are women of color.
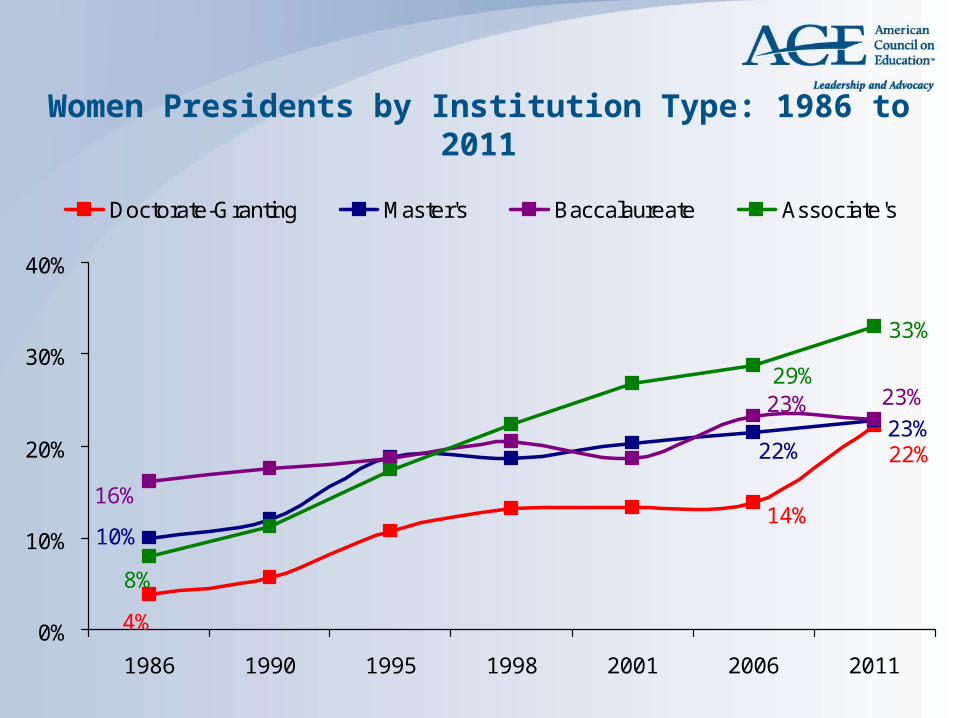
Women Presidents by Institution Type: 1986 to 2011
4%
22%
14%10%
22%23%
16%
23% 23%
8%
33%
29%
0%
10%
20%
30%
40%
1986 1990 1995 1998 2001 2006 2011
Doctorate-Granting Master's Baccalaureate Associate's
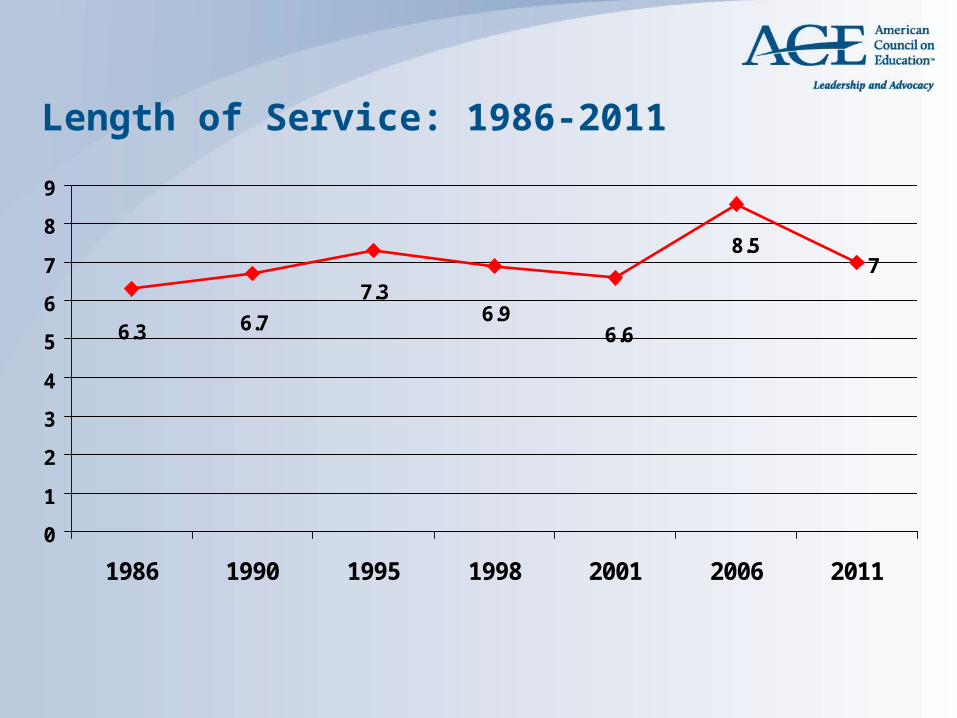
Length of Service: 1986-2011
78.5
6.66.9
7.36.76.3
0
1
2
3
4
5
6
7
8
9
1986 1990 1995 1998 2001 2006 2011
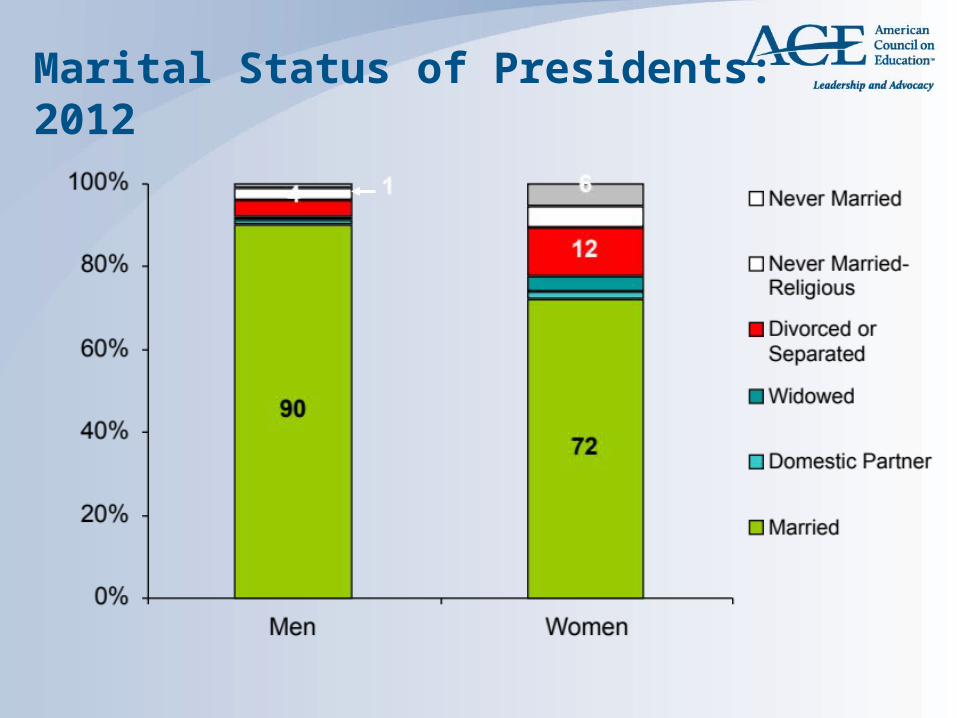
Marital Status of Presidents: 2012
2
ACPS 2012: Racial/Ethnic Diversity of Presidents
• Share of racial/ethnic minority presidents decreased from 14 percent in 2006 to 13 percent in 2011.
• The decline in minority presidents appears to occur within HSI’s.
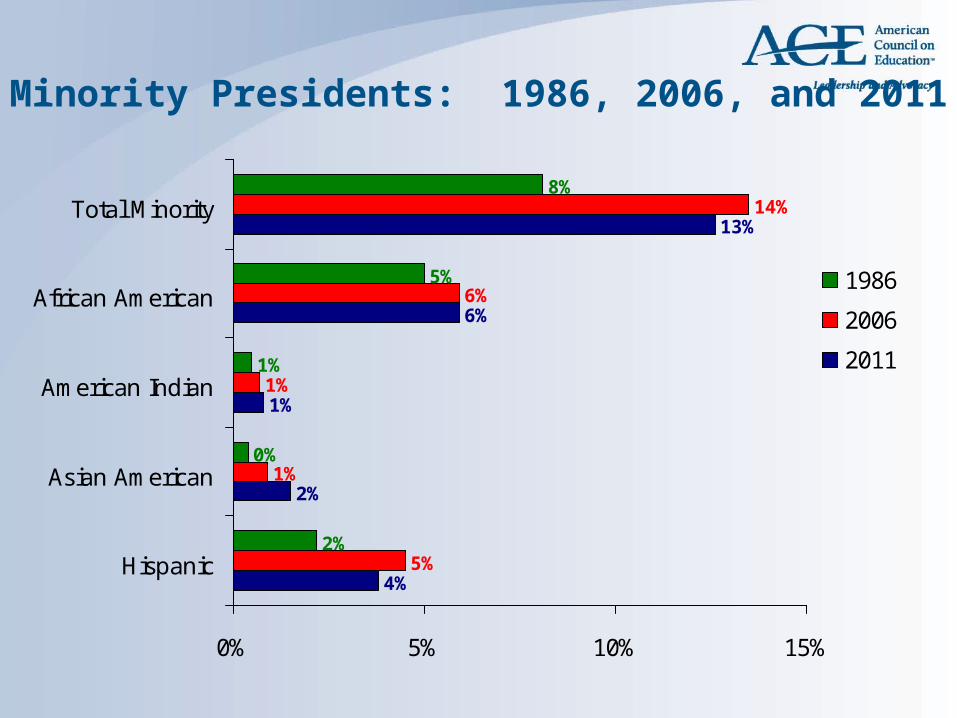
Minority Presidents: 1986, 2006, and 2011
4%
2%
1%
6%
13%
5%
1%
1%
6%
14%
2%
0%
1%
5%
8%
0% 5% 10% 15%
Hispanic
Asian American
American Indian
African American
Total Minority
1986
2006
2011
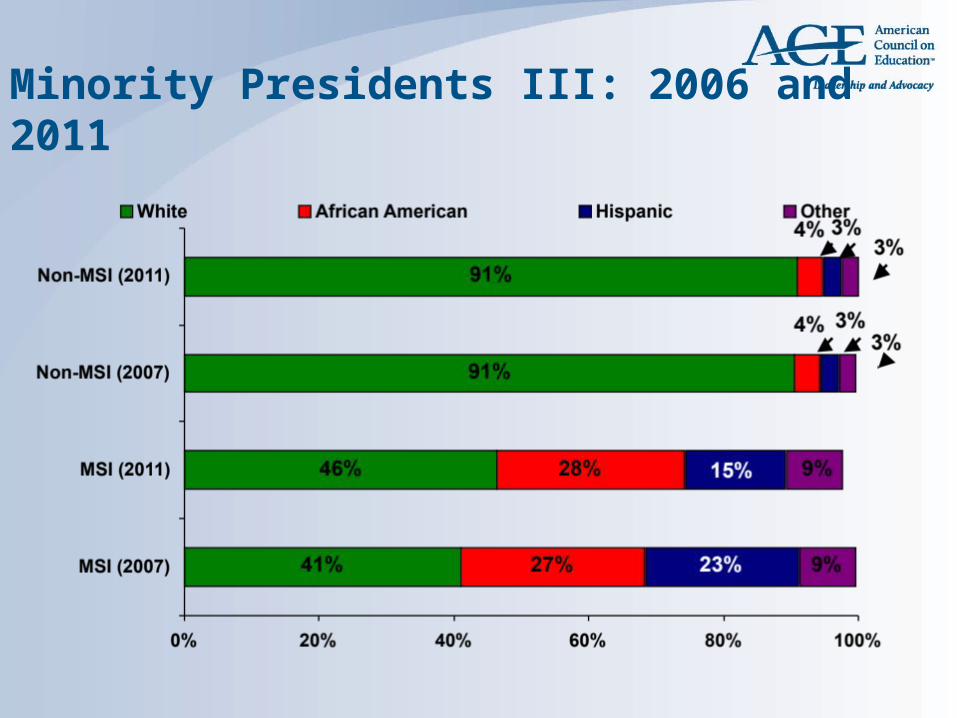
Minority Presidents III: 2006 and 2011
ACPS 2012: Aging of Presidents
• Average age of presidents in 2011 is 61, up from 60 in 2006.
• 58 percent of presidents are over the age of 61 (up from 49 percent in 2006).
• Between 1986 and 2011 the majority of presidents have shifted from 50 or younger to 61 or older
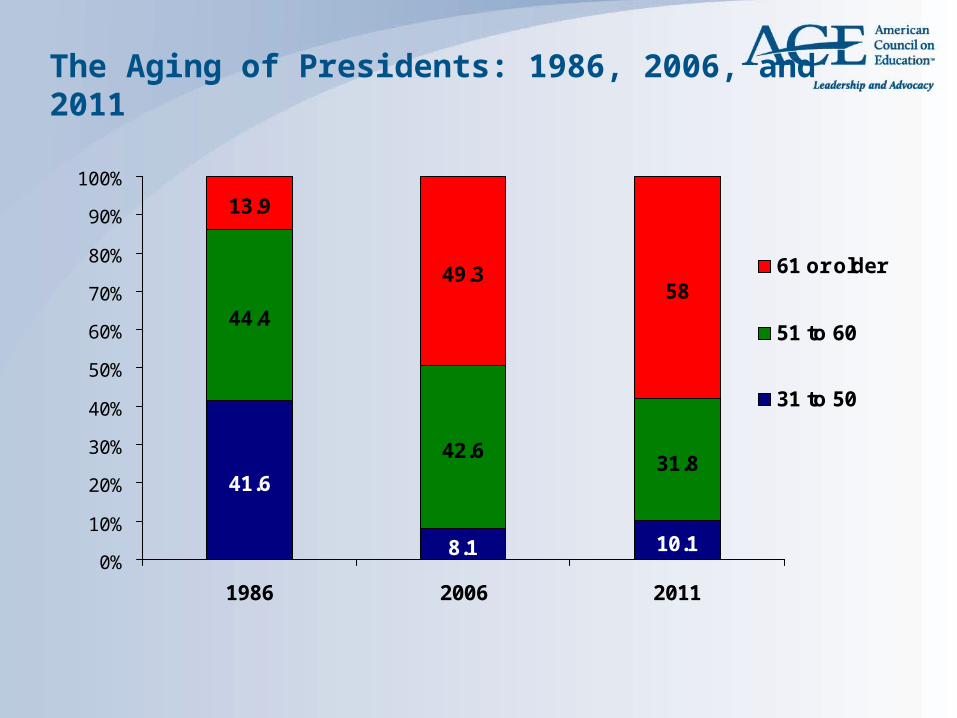
The Aging of Presidents: 1986, 2006, and 2011
8.1 10.1
44.4
42.6 31.8
13.9
58
41.6
49.3
0%
10%
20%
30%
40%
50%
60%
70%
80%
90%
100%
1986 2006 2011
61 or older
51 to 60
31 to 50
ACPS 2012: Career Paths of Presidents
• Twenty percent of presidents’ most recent prior position was outside of higher education, up from 13 percent in 2006.
• Presidents coming from outside higher education no more racially diverse.
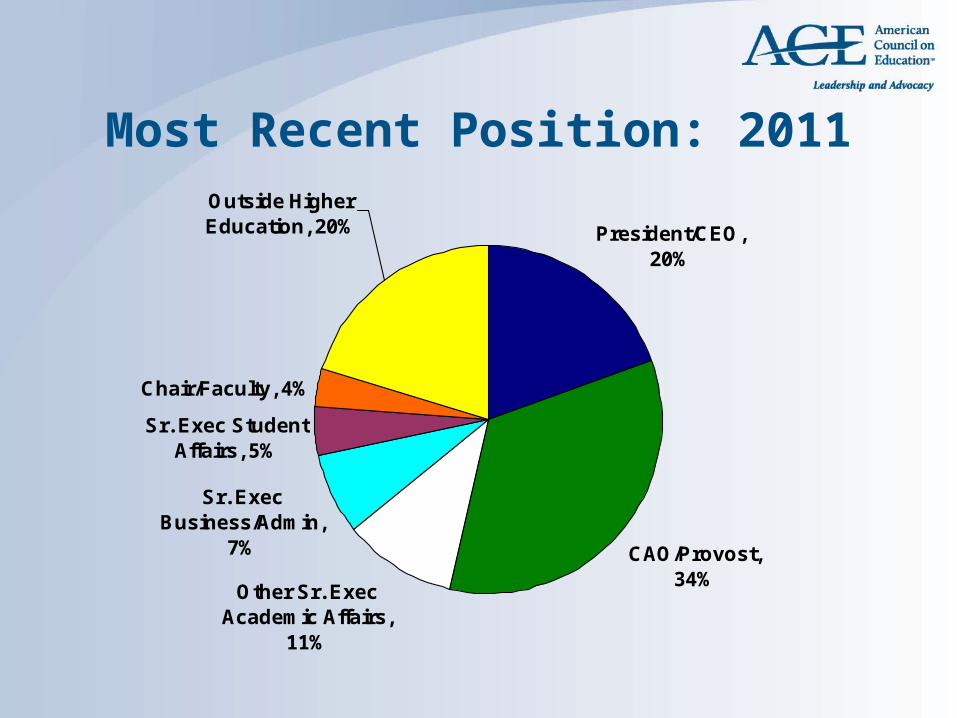
Most Recent Position: 2011
President/CEO, 20%
CAO/Provost, 34%Other Sr. Exec
Academic Affairs, 11%
Sr. Exec Business/Admin,
7%
Sr. Exec Student Affairs, 5%
Chair/Faculty, 4%
Outside Higher Education, 20%
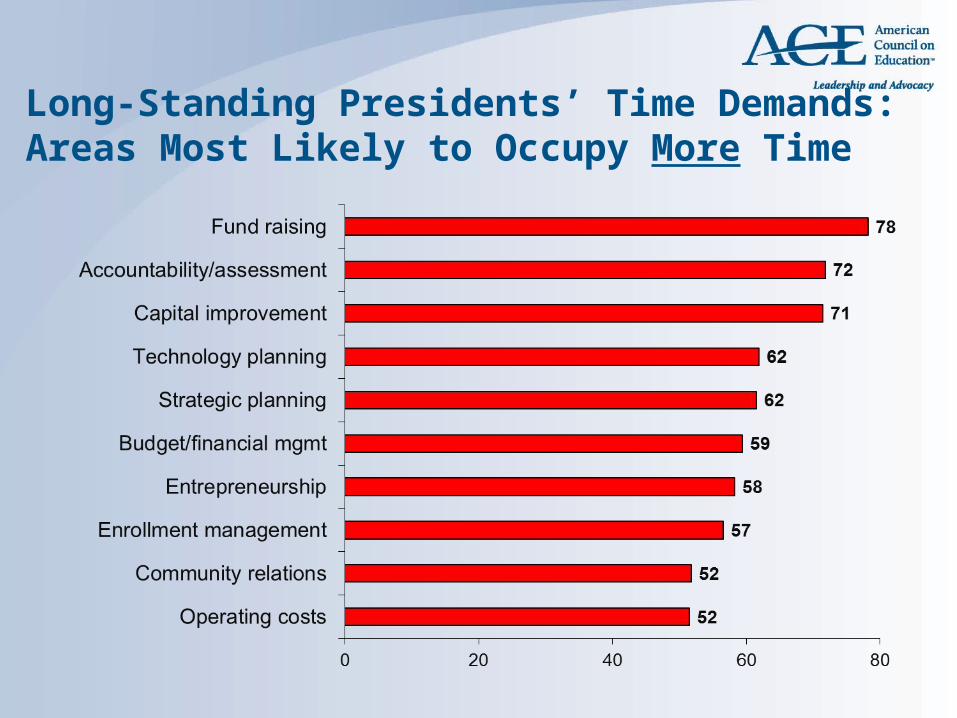
Long-Standing Presidents’ Time Demands: Areas Most Likely to Occupy More Time
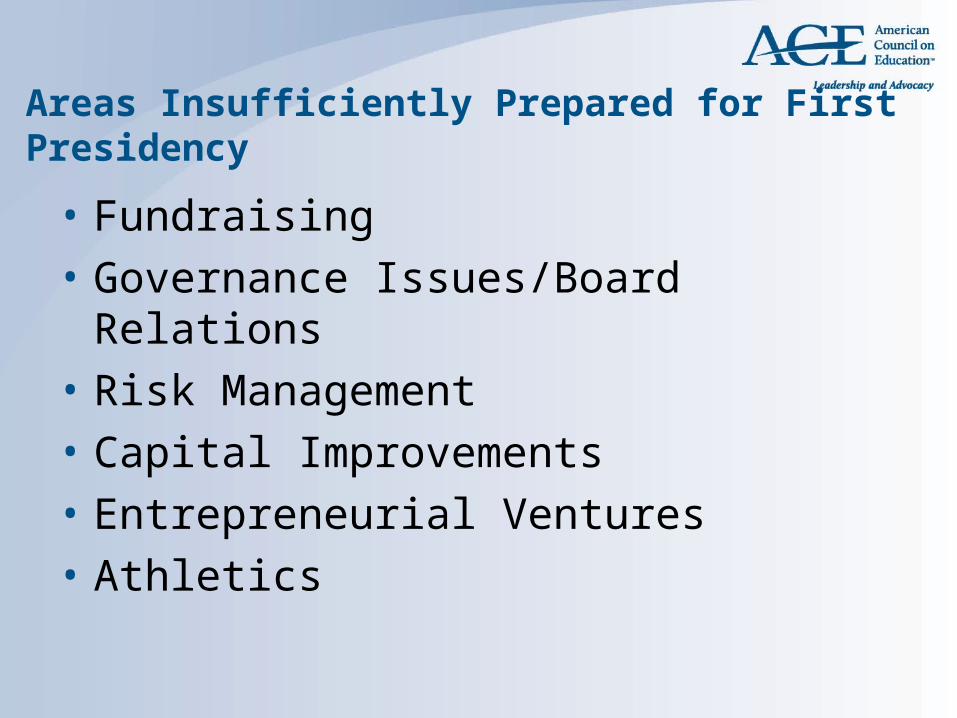
Areas Insufficiently Prepared for First Presidency
• Fundraising • Governance Issues/Board Relations• Risk Management• Capital Improvements• Entrepreneurial Ventures• Athletics
On the Pathway to the Presidency• Follow-up study to The American College President: 2012
Edition.
• Describes characteristics of senior leaders other than presidents (previous report in 2005).
• Partnership with College and University Professional Association for Human Resources (CUPA-HR)
• Sponsored by TIAA-CREF Institute.
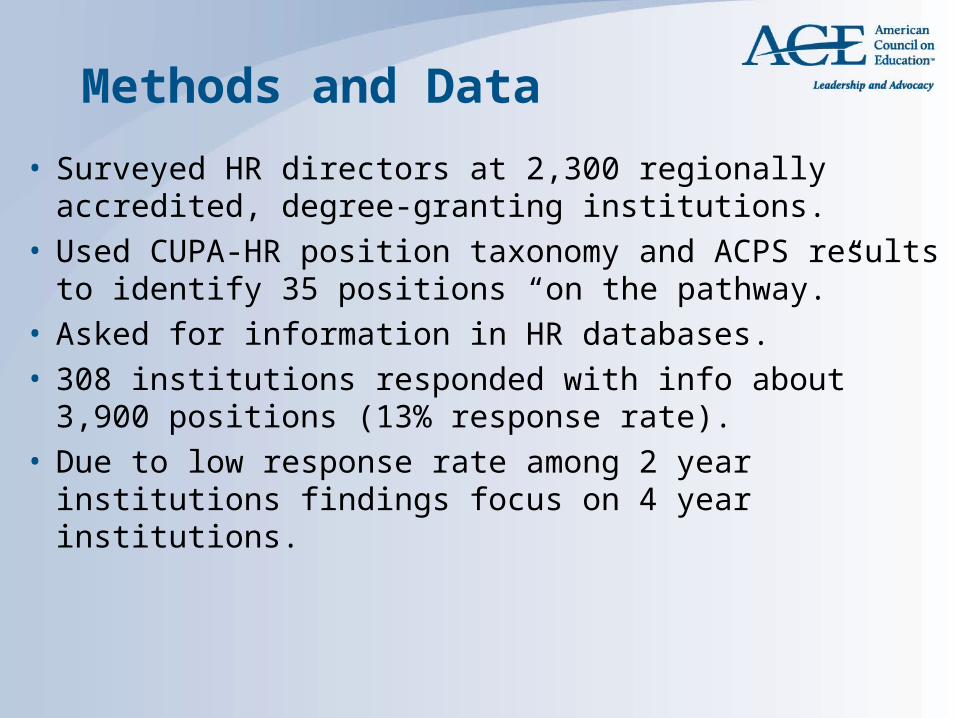
Methods and Data• Surveyed HR directors at 2,300 regionally accredited,
degree-granting institutions.• Used CUPA-HR position taxonomy and ACPS results
to identify 35 positions “on the pathway.”• Asked for information in HR databases.• 308 institutions responded with info about 3,900
positions (13% response rate). • Due to low response rate among 2 year institutions
findings focus on 4 year institutions.
On the Pathway to the Presidency
• What is the age profile of senior leaders? • Are those in position to be the next
generation of presidents more diverse than the current group?
• To what extent have current leaders benefitted from succession planning?
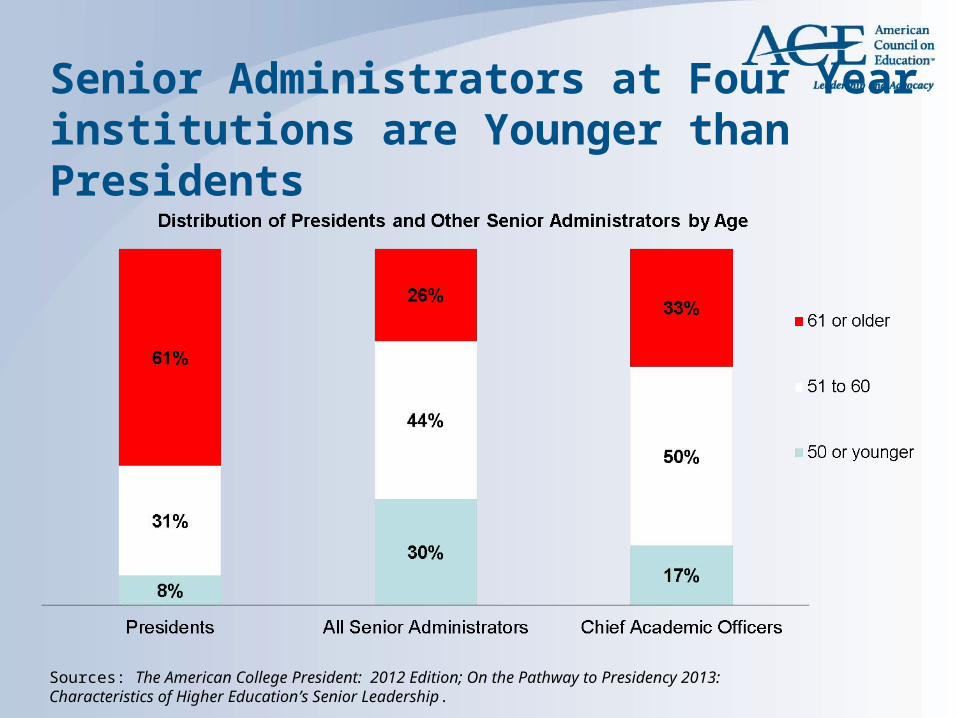
Senior Administrators at Four Year institutions are Younger than Presidents
Sources: The American College President: 2012 Edition; On the Pathway to Presidency 2013: Characteristics of Higher Education’s Senior Leadership.
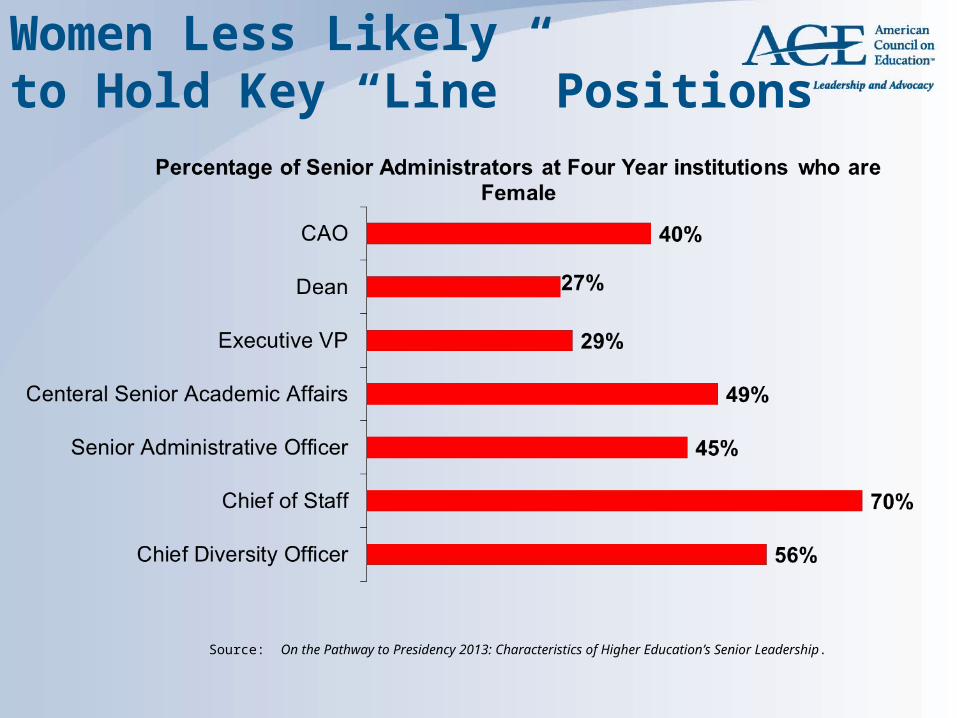
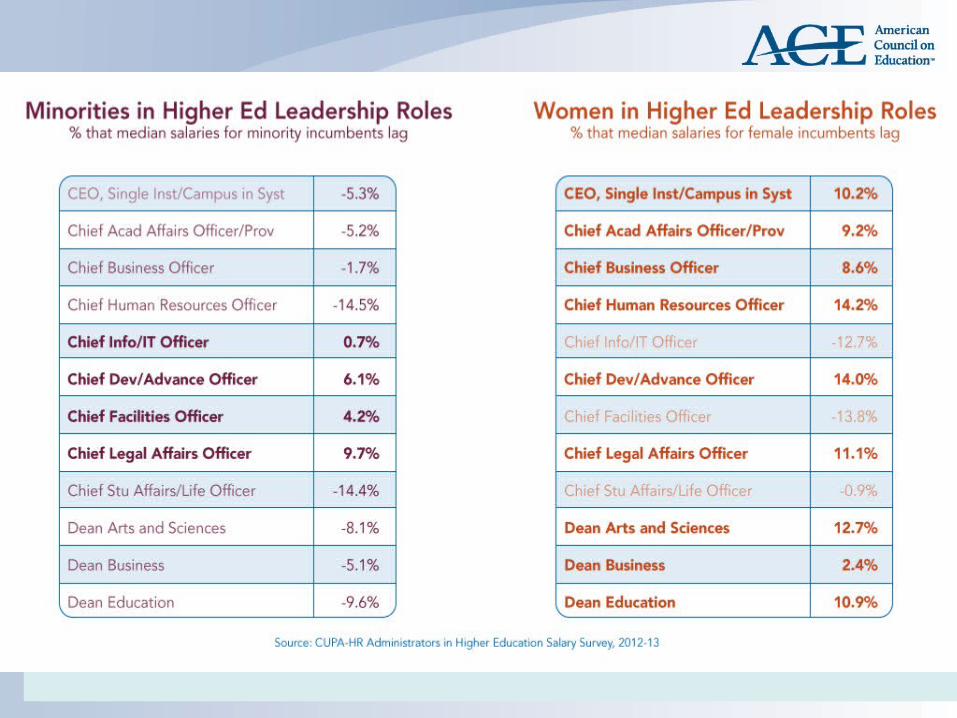
Women Less Likely to Hold Key “Line” Positions
Source: On the Pathway to Presidency 2013: Characteristics of Higher Education’s Senior Leadership.
41
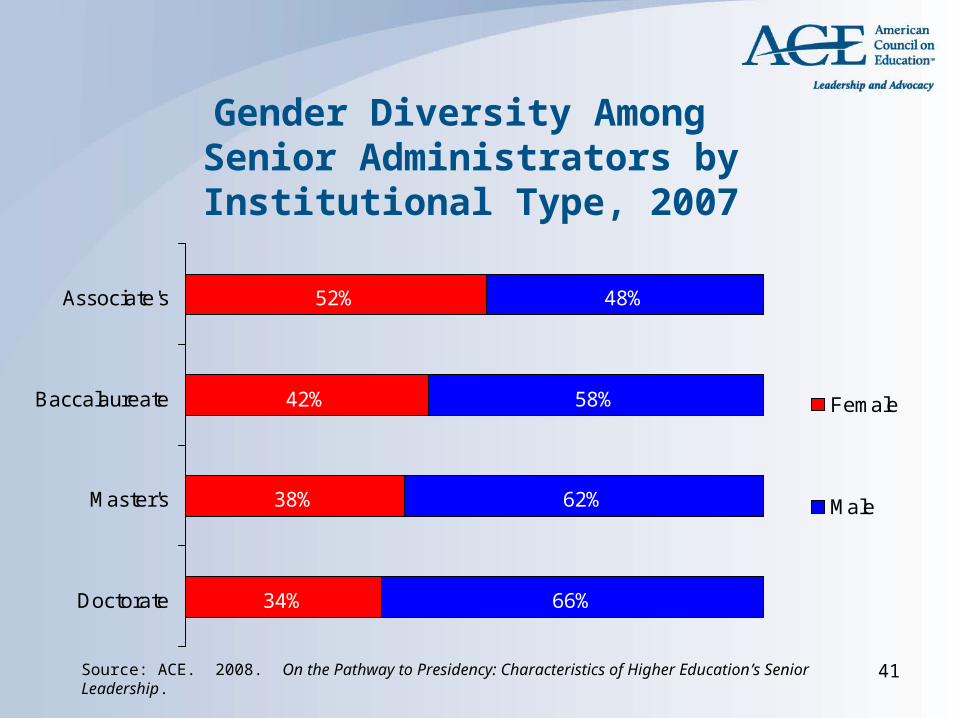
Gender Diversity Among Senior Administrators by Institutional Type,
2007
34%
38%
42%
52%
66%
62%
58%
48%
Doctorate
Master's
Baccalaureate
Associate's
Female
Male
Source: ACE. 2008. On the Pathway to Presidency: Characteristics of Higher Education’s Senior Leadership.
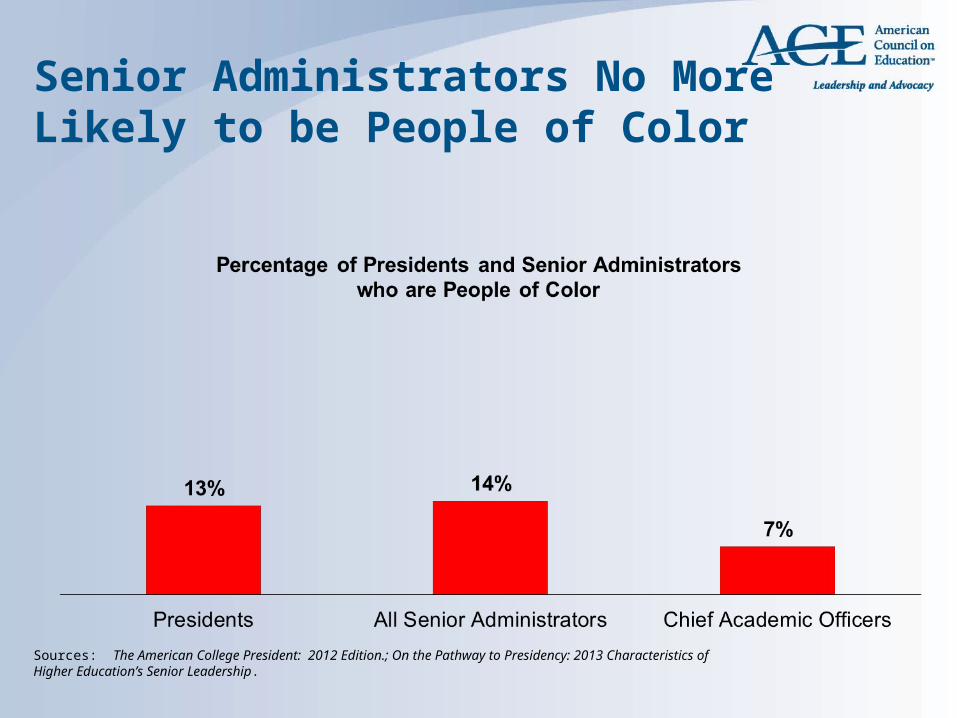
Senior Administrators No More Likely to be People of Color
Sources: The American College President: 2012 Edition.; On the Pathway to Presidency: 2013 Characteristics of Higher Education’s Senior Leadership.
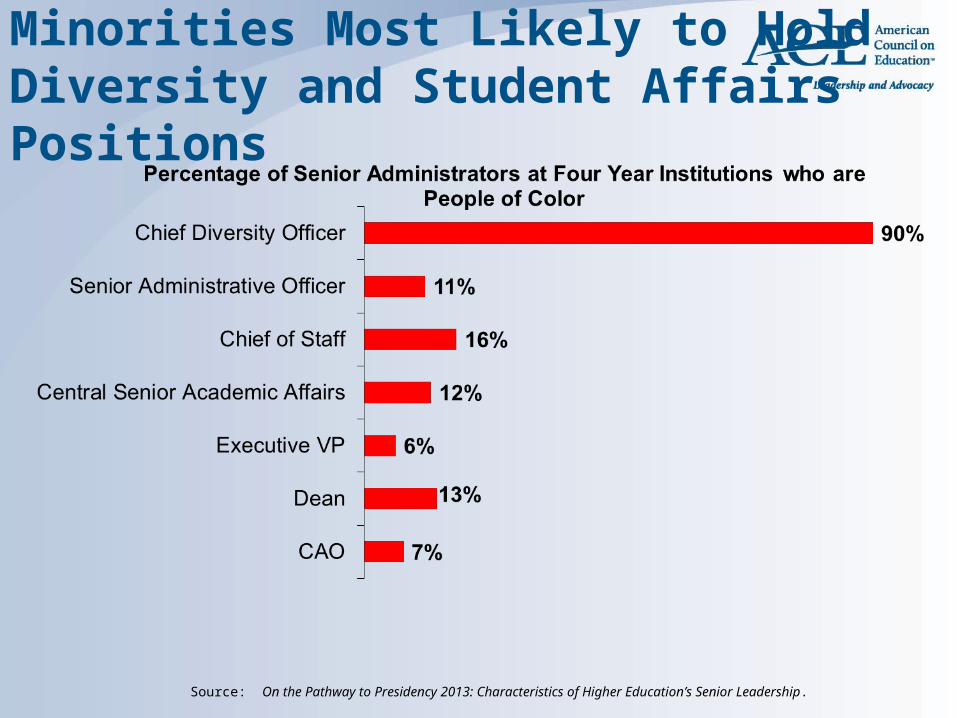
Minorities Most Likely to Hold Diversity and Student Affairs Positions
Source: On the Pathway to Presidency 2013: Characteristics of Higher Education’s Senior Leadership.
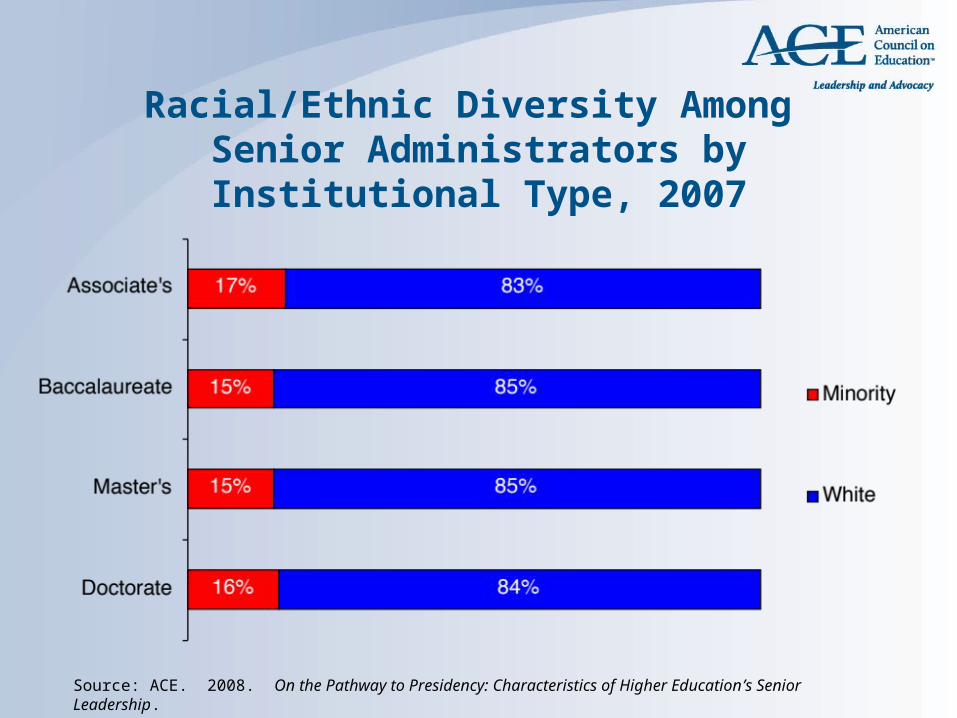
Racial/Ethnic Diversity Among Senior Administrators by Institutional Type,
2007
Source: ACE. 2008. On the Pathway to Presidency: Characteristics of Higher Education’s Senior Leadership.
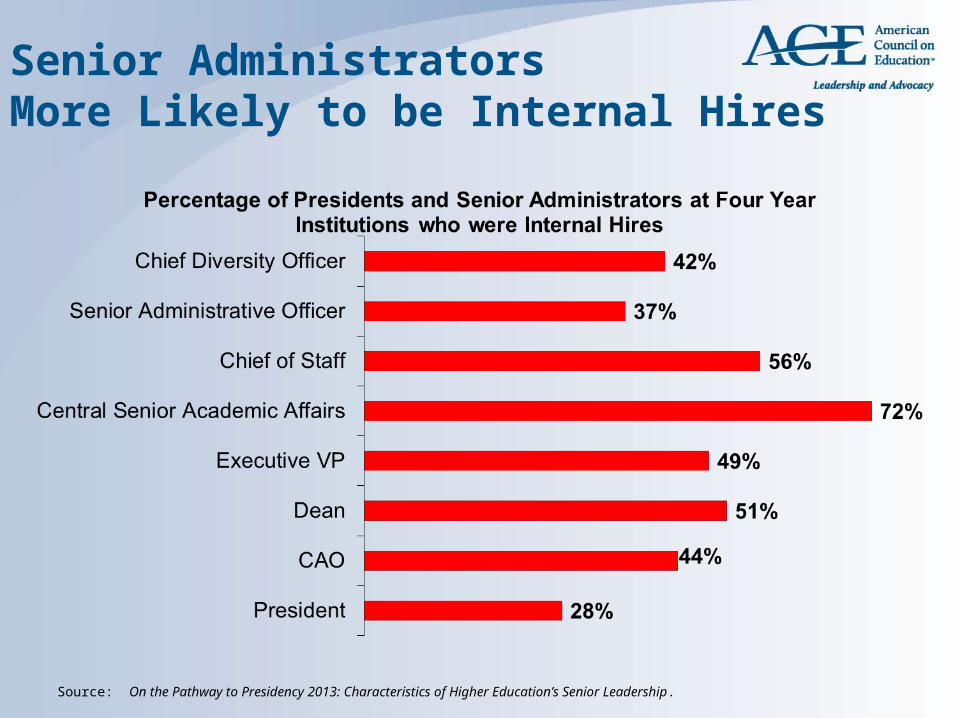
Senior Administrators More Likely to be Internal Hires
Source: On the Pathway to Presidency 2013: Characteristics of Higher Education’s Senior Leadership.
46
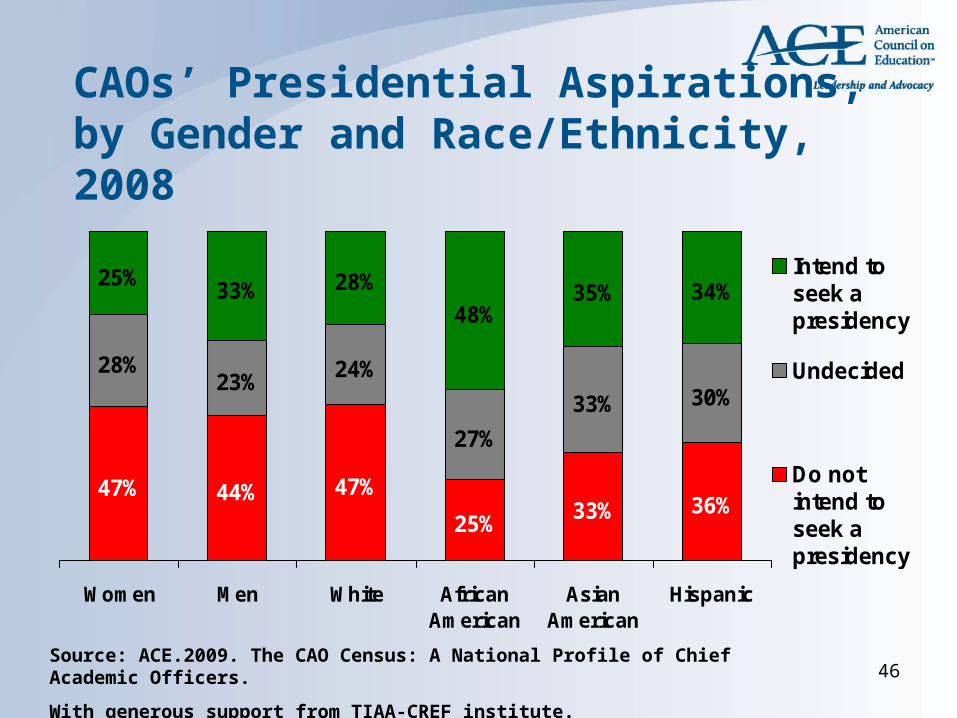
CAOs’ Presidential Aspirations, by Gender and Race/Ethnicity, 2008
47% 44% 47%25% 33% 36%
28%23% 24%
27%33% 30%
25% 33% 28%48%
35% 34%
Women Men White AfricanAmerican
AsianAmerican
Hispanic
Intend toseek apresidency
Undecided
Do notintend toseek apresidency
Source: ACE.2009. The CAO Census: A National Profile of Chief Academic Officers.
With generous support from TIAA-CREF institute.
47
Putting it all in Perspective • Sobering news regarding gender/racial diversity in
presidential ranks. Women continue to increase their representation, but at a slow pace.
• The high number of projected presidential retirements may present a challenge or even a perceived temporary shortage of leadership. But it also presents an opportunity to diversify the leadership of higher education.
• Need for institutions to focus intentionally on succession planning.
• Increasing Board diversity will be key if we are to make progress in diversifying senior leadership ranks.
For Discussion
– What are some of the continuing barriers that are preventing more women from reaching top leadership positions in higher education?
– What are the key levers for change? What needs to change in order for more women to reach the top?
For Discussion
– How can we more effectively sustain women leaders once they reach the top? What type of resources and support mechanisms ought to be in place? What can the associations do to support these efforts?

Thoughts and Questions