Embed Size (px)
Citation preview
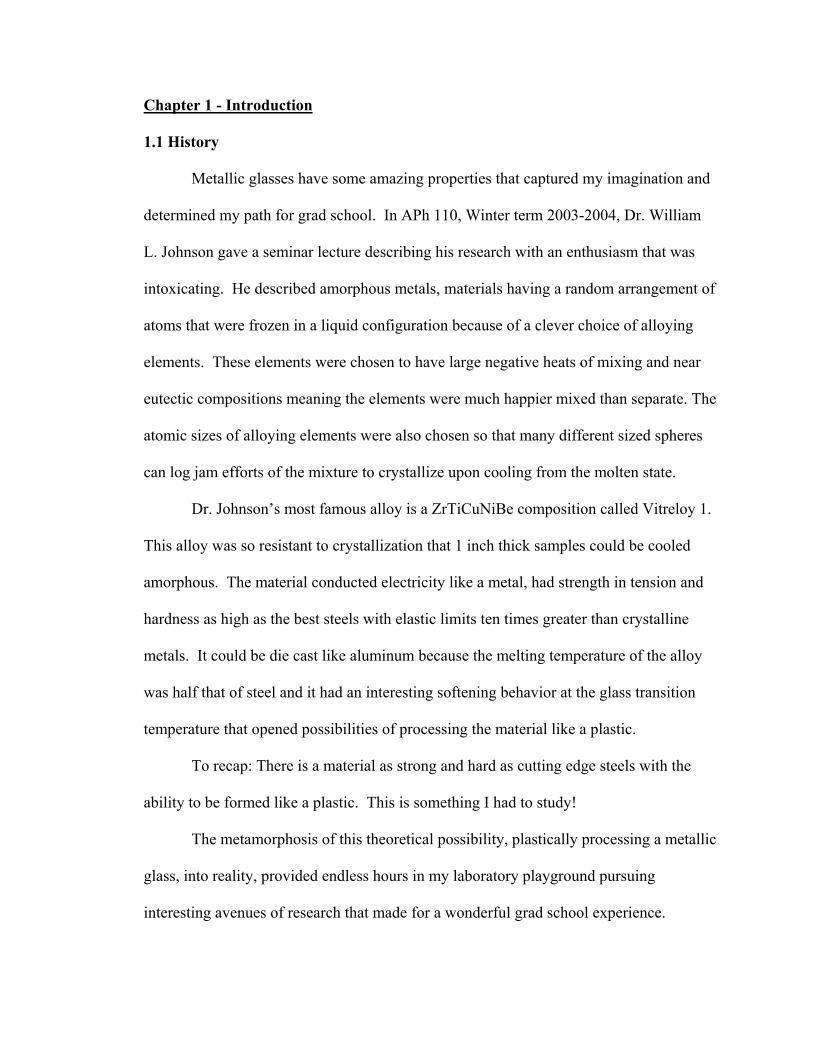
Chapter 1 - Introduction
1.1 History
Metallic glasses have some amazing properties that captured my imagination and
determined my path for grad school. In APh 110, Winter term 2003-2004, Dr. William
L. Johnson gave a seminar lecture describing his research with an enthusiasm that was
intoxicating. He described amorphous metals, materials having a random arrangement of
atoms that were frozen in a liquid configuration because of a clever choice of alloying
elements. These elements were chosen to have large negative heats of mixing and near
eutectic compositions meaning the elements were much happier mixed than separate. The
atomic sizes of alloying elements were also chosen so that many different sized spheres
can log jam efforts of the mixture to crystallize upon cooling from the molten state.
Dr. Johnson’s most famous alloy is a ZrTiCuNiBe composition called Vitreloy 1.
This alloy was so resistant to crystallization that 1 inch thick samples could be cooled
amorphous. The material conducted electricity like a metal, had strength in tension and
hardness as high as the best steels with elastic limits ten times greater than crystalline
metals. It could be die cast like aluminum because the melting temperature of the alloy
was half that of steel and it had an interesting softening behavior at the glass transition
temperature that opened possibilities of processing the material like a plastic.
To recap: There is a material as strong and hard as cutting edge steels with the
ability to be formed like a plastic. This is something I had to study!
The metamorphosis of this theoretical possibility, plastically processing a metallic
glass, into reality, provided endless hours in my laboratory playground pursuing
interesting avenues of research that made for a wonderful grad school experience.
1.2
1.2 Physics of Metallic Glasses
Below the glass transition temperature, metallic glasses are liquids stuck in one
configuration. They are formed by rapidly quenching molten material. As the material
cools, a competition between thermodynamics and kinetics ensues. Thermodynamics
requires that materials exist in the lowest energy state at a given temperature. Below the
melting temperature, the lowest energy state for materials is a crystal. To form a crystal
however, the atoms must move into a crystalline configuration. As a liquid cools, the
viscosity of the liquid increases or stated another way, the mobility of the atoms
decreases. If a material can be cooled quickly enough to limit atom mobility and frustrate
crystallization, a glass is formed. The speed at which an alloy must be cooled to frustrate
crystallization is called its glass forming ability (GFA). Due to the slower cooling rate of
thicker samples, another measure of GFA is an alloy's critical casting thickness. Critical
casting thickness is the maximum diameter a cylindrical sample can be cast amorphous
(see Derivation 1).
A glass at room temperature can be reheated above Tg to a viscous liquid state
where the mobility of the atoms increases as a function of temperature. This increased
mobility allows the glass, which bypassed crystallization when originally cooled from the
melt, to sample various configurations and eventually the crystalline state is found. Most
heating processes are too slow to bypass crystallization of metallic glasses, but one alloy
very resistant to crystallization, PdNiCuP, has been cooled from the molten state to room
temperature and then reheated to the molten state with no crystallization [1].
These thermodynamic properties can be measured in a Differential Scanning
Calorimeter (DSC). The amount of heat required to equalize the temperatures of an
1.3
empty reference crucible and a crucible with a known weight of sample is measured as a
function of temperature. The heat difference divided by the mass of the sample is the
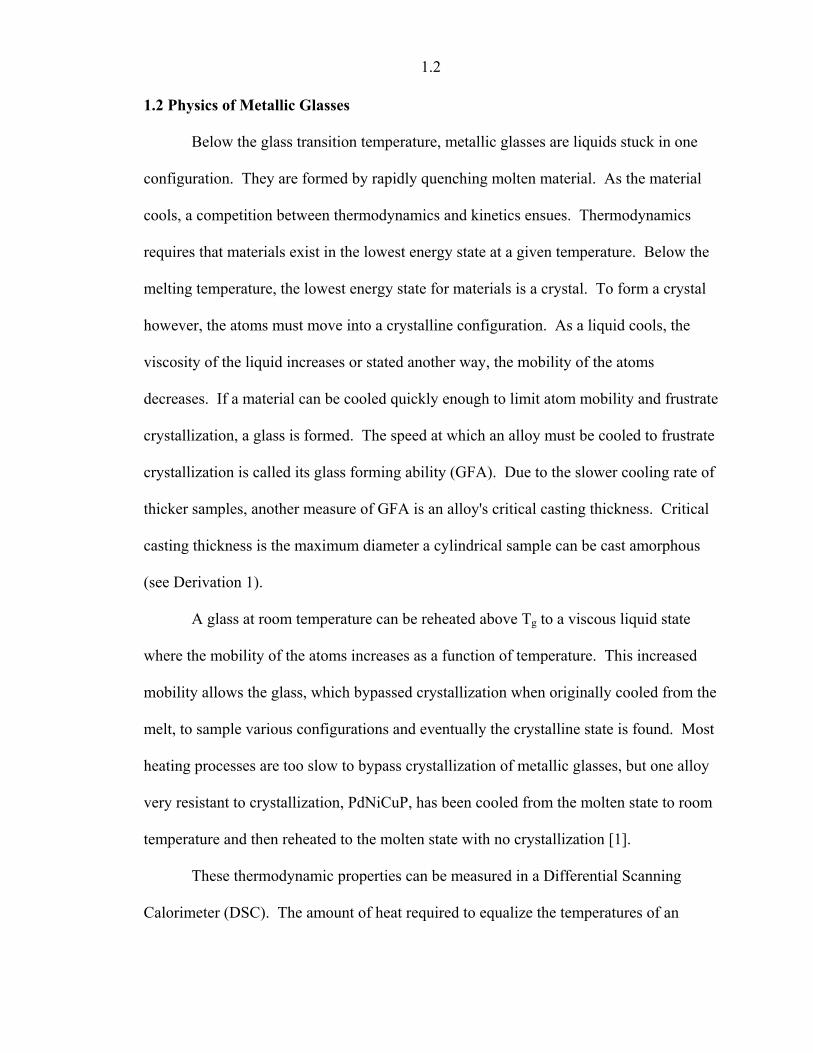
heat capacity of the sample. A plot of the heat capacity as a function of temperature for a
typical metallic glass (MG) is a good starting point to discuss the thermodynamics of
these materials. Figure 1.1 shows a typical DSC scan for a MG. The glass transition
temperature, Tg, the crystallization temperature, Tx, the solidus temperature, Ts, and the
liquidus temperature, TL, are shown along with the enthalpy of crystallization, Hx, the
enthalpy of fusion, Hf and the magnitude of the discontinuity in heat capacity Δcp.
Area=Hf
V
Area=Hx
V
-6
-5
-4
-3
-2
-1
0
1
2
100 200 300 400 500 600 700 800Temperature [C]
Hea
t Flo
w [W
/g]
Tx
TsTL
Tg regionenlarged below
0.150.170.190.210.230.250.270.290.31
270 290 310 330 350 370 390
Tg
V
V
Δcp
Exo
Figure 1.1: DSC scan of Zr44Ti11Cu20Be25 showing heat capacity features characteristic of metallic glasses. Inset region on left shows glass transition region and maintains axis units of large plot.
These variables need further explanation. The glassy sample begins at room
temperature and is heated above its glass transition temperature. The physics of the glass
transition is still being debated. Some claim that it is a second order phase transition [2]
1.4
and that glasses are a unique phase of matter. The less controversial explanation follows
the kinetics argument above and defines Tg as the temperature at which the material
begins to flow. The glass transition is visible as a discontinuous jump in heat capacity =
Δcp. In the kinetics argument, Δcp arises from changes in the slope of the volume,
entropy, and enthalpy curves at the glass transition due to the kinetic freezing of the
liquid [2] (see Derivation 2). Above Tg, the mobility of the atoms in the undercooled
liquid increases and at Tx a crystalline configuration is found and the sample reaches the
desired thermodynamic low energy crystalline state. As the sample transitions from a
high energy liquid to a low energy crystal, heat must be released and the exothermic
crystallization peak is observed. The total heat released in the crystallization process is
Hx. The temperatures at which melting begins and ends are Ts and TL respectively. In an
elemental solid, melting peaks are very sharp and theoretically Ts = TL. Melting a solid is
an endothermic process meaning that heat input is required to cause the phase change
from crystal to liquid. The amount of heat required to melt the crystal = Hf. If the
sample was heated quickly enough, crystallization and melting would not have occurred
and the glass could be taken back above the crystalline melting temperature with only a
discontinuity in heat capacity.
The ability of a metallic glass to resist crystallization at temperatures above Tg is
called its thermal stability. This is of course a time and temperature dependant
parameter. The longer a MG is left at a temperature above Tg, the more configurations
the atoms can explore and eventually the sample will crystallize. Additionally, the atoms
move more quickly and explore configurations more quickly at higher temperatures.
Both Tg and Tx as measured in a DSC will depend on heating rate. Exact values for Tg
1.5
and Tx are impossible to obtain because they are tied to the kinetics of the atoms. In
much of the scientific literature on MG and for most of this thesis, thermodynamic data is
collected at heating rates of 20 K/min. The value Tx - Tg = ΔT is one measure of the
thermal stability of a MG. ΔT is also called the width of the supercooled liquid region
(SCLR), so named because the material has regained flow properties of a liquid, but
exists at “super cooled” temperatures well below the melting temperature.
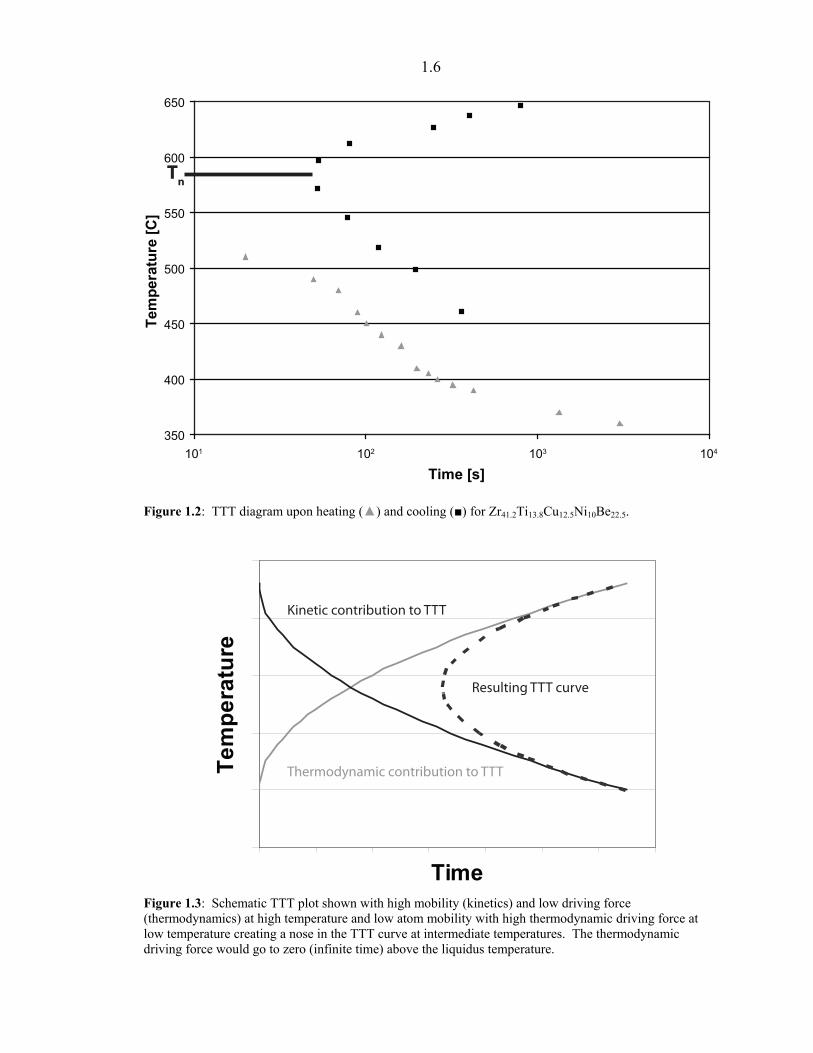
Another quantitative measure of the thermal stability of an alloy is summarized in
a time temperature transformation (TTT) diagram. TTT diagrams depict the results of
rapidly bringing a MG to a given temperature and then measuring the time to the onset of
crystallization at that temperature. Asymmetries exist in TTT diagrams constructed by
cooling molten material and waiting for crystallization vs ones constructed by heating
glassy material and waiting for crystallization [3]. The authors of [3] discuss the
asymmetry in terms of classical nucleation theory and suggest that crystal nuclei are
formed upon cooling and then grow at different rates upon heating above Tg. Heating
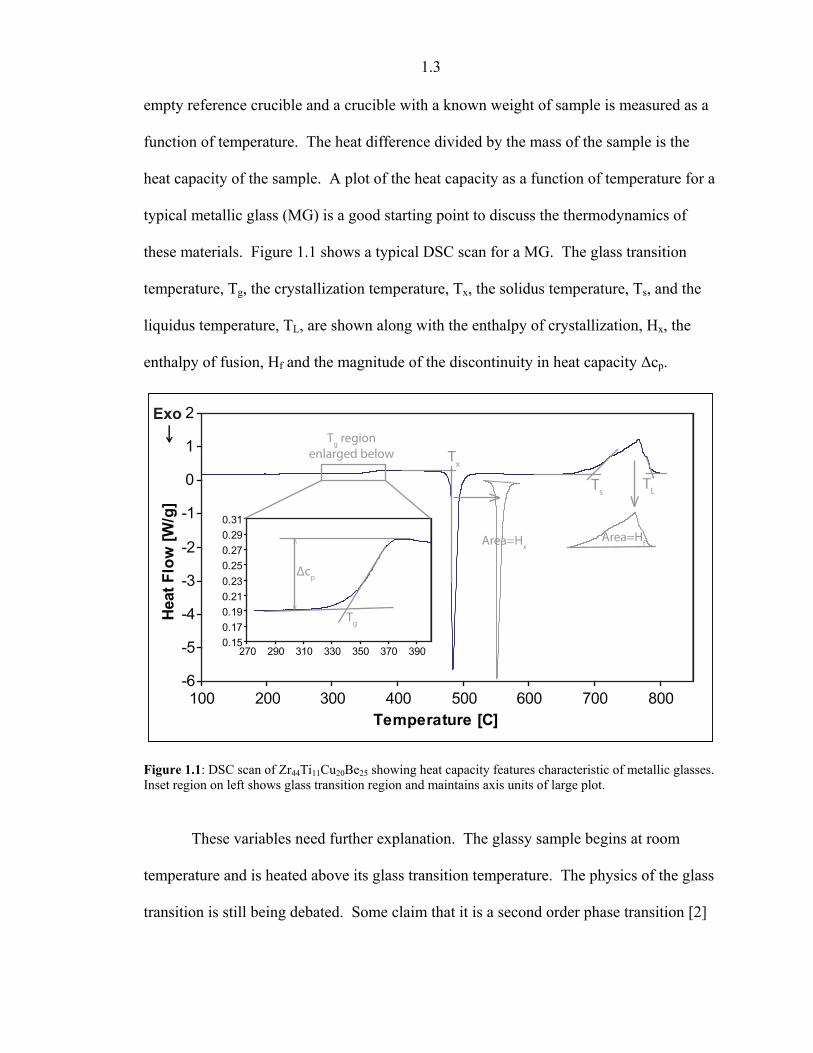
and cooling TTT diagrams for the Zr based alloy with the highest known GFA,
Zr41.2Ti13.8Cu12.5Ni10Be22.5 [3-5], are presented in Figure 1.2. Notice the rounded shape of
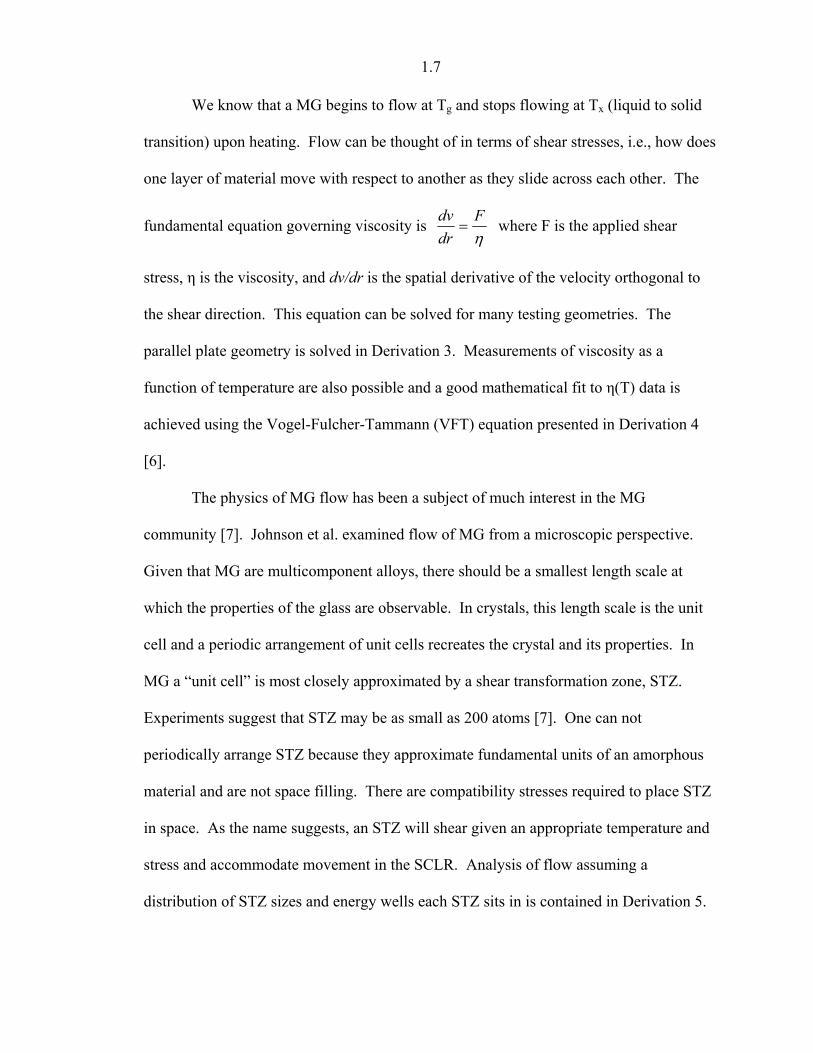
the cooling TTT curve. The shortest time is marked Tn on the temperature axis indicating
the “nose temperature.” At this temperature, the thermodynamic driving force to
crystallize and mobility of the atoms combine to be optimal for crystallizing in the
shortest possible time. At temperatures higher than Tn, the mobility of atoms is greater,
but there is less thermodynamic driving force to crystallize. At temperatures lower than
Tn, the thermodynamic driving force is higher, but the mobility of the atoms is too low.
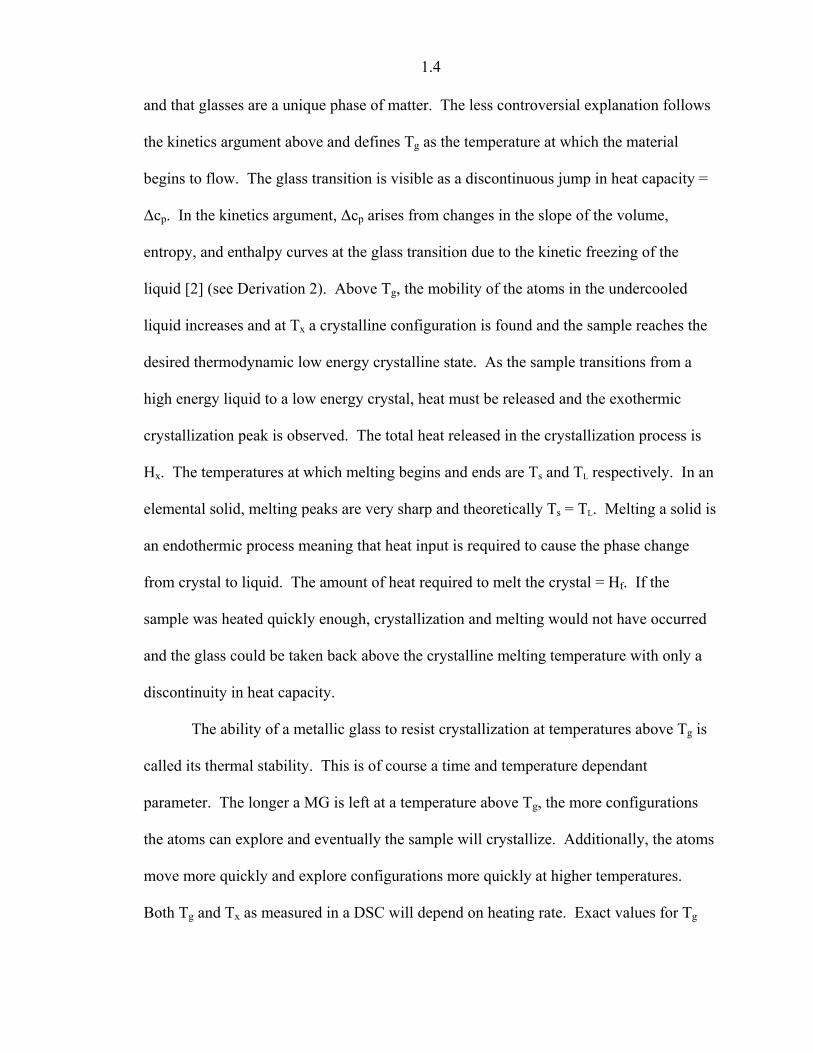
These concepts are shown in Figure 1.3.
1.6
350
400
450
500
550
600
650
101 102 103 104
Time [s]
Tem
pera
ture
[C]
Tn
Figure 1.2: TTT diagram upon heating (▲) and cooling (■) for Zr41.2Ti13.8Cu12.5Ni10Be22.5.
Time
Tem
pera
ture
Kinetic contribution to TTT
Thermodynamic contribution to TTT
Resulting TTT curve
Figure 1.3: Schematic TTT plot shown with high mobility (kinetics) and low driving force (thermodynamics) at high temperature and low atom mobility with high thermodynamic driving force at low temperature creating a nose in the TTT curve at intermediate temperatures. The thermodynamic driving force would go to zero (infinite time) above the liquidus temperature.
1.7
We know that a MG begins to flow at Tg and stops flowing at Tx (liquid to solid
transition) upon heating. Flow can be thought of in terms of shear stresses, i.e., how does
one layer of material move with respect to another as they slide across each other. The
fundamental equation governing viscosity is ηF
drdv
= where F is the applied shear
stress, η is the viscosity, and dv/dr is the spatial derivative of the velocity orthogonal to
the shear direction. This equation can be solved for many testing geometries. The
parallel plate geometry is solved in Derivation 3. Measurements of viscosity as a
function of temperature are also possible and a good mathematical fit to η(T) data is
achieved using the Vogel-Fulcher-Tammann (VFT) equation presented in Derivation 4
[6].
The physics of MG flow has been a subject of much interest in the MG
community [7]. Johnson et al. examined flow of MG from a microscopic perspective.
Given that MG are multicomponent alloys, there should be a smallest length scale at
which the properties of the glass are observable. In crystals, this length scale is the unit
cell and a periodic arrangement of unit cells recreates the crystal and its properties. In
MG a “unit cell” is most closely approximated by a shear transformation zone, STZ.
Experiments suggest that STZ may be as small as 200 atoms [7]. One can not
periodically arrange STZ because they approximate fundamental units of an amorphous
material and are not space filling. There are compatibility stresses required to place STZ
in space. As the name suggests, an STZ will shear given an appropriate temperature and
stress and accommodate movement in the SCLR. Analysis of flow assuming a
distribution of STZ sizes and energy wells each STZ sits in is contained in Derivation 5.
1.8
The result is an equation with less fitting parameters than the VFT equation that better
fits η(T) data of MG. The equation is:
⎥⎥⎦
⎤
⎢⎢⎣
⎡⎟⎟⎠
⎞⎜⎜⎝
⎛=
∞
Amg
TT
AExp/
ηη
Where η is the temperature dependant viscosity, η∞ is the high temperature viscosity or
can be approximated by the plank limit viscosity ~ 10-5 Pa-s, A = Log(ηg/η∞) where ηg =
1012 Pa-s, and m = Angell fragility.
The Angell fragility is defined as follows:
)/()(
TTLogm
g∂∂
=η
The Angell fragility gives the slope of the Log(η(Tg/T)) curve. This is a valuable
parameter because it determines how steep the η(T) plot will be. Fragile liquids or
materials with high m soften quickly above their glass transition temperature and exhibit
steeper η(T) relationships.
The physics of the SCLR in some alloys is even more complicated than we have
discussed so far. Phase separation in metallic glasses has been claimed in many glass
forming alloy systems including AuPbSb [8-9], ZrCu [10], ZrTiBe [11-14], ZrTiCuNiBe
[15-17], MgCuYLi [18], CuZrAlAg [19], TiYAlCo and ZrYAlCo [20]. X-ray scattering
has shown splitting of the broad amorphous spectrum in as-cast AuPbSb glass [8].
Additionally Small Angle Neutron Scattering (SANS), Small Angle X-ray Scattering
(SAXS), Anomalous Small Angle X-ray Scattering (ASAXS), observation with
Transmission Electron Microscopy (TEM), rheology measurement anomalies, resistivity
measurement anomalies, and Differential Scanning Calorimetry (DSC) measurements
showing apparent double glass transitions are some of the techniques used to support the
1.9
claims of phase separation. Some AuPbSb and ZrTiBe glasses are thought to have two
glasses in as-quenched samples. Other alloy systems are thought to phase separate upon
annealing.
Much of the work on phase separation in the Vitreloy (ZrTiNiCuBe) system is
relevant to this thesis. Johnson and collaborators conducted SANS experiments on
Vitreloy compositions after various annealing times and temperatures [15-17]. As-cast
samples exhibited only background scattering, but after annealing, the maximum
scattering intensity was peaked about q = 0.5 A-1 and indicated a quasiperiodic
arrangement of scattering inhomogeneities. SAXS and ASAXS experiments determined
that the annealing led to the segregation of the alloy into Zr rich and Ti rich amorphous
phases. This composition variation was found to happen at a length scale of about 13nm.
After this amorphous phase separation, the crystallization pathway becomes quite
complex. Kelton found a stable icosahedral phase in the TiZrNi phase diagram from ab
initio calculations [21]. Evidence of the icosahedral phase has been found in various
Vitreloy compositions by indexing X-ray diffraction patterns of alloys crystallized by
isothermal annealing in the SCLR [22-24]. TEM observation of quasicrystal phases has
also been accomplished [23-24]. The SANS peak is seen to shift as a function of
annealing temperature as predicted by the Cahn-Hilliard theory for spinodal
decomposition. Annealing at temperatures higher than the amorphous phase
decomposition region causes spinodal decomposition of the alloy into nanocrystalline
regions [15-17]. Some postulate that the quasicrystals phase precipitates from the phase
separated glass and later provides the nucleation site for other crystal phases [22-24].
Slight coarsening of the nanocrystals has been observed with annealing, but the length
1.10
scale only increased to about 40nm [17]. Other compositions in the same Vitreloy alloy
family did not phase separate into amorphous phases upon annealing [16]. Johnson and
collaborators proposed a miscibility gap and a spinodal decomposition region in the
SCLR of the ZrTiNiCuBe phase diagram and proposed rough composition boundaries.
Tanner and Ray examined the ZrTiBe system for glass forming compositions and
found many alloys could be made amorphous in 100μm thick ribbons [11-14]. Heat
capacity measurements conducted in a DSC on some of the compositions revealed two
discontinuities in heat capacity in the supercooled liquid region (SCLR). A glassy
material is expected to exhibit one discontinuity in heat capacity at the glass transition
temperature as the material transitions from solid-like to liquid-like behavior and
becomes able to flow [2]. Two jumps in heat capacity, and an apparent double glass
transition temperature are unusual. Tanner proposed that this anomalous feature in the
heat capacity was due to the presence of two glassy phases.
There are some in the metallic glass community who dispute the existence of the
two phases in many of these systems and attempt to explain the data in alternative ways
[25-28]. Perhaps the most controversial alloy thought to show two phases is
Zr36Ti24Be40. Hono showed that TEM work done by Tanner supporting the existence of
two phases in the Zr36Ti24Be40 alloy was flawed and proved that the observed “phases”
were in fact etching artifacts [27]. The apparent double glass transition has been
suggested to be a single glass transition with a neighboring exothermic ordering event
prior to crystallization [26]. This explanation could be plausible given the evidence of
quasi crystal formation in the more complicated Vitreloy system, especially in light of
TEM work showing what appear to be ordered phases after deformation of the in the
1.11
SCLR of the Zr36Ti24Be40 alloy [25]. Discussion and experiments supporting the two
phase glass argument in the ZrTiBe system will be discussed further in Chapter 6.
1.3 Applied Physics (for processing) in Metallic Glasses
Armed with the concepts of viscosity, thermal stability and TTT diagrams we can
consider what properties a metallic glass must posses to be a good candidate for
processing like a plastic in the SCLR. The plastic forming process we sought to replicate
was injection molding. A simple injection molding process requires feedstock material, a
heated reservoir in which the material is softened, a nozzle, a mold and a plunger to force
the softened material from the reservoir through the nozzle into the mold. Typical plastic
injection molding occurs at temperatures of 180 - 340 °C and viscosities of 102 - 103 Pa-s.
Time is a minimal constraint because polymers and plastics typically have enormous
thermal stabilities due to the long tangled molecular chains that kinetically resist
organization into a crystalline structure. 60 - 300 s is a reasonable time to thermally
equilibrate the feedstock material and inject it into the mold.
A metallic glass must have good enough GFA to make macroscopic specimens to
be a viable candidate for feedstock material. The metallic glass community calls an alloy
a bulk metallic glass (BMG) if the GFA is high enough to allow 1mm diameter rods to be
cast fully amorphous. BMG forming alloys also have the advantage of having better
thermal stability on cooling as compared to alloys with poorer GFA.
Processing a BMG using a method similar to injection molding in the SCLR
however, requires high thermal stability of the glass upon heating. In order to look at the
relevant parameters for processing in the SCLR we invented a new kind of plot for
metallic glasses. Because temperature is the easiest parameter to vary in the injection
1.12
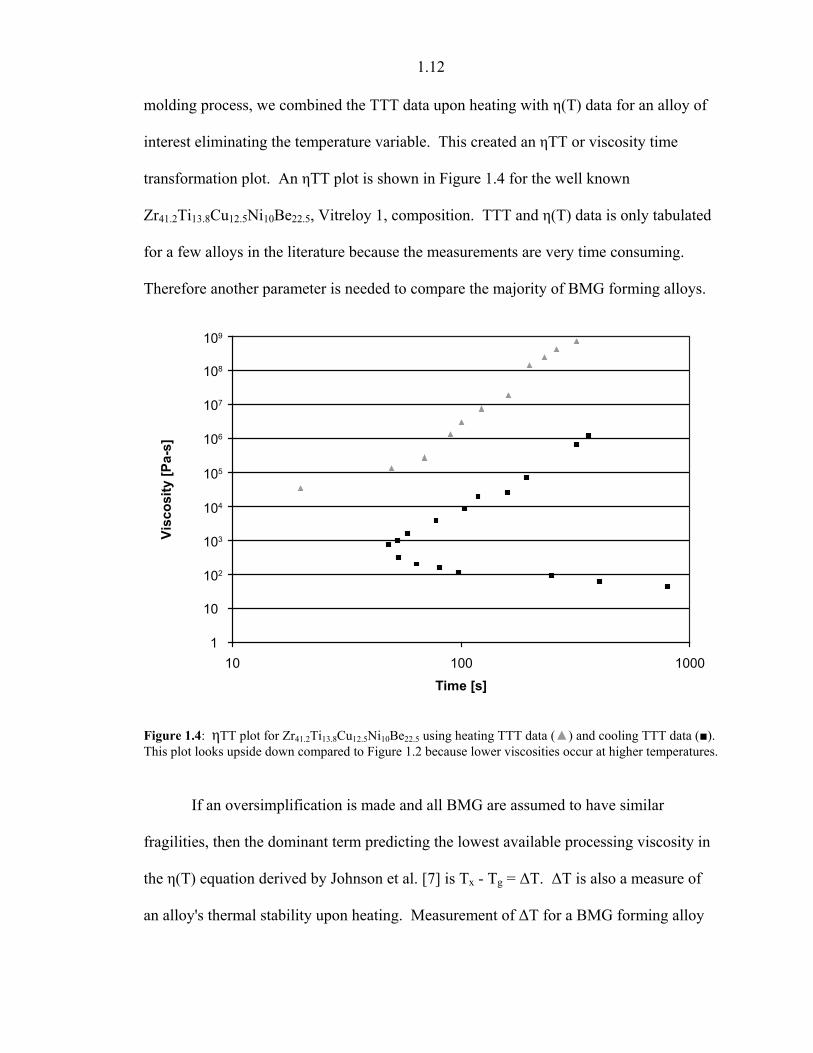
molding process, we combined the TTT data upon heating with η(T) data for an alloy of
interest eliminating the temperature variable. This created an ηTT or viscosity time
transformation plot. An ηTT plot is shown in Figure 1.4 for the well known
Zr41.2Ti13.8Cu12.5Ni10Be22.5, Vitreloy 1, composition. TTT and η(T) data is only tabulated
for a few alloys in the literature because the measurements are very time consuming.
Therefore another parameter is needed to compare the majority of BMG forming alloys.
109
108
107
106
105
104
103
102
10
110 100 1000
Time [s]
Visc
osity
[Pa-
s]
Figure 1.4: ηTT plot for Zr41.2Ti13.8Cu12.5Ni10Be22.5 using heating TTT data (▲) and cooling TTT data (■). This plot looks upside down compared to Figure 1.2 because lower viscosities occur at higher temperatures.
If an oversimplification is made and all BMG are assumed to have similar
fragilities, then the dominant term predicting the lowest available processing viscosity in
the η(T) equation derived by Johnson et al. [7] is Tx - Tg = ΔT. ΔT is also a measure of
an alloy's thermal stability upon heating. Measurement of ΔT for a BMG forming alloy
1.13
takes less than one hour and ΔT data is tabulated for many compositions. This could be a
simple way of eliminating many compositions from consideration as potential alloys for
plastic forming processes in the SCLR.
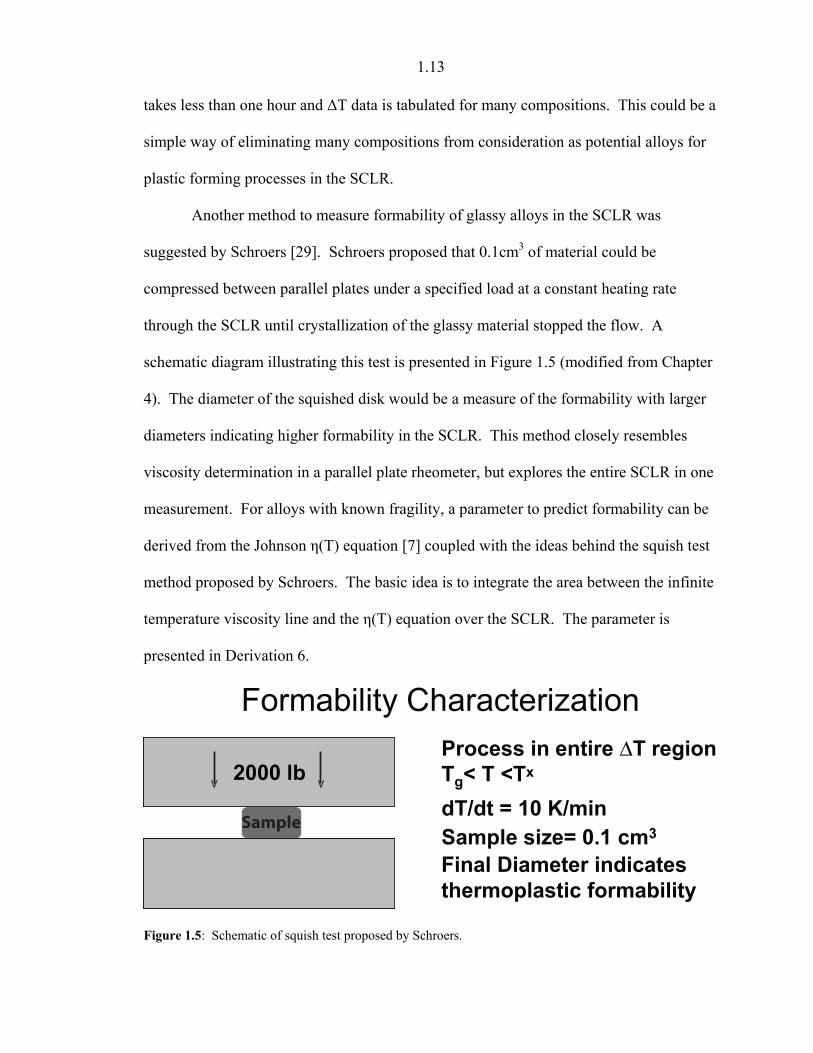
Another method to measure formability of glassy alloys in the SCLR was
suggested by Schroers [29]. Schroers proposed that 0.1cm3 of material could be
compressed between parallel plates under a specified load at a constant heating rate
through the SCLR until crystallization of the glassy material stopped the flow. A
schematic diagram illustrating this test is presented in Figure 1.5 (modified from Chapter
4). The diameter of the squished disk would be a measure of the formability with larger
diameters indicating higher formability in the SCLR. This method closely resembles
viscosity determination in a parallel plate rheometer, but explores the entire SCLR in one
measurement. For alloys with known fragility, a parameter to predict formability can be
derived from the Johnson η(T) equation [7] coupled with the ideas behind the squish test
method proposed by Schroers. The basic idea is to integrate the area between the infinite
temperature viscosity line and the η(T) equation over the SCLR. The parameter is
presented in Derivation 6.
Formability Characterization
2000 lb2000 lb Tg< T <TxProcess in entire ΔT region
dT/dt = 10 K/minSample size= 0.1 cm3
V V
Sample
Final Diameter indicatesthermoplastic formability
Figure 1.5: Schematic of squish test proposed by Schroers.
1.14
1.4 Advantages of Thermoplastic Processing and State of the Field in 2005
Most practical applications of MG demand near net-shaping process in
manufacturing. The most common method of obtaining metallic glass parts is die casting
wherein molten alloy is injected into a mold and then cooled below the glass transition
temperature sufficiently fast to avoid crystallization. Die casting requires the molten
alloy to be quickly introduced into the mold and then rapidly quenched before the onset
of crystallization. This processing route takes advantage of the thermodynamic stability
of the alloy at temperatures above the crystallization nose, Tn in the TTT diagram showed
in Figure 1.2. At the temperature Tn, an alloy has the minimum time to crystallization.
Porosity is introduced into the sample due to the high inertial forces in relation to the
surface tension forces realized during the injection of the molten liquid, which gives rise
to a Rayleigh-Taylor instability and consequent flow breakup resulting in void
entrapment. Porosity is also found in the center of die cast parts because parts are cooled
through contact with a mold from the outside in and cavities nucleate in the center due to
large negative pressures present in the center of parts cooled in this manner. The cooling
requirements of die casting bound the dimensions of die cast parts to no larger than can
be cooled sufficiently fast to avoid crystallization and no smaller than can be quickly
filled. Parts with complex geometries, thin sections, and high aspect ratios are difficult to
obtain with die casting.
The unique advantages of injection molding, blow molding, micro replication,
and other thermoplastic technologies are largely responsible for the widespread uses of
plastics such as polyethylene, polyurethane, PVC, etc., in a broad range of engineering
applications. Powder Injection Molding (PIM) of metals represents an effort to apply
1.15
similar processing to metals, but requires blending of the powder with a plastic binder to
achieve net shape forming and subsequent sintering of the powder. Given suitable
materials, thermoplastic forming (TPF) would be the method of choice for manufacturing
of metallic glass components because TPF decouples the forming and cooling steps by
processing glassy material at temperatures above Tg and below Tx followed by cooling to
ambient temperature [30-31]. To clear up some terminology difficulties it should be
noted that forming in the SCLR, thermoplastic forming, and plastic processing all refer to
the same process of applying pressure to deform an alloy heated to a temperature in the
SCLR. A polymer or plastic material made up of long carbon chains also exhibits a Tg
and is processed in this manner, thus the terminology “plastic” processing.
Thermoplastic forming methods take advantage of the kinetic stability of an alloy
at temperatures below the crystallization nose. TPF decouples the fast cooling and
forming of MG parts inherent in die casting and allows for the replication of small
features and thin sections of metals with high aspect ratios. TPF methods also take
advantage of lower processing temperatures resulting in relatively lower oxidation rates.
TPF has several advantages over conventional die casting, including smaller
solidification shrinkage, less porosity of the final product, more flexibility on possible
product sizes, and a robust process that does not sacrifice the mechanical properties of the
material. TPF methods include the forming of amorphous metal sheets [32], the
compaction of amorphous powders [33], the extrusion of amorphous feedstock into a die
[34], and the imprinting of amorphous metal [35]. Most of these routes reduce the
porosity of the processed amorphous part but have limitations. Forming of amorphous
metal sheets limits the thickness of the final sample and the available part geometries.
1.16
Powder compaction methods usually produce parts having micro or nano dispersed
porosity which often results in inferior mechanical properties compared to homogenously
solidifying parts. Free extrusion, or extrusion into a die only allows parts with simple
geometries to be fabricated. Imprinting methods enable very small features to be
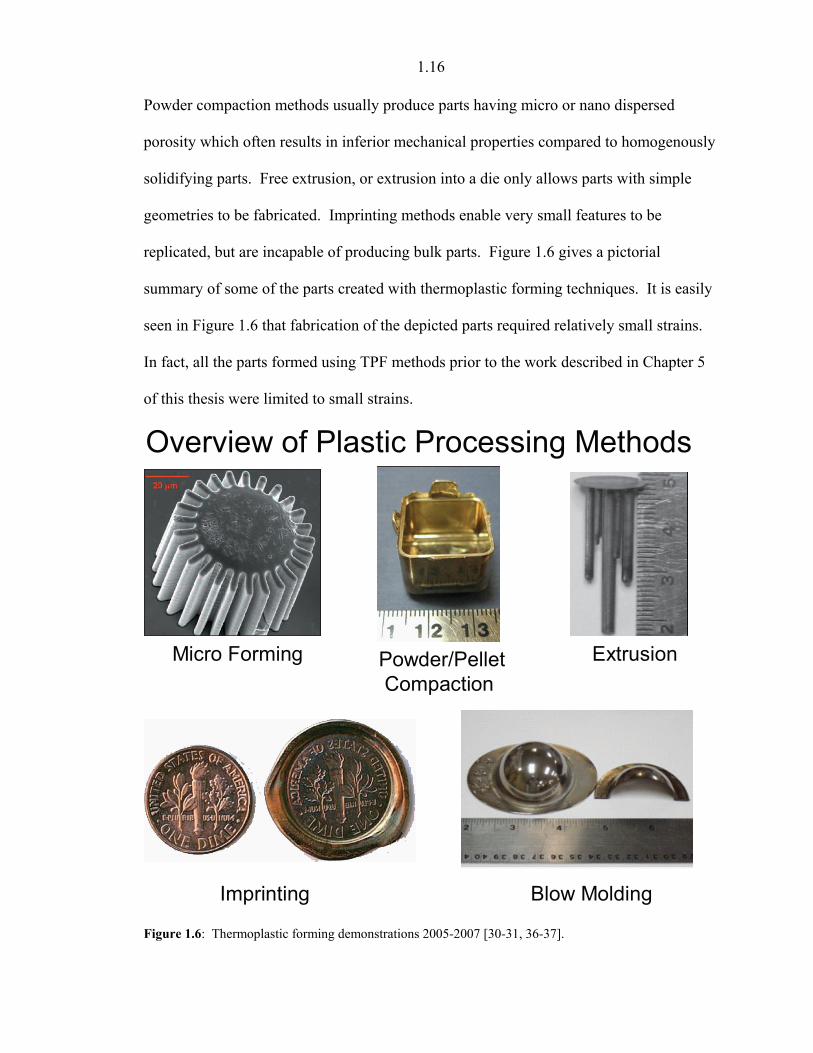
replicated, but are incapable of producing bulk parts. Figure 1.6 gives a pictorial
summary of some of the parts created with thermoplastic forming techniques. It is easily
seen in Figure 1.6 that fabrication of the depicted parts required relatively small strains.
In fact, all the parts formed using TPF methods prior to the work described in Chapter 5
of this thesis were limited to small strains.
Overview of Plastic Processing Methods
Micro Forming Powder/PelletCompaction
Extrusion
Blow MoldingImprinting
Figure 1.6: Thermoplastic forming demonstrations 2005-2007 [30-31, 36-37].
1.17
The goal of injection molding is to use the ability of metallic glasses to flow
homogeneously at temperatures between Tg and Tx to enable pressurized injection of the
alloy into a mold to produce a homogenous bulk part with no size restrictions. This
method would require higher strains than previously achieved by any of the thermoplastic
forming methods prior to 2005.
A perfect BMG forming alloy that could be swapped for polymer plastics in
injection molding and similar plastic forming processes would have the following
properties:
• Thermal stability in the SCLR for 60 - 300 s
• A viscosity of 102 - 103 Pa-s
• A processing temperature of 180 - 340 °C
In 2005 when my graduate studies began, there were hundreds of BMG forming
compositions to choose from. Metallic glass forming alloy compositions are given in
atomic percent unless otherwise stated and the family to which a particular alloy belongs
is determined by the element with the highest atomic percentage. Some of the families
we considered were Au, Pd, Pt, Zr, Ti, Ce, Y, La, Mg, Ca, Co, and Fe based alloys [38-
39]. Y, La, Co, and Fe based alloys are known for low fracture toughness and are
therefore mechanically undesirable. Ce, Ca, and Mg based glasses are often prone to
corrosion. Au based alloys have very high fragility but often the Tg is near room
temperature and the alloys crystallize readily. Zr, Ti, Pd, and Pt based BMG were
examined for suitability to forming processes in the SCLR.
A literature search revealed many attempts at forming in the SCLR prior to 2005.
Some of the best results to date are presented in Figure 1.6. The favored alloys were
1.18
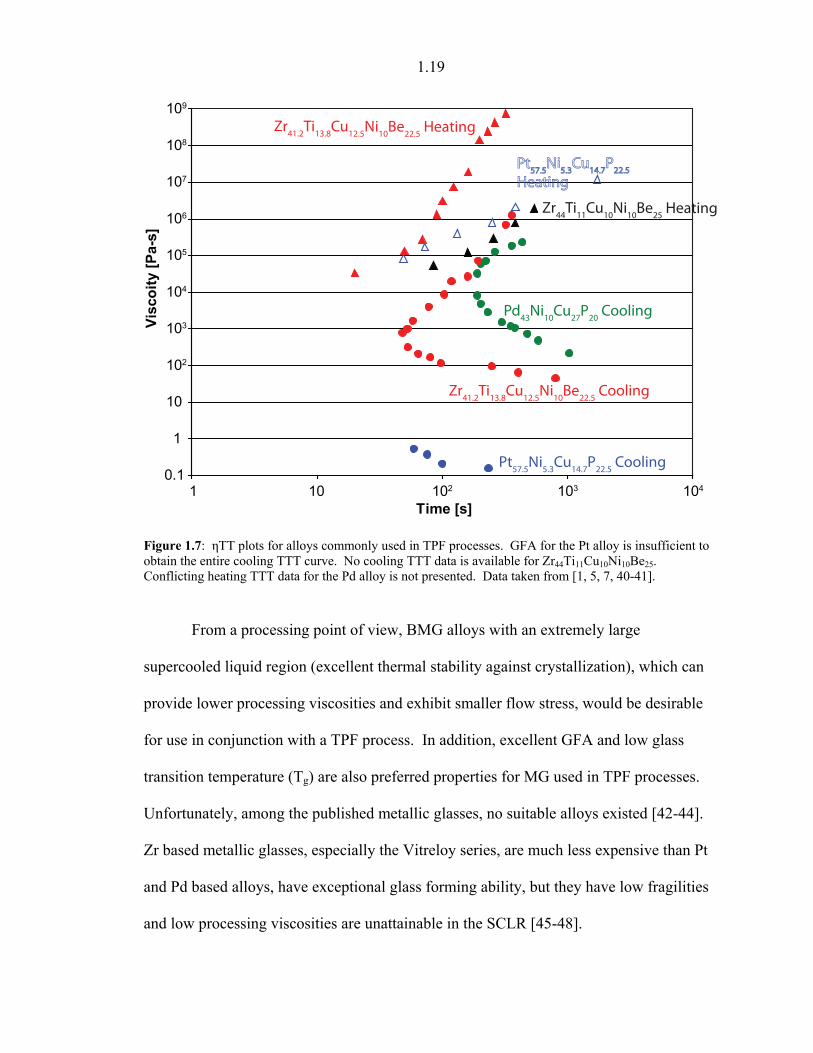
Pd43Ni10Cu27P20, Pt57.5Ni5.3Cu14.7P22.5, Zr41.2Ti13.8Cu12.5Ni10Be22.5 (Vitreloy 1), and
Zr44Ti11Cu10Ni10Be25 (Vitreloy 1b). TTT diagrams and η(T) measurements had been
published prior to 2005 for many of these alloys and DSC data existed for all of them.
The alloys all had large ΔT values ranging from the smallest value for ΔTVit 1 = 65 °C to
ΔTVit 1b = 135 °C. The Pd and Pt based glasses have smaller ΔT values, but higher
fragilities making all these alloys good candidates for TPF. In the last four years,
publications from other research groups, and work within the Johnson group has fleshed
out the data necessary to construct ηTT plots for all these compositions. Figure 1.7
contains heating and cooling ηTT plots for the good TPF candidate alloys. It is quickly
seen that the alloys are limited to viscosities greater than 105 Pa-s for the processing
times required for injection molding and similar TPF processes using the ηTT plots for
heating. Only a cooling ηTT plot for Pd43Ni10Cu27P20 is presented. There are multiple
conflicting sets of data for heating the Pd alloy. The Pd alloy differs from other alloys
because Pd based alloys are able to be fluxed and cleaned with B2O3. Fluxing Pd based
alloys with B2O3 under inert gases allows the alloys greater thermal stability and
resistance to crystallization. Fluxed and unfluxed samples have very different TTT plots
because unfluxed alloys crystallize at much shorter times for a given temperature than
their fluxed counterparts. In an injection molding process conducted in air, the unfluxed
behavior is what would be observed. The Pd based alloy shows the most promise for
TPF of the alloys examined so far, but falls short of what would be needed to replace a
plastic.
1.19
0.1
1
10
102
103
104
105
106
107
108
109
1 10 102 103 104
Time [s]
Visc
oity
[Pa-
s]
Pt57.5Ni5.3Cu14.7P22.5 Cooling
Zr41.2Ti13.8Cu12.5Ni10Be22.5 Heating
Zr41.2Ti13.8Cu12.5Ni10Be22.5 Cooling
Pd43Ni10Cu27P20 Cooling
Pt57.5Ni5.3Cu14.7P22.5
Heating
Zr44Ti11Cu10Ni10Be25 Heating
Figure 1.7: ηTT plots for alloys commonly used in TPF processes. GFA for the Pt alloy is insufficient to obtain the entire cooling TTT curve. No cooling TTT data is available for Zr44Ti11Cu10Ni10Be25. Conflicting heating TTT data for the Pd alloy is not presented. Data taken from [1, 5, 7, 40-41].
From a processing point of view, BMG alloys with an extremely large
supercooled liquid region (excellent thermal stability against crystallization), which can
provide lower processing viscosities and exhibit smaller flow stress, would be desirable
for use in conjunction with a TPF process. In addition, excellent GFA and low glass
transition temperature (Tg) are also preferred properties for MG used in TPF processes.
Unfortunately, among the published metallic glasses, no suitable alloys existed [42-44].
Zr based metallic glasses, especially the Vitreloy series, are much less expensive than Pt
and Pd based alloys, have exceptional glass forming ability, but they have low fragilities
and low processing viscosities are unattainable in the SCLR [45-48].
1.20
Accordingly, a need exists for a new family of inexpensive MG that can be
incorporated into a thermoplastic processing application.
1.5 Alloy Development Strategies
The value of ΔT was the easiest parameter to measure and seemed to give a good
indication of TPF potential so we set out to find alloys with larger ΔT values. Without a
strategy, success in alloy development can be as likely as winning the lottery.
Approaching the problem scientifically and not just rolling the dice was the key. Even
then, it took a few iterations before finding the right method.
The first strategy to find alloys with larger ΔT values that met with limited
success was based on the phase separation work discussed in Section 1.2 in the
ZrTiCuNiBe, Vitreloy, system. Given that some of the Vitreloy compositions showed
phase separation upon annealing in the SCLR which led to formation of a quasicrystal
phase and eventual nanocrystallization, it was thought that we could increase ΔT by
suppressing the quasicrystalline phase. Kelton’s work predicted a stable TiZrNi
quasicrystal [21]. The simplest solution to suppress a TiZrNi phase is to remove all Ni
from the alloys.
The alloy with the largest ΔT found by this method was the all Cu version of
Vitreloy 1b, Zr44Ti11Cu20Be25. Unfortunately, ΔTvit 1b all Cu = 135 °C. We hadn’t lost
anything in ΔT by removing all the Ni, but also hadn’t gained anything.
Exploring quinary composition space in the Vitreloy system is very cumbersome.
Assuming we coarse grained the system into 5% composition steps, we would need to
create 10626 alloys to tile the composition space. The combinatorics for 1 - 5 component
alloys is included in Derivation 7. It takes approximately 2 hours per alloy to weigh,
1.21
melt, cast and run a DSC scan. This task could be accomplished in just over 10 years of
40 hour work weeks. If we explored a ternary composition space, we would only need
231 alloys to tile the system. Tanner explored the ZrTiBe system in the 1970s [11-14]
and found that compositions with 30 – 60% Be could be made amorphous in thin foils.
Additional work by Tanner using the CALPHAD method to predict ternary phase
diagrams from binary phase diagram data found the region of composition space
expected to have the lowest melting temperature alloys [49]. This near eutectic region
occupied a triangle with 30 - 45% Be. Using this prior work by Tanner and the ternary
phase space simplification, we were able to significantly diminish the number of alloys
necessary to explore the composition space. The ternary alloy development is detailed in
Chapter 3 of this thesis.
The next alloy development strategy challenged many of the assumptions about
GFA in the Vitreloy family held in the BMG community in 2005. It was assumed
because of the work by Tanner that alloys in the ZrTiBe system were limited in GFA to
thin foils 10 - 100μm thick [11-14, 50-51]. Thanks to Dr. Peker’s work and patent it was
also assumed that the GFA of Vitreloy type alloys was only attainable by adding late
transition metals (LTM) from the columns containing Mn, Fe, Co, Ni, or Cu on the
periodic table [4, 52]. Both these assumptions turned out to be false. In order to stay
outside the Peker patent, only alloys free of LTM were tested. ZrTiBe compositions with
GFA high enough to cast 1 - 6mm diameter rods were found. This means that the critical
cooling rates required to create amorphous ZrTiBe samples were 100 - 1000 times lower
than previously thought. Additions of V, Nb, and Cr were found to raise the GFA of
alloys to as high as 8mm diameter casting thickness. Bulk glass forming alloys with
1.22
densities as low as crystalline Titanium were discovered having compressive yield
strengths as high as Vitreloy compositions [53-54]. Some of the highest strength to
weight ratio metals in existence are among these alloys. The low density and no LTM
alloy development details and hallmark alloys are more thoroughly discussed in Chapter
2 of this thesis. The alloy with largest ΔT value discovered using this strategy of alloy
development, Zr35Ti30Be35, only had ΔT = 120 °C.
It became clear that our last option was to venture back into Peker patent territory
by adding LTM to the ternary compositions. It is important to have a mental picture of
what each alloying addition accomplishes to know what direction to move for further
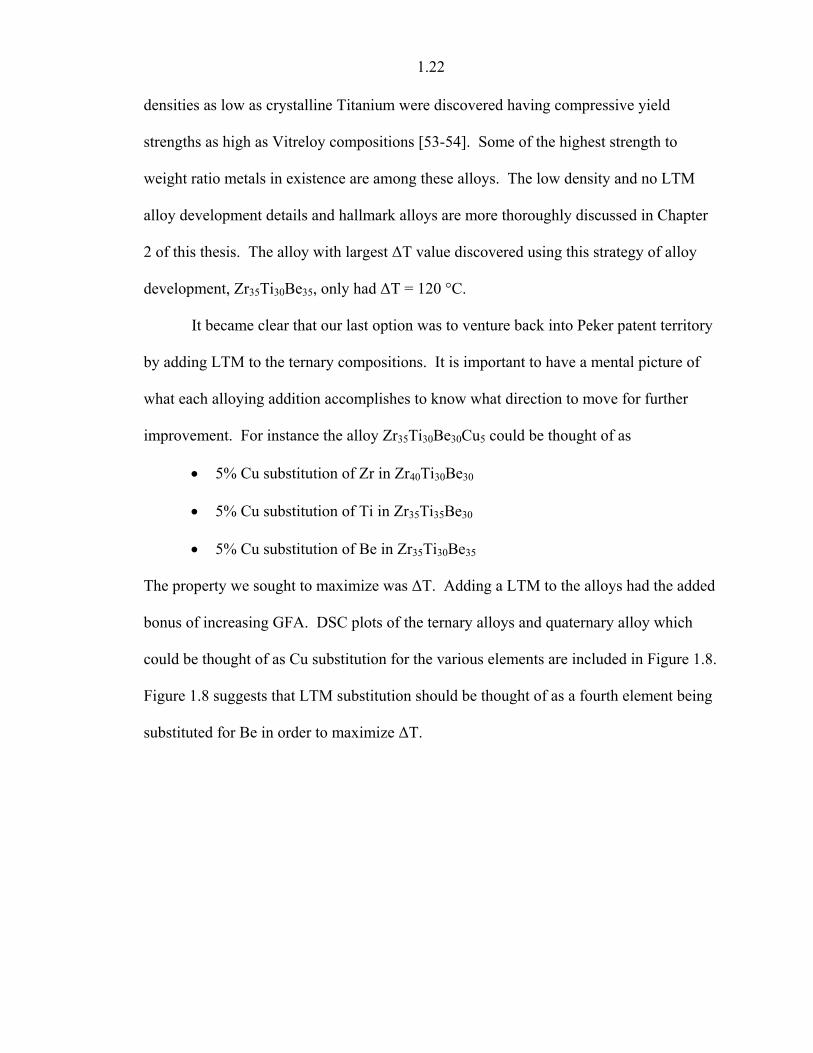
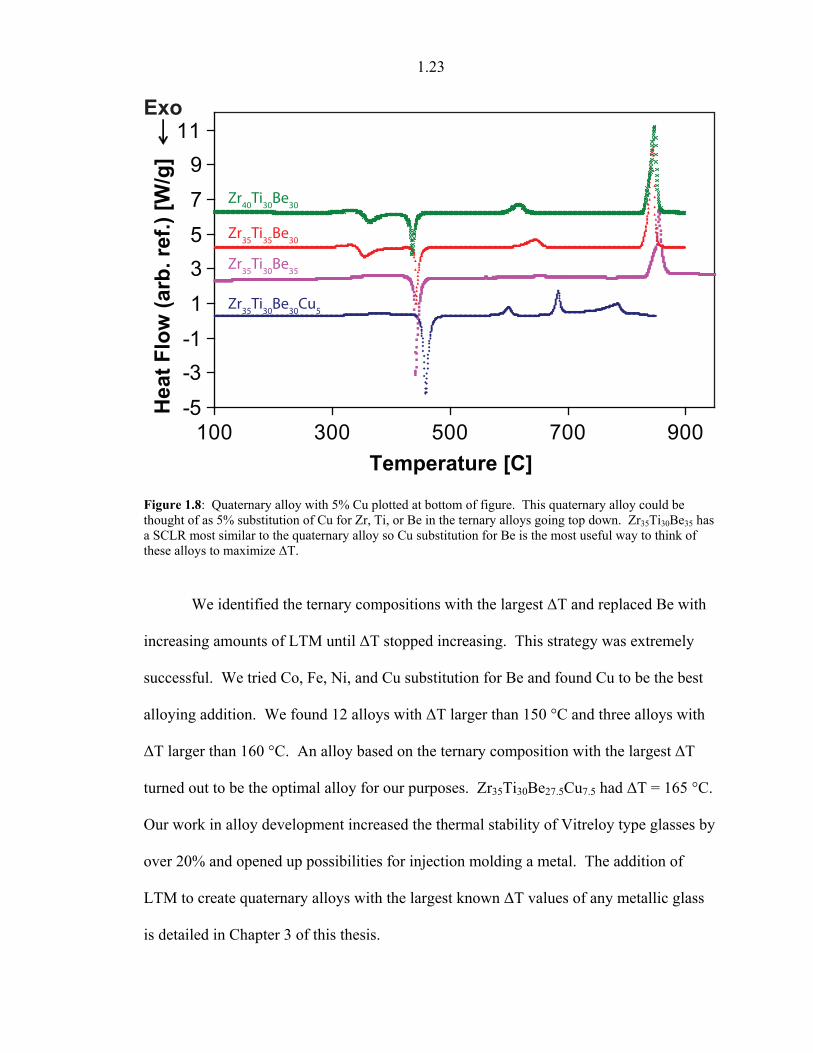
improvement. For instance the alloy Zr35Ti30Be30Cu5 could be thought of as
• 5% Cu substitution of Zr in Zr40Ti30Be30
• 5% Cu substitution of Ti in Zr35Ti35Be30
• 5% Cu substitution of Be in Zr35Ti30Be35
The property we sought to maximize was ΔT. Adding a LTM to the alloys had the added
bonus of increasing GFA. DSC plots of the ternary alloys and quaternary alloy which
could be thought of as Cu substitution for the various elements are included in Figure 1.8.
Figure 1.8 suggests that LTM substitution should be thought of as a fourth element being
substituted for Be in order to maximize ΔT.
1.23
-5-3-113579
11
100 300 500 700 900Temperature [C]
Hea
t Flo
w (a
rb. r
ef.)
[W/g
]
Zr35Ti30Be30Cu5
Zr35Ti30Be35
Zr35Ti35Be30
Zr40Ti30Be30
Exo
Figure 1.8: Quaternary alloy with 5% Cu plotted at bottom of figure. This quaternary alloy could be thought of as 5% substitution of Cu for Zr, Ti, or Be in the ternary alloys going top down. Zr35Ti30Be35 has a SCLR most similar to the quaternary alloy so Cu substitution for Be is the most useful way to think of these alloys to maximize ΔT.
We identified the ternary compositions with the largest ΔT and replaced Be with
increasing amounts of LTM until ΔT stopped increasing. This strategy was extremely
successful. We tried Co, Fe, Ni, and Cu substitution for Be and found Cu to be the best
alloying addition. We found 12 alloys with ΔT larger than 150 °C and three alloys with
ΔT larger than 160 °C. An alloy based on the ternary composition with the largest ΔT
turned out to be the optimal alloy for our purposes. Zr35Ti30Be27.5Cu7.5 had ΔT = 165 °C.
Our work in alloy development increased the thermal stability of Vitreloy type glasses by
over 20% and opened up possibilities for injection molding a metal. The addition of
LTM to create quaternary alloys with the largest known ΔT values of any metallic glass
is detailed in Chapter 3 of this thesis.
1.24
1.6 What To Do with All These Alloys
Grad students often daydream about being one of those scientists so accomplished
they get equations or physical constants or even elements named after them. Einstein,
Curie, Fermi, Nobel, Mendel, Bohr, Lawrence, Rutherford, Meitner, and Seaborg all
made it to the Periodic Table of the Elements. Some of us in the Johnson group wished
to play a hand in our scientific immortality and decided to name alloys after ourselves.
Elements have the suffix “ium” added after the name and in order to differentiate our
alloys from elements, we had to come up with a new suffix. Indisputably Amorphous
Metal, “IAM,” seemed like a good suffix that would sound elemental. It further amused
because of the biblical reference in Exodus, and because the plural, IAMS, could be
confused for a dog food. Just to make sure these alloys are in print and not limited to oral
histories of the Johnson research group they are recorded here.
• Aaroniam Zr35Ti30Be29Co6
• Marioniams A class of Ni and Cu free Pd glasses [55]
• O’Reillyam / O'Reilliam Zr35Ti30Be30Al5*
*In honor of my favorite news commentator, I have named a cutting edge alloy after Bill
O’Reilly. This alloy, O'Reillyam (O'Reilliam) is less dense than others in its family and
can withstand a corrosive environment 1,000,000 times longer than its precious-metal
sister.
After inventing and naming the alloys, some of the properties needed to be
studied. The squish test proposed by Schroers, as a way to rank thermoplastic formability
of different alloys, was performed on the alloys favored for TPF in the literature, namely,
Pd43Ni10Cu27P20, Pt57.5Ni5.3Cu14.7P22.5, Zr41.2Ti13.8Cu12.5Ni10Be22.5 (Vitreloy 1), and
1.25
Zr44Ti11Cu10Ni10Be25 (Vitreloy 1b) as well as the alloy we invented with the largest ΔT,
Zr35Ti30Be27.5Cu7.5. The squish test indicated that Zr35Ti30Be27.5Cu7.5 had the best
potential for TPF of any of the alloys tested. Details of the squish test are included in
Chapter 4 of this thesis.
η(T) and TTT measurements for Zr35Ti30Be27.5Cu7.5 were taken to quantitatively
determine the TPF. Details of these experiments in Chapter 4 reveal a surprisingly high
fragility was calculated for this alloy that does not fit well with other Vitreloy alloy data.
It has been neglected so far, but many of the ternary alloys showed the double
discontinuity in heat capacity that Tanner proposed was evidence of two glasses. Many
of the quaternary compositions based on the “two Tg” ternaries also showed the double
jump in heat capacity. A more detailed study of the flow properties of these materials
with the two Tg events is included in Chapter 6 of this thesis. The unusual flow
properties of these materials may be the reason for the high fragility calculated for
Zr35Ti30Be27.5Cu7.5 which exhibits the two Tg phenomenon. A plot in Chapter 5 of ηTT
(using heating data) for the commonly used TPF alloys and the newly invented
Zr35Ti30Be27.5Cu7.5 verify as the squish tests did that Zr35Ti30Be27.5Cu7.5 is the best
available for TPF applications like injection molding. That plot is reprinted here as
Figure 1.9.
1.26
10000
100000
1000000
10000000
0 100 200 300 400 500 600
Time to crystallize [s]
Visc
osity
[Pa-
s]
Pt57.3Ni5.3Cu14.6P22.8
Pd40Ni10Cu30P20
Zr44Ti11Be25Ni10Cu10
Zr35Ti30Be27.5Cu7.5
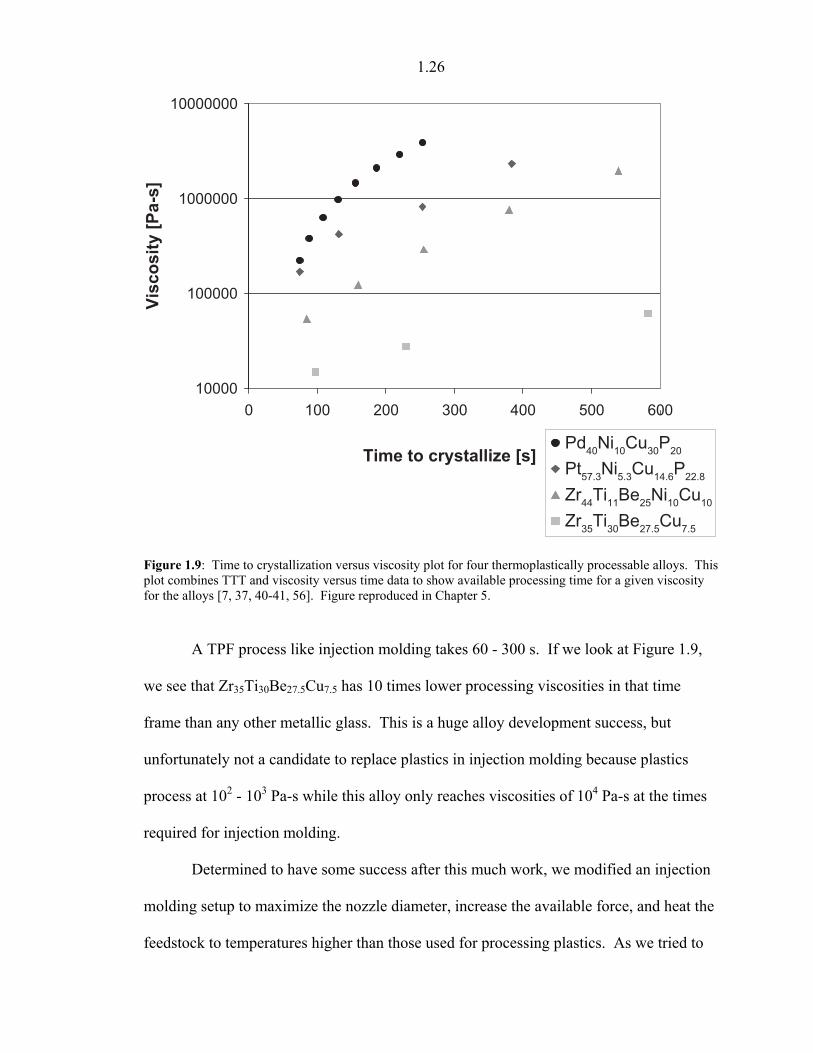
Figure 1.9: Time to crystallization versus viscosity plot for four thermoplastically processable alloys. This plot combines TTT and viscosity versus time data to show available processing time for a given viscosity for the alloys [7, 37, 40-41, 56]. Figure reproduced in Chapter 5.
A TPF process like injection molding takes 60 - 300 s. If we look at Figure 1.9,
we see that Zr35Ti30Be27.5Cu7.5 has 10 times lower processing viscosities in that time
frame than any other metallic glass. This is a huge alloy development success, but
unfortunately not a candidate to replace plastics in injection molding because plastics
process at 102 - 103 Pa-s while this alloy only reaches viscosities of 104 Pa-s at the times
required for injection molding.
Determined to have some success after this much work, we modified an injection
molding setup to maximize the nozzle diameter, increase the available force, and heat the
feedstock to temperatures higher than those used for processing plastics. As we tried to
1.27
make Zr35Ti30Be27.5Cu7.5 feedstock we ran into additional problems. Alloys are melted
on an arc melter and if the ingot cools amorphous, the value of ΔT ~ 165 °C. If the alloy
is remelted and cast into a mold, ΔT decreases. We tried various temperatures and hold
times while melting the alloy in quartz tubes and water quenching and the value of ΔT
decreased. The details of this study are included in Chapter 5.
Finally we decided that amorphous ingots from the arc melter must be used as
feedstock material. The bottom of the ingots however had a thin crystalline layer because
of direct contact with the cooled hearth and had to be cut off with a diamond saw. After
verifying that the ingots were completely amorphous, multiple attempts at injection
molding were made using varying temperatures and pressures. The modifications were
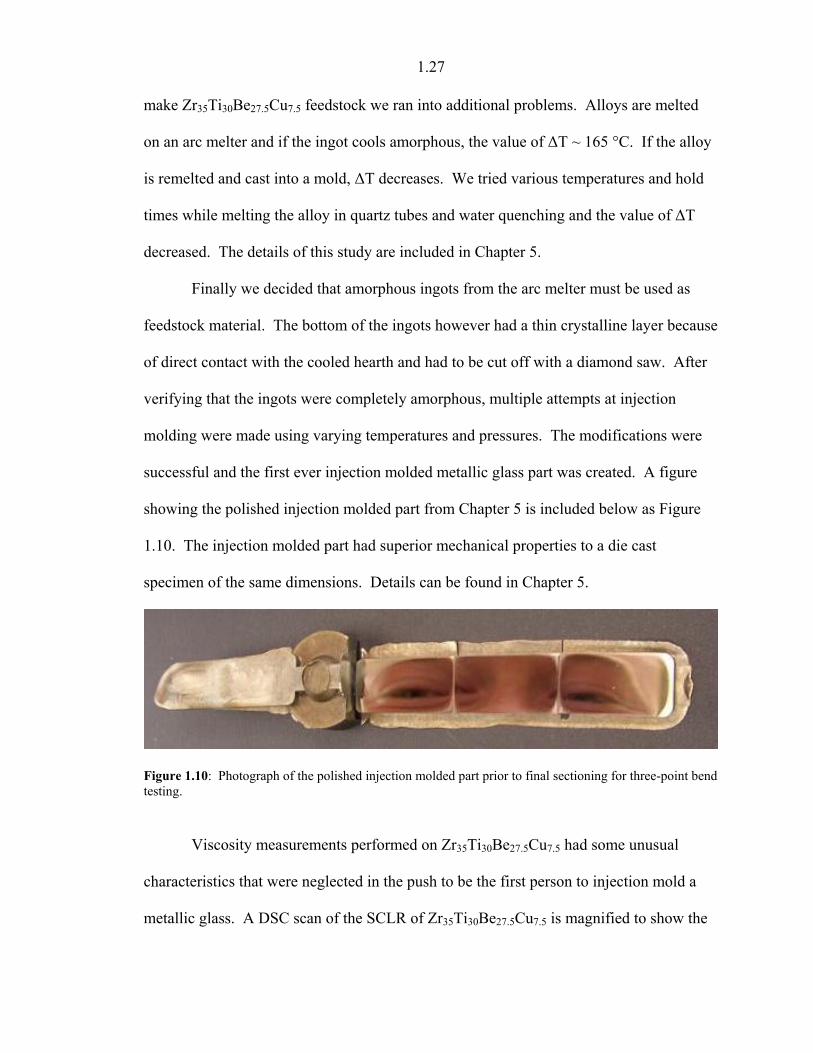
successful and the first ever injection molded metallic glass part was created. A figure
showing the polished injection molded part from Chapter 5 is included below as Figure
1.10. The injection molded part had superior mechanical properties to a die cast
specimen of the same dimensions. Details can be found in Chapter 5.
Figure 1.10: Photograph of the polished injection molded part prior to final sectioning for three-point bend testing.
Viscosity measurements performed on Zr35Ti30Be27.5Cu7.5 had some unusual
characteristics that were neglected in the push to be the first person to injection mold a
metallic glass. A DSC scan of the SCLR of Zr35Ti30Be27.5Cu7.5 is magnified to show the
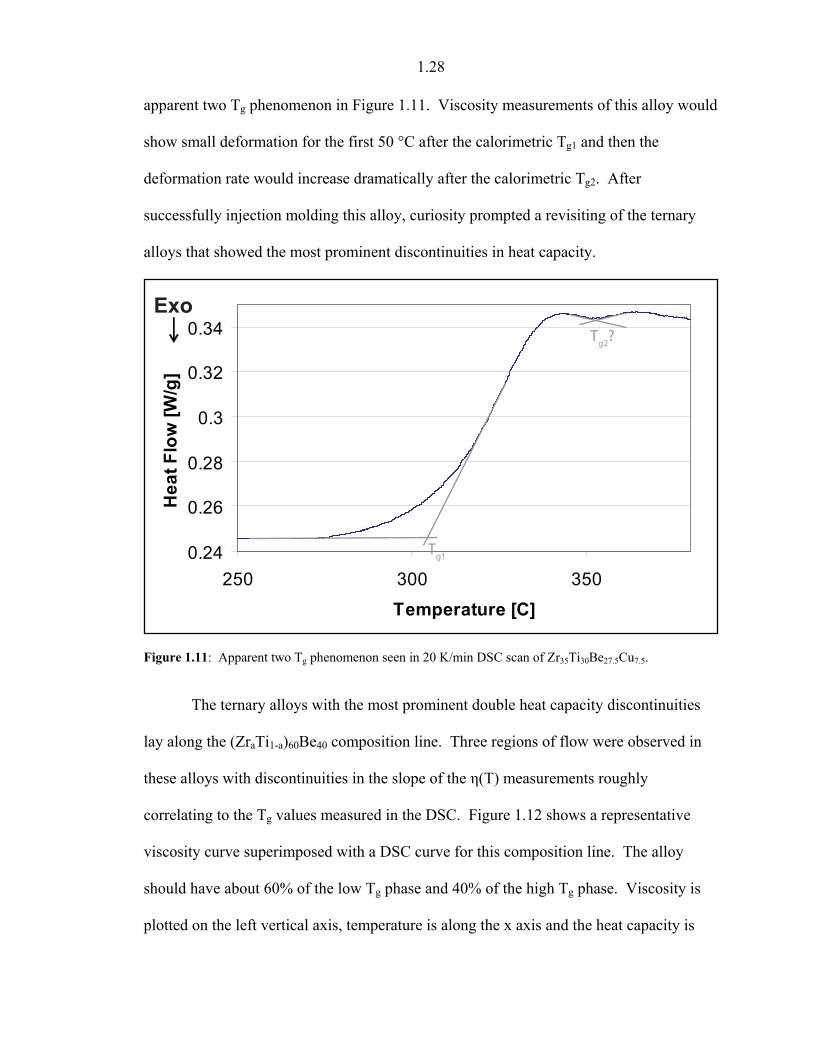
1.28
apparent two Tg phenomenon in Figure 1.11. Viscosity measurements of this alloy would
show small deformation for the first 50 °C after the calorimetric Tg1 and then the
deformation rate would increase dramatically after the calorimetric Tg2. After
successfully injection molding this alloy, curiosity prompted a revisiting of the ternary
alloys that showed the most prominent discontinuities in heat capacity.
0.24
0.26
0.28
0.3
0.32
0.34
250 300 350
Temperature [C]
Hea
t Flo
w [W
/g]
Tg1
Tg2?
Exo
Figure 1.11: Apparent two Tg phenomenon seen in 20 K/min DSC scan of Zr35Ti30Be27.5Cu7.5.
The ternary alloys with the most prominent double heat capacity discontinuities
lay along the (ZraTi1-a)60Be40 composition line. Three regions of flow were observed in
these alloys with discontinuities in the slope of the η(T) measurements roughly
correlating to the Tg values measured in the DSC. Figure 1.12 shows a representative
viscosity curve superimposed with a DSC curve for this composition line. The alloy
should have about 60% of the low Tg phase and 40% of the high Tg phase. Viscosity is
plotted on the left vertical axis, temperature is along the x axis and the heat capacity is
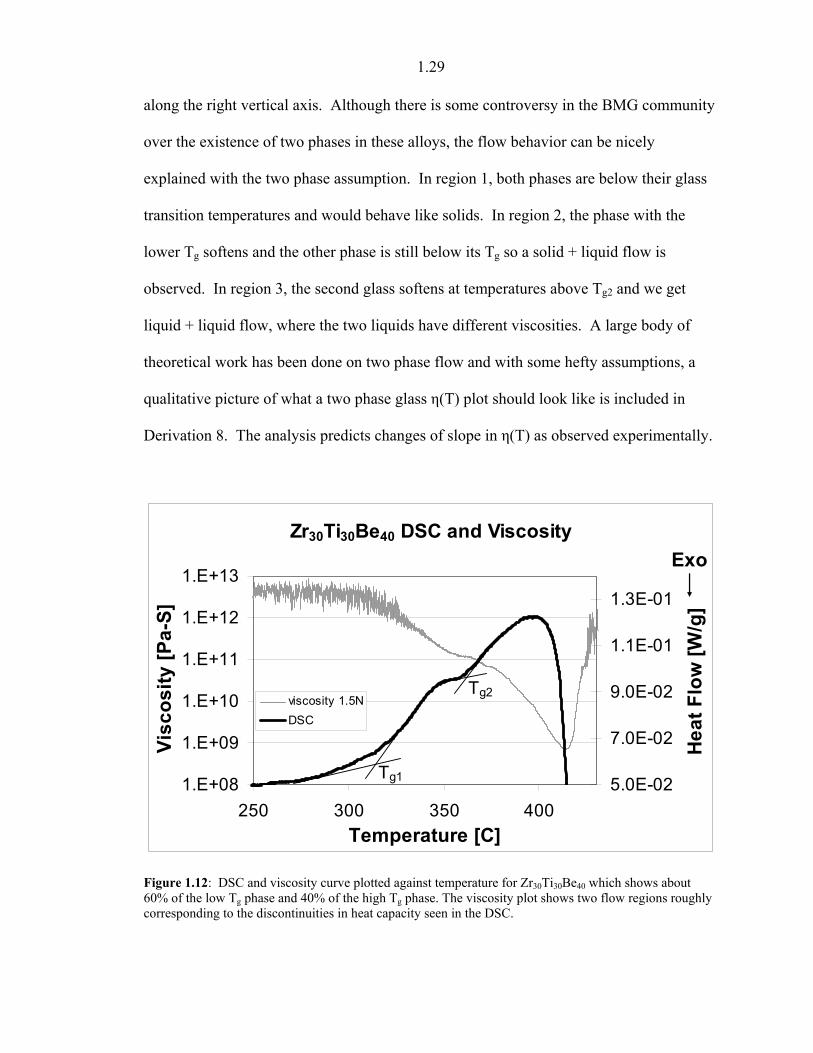
1.29
along the right vertical axis. Although there is some controversy in the BMG community
over the existence of two phases in these alloys, the flow behavior can be nicely
explained with the two phase assumption. In region 1, both phases are below their glass
transition temperatures and would behave like solids. In region 2, the phase with the
lower Tg softens and the other phase is still below its Tg so a solid + liquid flow is
observed. In region 3, the second glass softens at temperatures above Tg2 and we get
liquid + liquid flow, where the two liquids have different viscosities. A large body of
theoretical work has been done on two phase flow and with some hefty assumptions, a
qualitative picture of what a two phase glass η(T) plot should look like is included in
Derivation 8. The analysis predicts changes of slope in η(T) as observed experimentally.
Zr30Ti30Be40 DSC and Viscosity
1.E+08
1.E+09
1.E+10
1.E+11
1.E+12
1.E+13
250 300 350 400Temperature [C]
Visc
osity
[Pa-
S]
5.0E-02
7.0E-02
9.0E-02
1.1E-01
1.3E-01
Hea
t Flo
w [W
/g]
viscosity 1.5NDSC
Exo
Tg1
Tg2
Figure 1.12: DSC and viscosity curve plotted against temperature for Zr30Ti30Be40 which shows about 60% of the low Tg phase and 40% of the high Tg phase. The viscosity plot shows two flow regions roughly corresponding to the discontinuities in heat capacity seen in the DSC.
1.30
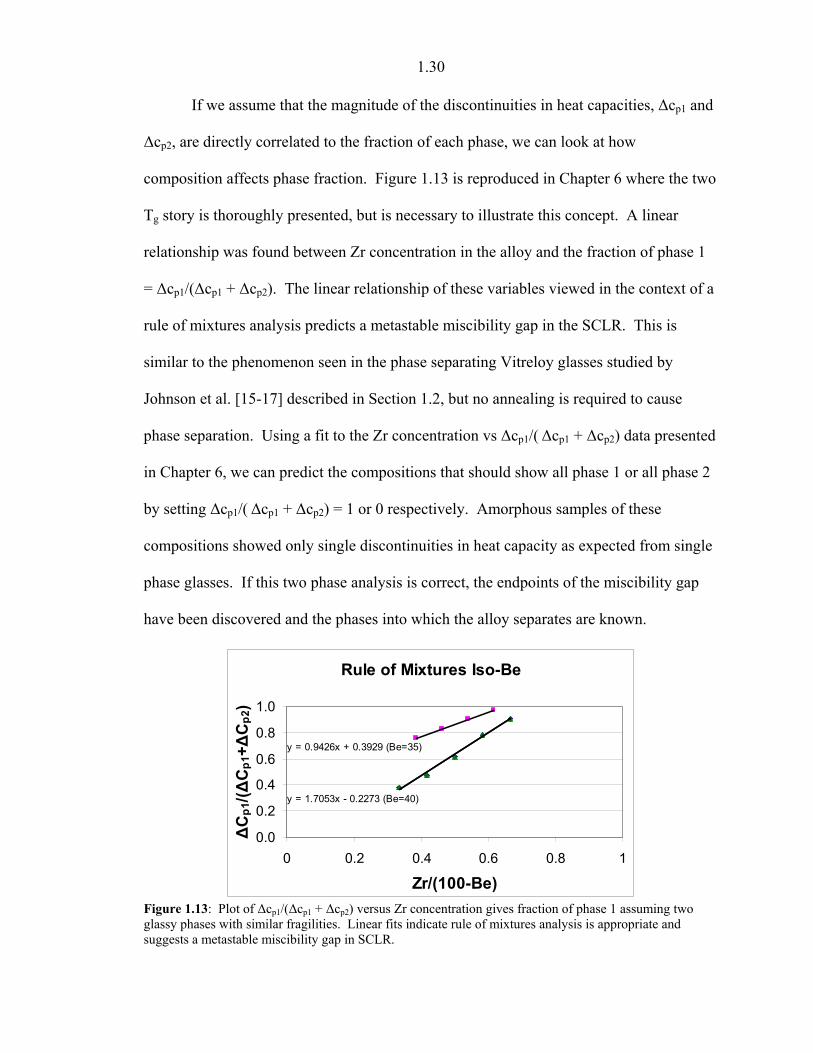
If we assume that the magnitude of the discontinuities in heat capacities, Δcp1 and
Δcp2, are directly correlated to the fraction of each phase, we can look at how
composition affects phase fraction. Figure 1.13 is reproduced in Chapter 6 where the two
Tg story is thoroughly presented, but is necessary to illustrate this concept. A linear
relationship was found between Zr concentration in the alloy and the fraction of phase 1
= Δcp1/(Δcp1 + Δcp2). The linear relationship of these variables viewed in the context of a
rule of mixtures analysis predicts a metastable miscibility gap in the SCLR. This is
similar to the phenomenon seen in the phase separating Vitreloy glasses studied by
Johnson et al. [15-17] described in Section 1.2, but no annealing is required to cause
phase separation. Using a fit to the Zr concentration vs Δcp1/( Δcp1 + Δcp2) data presented
in Chapter 6, we can predict the compositions that should show all phase 1 or all phase 2
by setting Δcp1/( Δcp1 + Δcp2) = 1 or 0 respectively. Amorphous samples of these
compositions showed only single discontinuities in heat capacity as expected from single
phase glasses. If this two phase analysis is correct, the endpoints of the miscibility gap
have been discovered and the phases into which the alloy separates are known.
Rule of Mixtures Iso-Be
y = 1.7053x - 0.2273 (Be=40)
y = 0.9426x + 0.3929 (Be=35)
0.0
0.2
0.4
0.6
0.8
1.0
0 0.2 0.4 0.6 0.8 1
Zr/(100-Be)
ΔC
p1/(Δ
Cp1
+ΔC
p2)
Figure 1.13: Plot of Δcp1/(Δcp1 + Δcp2) versus Zr concentration gives fraction of phase 1 assuming two glassy phases with similar fragilities. Linear fits indicate rule of mixtures analysis is appropriate and suggests a metastable miscibility gap in SCLR.
1.31
The alloy calculated to contain only phase 1 was Zr43Ti17Be40. The alloy
calculated to contain only phase 2 was Zr8Ti52Be40. If phase separation into these single
phase compositions existed in the two Tg alloys, Z contrast imaging in the SEM seemed
like a good way to prove their existence. SEM failed to observe the phases suggesting
that perhaps the scale of phase separation was too small. This was plausible because
Johnson et al. calculated the scale of phase separation was 13nm in Vitreloy compositions
from SANS data [15]. TEM work also failed to reveal the two phases. Bright field (BF)
and dark field (DF) images showed no evidence of phase separation at nm length scales.
Diffraction patterns may have had broadening of the amorphous halo, but were not
distinct enough to prove phase separation. Composition analysis was also inconclusive.
If the phase separation is very small, on the order of 3 - 5nm or the size of an STZ, the
electron interactions with multiple phase regions would be averaged over the thickness of
the sample and would mask BF or DF contrast.
It is disheartening not to have microscopic evidence of the two phases. Ternary
samples had limited GFA so preparation of a sample for SANS is difficult. SAXS is a
good technique for observing composition fluctuations that we are pursuing at Argonne
National Labs. We discovered that these samples could be doped with up to 2% Fe
without diminishing the apparent two Tg effect and hoped that Mössbauer spectroscopy
might reveal two local environments. We doped the two endpoint compositions expected
to contain only one phase with 2% Fe and observed two distinct spectra. Two
intermediate compositions showing the two Tg phenomenon were also doped with 2% Fe.
The two intermediate compositions had Mössbauer spectra identical to the Zr8Ti52Be40
alloy. Various annealing times and temperatures were tried on the two Tg alloys with no
1.32
change in the spectra. If we had microscopic evidence of the two phases, we could argue
that all the Fe went to the Ti rich phase and therefore all spectra looked like the
Zr8Ti52Be40 alloy except the Zr43Ti17Be40 composition where the Fe was forced into the
Zr rich phase because there was no Ti rich phase present. This explanation seems
implausible given the entropic driving force to dissolve impurities in a phase.
Additionally there seems to be no insolubility of Fe in the FeZr phase diagram.
The anomalous flow behavior of alloys with an apparent two Tg event was
observed and the steeper slope of η(T) in the “liquid + liquid” region 3 may be the reason
for the higher than expected fragility calculated for Zr35Ti30Be27.5Cu7.5 reported in
Chapter 4. Chapter 6 clearly shows the presence of two relaxation phenomena in the
SCLR of these alloys, but fails to convincingly establish the presence of two phases.
1.6.1 Biocompatible Beryllium???
Appendices A1, A2, and A3 were a digression from the thermodynamics, flow
properties and TPF theme of this work, but represent efforts to commercialize a few of
the more amazing alloys and led to some important discoveries.
ZrTiBe alloys have high strength, high hardness, good wear characteristics, high
corrosion resistance, high elastic limit, and low Young’s modulus [57-59]. They fail
catastrophically in tension and can show some compressive plasticity in compression [57,
60]. They are less dense than steel, more dense than Al and some compositions approach
the density of Ti [57]. The fatigue properties were wonderful according to some groups
in 2005 and terrible according to other groups [61-62]. One promising application we
saw for these alloys was as orthopaedic hardware.
1.33
Hip replacements have some characteristic failure mechanisms. Wear debris can
be created as the ball and socket material rub together [63]. This wear debris migrates
into the surrounding tissue and causes inflammation. The hardness and good wear
characteristics of ZrTiBe glasses could diminish the likelihood of this failure mechanism.
Another problem is called stress shielding [64]. The commonly used implant materials
have stiffnesses or Young’s modulii much higher than bone. As a result, the load on the
hip is carried mainly by the metallic implant material and not the bone surrounding it. As
a result of this stress shielding, the body decreases the unused bone's density, the implant
loosens, and fracture can result. The Young’s modulus of ZrTiBe BMG is much lower
than the commonly used implant materials and could diminish stress shielding. Another
failure mechanism is fatigue cracking [65]. The size and type of artificial hip is
determined prior to surgery. If a person gains weight and stresses the hip more than was
estimated, fatigue conditions accelerate and the socket joint can fail catastrophically. The
good corrosion resistance and high strength of ZrTiBe glasses along with some of the
promising fatigue data made us hopeful that the newly discovered alloys would be
unaffected by this failure mechanism as well.
The newly invented alloys showed promise to solve some of the mechanical
failure mechanisms of hip joints or more broadly orthopaedic hardware, but
biocompatibility of these alloys was unknown. Zr and Ti are well known for their
biocompatibility. Many alloys free of Ni and Cu had been invented and Ni and Cu are
known for poor biocompatibility. Beryllium is a known respiratory toxin, but very little
data on cytotoxicity of Be containing alloys was found in the literature. A good indicator
of biocompatibility is corrosion resistance [66]. Zr based BMG compositions are known
1.34
to have good corrosion resistances in saline environments [67] and biologically relevant
solutions [68] and this suggested they might show good biocompatibility.
With limited equipment to test corrosion at Caltech, we chose four highly
corrosive solutions, (37% w/w HCl, 0.6M NaCl, 50% w/w NaOH, and 10x phosphate
buffered saline (PBS)), to test the corrosion resistance of three metallic glass
compositions, (Zr35Ti30Be35, Zr35Ti30Be29Co6, and Zr44Ti11Cu10Ni10Be25), and three
commonly used alloys for biomedical applications (Ti-6Al-4V, 316L Stainless Steel, and
CoCrMo). Mass loss measurements were conducted at 1 week, 1 month, and 3 months.
Inductively coupled plasma mass spectrometry (ICPMS) measurements were used to
analyze the solution for dissolved elements. Details of this study are included in
Appendix A1. It was determined from mass loss data that all alloys had excellent
corrosion resistance in all solutions except for HCl. ICPMS data was inconclusive for
some of the solutions because the amount of dissolved material was below the detection
limit.
Corrosion rates in HCl were enormous for most of the alloys tested.
Zr44Ti11Cu10Ni10Be25 dissolved in under 10 minutes. Most of the other alloys were
completely dissolved in 1 week, Zr35Ti30Be35 survived for almost 1 month, and the only
alloy to survive the full 3 months was CoCrMo which lost 12% of its mass. Corrosion
rates in HCl were seen to vary by many orders of magnitude depending on composition.
We sought to find the most corrosion resistant BMG for biological applications and given
that this was an acidic chloride containing environment, we saw an opportunity to quickly
differentiate corrosion resistances in a possibly biologically relevant accelerated
corrosion environment.
1.35
Zr35Ti30Be35 quaternary variants showed the most promise for injection molding
so the bulk of the corrosion testing focused on those compositions. Depending on the
fourth alloying element, the corrosion rate varied from 107 MPY to 50 MPY where MPY
is a corrosion penetration rate that measures .001 in / year thickness loss. A plot of
standard hydrogen electrode (SHE) half cell potential of the fourth alloying element vs
Log(MPY) gave a fairly linear relationship. This was unexpected and has not been
satisfactorily explained. The most noble alloying element Pd, when substituted for 4%
Be, caused the highest corrosion rate while Al, which has the most anodic half cell
potential, when substituted for 5% Be, caused the lowest corrosion rate of the ZrTiBe
compositions tested in HCl. The problem with Al addition was that it raised Tg and
decreased GFA and ΔT (see Chapter 3). More details can be found in Appendix A1.
Zr35Ti30Be35 and Zr35Ti30Be29Co6 were chosen for further biocompatibility testing.
Zr35Ti30Be35 exhibited one of the best corrosion resistances in HCl, had moderate GFA =
6mm, had a moderate ΔT = 120 °C and good strength to weight ratio. Zr35Ti30Be29Co6
had good corrosion resistance, but much better GFA = 15mm, ΔT = 155 °C, and showed
good potential for TPF. Samples were sent to a testing company NAMSA and short term
in vitro and in vivo studies were done to assess biocompatibility. Both alloys performed
as well as the control specimen and were considered biocompatible in these short term
trials. I took a semester long cell culture class at PCC and had the opportunity to test the
cytotoxicity of the 10x PBS solutions in which the metals were tested for corrosion
resistance. The solution was diluted to regular 1x strength and no visible damage to the
cells resulted after they were exposed to the media and allowed to reach 90% confluence.
We became aware of extensive biocompatibility testing performed for Liquidmetal
1.36
Technologies on samples of Vitreloy 1 and a glassy composite material called LM2 in an
effort to obtain FDA approval. The testing showed that both Vitreloy and the Be
containing LM2 were viable as biomaterials and had even passed 1 year in vivo studies in
New Zealand White Rabbits. The results of the biocompatibility testing are more
thoroughly discussed in Appendix A2.
Discussions with Liquidmetal Technologies revealed that the FDA approval
process had been abandoned temporarily not because of biocompatibility issues, but
because of corrosion fatigue issues with these alloys. Given our improvements in ZrTiBe
alloy corrosion resistance we arranged a collaboration with Dr. Liaw at the University of
Tennessee, Knoxville and provided Zr35Ti30Be35 and Zr35Ti30Be29Co6 samples for
corrosion testing in NaCl solutions and corrosion fatigue testing. Our newly invented
alloys showed more than an order of magnitude increase in corrosion resistance in
simulated sea water solutions as compared to other ZrTi based BMG compositions and
even better than other crystalline alloys commonly used in marine environments.
Corrosion fatigue results however, were unimproved over other ZrTi based glass forming
compositions.
X-ray photoelectron spectroscopy, XPS, studies of the surface chemistry of these
new compositions revealed a fully oxidized surface that likely acts as an effective
corrosion barrier in static corrosion testing. This oxide layer is expected to have low
fracture toughness if the fracture toughnesses of Zr, Ti, or Be oxides are representative of
the alloy's surface oxide fracture toughness. As a result of the applied stresses in
corrosion fatigue testing, the surface layer cracks allowing the corrosive solution access
1.37
to the unoxidized inner material, resulting in a corrosion couple between the inner
material and cracked surface layer. More details of this study are found in Appendix A3.
1.7 Introduction Summary
The thermoplastic formability (TPF) of metallic glasses was found to be related to
the calorimetrically measured crystallization temperature minus the glass transition
temperature, Tg - Tx = ΔT. Alloy development in the ZrTiBe system identified a
composition with ΔT = 120 °C. Many alloys with ΔT > 150 °C and one alloy,
Zr35Ti30Be27.5Cu7.5, with ΔT = 165 °C were discovered by substituting Be with small
amounts of fourth alloying elements. The viscosity as a function of temperature, η(T),
and time temperature transformation (TTT) measurements for the new alloy are presented
and combined to create ηTT plots (viscosity time transformation) that are useful in
determining what viscosities are available for a required processing time. ηTT plots are
created for many alloys used in TPF in the literature and it is found that for processes
requiring 60 - 300 s, Zr35Ti30Be27.5Cu7.5 provides an order of magnitude lower viscosity
for processing than the other metallic glasses. Injection molding is demonstrated with
Zr35Ti30Be27.5Cu7.5 and the part shows improved mechanical properties over die cast
specimens of the same geometry. Changes of slope in η(T) measurements were observed
and investigated in some quaternary compositions and found to be present in ternary
compositions as well. Traditionally metallic glasses show a single discontinuity in heat
capacity at the glass transition temperature. Alloys with the changes in slope of η(T)
were found to show two discontinuities in heat capacity with the changes in slope of η(T)
roughly correlating with the observed Tg values. These two Tg values were assumed to
arise from two glassy phases present in the alloy. Further heat capacity analysis found
1.38
systematic trends in the magnitude of the heat capacity discontinuities with composition
and the single phase compositions of a metastable miscibility gap were discovered.
Microscopic evidence of the two phases is lacking so we must limit our claims to
evidence of two relaxation phenomena existing and can’t definitively claim two phases.
The alloy development led to the discovery of alloys with densities near Ti that
are among the highest strength to weight ratio materials known. Alloys with corrosion
resistances in simulated sea water 10x greater than other Zr based glasses and commonly
used marine metals were discovered. Glasses spanning 6 orders of magnitude in
corrosion resistance to 37% w/w HCl were discovered. Corrosion fatigue in saline
environments remains a problem for these compositions and prevents their utility as
biomaterials despite good evidence of biocompatibility in in vitro and in vivo studies.
Chapter 1 References [1] J. Schroers, W.L. Johnson, R. Busch, Appl. Phys. Lett. 77 (2000) 1158. [2] S.R. Elliott, Physics of Amorphous Materials, second ed., John Wiley & Sons
Inc., New York, 1990, pp. 29-69. [3] J. Schroers, A. Masuhr, W.L. Johnson, R. Busch, Phys. Rev. B 60 (1999) 11855. [4] A. Peker, W.L. Johnson, Appl. Phys. Lett. 63 (1993) 2342. [5] Y.J. Kim, R. Busch, W.L. Johnson, A.J. Rulison, W.K. Rhim, Appl. Phys. Lett.
68 (1996) 1057. [6] H. Vogel, Z. Phys. 22 (1921) 645. [7] W.L. Johnson, M.D. Demetriou, J.S. Harmon, M.L. Lind, K. Samwer, MRS Bull.
32 (2007) 644. [8] M.C. Lee, J.M. Kendall, W.L. Johnson, Appl. Phys. Lett. 40 (1982) 382. [9] W.L. Johnson, Amorphe Metallische Werkstoffe 14, Metalltagung in der DDR
(1981) 183. [10] R. Schulz, K. Samwer, W.L. Johnson, J. Non-Cryst. Solids 61 & 62 (1984) 997. [11] L.E. Tanner, R. Ray, Scripta Metal. 11 (1977) 783. [12] R. Hasegawa, L.E. Tanner, Phys. Rev. B 16 (1977) 3925. [13] L.E. Tanner, R. Ray, Acta Metall. 27 (1979) 1727. [14] L.E. Tanner, R. Ray, Scripta Metall. 14 (1980) 657. [15] S. Schneider, P. Thiyagarajan, U. Geyer, W.L. Johnson, MRS Technical Report
DOI 10.2172/510428 (1996). [16] S. Schneider, P. Thiyagarajan, U. Geyer, W.L. Johnson, Physica B 241 (1998)
918.
1.39
[17] S. Schneider, U. Geyer, P. Thiyagarajan, W.L. Johnson, Materials Science Forum Vols. 235-238 (1997) 337.
[18] W. Liu, W.L. Johnson, S. Schneider, U. Geyer, P. Thiyagarajan, Phys. Rev. B 59 (1999) 11755.
[19] Q. Zhang, W. Zhang, G. Xie, A. Inoue, Mater. Sci. Eng. B 148 (2008) 97. [20] B.J. Park, H.J. Chang, D.H. Kim, W.T. Kim, K. Chattopadhyay, T.A.
Abinandanan, S. Bhattacharyya, Phys. Rev. Lett. 96 (2006) 245503. [21] R.G. Hennig, A.E. Carlsson, K.F. Kelton, C.L. Henley, Phys. Rev. B 71 (2005)
144103. [22] X.P. Tang, J.F. Löffler, W.L. Johnson, Y. Wu, J. Non-Cryst. Solids 317 (2003)
118. [23] B. Van de Moortele, T. Epicier, J.L. Soubeyroux, J.M. Pelletier, Phil. Mag. Lett.
84 (2004) 245. [24] G. Wang, J. Shen, J.F. Sun, B.D. Zhou, J.D. Fitz Gerald, D.J. Llewellyn, Z.H.
Stachurski, Scripta Mater. 53 (2005) 641. [25] J.H. Na, Y.C. Kim, W.T. Kim, D.H. Kim, Met. Mater. Int. 14 (2008) 553. [26] G. Kumar, D. Nagahama, M. Ohnuma, T. Ohkubo, K. Hono, Scripta Mater. 54
(2006) 801. [27] D. Nagahama, T. Ohkubo, K. Hono, Scripta Mater. 49 (2003) 729. [28] T. Abe, M. Shimono, K. Hashimoto, K. Hono, H. Onodera, Scripta Mater. 55
(2006) 421. [29] J. Schroers, Acta Mater. 56 (2008) 471. [30] J. Schroers, JOM 57 (2005) 35. [31] J. Schroers, N. Paton, Adv. Mater. Processes 164 (2006) 61. [32] T. Masumoto, A. Inoue, N. Nishiyama, H. Horimura, T. Shibata, US Patent
#6027586. [33] T. Masumoto, A. Inoue, J. Nagahora, K. Kita, US Patent #5209791. [34] K.S. Lee, Y.W. Chang, Mater. Sci. Eng. A 399 (2005) 238. [35] Y. Saotome, K. Imai, S. Shioda, S. Shimizu, T. Zhang, A. Inoue, Intermetallics 10
(2002) 1241. [36] J. Schroers, Q. Pham, A. Peker, N. Paton, R.V. Curtis, Scripta Mater. 57 (2007)
341. [37] G. Duan, A. Wiest, M.L. Lind, J. Li, W.K. Rhim, W.L. Johnson, Adv. Mater. 19
(2007) 4272. [38] Y. Li, S.J. Poon, G.J. Shiflet, J. Xu, D.H. Kim, J.F. Löffler, MRS Bull. 32 (2007)
624. [39] A.L. Greer, E. Ma, MRS Bull. 32 (2007) 611. [40] B.A. Legg, J. Schroers, R. Busch, Acta Mater. 55 (2007) 1109. [41] T. Waniuk, J. Schroers, W.L. Johnson, Phys. Rev. B 67 (2003) 184203. [42] J. Schroers, W.L. Johnson, Appl. Phys. Lett. 84 (2004) 3666. [43] G.J. Fan, H.J. Fecht, E.J. Lavernia, Appl. Phys. Lett. 84 (2004) 487. [44] J.P. Chu, H. Wijaya, C.W. Wu, T.R. Tsai, C.S. Wei, T.G. Nieh, J. Wadsworth,
Appl. Phys. Lett. 90 (2007), 034101. [45] A. Masuhr, T.A. Waniuk, R. Busch, W.L. Johnson, Phys. Rev. Lett. 82 (1999)
2290. [46] R. Busch,W.L. Johnson, Appl. Phys. Lett. 72 (1998) 2695.
1.40
[47] F. Spaepen, Acta Metall. 25 (1977) 407. [48] J. Lu, G. Ravichandran,W.L. Johnson, Acta Mater. 21 (2003) 3429. [49] L. Kaufman, L.E. Tanner, CALPHAD 3 (1979) 91. [50] L.E. Tanner, R. Ray, C.F. Cline, US Patent #3989517. [51] L.E. Tanner, R. Ray, C.F. Cline, US Patent #4050931. [52] A. Peker, W.L. Johnson, US Patent #5288344. [53] G. Duan, A. Wiest, W.L. Johnson, US Patent Application #20080121316. [54] G. Duan, A. Wiest, M.L. Lind, A. Kahl, W.L. Johnson, Appl. Phys. Lett. 90
(2007) 211901. [55] M.D. Demetriou, A. Wiest, W.L. Johnson, US Patent Application #20090162629. [56] J.F. Löffler, J. Schroers, W.L. Johnson, Appl. Phys. Lett. 77 (2000) 681. [57] G. Duan, A. Wiest, M.L. Lind, A. Kahl, W.L. Johnson, Scripta Mater. 58 (2008)
465. [58] A. Wiest, G.Y. Wang, L. Huang, S. Roberts, M.D. Demetriou, P.K. Liaw, W.L.
Johnson, Scripta Mater. in review. [59] M.Z. Ma, R.P. Liu, Y. Xiao, D.C. Lou, L. Liu, Q. Wang, W.K. Wang, Mater. Sci.
Eng. A 386 (2004) 326. [60] D.C. Hofmann, J.Y. Suh, A. Wiest, G. Duan, M.L. Lind, M.D. Demetriou, W.L.
Johnson, Nature 451 (2008) 1085. [61] G.Y. Wang, P.K. Liaw, A. Peker, B. Yang, M.L. Benson, W. Yuan, W.H. Peter,
L. Huang, M. Freels, R.A. Buchanan, C.T. Liu, C.R. Brooks, Intermetallics 13 (2005) 429.
[62] C.J. Gilbert, J.M. Lippmann, R.O. Ritchie, Scripta Mater. 38 (1998) 537. [63] C.R. McMillin, in: B.D. Ratner, A.S. Hoffman, F.J. Schoen, J.E. Lemons (Eds.),
Biomaterials Science: An Introduction to Materials in Medicine, Academic Press, California, 1996, pp. 267-271.
[64] J. Black, Biological Performance of Materials: Fundamentals of biocompatibility, fourth ed., CRC Press, Florida, 2006.
[65] M. Niinomi, T. Hattori, T. Kasuga, H. Fukui, in: G.E. Wnek, G.L. Bowlin (Eds.), Encyclopedia of Biomaterials and Biomedical Engineering, second ed., Informa Healthcare USA, Inc., New York, 2008, pp. 2876-2892.
[66] G.L. Burke, Can. Med. Assoc. J. (1940) 125. [67] M.L. Morrison, R.A. Buchanan, P.K. Liaw, B.A. Green, G.Y. Wang, C.T. Liu,
J.A. Horton, Mater. Sci. Eng. A 467 (2007) 198. [68] M.L. Morrison, R.A. Buchanan, R.V. Leon, C.T. Liu, B.A. Green, P.K. Liaw, J.A.
Horton, J. Biomed. Mater. Res. Part A 74 (2005) 430.