Embed Size (px)
Citation preview
CHAPTER 10
RADIONUCLIDES IN MILK
ABSTRACT
In this chapter we discuss radionuclide concentrations measured in milk samples collected in the vicinity of the Savannah River Site (SRS). The routine milk sampling data for 131I and 90Sr are potentially the most useful for dose reconstruction. This chapter compiles these data in an electronic form and discusses them in detail. Tritium and 137Cs were also analyzed routinely at the SRS. However, we did not compile these data because many of the samples contained concentrations below the minimum detection limit. Furthermore, the tritium measurement techniques before 1971 had poor sensitivity.
We attempted to verify the data by comparing the reported concentrations from as many sources as possible. The primary source of the data is original handwritten compilations of effluent and environmental monitoring results. In general, we found these original data to be in good agreement with the data reported in monthly, quarterly, semiannual, and annual summary reports generated by SRS.
We also compiled milk monitoring data generated by the Public Health Service (PHS) (which later became the U.S. Environmental Protection Agency) for the three monitoring locations closest to the SRS. These data are very useful because they provided an independent source of information about the concentrations of atmospheric radionuclides in milk in the southeastern U.S. A comparison of the SRS and PHS data suggests that, in general, fallout from atmospheric weapons testing is the probable source of the radionuclide concentrations measured in milk around the SRS. However, there is evidence that SRS activities have contributed to offsite contamination in a few instances. Therefore, these data may be useful for source term verification and environmental transport model validation. These data also allow us to quantify the magnitude of exposures from consumption of contaminated milk. Appendix K further discusses potential uses for environmental monitoring data in dose reconstruction.
INTRODUCTION
Milk can be an important human exposure pathway for environmental releases of radionuclides, in particular, radioiodine. Following an atmospheric release, radionuclides may be deposited onto forage that is ingested by cows. A portion of the ingested radioactivity is secreted into the milk, which can be consumed by humans. Other mechanisms, such as irrigation or flooding of the pasture with contaminated water and root uptake from contaminated soil, may also contaminate forage. Milk monitoring data that are of high quality and above detection limits can be very useful for a dose reconstruction. They may allow the doses from this exposure pathway to be quantified directly or they may be used to test the performance of the environmental transport models used in the dose reconstruction or to quantify individual parameter values in the models.
Risk Assessment Corporation “Setting the standard in environmental health”
10-2 The Savannah River Site Dose Reconstruction ProjectPhase II: Source Term Calculation and Ingestion Pathway Data Retrieval
Three different categories of milk samples were routinely collected and analyzed by the
SRS: 1. Milk from a farm cow (individual family cow) 2. Milk from a local dairy 3. Milk collected from local dairies and sold by a major distributor. Originally, the farms and dairies that were sampled were located within a 50-mile radius of
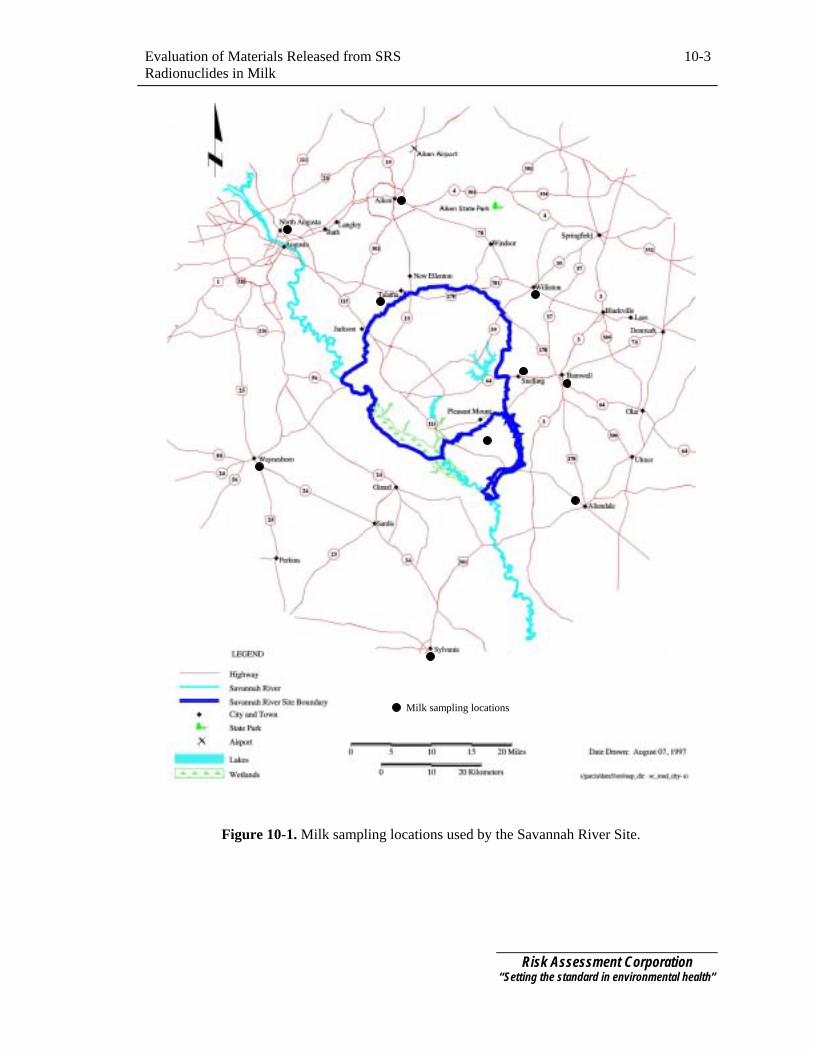
the Site. Around early 1962, the sampling locations were selected to be within a 25-mile radius of the Site. The number of sampling locations and frequency of sampling varied over time according to the findings, the availability of suitable monitoring locations, and resources. Figure 10-1 shows the various milk sampling locations that have been used by the SRS for the radiological monitoring of milk. Table 10-1 summarizes the routine radiological monitoring for milk.
Radiological monitoring of milk was not included in the preoperational background survey (Reinig et al. 1953). That survey was designed to establish background levels of naturally occurring radionuclides before plant startup.
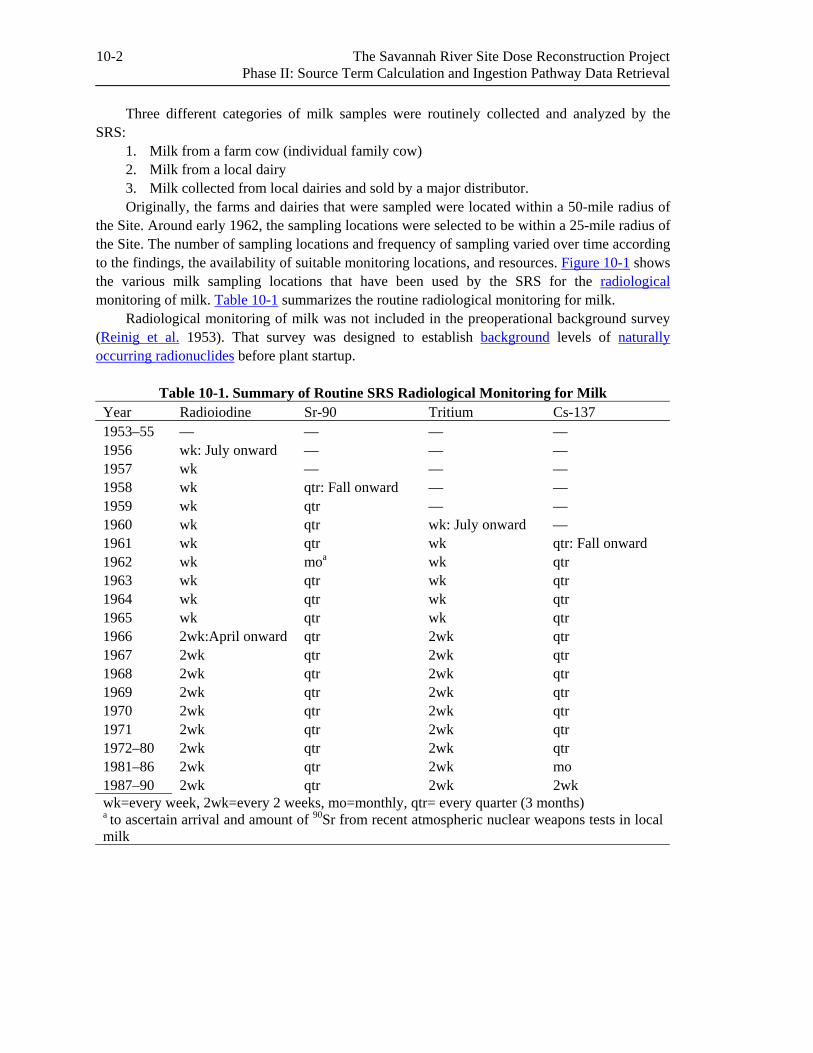
Table 10-1. Summary of Routine SRS Radiological Monitoring for Milk
Year Radioiodine Sr-90 Tritium Cs-137 1953–55 — — — — 1956 wk: July onward — — — 1957 wk — — — 1958 wk qtr: Fall onward — — 1959 wk qtr — — 1960 wk qtr wk: July onward — 1961 wk qtr wk qtr: Fall onward 1962 wk moa wk qtr 1963 wk qtr wk qtr 1964 wk qtr wk qtr 1965 wk qtr wk qtr 1966 2wk:April onward qtr 2wk qtr 1967 2wk qtr 2wk qtr 1968 2wk qtr 2wk qtr 1969 2wk qtr 2wk qtr 1970 2wk qtr 2wk qtr 1971 2wk qtr 2wk qtr 1972–80 2wk qtr 2wk qtr 1981–86 2wk qtr 2wk mo 1987–90 2wk qtr 2wk 2wk wk=every week, 2wk=every 2 weeks, mo=monthly, qtr= every quarter (3 months) a to ascertain arrival and amount of 90Sr from recent atmospheric nuclear weapons tests in local milk
Evaluation of Materials Released from SRS Radionuclides in Milk
10-3
Milk sampling locations
Figure 10-1. Milk sampling locations used by the Savannah River Site.
Risk Assessment Corporation “Setting the standard in environmental health”
10-4 The Savannah River Site Dose Reconstruction ProjectPhase II: Source Term Calculation and Ingestion Pathway Data Retrieval
MEASUREMENTS OF BETA-GAMMA-EMITTERS
The beta-gamma-emitters that were routinely monitored by SRS were radioiodine,
strontium, tritium, and 137Cs (Table 10-1). The earliest sampling of milk is reported in the Control Weekly Report dated June 18–22, 1956 (Du Pont 1956a), which indicates that SRS was experimenting with methods for analyzing iodine and strontium. Routine sampling of milk began toward the end of 1956 for 131I, in the fall of 1958 for 90Sr, in July 1960 for tritium, and in September 1961 for 137Cs.
In general, samples were analyzed weekly and later (beginning April 1966) every 2 weeks (biweekly) for radioiodine and tritium. Milk samples were analyzed quarterly for 90Sr except during 1962 when the monitoring was increased to monthly to ascertain when and to what extent 90Sr from recent atmospheric nuclear tests would appear in local milk (Du Pont 1962a). Milk samples were analyzed quarterly for 137Cs until 1981 when the sample frequency was increased to monthly. This continued until 1987 when the sample frequency was increased to biweekly. Details of the analytical and counting procedures are presented in Appendix A.
We compiled the milk monitoring results for 131I and 90Sr electronically in a Microsoft Excel© workbook (filename: Ch10-All_data.xls). These data are described in detail in the following sections. The tritium measurements have not been compiled because many of the milk sample concentrations were below the minimum detection limit (4000 pCi L−1). The sensitivity of the measurement techniques improved by an order of magnitude in 1971 allowing more reliable tritium concentrations in milk to be determined. Many of the 137Cs measurements in milk samples were also below the sensitivity of the analysis and have not been compiled for this reason. The tritium and 137Cs data are readily available for more detailed examination if necessary.
The data used to plot the figures that are presented later in this chapter are extracted from the Microsoft Excel© workbook Ch10alldata.xls that combines all the data from a separate Microsoft Excel© workbook (filename: Ch10-Figure_data.xls).
Radioiodine
A summary of the source and number of milk samples (e.g. farm cow, local dairy) that were routinely collected as part of the SRS milk-monitoring program is presented in Table 10-2. Details about the frequency of sampling these locations are given in Table 10-1. The SRS environmental monitoring program measurements for analyzing milk samples for radioiodine have been compiled electronically in a Microsoft Excel© workbook (filename: Ch10-All_data.xls) that has a separate spreadsheet for each year of data. The spreadsheets are named according to the year for which the data have been compiled, using the following format, I-131_19xx, where xx represents the last two digits of the year. For example, I-131_1960 contains the 131I measurements in milk for 1960. The data are compiled for 1956 through 1970. As explained below, the data for 1956 through July 1959 are sparse and incomplete. The primary source of these data is handwritten compilations of effluent and environmental monitoring results on ledger sheets. At some point in time, each sheet was photographed by the Site in a format similar to microfiche and mounted on a computer card with a hole cut in the center. These cards, called aperture cards, were found for August 1959 through December 1973 for 131I concentrations in milk. The aperture card data were cross-checked with the data in the weekly, monthly, quarterly, semiannual, and annual environmental monitoring reports. This was accomplished by entering the average concentrations reported for a specific time period
Evaluation of Materials Released from SRS Radionuclides in Milk
10-5
separately in the Microsoft Excel© workbook and comparing these values with those obtained by summing the relevant data from the aperture cards. In general, we observed good agreement between the aperture card and report data. A note is made in the workbook where there is disagreement. For the time period before August 1959, the data are compiled from the weekly and semiannual monitoring reports. These data are incomplete. From 1974 onward, data were compiled only for those time periods when positive monitoring results were reported. These data are obtained from the monthly reports (if available) and the annual monitoring reports. See Chapter 7 for a summary of the different sources of environmental monitoring data.
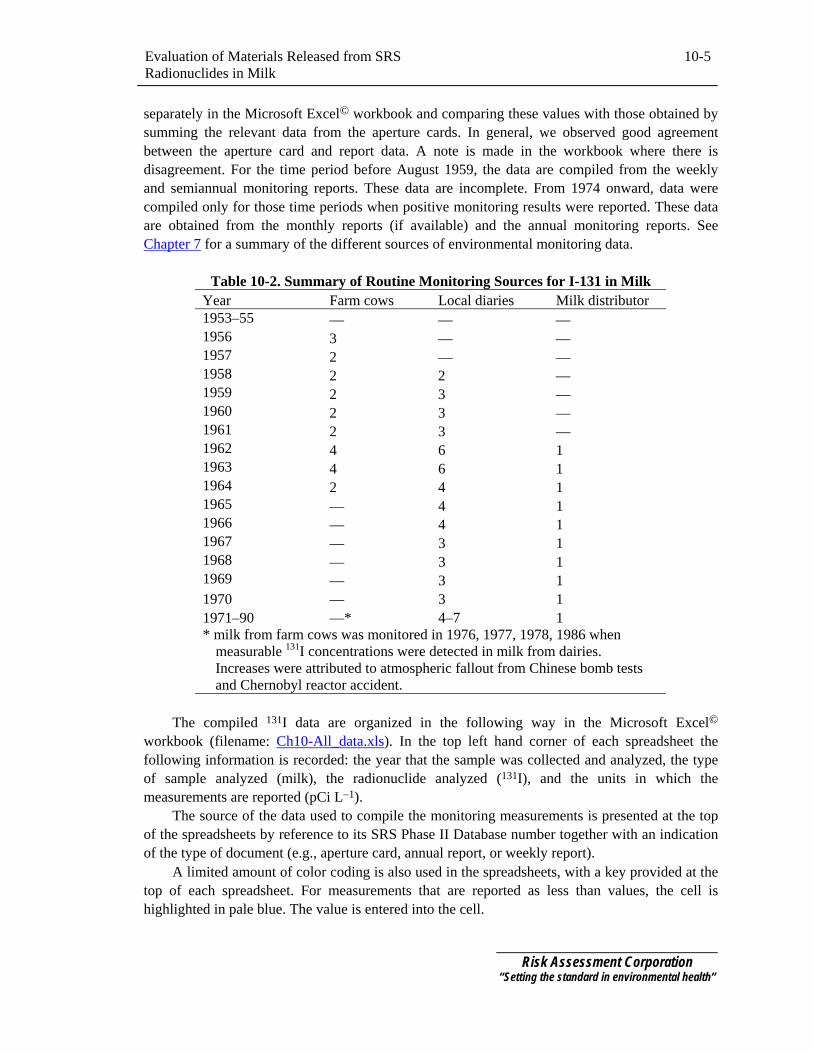
Table 10-2. Summary of Routine Monitoring Sources for I-131 in Milk Year Farm cows Local diaries Milk distributor 1953–55 — — — 1956 3 — — 1957 2 — — 1958 2 2 — 1959 2 3 — 1960 2 3 — 1961 2 3 — 1962 4 6 1 1963 4 6 1 1964 2 4 1 1965 — 4 1 1966 — 4 1 1967 — 3 1 1968 — 3 1 1969 — 3 1 1970 — 3 1 1971–90 —* 4–7 1 * milk from farm cows was monitored in 1976, 1977, 1978, 1986 when
measurable 131I concentrations were detected in milk from dairies. Increases were attributed to atmospheric fallout from Chinese bomb tests and Chernobyl reactor accident.
The compiled 131I data are organized in the following way in the Microsoft Excel©
workbook (filename: Ch10-All_data.xls). In the top left hand corner of each spreadsheet the following information is recorded: the year that the sample was collected and analyzed, the type of sample analyzed (milk), the radionuclide analyzed (131I), and the units in which the measurements are reported (pCi L−1).
The source of the data used to compile the monitoring measurements is presented at the top of the spreadsheets by reference to its SRS Phase II Database number together with an indication of the type of document (e.g., aperture card, annual report, or weekly report).
A limited amount of color coding is also used in the spreadsheets, with a key provided at the top of each spreadsheet. For measurements that are reported as less than values, the cell is highlighted in pale blue. The value is entered into the cell.
Risk Assessment Corporation “Setting the standard in environmental health”
10-6 The Savannah River Site Dose Reconstruction ProjectPhase II: Source Term Calculation and Ingestion Pathway Data Retrieval
A cell is highlighted in yellow if there is a discrepancy between documented sources of the
value. This situation tends to occur when the reported average concentration for a specified time period (month, 6 months) is different than that calculated from the reported individual measurements.
A red dot placed in the upper right hand corner of a spreadsheet cell indicates that a note is attached to that cell. The note contains additional information about that measurement.
The first column of data reports the sample date. The subsequent columns report the measured values by sample location. The sample locations are arranged by sample type (e.g., farm cow, local dairy, or major distributor).
Additional columns or rows are inserted into the spreadsheets to cross-check the reported data if sufficient information is available. For example, the average concentration for a sample type that is reported for a specific time period is compared with the value obtained by summing the relevant data from the aperture cards. Similarly, the average monthly or 6-month concentrations that are calculated from the individual measurements are compared with those reported in the monthly, semiannual, or annual reports.
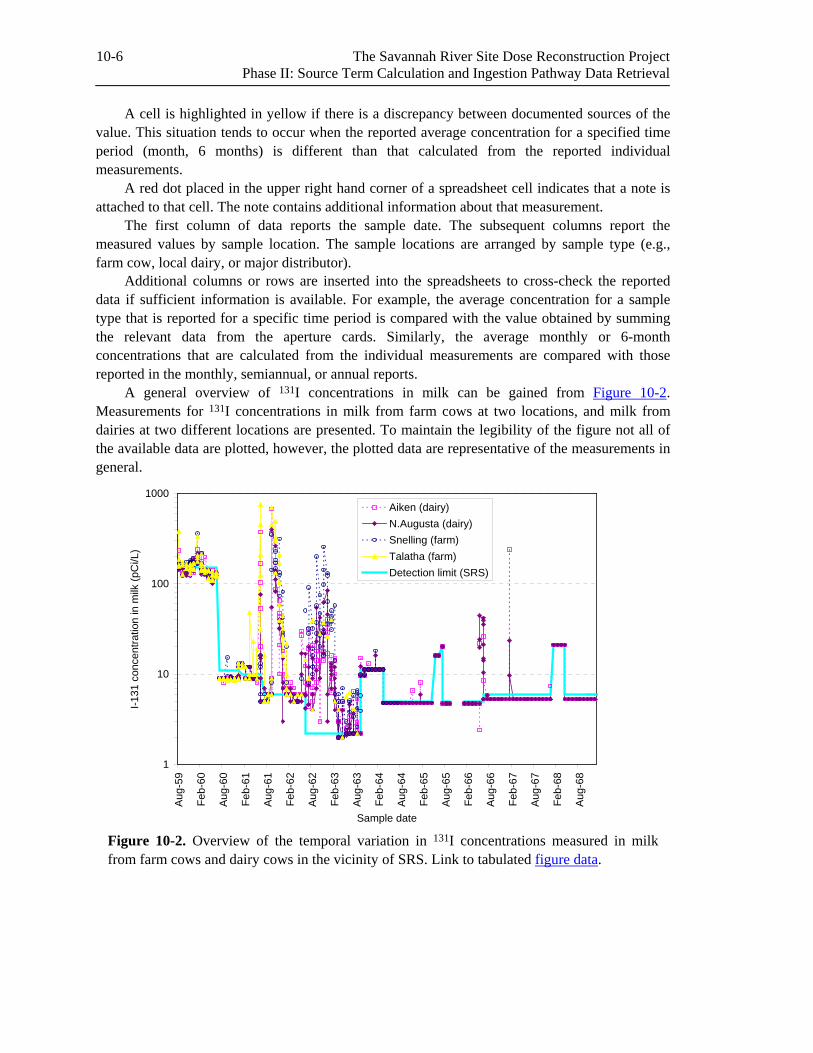
A general overview of 131I concentrations in milk can be gained from Figure 10-2. Measurements for 131I concentrations in milk from farm cows at two locations, and milk from dairies at two different locations are presented. To maintain the legibility of the figure not all of the available data are plotted, however, the plotted data are representative of the measurements in general.
1
10
100
1000
Aug-
59
Feb-
60
Aug-
60
Feb-
61
Aug-
61
Feb-
62
Aug-
62
Feb-
63
Aug-
63
Feb-
64
Aug-
64
Feb-
65
Aug-
65
Feb-
66
Aug-
66
Feb-
67
Aug-
67
Feb-
68
Aug-
68
Sample date
I-131
con
cent
ratio
n in
milk
(pC
i/L)
Figure 10-2. Overview of the temporal variation in 131I concentrations measured in milk from farm cows and dairy cows in the vicinity of SRS. Link to tabulated figure data.
Detection limit (SRS)Talatha (farm)Snelling (farm)N.Augusta (dairy)Aiken (dairy)
Evaluation of Materials Released from SRS Radionuclides in Milk
10-7
Description and History of the Milk Monitoring Program for Radioiodine
According to Kantelo et al. (1993), the SRS began local milk analyses for 131I in 1957. Based on the weekly report dated June 18–22, 1956, (Du Pont 1956a) it appears that SRS was experimenting with methods for analyzing iodine and strontium in the first half of 1956. The earliest recorded measurements of radioiodine concentrations in weekly milk samples are reported in the August 6–10, 1956, weekly report (Du Pont 1956b) for three consecutive weeks commencing July 23, 1956. The milk was collected from three separate locations: Talatha Gate, Snelling, and Allendale. The weekly reports indicate that routine weekly samples of milk were collected from September 17, 1956, onward (Du Pont 1956c). The results are presented as the average and maximum concentration for all sample locations. Consequently, it is not possible to determine the concentration measured at each location. However, in some cases the location with the maximum concentration is noted. Furthermore, the number of locations sampled varied. The absence of reported concentrations from late October to the end of the year suggests they were below the sensitivity of the analysis (200 pCi L−1) rather than not sampled.
In the January through June 1957 semiannual report (Horton and Mealing 1957), no mention is made of milk monitoring, but a detection limit for radioiodine in milk is listed as 120 pCi L−1 (Appendix A; Table A-5). In the subsequent semiannual report (Horton et al. 1958), the detection limit for radioiodine in milk is not listed and there is no mention of milk monitoring. Despite this, the monthly reports do provide results of milk monitoring for radioiodine. Weekly milk samples appear to have been collected routinely from Talatha and Snelling. The results presented in the weekly and monthly reports have been compiled and compared in the Microsoft Excel© workbook. The values given in the monthly reports generally agree with the weekly values. The monthly values for 1957 include the last week of the previous month and do not include the last week of the current month. It is a little more difficult to reconcile the values for the first 6 months of 1957. Gaps in the data may indicate that the measured concentrations were below the sensitivity of the analysis.
It is difficult to accurately reconstruct the measured concentrations of radioiodine in milk for 1958 based on the two sources of available information: weekly and semiannual reports. The monthly reports provide no information on this topic. The weekly reports for 1958 indicate that two routine milk samples were collected weekly from Talatha and Snelling until April when only one sample was collected (from Talatha). This was restored to two weekly samples at the end of May. The first positive analysis for radioiodine was reported on April 21, 1958, (170 pCi L−1) for milk samples from Talatha (Du Pont 1958). This is consistent with the January through June 1958 semiannual report (Harvey et al. 1959a), which states that the maximum concentration observed was 270 pCi L−1 at Snelling on January 20. The semiannual report also states that 55 milk samples were collected during the first 6 months, of which four were positive samples, with an average concentration of 190 pCi L−1. The semiannual report states that the samples were taken from four locations (Talatha, Snelling, Aiken, and N. Augusta) rather than two. The weekly reports indicate that from April 21 onward, milk samples were also collected on weekly for a special study and that generally two or fewer locations were sampled. This suggests that the radioiodine results from Aiken and N. Augusta were included in the monitoring results presented in the semiannual reports. The July through December 1958 semiannual report (Harvey et al. 1959b) states that an additional sample location (Langley) was added to the program after November 10. The report goes on to state that 107 milk samples were analyzed for radioiodine
Risk Assessment Corporation “Setting the standard in environmental health”
10-8 The Savannah River Site Dose Reconstruction ProjectPhase II: Source Term Calculation and Ingestion Pathway Data Retrieval
and that 24 contained detectable concentrations. The average concentration of the 24 samples was 270 pCi L−1, and the maximum concentration of 1100 pCi L−1 was in a sample collected from Talatha on July 21. All detectable concentrations (100 ±6 pCi L−1 detection limit) occurred in samples collected during July 14 to August 18 and October 6 to November 18, periods during and immediately after weapons tests. See Chapter 6 for more details regarding other sources of radionuclide contamination.
Throughout 1959, 1960, and 1961, milk samples were collected weekly from the same five locations (Talatha, Snelling, Aiken, N. Augusta, and Langley). These consisted of three dairies located in Aiken (Holley’s), Langley (Key’s), and North Augusta (Haskell’s) and two farm cows at farms located in Talatha and Snelling. From July 1961 onward, a fourth dairy (Simmond’s) in Pleasant Mount was also sampled routinely.
According to the 1959 and 1960 semiannual reports (Du Pont 1959a, 1960a, 1960b, 1961a), the average concentration of 131I in the milk samples (collected weekly) during 1959 and 1960 was below the reported 6-month average detection limits. The detection limit decreased from 170 to 160 pCi L−1 for the second 6-month period and decreased from 150 to 9 pCi L−1 in July 1960. These summary data agree with the handwritten values reported by location on aperture cards.
Radioiodine was first detected (19 pCi L−1) in a milk sample collected from Talatha, South Carolina, on May 10, 1961. This increase in concentration was attributed to increased releases of 131I from the 292-F stack because processing of shorter cooled uranium had commenced on April 28, 1961 (Du Pont 1961b). This value is not reported in the quarterly or semiannual reports that cover this time period. Instead, these reports indicate that no routine milk sample was collected on the following day, May 11, 1961, from Talatha, South Carolina.
1
10
100
1000
10000
3-Ja
n
26-J
an
16-F
eb
9-M
ar
30-M
ar
20-A
pr
11-M
ay
1-Ju
n
22-J
un
13-J
ul
3-Au
g
24-A
ug
14-S
ep
5-O
ct
26-O
ct
16-N
ov
6-D
ec
28-D
ec
1961
I-131
con
cent
ratio
n in
milk
(pC
i/L)
Talatha (farm)Snelling (farm)Pleasant Mt. (farm)Langley (dairy)Aiken (dairy)N. Augusta (dairy)Detection limit
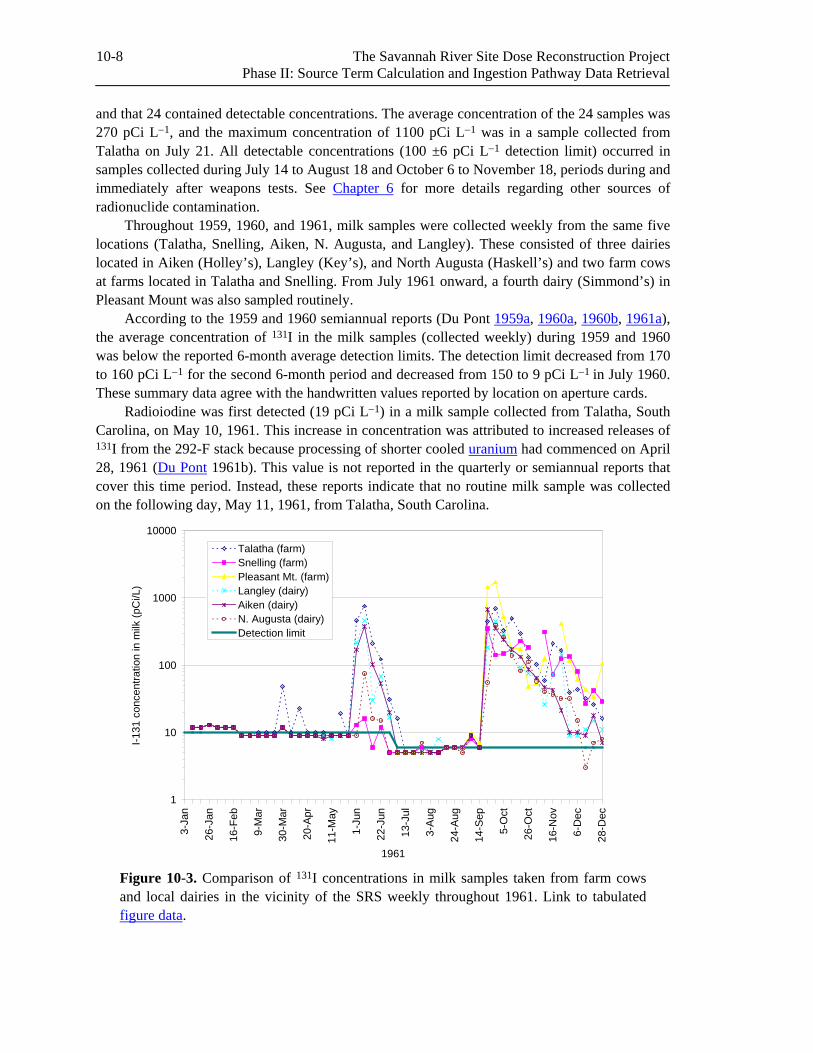
Figure 10-3. Comparison of 131I concentrations in milk samples taken from farm cows and local dairies in the vicinity of the SRS weekly throughout 1961. Link to tabulated figure data.
Evaluation of Materials Released from SRS Radionuclides in Milk
10-9
Figure 10-3 plots 131I concentrations measured in weekly milk samples collected throughout
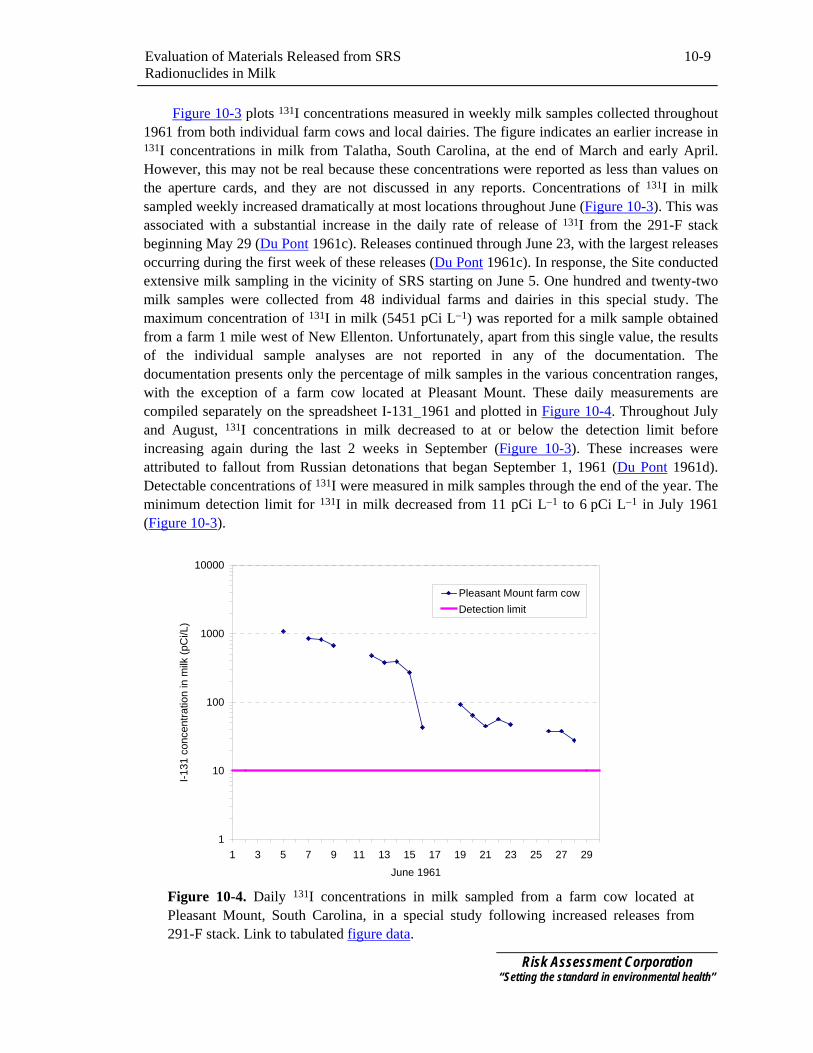
1961 from both individual farm cows and local dairies. The figure indicates an earlier increase in 131I concentrations in milk from Talatha, South Carolina, at the end of March and early April. However, this may not be real because these concentrations were reported as less than values on the aperture cards, and they are not discussed in any reports. Concentrations of 131I in milk sampled weekly increased dramatically at most locations throughout June (Figure 10-3). This was associated with a substantial increase in the daily rate of release of 131I from the 291-F stack beginning May 29 (Du Pont 1961c). Releases continued through June 23, with the largest releases occurring during the first week of these releases (Du Pont 1961c). In response, the Site conducted extensive milk sampling in the vicinity of SRS starting on June 5. One hundred and twenty-two milk samples were collected from 48 individual farms and dairies in this special study. The maximum concentration of 131I in milk (5451 pCi L−1) was reported for a milk sample obtained from a farm 1 mile west of New Ellenton. Unfortunately, apart from this single value, the results of the individual sample analyses are not reported in any of the documentation. The documentation presents only the percentage of milk samples in the various concentration ranges, with the exception of a farm cow located at Pleasant Mount. These daily measurements are compiled separately on the spreadsheet I-131_1961 and plotted in Figure 10-4. Throughout July and August, 131I concentrations in milk decreased to at or below the detection limit before increasing again during the last 2 weeks in September (Figure 10-3). These increases were attributed to fallout from Russian detonations that began September 1, 1961 (Du Pont 1961d). Detectable concentrations of 131I were measured in milk samples through the end of the year. The minimum detection limit for 131I in milk decreased from 11 pCi L−1 to 6 pCi L−1 in July 1961 (Figure 10-3).
1
10
100
1000
10000
1 3 5 7 9 11 13 15 17 19 21 23 25 27 29June 1961
I-131
con
cent
ratio
n in
milk
(pC
i/L)
Pleasant Mount farm cowDetection limit
Figure 10-4. Daily 131I concentrations in milk sampled from a farm cow located at Pleasant Mount, South Carolina, in a special study following increased releases from 291-F stack. Link to tabulated figure data.
Risk Assessment Corporation “Setting the standard in environmental health”
10-10 The Savannah River Site Dose Reconstruction ProjectPhase II: Source Term Calculation and Ingestion Pathway Data Retrieval
Sample collection from the small dairy in Langley, South Carolina, was discontinued in
January 1962. Barnwell and Allendale were added on January 25, 1962 (Du Pont 1962b). Although the frequency of milk sampling for radioiodine was reported as weekly, there were exceptions to this. In January 1962, milk was sampled weekly from three sites with farm cows and monthly from five dairies and one milk distributor. From February through June 1962, the sampling schedule changed somewhat and milk was collected just monthly from the same three sites with farm cows and weekly from the five dairies and one milk distributor. During this time period, sampling of the Sylvania, Georgia, farm cow was discontinued. However, it appears that a replacement farm cow was identified in Waynesboro, Georgia, and sampling began again in July. The detection of 131I in milk samples in May and June 1962 was attributed to fallout from U.S. nuclear tests (Du Pont 1963a).
From July 1962 until late in 1963, of the four locations with farm cows, two were sampled weekly and two monthly. The six dairies and one distributor were all sampled weekly. In late 1963, sampling was discontinued at two farm cow sites (Talatha and Pleasant Mount) and two local dairies (Barnwell and Williston), presumably because previous milk samples consistently contained concentrations below the minimum detection limit at that time (2.2 pCi L−1). Sampling of the two farm cows at Snelling, South Carolina, and Waynesboro, Georgia, continued weekly until August 1964, when sampling at those locations was discontinued. Weekly sampling of the four dairies and one distributor continued throughout 1964. In August 1963, the sample size was reduced from 1 to ½-gal for all locations because fallout radioiodine was no longer detectable in milk (Johnson 1963).
Du Pont (1963b) reports the sampling schedule as of 7/15/63. This report indicates that the weekly milk samples were collected on Thursdays in the first 4 weeks of every month, and that the monthly samples were collected on the Thursday of the second week of every month. These were 1-gal samples with the exception of Borden (distributor), from which a 2-gallon sample was obtained. There is no explanation why the minimum detection limit reported for the analysis of radioiodine in Borden milk samples is 12 pCi L−1 versus 6 pCi L−1 for other samples.
In August 1964, the number of locations where milk samples were collected weekly was reduced to four (Aiken, N. Augusta, Waynesboro, and Allendale) (Johnson 1964). Slight increases in 131I concentrations in milk samples collected between October 29, 1964, and November 11, 1964, were attributed to fallout from a Chinese nuclear weapons test (Du Pont 1965a). The monthly report for December 1964 (Du Pont 1964) states that 350 mCi of radioiodine was released from two sources in the Savannah River Laboratory during the period December 7–21, but that milk samples from Jackson and Talatha contained no measurable 131I.
Milk from four dairies (Aiken, N. Augusta, Waynesboro, and Allendale) was sampled weekly during 1965. The 131I concentration was reported to be less than the sensitivity of the analysis (5 pCi L−1) throughout the entire year (Du Pont 1965b, 1966a).
During the first quarter of 1966, (Du Pont 1966b) no radioiodine was detected in milk samples despite reported iodine releases from F-Area during January and February (associated with iodine suppression tests). Again, the sensitivity of the analysis was reported as 5 pCi L−1.
In 1966, it was proposed that the sampling frequency should be reduced to biweekly. This was recommended because an 8-month test had shown that the air pumps for the air samples in 614 Buildings could be operated on a 2-week cycle without excessive wear or maintenance problems (Marter and Johnson 1966). It was noted that a longer sampling period was a
Evaluation of Materials Released from SRS Radionuclides in Milk
10-11
disadvantage for monitoring low-level releases of 131I from the plant because of its short half-life. However, it was considered likely that the stack air monitors would alert the Site to any unusual iodine releases that would require shortened sampling periods (Marter and Johnson 1966). The milk monitoring results summarized on the aperture cards indicate that biweekly sampling started in April, but that more frequent sampling of the small dairy in North Augusta did occur in June following a Chinese nuclear bomb test.
The routine milk monitoring results reported in the semiannual report for the first 6 months of 1966 (Du Pont 1966c) do not agree exactly with the information recorded on the aperture cards (Du Pont 1966d). The aperture card for 1966 shows that more frequent sampling of the small dairy in N. Augusta was conducted in late May and June. The analyses that fell outside the normal sampling schedule were not included in the calculation of the 6-month average value. Consequently, an average 131I concentration of 6 pCi L−1 is reported rather than 12 pCi L−1. There is also a small discrepancy in the 6-month average value reported for the dairy in Allendale. The semiannual report gives an average 131I concentration of 11 pCi L−1 compared to the value of 8 pCi L−1 that is calculated from the aperture card data. No explanation for this can be found. The August 1966 environmental monitoring monthly report (Du Pont 1966e) states that milk samples collected from a family cow in Snelling on August 24 and 26 contained 12 pCi L−1 and 25 pCi L−1, respectively, of 131I. The samples were collected following an increased release of 131I that resulted from routine processing of short-cooled material. The monthly report states that increased concentrations of 131I were not detected in any of the routine dairy milk samples. This corresponds to the results shown on the aperture card and reported in the semiannual report.
Sampling at the Allendale dairy was discontinued in 1967. The remaining three dairies (N. Augusta, Aiken, and Waynesboro) and a major milk distributor of locally produced milk (Augusta/Borden) were sampled biweekly. The semiannual and annual reports give lower average values for the first 6 months than those that are calculated from the aperture cards. The discrepancy arises in January where the average January values recorded on the aperture cards cannot be reproduced based on the reported weekly measurements. The reported weekly measurements yield a January average for each sample location that is up to a factor of 2 larger than the January average that is written on and calculated from data on the aperture card. Also in March, a small increase (22 pCi L−1) in 131I concentrations in milk samples (with maximum concentration on March 6) from farm cows at Snelling, South Carolina, and Waynesboro, Georgia, was noted in the 1967 environmental monitoring annual report (Ashley 1968) in the section entitled “Radioactive Waste Releases: Separations Areas.” This was associated with special tests in March. The farm cows were no longer part of the routine monitoring program that sampled small dairies. The April 1968 monthly report prepared by the Environmental Monitoring Group (Du Pont 1968) also notes increased concentrations of 131I in composite thyroid samples of white tailed deer collected on the SRS during 1967. The maximum concentration was found in deer collected March 8 (see Chapter 11 for more details concerning radionuclide concentrations in deer and other wild game).
From 1968 onward, milk monitoring results ceased to be reported as a separate section in the annual environmental reports. The monitoring results for 131I (tritium and 90Sr) are tabulated in Appendix A, Table 5, of the 1968 annual environmental monitoring report (Ashley 1969). The semiannual reports continued to devote a section to milk monitoring results. Throughout the year, the concentration of 131I in milk was less than the minimum detection limit (2.2 pCi L−1).
Risk Assessment Corporation “Setting the standard in environmental health”

10-12 The Savannah River Site Dose Reconstruction ProjectPhase II: Source Term Calculation and Ingestion Pathway Data Retrieval
The concentration of 131I in milk continued to be less than the minimum detection limit
throughout 1970 and 1971. During April and the first week of May 1972, low concentrations of 131I (≤25 pCi L−1) were detected in milk at all four dairy sample locations (N. Augusta, Aiken, Waynesboro, and Barnwell) and the milk distributor (Borden) in Augusta. This increase was attributed to fallout from atmospheric weapons testing as a second peak of activity in air, possibly after travel around the earth (Ashley and Zeigler 1973). No mention is made of positive measurements of 131I in milk during January and March. According to the aperture cards, low concentrations of 131I (≤5 pCi L−1) were measured in milk from dairies in N. Augusta, Aiken, and Waynesboro during the first week of September and at Barnwell during the third week of September (biweekly sampling). These measurements are not discussed in the annual reports or the monthly reports.
Milk samples from small local dairies (anywhere between four and seven) and one major distributor continued to be analyzed for 131I up through 1990 (more recent annual environmental monitoring reports have not been examined). The concentration of 131I in milk was below the sensitivity of the analysis at all times with the exception of three time periods in 1976, 1977, and 1978 when 131I was detected in the milk samples. At these times, farm cows were also sampled in addition to the routine monitoring of the milk from small diaries. The increases were attributed to atmospheric fallout from Chinese bomb tests. A single milk sample from Gracewood, Georgia, (near Augusta, Georgia) in May 1986 also contained a measurable concentration of 131I (11 pCi L−1). This was attributed to fallout following the Chernobyl nuclear accident.
Strontium
A general overview of the time period and frequency that the SRS has sampled milk on a routine basis for 90Sr is presented in Table 10-1. The SRS environmental monitoring program results for 90Sr analyzes of milk samples are compiled as two spreadsheets in the same Microsoft Excel© workbook that contains the 131I measurements (filename: Ch10-All_data.xls). One spreadsheet covers the data for 1960 through 1961 and is labeled Sr-90_60-61. The other spreadsheet covers the data for 1962 through 1973 and is labeled Sr-90_62-73. These data are taken from handwritten compilations of effluent and environmental monitoring results on ledger sheets (the aperture cards) and from the various environmental monitoring reports the Site produced. The aperture card data are available from July 1962 through December 1973. For the time period from March 1960 up to July 1962, the data are compiled from the weekly and biweekly monitoring reports and cross-checked with the semiannual reports.
From 1974 through 1990, the 90Sr (also 137Cs and tritium) concentrations measured in milk are reported in the annual reports as the minimum and maximum annual concentrations by location. The annual average concentration was also reported for the earlier years in this time period. It is not possible to discern the actual concentration measured each quarter at a specific location. For this reason, these data have not been compiled in the Microsoft Excel© workbook.
The general format and layout of the spreadsheets is similar to that used for the 131I data. However, there are fewer measurements because milk samples for 90Sr were taken quarterly rather than weekly.
In the top left hand corner of each spreadsheet the following information is recorded: the years that the samples were collected and analyzed, the type of sample analyzed (milk), the radionuclide analyzed (90Sr), and the units in which the measurements are reported (pCi L−1).
Evaluation of Materials Released from SRS Radionuclides in Milk
10-13
The source of the data used to compile the monitoring measurements is presented at the top
of the spreadsheets by reference to its SRS Phase II Database number together with an indication of the type of document (e.g., aperture card, annual report, or weekly report).
A red dot placed in the upper right hand corner of a spreadsheet cell indicates that a note is attached to that cell. The note contains additional information about that measurement or time period.
The first column of data reports the sample date. The subsequent columns report the measured values by sample location. The sample locations are arranged by sample type (e.g., farm cow, local dairy, or major distributor).
Additional columns or rows are inserted into the spreadsheets to cross-check the reported data if sufficient information is available. For example, the average concentration for a sample type that is reported for a specific time period is compared with the value obtained by summing the relevant data from the aperture cards. Similarly, the average monthly or 6-month concentrations that are calculated from the individual measurements are compared with those reported in the monthly, semiannual, or annual reports.
Description and History of the Milk Monitoring Program for Radiostrontium
Sampling of milk for 90Sr began during the fall of 1958 (Du Pont 1959b) (Table 10-1). Samples were taken from three small farms (family-owned cows) and from two small dairies in the vicinity of the SRS; however, the sample locations are not identified in any of the reports. Although it may be assumed that these are the same five locations that were used for 131I sampling, there is no way to correlate each sample to a specific location. A sample was also taken from a small farm 100 mile from SRS. The July through December 1959 environmental monitoring semiannual report (Du Pont 1960a) only reports the monthly average concentrations of 90Sr for all the milk samples. Values provided for January, April, June, July, and December varied between 14.3 pCi L−1 and 23.3 pCi L−1.
From March 1960 onward, the concentration of 90Sr in milk was reported quarterly by location in the weekly (later biweekly) environmental monitoring reports. The measured 90Sr concentration in milk was reported by location and can be cross-checked with the summary data presented in the semiannual reports. Milk was sampled quarterly on a routine basis from three farm cows (located in Talatha, South Carolina, Snelling, South Carolina, and Sylvania, Georgia). The 90Sr content of milk from the farm in Snelling, South Carolina, increased significantly in May 1961 and remained higher than normal through August 1961 (Du Pont 1961e). Extensive sampling of soil and vegetation on pastureland where the cow grazed indicated an accumulation of fallout 90Sr in low lying “sinks” because of drainage and/or windbreaks caused by hedgerows surrounding the grazing area (Du Pont 1961e). The sampling location of Pleasant Mount, South Carolina (farm cow) was added in September 1961. Interestingly, milk from this cow assayed highest in both 90Sr and 137Cs. The farm was located approximately 2 mile southeast of the Snelling, South Carolina, farm, which was located 1.5 mile east of the SRS perimeter.
Six local diaries (Waynesboro, N. Augusta, Langley, New Ellenton, Williston, and Sylvania) were also sampled quarterly on a routine basis. Sampling at New Ellenton ceased after March 1961, but Aiken was included in the program in March 1961.
In the previous year, farm cows at Cope, South Carolina, and Aiken, South Carolina, were sampled in a special study from June through December 1960. The study was carried out to
Risk Assessment Corporation “Setting the standard in environmental health”
10-14 The Savannah River Site Dose Reconstruction ProjectPhase II: Source Term Calculation and Ingestion Pathway Data Retrieval
explain the higher 90Sr concentrations found in milk from single-cow farms compared with milk from large dairies (see Figure 10-6). Morning and evening milk samples and samples of the diet were analyzed for various factors including calcium content.
Throughout 1962 and 1963, milk from six farm cow locations (Talatha, Snelling, Pleasant Mt., Sylvania, and two in Waynesboro) was analyzed for 90Sr. The frequency of 90Sr determinations in milk was increased from quarterly to monthly in 1962 (Du Pont 1962a). The purpose of the accelerated analysis schedule was to determine when and to what extent 90Sr from recent atmospheric nuclear tests would appear in local milk.
The 90Sr data are not reported by location on the aperture cards after March 1963; only average concentrations are reported for farm milk, dairy milk, and distributor milk. Fortunately, June 1963 site-specific data were reported in the September 1963 monthly report (Du Pont 1963c). However, site-specific data for the rest of the year are not reported anywhere. Du Pont (1963b) reports the sampling schedule as of 7/15/63 and indicates that quarterly samples were collected on the Thursday of the second week of March, June, September, and December. The quarterly samples were ½-gal in size.
From 1964 onward, only two farm cows were sampled quarterly on a routine basis, at Snelling and at Waynesboro (McLeroy). Sampling of Waynesboro was discontinued after June 1967, and sampling at Snelling was discontinued after December 1969.
Milk from six dairies (Aiken, N. Augusta, Williston, Waynesboro, Allendale, and Barnwell) was sampled for 90Sr from 1962 onward. The dairies at Barnwell and Aiken were added to the routine sampling schedule on January 25, 1962. Sampling was discontinued at Williston and Barnwell after August 1963 and at Allendale after August 1966. From March 1973 through 1976, only two dairies were sampled routinely (quarterly) (N. Augusta [Keys] and Waynesboro [Boyce]). In 1977, a third dairy in Denmark, South Carolina, was also sampled. Three dairies were sampled in 1978 through 1980, but the sample locations changed. The number of dairies sampled increased after 1980; the exact number fluctuated from year to year. For example, six dairies were sampled from 1981 through 1984, seven in 1986 (two of the dairies ceased operations early during 1986, effectively leaving only five dairies from which to sample), and five in 1987 through 1990.
Milk from three major distributors that was produced in the local milkshed was sampled routinely from 1960 through 1973. From March 1973 through 1990, milk from just one major distributor (Borden) continued to be sampled quarterly and analyzed for 90Sr.
USEFULNESS AND LIMITATIONS OF THE MILK DATA FOR DOSE
RECONSTRUCTION
Factors that determine how useful the milk monitoring data may be for reconstructing historical releases from the SRS include the
• Ability to reconstruct the historical measurements at individual locations • Availability of sufficient datasets to allow spatial and/or temporal trends in the data to
be identified • Ability to differentiate between Site releases of contaminants and other sources of the
same contaminants in the environment. The following sections discuss these factors and also address some other issues that may
limit the usefulness of the data.
Evaluation of Materials Released from SRS Radionuclides in Milk
10-15
Availability of Original Monitoring Measurements
One of the problems with the milk monitoring data that are reported in the quarterly, semiannual, and annual reports is that results are often averaged over large spatial areas or over more than one sample period for a given location. For example, for the late 1950s and much of the 1960s, the 131I and 90Sr results for a given sample date are combined and reported as an average value; the maximum value is also reported. This applies to the analyses for farm cow milk, dairy milk, and large distributors’ milk. Similarly, from 1974 onward, even though the 131I and 90Sr concentrations are reported by location, they are reported annually, normally as the maximum and minimum concentration measured throughout the year. The annual average is also reported occasionally. Based on these data, it is difficult to infer a great deal about releases from the Site. Spatial and temporal trends cannot be assessed without knowing individual results. Fortunately, the compilations of data on the aperture cards are reported for each sampling location. Summing these data by sample type (e.g., single cow or dairy) and comparing the results with the data presented in the Site reports represents a type of data verification. Also, for the very early time periods before the aperture card data are available, the weekly and monthly reports generally contain sufficient detail to reconstruct the measured concentrations. The individual datasets that have been compiled electronically for the separate milk sampling locations may allow meaningful conclusions to be reached about releases of iodine and strontium from the SRS.
The aperture cards provide data through 1973. For the time period after 1973, a mechanism to determine the concentrations measured in milk at each sample time has not been established. This is not of concern for 131I data because the measured concentrations were invariably below the sensitivity of the analysis. For those rare occasions when a detectable concentration was measured, individual results are reported. This is not the case for 90Sr, which was consistently detected in all milk samples throughout the entire time period but only reported annually. The 90Sr concentrations measured in milk were invariably attributed to worldwide fallout from weapons tests.
Availability of Spatial and Temporal Datasets
Although the number and location of milk sampling stations has fluctuated considerably over the history of the SRS operations, a comprehensive dataset of 131I and 90Sr measurements in milk has been compiled. In the early days, most of the milk samples were from single milk cows on small farms. However, these farms gradually disappeared with time, and the number of samples from small dairies increased (Table 10-2). The milk sampling stations were located in most directions around the SRS and provide reasonable spatial coverage (Figure 10-1). This may help to distinguish between increases in contaminant concentrations because of fallout from atmospheric weapons testing and releases from the SRS. The following section discusses this point further.
For the 131I measurements in milk, the sensitivity of the analyses has allowed measurable concentrations to be detected in milk samples from the late 1950s through the mid-1960s. The most significant increase in sensitivity occurred in June 1960 with the introduction of an ion exchange-gamma spectrometric technique (Figure 10-2). This technique, which replaced a radiochemical separations technique that used a Geiger-Mueller counter to count the sample,
Risk Assessment Corporation “Setting the standard in environmental health”
10-16 The Savannah River Site Dose Reconstruction ProjectPhase II: Source Term Calculation and Ingestion Pathway Data Retrieval
reduced the minimum detection limit by over an order of magnitude (~10 pCi L−1 versus ~160 pCi L−1). For further details see Appendix A. Beginning in 1966, the concentration of 131I measured in milk samples was usually below the sensitivity of the analyses. Milk samples were generally sampled weekly through 1966, after which the frequency decreased to every 2 weeks. Decreasing the frequency of sampling increased the likelihood that releases of 131I would go undetected because of the short half-life of 131I.
Concentrations of 90Sr have been measured in milk samples from around the SRS throughout the entire monitoring program for 90Sr (1959–1990) (Table 10-1). However, the milk was sampled just four times a year at each location, with the exception of 1962, when monthly samples were analyzed.
Other Sources of Contamination
The SRS was not the only potential source of 131I and 90Sr in the environment. Fallout from atmospheric weapons testing was a source of radionuclides in the environment and, hence, in milk samples. Fallout concentrations of these radionuclides were greatest in the early 1960s. The concentrations in fallout decreased significantly from 1963 onward following the bomb testing moratorium.
The PHS started a milk monitoring program in 1957. Milk was sampled from locations throughout the U.S. The three monitoring locations closest to the SRS were Atlanta, Georgia, Charleston, South Carolina, and Charlotte, North Carolina. The milk monitoring results for all three locations have been compiled electronically in a Microsoft Excel© workbook (filename: Ch10-All_data.xls). These data are located in the sheets labeled PHS and Raw. The data are compiled from the series of reports titled Radiological Health Data that the PHS produced from 1960 through 1970. From 1971, these reports were produced by the U.S. Environmental Protection Agency and were titled Radiological Health Data and Reports in 1971, Radiation Data and Reports from 1972 through 1975, and Environmental Radiation Data from 1975 through 1994. The results are compiled for the following radionuclides: 137Cs, 140Ba, 131I, 89Sr-89, and 90Sr. The mean monthly concentration of each radionuclide is reported in picocuries per liter, together with the counting error and number of samples if such data were available. If no entry was made for the number of samples collected, then a single sample was collected for that month; the exact dates of collection are not included (they were reported beginning in 1979). In some cases, more than one sample was collected in a given month. Beginning in 1979, the dates of collection are included in those instances. Dates of collection are also included for samples collected in response to Chinese weapons testing on September 26 and November 11, 1976, September 17, 1977, and March 14, 1978, and in response to the accident in Chernobyl on April 26, 1981. Before July 1974, a zero entry or no entry at all for a given radionuclide indicates that the measurement was below the minimum detectable concentration (MDC) or practical reporting level. This was quite common for 140Ba, 131I, and 89Sr. Since July 1994, we included everything reported in the spreadsheet. The spreadsheet also indicates no analysis (na), no sampled collected (ns), not reported (nr), and not detected (nd).
From 1957 through June 1961, raw milk samples were analyzed. From 1960 through 1993, pasteurized milk was analyzed; thus, there was a brief period when both milk types were analyzed.
Evaluation of Materials Released from SRS Radionuclides in Milk
10-17
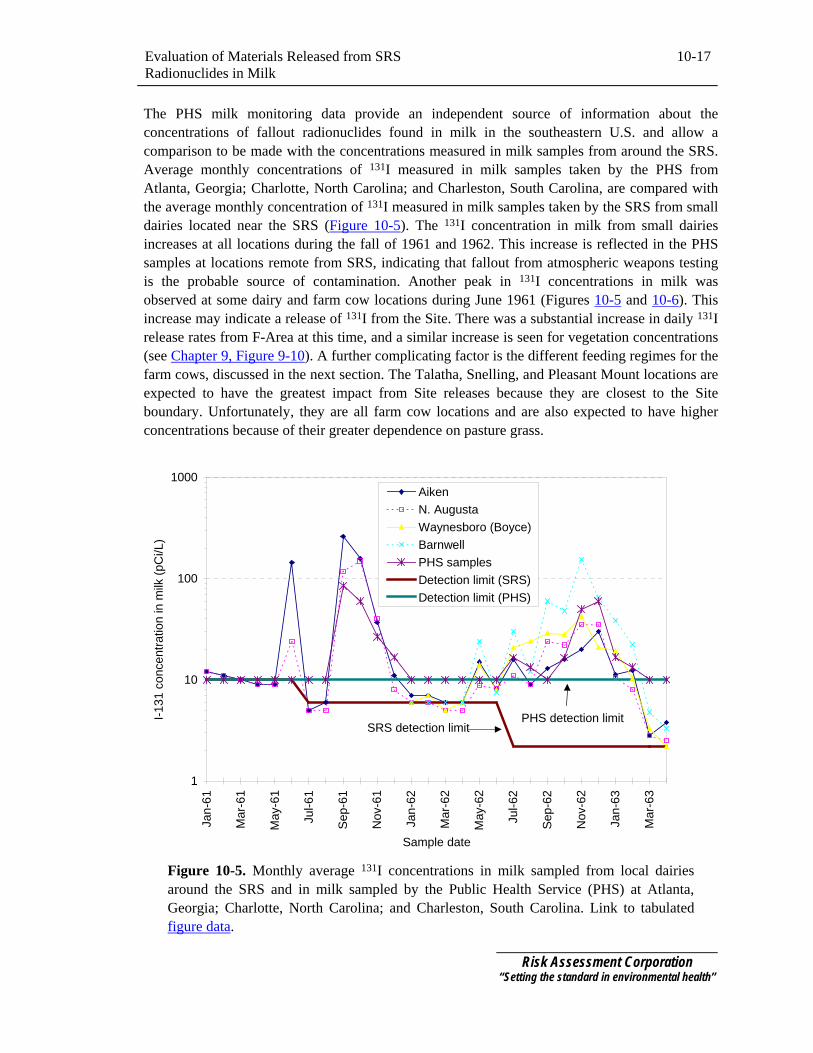
The PHS milk monitoring data provide an independent source of information about the concentrations of fallout radionuclides found in milk in the southeastern U.S. and allow a comparison to be made with the concentrations measured in milk samples from around the SRS. Average monthly concentrations of 131I measured in milk samples taken by the PHS from Atlanta, Georgia; Charlotte, North Carolina; and Charleston, South Carolina, are compared with the average monthly concentration of 131I measured in milk samples taken by the SRS from small dairies located near the SRS (Figure 10-5). The 131I concentration in milk from small dairies increases at all locations during the fall of 1961 and 1962. This increase is reflected in the PHS samples at locations remote from SRS, indicating that fallout from atmospheric weapons testing is the probable source of contamination. Another peak in 131I concentrations in milk was observed at some dairy and farm cow locations during June 1961 (Figures 10-5 and 10-6). This increase may indicate a release of 131I from the Site. There was a substantial increase in daily 131I release rates from F-Area at this time, and a similar increase is seen for vegetation concentrations (see Chapter 9, Figure 9-10). A further complicating factor is the different feeding regimes for the farm cows, discussed in the next section. The Talatha, Snelling, and Pleasant Mount locations are expected to have the greatest impact from Site releases because they are closest to the Site boundary. Unfortunately, they are all farm cow locations and are also expected to have higher concentrations because of their greater dependence on pasture grass.
1
10
100
1000
Jan-
61
Mar
-61
May
-61
Jul-6
1
Sep-
61
Nov
-61
Jan-
62
Mar
-62
May
-62
Jul-6
2
Sep-
62
Nov
-62
Jan-
63
Mar
-63
Sample date
I-131
con
cent
ratio
n in
milk
(pC
i/L)
AikenN. AugustaWaynesboro (Boyce)BarnwellPHS samplesDetection limit (SRS)Detection limit (PHS)
SRS detection limitPHS detection limit
Figure 10-5. Monthly average 131I concentrations in milk sampled from local dairies around the SRS and in milk sampled by the Public Health Service (PHS) at Atlanta, Georgia; Charlotte, North Carolina; and Charleston, South Carolina. Link to tabulated figure data.
Risk Assessment Corporation “Setting the standard in environmental health”
10-18 The Savannah River Site Dose Reconstruction ProjectPhase II: Source Term Calculation and Ingestion Pathway Data Retrieval
1
10
100
1000
Jan-
61
Mar
-61
May
-61
Jul-6
1
Sep-
61
Nov
-61
Jan-
62
Mar
-62
May
-62
Jul-6
2
Sep-
62
Nov
-62
Jan-
63
Mar
-63
Sample date
I-131
con
cent
ratio
n in
milk
(pC
i/L)
TalathaSnellingPleasant Mt.PHS averageDetection limit (SRS)
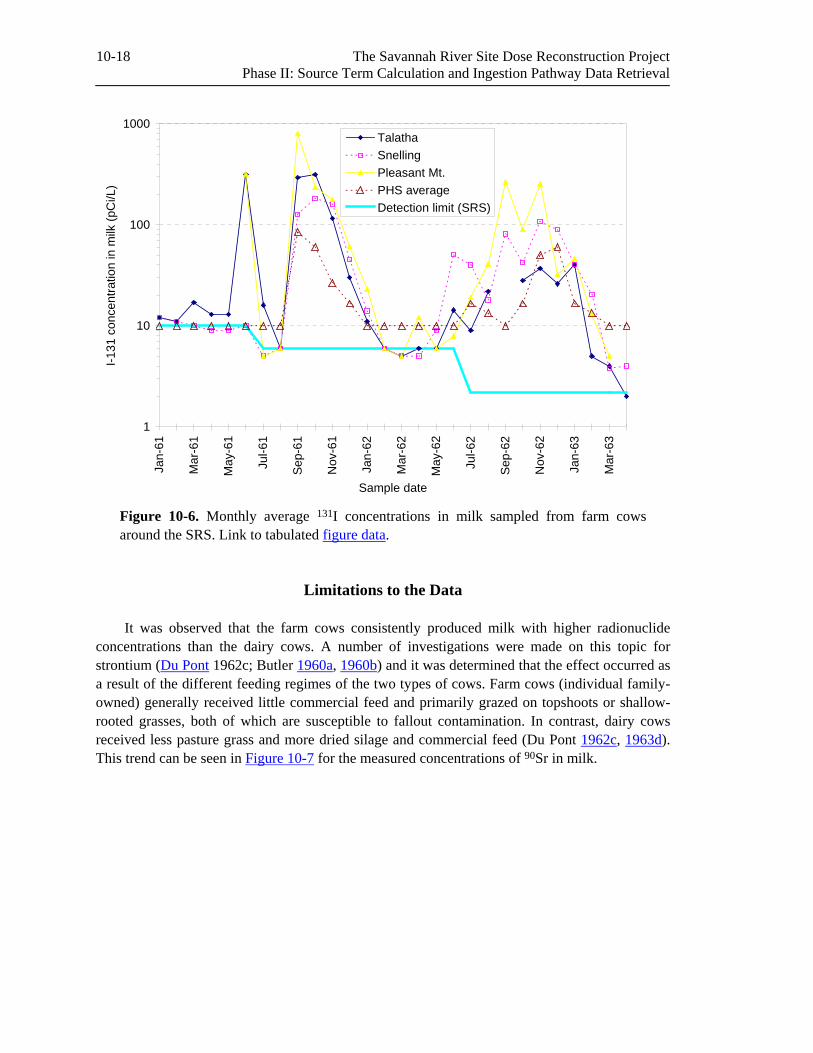
Figure 10-6. Monthly average 131I concentrations in milk sampled from farm cows around the SRS. Link to tabulated figure data.
Limitations to the Data
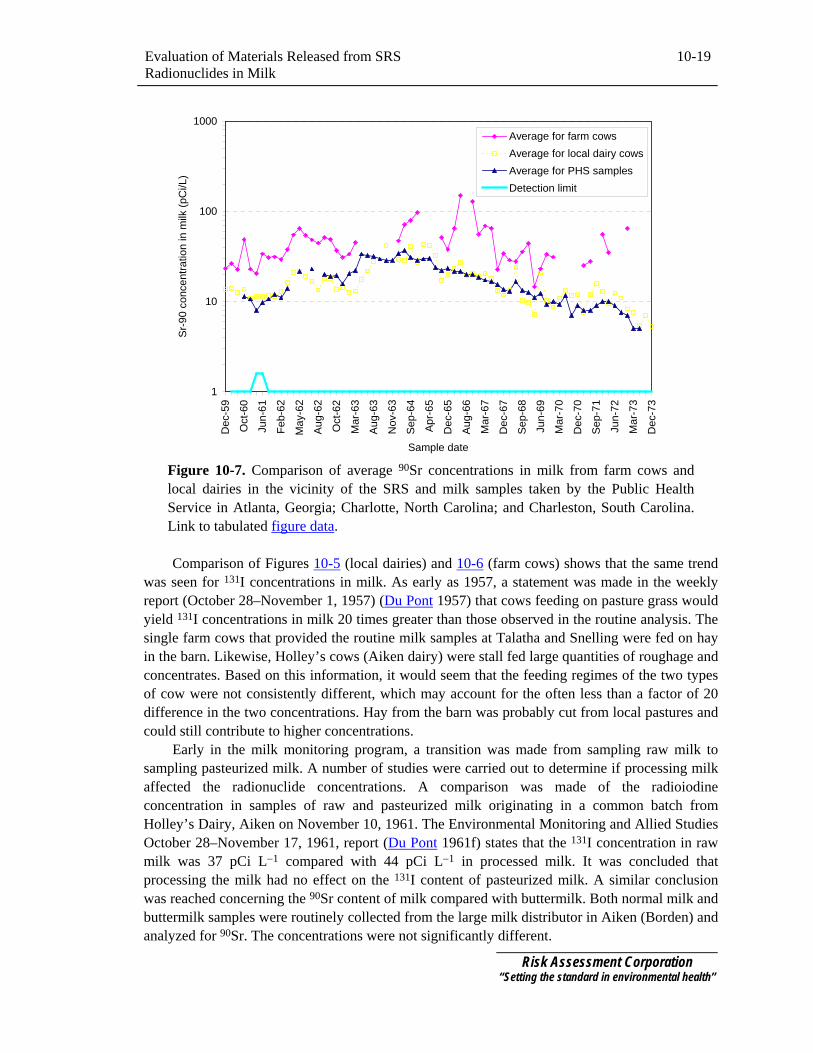
It was observed that the farm cows consistently produced milk with higher radionuclide concentrations than the dairy cows. A number of investigations were made on this topic for strontium (Du Pont 1962c; Butler 1960a, 1960b) and it was determined that the effect occurred as a result of the different feeding regimes of the two types of cows. Farm cows (individual family-owned) generally received little commercial feed and primarily grazed on topshoots or shallow-rooted grasses, both of which are susceptible to fallout contamination. In contrast, dairy cows received less pasture grass and more dried silage and commercial feed (Du Pont 1962c, 1963d). This trend can be seen in Figure 10-7 for the measured concentrations of 90Sr in milk.
Evaluation of Materials Released from SRS Radionuclides in Milk
10-19
1
10
100
1000
Dec
-59
Oct
-60
Jun-
61
Feb-
62
May
-62
Aug-
62
Oct
-62
Mar
-63
Aug-
63
Nov
-63
Sep-
64
Apr-6
5
Dec
-65
Aug-
66
Mar
-67
Dec
-67
Sep-
68
Jun-
69
Mar
-70
Dec
-70
Sep-
71
Jun-
72
Mar
-73
Dec
-73
Sample date
Sr-9
0 co
ncen
tratio
n in
milk
(pC
i/L)
Average for farm cowsAverage for local dairy cowsAverage for PHS samples Detection limit
Figure 10-7. Comparison of average 90Sr concentrations in milk from farm cows and local dairies in the vicinity of the SRS and milk samples taken by the Public Health Service in Atlanta, Georgia; Charlotte, North Carolina; and Charleston, South Carolina. Link to tabulated figure data.
Comparison of Figures 10-5 (local dairies) and 10-6 (farm cows) shows that the same trend
was seen for 131I concentrations in milk. As early as 1957, a statement was made in the weekly report (October 28–November 1, 1957) (Du Pont 1957) that cows feeding on pasture grass would yield 131I concentrations in milk 20 times greater than those observed in the routine analysis. The single farm cows that provided the routine milk samples at Talatha and Snelling were fed on hay in the barn. Likewise, Holley’s cows (Aiken dairy) were stall fed large quantities of roughage and concentrates. Based on this information, it would seem that the feeding regimes of the two types of cow were not consistently different, which may account for the often less than a factor of 20 difference in the two concentrations. Hay from the barn was probably cut from local pastures and could still contribute to higher concentrations.
Early in the milk monitoring program, a transition was made from sampling raw milk to sampling pasteurized milk. A number of studies were carried out to determine if processing milk affected the radionuclide concentrations. A comparison was made of the radioiodine concentration in samples of raw and pasteurized milk originating in a common batch from Holley’s Dairy, Aiken on November 10, 1961. The Environmental Monitoring and Allied Studies October 28–November 17, 1961, report (Du Pont 1961f) states that the 131I concentration in raw milk was 37 pCi L−1 compared with 44 pCi L−1 in processed milk. It was concluded that processing the milk had no effect on the 131I content of pasteurized milk. A similar conclusion was reached concerning the 90Sr content of milk compared with buttermilk. Both normal milk and buttermilk samples were routinely collected from the large milk distributor in Aiken (Borden) and analyzed for 90Sr. The concentrations were not significantly different.
Risk Assessment Corporation “Setting the standard in environmental health”
10-20 The Savannah River Site Dose Reconstruction ProjectPhase II: Source Term Calculation and Ingestion Pathway Data Retrieval
REFERENCES
Ashley, C. 1968. Environmental Monitoring at the Savannah River Plant. Annual Report-1967.
DPST-68-302. SRS Phase II Database MJC1994051712. June.
Ashley, C. 1969. Environmental Monitoring at the Savannah River Plant, Annual Report–1968. DPST-69-302. SRS Phase II Database MJC1994051713. June.
Ashley, C. and C.C. Zeigler. 1973. Environmental Monitoring at the Savannah River Plant. Annual Report-1972. DPSPU-73-302. SRS Phase II Database MJC1994051716. August.
Butler, F.E. 1960a. Memo to A.R. Boulogne. Subject: Offsite milk monitoring and analysis. SRS Phase II Database HAG1994083191. January 18.
Butler, F.E. 1960b. Memo to A.R. Boulogne. Subject: Special milk sampling program. SRS Phase II Database HAG1994083192. May 31.
Du Pont. 1956a. Control Weekly Report. June 18–22, 1956. Savannah River Laboratory. SRS Phase II Database MJC1993051812.
Du Pont. 1956b. Control Weekly Report. August 6–10, 1956. Savannah River Laboratory. SRS Phase II Database MJC1993051812.
Du Pont. 1956c. Control Weekly Report. September 17–21, 1956. Savannah River Laboratory. SRS Phase II Database MJC1993051812.
Du Pont. 1957. Control Weekly Report. October 28–November 1, 1957. Savannah River Laboratory. SRS Phase II Database MJC1993051813.
Du Pont. 1958. Control Weekly Report. April 21–25, 1958. Savannah River Laboratory. SRS Phase II Database MJC1993051814.
Du Pont. 1959a. Health Physics Regional Monitoring Semiannual Report, January through June 1959. DPSPU-59-11-30. SRS Phase II Database MJC1993121014. November.
Du Pont. 1959b. Environmental Monitoring Monthly Report, August. Radiological Control and Methods. SRS Phase II Database HG1996012232.
Du Pont. 1960a. Health Physics Regional Monitoring Semiannual Report, July through December 1959. DPSP-60-11-9. SRS Phase II Database MJC1993121015. June.
Du Pont. 1960b. Health Physics Regional Monitoring Semiannual Report, January through June 1960. DPSP-60-25-26. SRS Phase II Database MJC1993121016. October.
Evaluation of Materials Released from SRS Radionuclides in Milk
10-21
Du Pont. 1961a. Health Physics Regional Monitoring Semiannual Report, July through
December 1960. DPSP-61-25-4. SRS Phase II Database MJC1993121017. October.
Du Pont. 1961b. Environmental Monitoring Monthly Report, May. SRS Phase II Database HG1996012253.
Du Pont. 1961c. Environmental Monitoring Monthly Report, June. SRS Phase II Database HG1996012254.
Du Pont. 1961d. Environmental Monitoring Monthly Report, September. SRS Phase II Database HG1996012257.
Du Pont. 1961e. Environmental Monitoring and Allied Studies Report. September 1–15, 1961. Savannah River Laboratory. SRS Phase II Database MJC1993051816.
Du Pont. 1961f. Environmental Monitoring and Allied Studies Report. October 28–November 17, 1961. SRS Phase II Database MJC1993051816.
Du Pont. 1962a. Effect of the Savannah River Plant on Environmental Radioactivity Semiannual Report, January through June 1962. DPSPU-62-30-24. SRS Phase II Database MJC1993121315. July.
Du Pont. 1962b. Environmental Monitoring and Allied Studies Report. February 24–March 9, 1962. Savannah River Laboratory. SRS Phase II Database MJC1993051816.
Du Pont. 1962c. Untitled report that compares 90Sr concentration in milk collected from farm cows and dairies. SRS Phase II Database HAG1994083193. December 6.
Du Pont. 1963a. Health Physics Environmental Monitoring Semiannual Report, January through June 1962. DPSP-63-25-3. SRS Phase II Database BS 1994071268. February.
Du Pont. 1963b. Copy of daily environmental sample collection schedule, including sample frequency, sample type, number of samples, sample designation. SRS Phase II Database HAG1994083176. July 15.
Du Pont. 1963c. Environmental Monitoring Monthly Report, September. Radiological Control and Methods. SRS Phase II Database HAG199604244.
Du Pont. 1963d. Effect of the Savannah River Plant on Environmental Radioactivity Semiannual Report, January through June 1963. DPSPU-63-30-32. SRS Phase II Database MJC1993121316. August.
Du Pont. 1964. Environmental Monitoring Monthly Report, December. Radiological Control and Methods. SRS Phase II Database HAG199604254.
Risk Assessment Corporation “Setting the standard in environmental health”
10-22 The Savannah River Site Dose Reconstruction ProjectPhase II: Source Term Calculation and Ingestion Pathway Data Retrieval
Du Pont. 1965a. Effect of the Savannah River Plant on Environmental Radioactivity. Semiannual
Report, July through December-1964. DPSPU-65-30-1. SRS Phase II Database MJC1993121318. February.
Du Pont. 1965b. Effect of the Savannah River Plant on Environmental Radioactivity. Semiannual Report, January through June-1965. DPST-65-30-2. SRS Phase II Database MJC1993121321. August.
Du Pont. 1966a. Effect of the Savannah River Plant on Environmental Radioactivity. Semiannual Report, July through December-1965. DPST-66-30-1. SRS Phase II Database MJC1993121322. February.
Du Pont. 1966b. Environmental Monitoring Monthly Report, March. Radiological and Environmental Sciences Division, Savannah River Laboratory. SRS Phase II Database MJC1996050811.
Du Pont. 1966c. Effect of the Savannah River Plant on Environmental Radioactivity Semiannual Report, January through June 1966. DPST-66-30-2. SRS Phase II Database MJC1993121323. August.
Du Pont. 1966d. I-131, tritium and 90Sr in milk - 1966. Handwritten Environmental Monitoring Datasheets (aperture cards). SRS Phase II Database MJC1996082743.
Du Pont. 1966e. Environmental Monitoring Monthly Report, August. Radiological and Environmental Sciences Division, Savannah River Laboratory. SRS Phase II Database MJC1996050602.
Du Pont. 1968. Environmental Monitoring Monthly Report, April. Radiological Sciences Division, Savannah River Laboratory, Environmental Monitoring Group. SRS Phase II Database MJC1996051003.
Harvey, R.S., J.H. Horton, and H.G. Mealing. 1959a. Health Physics Regional Monitoring Semiannual Report, January through June 1958. DPSP-58-25-38. SRS Phase II Database MJC1993121012. January 9.
Harvey, R.S., J.H. Horton, and H.G. Mealing. 1959b. Health Physics Regional Monitoring Semiannual Report, July through December 1958. DPSPU-59-11-23. SRS Phase II Database MJC1993121013. August.
Horton, J.H. and H.G. Mealing. 1957. Health Physics Regional Monitoring. Semi-Annual Report, January through June 1957. DPSP-57-25-43. SRS Phase II Database MJC1993121010. November 20.
Horton, J.H., R.S. Harvey, and H.G. Mealing. 1958. Health Physics Regional Monitoring. Semi-Annual Report, July through December 1957. DPSP-58-25-17. SRS Phase II Database MJC1993121011.
Evaluation of Materials Released from SRS Radionuclides in Milk
10-23
Johnson, J.E. 1963. Memo to W.L. Marter. Subject: Regional Monitoring Program Review. SRS
Phase II Database SKR199402021. December 13.
Johnson, J.E. 1964. Memo to file. Subject: Environmental Monitoring–Routine Sample Collection. SRS Phase II Database JMW1996011110. July 31.
Kantelo, M.V., L.R. Bauer, W.L. Marter, C.E. Murphy, Jr., and C.C. Zeigler. 1993. Radioiodine in the Savannah River Site Environment. WSRC-RP-90-424-2. Westinghouse Savannah River Company. SRS Phase II Database MJC1994051312. January.
Marter, W.L. and J.E. Johnson. 1966. Memo to C.M. Patterson. Subject: Environmental Sampling. SRS Phase II Database JMW1996011127. January 19.
Reinig, W.C., R.E. Gosline, E.L. Albenesius, and R.C. Williams. 1953. Natural Radioactive Contents of the Savannah River Plant. DP-27. Health Physics Section, Savannah River Plant. SRS Phase II Database MJC199312101. May 1.
Risk Assessment Corporation “Setting the standard in environmental health”