Embed Size (px)
Citation preview
CHAPTER 37 CRIME STATISTICS
37.1 Crime Statistics is an important and essential input for assessing quality of life and the human rights situation in the society. Crime Statistics broadly reflects the status of operations of Criminal Justice System in a Country. Crime Statistics includes data on Offences and law Offenders, interalia In India, Crime statistics are generated on the basis of crime records maintained by different law enforcing agencies like the Police and the Judiciary at different level of administrative/legal jurisdiction under the federal system of India. These statistics are normally readily available and are generally used for assessing how crime is being dealt with by law enforcement agencies, However, these statistics are based on only those cases which are generally reported to the law enforcement agencies and recorded through all stages of actions on the cases reported. As such, 'Crime Statistics' in India gives an incomplete picture of crime situations in the country. However, the deficiency is not particular to India, as some studies have shown that even data collected by British Crime Statistics provides a picture of 30% of the actual crime in that country. 37.2 Source of Crime Statistics: National Crime Records Bureau (NCRB) is the nodal agency at the centre to collect, compile and disseminate the information related with crime. “Crime in India”, an annual compilation of NCRB, is being published since 1953. For this publication, the information in 22 standardized formats is being collected from all the 36 States/UTs as well as from 35 mega cities. 37.3 Internationally, data on crime & drugs are maintained by United Nations Office of Drugs and Crime (UNODC) . UNODC collects data on crime and the operation of criminal justice systems in order to make policy-relevant information and analysis available in a timely manner to the international community. UNODC works on the development of methodology and standards for crime and criminal justice information systems and for the conduct of victimization surveys. The office also aims to enhance the cross-national comparability of data through the development of key indicators and data reporting tools. Periodic reports of UNODC on selected crime issues provide an in-depth analysis on key topics of concern at the global and regional level. 37.4 Recognizing the importance of Crime Statistics , UNODC in cooperation with United Nations Statistical Division conducted the Eleventh United Nations survey of Crime Trends and the Operations of Criminal Justice Systems (11th UN-CTS ) during 2007-08. The major goal of the survey was to collect the data on incidence of reported crimes and operations of criminal justice system. India has also participated in the survey. The survey results provide an overview of trends and interrelationships between various parts of the criminal justice system to promote informed decision-making in administration, nationally and internationally. The First & Second UN-CTS was conducted during 1970-80. Present CTS questionnaire pertains to 2014 . 37.5 The information maintained by UNODC includes :
• Statistics on Crime : Homicide, assaults sexual violence, robbery , kidnapping, theft burglary , drug related crime .
• Statistics on Drug Use.
• Statistics on Criminal Justice: Persons prosecuted, convicted, detained , Criminal Justice system resources etc.
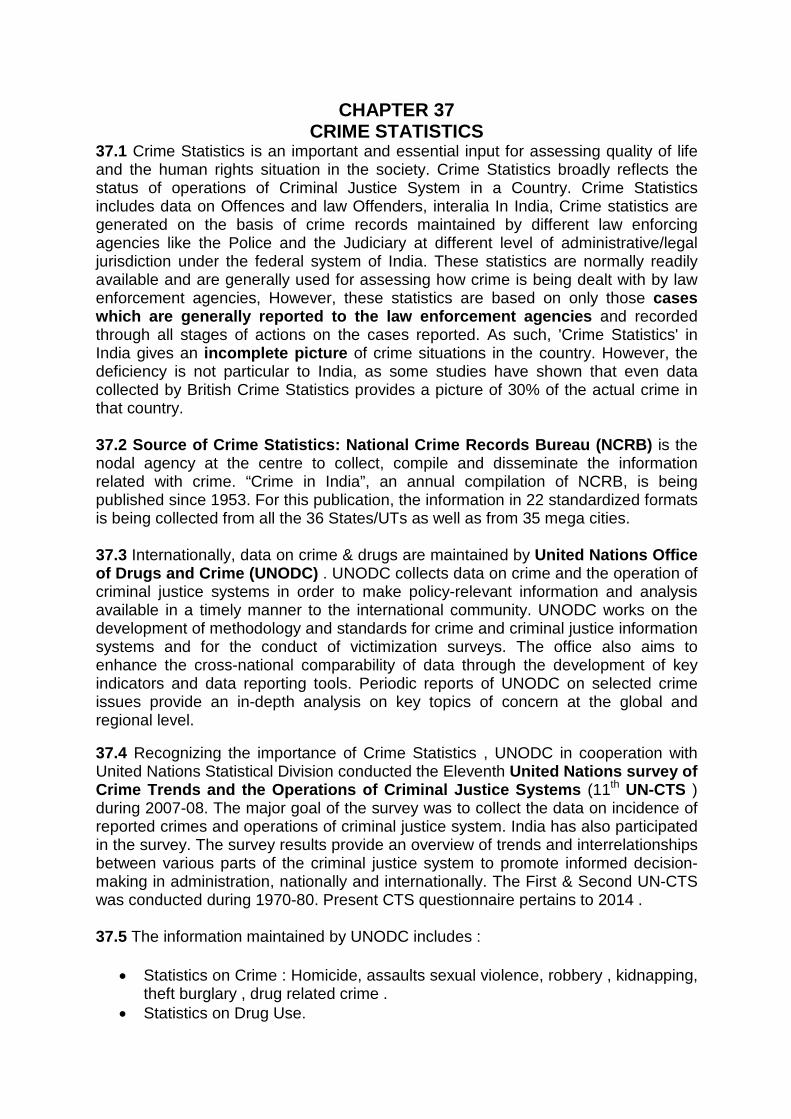
37.6 High-level special events: Thirteenth United Nations Congress on Crime Prevention and Criminal Justice As part of the Thirteenth United Nations Congress on Crime Prevention and Criminal Justice, the United Nations Office on Drugs and Crime (UNODC), in cooperation with other stakeholders, organized 11 high-level special events between 13 and 15 April 2015. UNODC, in partnership with the Rule of Law Coordination and Resource Group and the permanent missions of Italy and Thailand to the United Nations, organized a high-level special event on the rule of law, human rights and the post-2015 development agenda. The event brought together leading figures to discuss how “the advancement of the rule of law at the national and international levels, including through crime prevention and criminal justice mechanisms, is essential for sustained and inclusive economic growth and sustainable development and the full realization of all human rights and fundamental freedoms, including the right to development, all of which, in turn, reinforce the rule of law”. UNODC, in partnership with the Secretariat of the Convention on International Trade in Endangered Species of Wild Fauna and Flora (CITES) and the other partners of the International Consortium on Combating Wildlife Crime, namely the International Criminal Police Organization, the World Bank and the World Customs Organization, organized a high-level event on “Wildlife and forest crime: a serious crime”. UNODC and the Board of Trustees of the United Nations Voluntary Trust Fund for Victims of Trafficking in Persons, Especially Women and Children, organized a high-level event to present the achievements of and challenges faced by the Trust Fund during the five years since its inception. The UNODC Executive Director highlighted the fact that the Trust Fund, which had been established by the General Assembly in its resolution 64/293 of 30 July 2010 as part of the Global Plan of Action to Combat Trafficking in Persons, had provided $1.7 million to 28 non-governmental organizations (NGOs) in 25 countries. Eleven NGOs had provided direct, specialized assistance to around 2,000 victims of human trafficking annually over the past three years, and 17 NGO projects would start being implemented during the current year. Participants acknowledged the key role played by NGOs in providing assistance to victims and in supporting Governments to both shape and implement legislation to counter trafficking. 37.7 Procedure for Collection of Crime Statistics: The flow of information starts from the Police stations wherein the cognizable offence is reported in the form of First Information Report (FIR).FIR sets the process of Criminal Justice in motion. The information thereafter flows from District Crime Record Bureaus to State Crime Record Bureau and the same is finally consolidated by National Crime Records Bureau .
37.8 Genesis of National Crime Records Bureau : Setting up of National Crime Records Bureau was recommended by the National Police Commission set up in 1977 . Accepting the recommendations, the Ministry of Home Affairs constituted a
Task Force in 1985 to work out the modalities for setting up of the National Crime Records Bureau (NCRB). The Government accepted the recommendations of the Task Force and constituted the NCRB with headquarters at New Delhi in January, 1986. The objectives of the Bureau are :
i. To function as a clearing house of information on crime and criminals including those operating at National and International levels so as to assists the investigators, and others in linking crimes to their perpetrators.
ii. To store, coordinate and disseminate information on inter-state and international criminals from and to respective States, national investigating agencies, courts and prosecutors in India without having to refer to the Police Station records.
iii. To collect and process crime statistics at the National level. Major Issues: 37.9 Major issues pertaining to crime statistics include: i. Large extent of non-reporting/ recording of crime/ offences at different levels of administration, particularly with reference to non-cognizable offences having social implications ii. Inadequate coverage of crime heads – under-coverage due to non-reporting for identified reasons. iii. Reliability – systemic biases, errors due to overlaps between different sections of IPC, outreach to vulnerable (women, children and backward communities). iv. Timeliness – rationalization of data flow. v. Identification of new types of crime/ offences for collection of statistics thereon. 37.10 The above issues were discussed by Committee on Crime Statistics constituted in October, 2010 by the Ministry of Statistics & Programme Implementation. Crime is a state subject and state governments might be sensitive to the number of cases reported in their domains. States with better reporting systems or more empowered and educated public might record higher rates of crime. Further, in lot of cases the offended person may not report the crime out of social considerations or out of the fear of consequences eg. crime against women, children etc . Hence the comparisons across the states and across categories of crime must always be done with caution . Terms & Definitions : 37.11 The Criminal Procedure Code (Cr.P.C) India classifies all the crimes into two categories :
• Cognizable Crime : Sec. 2 ( C ) Cr PC • Non Cognizable Crime: Sec 2 (I ) Cr PC
(I) Cognizable Crime : A cognizable offence or case is defined as the one which an officer in-charge of a police station may investigate without the order of a magistrate and effect arrest without warrant. Cognizable crimes are broadly categorised as those falling either under the `Indian Penal Code (IPC)' or under the `Special and Local Laws (SLL)'
(II) Non Cognizable Crime : Non-Cognizable crimes are defined as those which can not be investigated by police without the order of a competent magistrate. Police do not initiate investigation in non-cognizable crimes except with magisterial permission. (III) Broad classification of crimes under the Indian penal code (IPC) : i) Crimes against body: Murder, Attempt to commit murder, Culpable homicide not amounting to murder,Kidnapping & Abduction, Hurt,Causing death by negligence; ii) Crimes against property: Dacoity, Preparation and assembly to commit Dacoity, Robbery, Burglary and Theft; iii) Crimes against public order: Riots and Arson; iv) Economic crimes: Criminal breach of trust, Cheating & Counterfeiting; v) Crimes against women: Rape, Dowry death, Cruelty by husband or his relatives, Assault on women with intent to outrage her modesty, Insult to the modesty of women and Importation of girl from foreign country; vi) Crimes against children: Child rape, Kidnapping & abduction of children, Procuration of minor girls, Selling and buying of girls for prostitution, Abetment of suicide, Exposure and Abandonment, Infanticide and foeticide; vii) Other IPC crimes. (IV)Crimes under the Special and Local Laws (SLL) i) Arms Act, 1959; ii) Narcotic Drugs & Psychotropic Substances Act, 1985; iii) Gambling Act, 1867; iv) Excise Act, 1944; v) Prohibition Act; vi) Explosives & Explosive Substances Act, 1884 & 1908; vii) Immoral Traffic (Prevention) Act, 1956; viii) Indian Railways Act, 1989; ix) The Foreigners Act, 1946; x) Protection of Civil Rights Act, 1955; xi) Passport Act, 1967; xii) Essential Commodities Act, 1955; xiii) Antiquities & Art Treasures Act, 1972; xiv) Dowry Prohibition Act, 1961; xv) Prohibition of Child Marriage Act 2006; xvi) Indecent Representation of Women (Prohibition) Act, 1986; xvii) Copyright Act, 1957; xiii) Commission of Sati Prevention Act, 1987; xix) SC/ST (Prevention of Atrocities) Act, 1989; xx) Forest Act, 1927; xxi) Other crimes (not specified above) under Special and Local Laws including Cyber Laws under Information Technology Act (IT), 2000. (V) Incidence of Crime : Number of crime reported under Indian Penal Code(IPC) or Special & Local Laws(SLL). (VI) Rate of Crime : Number of crime reported per lakh person in the target Population .
Past Trends: 37.12 As per the number of cases reported, the total cognizable crime under IPC in general has been showing a rising trend except for the years 1954, 1955, 1963, 1968, 1969, 1975, 1976, 1979, 1982, 1993 and 2003, in which the declining trend was observed. The total during 2014 was 28,51,563 recording an increase of 373.7 % over 1953 when 6,01,964 cases were reported. 37.13 The total number of complaints received by police including oral, written, distress call or the ones initiated suo-moto by police is being collected since 1999 in order to assess the quantum of work load of police. The NCRB has now started collecting detailed data on nature and types of crime related complaints received by Crime in India-2014.

As regards the nature and number of crime related complaints vis-à-vis actual number of cognizable crimes registered by Police. A total of 1,30,27,600 complaints were received by police in the country during the year 2014 as compared to 1,86,84,289 complaints received during the year 2013 showing a decrease of 30.28% over 2013, it is due to fact that some States have given non-crime related complaints in previous year(2013). 35.4% of these were written complaints, 33.8% were oral complaints (including 23.7% complaints received vide distress call over phone/dial 100) and 30.8% complaints were of other kind of complaints which include 23.6% complaints initiated suo-moto by Police. Nearly, 28.8% of these complaints were registered as non-cognizable offences (37,55,602 out of 1,30,27,600 complaints).
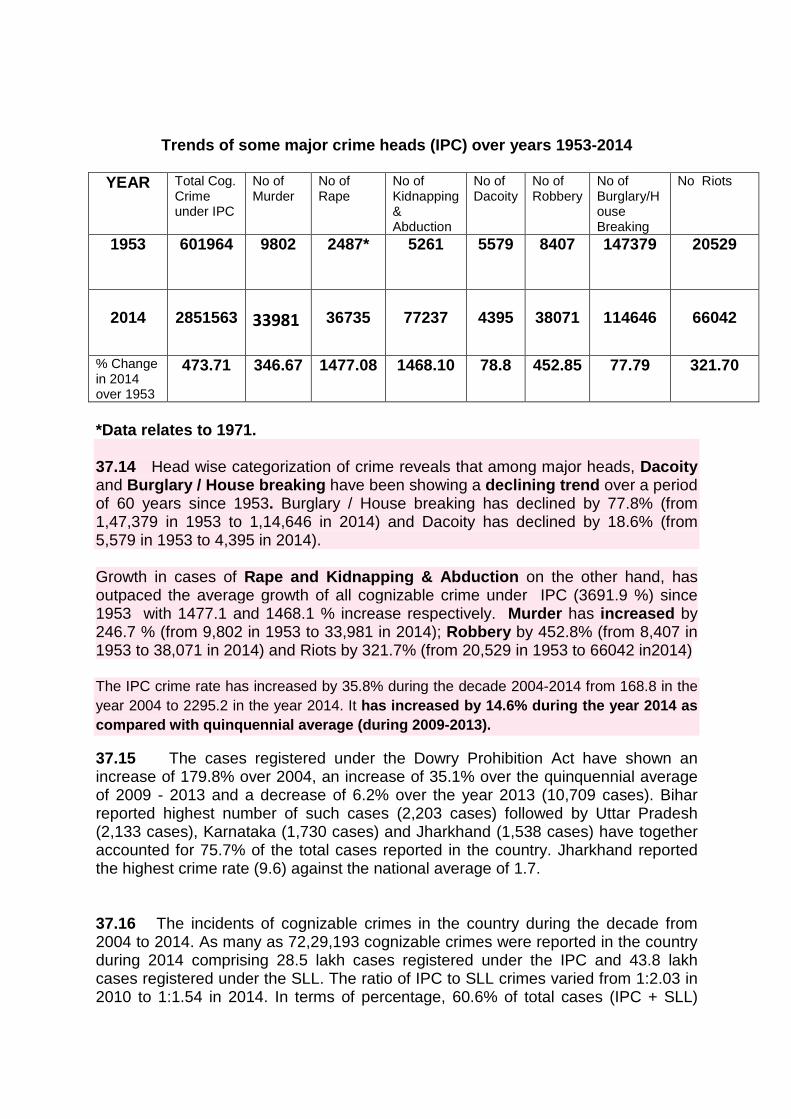
Trends of some major crime heads (IPC) over years 1953-2014
YEAR Total Cog. Crime under IPC
No of Murder
No of Rape
No of Kidnapping & Abduction
No of Dacoity
No of Robbery
No of Burglary/House Breaking
No Riots
1953 601964 9802 2487* 5261 5579 8407 147379 20529
2014
2851563
33981
36735
77237
4395
38071
114646
66042
% Change in 2014 over 1953
473.71 346.67 1477.08 1468.10 78.8 452.85 77.79 321.70
*Data relates to 1971. 37.14 Head wise categorization of crime reveals that among major heads, Dacoity and Burglary / House breaking have been showing a declining trend over a period of 60 years since 1953. Burglary / House breaking has declined by 77.8% (from 1,47,379 in 1953 to 1,14,646 in 2014) and Dacoity has declined by 18.6% (from 5,579 in 1953 to 4,395 in 2014). Growth in cases of Rape and Kidnapping & Abduction on the other hand, has outpaced the average growth of all cognizable crime under IPC (3691.9 %) since 1953 with 1477.1 and 1468.1 % increase respectively. Murder has increased by 246.7 % (from 9,802 in 1953 to 33,981 in 2014); Robbery by 452.8% (from 8,407 in 1953 to 38,071 in 2014) and Riots by 321.7% (from 20,529 in 1953 to 66042 in2014) The IPC crime rate has increased by 35.8% during the decade 2004-2014 from 168.8 in the year 2004 to 2295.2 in the year 2014. It has increased by 14.6% during the year 2014 as compared with quinquennial average (during 2009-2013).
37.15 The cases registered under the Dowry Prohibition Act have shown an increase of 179.8% over 2004, an increase of 35.1% over the quinquennial average of 2009 - 2013 and a decrease of 6.2% over the year 2013 (10,709 cases). Bihar reported highest number of such cases (2,203 cases) followed by Uttar Pradesh (2,133 cases), Karnataka (1,730 cases) and Jharkhand (1,538 cases) have together accounted for 75.7% of the total cases reported in the country. Jharkhand reported the highest crime rate (9.6) against the national average of 1.7.
37.16 The incidents of cognizable crimes in the country during the decade from 2004 to 2014. As many as 72,29,193 cognizable crimes were reported in the country during 2014 comprising 28.5 lakh cases registered under the IPC and 43.8 lakh cases registered under the SLL. The ratio of IPC to SLL crimes varied from 1:2.03 in 2010 to 1:1.54 in 2014. In terms of percentage, 60.6% of total cases (IPC + SLL)
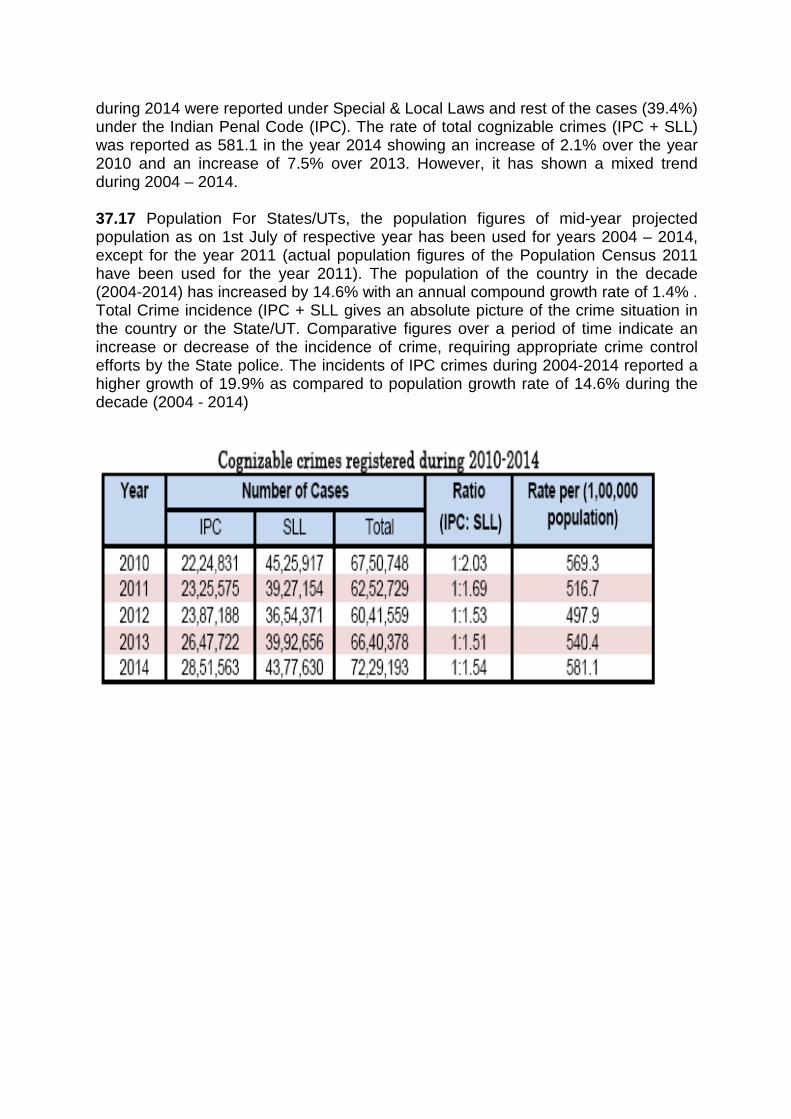
during 2014 were reported under Special & Local Laws and rest of the cases (39.4%) under the Indian Penal Code (IPC). The rate of total cognizable crimes (IPC + SLL) was reported as 581.1 in the year 2014 showing an increase of 2.1% over the year 2010 and an increase of 7.5% over 2013. However, it has shown a mixed trend during 2004 – 2014. 37.17 Population For States/UTs, the population figures of mid-year projected population as on 1st July of respective year has been used for years 2004 – 2014, except for the year 2011 (actual population figures of the Population Census 2011 have been used for the year 2011). The population of the country in the decade (2004-2014) has increased by 14.6% with an annual compound growth rate of 1.4% . Total Crime incidence (IPC + SLL gives an absolute picture of the crime situation in the country or the State/UT. Comparative figures over a period of time indicate an increase or decrease of the incidence of crime, requiring appropriate crime control efforts by the State police. The incidents of IPC crimes during 2004-2014 reported a higher growth of 19.9% as compared to population growth rate of 14.6% during the decade (2004 - 2014)
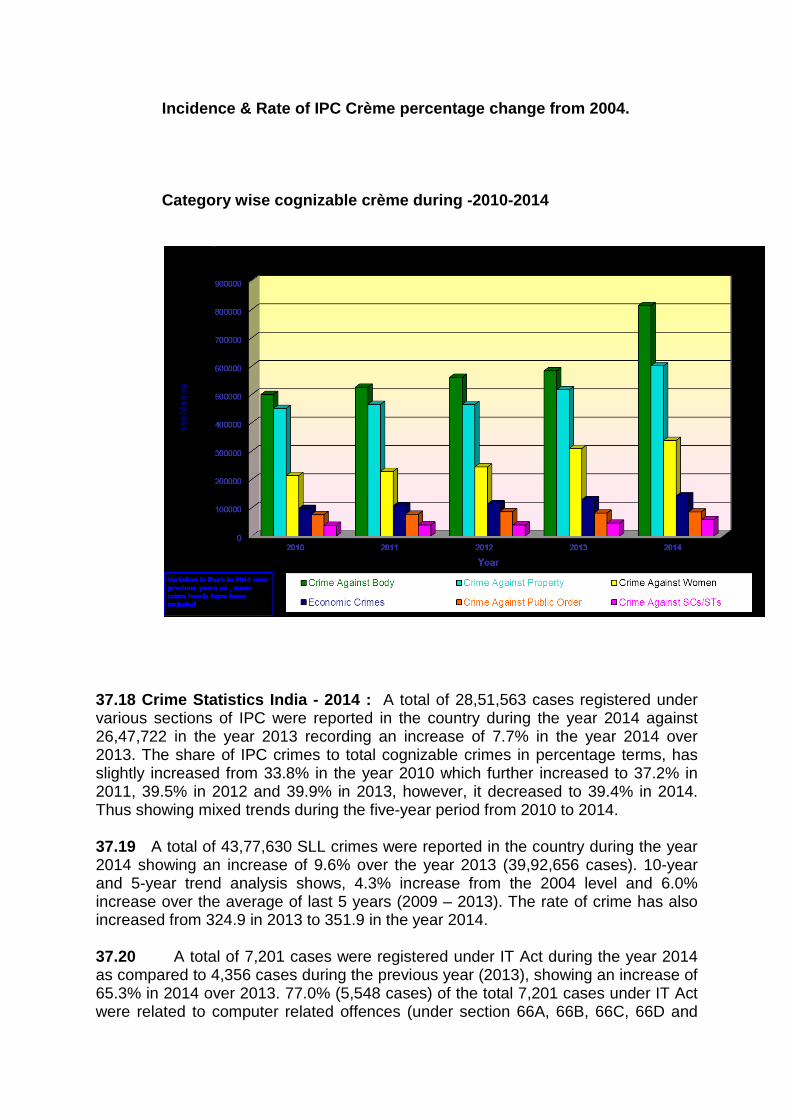
Incidence & Rate of IPC Crème percentage change from 2004.
Category wise cognizable crème during -2010-2014
37.18 Crime Statistics India - 2014 : A total of 28,51,563 cases registered under various sections of IPC were reported in the country during the year 2014 against 26,47,722 in the year 2013 recording an increase of 7.7% in the year 2014 over 2013. The share of IPC crimes to total cognizable crimes in percentage terms, has slightly increased from 33.8% in the year 2010 which further increased to 37.2% in 2011, 39.5% in 2012 and 39.9% in 2013, however, it decreased to 39.4% in 2014. Thus showing mixed trends during the five-year period from 2010 to 2014. 37.19 A total of 43,77,630 SLL crimes were reported in the country during the year 2014 showing an increase of 9.6% over the year 2013 (39,92,656 cases). 10-year and 5-year trend analysis shows, 4.3% increase from the 2004 level and 6.0% increase over the average of last 5 years (2009 – 2013). The rate of crime has also increased from 324.9 in 2013 to 351.9 in the year 2014. 37.20 A total of 7,201 cases were registered under IT Act during the year 2014 as compared to 4,356 cases during the previous year (2013), showing an increase of 65.3% in 2014 over 2013. 77.0% (5,548 cases) of the total 7,201 cases under IT Act were related to computer related offences (under section 66A, 66B, 66C, 66D and
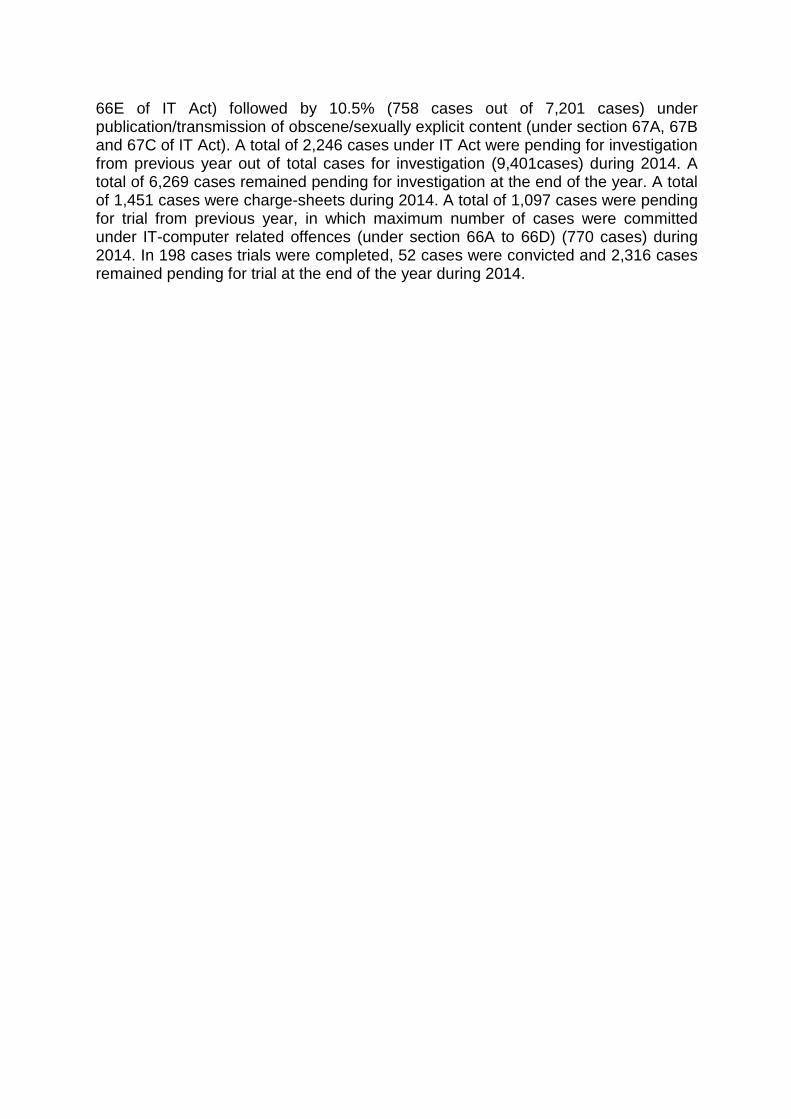
66E of IT Act) followed by 10.5% (758 cases out of 7,201 cases) under publication/transmission of obscene/sexually explicit content (under section 67A, 67B and 67C of IT Act). A total of 2,246 cases under IT Act were pending for investigation from previous year out of total cases for investigation (9,401cases) during 2014. A total of 6,269 cases remained pending for investigation at the end of the year. A total of 1,451 cases were charge-sheets during 2014. A total of 1,097 cases were pending for trial from previous year, in which maximum number of cases were committed under IT-computer related offences (under section 66A to 66D) (770 cases) during 2014. In 198 cases trials were completed, 52 cases were convicted and 2,316 cases remained pending for trial at the end of the year during 2014.
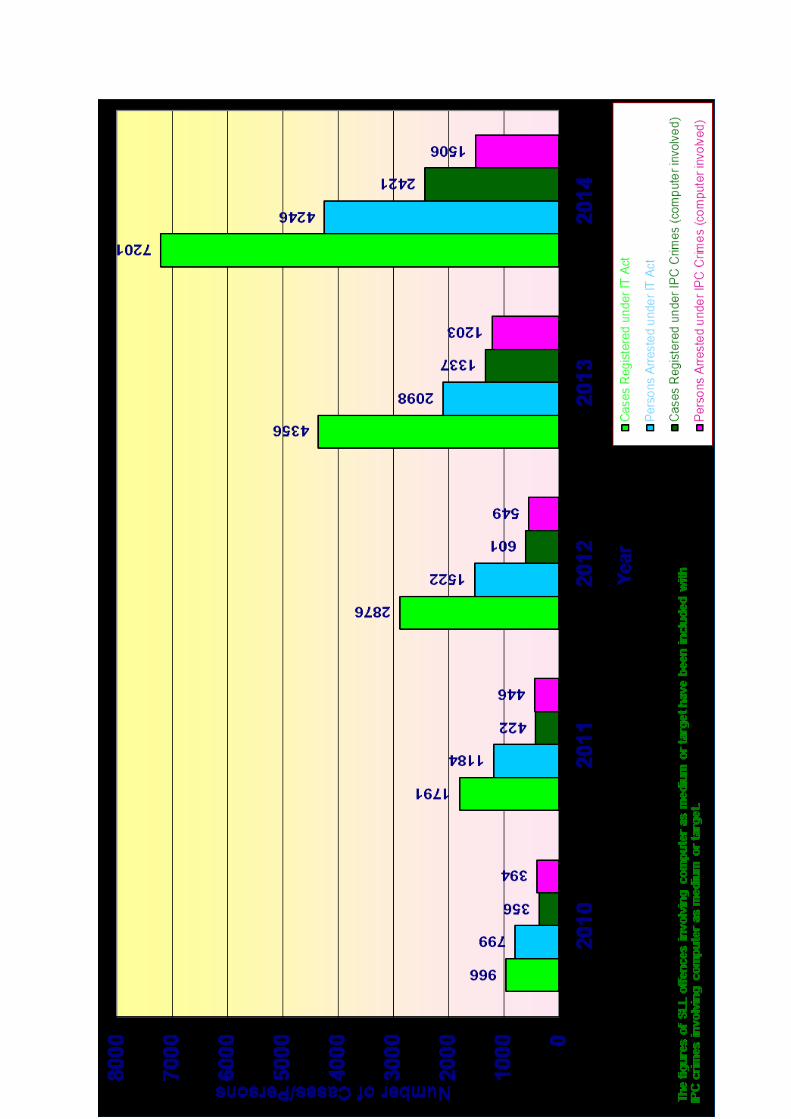
Karnataka (513 cases), Uttar Pradesh (372 cases) and Kerala (349 cases).
Source : Crime In India ,2013 NCRB A4 & A11 are part of crime against women also, A6,A7 & A8 are part of property crimes also.
Perc
enta
ge D
istr
ibut
ion
of IP
C C
rimes
dur
ing
2014
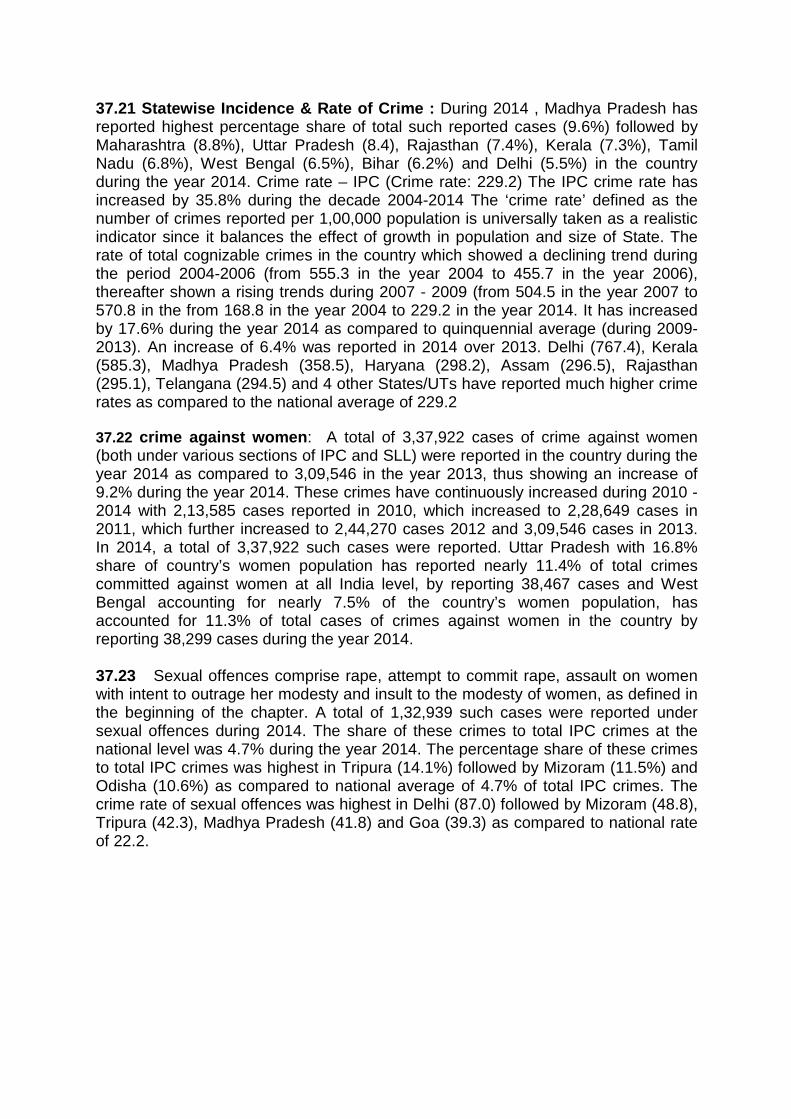
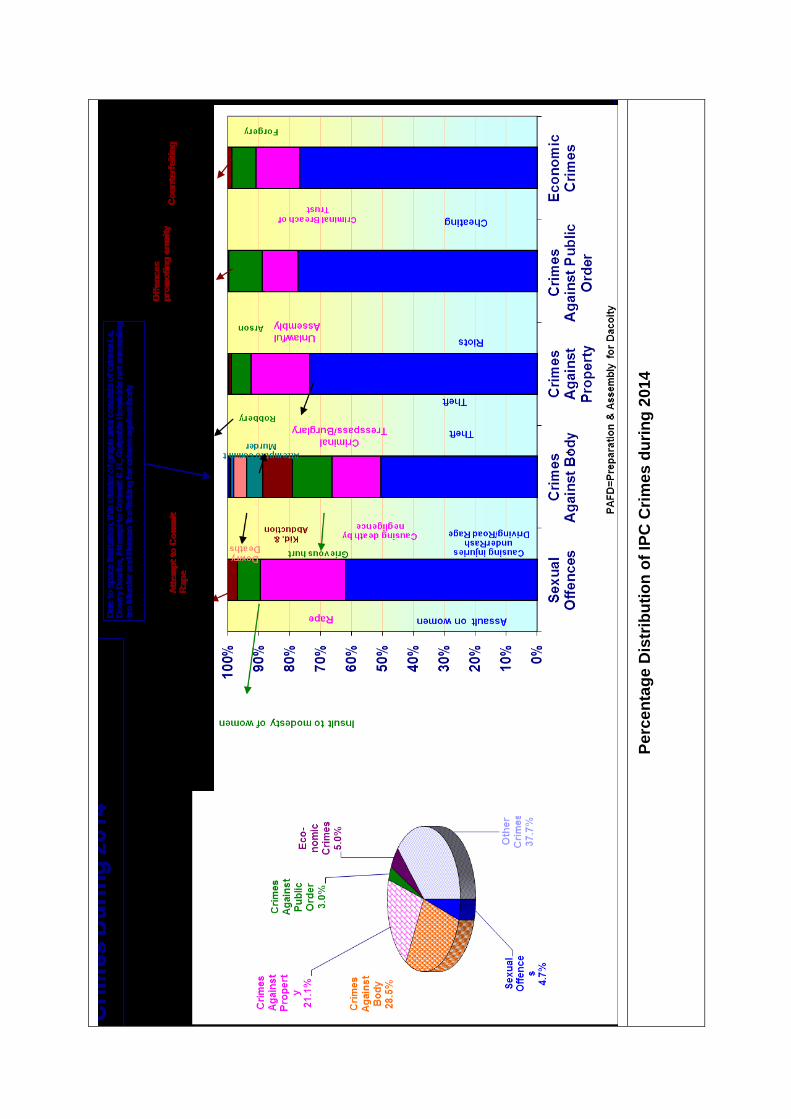
37.21 Statewise Incidence & Rate of Crime : During 2014 , Madhya Pradesh has reported highest percentage share of total such reported cases (9.6%) followed by Maharashtra (8.8%), Uttar Pradesh (8.4), Rajasthan (7.4%), Kerala (7.3%), Tamil Nadu (6.8%), West Bengal (6.5%), Bihar (6.2%) and Delhi (5.5%) in the country during the year 2014. Crime rate – IPC (Crime rate: 229.2) The IPC crime rate has increased by 35.8% during the decade 2004-2014 The ‘crime rate’ defined as the number of crimes reported per 1,00,000 population is universally taken as a realistic indicator since it balances the effect of growth in population and size of State. The rate of total cognizable crimes in the country which showed a declining trend during the period 2004-2006 (from 555.3 in the year 2004 to 455.7 in the year 2006), thereafter shown a rising trends during 2007 - 2009 (from 504.5 in the year 2007 to 570.8 in the from 168.8 in the year 2004 to 229.2 in the year 2014. It has increased by 17.6% during the year 2014 as compared to quinquennial average (during 2009-2013). An increase of 6.4% was reported in 2014 over 2013. Delhi (767.4), Kerala (585.3), Madhya Pradesh (358.5), Haryana (298.2), Assam (296.5), Rajasthan (295.1), Telangana (294.5) and 4 other States/UTs have reported much higher crime rates as compared to the national average of 229.2 37.22 crime against women: A total of 3,37,922 cases of crime against women (both under various sections of IPC and SLL) were reported in the country during the year 2014 as compared to 3,09,546 in the year 2013, thus showing an increase of 9.2% during the year 2014. These crimes have continuously increased during 2010 - 2014 with 2,13,585 cases reported in 2010, which increased to 2,28,649 cases in 2011, which further increased to 2,44,270 cases 2012 and 3,09,546 cases in 2013. In 2014, a total of 3,37,922 such cases were reported. Uttar Pradesh with 16.8% share of country’s women population has reported nearly 11.4% of total crimes committed against women at all India level, by reporting 38,467 cases and West Bengal accounting for nearly 7.5% of the country’s women population, has accounted for 11.3% of total cases of crimes against women in the country by reporting 38,299 cases during the year 2014. 37.23 Sexual offences comprise rape, attempt to commit rape, assault on women with intent to outrage her modesty and insult to the modesty of women, as defined in the beginning of the chapter. A total of 1,32,939 such cases were reported under sexual offences during 2014. The share of these crimes to total IPC crimes at the national level was 4.7% during the year 2014. The percentage share of these crimes to total IPC crimes was highest in Tripura (14.1%) followed by Mizoram (11.5%) and Odisha (10.6%) as compared to national average of 4.7% of total IPC crimes. The crime rate of sexual offences was highest in Delhi (87.0) followed by Mizoram (48.8), Tripura (42.3), Madhya Pradesh (41.8) and Goa (39.3) as compared to national rate of 22.2.
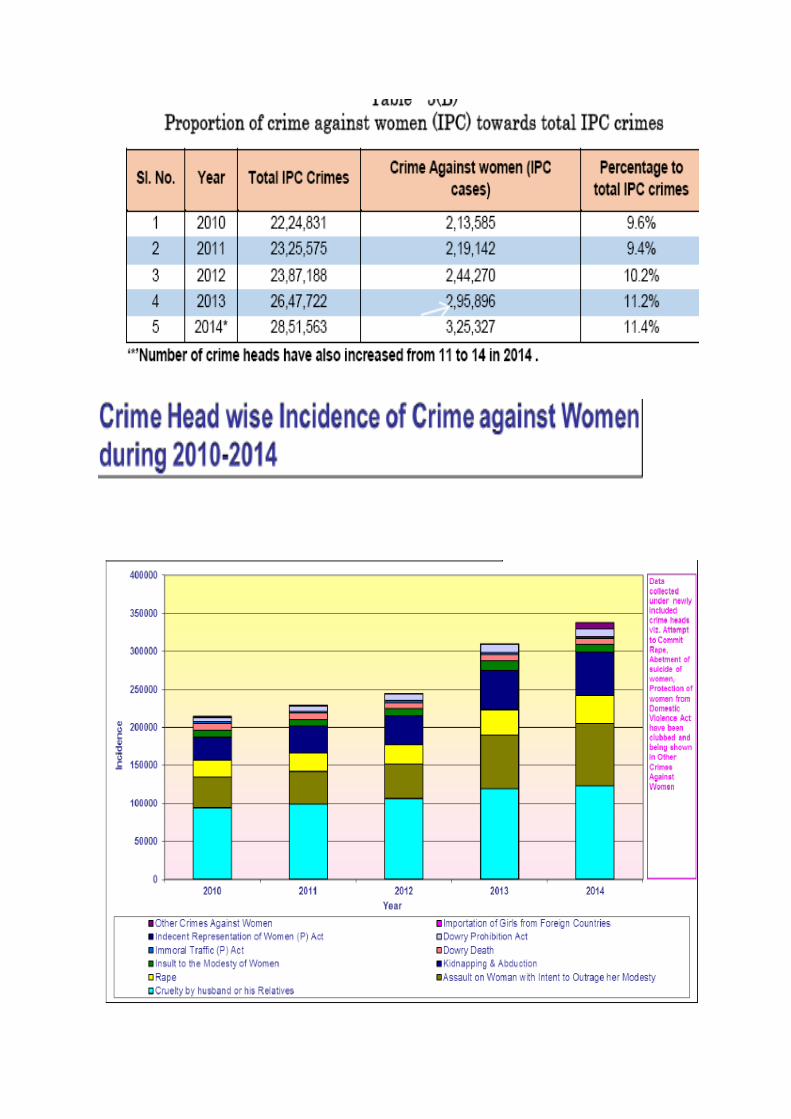
37.24 Police Infrastructure: As on 31.12.2014 existing (actual) police strength was 17.2 lakh against the sanctioned strength of 22.4 lakh of total police force (civil and armed combined), rendering 22.9% posts as vacant. The density of police
personnel (i.e. police personnel per 100 Sq Kms ) decreased to 54.4 from 54.7 in the previous year and the ratio of policeman per lakh population increased to 140 from 141 in the previous year . Delhi and Chandigarh reported highest police density (in excess of 5000 policemen per 100 Sq Km). 37.25 Disposal of persons arrested by Police: A total of 37,90,812 persons were arrested by the police under various IPC crimes during 2014 as against 35,23,577 persons in 2013, showing an increase of 7.6%. Crime head-wise information on the persons arrested under IPC crimes during 2013 and 2014 along with percentage variation in 2014 over 2013 is presented in Table-12.1. As many as 14,41,142 persons accounting for 38.0% were arrested for committing crimes other than the specified ones termed as ‘other IPC crimes’. Among the specified crimes, the highest arrests were made in cases of ‘causing injuries by negligent driving/rash driving’ (10.4%) (3,94,004 persons) followed by ‘Riots’ (8.1%) (3,08,544 persons), ‘Theft’ (6.8%) (2,59,441 persons), ‘Cruelty by husband or his relatives’ (6.0%) (2,25,648 persons) and ‘Grievous Hurt’ (5.0%) (1,88,916 persons). The highest increase in the arrests was observed for cases of ‘auto theft’ 37.7% (from 57,856 in 2013 to 79,680 in 2014) followed by ‘causing death by negligence 34.2% (from 90,904 in 2013 to 1,22,011 in 2014). Highest decline was observed in ‘importation of girls from foreign country’ 27.6% (from 58 in 2013 to 42 in 2014). Since some crimes heads have been modified, inter-alia, some crime heads newly added in 2014, therefore the comparison for these crime heads cannot be made in 2014 vis-à-vis 2013 37.26 A total of 48,04,382 persons were arrested under the SLL crimes, which was 55.9% of total arrestees, during 2014 as compared to 44,67,963 persons during 2013 accounting for an increase of 7.5% during 2014 over 2013. There are new acts which were included in the revised proformae of Crime in India – 2014. The details on crime-head wise, sex wise and age group wise arrests under SLL crimes during the year 2014. The percentage of female persons arrested under SLL crimes at all-India level was 3.0% (1,43,744 out of 48,04,382) against 10.2% for IPC crimes. Gujarat has reported the highest number of female arrestees with (64.7%) (92,982 females out of 1,43,744 females) followed by Tamil Nadu (14.4%) (20,664 out of 1,43,744 females). 37.27 Disposal of persons arrested by Courts: As many as 1,79,68,824 persons (including those from previous years) were awaiting trials (under trial) in various criminal courts in the country during 2014 (an increase of 1.7% over the last year (1,76,60,316 persons) as per information presented in Table- 12.4. Trials in respect of 1,54,23,815 persons remained pending at the end of the year 2014. Out of 23,06,926 persons in whose cases trials have been completed, 8,58,382 persons were convicted, 13,77,233 persons were acquitted and 71,311 persons were discharged by court. The overall conviction percentage at allIndia level for the persons arrested in IPC cases was 37.2% (8,58,382 out of 23,06,926 persons whose trials were completed). Crime head wise persons convicted reveals that maximum convictions were under cases of causing injuries due to negligent driving/rash driving (50.0%) (1,96,942 out of 3,94,004 persons), followed by importation of girls from foreign country (28.6%) (12 out of 42 persons). The State/UT-wise details on the disposal of persons charged in IPC cases by courts during 2014 are presented in Table-12.4. Out of total 1,79,68,824 persons under trial,
32,68,284 persons were from the State of Maharashtra followed by Bihar 19,12,211 persons and Uttar Pradesh 14,55,545 persons respectively. When compared with share of persons awaiting trial at the end of the year at national level, these States accounted for 18.2%, 10.6% and 8.1% of total persons waiting for trials to be completed respectively The State/UT-wise details on
References:
• Website of United Nations Office of Drugs and Crime (UNODC) • Crime in India 2014, National Crime Records Bureau, Ministry of Home Affairs
& other information available on the website of National Crime Records Bureau.