Embed Size (px)
Citation preview
CHAPTER-4
Dielectric Study
Dielectric Study
4.1 Introduction
The characterization of dielectric ceramics has received considerable scientific
interest because of their enormous applications in electronic devices such as resonators,
actuators, multilayer capacitors, etc. The principal applications of dielectric materials are
as capacitive elements in electronics circuits and electrical insulations. In contrast to
electrical conductivity that involves long-range motion of charge carriers, the dielectric
response results from the short-range motion of charge carriers under the influence of an
externally applied electric field. The relative dielectric constant (εr), loss tangent (tanδ)
and dielectric strength (breakdown) are the three important characteristics of the
dielectrics relevant to their suitability for device applications. The relative dielectric
constant of the material determines the ability to store electrostatic energy. The loss
tangent indicates the ability of dielectrics to support the electrostatic field, while
dissipating minimal energy in the form of heat. The lower the dielectric loss (the
proportion of energy loss as heat) the more effective is the dielectric material. Dielectric
strength indicates the maximum voltage that the dielectric can safely withstand.
Dielectric properties depend upon the chemical composition, structure and particle size
of the material and various external factors such as temperature, humidity, mechanical
stress, intensity and frequency of the electric field.
Ferroelectrics are non-linear dielectrics whose dielectric behavior changes
appreciably with change of the electric field strength, pressure and temperature.
Ferroelectric ceramics play a significant role in modern technology owing to their
excellent dielectric, electro-optic, pyroelectric, piezoelectric, elasto-optic and electro-
mechanical properties. These materials are used to design high permittivity capacitors,
ferroelectric memory devices, pyroelectric sensors, piezoelectric transducers, PTC
thermistors, actuators, resonators, printer logic circuit, light modulator and deflector,
frequency changer, etc.
Chapter 4 Dielectric study
87
Ferroelectrics materials are considered important and useful for the following
reasons:
1. high relative dielectric constant as compared to the ordinary dielectrics
2. relatively low dielectric loss
3. high specific electrical resistivity
4. moderate dielectric breakdown strengths
5. non-linear electrical behavior (hysteresis).
The measurement of dielectric parameters of the ferroelectrics over a wide range of frequency and temperature provides some useful information regarding the existence of ferroelectricity, the nature of phase transition and suitability of materials for device applications. It is also important to explore the dependence of dielectric properties on impurities, microstructure, grain size, porosity, etc.
The dielectric properties of ferroelectrics depend on the field strength at which it is measured. It is a consequence of non-linear relation between polarization and electric field. For ferroelectric materials the dielectric constant increase upto the transition temperature and after that it obeys the Curie- Weiss law.
In this chapter detailed studies of dielectric properties of all the proposed compounds as a function of frequency and temperature have been discussed, which may provide information regarding the existence of ferroelectricity, the nature of phase transition in them and the effect of substitution on dielectric properties of the proposed compounds.
4.1.1 Brief Review of the Previous Work
Dielectric properties (εr, tanδ) of A(B'1/2B"1/2)O3 compounds depend on their
crystal structure, tolerance factor, the type of the ions occupying the B-site, and the A-
site. The pronounced effect of the radius of the A-site cation on the dielectric constant
can be envisaged when Ba(B'1/3B"2/3)O3 perovskites are compared to that of
Pb(B'1/3B"2/3)O3 compounds. Radii of lead and barium cation (in 12-fold coordination)
are RPb=0.172 nm and RBa=0.161 nm and the dielectric constant 6500 and 24 for
Pb(MgI/3Ta2/3)O3 and Ba(Mgl/3Ta2/3)O3, respectively [230]. The dielectric constant of
Ba(Mgl/3Ta2/3)O3 [231,232] and Ba(Mgl/3Nb2/3)O3[233] has different value. The niobates
possess higher value of dielectric constants as compared to tantalates. Tantalates, in
Chapter 4 Dielectric study
88
general, have higher Q-factors than niobates. This is because the materials with higher E
have higher harmonic component of the lattice vibration energy [234]. Only two
contributions into the dielectric constant of Ba(B'1/3B"2/3)O3 compounds come from ionic
and electronic polarizations. Kawashima et al. [235] reported that improvement in the Q
factor corresponds to increased ordering of Zn and Ta in Ba(Znl/3 Ta2/3)O3. According to
the literature, high degree of ordering and high density is the two most important factors
determining the dielectric constant and loss for devices. Kinetics of cation ordering
depends on the diffusion of the B-site cations from one oxygen octahedron to another.
This is controlled by temperature, type of B-site cations, stoichiometry and impurities.
The rate of ordering and densification of ceramics can be significantly increased with
increase in temperature. In recent years, there has been a considerable amount of interest
in the investigation of relaxor ferroelectrics (i.e., the ferroelectrics having a diffuse phase
transition (DPT)) which is characterized by a broad maximum in the temperature
dependence of the dielectric permittivity (real part) and the dielectric dispersion in the
said transition region (Smolenskii 1970, 1984). Lead iron niobate, PbFe0.5Nb0.5O3 (PFN),
is known to be the most intensively investigated by Ivanov et al (2000), Lampis et al
(1999), Darlington (1991), Yasuda and Ueda (1989a, 1989b). PFN is a ferroelectric of
the disordered-type (Smolenskii et al 1958, Bokov et al 1962) having a ferroelectric
transition temperature at 1100C (Bhat et al 1974, Brunskill et al 1981). It is current
interest as a component in commercial electroceramic materials, particularly as it is
typically characterized by high relative permittivities and low sintering temperatures.
The lead free BFN ceramic is synthesized by the solid-state reaction technique for the
first time by Saha et al [136]. The phenomenon of the high value of the dielectric
permittivity in ceramics AFe1/2B1/2O3 (A=Ba, Sr, Ca; B=Nb, Ta, Sb) in a wide
temperature interval is due to the Maxwell–Wagner relaxation was reported by Raevski
et al [139].
4.1.2 Measurements of dielectric constant and loss tangent
Measurements of relative dielectric constant and loss tangent can be carried out using various methods depending upon the nature of specimen and frequency. To obtain relative dielectric constant and loss tangent the following methods are generally used.
R F method (lump circuit method).
Microwave method (distributed circuit method).
Impedance method/LCR method.
Chapter 4 Dielectric study
89
In the present study, the impedance method has been used to investigate the
dielectric and resistivity properties of the compounds. Capacitance of a sample is
measured using impedance or LCR bridge, depending on frequency range, such as
Schering bridge, transformer ratio bridge etc. Then the relative dielectric constant (εr) of
the sample is calculated from its capacitance and geometry.
4.1.3 Experimental
The dielectric properties (εr and tanδ) of all the samples were measured at
different temperatures and frequencies with the help of a computer-controlled LCR meter
(4NL, Model: PSM-1735, UK) along with a laboratory-designed and fabricated sample
holder and furnace [Fig. 2.7]. A chromel-alumel thermo-couple and a digital milli-
voltmeter (KUSAM MECO 108) were used to measure the temperature with accuracy of
0.1 mV (equivalent to 2.5 0C). The data were recorded in a temperature interval of about
2.5 0C after the sample attains steady state. Silica gel was put inside the sample holder to
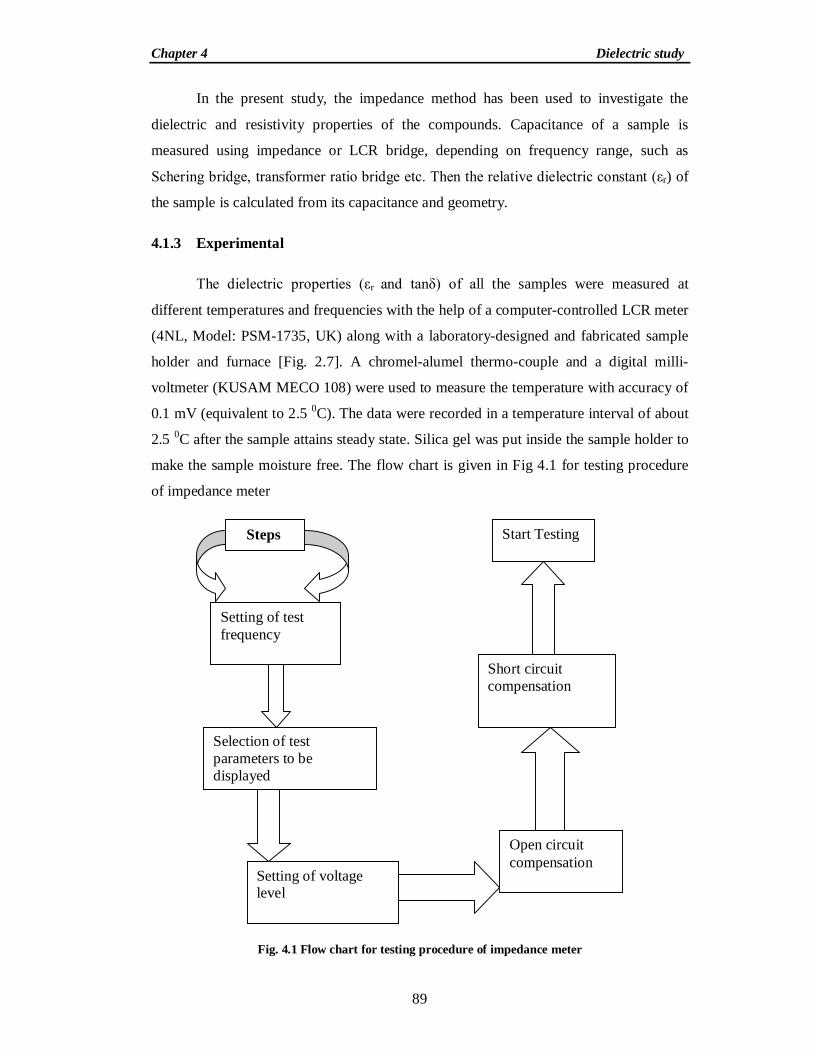
make the sample moisture free. The flow chart is given in Fig 4.1 for testing procedure
of impedance meter
Fig. 4.1 Flow chart for testing procedure of impedance meter
Setting of test frequency
Selection of test parameters to be displayed
Setting of voltage level
Open circuit compensation
Short circuit compensation
Steps Start Testing
Chapter 4 Dielectric study
90
The observations were taken for every 0.1mV (approximately 2.50C). The LCR
meter simultaneously gives number of parameters such as quality factor (Q), tanδ,
impedance (Z), phase angle (θ), parallel inductance (L), parallel capacitance (C) and
parallel resistance (R) as a function of frequency. Before taking measurements the
continuity of the silver coating and sample holder is checked. The offset voltage (the
voltage of the applied signal) and the frequency range are optimized. By varying the
variac attached to the furnace the heating rate is controlled and readings at different
temperatures are noted down. All the above parameters of each pellet sample were
recorded simultaneously as a function of frequency (1kHz to 5MHz) at different
temperatures (25- 500oC). Here, after obtaining capacitance (C), the relative dielectric
constant (r) of the material was calculated using the formula r = C/C0, where C0 is the
value of air capacitance, and is equal to ε0A/t (ε0 = 8.85x10⁻¹² F/m, A = surface area of
the sample, t = thickness of the pellet). Measurements are carried out in the frequency
range of 103 - 106 Hz, and temperature range of room temperature to about 500oC.
4.1.4 Results and discussion
Variation of relative dielectric constant (εr) and loss tangent (tanδ) with
temperature at different frequencies.
All the components of polarizations (i.e., electronic, ionic, dipolar and interfacial
polarization) are present in the audible range. In contrast to electronic and ionic
polarization, dipolar polarization occurs at lower frequencies and is thus important
because it can greatly affect the capacitive and insulating properties of glasses and
ceramics for low frequency applications. From the nature of variation of εr with
frequency, it is possible to find out the contribution of polarization predominantly
present in the compound in a particular frequency range [236]. In the frequency range
under investigation only the polar contribution to the total dielectric constant undergoes
dispersion. All the spontaneously polarized regions make a contribution to the dielectric
constant only at temperatures below the transition point. The space charge contribution
depends upon the purity and perfection of the crystal and exhibits itself prominently at
low frequencies. The increase in space charge polarization increases the value of relative
dielectric constant and loss tangent. The space charge polarization arises due to defects
and impurities present either in the bulk or at the surface of the crystal or both [237].
Generally pressed ceramic samples contain voids, grain boundaries and other defects.
Chapter 4 Dielectric study
91
0 100 200 300 400 500-10
0
10
20
30
40
50
60
70
80
(b) Ba(Bi0.5Nb0.5)O3
tan
Temperature(0C)
1kHz 10kHz 100kHz 1MHz
0 100 200 300 400 500
1000
10000
100000 (a) Ba(Bi0.5Nb0.5)O3
ln(
r)
Temperature(oC)
1kHz 10kHz 100kHz 1MHz
The value of the dielectric constant decreases with the increase in the number of voids.
The number of polarizable entities will be enhanced due to the increase in density or
packing fraction. The loss tangent in pellet samples is mostly due to the scattering
mechanism of charge carriers or defects [237]. The scattering cross section depends on
the grain size, inter grain space and grain boundaries. Since the pellets are pressed at
high pressure (4 106 N/m2) and sintered at high temperature, the packing fraction of the
pellets is high. As a result, the inter-grain space as well as the grain boundaries in the
pellet was reduced considerably by means of reducing the scattering cross section.
Hence, the tanδ decreases with increase in frequency due to the high packing fraction of
the pellet. Also, the dielectric loss decreases as the frequency of the applied ac electric
field increases because the jumping frequency of charge carriers cannot follow the
frequency of the applied field after certain frequency [238].
.
.
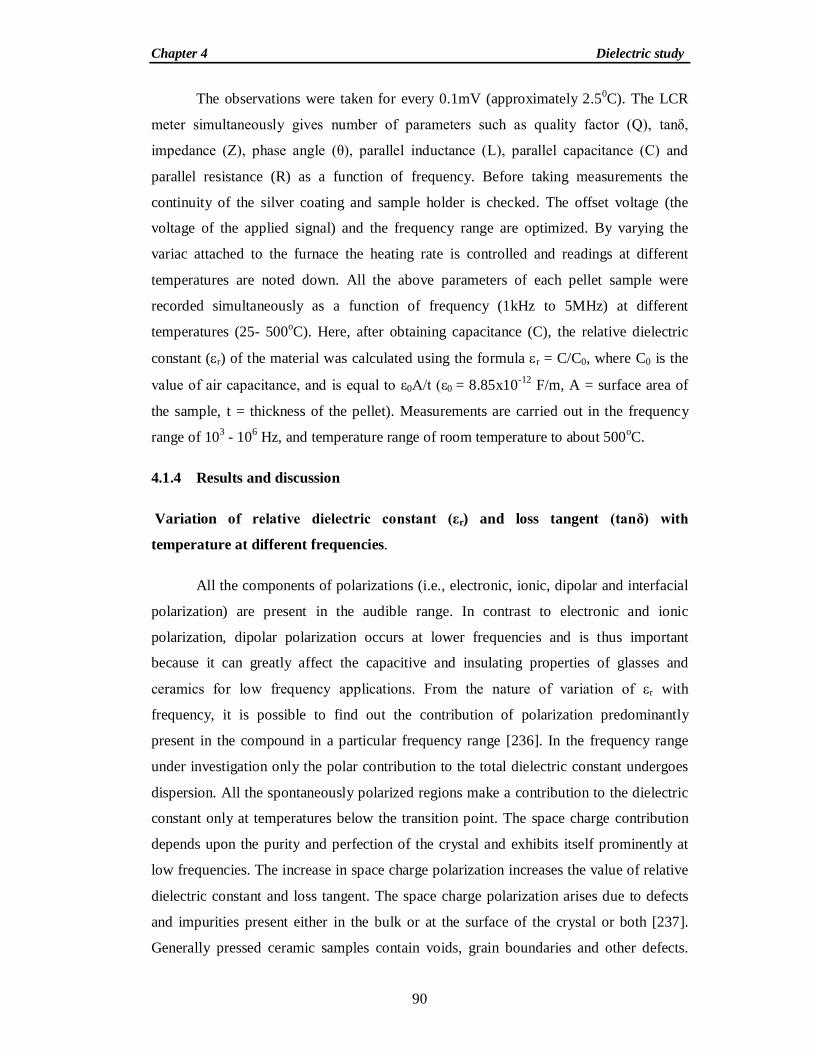
Fig. 4.2 Temperature dependence of (a) εr and (b) tanδ of Ba(Bi0.5Nb0.5)O3 at different frequencies.
Fig.4.2 shows the variation of relative dielectric constant (εr) and loss tangent
(tanδ) of Ba(Bi0.5Nb0.5)O3 with temperature at different frequencies. It is also observed
that both εr and tanδ decrease on increasing frequency, which is a general feature of
dielectric materials. Again, εr increases gradually on increasing temperature to its
maximum value (εmax) and then decreases. The increase in εr in all the samples can be
ascribed to the electron-phonon interaction. [239,240].The dielectric anomaly observed
around 3170C may be due to the ferroelectric-paraelectric phase transition [223]. Above
this anomaly further increase of εr may be considered due to space charge polarization
which comes from mobility of ions and imperfections in the material. These combined
Chapter 4 Dielectric study
92
0 100 200 300 400 500100
200
300
400
500
-5
0
5
10
15
20
25Ba(Bi0.5V0.5)O3
r
Temperature( 0C)
1kHz 10kHz 100kHz 1MHz
(a)
0 100 200 300 400 500
0
5
10
15
20
25
30(b)
Ba(Bi0.5V0.5)O3ta
n
Temperature(0C)
1kHz 10kHz 100kHz 1MHz
effects produce a sharp increase in the relative dielectric constant on increasing
temperature. Similar trend of variation is observed in tanδ (as in εr). The rate of increase
in tanδ in the material at low temperatures is slow, whereas at higher temperatures the
increase is relatively sharp. This sharp increase in tanδ at higher temperatures may be
due to scattering of thermally activated charge carriers and presence of some unknown
defects including oxygen vacancies in the sample. At higher temperatures, the
conductivity begins to dominate, which in turn, is responsible for rise in tanδ. At the
same time, the defect structure along with the presence of Nb5+ ions accounts for its high
temperature ferroelectrics [241-243]. The higher value of tanδ at high temperatures may
be due to space charge polarization and ferroelectric domain wall contributions.
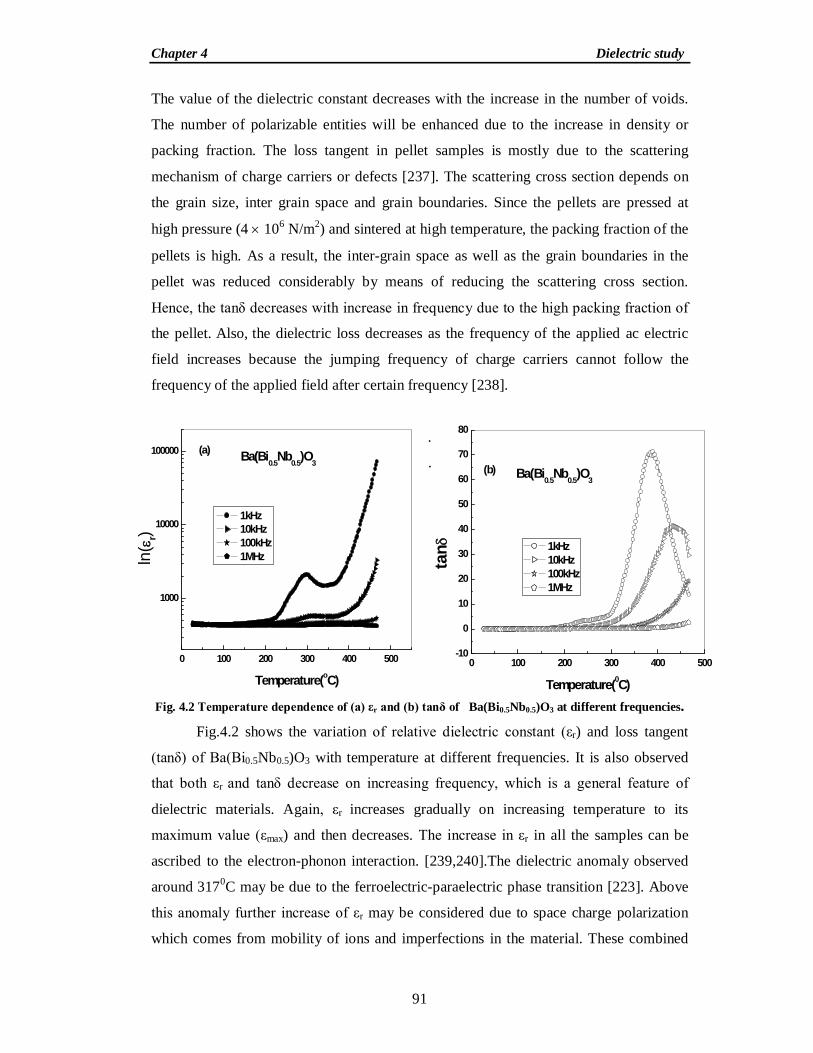
Fig. 4.3 Temperature-frequency dependence of (a) εr and (b) tanδ of Ba(Bi0.5V0.5)O3
The variation of relative dielectric constant (εr) and loss tangent (tanδ) with temperature
of Ba(Bi0.5V0.5)O3 at different frequencies is shown in Fig.4.3. The value of εr increases
on increasing temperature up to a temperature (referred as transition temperature (Tc)),
and then decreases. It is also observed that both εr and tanδ decrease on increasing
frequency, which is a general feature of dielectric materials [244]. The maximum value
of εr and tanδ decreases with rise in frequency. Such characteristic is found in a normal
ferroelectric material. Additionally, dispersion in tanδ at the higher temperatures has
been observed in the titled compound. This trend is also observed in some similar-type of
compounds [245–248]. It is associated to ionic conductivity of the material, which is
related to the loss of oxygen during high-temperature sintering. Dielectric constant
decreases with increase in frequency, which is a general characteristic of dielectric
Chapter 4 Dielectric study
93
0 100 200 300 400 500
1000
10000
(a)
Ba(Bi0.5Ta0.5)O3
ln(
r)
Temperature(0C)
1kHz 10kHz 100kHz 1MHz
0 100 200 300 400 500
0
20
40
60
(b)
Ba(Bi0.5Ta0.5)O3
tan
Temperature(0C)
1kHz 10kHz 100kHz 1MHz
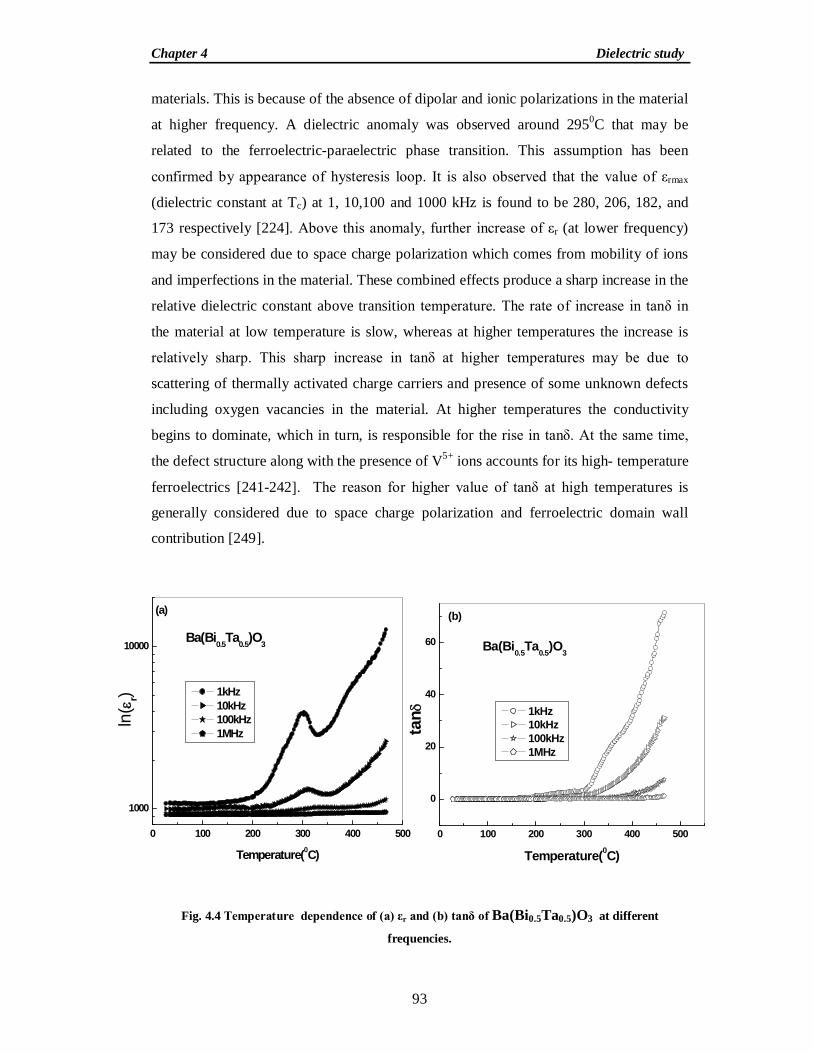
materials. This is because of the absence of dipolar and ionic polarizations in the material
at higher frequency. A dielectric anomaly was observed around 2950C that may be
related to the ferroelectric-paraelectric phase transition. This assumption has been
confirmed by appearance of hysteresis loop. It is also observed that the value of εrmax
(dielectric constant at Tc) at 1, 10,100 and 1000 kHz is found to be 280, 206, 182, and
173 respectively [224]. Above this anomaly, further increase of εr (at lower frequency)
may be considered due to space charge polarization which comes from mobility of ions
and imperfections in the material. These combined effects produce a sharp increase in the
relative dielectric constant above transition temperature. The rate of increase in tanδ in
the material at low temperature is slow, whereas at higher temperatures the increase is
relatively sharp. This sharp increase in tanδ at higher temperatures may be due to
scattering of thermally activated charge carriers and presence of some unknown defects
including oxygen vacancies in the material. At higher temperatures the conductivity
begins to dominate, which in turn, is responsible for the rise in tanδ. At the same time,
the defect structure along with the presence of V5+ ions accounts for its high- temperature
ferroelectrics [241-242]. The reason for higher value of tanδ at high temperatures is
generally considered due to space charge polarization and ferroelectric domain wall
contribution [249].
Fig. 4.4 Temperature dependence of (a) εr and (b) tanδ of Ba(Bi0.5Ta0.5)O3 at different
frequencies.
Chapter 4 Dielectric study
94
0 100 200 300 400 500
0
5
10
15 (b)Sr(Bi0.5Nb0.5)O3
tan
Temperature ( 0C)
1kHz 10kHz 100kHz 1MHz
0 100 200 300 400 500
200
400
600
800
1000(a)
Sr(Bi0.5Nb0.5)O3
1kHz 10kHz 100kHz 1MHz
r
Temperature ( 0C)
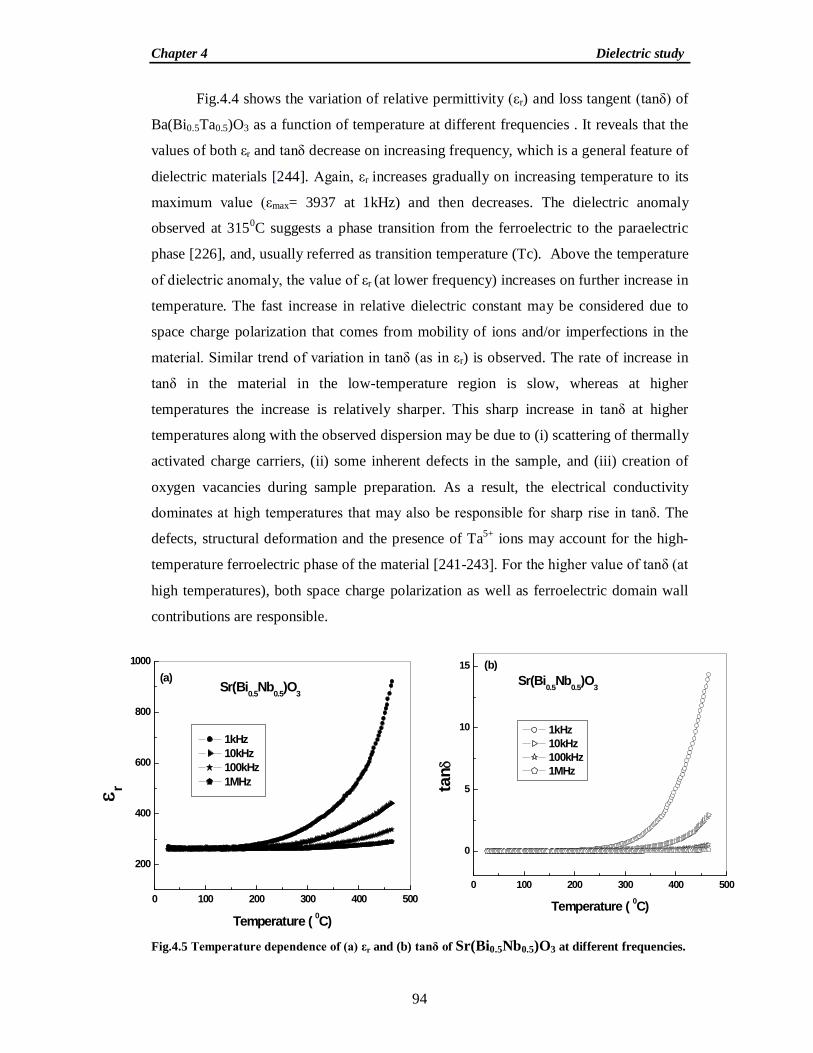
Fig.4.4 shows the variation of relative permittivity (εr) and loss tangent (tanδ) of
Ba(Bi0.5Ta0.5)O3 as a function of temperature at different frequencies . It reveals that the
values of both εr and tanδ decrease on increasing frequency, which is a general feature of
dielectric materials [244]. Again, εr increases gradually on increasing temperature to its
maximum value (εmax= 3937 at 1kHz) and then decreases. The dielectric anomaly
observed at 3150C suggests a phase transition from the ferroelectric to the paraelectric
phase [226], and, usually referred as transition temperature (Tc). Above the temperature
of dielectric anomaly, the value of εr (at lower frequency) increases on further increase in
temperature. The fast increase in relative dielectric constant may be considered due to
space charge polarization that comes from mobility of ions and/or imperfections in the
material. Similar trend of variation in tanδ (as in εr) is observed. The rate of increase in
tanδ in the material in the low-temperature region is slow, whereas at higher
temperatures the increase is relatively sharper. This sharp increase in tanδ at higher
temperatures along with the observed dispersion may be due to (i) scattering of thermally
activated charge carriers, (ii) some inherent defects in the sample, and (iii) creation of
oxygen vacancies during sample preparation. As a result, the electrical conductivity
dominates at high temperatures that may also be responsible for sharp rise in tanδ. The
defects, structural deformation and the presence of Ta5+ ions may account for the high-
temperature ferroelectric phase of the material [241-243]. For the higher value of tanδ (at
high temperatures), both space charge polarization as well as ferroelectric domain wall
contributions are responsible.
Fig.4.5 Temperature dependence of (a) εr and (b) tanδ of Sr(Bi0.5Nb0.5)O3 at different frequencies.
Chapter 4 Dielectric study
95
0 100 200 300 400 500100
200
300
400
500
600
700(a) Sr(Bi0.5V0.5)O3
0 100 200 300 400 500
0
1000
2000
3000
4000
5000
r
Temperature(0C)
1kHZ
r
Temperature(0C)
10kHZ 100kHZ 1MHZ
0 100 200 300 400 500
0
5
10
15(b)
Sr(Bi0.5V0.5)O3
tan
Temperature(0C)
1kHz 10kHz 100kHz 1MHz
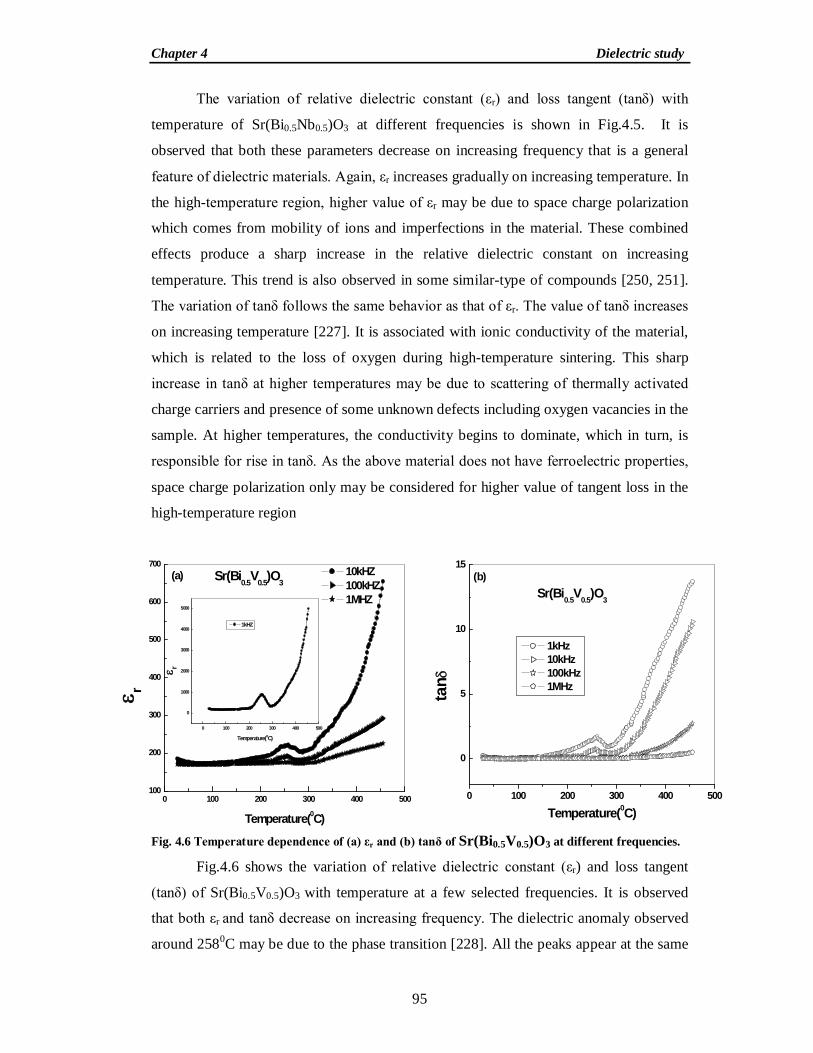
The variation of relative dielectric constant (εr) and loss tangent (tanδ) with
temperature of Sr(Bi0.5Nb0.5)O3 at different frequencies is shown in Fig.4.5. It is
observed that both these parameters decrease on increasing frequency that is a general
feature of dielectric materials. Again, εr increases gradually on increasing temperature. In
the high-temperature region, higher value of εr may be due to space charge polarization
which comes from mobility of ions and imperfections in the material. These combined
effects produce a sharp increase in the relative dielectric constant on increasing
temperature. This trend is also observed in some similar-type of compounds [250, 251].
The variation of tanδ follows the same behavior as that of εr. The value of tanδ increases
on increasing temperature [227]. It is associated with ionic conductivity of the material,
which is related to the loss of oxygen during high-temperature sintering. This sharp
increase in tanδ at higher temperatures may be due to scattering of thermally activated
charge carriers and presence of some unknown defects including oxygen vacancies in the
sample. At higher temperatures, the conductivity begins to dominate, which in turn, is
responsible for rise in tanδ. As the above material does not have ferroelectric properties,
space charge polarization only may be considered for higher value of tangent loss in the
high-temperature region
Fig. 4.6 Temperature dependence of (a) εr and (b) tanδ of Sr(Bi0.5V0.5)O3 at different frequencies.
Fig.4.6 shows the variation of relative dielectric constant (εr) and loss tangent
(tanδ) of Sr(Bi0.5V0.5)O3 with temperature at a few selected frequencies. It is observed
that both εr and tanδ decrease on increasing frequency. The dielectric anomaly observed
around 2580C may be due to the phase transition [228]. All the peaks appear at the same
Chapter 4 Dielectric study
96
0 100 200 300 400 500
300
600
900
1200
1500(a)
Sr(Bi0.5Ta0.5)O3
1kHz 10kHz 100kHz 1MHz r
Temperature ( 0C)0 100 200 300 400 500
0
5
10
15 (b)ta
n
Temperature ( 0C)
1kHz 10kHz 100kHz 1MHz
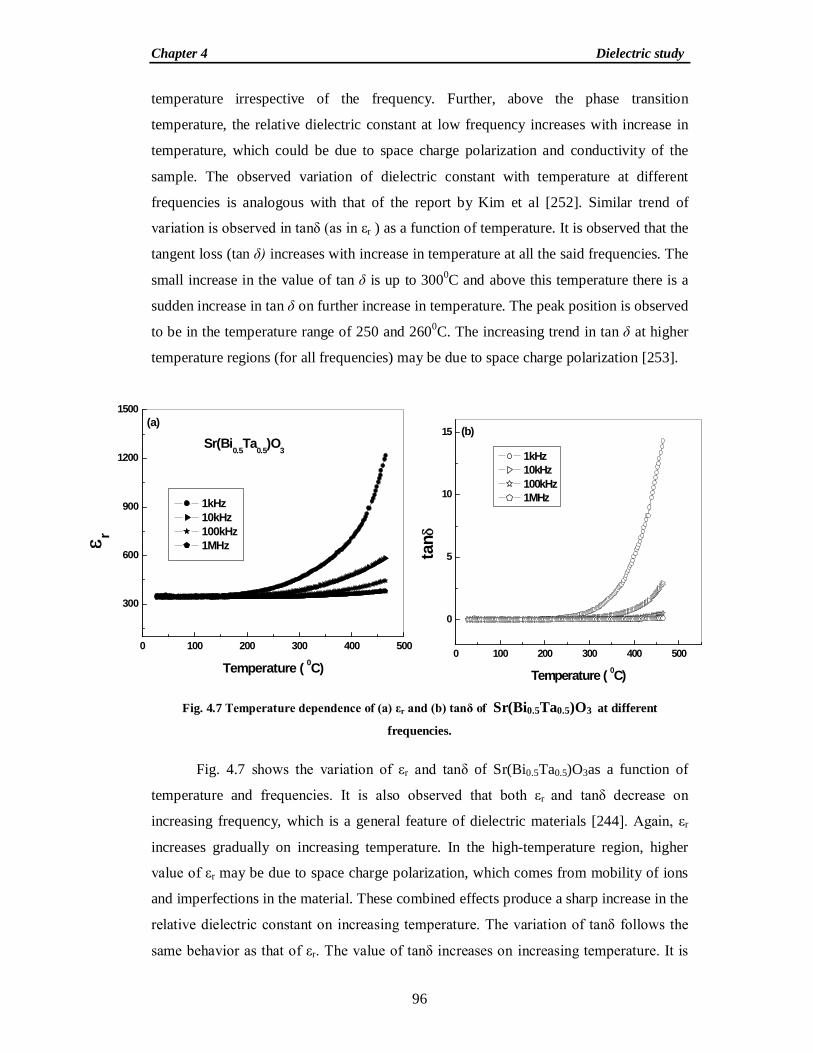
temperature irrespective of the frequency. Further, above the phase transition
temperature, the relative dielectric constant at low frequency increases with increase in
temperature, which could be due to space charge polarization and conductivity of the
sample. The observed variation of dielectric constant with temperature at different
frequencies is analogous with that of the report by Kim et al [252]. Similar trend of
variation is observed in tanδ (as in εr ) as a function of temperature. It is observed that the
tangent loss (tan δ) increases with increase in temperature at all the said frequencies. The
small increase in the value of tan δ is up to 3000C and above this temperature there is a
sudden increase in tan δ on further increase in temperature. The peak position is observed
to be in the temperature range of 250 and 2600C. The increasing trend in tan δ at higher
temperature regions (for all frequencies) may be due to space charge polarization [253].
Fig. 4.7 Temperature dependence of (a) εr and (b) tanδ of Sr(Bi0.5Ta0.5)O3 at different
frequencies.
Fig. 4.7 shows the variation of εr and tanδ of Sr(Bi0.5Ta0.5)O3as a function of
temperature and frequencies. It is also observed that both εr and tanδ decrease on
increasing frequency, which is a general feature of dielectric materials [244]. Again, εr
increases gradually on increasing temperature. In the high-temperature region, higher
value of εr may be due to space charge polarization, which comes from mobility of ions
and imperfections in the material. These combined effects produce a sharp increase in the
relative dielectric constant on increasing temperature. The variation of tanδ follows the
same behavior as that of εr. The value of tanδ increases on increasing temperature. It is
Chapter 4 Dielectric study
97
associated to ionic conductivity of the material, which is related to the loss of oxygen
during high-temperature sintering. This sharp increase in tanδ at higher temperatures
may be due to scattering of thermally activated charge carriers and presence of some
unknown defects including oxygen vacancies in the sample. At higher temperatures the
conductivity begins to dominate, which in turn, is responsible for rise in tanδ.
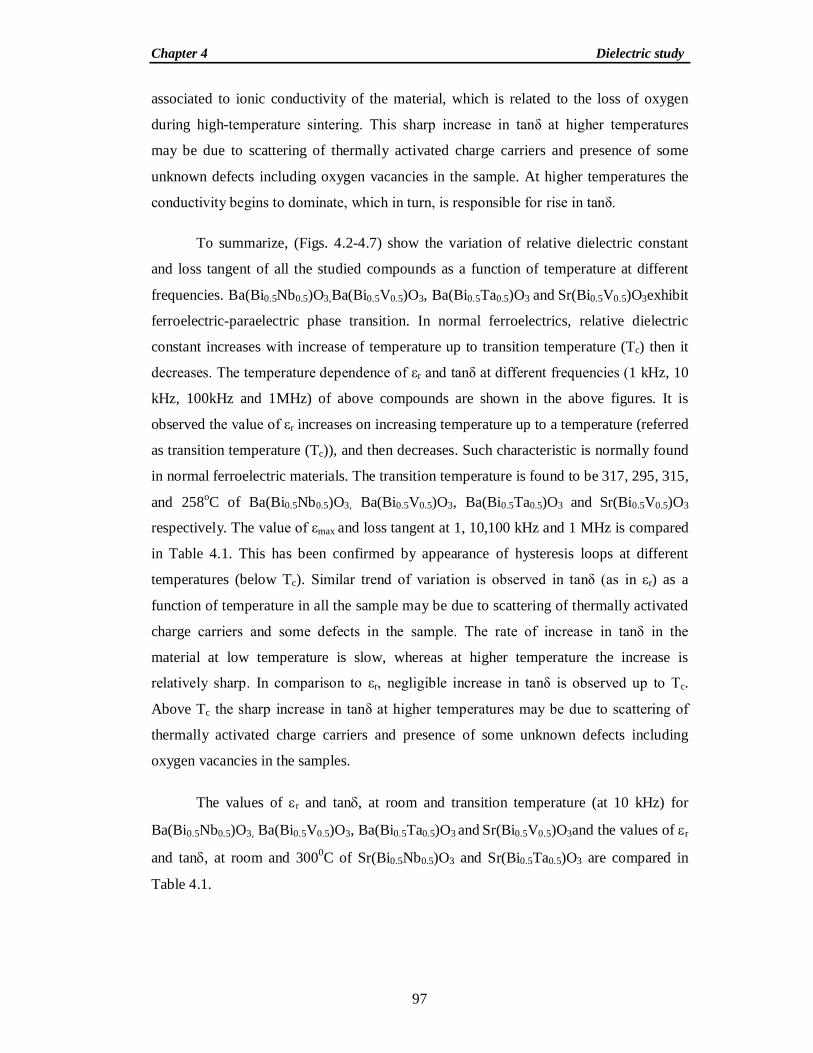
To summarize, (Figs. 4.2-4.7) show the variation of relative dielectric constant
and loss tangent of all the studied compounds as a function of temperature at different
frequencies. Ba(Bi0.5Nb0.5)O3,Ba(Bi0.5V0.5)O3, Ba(Bi0.5Ta0.5)O3 and Sr(Bi0.5V0.5)O3exhibit
ferroelectric-paraelectric phase transition. In normal ferroelectrics, relative dielectric
constant increases with increase of temperature up to transition temperature (Tc) then it
decreases. The temperature dependence of εr and tanδ at different frequencies (1 kHz, 10
kHz, 100kHz and 1MHz) of above compounds are shown in the above figures. It is
observed the value of εr increases on increasing temperature up to a temperature (referred
as transition temperature (Tc)), and then decreases. Such characteristic is normally found
in normal ferroelectric materials. The transition temperature is found to be 317, 295, 315,
and 258oC of Ba(Bi0.5Nb0.5)O3, Ba(Bi0.5V0.5)O3, Ba(Bi0.5Ta0.5)O3 and Sr(Bi0.5V0.5)O3
respectively. The value of εmax and loss tangent at 1, 10,100 kHz and 1 MHz is compared
in Table 4.1. This has been confirmed by appearance of hysteresis loops at different
temperatures (below Tc). Similar trend of variation is observed in tanδ (as in εr) as a
function of temperature in all the sample may be due to scattering of thermally activated
charge carriers and some defects in the sample. The rate of increase in tanδ in the
material at low temperature is slow, whereas at higher temperature the increase is
relatively sharp. In comparison to εr, negligible increase in tanδ is observed up to Tc.
Above Tc the sharp increase in tanδ at higher temperatures may be due to scattering of
thermally activated charge carriers and presence of some unknown defects including
oxygen vacancies in the samples.
The values of r and tan, at room and transition temperature (at 10 kHz) for
Ba(Bi0.5Nb0.5)O3, Ba(Bi0.5V0.5)O3, Ba(Bi0.5Ta0.5)O3 and Sr(Bi0.5V0.5)O3and the values of r
and tan, at room and 3000C of Sr(Bi0.5Nb0.5)O3 and Sr(Bi0.5Ta0.5)O3 are compared in
Table 4.1.
Chapter 4 Dielectric study
98
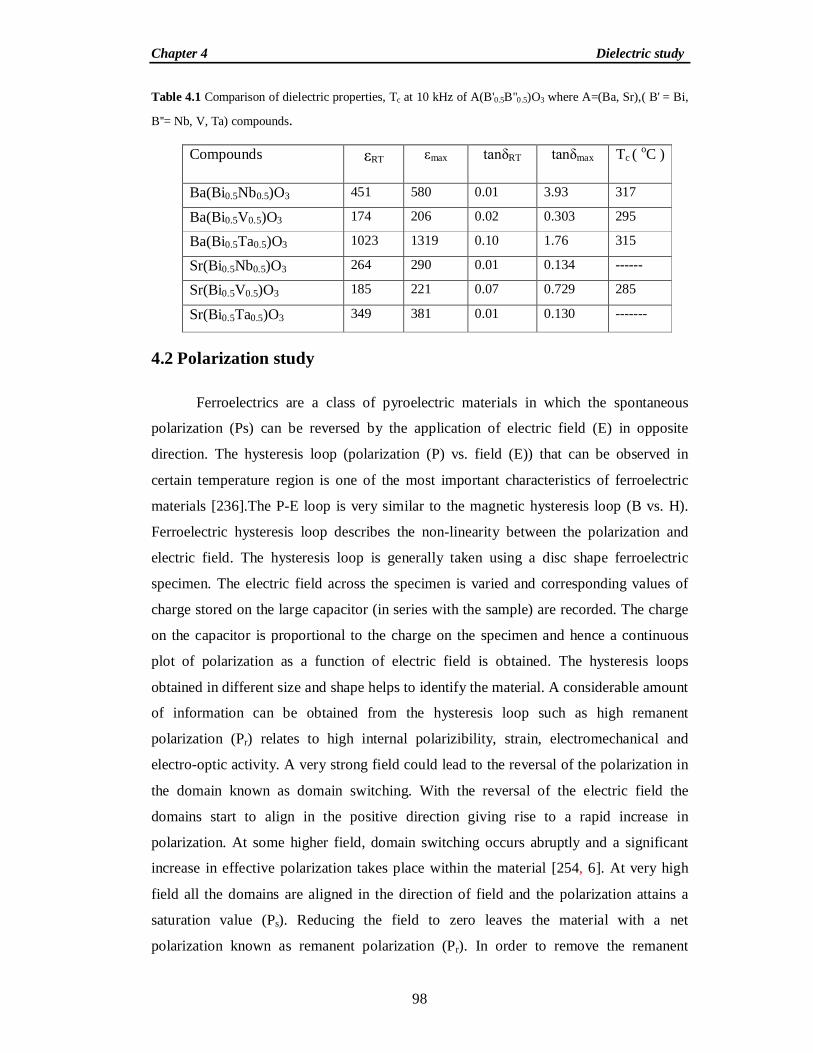
Table 4.1 Comparison of dielectric properties, Tc at 10 kHz of A(B'0.5B''0.5)O3 where A=(Ba, Sr),( B' = Bi,
B''= Nb, V, Ta) compounds.
Compounds εRT εmax tanδRT tanδmax Tc ( oC )
Ba(Bi0.5Nb0.5)O3 451 580 0.01 3.93 317
Ba(Bi0.5V0.5)O3 174 206 0.02 0.303 295
Ba(Bi0.5Ta0.5)O3 1023 1319 0.10 1.76 315
Sr(Bi0.5Nb0.5)O3 264 290 0.01 0.134 ------
Sr(Bi0.5V0.5)O3 185 221 0.07 0.729 285
Sr(Bi0.5Ta0.5)O3 349 381 0.01 0.130 -------
4.2 Polarization study
Ferroelectrics are a class of pyroelectric materials in which the spontaneous
polarization (Ps) can be reversed by the application of electric field (E) in opposite
direction. The hysteresis loop (polarization (P) vs. field (E)) that can be observed in
certain temperature region is one of the most important characteristics of ferroelectric
materials [236].The P-E loop is very similar to the magnetic hysteresis loop (B vs. H).
Ferroelectric hysteresis loop describes the non-linearity between the polarization and
electric field. The hysteresis loop is generally taken using a disc shape ferroelectric
specimen. The electric field across the specimen is varied and corresponding values of
charge stored on the large capacitor (in series with the sample) are recorded. The charge
on the capacitor is proportional to the charge on the specimen and hence a continuous
plot of polarization as a function of electric field is obtained. The hysteresis loops
obtained in different size and shape helps to identify the material. A considerable amount
of information can be obtained from the hysteresis loop such as high remanent
polarization (Pr) relates to high internal polarizibility, strain, electromechanical and
electro-optic activity. A very strong field could lead to the reversal of the polarization in
the domain known as domain switching. With the reversal of the electric field the
domains start to align in the positive direction giving rise to a rapid increase in
polarization. At some higher field, domain switching occurs abruptly and a significant
increase in effective polarization takes place within the material [254, 6]. At very high
field all the domains are aligned in the direction of field and the polarization attains a
saturation value (Ps). Reducing the field to zero leaves the material with a net
polarization known as remanent polarization (Pr). In order to remove the remanent
Chapter 4 Dielectric study
99
polarization a minimum field in opposite direction is to be applied. This field is termed
as coercive field Ec. At full reversal field, the final Ps will have in magnitude equal to the
original field Ps but opposite in sign. If the field increases to a more negative value, the
direction of polarization flips and hence hysteresis loop is obtained. The value of Ps is
obtained by extrapolating the curve onto the polarization axis. The hysteresis thus
observed is a function of the work required to displace the domain walls and is closely
related to the defect distribution in the crystal and to the energy barrier separating the
different orientation states. When the Ec value is large the loop is of square-type and the
material is useful for memory applications. When temperature increases the area of the
loop decreases and becomes a straight line at Curie temperature (Tc). Thus the prominent
features of ferroelectric properties are hysteresis and nonlinearity in the relation between
polarization and electric field.
4.2.1Brief Review of the previous work:
In 1920, Valasek discovered that the polarization of Rochelle salt could be
reversed by an externally applied electric field. From the nature of loop Valasek [4]
recognized the similarities between the dielectric properties of Rochelle salt and
ferromagnetic properties of iron. Literature survey reveals that some authors have
reported regarding the nature of hysteresis loop in the similar type compounds. Rehring
et al. [255] reported the polarization BZT-O4.5 and BZT-O5.0 crystals oriented along the
psuedocubic <100> as a function of electric field at room temperature. The compounds
have remanent polarization (Pr) and coercive fields (Ec) of approximately 13 C/cm2 and
1 kV/cm respectively. Z.Yu et al. [256] reported the polarization hysteresis loops of
Ba(Ti0.7Zr0.3)O3 at low temperature and observed near square P-E loops with high
remanent polarizations (Pr =10C /cm2 at 175 K). From the above information it appears
that no work has been done on polarization behavior of the proposed compounds as a
function of electric field and temperature. In view of the above, we have carried out the
polarization study of a few compounds under present study.
4.2.2 Experimental
The polarization is defined as the electric dipole moment per unit volume, which
can be obtained from hysteresis loop parameters. Before tracing the hysteresis loops the
ferroelectric materials are poled by applying an electric field. Poling is done to align the
Chapter 4 Dielectric study
100
randomly oriented electric dipoles in a specified direction. The process of poling of
ferroelectrics is to switch reverse domains below Tc with higher electric fields than
coercive field. The hysteresis loop of the sample was obtained on the poled (for 24 h in
the silicon oil shown in Fig. 2.9) samples. The DC poling unit consists of a regulated
power supply, sample holder immersed in silicon oil and a small furnace. After poling in
controlled environment and with an optimized electric field for sufficiently long
duration, the hysteresis loops were obtained at room temperature using a P-E loop tracer
(M/s Marine India, New Delhi) (Fig. 2.10). The P-E loop tracer consists of a computer-
controlled regulated power supply, sample holder immersed in silicon oil and a small
furnace. For the initialization, the sample thickness, area, tentative resistance and
capacitance of the sample, and a tentative field is applied. By permutation and
combination of sample capacitance and resistance, applied filed strength and frequency
the loops are optimized at room temperature.
4.2.3 Results and discussion
As mentioned earlier, the non-linear relationship between P and E (hysteresis
loop) is one of the essential characteristics of a ferroelectric material. Since the ceramics
samples of this family have dielectric breakdown at low electric field, the saturation
polarization could not be obtained with the given field; but due to the fixture
arrangement inside the P-E loop tracer .we have measured polarization of our samples of
different thickness and area. The dielectric anomaly in the studied compounds was
assumed to be related to the ferroelectric-paraelectric phase transition. This assumption
was confirmed by appearance of hysteresis loop. The room temperature hysteresis loops
of the samples are shown in Figs.4.8-4.11.Remanent polarization (i.e., 2Pr) of all the
samples at different electric field is shown in Table 4.2.
Chapter 4 Dielectric study
101
-0.4 -0.3 -0.2 -0.1 0.0 0.1 0.2 0.3 0.4-1.5
-1.0
-0.5
0.0
0.5
1.0 Ba(Bi0.5Nb0.5)O3
P r(C/
cm2 )
E(kV/cm)
30oC
-0.4 -0.3 -0.2 -0.1 0.0 0.1 0.2 0.3 0.4-1.8
-1.2
-0.6
0.0
0.6
1.2
Ba(Bi0.5V0.5)O3
P r(C/
cm2 )
E(kV/cm)
30oC
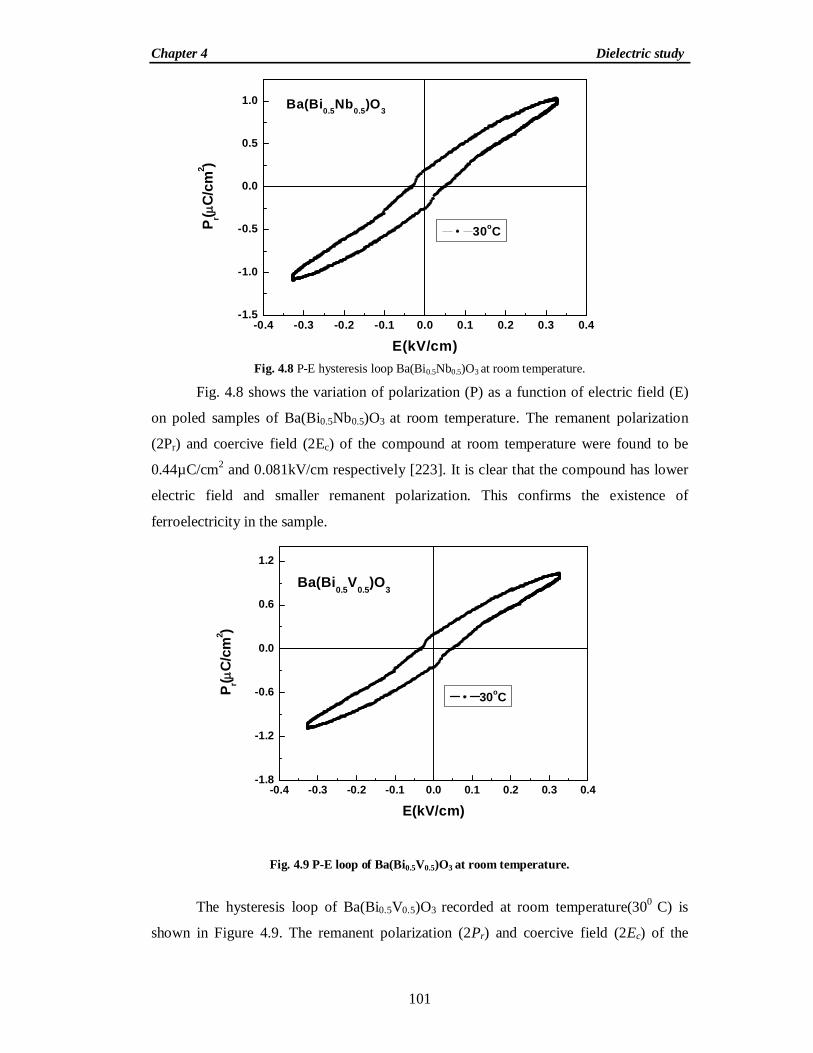
Fig. 4.8 P-E hysteresis loop Ba(Bi0.5Nb0.5)O3 at room temperature.
Fig. 4.8 shows the variation of polarization (P) as a function of electric field (E)
on poled samples of Ba(Bi0.5Nb0.5)O3 at room temperature. The remanent polarization
(2Pr) and coercive field (2Ec) of the compound at room temperature were found to be
0.44µC/cm2 and 0.081kV/cm respectively [223]. It is clear that the compound has lower
electric field and smaller remanent polarization. This confirms the existence of
ferroelectricity in the sample.
Fig. 4.9 P-E loop of Ba(Bi0.5V0.5)O3 at room temperature.
The hysteresis loop of Ba(Bi0.5V0.5)O3 recorded at room temperature(300 C) is
shown in Figure 4.9. The remanent polarization (2Pr) and coercive field (2Ec) of the

Chapter 4 Dielectric study
102
-0.20 -0.15 -0.10 -0.05 0.00 0.05 0.10 0.15-20
-15
-10
-5
0
5
10
15
20
Ba(Bi0.5Ta0.5)O 3P(C
/cm
2 )
E(kV/cm)
300C
-0.3 -0.2 -0.1 0.0 0.1 0.2 0.3-1.8
-1.2
-0.6
0.0
0.6
1.2
1.8Sr(Bi0.5V0.5)O3
P r(C
/cm
2 )
E(kV/cm)
300C
compound at 30oC are 0.43µC/cm2 and 0.081kV/cm respectively [224]. However, even
with smaller remanent polarization, the existence of ferroelectric properties in the
compound can be concluded.
Fig. 4.10 P-E hysteresis loop Ba(Bi0.5Ta0.5)O3 at room temperature.
The hysteresis loop of Ba(Bi0.5Ta0.5)O3, recorded at room temperature(300 C), is
shown in Figure 4.10. The remanent polarization (2Pr) and coercive field (2Ec) of the
compound at 30oC are 8.13µC/cm2 and 0.078kV/cm respectively. It is observed from the
loop compound is lossy in nature [226]. The observed hysteresis loop confirms the
existence of ferroelectric properties in the material at room temperature.
Fig. 4.11 P-E hysteresis loop Sr(Bi0.5V0.5)O3 at room temperature
Chapter 4 Dielectric study
103
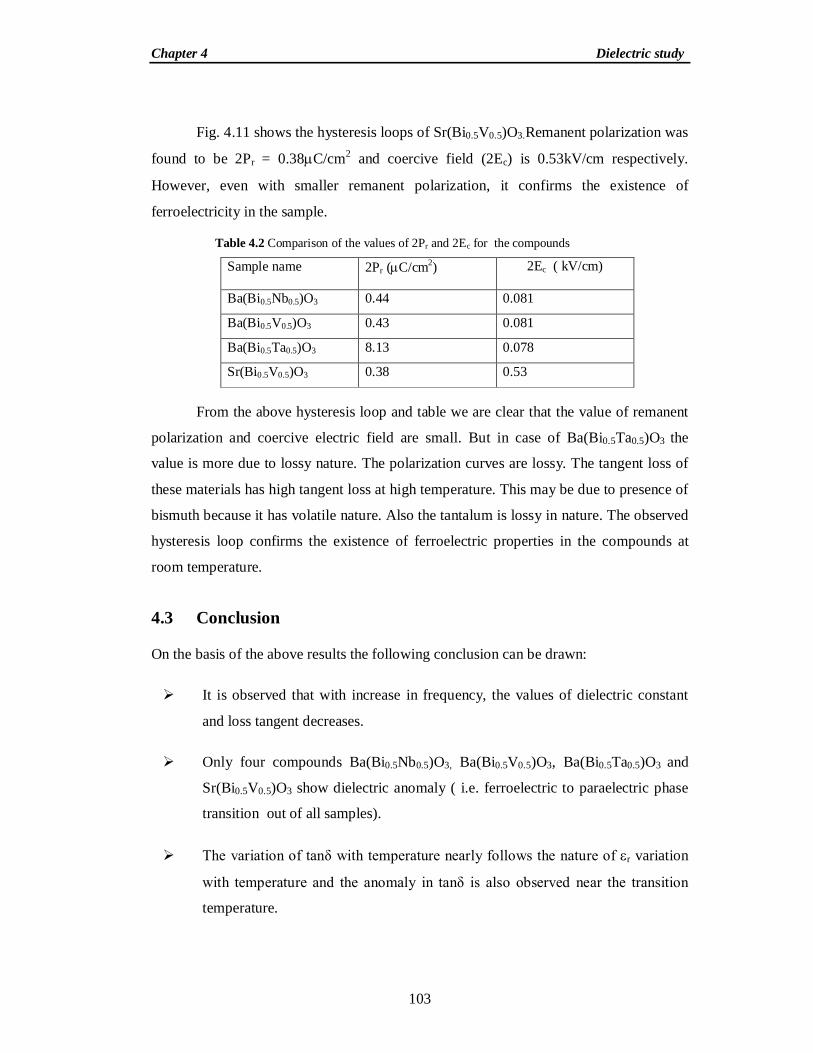
Fig. 4.11 shows the hysteresis loops of Sr(Bi0.5V0.5)O3.Remanent polarization was
found to be 2Pr = 0.38C/cm2 and coercive field (2Ec) is 0.53kV/cm respectively.
However, even with smaller remanent polarization, it confirms the existence of
ferroelectricity in the sample.
Table 4.2 Comparison of the values of 2Pr and 2Ec for the compounds
Sample name 2Pr (C/cm2) 2Ec ( kV/cm)
Ba(Bi0.5Nb0.5)O3 0.44 0.081
Ba(Bi0.5V0.5)O3 0.43 0.081
Ba(Bi0.5Ta0.5)O3 8.13 0.078
Sr(Bi0.5V0.5)O3 0.38 0.53
From the above hysteresis loop and table we are clear that the value of remanent
polarization and coercive electric field are small. But in case of Ba(Bi0.5Ta0.5)O3 the
value is more due to lossy nature. The polarization curves are lossy. The tangent loss of
these materials has high tangent loss at high temperature. This may be due to presence of
bismuth because it has volatile nature. Also the tantalum is lossy in nature. The observed
hysteresis loop confirms the existence of ferroelectric properties in the compounds at
room temperature.
4.3 Conclusion
On the basis of the above results the following conclusion can be drawn:
It is observed that with increase in frequency, the values of dielectric constant
and loss tangent decreases.
Only four compounds Ba(Bi0.5Nb0.5)O3, Ba(Bi0.5V0.5)O3, Ba(Bi0.5Ta0.5)O3 and
Sr(Bi0.5V0.5)O3 show dielectric anomaly ( i.e. ferroelectric to paraelectric phase
transition out of all samples).
The variation of tanδ with temperature nearly follows the nature of r variation
with temperature and the anomaly in tanδ is also observed near the transition
temperature.
Chapter 4 Dielectric study
104
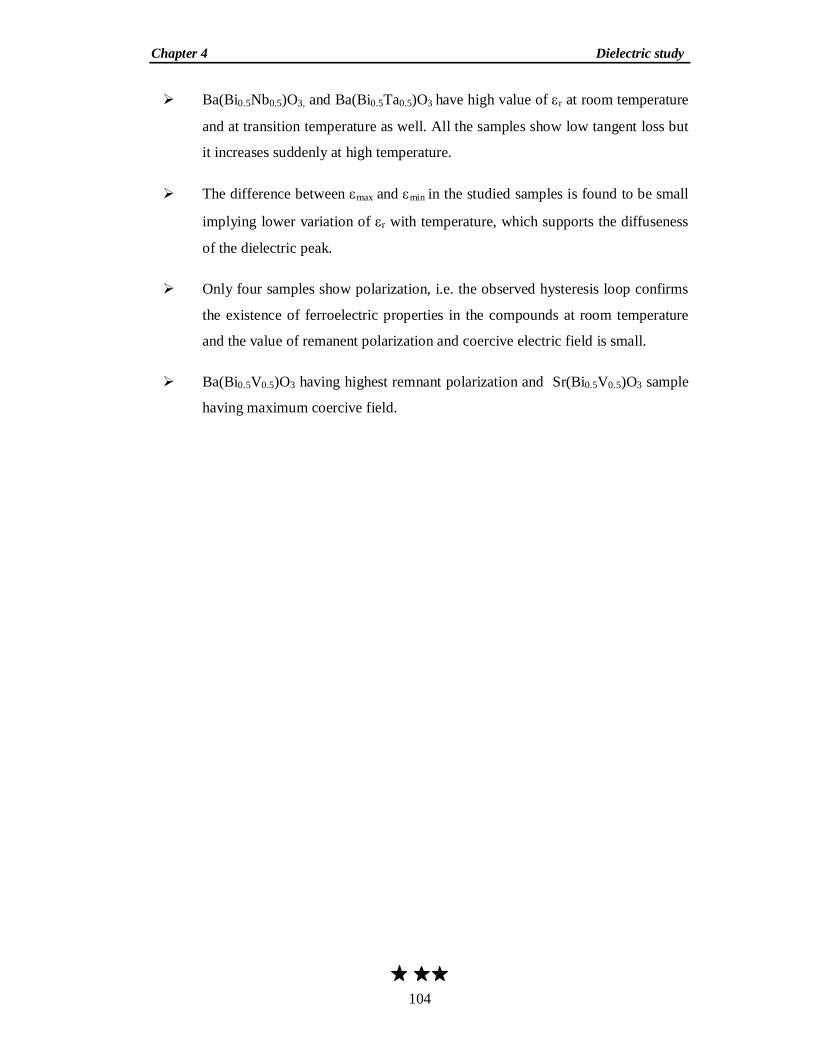
Ba(Bi0.5Nb0.5)O3, and Ba(Bi0.5Ta0.5)O3 have high value of r at room temperature
and at transition temperature as well. All the samples show low tangent loss but
it increases suddenly at high temperature.
The difference between max and min in the studied samples is found to be small
implying lower variation of r with temperature, which supports the diffuseness
of the dielectric peak.
Only four samples show polarization, i.e. the observed hysteresis loop confirms
the existence of ferroelectric properties in the compounds at room temperature
and the value of remanent polarization and coercive electric field is small.
Ba(Bi0.5V0.5)O3 having highest remnant polarization and Sr(Bi0.5V0.5)O3 sample
having maximum coercive field.


![Dielectric Materialsael.chungbuk.ac.kr/lectures/graduate/ICT융합특론/06... · 2021. 4. 10. · Fig. Dielectric materials with special effects [Kemet] 17. Dielectric material types](https://img.pdfslide.net/doc/110x75/61324899dfd10f4dd73a59aa/dielectric-oee06-2021-4-10-fig-dielectric-materials-with-special.jpg)