Embed Size (px)
Citation preview
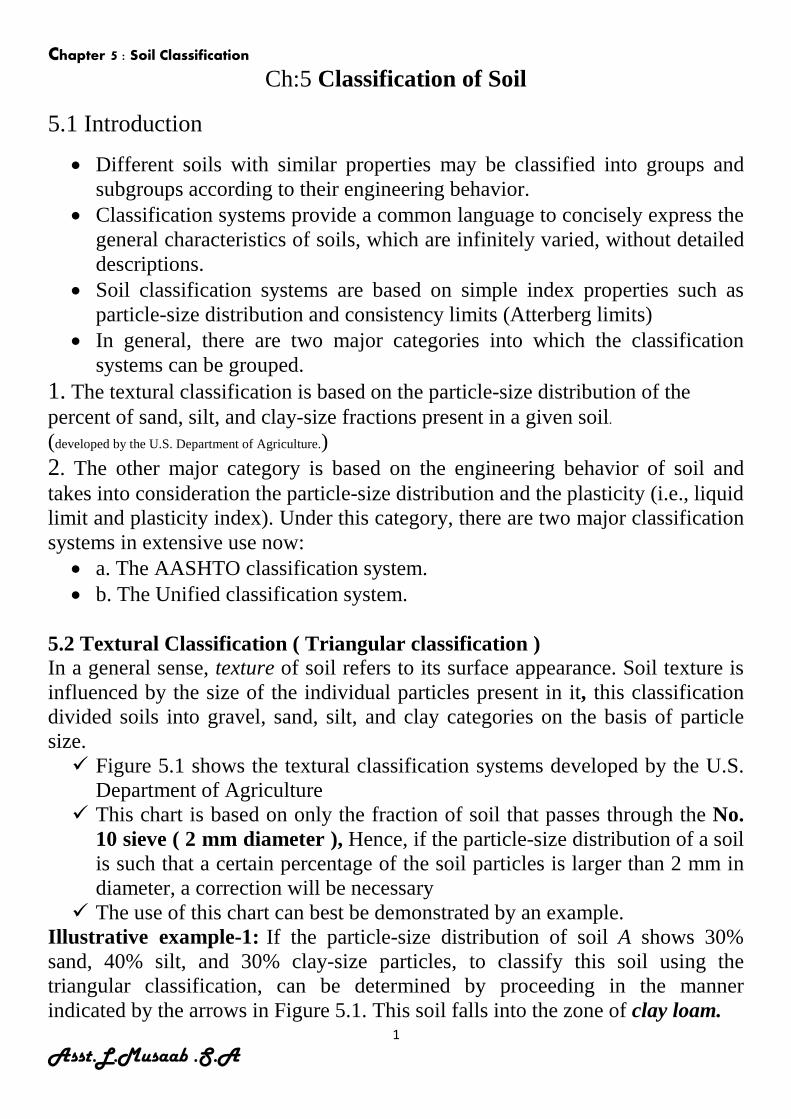
Chapter 5 : Soil Classification
1 Asst.L.Musaab .S.A
Ch:5 Classification of Soil
5.1 Introduction
• Different soils with similar properties may be classified into groups and subgroups according to their engineering behavior.
• Classification systems provide a common language to concisely express the general characteristics of soils, which are infinitely varied, without detailed descriptions.
• Soil classification systems are based on simple index properties such as particle-size distribution and consistency limits (Atterberg limits)
• In general, there are two major categories into which the classification systems can be grouped.
1. The textural classification is based on the particle-size distribution of the percent of sand, silt, and clay-size fractions present in a given soil. (developed by the U.S. Department of Agriculture.) 2. The other major category is based on the engineering behavior of soil and takes into consideration the particle-size distribution and the plasticity (i.e., liquid limit and plasticity index). Under this category, there are two major classification systems in extensive use now:
• a. The AASHTO classification system. • b. The Unified classification system.
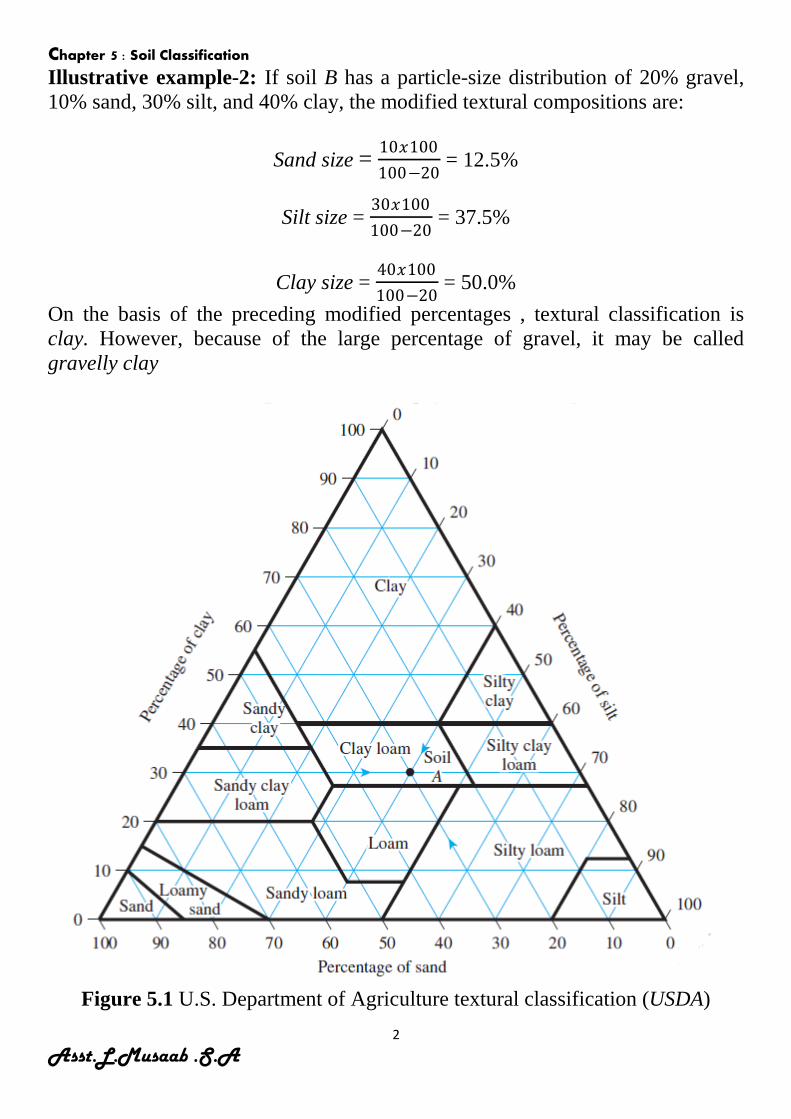
5.2 Textural Classification ( Triangular classification ) In a general sense, texture of soil refers to its surface appearance. Soil texture is influenced by the size of the individual particles present in it, this classification divided soils into gravel, sand, silt, and clay categories on the basis of particle size. Figure 5.1 shows the textural classification systems developed by the U.S.
Department of Agriculture This chart is based on only the fraction of soil that passes through the No.
10 sieve ( 2 mm diameter ), Hence, if the particle-size distribution of a soil is such that a certain percentage of the soil particles is larger than 2 mm in diameter, a correction will be necessary
The use of this chart can best be demonstrated by an example. Illustrative example-1: If the particle-size distribution of soil A shows 30% sand, 40% silt, and 30% clay-size particles, to classify this soil using the triangular classification, can be determined by proceeding in the manner indicated by the arrows in Figure 5.1. This soil falls into the zone of clay loam.
Chapter 5 : Soil Classification
2 Asst.L.Musaab .S.A
Illustrative example-2: If soil B has a particle-size distribution of 20% gravel, 10% sand, 30% silt, and 40% clay, the modified textural compositions are:
Sand size = 10𝑥𝑥100100−20
= 12.5%
Silt size = 30𝑥𝑥100100−20
= 37.5%
Clay size = 40𝑥𝑥100100−20
= 50.0% On the basis of the preceding modified percentages , textural classification is clay. However, because of the large percentage of gravel, it may be called gravelly clay
Figure 5.1 U.S. Department of Agriculture textural classification (USDA)
Chapter 5 : Soil Classification
3 Asst.L.Musaab .S.A
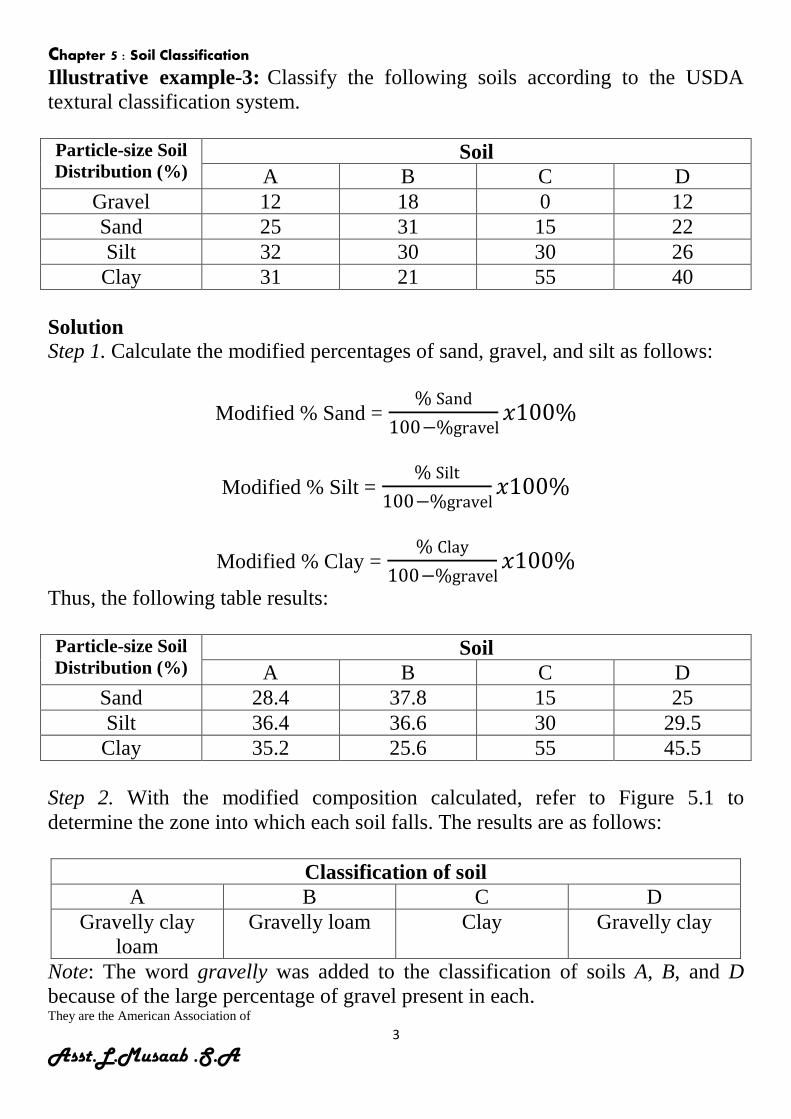
Illustrative example-3: Classify the following soils according to the USDA textural classification system.
Particle-size Soil Distribution (%)
Soil A B C D
Gravel 12 18 0 12 Sand 25 31 15 22 Silt 32 30 30 26 Clay 31 21 55 40
Solution Step 1. Calculate the modified percentages of sand, gravel, and silt as follows:
Modified % Sand = % Sand
100−%gravel𝑥𝑥100%
Modified % Silt = % Silt
100−%gravel𝑥𝑥100%
Modified % Clay = % Clay
100−%gravel𝑥𝑥100%
Thus, the following table results: Particle-size Soil Distribution (%)
Soil A B C D
Sand 28.4 37.8 15 25 Silt 36.4 36.6 30 29.5 Clay 35.2 25.6 55 45.5
Step 2. With the modified composition calculated, refer to Figure 5.1 to determine the zone into which each soil falls. The results are as follows:
Classification of soil A B C D
Gravelly clay loam
Gravelly loam Clay Gravelly clay
Note: The word gravelly was added to the classification of soils A, B, and D because of the large percentage of gravel present in each. They are the American Association of
Chapter 5 : Soil Classification
4 Asst.L.Musaab .S.A
5.3 Classification by Engineering Behavior
The textural classification of soil is relatively simple, it is based entirely on the particle-size distribution, the soils engineer must consider plasticity, so that the textural classification of soil are inadequate for most engineering purposes , Currently, two more elaborate classification systems are commonly used by soils engineers. Both systems take into consideration the particle-size distribution and Atterberg limits. They are :
• American Association of State Highway and Transportation Officials (AASHTO) classification system, The AASHTO classification system is used mostly by state and county highway departments.
• Unified Soil Classification System (USCS), Geotechnical engineers generally prefer the Unified system.
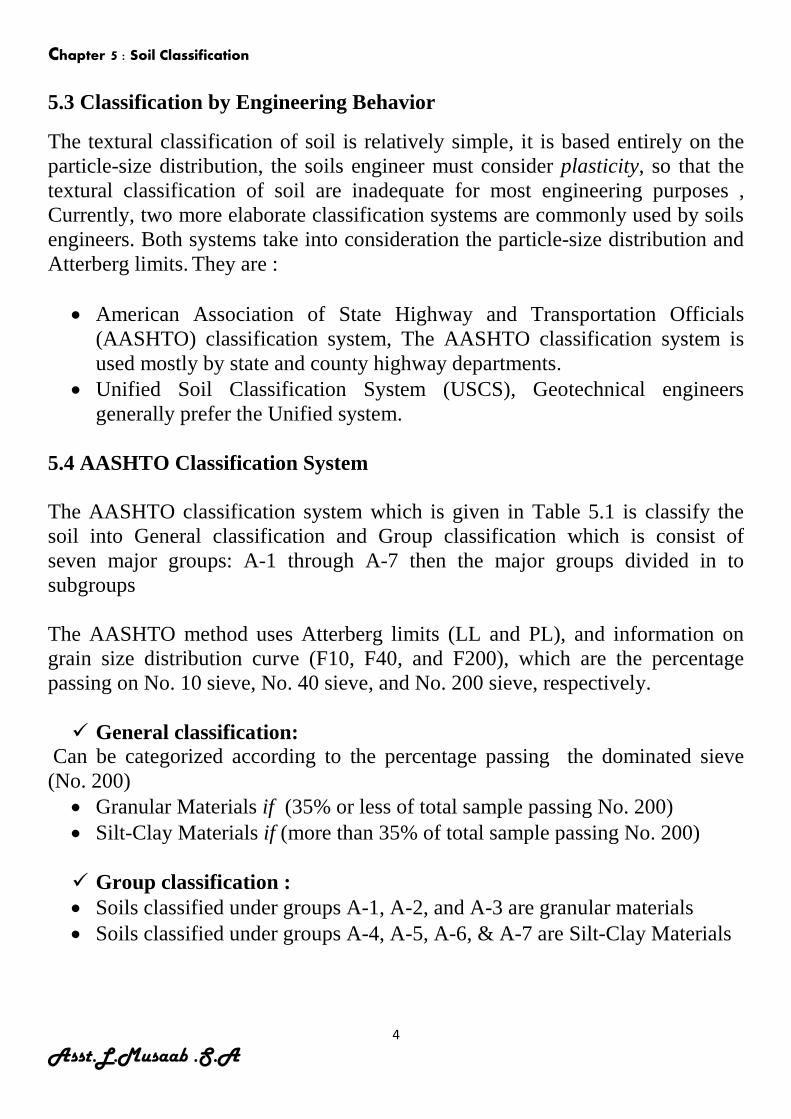
5.4 AASHTO Classification System The AASHTO classification system which is given in Table 5.1 is classify the soil into General classification and Group classification which is consist of seven major groups: A-1 through A-7 then the major groups divided in to subgroups The AASHTO method uses Atterberg limits (LL and PL), and information on grain size distribution curve (F10, F40, and F200), which are the percentage passing on No. 10 sieve, No. 40 sieve, and No. 200 sieve, respectively. General classification:
Can be categorized according to the percentage passing the dominated sieve (No. 200)
• Granular Materials if (35% or less of total sample passing No. 200) • Silt-Clay Materials if (more than 35% of total sample passing No. 200)
Group classification : • Soils classified under groups A-1, A-2, and A-3 are granular materials • Soils classified under groups A-4, A-5, A-6, & A-7 are Silt-Clay Materials
Chapter 5 : Soil Classification
5 Asst.L.Musaab .S.A
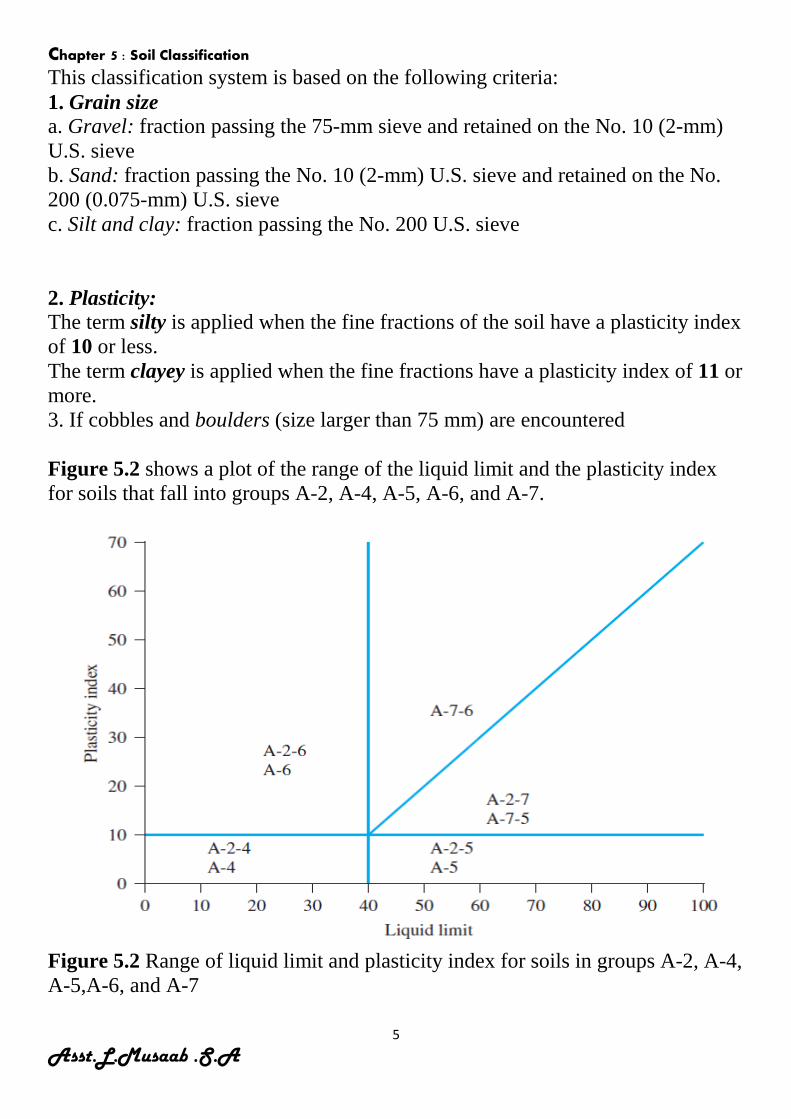
This classification system is based on the following criteria: 1. Grain size a. Gravel: fraction passing the 75-mm sieve and retained on the No. 10 (2-mm) U.S. sieve b. Sand: fraction passing the No. 10 (2-mm) U.S. sieve and retained on the No. 200 (0.075-mm) U.S. sieve c. Silt and clay: fraction passing the No. 200 U.S. sieve 2. Plasticity: The term silty is applied when the fine fractions of the soil have a plasticity index of 10 or less. The term clayey is applied when the fine fractions have a plasticity index of 11 or more. 3. If cobbles and boulders (size larger than 75 mm) are encountered Figure 5.2 shows a plot of the range of the liquid limit and the plasticity index for soils that fall into groups A-2, A-4, A-5, A-6, and A-7.
Figure 5.2 Range of liquid limit and plasticity index for soils in groups A-2, A-4, A-5,A-6, and A-7
Chapter 5 : Soil Classification
6 Asst.L.Musaab .S.A
To evaluate the quality of a soil as a highway subgrade material, one must also incorporate a number called the group index (GI) with the groups and subgroups of the soil. GI = (F200 − 35) [0.2 + 0.005(LL − 40)] + 0.01(F200 − 15)(PI − 10)....... (5.1)
There are some rules in Equation (5.1):
1. When GI is calculated as negative values, report GI = 0.
2. GI is reported in rounded integer numbers. For example, GI = 4.4 should be reported as 4 and GI = 4.5 should be reported as 5.
3. The group index of soils belonging to groups A-1-a, A-1-b, A-2-4, A-2-5, and A-3 is always 0.
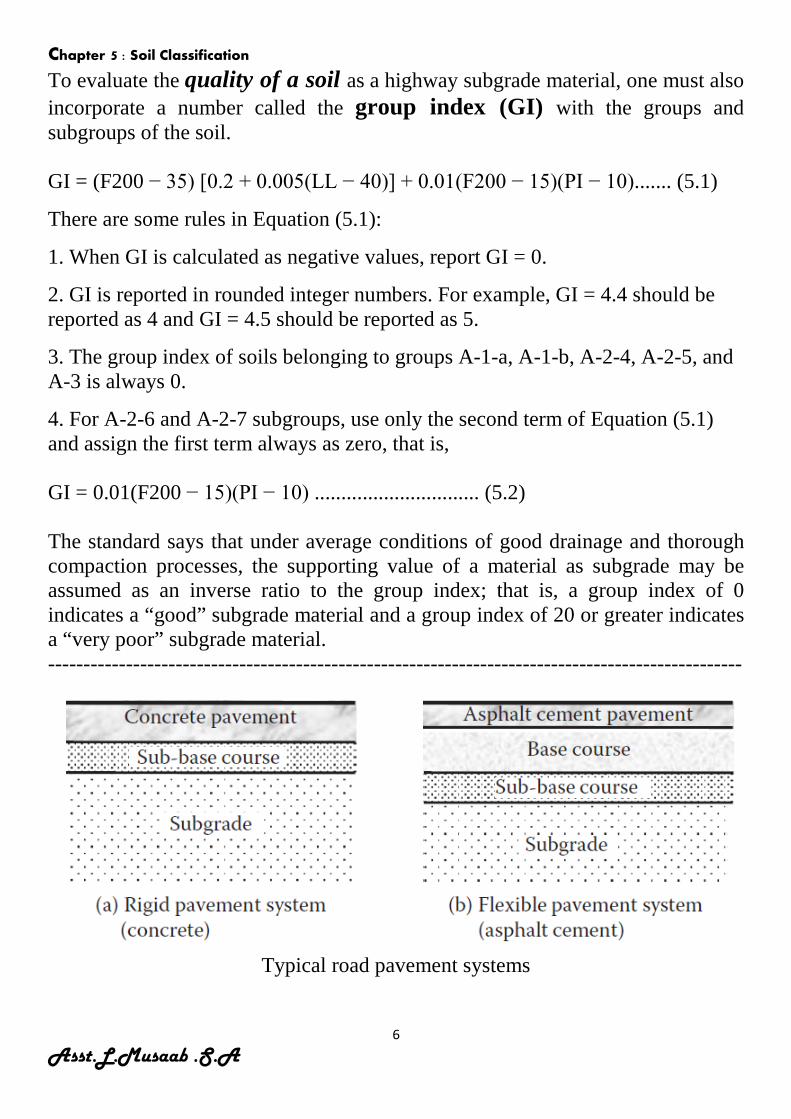
4. For A-2-6 and A-2-7 subgroups, use only the second term of Equation (5.1) and assign the first term always as zero, that is, GI = 0.01(F200 − 15)(PI − 10) ............................... (5.2) The standard says that under average conditions of good drainage and thorough compaction processes, the supporting value of a material as subgrade may be assumed as an inverse ratio to the group index; that is, a group index of 0 indicates a “good” subgrade material and a group index of 20 or greater indicates a “very poor” subgrade material. --------------------------------------------------------------------------------------------------
Typical road pavement systems
Chapter 5 : Soil Classification
7 Asst.L.Musaab .S.A
Example 1 The results of the particle-size analysis of a soil are as follows: • Percent passing the No. 10 sieve _ 42 • Percent passing the No. 40 sieve _ 35 • Percent passing the No. 200 sieve _ 20 The liquid limit and plastic limit of the minus No. 40 fraction of the soil are 25 and 20, respectively. Classify the soil by the AASHTO system. Solution Since 20% (i.e., less than 35%) of soil is passing No. 200 sieve, it is a granular soil. Hence it can be A-1, A-2, or A-3. Refer to Table 5.1. Starting from the left of the table, the soil falls under A-1-b PI=LL-PL=25-20=5<6 The group index of the soil is 0. So, the soil is A-1-b(0). -------------------------------------------------------------------------------------------------- Example 2 Ninety-five percent of a soil passes through the No. 200 sieve and has a liquid limit of 60 and plasticity index of 40. Classify the soil by the AASHTO system. Solution Ninety-five percent of the soil (which is ≥ 36%) is passing through No. 200 sieve. So it is a silty-clay material. Now refer to Table 5.1. Starting from the left of the table, it falls under A-7-6 GI = (F200 − 35) [0.2 + 0.005(LL − 40)] + 0.01(F200 − 15)(PI − 10) GI = (95 − 35) [0.2 + 0.005(60 − 40)] + 0.01(95 − 15)(40 − 10) GI =42 So, the classification is A-7-6(42).
Chapter 5 : Soil Classification
8 Asst.L.Musaab .S.A
5.5 UNIFIED SOIL CLASSIFICATION SYSTEM (USCS)
First developed by Arthur Casagrande for wartime airfield construction in 1942, This is the most widely used classification system by geotechnical engineers.
• Quick Review • The system uses six simple major symbols and four modifiers as in the
following: Major symbols: G Gravel S Sand M Silt C Clay O Organic Pt Peat Modifiers: W Well graded (for gravel and sand) P Poorly graded (for gravel and sand) H High plasticity (for silt, clay, and organic soils) L Low plasticity (for silt, clay, and organic soils)
• Classified group names are combinations of these characters—for example GP for poorly graded gravel SW for well-graded sand CH for high-plasticity clay SM for silty sand Thus; Possible group names for gravelly soils are : GW, GP, GM, and GC
Possible group names for sandy soils are : SW, SP, SM, and SC
Possible group names for silty soils are : MH and ML
Possible group names for clayey soils are : CH and CL
Possible group names for organic soils are : OH and OL
Possible group names for Peat soils are : Pt stands alone
There is other possibility of grouping for several boundary soils which is called
Chapter 5 : Soil Classification
9 Asst.L.Musaab .S.A
Dual naming , such as GW–GM for (well-graded gravel with silt)
GC–GM for (silty clayey gravel) SW–SM for (well-graded sand with silt)
• This system uses LL, PL, and PI (= LL − PL), and soils’ gradation information. First, from a grain size distribution curve
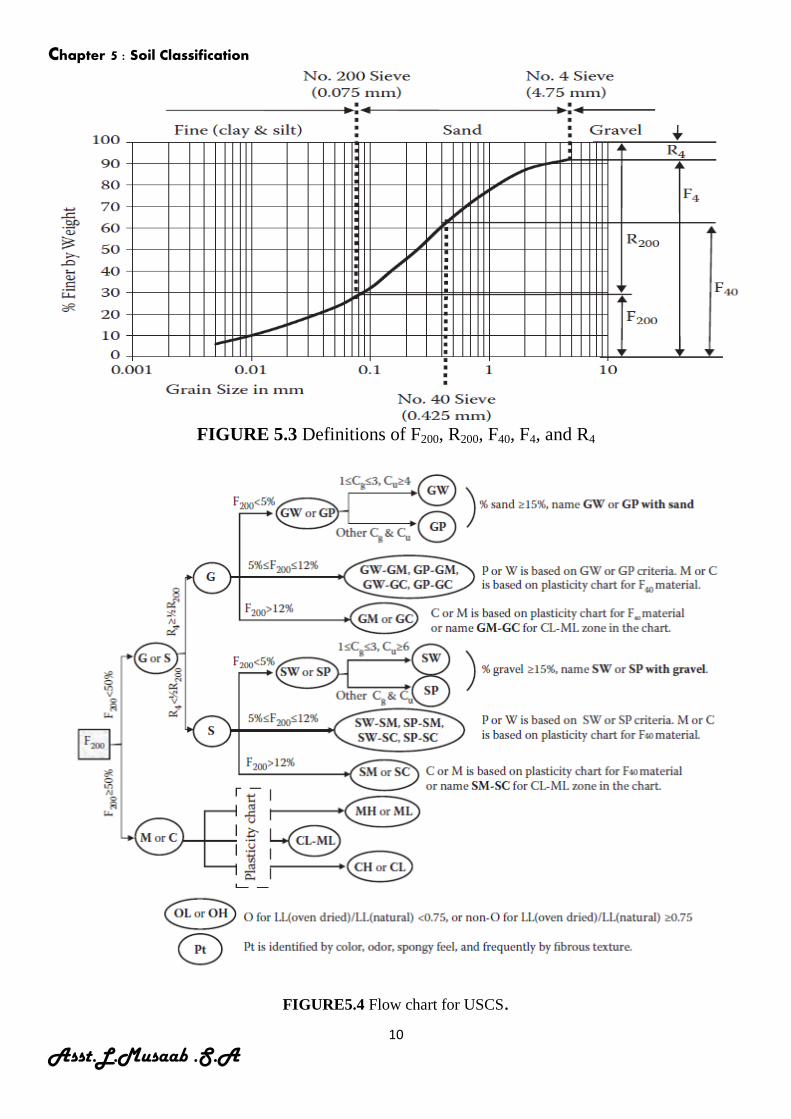
The percentages of each component are identified as shown in Figure 5.3.: gravel [d ≥ 4.75 mm], sand [4.75 mm > d > 0.075 mm], fine [d ≤ 0.075 mm] The values of F200, R200, F4, and R4 are obtained as: F200: % finer than No. 200 sieve (0.075 mm) = percentage of fine content R200: percentage retained on No. 200 sieve (0.075 mm) = percentage of sand and gravel content F4: percentage finer than No. 4 sieve (4.75 mm) = percentage of sand and fine content R4: percentage retained on No. 4 sieve (4.75 mm) = percentage of gravel content Note that in USCS, clay and silt are categorized as fine. The coefficient of uniformity Cu= (D60/D10) and the coefficient of gradation Cg= ((D30)2/(D60 × D10)) are calculated.
Chapter 5 : Soil Classification
10 Asst.L.Musaab .S.A
FIGURE 5.3 Definitions of F200, R200, F40, F4, and R4
FIGURE5.4 Flow chart for USCS.
Chapter 5 : Soil Classification
11 Asst.L.Musaab .S.A
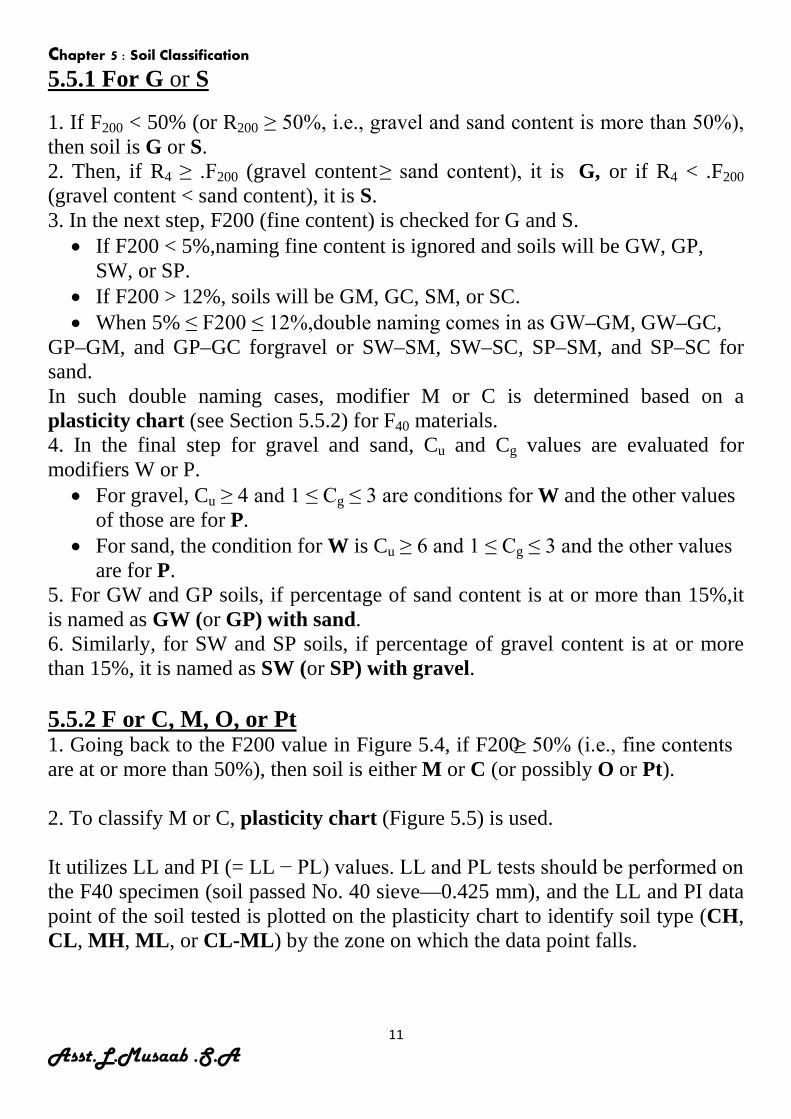
U5.5.1 For G or S
1. If F200 < 50% (or R200 ≥ 50%, i.e., gravel and sand content is more than 50%), then soil is G or S. 2. Then, if R4 ≥ .F200 (gravel content ≥ sand content), it is G, or if R4 < .F200 (gravel content < sand content), it is S. 3. In the next step, F200 (fine content) is checked for G and S.
• If F200 < 5%,naming fine content is ignored and soils will be GW, GP, SW, or SP.
• If F200 > 12%, soils will be GM, GC, SM, or SC. • When 5% ≤ F200 ≤ 12%,double naming comes in as GW–GM, GW–GC,
GP–GM, and GP–GC forgravel or SW–SM, SW–SC, SP–SM, and SP–SC for sand. In such double naming cases, modifier M or C is determined based on a plasticity chart (see Section 5.5.2) for F40 materials. 4. In the final step for gravel and sand, Cu and Cg values are evaluated for modifiers W or P.
• For gravel, Cu ≥ 4 and 1 ≤ Cg ≤ 3 are conditions for W and the other values of those are for P.
• For sand, the condition for W is Cu ≥ 6 and 1 ≤ Cg ≤ 3 and the other values are for P.
5. For GW and GP soils, if percentage of sand content is at or more than 15%,it is named as GW (or GP) with sand. 6. Similarly, for SW and SP soils, if percentage of gravel content is at or more than 15%, it is named as SW (or SP) with gravel. U5.5.2 F or C, M, O, or Pt 1. Going back to the F200 value in Figure 5.4, if F200 ≥ 50% (i.e., fine contents are at or more than 50%), then soil is either M or C (or possibly O or Pt). 2. To classify M or C, plasticity chart (Figure 5.5) is used. It utilizes LL and PI (= LL − PL) values. LL and PL tests should be performed on the F40 specimen (soil passed No. 40 sieve—0.425 mm), and the LL and PI data point of the soil tested is plotted on the plasticity chart to identify soil type (CH, CL, MH, ML, or CL-ML) by the zone on which the data point falls.
Chapter 5 : Soil Classification
12 Asst.L.Musaab .S.A
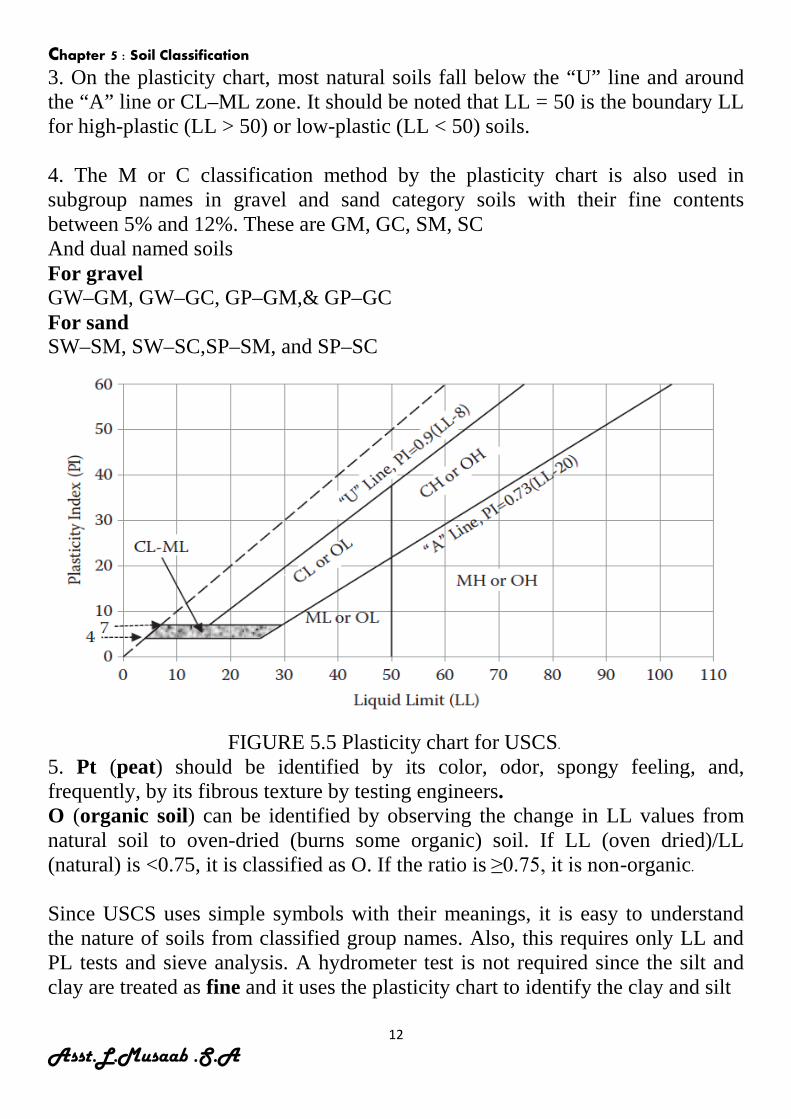
3. On the plasticity chart, most natural soils fall below the “U” line and around the “A” line or CL–ML zone. It should be noted that LL = 50 is the boundary LL for high-plastic (LL > 50) or low-plastic (LL < 50) soils. 4. The M or C classification method by the plasticity chart is also used in subgroup names in gravel and sand category soils with their fine contents between 5% and 12%. These are GM, GC, SM, SC And dual named soils For gravel GW–GM, GW–GC, GP–GM,& GP–GC For sand SW–SM, SW–SC,SP–SM, and SP–SC
FIGURE 5.5 Plasticity chart for USCS.
5. Pt (peat) should be identified by its color, odor, spongy feeling, and, frequently, by its fibrous texture by testing engineers. O (organic soil) can be identified by observing the change in LL values from natural soil to oven-dried (burns some organic) soil. If LL (oven dried)/LL (natural) is <0.75, it is classified as O. If the ratio is ≥0.75, it is non-organic. Since USCS uses simple symbols with their meanings, it is easy to understand the nature of soils from classified group names. Also, this requires only LL and PL tests and sieve analysis. A hydrometer test is not required since the silt and clay are treated as fine and it uses the plasticity chart to identify the clay and silt
Chapter 5 : Soil Classification
13 Asst.L.Musaab .S.A
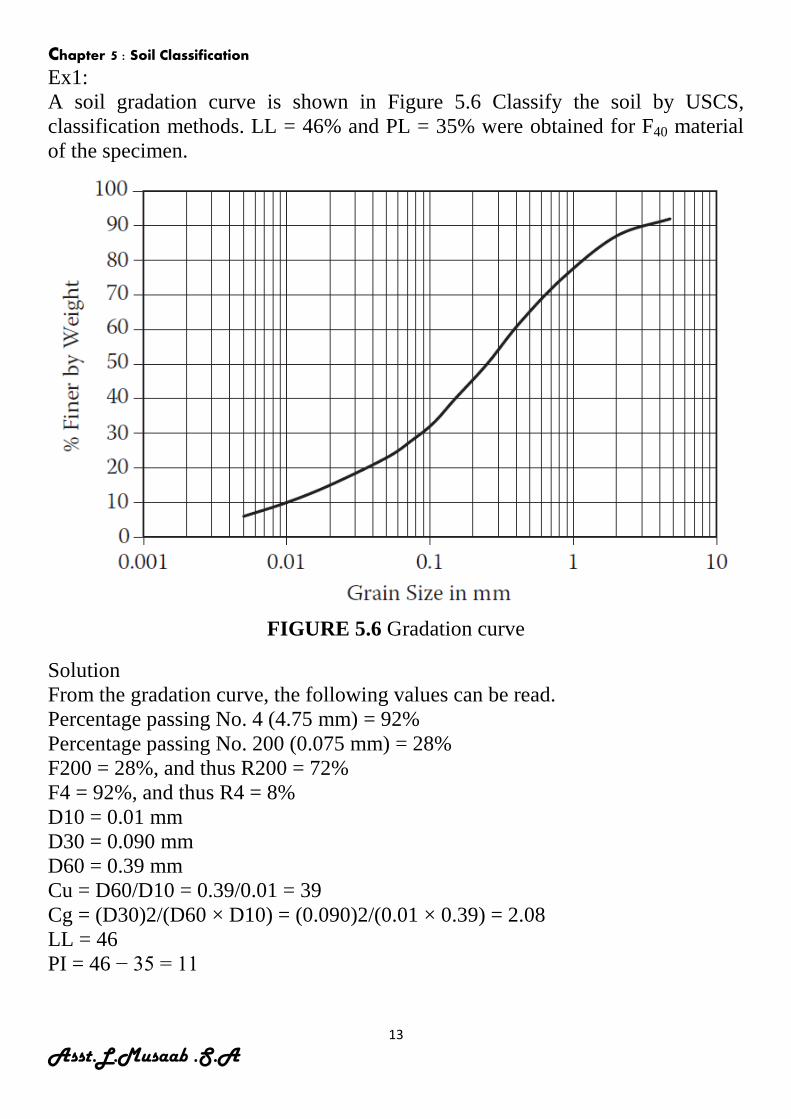
Ex1: A soil gradation curve is shown in Figure 5.6 Classify the soil by USCS, classification methods. LL = 46% and PL = 35% were obtained for F40 material of the specimen.
FIGURE 5.6 Gradation curve
Solution From the gradation curve, the following values can be read. Percentage passing No. 4 (4.75 mm) = 92% Percentage passing No. 200 (0.075 mm) = 28% F200 = 28%, and thus R200 = 72% F4 = 92%, and thus R4 = 8% D10 = 0.01 mm D30 = 0.090 mm D60 = 0.39 mm Cu = D60/D10 = 0.39/0.01 = 39 Cg = (D30)2/(D60 × D10) = (0.090)2/(0.01 × 0.39) = 2.08 LL = 46 PI = 46 − 35 = 11
Chapter 5 : Soil Classification
14 Asst.L.Musaab .S.A
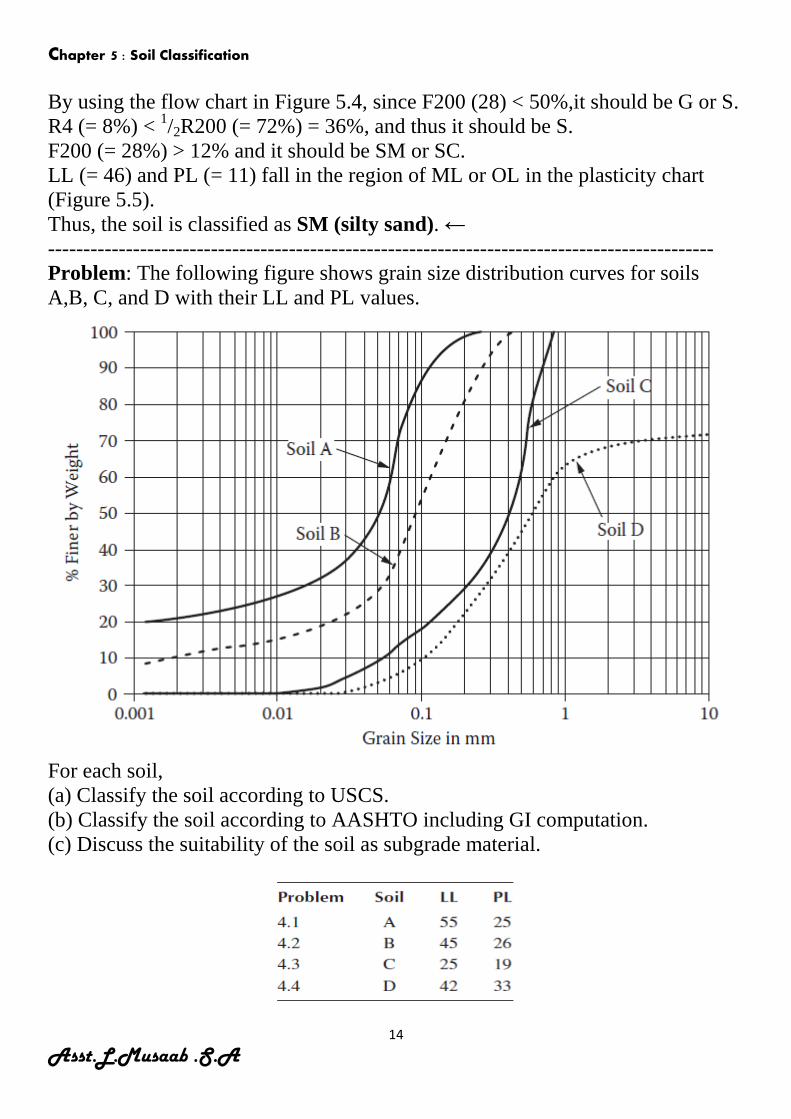
By using the flow chart in Figure 5.4, since F200 (28) < 50%,it should be G or S. R4 (= 8%) < 1/2R200 (= 72%) = 36%, and thus it should be S. F200 (= 28%) > 12% and it should be SM or SC. LL (= 46) and PL (= 11) fall in the region of ML or OL in the plasticity chart (Figure 5.5). Thus, the soil is classified as SM (silty sand). ← ---------------------------------------------------------------------------------------------- Problem: The following figure shows grain size distribution curves for soils A,B, C, and D with their LL and PL values.
For each soil, (a) Classify the soil according to USCS. (b) Classify the soil according to AASHTO including GI computation. (c) Discuss the suitability of the soil as subgrade material.