Embed Size (px)
Citation preview
-1-
Chapter I Globalization, the changing face of the East Asian economy, and prospects for
Japan
Section 1 The advance of globalization and East Asian economic development
【Key points】
1. Expansion and convergence of disparities in economic standards
The advance of globalization over the last two centuries has been accompanied by growing
disparity among national economic standards, but those states which have participated in the
globalization process have conversely demonstrated convergence. This trend can be viewed as
the formation and expansion of a “convergence club”, as it were. History reveals that as the
United Kingdom, the United States and the rest of the developed world have observed other
countries begin to catch up in the convergence process, they have instituted various reforms
aimed at sustained growth, consequently maintaining their own growth and shifting into a new
stage of development. Amid ongoing globalization, it will be vital that Japan keeps pace with
other “convergence club” members in pursuing reform toward sustained growth.
2. Advance of and background to globalization
Over the century between 1820 and the outbreak of World War I in 1914, the world
experienced its first globalization boom. Globalization was powered at the time by plummeting
transport costs and the lower tariff barriers brought about as the UK and other countries
established and maintained free trading systems.
Globalization receded over the two world wars, including the interim between them, with
various barriers erected to constrain immigration and the movement of goods and capital as the
international community split into economic blocks.
The postwar period has marked the second boom in globalization, driven this time by
dramatic advances in means of transportation and communications, the development of today’s
multilateral trading system, and systemic advances opening the way for various types of
economic partnership. Advances in air and sea transport, the creation of rail and
communications networks which are stretching to the very corners of the earth, and leaps ahead
in information technology (IT) are diversifying means of transport and pushing down
communications costs. Moreover, recognizing that the protectionism and creation of economic
blocs over the wartime period were the result of defects in the international trading and
economic systems, the international community has since worked to create sounder systems.
Trade in goods and services and foreign direct investment have consequently boomed in this
third stage.
-2-
3. Convergence and deepening relations in East Asia
For the past few decades, the economic levels of Japan and other East Asian nations have
basically continued to rise and converge. This can be seen not only in per capita GDP, but also
in the growing sophistication of economic structures. One cause of this convergence has been
the deepening of regional economic relations in terms of both trade and investment. Closer trade
relations and growing investment have promoted increasingly advanced economic structures
and horizontal regional specialization in East Asia, contributing to regional convergence and
sophistication.
Behind these deepening economic ties lies the steady growth of East Asia ’s share of world
GDP since the historical turning point which occurred around 1950. Japan needs to follow the
example of the United States and Europe in advancing economic structural reform and
transformation of the nation as a means of growing together with the rest of East Asia .
1. Expansion and convergence of disparities in economic standards
(1) International economic disparities
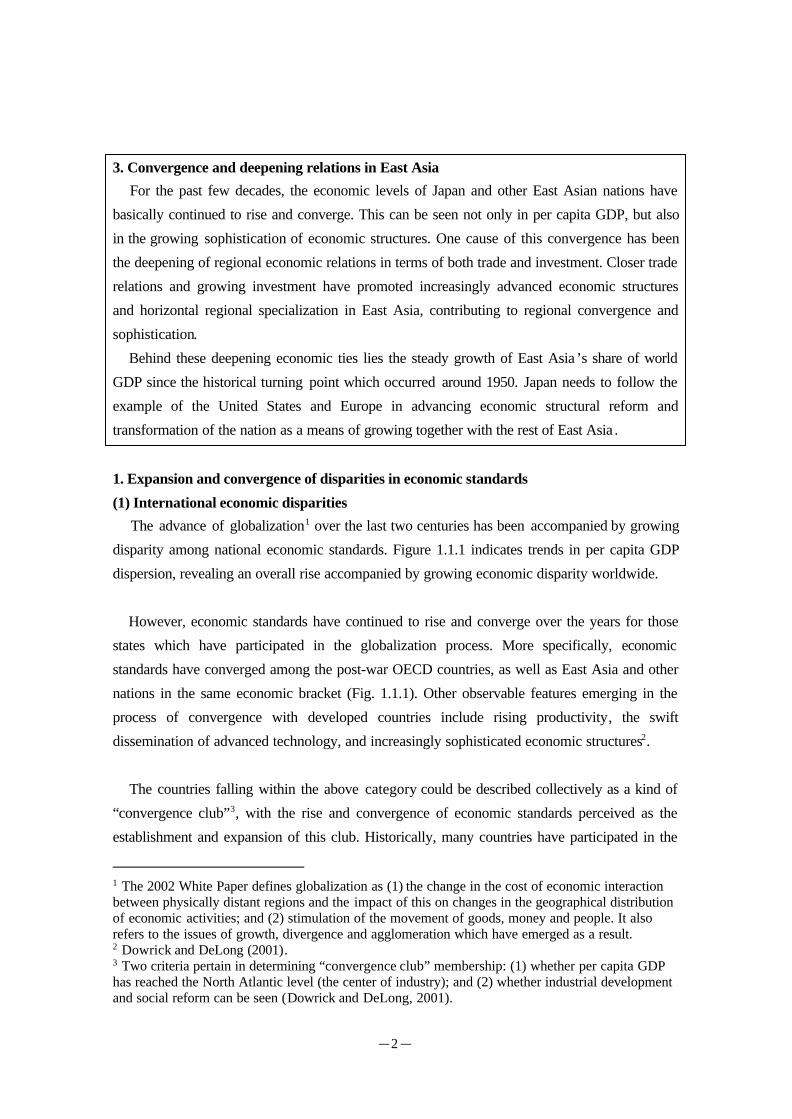
The advance of globalization1 over the last two centuries has been accompanied by growing
disparity among national economic standards. Figure 1.1.1 indicates trends in per capita GDP
dispersion, revealing an overall rise accompanied by growing economic disparity worldwide.
However, economic standards have continued to rise and converge over the years for those
states which have participated in the globalization process. More specifically, economic
standards have converged among the post-war OECD countries, as well as East Asia and other
nations in the same economic bracket (Fig. 1.1.1). Other observable features emerging in the
process of convergence with developed countries include rising productivity, the swift
dissemination of advanced technology, and increasingly sophisticated economic structures2.
The countries falling within the above category could be described collectively as a kind of
“convergence club”3, with the rise and convergence of economic standards perceived as the
establishment and expansion of this club. Historically, many countries have participated in the
1 The 2002 White Paper defines globalization as (1) the change in the cost of economic interactionbetween physically distant regions and the impact of this on changes in the geographical distributionof economic activities; and (2) stimulation of the movement of goods, money and people. It alsorefers to the issues of growth, divergence and agglomeration which have emerged as a result.2 Dowrick and DeLong (2001).3 Two criteria pertain in determining “convergence club” membership: (1) whether per capita GDPhas reached the North Atlantic level (the center of industry); and (2) whether industrial developmentand social reform can be seen (Dowrick and DeLong, 2001).
-3-
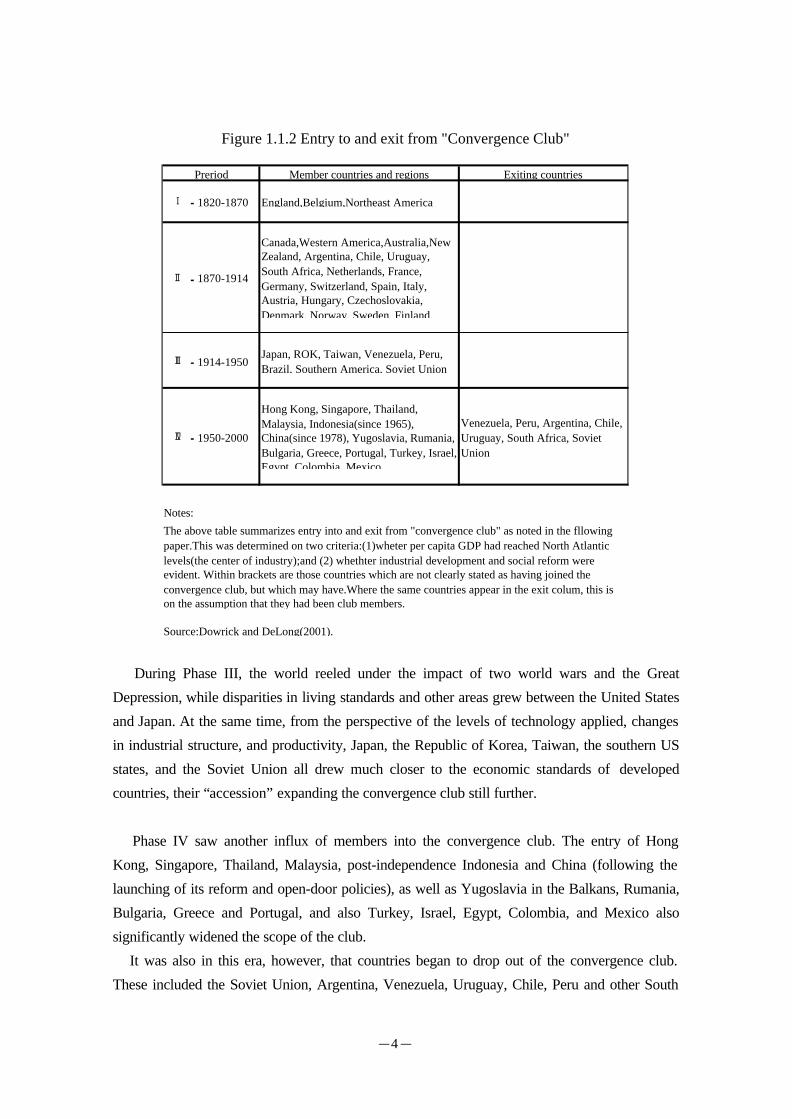
convergence club. Interestingly enough, once a country has become a member of the
convergence club, the usual pattern is to achieve high-level economic growth, reach the same
economic standards as other “member” nations, and maintain economic growth over subsequent
years. The emergence and development of the convergence club can be broadly divided into
four phases: Phase I, 1820-1870; Phase II, 1870-1913; Phase III, 1913-1950; and Phase IV,
1950-2000 (Fig. 1.1.2).
Phase I began in the United Kingdom in the wake of the Industrial Revolution. Changes in
the domestic economic structure and industrial development accelerated, while the relevant
technologies were communicated to continental Europe and North America.
In Phase II, the scope of the convergence club broadened. New members included
continental Europe, Canada, western America, Australia, New Zealand, Argentina, Chile,
Uruguay and South Africa. By adopting advanced technologies and industrialized themselves,
these countries grew swiftly to join the ranks of the developedcountries. The convergence club
stretched as far as the economies of European colonies during this period, which corresponded
with the first age of globalization discussed later.
Fig. 1.1.1 Trends in per capita GDP dispersion
0.0
0.2
0.4
0.6
0.8
1.0
1.2
1.4
1950 1955 1960 1965 1970 1975 1980 1985 1990 1995
WorldDeveloped countriesDeveloping countries“Convergence club”
Notes1. This graph shows the standard deviation of the natural logarithm for per capita GDP in respective countries (Geary Khamis (1990); expressed in dollars).2. “Developed countries” refer to OECD Development Assistance Committee members. “Developing countries” are those countries other than developed countries.3. The “Convergence Club” refers to those countries within the Stage IV category of Fig. 1.1.2. The former Communist countries are excluded.4. The analysis was conducted in regard to the 127 countries for which national data is presented in Maddison (2001). Data for the communist countries up to 1989 was taken from Maddison(1995). Because no data was given for Rumania in 1951-54 and 1956-59, while the figure for 1995 was extremely low compared to previous and subsequent years, this period was excludedfrom calculations.
Sources: The World Economy—A Millennial Perspective (Angus Maddison; 2001); Monitoring the World Economy 1820-1992 (Angus Maddison; 1995); Japan’s Official DevelopmentAssistance 2000 (Economic Cooperation Bureau, Ministry of Foreign Affairs, Japan; published by Association for Promotion of International Cooperation).
(Year)
-4-
During Phase III, the world reeled under the impact of two world wars and the Great
Depression, while disparities in living standards and other areas grew between the United States
and Japan. At the same time, from the perspective of the levels of technology applied, changes
in industrial structure, and productivity, Japan, the Republic of Korea, Taiwan, the southern US
states, and the Soviet Union all drew much closer to the economic standards of developed
countries, their “accession” expanding the convergence club still further.
Phase IV saw another influx of members into the convergence club. The entry of Hong
Kong, Singapore, Thailand, Malaysia, post-independence Indonesia and China (following the
launching of its reform and open-door policies), as well as Yugoslavia in the Balkans, Rumania,
Bulgaria, Greece and Portugal, and also Turkey, Israel, Egypt, Colombia, and Mexico also
significantly widened the scope of the club.
It was also in this era, however, that countries began to drop out of the convergence club.
These included the Soviet Union, Argentina, Venezuela, Uruguay, Chile, Peru and other South
Preriod Member countries and regions Exiting countries
Ⅰ.1820-1870 England,Belgium,Northeast America
Ⅱ.1870-1914
Canada,Western America,Australia,NewZealand, Argentina, Chile, Uruguay,South Africa, Netherlands, France,Germany, Switzerland, Spain, Italy,Austria, Hungary, Czechoslovakia,Denmark, Norway, Sweden, Finland,
Ⅲ.1914-1950Japan, ROK, Taiwan, Venezuela, Peru,Brazil, Southern America, Soviet Union
Ⅳ.1950-2000
Hong Kong, Singapore, Thailand,Malaysia, Indonesia(since 1965),China(since 1978), Yugoslavia, Rumania,Bulgaria, Greece, Portugal, Turkey, Israel,Egypt, Colombia, Mexico
Venezuela, Peru, Argentina, Chile,Uruguay, South Africa, SovietUnion
Notes:
Source:Dowrick and DeLong(2001).
Figure 1.1.2 Entry to and exit from "Convergence Club"
The above table summarizes entry into and exit from "convergence club" as noted in the fllowingpaper.This was determined on two criteria:(1)wheter per capita GDP had reached North Atlanticlevels(the center of industry);and (2) whethter industrial development and social reform wereevident. Within brackets are those countries which are not clearly stated as having joined theconvergence club, but which may have.Where the same countries appear in the exit colum, this ison the assumption that they had been club members.
-5-
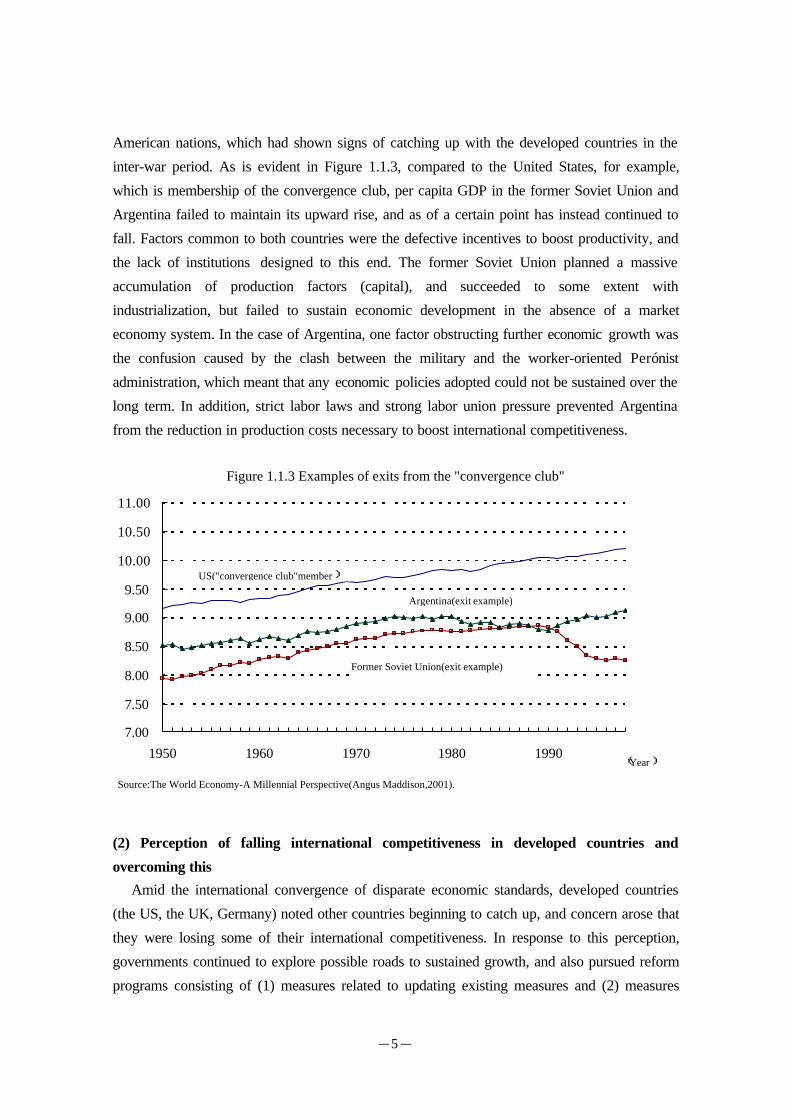
American nations, which had shown signs of catching up with the developed countries in the
inter-war period. As is evident in Figure 1.1.3, compared to the United States, for example,
which is membership of the convergence club, per capita GDP in the former Soviet Union and
Argentina failed to maintain its upward rise, and as of a certain point has instead continued to
fall. Factors common to both countries were the defective incentives to boost productivity, and
the lack of institutions designed to this end. The former Soviet Union planned a massive
accumulation of production factors (capital), and succeeded to some extent with
industrialization, but failed to sustain economic development in the absence of a market
economy system. In the case of Argentina, one factor obstructing further economic growth was
the confusion caused by the clash between the military and the worker-oriented Perónist
administration, which meant that any economic policies adopted could not be sustained over the
long term. In addition, strict labor laws and strong labor union pressure prevented Argentina
from the reduction in production costs necessary to boost international competitiveness.
(2) Perception of falling international competitiveness in developed countries and
overcoming this
Amid the international convergence of disparate economic standards, developed countries
(the US, the UK, Germany) noted other countries beginning to catch up, and concern arose that
they were losing some of their international competitiveness. In response to this perception,
governments continued to explore possible roads to sustained growth, and also pursued reform
programs consisting of (1) measures related to updating existing measures and (2) measures
Figure 1.1.3 Examples of exits from the "convergence club"
7.00
7.50
8.00
8.50
9.00
9.50
10.00
10.50
11.00
1950 1960 1970 1980 1990
US("convergence club"member)
Argentina(exit example)
Former Soviet Union(exit example)
(Year)
Source:The World Economy-A Millennial Perspective(Angus Maddison,2001).
-6-
designed to boost regional economic autonomy4. The former included changes to legal and tax
systems, deregulation, privatization of state-owned enterprises, the introduction of greater
flexibility into the labor market, and improvement of education and job training. The latter
comprised a paradigm shift from the idea of all countries introducing the same measures to a
new focus on measures utilizing “local power”—in other words, reflecting the nature of the
local economy in promoting R&D and forming industrial agglomerations.
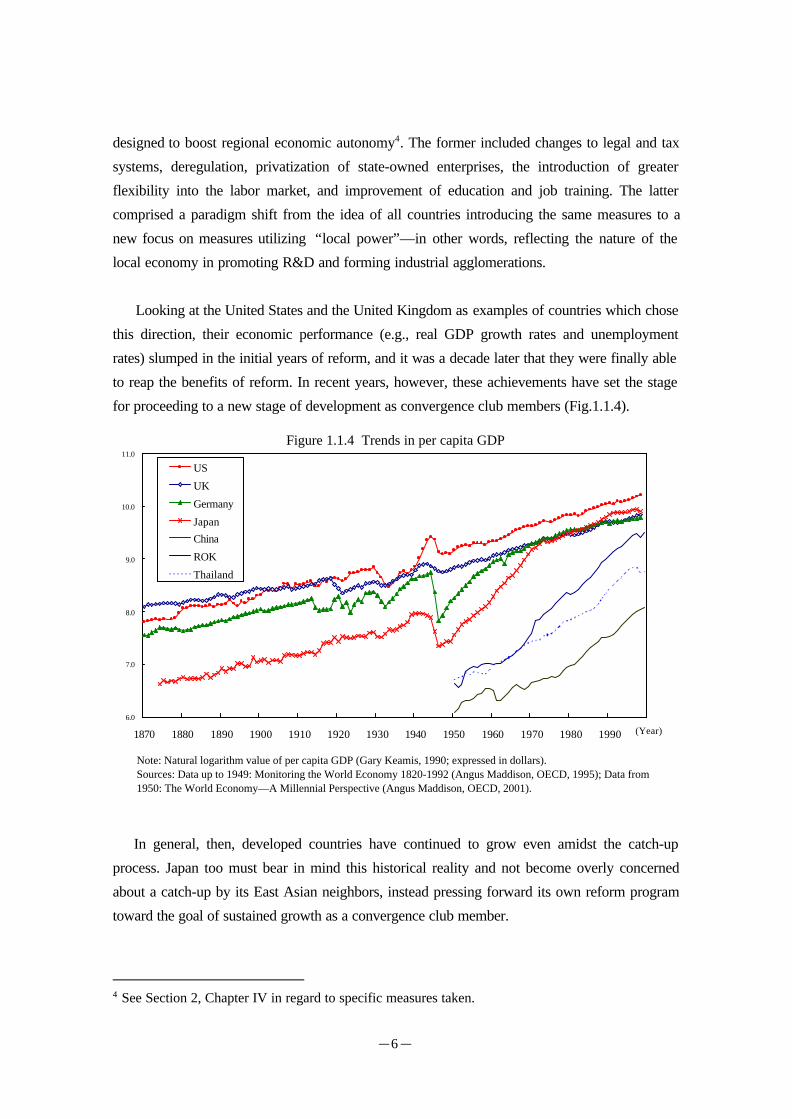
Looking at the United States and the United Kingdom as examples of countries which chose
this direction, their economic performance (e.g., real GDP growth rates and unemployment
rates) slumped in the initial years of reform, and it was a decade later that they were finally able
to reap the benefits of reform. In recent years, however, these achievements have set the stage
for proceeding to a new stage of development as convergence club members (Fig.1.1.4).
In general, then, developed countries have continued to grow even amidst the catch-up
process. Japan too must bear in mind this historical reality and not become overly concerned
about a catch-up by its East Asian neighbors, instead pressing forward its own reform program
toward the goal of sustained growth as a convergence club member.
4 See Section 2, Chapter IV in regard to specific measures taken.
Figure 1.1.4 Trends in per capita GDP
6.0
7.0
8.0
9.0
10.0
11.0
1870 1880 1890 1900 1910 1920 1930 1940 1950 1960 1970 1980 1990
US
UK
Germany
Japan
China
ROK
Thailand
Note: Natural logarithm value of per capita GDP (Gary Keamis, 1990; expressed in dollars).Sources: Data up to 1949: Monitoring the World Economy 1820-1992 (Angus Maddison, OECD, 1995); Data from1950: The World Economy—A Millennial Perspective (Angus Maddison, OECD, 2001).
(Year)
-7-
2. Advance of and background to globalization
The development of globalization traces back over roughly two centuries, which in a “boom
and bust” sense can be divided into three broad phases. The first phase, the first age of
globalization, occurred over the century between 1820 and the outbreak of World War I in 1914.
The second phase was the retrogression embracing the two world wars. The third phase
comprises the post-war years, which ushered in a second age of globalization which has
continued through to the present day.
(1) Phase 1: First age of globalization (1820s-1914)
During this phase, globalization was powered by technological innovation and international
cooperation in the reduction of tariff barriers. The United Kingdom led the way in instituting
and maintaining a free trade system, a stance which it maintained despite protectionist trends
emerging in the 1870s in continental Europe and the United States, the latter just a rising nation
at the time.
(a) Technological innovations in communications and transportation
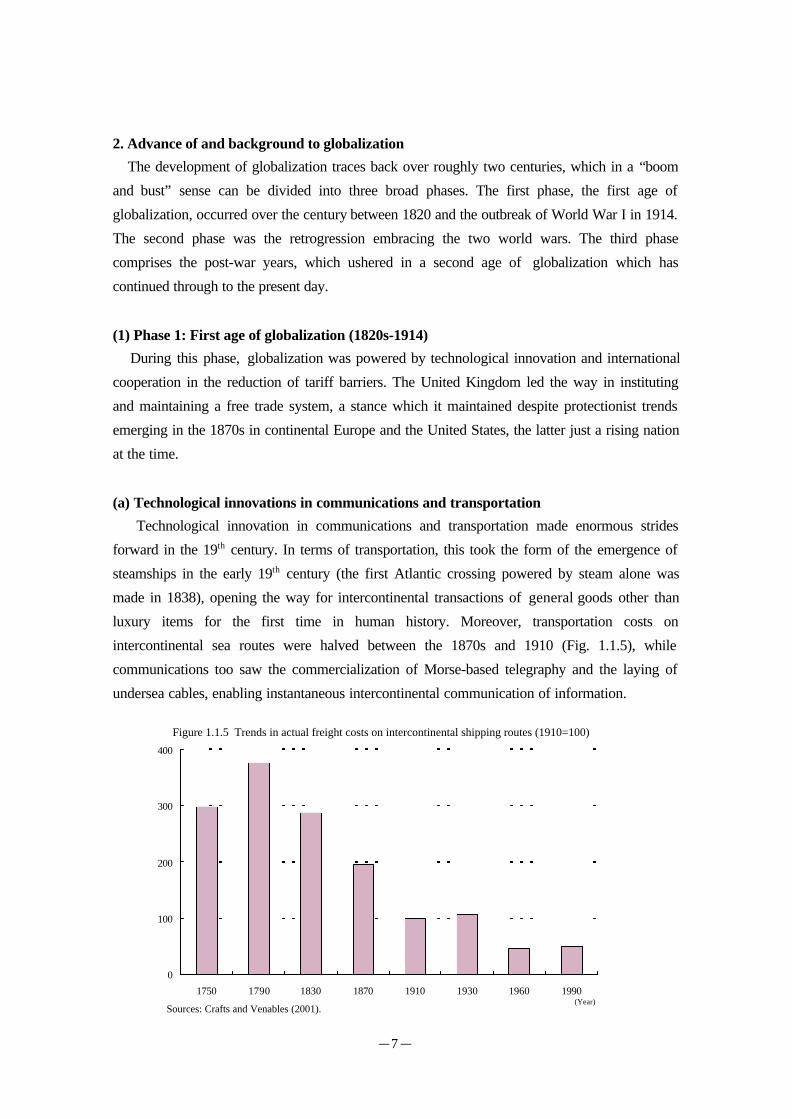
Technological innovation in communications and transportation made enormous strides
forward in the 19th century. In terms of transportation, this took the form of the emergence of
steamships in the early 19th century (the first Atlantic crossing powered by steam alone was
made in 1838), opening the way for intercontinental transactions of general goods other than
luxury items for the first time in human history. Moreover, transportation costs on
intercontinental sea routes were halved between the 1870s and 1910 (Fig. 1.1.5), while
communications too saw the commercialization of Morse-based telegraphy and the laying of
undersea cables, enabling instantaneous intercontinental communication of information.
0
100
200
300
400
1750 1790 1830 1870 1910 1930 1960 1990
Sources: Crafts and Venables (2001).(Year)
Figure 1.1.5 Trends in actual freight costs on intercontinental shipping routes (1910=100)
-8-
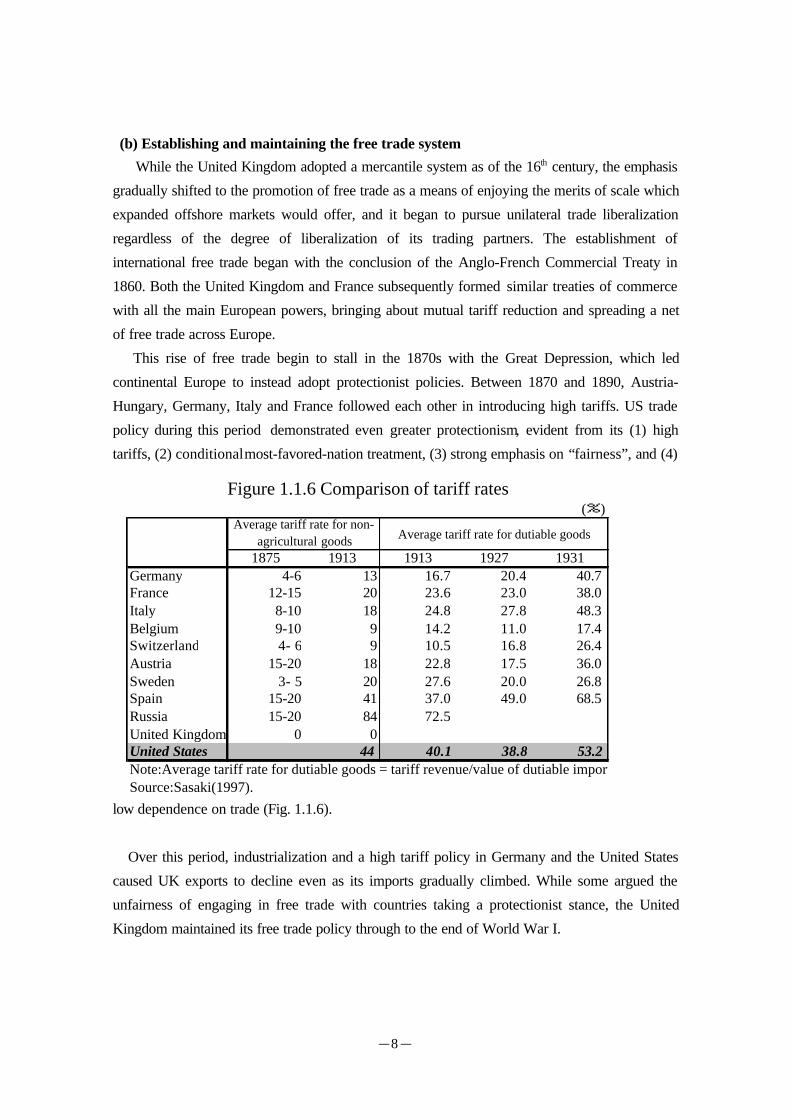
(b) Establishing and maintaining the free trade system
While the United Kingdom adopted a mercantile system as of the 16th century, the emphasis
gradually shifted to the promotion of free trade as a means of enjoying the merits of scale which
expanded offshore markets would offer, and it began to pursue unilateral trade liberalization
regardless of the degree of liberalization of its trading partners. The establishment of
international free trade began with the conclusion of the Anglo-French Commercial Treaty in
1860. Both the United Kingdom and France subsequently formed similar treaties of commerce
with all the main European powers, bringing about mutual tariff reduction and spreading a net
of free trade across Europe.
This rise of free trade begin to stall in the 1870s with the Great Depression, which led
continental Europe to instead adopt protectionist policies. Between 1870 and 1890, Austria-
Hungary, Germany, Italy and France followed each other in introducing high tariffs. US trade
policy during this period demonstrated even greater protectionism, evident from its (1) high
tariffs, (2) conditional most-favored-nation treatment, (3) strong emphasis on “fairness”, and (4)
low dependence on trade (Fig. 1.1.6).
Over this period, industrialization and a high tariff policy in Germany and the United States
caused UK exports to decline even as its imports gradually climbed. While some argued the
unfairness of engaging in free trade with countries taking a protectionist stance, the United
Kingdom maintained its free trade policy through to the end of World War I.
(%)
1875 1913 1913 1927 1931Germany 4-6 13 16.7 20.4 40.7France 12-15 20 23.6 23.0 38.0Italy 8-10 18 24.8 27.8 48.3Belgium 9-10 9 14.2 11.0 17.4Switzerland 4- 6 9 10.5 16.8 26.4Austria 15-20 18 22.8 17.5 36.0Sweden 3- 5 20 27.6 20.0 26.8Spain 15-20 41 37.0 49.0 68.5Russia 15-20 84 72.5United Kingdom 0 0United States 44 40.1 38.8 53.2Note:Average tariff rate for dutiable goods = tariff revenue/value of dutiable imports.Source:Sasaki(1997).
Average tariff rate for non-agricultural goods Average tariff rate for dutiable goods
Figure 1.1.6 Comparison of tariff rates
-9-
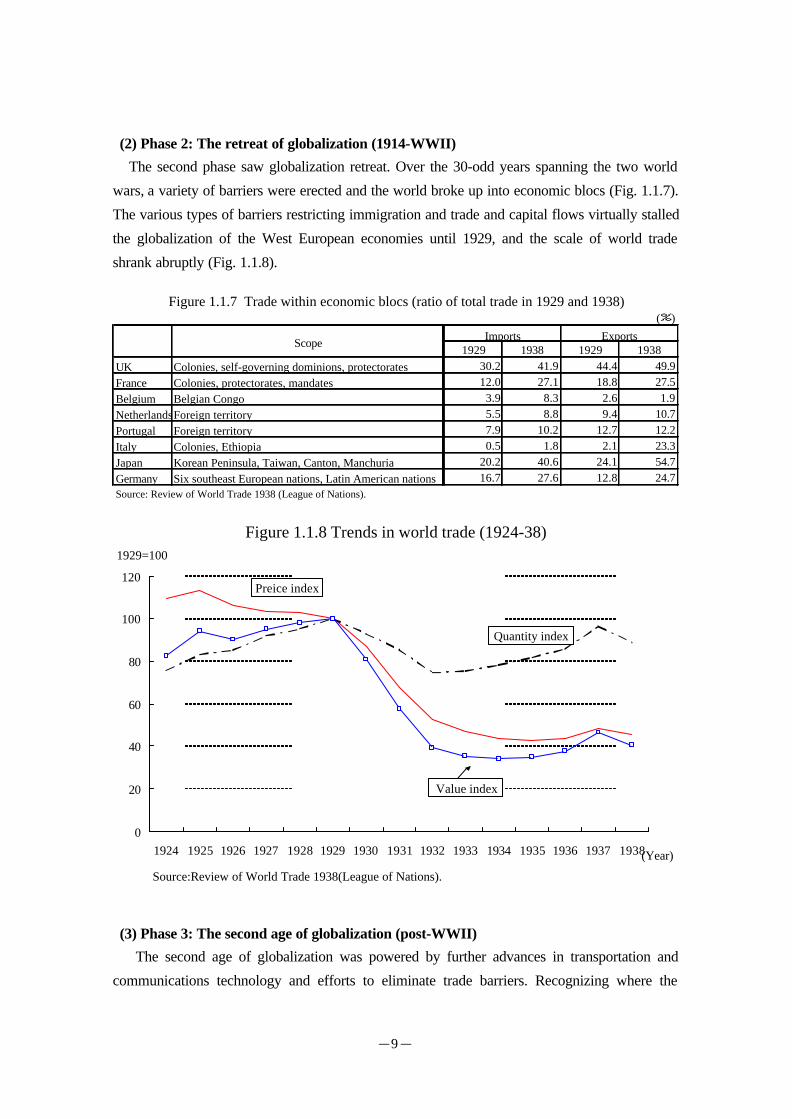
(2) Phase 2: The retreat of globalization (1914-WWII)
The second phase saw globalization retreat. Over the 30-odd years spanning the two world
wars, a variety of barriers were erected and the world broke up into economic blocs (Fig. 1.1.7).
The various types of barriers restricting immigration and trade and capital flows virtually stalled
the globalization of the West European economies until 1929, and the scale of world trade
shrank abruptly (Fig. 1.1.8).
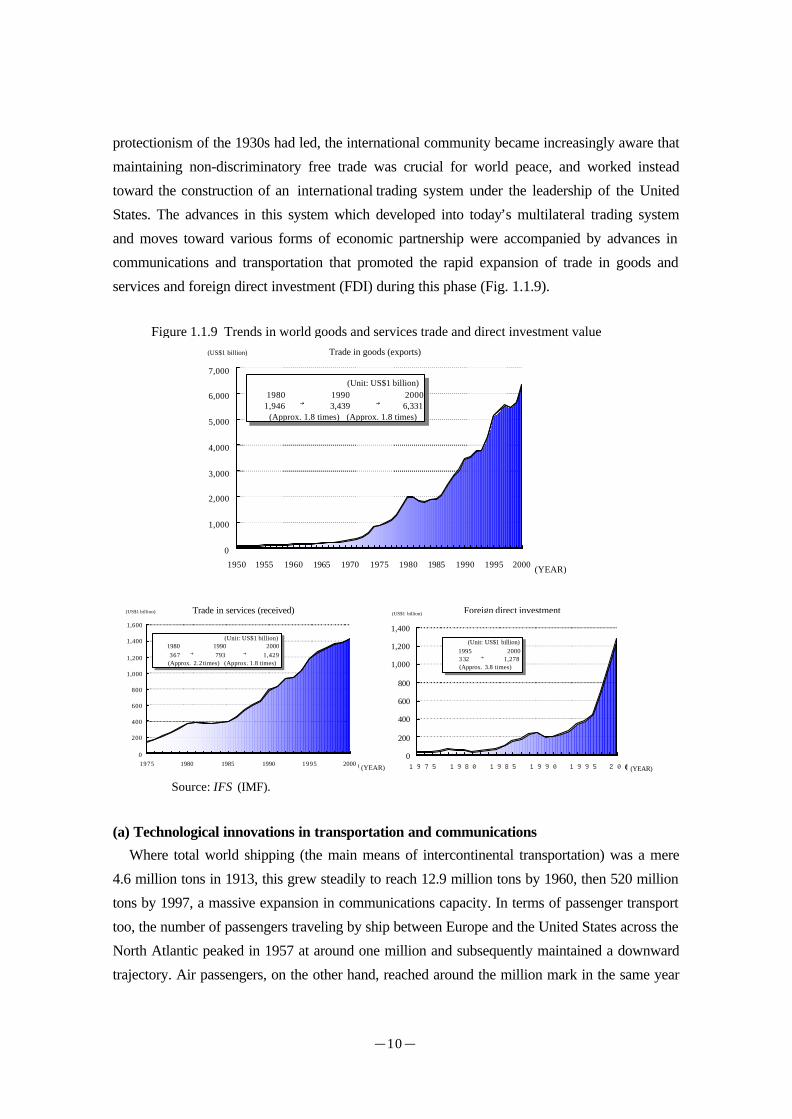
(3) Phase 3: The second age of globalization (post-WWII)
The second age of globalization was powered by further advances in transportation and
communications technology and efforts to eliminate trade barriers. Recognizing where the
(%)
1929 1938 1929 1938UK Colonies, self-governing dominions, protectorates 30.2 41.9 44.4 49.9France Colonies, protectorates, mandates 12.0 27.1 18.8 27.5Belgium Belgian Congo 3.9 8.3 2.6 1.9NetherlandsForeign territory 5.5 8.8 9.4 10.7Portugal Foreign territory 7.9 10.2 12.7 12.2Italy Colonies, Ethiopia 0.5 1.8 2.1 23.3Japan Korean Peninsula, Taiwan, Canton, Manchuria 20.2 40.6 24.1 54.7Germany Six southeast European nations, Latin American nations 16.7 27.6 12.8 24.7Source: Review of World Trade 1938 (League of Nations).
ExportsImportsScope
Figure 1.1.7 Trade within economic blocs (ratio of total trade in 1929 and 1938)
Figure 1.1.8 Trends in world trade (1924-38)
0
20
40
60
80
100
120
1924 1925 1926 1927 1928 1929 1930 1931 1932 1933 1934 1935 1936 1937 1938(Year)
1929=100
Preice index
Quantity index
Value index
Source:Review of World Trade 1938(League of Nations).
-10-
protectionism of the 1930s had led, the international community became increasingly aware that
maintaining non-discriminatory free trade was crucial for world peace, and worked instead
toward the construction of an international trading system under the leadership of the United
States. The advances in this system which developed into today’s multilateral trading system
and moves toward various forms of economic partnership were accompanied by advances in
communications and transportation that promoted the rapid expansion of trade in goods and
services and foreign direct investment (FDI) during this phase (Fig. 1.1.9).
(a) Technological innovations in transportation and communications
Where total world shipping (the main means of intercontinental transportation) was a mere
4.6 million tons in 1913, this grew steadily to reach 12.9 million tons by 1960, then 520 million
tons by 1997, a massive expansion in communications capacity. In terms of passenger transport
too, the number of passengers traveling by ship between Europe and the United States across the
North Atlantic peaked in 1957 at around one million and subsequently maintained a downward
trajectory. Air passengers, on the other hand, reached around the million mark in the same year
Source: IFS (IMF).
Figure 1.1.9 Trends in world goods and services trade and direct investment value
0
1,000
2,000
3,000
4,000
5,000
6,000
7,000
1950 1955 1960 1965 1970 1975 1980 1985 1990 1995 2000 (Year)
(US$1 billion)
(Unit: US$1 billion) 1980 1990 2000 1,946 → 3,439 → 6,331 (Approx. 1.8 times) (Approx. 1.8 times)
Trade in goods (exports)
(YEAR)
0
200
400
600
800
1,000
1,200
1,400
1,600
1975 1980 1985 1990 1995 2000 (Year)
Trade in services (received)(US$1 billion)
(Unit: US$1 billion) 1980 1990 2000 367 → 793 → 1,429 (Approx. 2.2 times) (Approx. 1.8 times)
(YEAR)
0
200
400
600
800
1,000
1,200
1,400
1975 1980 1985 1990 1995 2000(年)
Foreign direct investment(US$1 billion)
(Unit: US$1 billion) 1995 2000 3 32 → 1,278 (Approx. 3.8 times)
(YEAR)
-11-
and continued to grow, doubling to two million a mere four years later in 1961 as air passenger
transport made it even easier to travel cross-border. Land transport also flourished as more and
more rail was laid, with total world rail mileage growing from 470,000 miles in 1900 to 770,000
miles.
In communications, US-led progress with communications satellites in the 1960s saw the
first utility model of a stationary satellite launched in 1963, opening the way for the large-scale
transmission of telephone calls and television images. In the late 1980s, the first optical fiber
undersea cables were laid in place of the old copper cables, allowing larger quantities of higher-
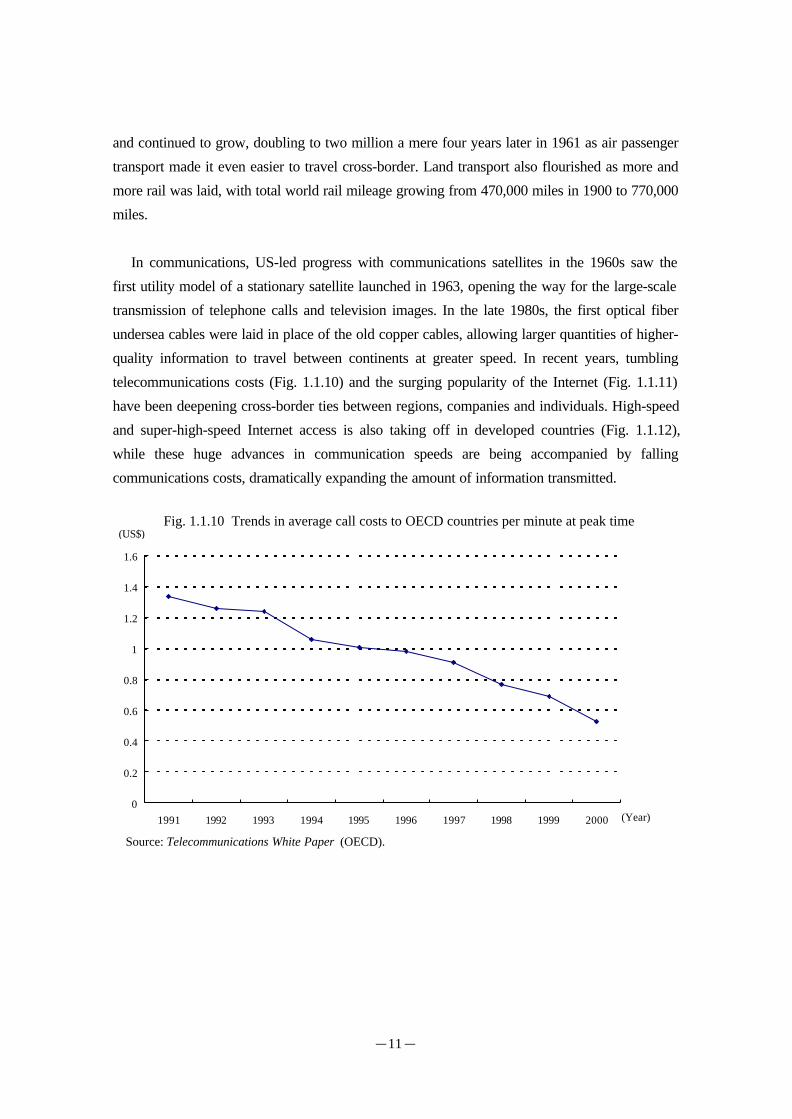
quality information to travel between continents at greater speed. In recent years, tumbling
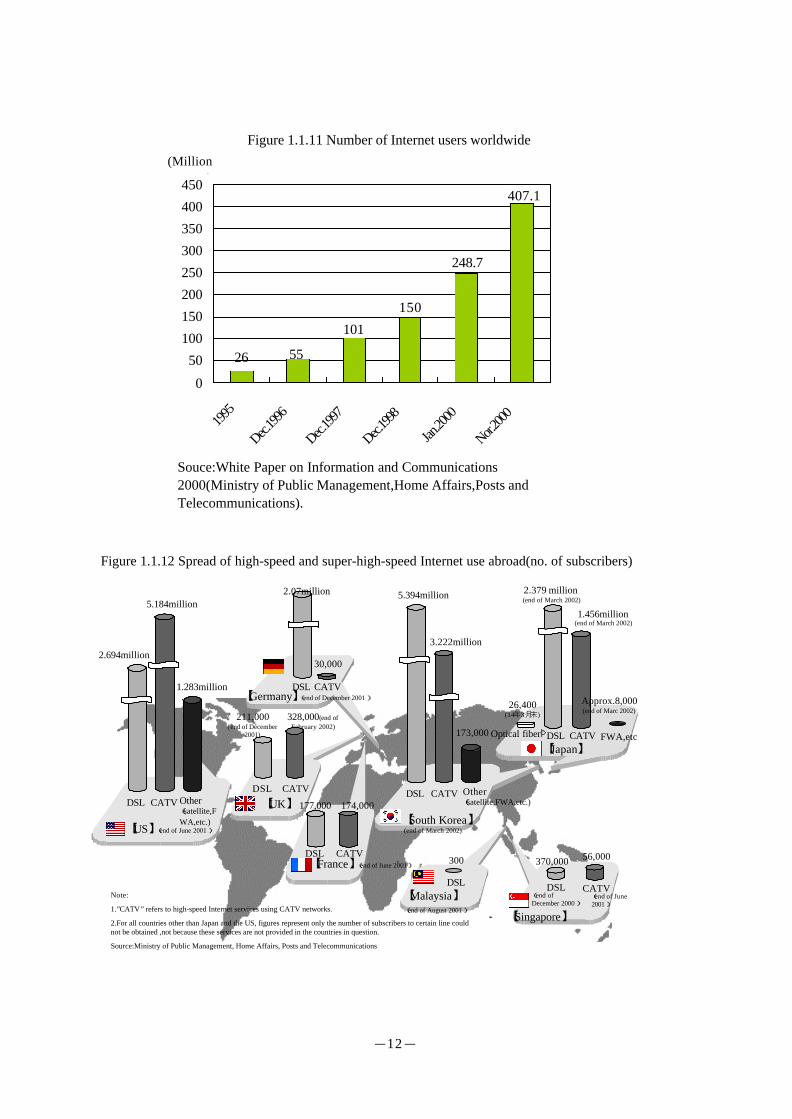
telecommunications costs (Fig. 1.1.10) and the surging popularity of the Internet (Fig. 1.1.11)
have been deepening cross-border ties between regions, companies and individuals. High-speed
and super-high-speed Internet access is also taking off in developed countries (Fig. 1.1.12),
while these huge advances in communication speeds are being accompanied by falling
communications costs, dramatically expanding the amount of information transmitted.
0
0.2
0.4
0.6
0.8
1
1.2
1.4
1.6
1991 1992 1993 1994 1995 1996 1997 1998 1999 2000
(US$)
(Year)
Source: Telecommunications White Paper (OECD).
Fig. 1.1.10 Trends in average call costs to OECD countries per minute at peak time
-12-
Figure 1.1.11 Number of Internet users worldwide
26 55
407.1
248.7
101
150
0
50
100
150
200
250
300
350
400
450
1995
Dec.199
6
Dec.199
7
Dec.1998
Jan.20
00
Nor.2000
Souce:White Paper on Information and Communications2000(Ministry of Public Management,Home Affairs,Posts andTelecommunications).
(Millionpersons)
Figure 1.1.12 Spread of high-speed and super-high-speed Internet use abroad(no. of subscribers)
【US】 (end of June 2001)
DSL CATV Other(satellite,FWA,etc.)
1.283million
2.694million
5.184million
DSL CATV【France】 (end of June 2001)
DSL CATV
【South Korea】(end of March 2002)
3.222million
5.394million
173,000
【Japan】Optical fiber゙ DSL CATV
Approx.8,000(end of Marc 2002)
1.456million(end of March 2002)
FWA,etc
DSL
300
【Malaysia】(end of August 2001)
DSL
【UK】
DSL
2.07million
【Germany】 (end of December 2001 )
CATV
26,400(14年3月末)
DSL
370,000
【Singapore】
CATV
56,000
(end ofDecember 2000)
(end of June2001)
211,000(end of December
2001)
328,000(end ofFebruary 2002)
2.379 million(end of March 2002)
Note:
1.”CATV” refers to high-speed Internet services using CATV networks.
2.For all countries other than Japan and the US, figures represent only the number of subscribers to certain line couldnot be obtained ,not because these services are not provided in the countries in question.
Source:Ministry of Public Management, Home Affairs, Posts and Telecommunications
177,000 174,000
CATV
30,000
Other(satellite,FWA,etc.)

-13-
(b) Development of the multilateral trading system
The postwar multilateral trading system began with the 1947 tariff negotiations in an effort
to get away from pre-war protectionism and its tragic consequences. Substantial tariff reduction
was achieved in the five rounds of negotiations following establishment of the General
Agreement on Tariffs and Trade (GATT) system in1948. The scope of liberalization was later
widened from tariffs to non-tariff barriers as of the Tokyo Round (1973-1979), leading to the
creation of the Anti-Dumping Agreement, the Agreement on Subsidies and Countervailing
Measures, the Government Procurement Agreement and numerous other agreements on non-
tariff measures. In the 1980s, economic globalization diversified into trade in services and direct
investment, and in the Uruguay Round (1986-1994), the trade in goods covered under the GATT
was supplemented by the conclusion of new agreements on trade in services, trade-related
investment measures and intellectual property rights. Great progress was also made with the
improvement of dispute settlement mechanisms and securing the enforceability of rules, leading
to the establishment of the World Trade Organization (WTO) as the driving force behind these
multilateral trading systems. Since its foundation, the WTO has played a major role as the only
international organization providing multilateral trade rules based on the principles and
procedures vital to realizing worldwide free trade.
The multilateral trading system centered around the WTO/GATT mechanisms have made an
enormous contribution to the development of the postwar world economy (Fig. 1.1.13). At the
same time, the conclusion of free trade agreements and other bilateral and multilateral economic
partnerships has begun to snowball in recent years.
Jan. 1948 Inaugurationof GATT
Tariffs on non-agriculturalgoods
1973-79 Tokyo Round Anti-dumping (AD)Technical barriers to trade (TBT)Government procurementSubsidiesLicensing,etc.
ServicesAgriculture
Tariffs on non-agricultural goods
1986-94 Uruguay Round ADTechnical barriers to trade (TBT)Government procurementSubsidiesLicensing,etc.
Textiles agreementPSIRules of originTRIPS、SPSDSU、TRIM
Jan. 1995 Inauguration ofWTO
Services-Energy-Distribution-E-commerceAgriculture
Tariffs on non-agricultural goods
2001- New round ADSubsidiesRegional trade agreements
TRIPS (partial negotiation) Investment*Competition*Trade facilitation*Government procurement transparency*E-commerce**
Environment
Note: Boxes indicate BIA (built-in agenda) items; single asterisks indicate the initiation of preparatory negotiations; and double asterisks indicate thatthe treatment of e-commerce under the WTO Agreement is under consideration by a subsidiary body based on the Work Programme.Source: METI.
Figure 1.1.13 Progress of WTO trade liberalization negotiation
-14-
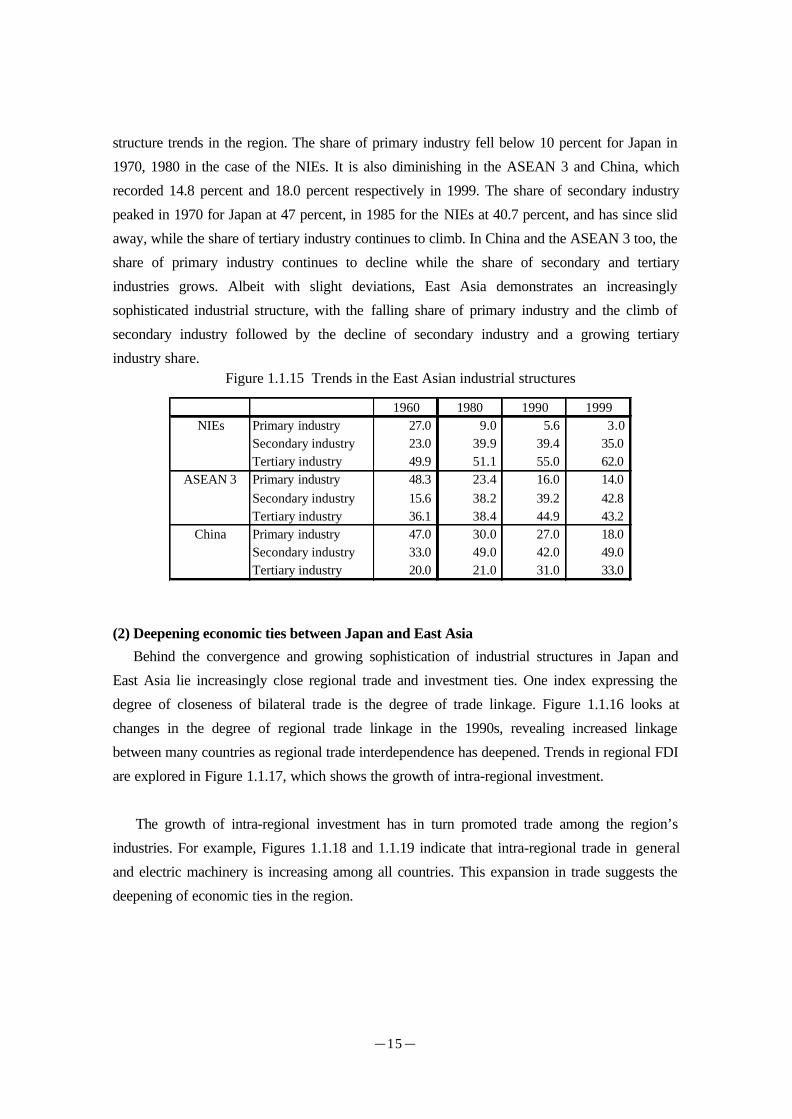
3. Convergence and deepening economic linkages between Japan and East Asia
(1) Convergence of economic standards between Japan and East Asia
This process of globalization has also occurred in Japan and East Asia. Trade and investment
has increased, and, as noted later in Section 2, passengers and cargo are moving with increasing
frequency within the region, part of a significant surge in the movement of goods, money,
people and information. Economic standards in the region have also been gradually converging
since the 1980s. The per capita GDP disparity (dispersion) across the nine East Asian nations
(Japan, the Newly Industrialized Economies (NIEs), the ASEAN 3 (Indonesia, Thailand and
Malaysia) and China) began to diminish slowly as of the end of the 1980s, indicating a
convergence in per capita GDP within the region (Fig. 1.1.14).
More specifically, the per capita GDP dispersion between Japan and the NIEs plummeted as
of the early 1970s and fell more slowly between Japan and the ASEAN 3 as of the mid-1970s, a
pattern echoed in the disparity between Japan and China as of the early 1980s. Convergence
with Japan, the most advanced country in the region, seems to be occurring in a time sequence,
starting from the NIEs and moving on to the ASEAN 3 and then China.
These countries evidence not only rising per capita GDP, but also growing productivity and
increasingly sophisticated industrial structures. The World Bank (1994) found East Asian
productivity to be head and shoulders above other regions. Figure 1.1.15 shows industrial
Note: Standard deviation of per capita GDP natural logarithm value (Geary Khamis, 1990; expressed in dollars). “ASEAN 3” refers to Thailand, Malaysia and Indonesia.Sources: The World Economy—A Millennial Perspective (Angus Maddison, OECD, 2001).
Figure 1.1.14 Trends in per capita GDP dispersion in East Asia
0.00
0.20
0.40
0.60
0.80
1.00
1950 1960 1970 1980 1990
JAPAN,NIEs,ASEAN3,China
0.00
0.20
0.40
0.60
1950 1960 1970 1980 1990
JAPAN,NIEs
0.00
0.20
0.40
0.60
0.80
1.00
1950 1960 1970 1980 1990
Japan,ASEAN3
0.00
0.20
0.40
0.60
0.80
1.00
1.20
1.40
1950 1960 1970 1980 1990
Japan,China
-15-
structure trends in the region. The share of primary industry fell below 10 percent for Japan in
1970, 1980 in the case of the NIEs. It is also diminishing in the ASEAN 3 and China, which
recorded 14.8 percent and 18.0 percent respectively in 1999. The share of secondary industry
peaked in 1970 for Japan at 47 percent, in 1985 for the NIEs at 40.7 percent, and has since slid
away, while the share of tertiary industry continues to climb. In China and the ASEAN 3 too, the
share of primary industry continues to decline while the share of secondary and tertiary
industries grows. Albeit with slight deviations, East Asia demonstrates an increasingly
sophisticated industrial structure, with the falling share of primary industry and the climb of
secondary industry followed by the decline of secondary industry and a growing tertiary
industry share.
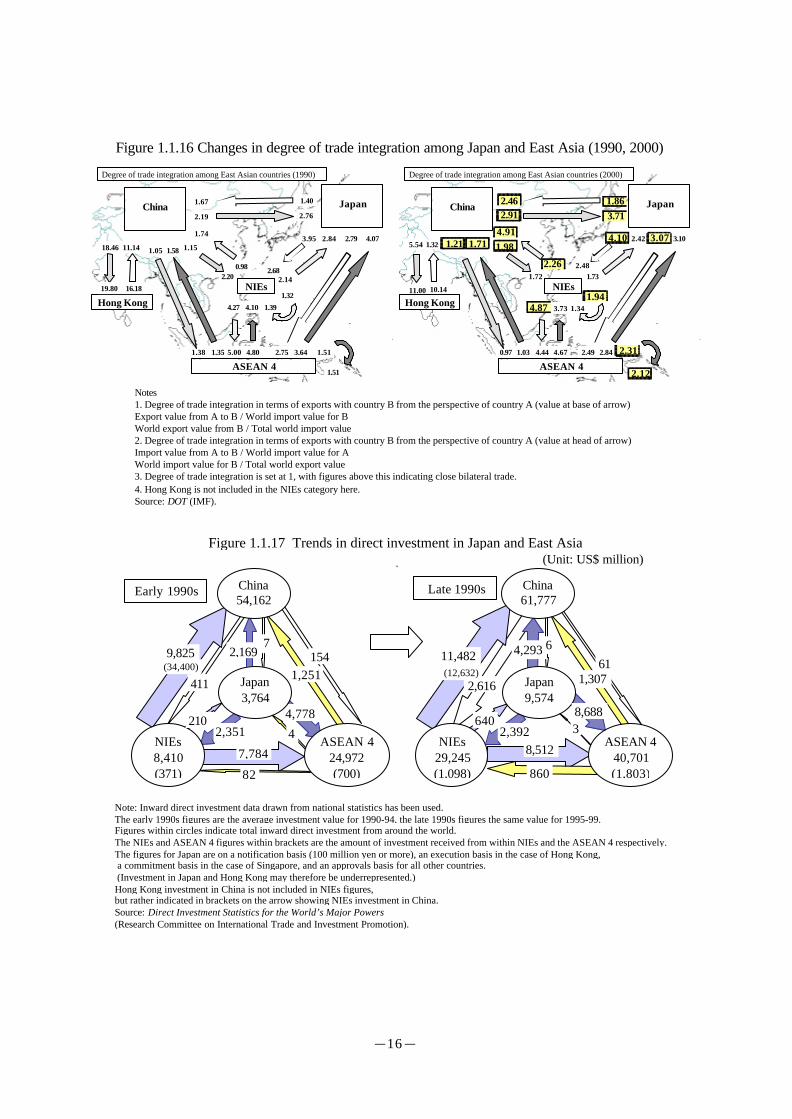
(2) Deepening economic ties between Japan and East Asia
Behind the convergence and growing sophistication of industrial structures in Japan and
East Asia lie increasingly close regional trade and investment ties. One index expressing the
degree of closeness of bilateral trade is the degree of trade linkage. Figure 1.1.16 looks at
changes in the degree of regional trade linkage in the 1990s, revealing increased linkage
between many countries as regional trade interdependence has deepened. Trends in regional FDI
are explored in Figure 1.1.17, which shows the growth of intra-regional investment.
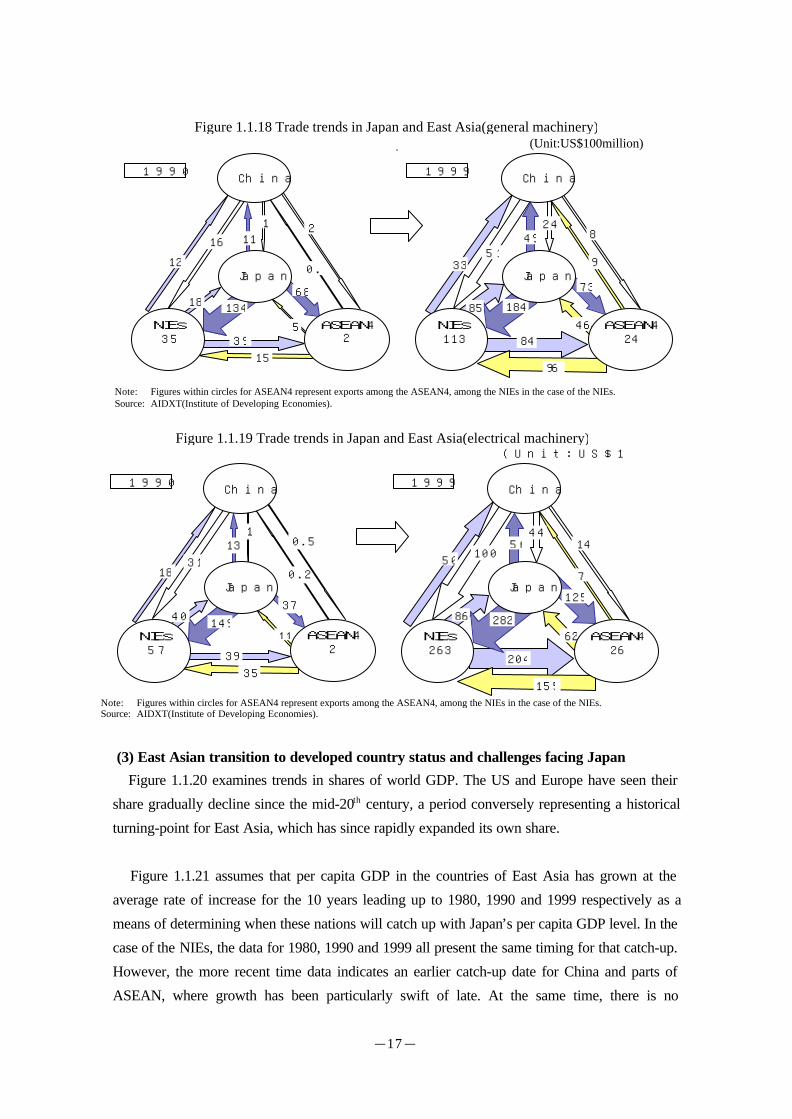
The growth of intra-regional investment has in turn promoted trade among the region’s
industries. For example, Figures 1.1.18 and 1.1.19 indicate that intra-regional trade in general
and electric machinery is increasing among all countries. This expansion in trade suggests the
deepening of economic ties in the region.
1960 1980 1990 1999NIEs Primary industry 27.0 9.0 5.6 3.0
Secondary industry 23.0 39.9 39.4 35.0Tertiary industry 49.9 51.1 55.0 62.0
ASEAN 3 Primary industry 48.3 23.4 16.0 14.0Secondary industry 15.6 38.2 39.2 42.8Tertiary industry 36.1 38.4 44.9 43.2
China Primary industry 47.0 30.0 27.0 18.0Secondary industry 33.0 49.0 42.0 49.0Tertiary industry 20.0 21.0 31.0 33.0
Figure 1.1.15 Trends in the East Asian industrial structures
-16-
ASEAN 4
NIEs
JapanChina
Degree of trade integration among East Asian countries (1990)
Hong Kong
1.67
2.19
1.40
2.76
3.95 2.84 2.79 4.07
2.200.98 2.68
2.14
1.74
1.151.581.0511.1418.46
1.38 1.35 5.00 4.80 2.75 3.64
16.1819.801.32
1.394.104.27
1.51
1.51
2.42 3.10
1.732.48
1.72
0.97 1.03 2.49 2.84
11.00 10.14
3.73
4.44 4.67
5.54
1.34
2.12
2.31
3.074.10
3.711.862.46
2.91
4.911.98
1.944.87
2.26
1.711.211.32
China Japan
Hong Kong
NIEs
ASEAN 4
Degree of trade integration among East Asian countries (2000)
Notes1. Degree of trade integration in terms of exports with country B from the perspective of country A (value at base of arrow)Export value from A to B / World import value for BWorld export value from B / Total world import value2. Degree of trade integration in terms of exports with country B from the perspective of country A (value at head of arrow)Import value from A to B / World import value for AWorld import value for B / Total world export value3. Degree of trade integration is set at 1, with figures above this indicating close bilateral trade.4. Hong Kong is not included in the NIEs category here.Source: DOT (IMF).
Figure 1.1.16 Changes in degree of trade integration among Japan and East Asia (1990, 2000)
Figure 1.1.17 Trends in direct investment in Japan and East Asia(Unit: US$ million)
Note: Inward direct investment data drawn from national statistics has been used. The early 1990s figures are the average investment value for 1990-94, the late 1990s figures the same value for 1995-99. Figures within circles indicate total inward direct investment from around the world. The NIEs and ASEAN 4 figures within brackets are the amount of investment received from within NIEs and the ASEAN 4 respectively. The figures for Japan are on a notification basis (100 million yen or more), an execution basis in the case of Hong Kong, a commitment basis in the case of Singapore, and an approvals basis for all other countries. (Investment in Japan and Hong Kong may therefore be underrepresented.) Hong Kong investment in China is not included in NIEs figures, but rather indicated in brackets on the arrow showing NIEs investment in China. Source: Direct Investment Statistics for the World’s Major Powers(Research Committee on International Trade and Investment Promotion).
Early 1990s
154
NIEs8,410(371)
ASEAN 424,972(700)
China54,162
2,351
7,784
4,778
411
2,169
210
79,825
1,251
82
Late 1990s
61Japan9,574
NIEs29,245(1,098)
ASEAN 440,701(1,803)
China61,777
2,3928,512
8,688
2,616
4,293
640
611,482
860
34
(12,632)(34,400)1,307Japan
3,764
-17-
(3) East Asian transition to developed country status and challenges facing Japan
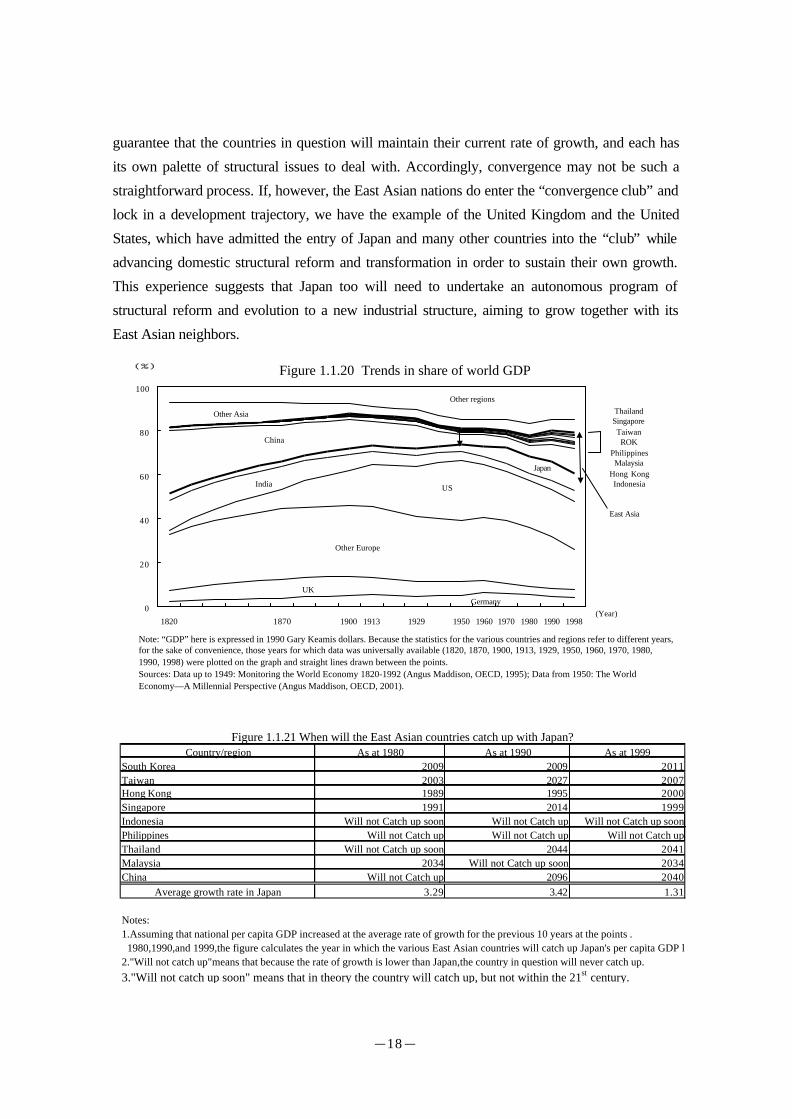
Figure 1.1.20 examines trends in shares of world GDP. The US and Europe have seen their
share gradually decline since the mid-20th century, a period conversely representing a historical
turning-point for East Asia, which has since rapidly expanded its own share.
Figure 1.1.21 assumes that per capita GDP in the countries of East Asia has grown at the
average rate of increase for the 10 years leading up to 1980, 1990 and 1999 respectively as a
means of determining when these nations will catch up with Japan’s per capita GDP level. In the
case of the NIEs, the data for 1980, 1990 and 1999 all present the same timing for that catch-up.
However, the more recent time data indicates an earlier catch-up date for China and parts of
ASEAN, where growth has been particularly swift of late. At the same time, there is no
Figure 1.1.18 Trade trends in Japan and East Asia(general machinery)(Unit:US$100million)
Note: Figures within circles for ASEAN4 represent exports among the ASEAN4, among the NIEs in the case of the NIEs.Source: AIDXT(Institute of Developing Economies).
1990
ASEAN42
China China
85
1999
184
5133
84
96
4924
8
9
73
46
12
16
18 134
111
3915
2
0.1
68
5
Japan Japan
NIEs35
ASEAN424
NIEs113
Figure 1.1.19 Trade trends in Japan and East Asia(electrical machinery)(Unit:US$100million)
Note: Figures within circles for ASEAN4 represent exports among the ASEAN4, among the NIEs in the case of the NIEs.Source: AIDXT(Institute of Developing Economies).
1990 China China
86
1999
282
5056
44
7
62
1831
149
131
3935
0.2
37Japan
0.5
40
11
125
100
Japan
14
204
155
NIEs263
ASEAN426
NIEs57
ASEAN42
-18-
guarantee that the countries in question will maintain their current rate of growth, and each has
its own palette of structural issues to deal with. Accordingly, convergence may not be such a
straightforward process. If, however, the East Asian nations do enter the “convergence club” and
lock in a development trajectory, we have the example of the United Kingdom and the United
States, which have admitted the entry of Japan and many other countries into the “club” while
advancing domestic structural reform and transformation in order to sustain their own growth.
This experience suggests that Japan too will need to undertake an autonomous program of
structural reform and evolution to a new industrial structure, aiming to grow together with its
East Asian neighbors.
Figure 1.1.20 Trends in share of world GDP
0
20
40
60
80
100
1820 1870 1900 1913 1929 1950 1960 1970 1980 1990 1998
(%)
(Year)Germany
UK
Other Europe
USIndia
Japan
China
Other Asia
Other regionsThailandSingaporeTaiwanROK
PhilippinesMalaysia
Hong KongIndonesia
East Asia
Note: “GDP” here is expressed in 1990 Gary Keamis dollars. Because the statistics for the various countries and regions refer to different years,for the sake of convenience, those years for which data was universally available (1820, 1870, 1900, 1913, 1929, 1950, 1960, 1970, 1980,1990, 1998) were plotted on the graph and straight lines drawn between the points.Sources: Data up to 1949: Monitoring the World Economy 1820-1992 (Angus Maddison, OECD, 1995); Data from 1950: The WorldEconomy—A Millennial Perspective (Angus Maddison, OECD, 2001).
Country/region As at 1980 As at 1990 As at 1999South Korea 2009 2009 2011Taiwan 2003 2027 2007Hong Kong 1989 1995 2000Singapore 1991 2014 1999Indonesia Will not Catch up soon Will not Catch up Will not Catch up soonPhilippines Will not Catch up Will not Catch up Will not Catch upThailand Will not Catch up soon 2044 2041Malaysia 2034 Will not Catch up soon 2034China Will not Catch up 2096 2040
Average growth rate in Japan 3.29 3.42 1.31
Notes:1.Assuming that national per capita GDP increased at the average rate of growth for the previous 10 years at the points . 1980,1990,and 1999,the figure calculates the year in which the various East Asian countries will catch up Japan's per capita GDP level.2."Will not catch up"means that because the rate of growth is lower than Japan,the country in question will never catch up.3."Will not catch up soon" means that in theory the country will catch up, but not within the 21st century.
Figure 1.1.21 When will the East Asian countries catch up with Japan?


![Globalization And A Changing World[1]](https://img.pdfslide.net/doc/110x75/5584f55fd8b42a78618b5387/globalization-and-a-changing-world1.jpg)