Embed Size (px)
Citation preview
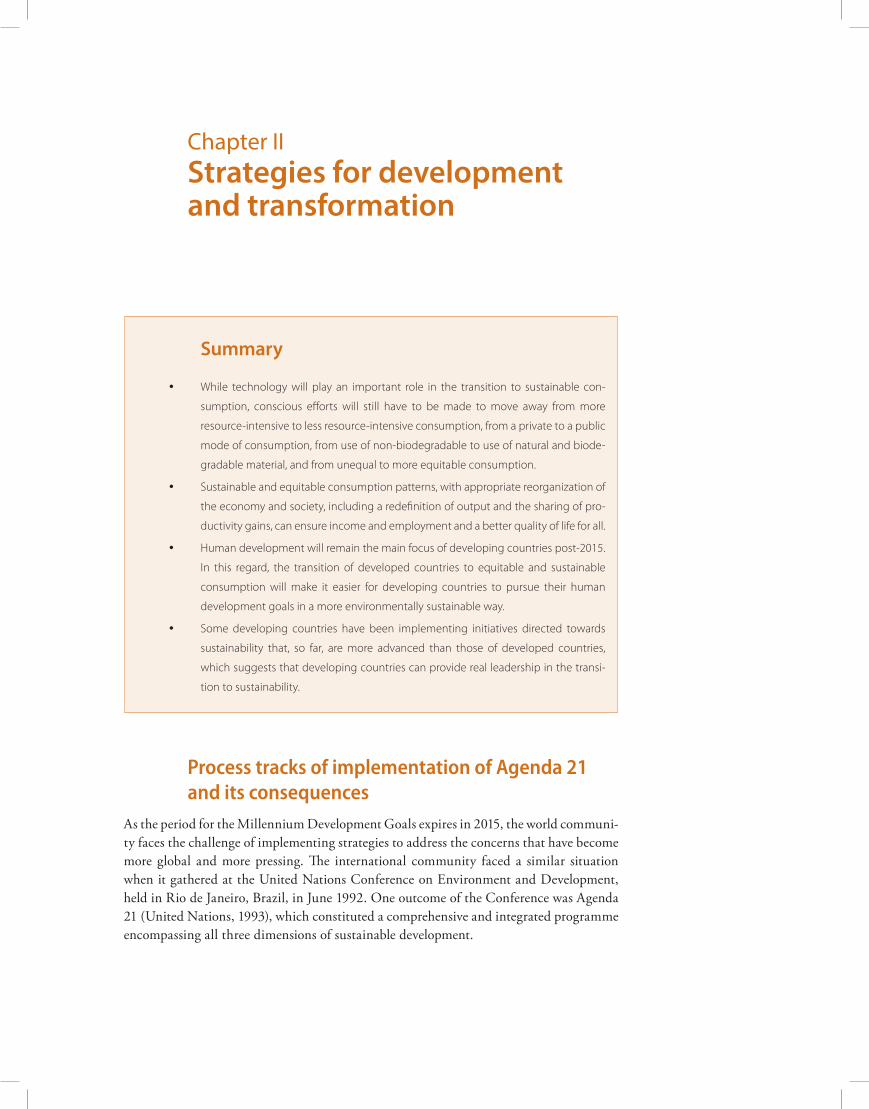
Chapter IIStrategies for development and transformation
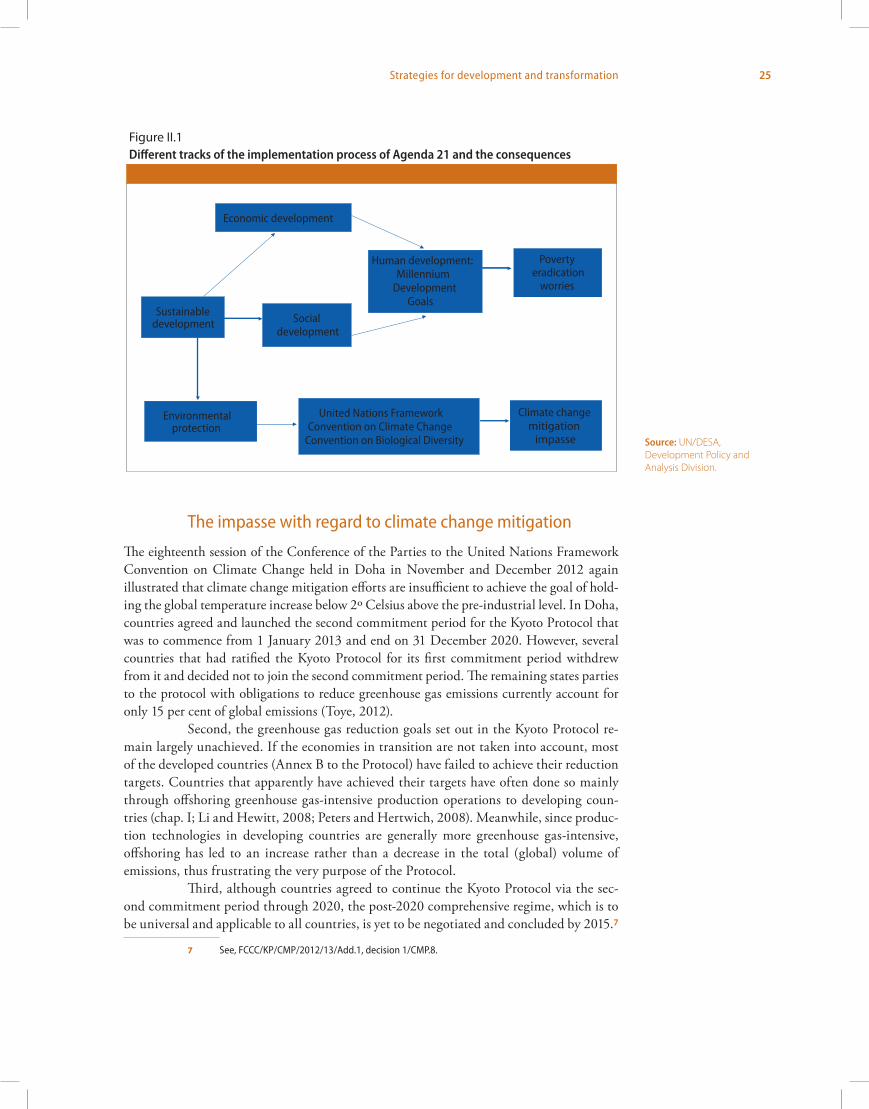
Process tracks of implementation of Agenda 21 and its consequences
As the period for the Millennium Development Goals expires in 2015, the world communi-ty faces the challenge of implementing strategies to address the concerns that have become more global and more pressing. The international community faced a similar situation when it gathered at the United Nations Conference on Environment and Development, held in Rio de Janeiro, Brazil, in June 1992. One outcome of the Conference was Agenda 21 (United Nations, 1993), which constituted a comprehensive and integrated programme encompassing all three dimensions of sustainable development.
Summary
y While technology will play an important role in the transition to sustainable con-
sumption, conscious efforts will still have to be made to move away from more
resource-intensive to less resource-intensive consumption, from a private to a public
mode of consumption, from use of non-biodegradable to use of natural and biode-
gradable material, and from unequal to more equitable consumption.
y Sustainable and equitable consumption patterns, with appropriate reorganization of
the economy and society, including a redefinition of output and the sharing of pro-
ductivity gains, can ensure income and employment and a better quality of life for all.
y Human development will remain the main focus of developing countries post-2015.
In this regard, the transition of developed countries to equitable and sustainable
consumption will make it easier for developing countries to pursue their human
development goals in a more environmentally sustainable way.
y Some developing countries have been implementing initiatives directed towards
sustainability that, so far, are more advanced than those of developed countries,
which suggests that developing countries can provide real leadership in the transi-
tion to sustainability.
24 World Economic and Social Survey 2013
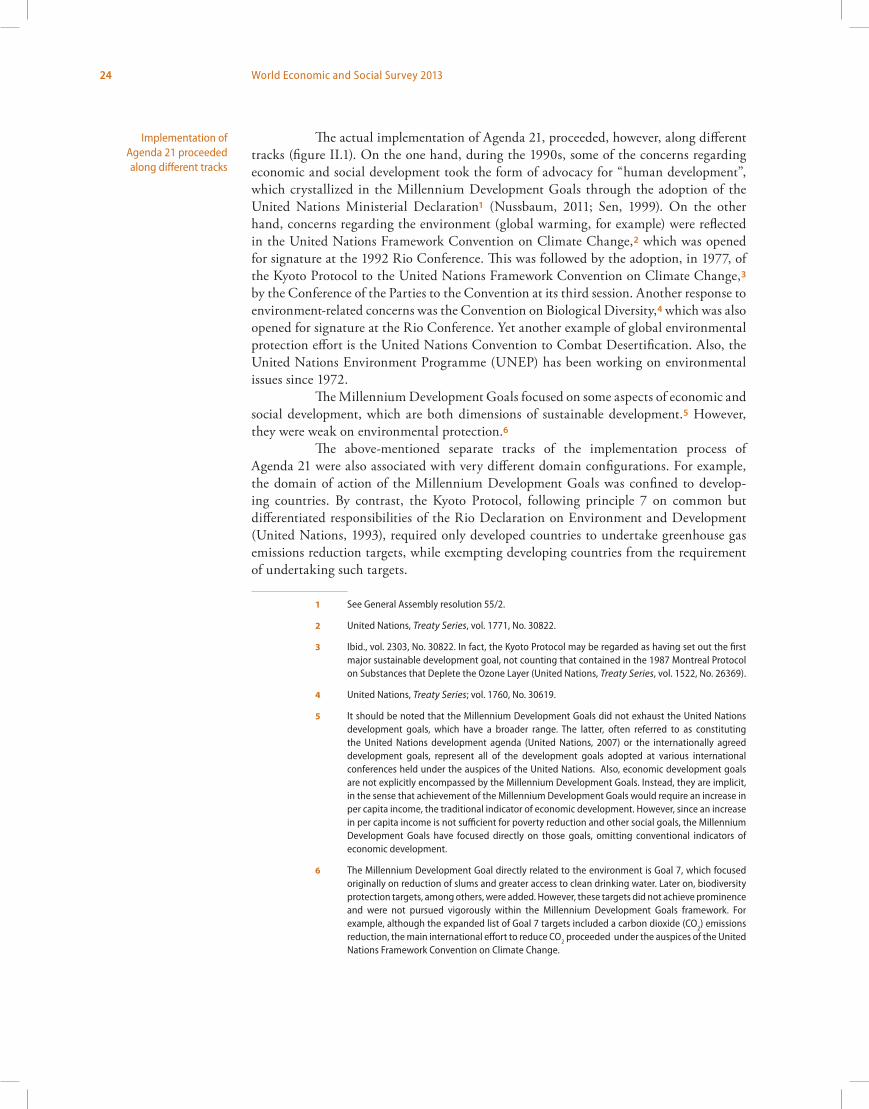
The actual implementation of Agenda 21, proceeded, however, along different tracks (figure II.1). On the one hand, during the 1990s, some of the concerns regarding economic and social development took the form of advocacy for “human development”, which crystallized in the Millennium Development Goals through the adoption of the United Nations Ministerial Declaration1 (Nussbaum, 2011; Sen, 1999). On the other hand, concerns regarding the environment (global warming, for example) were reflected in the United Nations Framework Convention on Climate Change,2 which was opened for signature at the 1992 Rio Conference. This was followed by the adoption, in 1977, of the Kyoto Protocol to the United Nations Framework Convention on Climate Change,3 by the Conference of the Parties to the Convention at its third session. Another response to environment-related concerns was the Convention on Biological Diversity,4 which was also opened for signature at the Rio Conference. Yet another example of global environmental protection effort is the United Nations Convention to Combat Desertification. Also, the United Nations Environment Programme (UNEP) has been working on environmental issues since 1972.
The Millennium Development Goals focused on some aspects of economic and social deve lopment, which are both dimensions of sustainable development.5 However, they were weak on environ mental protection.6
The above-mentioned separate tracks of the implementation process of Agenda 21 were also associated with very different domain configurations. For example, the domain of action of the Millennium Development Goals was confined to develop-ing countries. By contrast, the Kyoto Protocol, following principle 7 on common but differentiated responsibilities of the Rio Declaration on Environment and Development (United Nations, 1993), required only developed countries to undertake greenhouse gas emissions reduction targets, while exempting developing countries from the requirement of undertaking such targets.
1 See General Assembly resolution 55/2.
2 United Nations, Treaty Series, vol. 1771, No. 30822.
3 Ibid., vol. 2303, No. 30822. In fact, the Kyoto Protocol may be regarded as having set out the first major sustainable development goal, not counting that contained in the 1987 Montreal Protocol on Substances that Deplete the Ozone Layer (United Nations, Treaty Series, vol. 1522, No. 26369).
4 United Nations, Treaty Series; vol. 1760, No. 30619.
5 It should be noted that the Millennium Development Goals did not exhaust the United Nations development goals, which have a broader range. The latter, often referred to as constituting the United Nations development agenda (United Nations, 2007) or the internationally agreed development goals, represent all of the development goals adopted at various international conferences held under the auspices of the United Nations. Also, economic development goals are not explicitly encompassed by the Millennium Development Goals. Instead, they are implicit, in the sense that achievement of the Millennium Development Goals would require an increase in per capita income, the traditional indicator of economic development. However, since an increase in per capita income is not sufficient for poverty reduction and other social goals, the Millennium Development Goals have focused directly on those goals, omitting conventional indicators of economic development.
6 The Millennium Development Goal directly related to the environment is Goal 7, which focused originally on reduction of slums and greater access to clean drinking water. Later on, biodiversity protection targets, among others, were added. However, these targets did not achieve prominence and were not pursued vigorously within the Millennium Development Goals framework. For example, although the expanded list of Goal 7 targets included a carbon dioxide (CO
2) emissions
reduction, the main international effort to reduce CO2
proceeded under the auspices of the United Nations Framework Convention on Climate Change.
Implementation of Agenda 21 proceeded along different tracks
25Strategies for development and transformation
The impasse with regard to climate change mitigation
The eighteenth session of the Conference of the Parties to the United Nations Framework Convention on Climate Change held in Doha in November and December 2012 again illustrated that climate change mitigation efforts are insufficient to achieve the goal of hold-ing the global temperature increase below 2º Celsius above the pre-industrial level. In Doha, countries agreed and launched the second commitment period for the Kyoto Protocol that was to commence from 1 January 2013 and end on 31 December 2020. However, several countries that had ratified the Kyoto Protocol for its first commitment period withdrew from it and decided not to join the second commitment period. The remaining states parties to the protocol with obligations to reduce greenhouse gas emissions currently account for only 15 per cent of global emissions (Toye, 2012).
Second, the greenhouse gas reduction goals set out in the Kyoto Protocol re-main largely unachieved. If the economies in transition are not taken into account, most of the developed countries (Annex B to the Protocol) have failed to achieve their reduction targets. Countries that apparently have achieved their targets have often done so mainly through offshoring greenhouse gas-intensive production operations to developing coun-tries (chap. I; Li and Hewitt, 2008; Peters and Hertwich, 2008). Meanwhile, since produc-tion technologies in developing countries are generally more greenhouse gas-intensive, offshoring has led to an increase rather than a decrease in the total (global) volume of emissions, thus frustrating the very purpose of the Protocol.
Third, although countries agreed to continue the Kyoto Protocol via the sec-ond commitment period through 2020, the post-2020 comprehensive regime, which is to be universal and applicable to all countries, is yet to be negotiated and concluded by 2015.7
7 See, FCCC/KP/CMP/2012/13/Add.1, decision 1/CMP.8.
Figure II.1 Bifurcation of the implementation process of Agenda 21 and its consequences
Economic development
Poverty eradication
worries
United Nations Framework Convention on Climate Change
Convention on Biological Diversity
Sustainable development
Environmental protection
Human development:Millennium
Development Goals
Social development
Climate change mitigation
impasse
Source: UN/DESA, Development Policy and Analysis Division.
Figure II.1 Different tracks of the implementation process of Agenda 21 and the consequences
Source: UN/DESA, Development Policy and Analysis Division.
26 World Economic and Social Survey 2013
Worries regarding poverty eradication and other human development goals
Worries regarding poverty eradication emanate from the weaknesses with respect to poverty reduction achievement so far. First, although the world as a whole is on track towards achieving Millennium Development Goal 1, this has been largely due to China, which succeeded in raising about 600 million people out of poverty. By contrast, South Asia and sub-Saharan Africa have been less successful, and the absolute number of the poor in these regions has in fact increased. Chen and Ravallion (2010) indicate that “the developing world is poorer than we thought”, reporting that the number of poor in 2005 was 1.4 billion (using $1.25/day as the poverty line). They further indicate that if the higher, $2/day definition is used, the number of the poor in developing countries in 2005 increased to 2.6 billion (representing 47.6 per cent or almost half, of the developing world’s population).
Second, those who have risen above the poverty level still remain very close to it, so that negative shocks can easily wipe out the poverty reduction gains, which was what occurred during the recent food price spike.
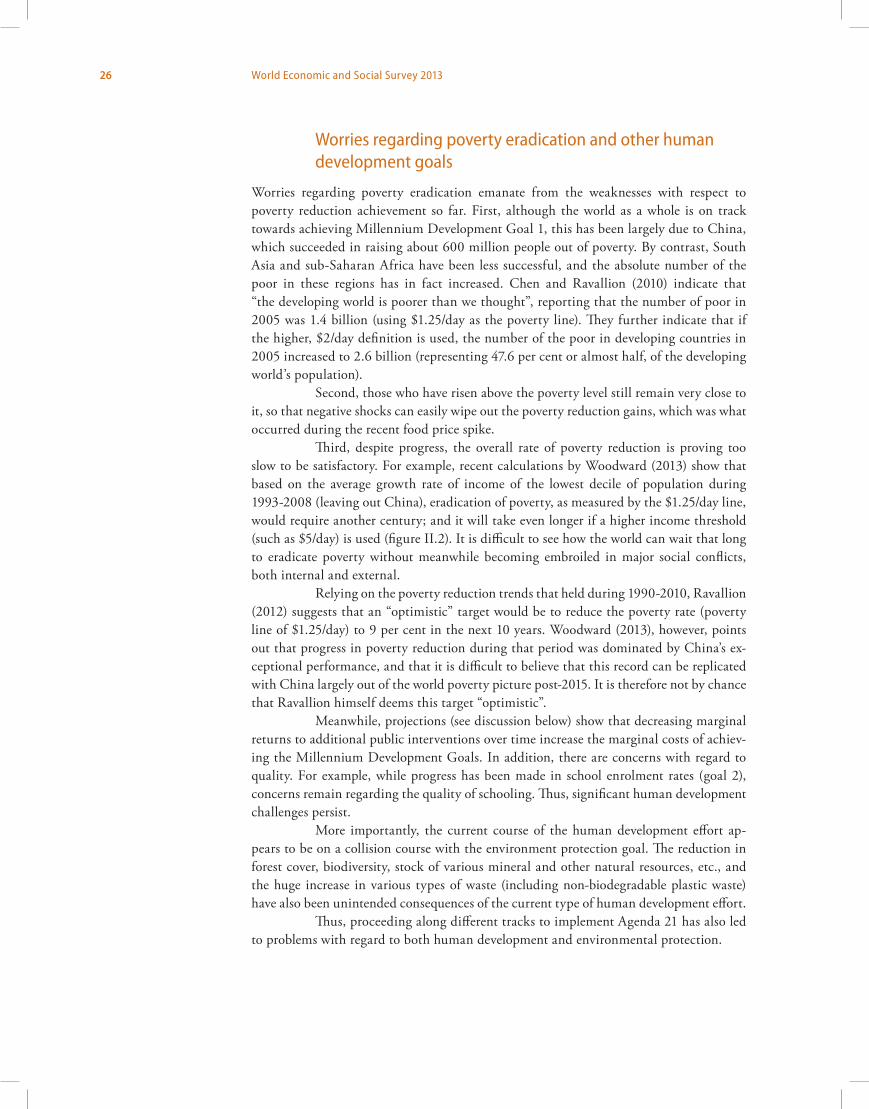
Third, despite progress, the overall rate of poverty reduction is proving too slow to be satisfactory. For example, recent calculations by Woodward (2013) show that based on the average growth rate of income of the lowest decile of population during 1993-2008 (leaving out China), eradication of poverty, as measured by the $1.25/day line, would require another century; and it will take even longer if a higher income threshold (such as $5/day) is used (figure II.2). It is difficult to see how the world can wait that long to eradicate poverty without meanwhile becoming embroiled in major social conflicts, both internal and external.
Relying on the poverty reduction trends that held during 1990-2010, Ravallion (2012) suggests that an “optimistic” target would be to reduce the poverty rate (poverty line of $1.25/day) to 9 per cent in the next 10 years. Woodward (2013), however, points out that progress in poverty reduction during that period was dominated by China’s ex-ceptional performance, and that it is difficult to believe that this record can be replicated with China largely out of the world poverty picture post-2015. It is therefore not by chance that Ravallion himself deems this target “optimistic”.
Meanwhile, projections (see discussion below) show that decreasing marginal returns to additional public interventions over time increase the marginal costs of achiev-ing the Millennium Development Goals. In addition, there are concerns with regard to quality. For example, while progress has been made in school enrolment rates (goal 2), concerns remain regarding the quality of schooling. Thus, significant human development challenges persist.
More importantly, the current course of the human development effort ap-pears to be on a collision course with the environment protection goal. The reduction in forest cover, biodiversity, stock of various mineral and other natural resources, etc., and the huge increase in various types of waste (including non-biodegradable plastic waste) have also been unintended consequences of the current type of human development effort.
Thus, proceeding along different tracks to implement Agenda 21 has also led to problems with regard to both human development and environ mental protection.
27Strategies for development and transformation
Millennium Development Goals and Sustainable Development Goals
Discussions on the Millennium Development Goals track have been prompted by the impending expiry of the Millennium Development Goals deadline in 2015. A large litera-ture—including AIV (2011), Institute of Development Studies (2010), Kenny and Sumner (2011), Melamed (2012), Vandemoortele (2012) and World Vision (2011)—has emerged concerning this track. The report of the United Nations System Task Team on the Post-2015 UN Development Agenda (2012) carries forward this discussion.
The other track is represented by the outcome document of the United Nations Conference on Sustainable Development entitled “The future we want”,8 pursuant to which a process of formulation of sustainable development goals was initiated. This has led to the establishment of the Open Working Group of the General Assembly on Sustainable Development Goals (see Assembly decision 67/555 of 22 January 2013).
These two tracks often present two different perspectives. Some of the pub-lications associated with the Millennium Development Goals track were written before the Conference and hence did not consider the concept and the process of formulation of Sustainable Development Goals. They generally continued to assign environmental goals a rather limited role in the post-2015 extension of the Millennium Development Goals, similar to what has been the case in the context of the existing Millennium Develop ment Goals.
8 General Assembly resolution 66/288, annex.
Discussions on the Millennium Development Goals and the Sustainable Development Goals reflect different tracks of the Agenda 21 implementation process, but the two sets of goals need to be integrated
Figure II.2 Income of the poorest decile, World (excluding China), 2000-2250Dollars per day (2005 purchasing power parity)
Figure II.2 Income of the poorest decile, World (excluding China), 2000-2250
0
5
10
15
20
25
2000 2050 2100 2150 2200 2250
Source: Woodward (2013).
$5.00-a-day poverty line
$1.25-a-day poverty line
Mean income for the decile
Range of incomes
Upper limit of range of incomes
Lower limitof range of incomes
Source: Woodward (2013).Note: The graph shows a projection of incomes for the lowest decile of the world population excluding China, based on extrapolation of the trend of mean per capita income in this decile between 1993 and 2005. The upper limit of the range of incomes is the income marking the division between the 9th and 10th deciles ($0.85 per day in 2005). The lower limit is a conservative (high) estimate of the lower band, set at half the mean income for the tenth decile ($0.30 per day in 2005) and corresponding with the upper bound of the 100th percentile.
28 World Economic and Social Survey 2013
There is a view that these two tracks, under which discussion is proceeding, need to converge so that the international community can emerge with one integrated set of goals. This conviction was reflected by the call, in the report of the United Nations System Task Team on the Post-2015 UN Development Agenda (2012), for a rebalancing of the post-2015 agenda by giving more importance to the goal of environmental protec-tion (and to peace, security and governance issues). Similar feelings were reflected in the recommendation of the inter-agency technical support team of the Open Working Group that technical input be sought from the Task Team.
Means of achieving an integrated post-2015 agenda
Causes of the climate change mitigation impasse
It is well known that one reason for the climate change mitigation impasse is the demand by some developed countries that large, fast-growing developing countries, such as China, India, Brazil, and South Africa, also accept greenhouse gas emissions reduction goals. Those developed countries argue that developing countries as a whole currently produce more greenhouse gas emissions than developed countries (chap. I) and that large, fast-growing developing countries have now become major emitters of greenhouse gases. As a result, effective climate change mitigation is no longer possible without the agreement of those developing countries to reduce the growth of their greenhouse gas emissions.
In response, developing countries point out that their per capita greenhouse gas emissions are still very low and of recent origin. By contrast, developed countries have been emitting at a high per capita level for several centuries (Raupach and others, 2007). Accordingly, it is unfair to impose restrictions on developing countries’ greenhouse gas emissions, which need to increase as these countries try to reduce poverty and raise the material standard of living of their populations. Reconciling these two opposing view-points has so far proved difficult.
Causes of human development concerns
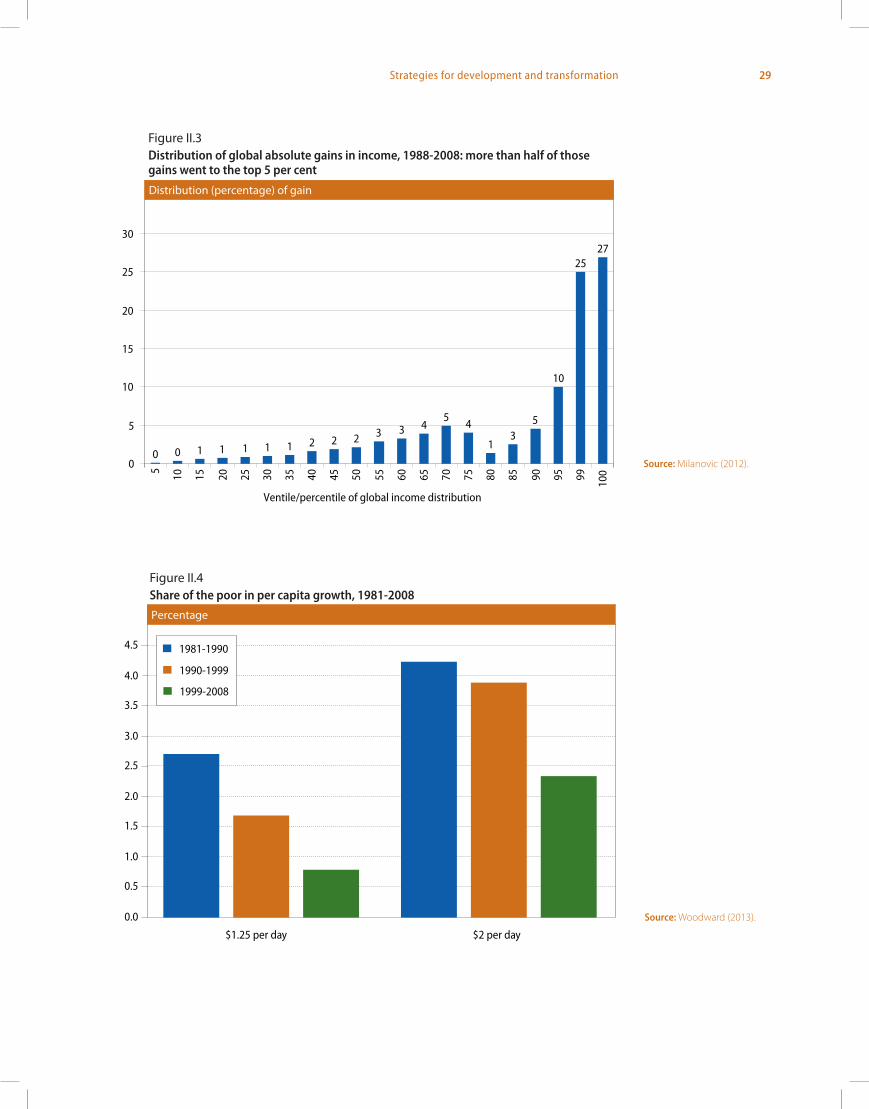
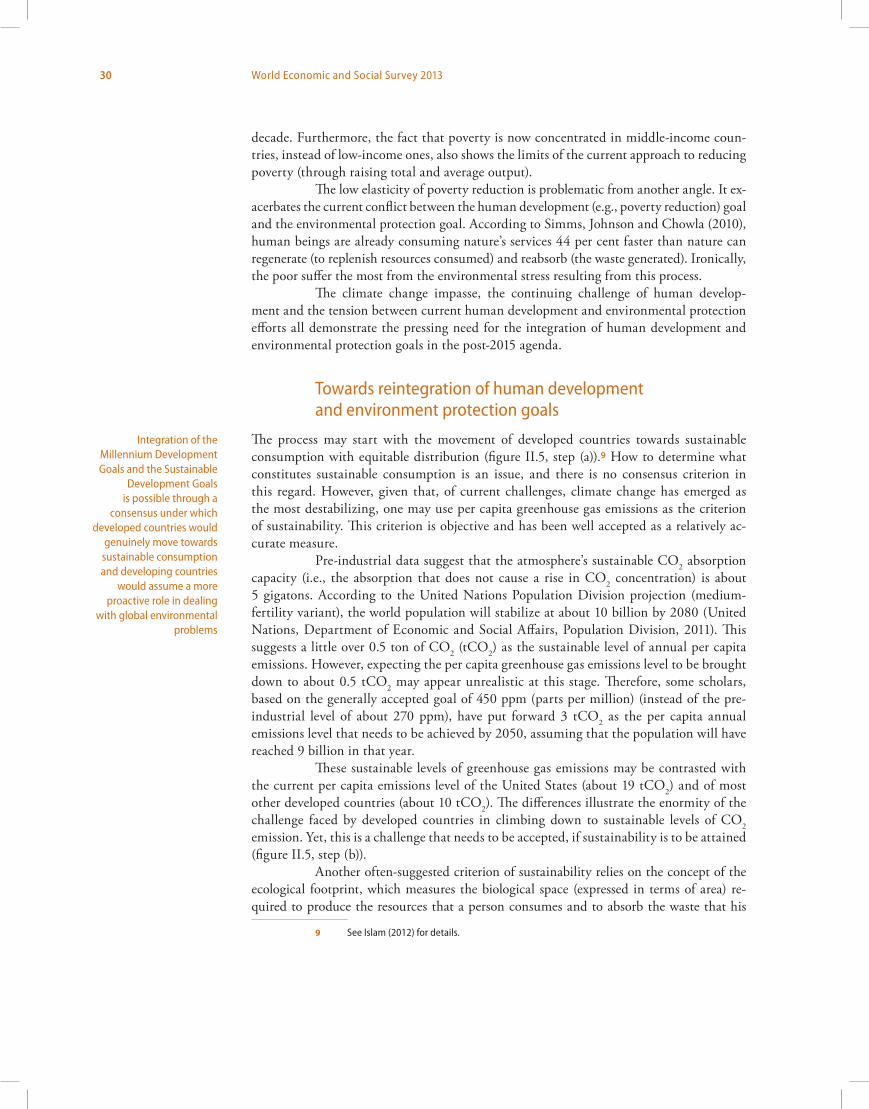
One main reason for the concerns regarding poverty eradication is unequal distribution of wealth and income (figure II.3). Within-country inequality has generally increased across the world in recent decades (United States of America, Congress of the United States, Congressional Budget Office, 2011; Galbraith, 2012; Milanovic, 2012; Stiglitz, 2012; Wilkinson, 2005; Wilkinson and Pickett, 2008). Owing to this inequality, the elasticity of poverty reduction with respect to increases in total or average income (of the country) is very low. For small improvements in poverty, large increases in the income of people in up-per income groups are necessary. According to Simms, Johnson and Chowla (2010, p. 18) and Woodward and Simms (2006, pp. 16-17), of every $100 worth of growth in world per capita income, the poor received only $2.20, during 1981-1990. This figure decreased to $0.60 during 1990-2001, because in the meantime, inequality had increased and the poor’s share of income decreased further (figure II.4). As a result, to reduce poverty by $1, it was necessary to raise global production and consumption by $166 during the latter
29Strategies for development and transformation
Figure II.3 Distribution of global absolute gains in income, 1988-2008: more than half of those gains went to the top 5 per cent
Figure II.3 Distribution of the global absolute gains in income, 1988-2008: more than half of those gains went to the top 5 per cent
Source: Based on Branko Milanovic, Global income inequality by the numbers: in history and now--an overview, World Bank Working Paper No. 6259, November 2012, Washington, D.C.
0 0 1 1 1 1 1 2 2 2 3 3 45
4
13
5
10
2527
0
5
10
15
20
25
30
5
10 15 20 25 30 35 40 45 50 55 60 65 70 75 80 85 90 95 99
100
Ventile/percentile of global income distribution
Distribution (percentage) of gain
Percentage
Figure II.4 Share of the poor in per capita growth, 1981-2001
Source: Woodward (2013).
0.0
0.5
1.0
1.5
2.0
2.5
3.0
3.5
4.0
4.5
$1.25 per day $2 per day
1981-1990
1990-1999
1999-2008
Figure II.4 Share of the poor in per capita growth, 1981-2008
Source: Milanovic (2012).
Source: Woodward (2013).
30 World Economic and Social Survey 2013
decade. Furthermore, the fact that poverty is now concentrated in middle-income coun-tries, instead of low-income ones, also shows the limits of the current approach to reducing poverty (through raising total and average output).
The low elasticity of poverty reduction is problematic from another angle. It ex-acerbates the current conflict between the human development (e.g., poverty reduction) goal and the environmental protection goal. According to Simms, Johnson and Chowla (2010), human beings are already consuming nature’s services 44 per cent faster than nature can regenerate (to replenish resources consumed) and reabsorb (the waste generated). Ironically, the poor suffer the most from the environmental stress resulting from this process.
The climate change impasse, the continuing challenge of human develop-ment and the tension between current human development and environmental protection efforts all demonstrate the pressing need for the integration of human development and environmental protection goals in the post-2015 agenda.
Towards reintegration of human development and environment protection goals
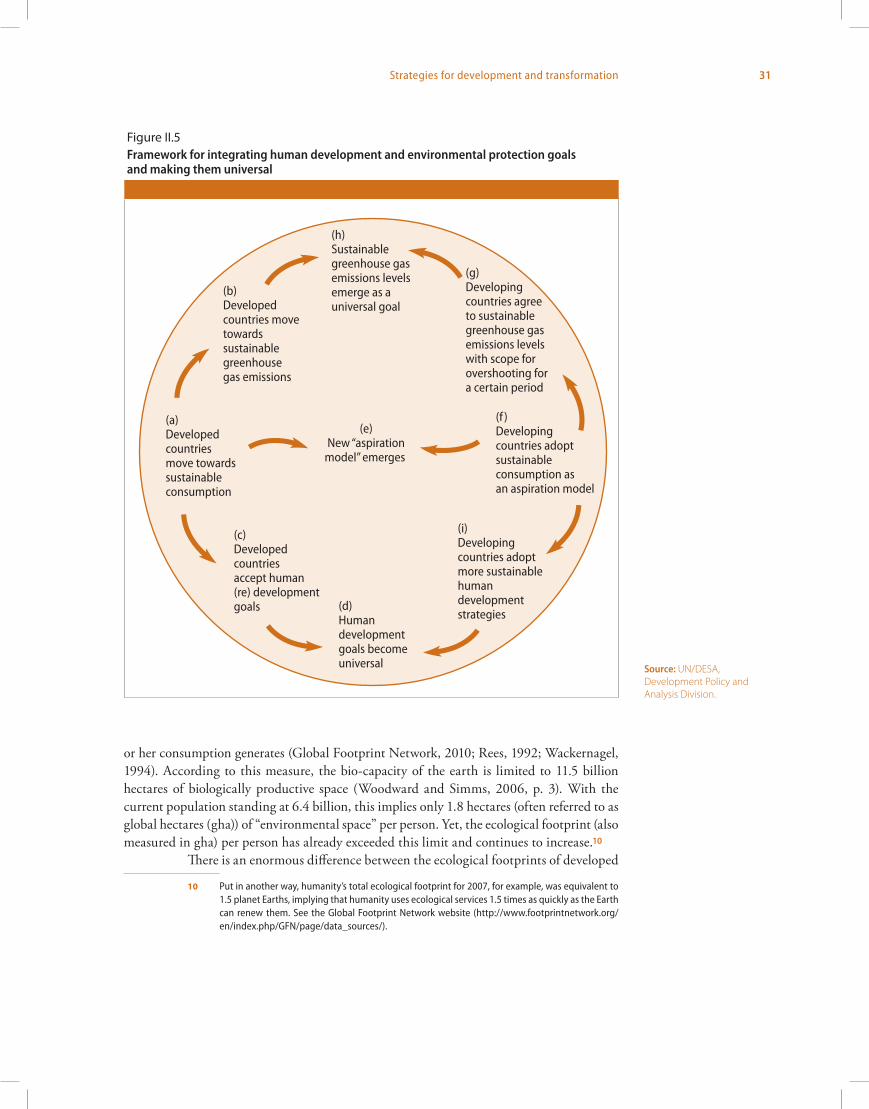
The process may start with the movement of developed countries towards sustainable consumption with equitable distribution (figure II.5, step (a)).9 How to determine what constitutes sustainable consumption is an issue, and there is no consensus criterion in this regard. However, given that, of current challenges, climate change has emerged as the most destabilizing, one may use per capita greenhouse gas emissions as the criterion of sustainability. This criterion is objective and has been well accepted as a relatively ac-curate measure.
Pre-industrial data suggest that the atmosphere’s sustainable CO2 absorption capacity (i.e., the absorption that does not cause a rise in CO2 concentration) is about 5 gigatons. According to the United Nations Population Division projection (medium-fertility variant), the world population will stabilize at about 10 billion by 2080 (United Nations, Department of Economic and Social Affairs, Population Division, 2011). This suggests a little over 0.5 ton of CO2 (tCO2) as the sustainable level of annual per capita emissions. However, expecting the per capita greenhouse gas emissions level to be brought down to about 0.5 tCO2 may appear unrealistic at this stage. Therefore, some scholars, based on the generally accepted goal of 450 ppm (parts per million) (instead of the pre-industrial level of about 270 ppm), have put forward 3 tCO2 as the per capita annual emissions level that needs to be achieved by 2050, assuming that the population will have reached 9 billion in that year.
These sustainable levels of greenhouse gas emissions may be contrasted with the current per capita emissions level of the United States (about 19 tCO2) and of most other developed countries (about 10 tCO2). The differences illustrate the enormity of the challenge faced by developed countries in climbing down to sustainable levels of CO2 emission. Yet, this is a challenge that needs to be accepted, if sustainability is to be attained (figure II.5, step (b)).
Another often-suggested criterion of sustainability relies on the concept of the ecological footprint, which measures the biological space (expressed in terms of area) re-quired to produce the resources that a person consumes and to absorb the waste that his
9 See Islam (2012) for details.
Integration of the Millennium Development Goals and the Sustainable
Development Goals is possible through a
consensus under which developed countries would
genuinely move towards sustainable consumption and developing countries
would assume a more proactive role in dealing
with global environmental problems
31Strategies for development and transformation
or her consumption generates (Global Footprint Network, 2010; Rees, 1992; Wackernagel, 1994). According to this measure, the bio-capacity of the earth is limited to 11.5 billion hectares of biologically productive space (Woodward and Simms, 2006, p. 3). With the current population standing at 6.4 billion, this implies only 1.8 hectares (often referred to as global hectares (gha)) of “environmental space” per person. Yet, the ecological footprint (also measured in gha) per person has already exceeded this limit and continues to increase.10
There is an enormous difference between the ecological footprints of developed
10 Put in another way, humanity’s total ecological footprint for 2007, for example, was equivalent to 1.5 planet Earths, implying that humanity uses ecological services 1.5 times as quickly as the Earth can renew them. See the Global Footprint Network website (http://www.footprintnetwork.org/en/index.php/GFN/page/data_sources/).
Figure II.5 Integrating the Millennium Development Goals and Sustainable Development Goals: means of integrating human development and environmental protection goals and making them universal
Source: UN/DESA, Development Policy and Analysis Division.
(h)Sustainable greenhouse gasemissions levelsemerge as a universal goal
(b)Developed countries movetowardssustainablegreenhousegas emissions
(a)Developedcountries move towardssustainableconsumption
(c)Developed countries accept human(re) developmentgoals (d)
Humandevelopmentgoals becomeuniversal
(g)Developingcountries agreeto sustainablegreenhouse gasemissions levelswith scope forovershooting fora certain period
(f )Developingcountries adoptsustainableconsumption asan aspiration model
(i)Developing countries adoptmore sustainablehuman developmentstrategies
(e)New “aspiration
model” emerges
Figure II.5 Framework for integrating human development and environmental protection goals and making them universal
Source: UN/DESA, Development Policy and Analysis Division.
32 World Economic and Social Survey 2013
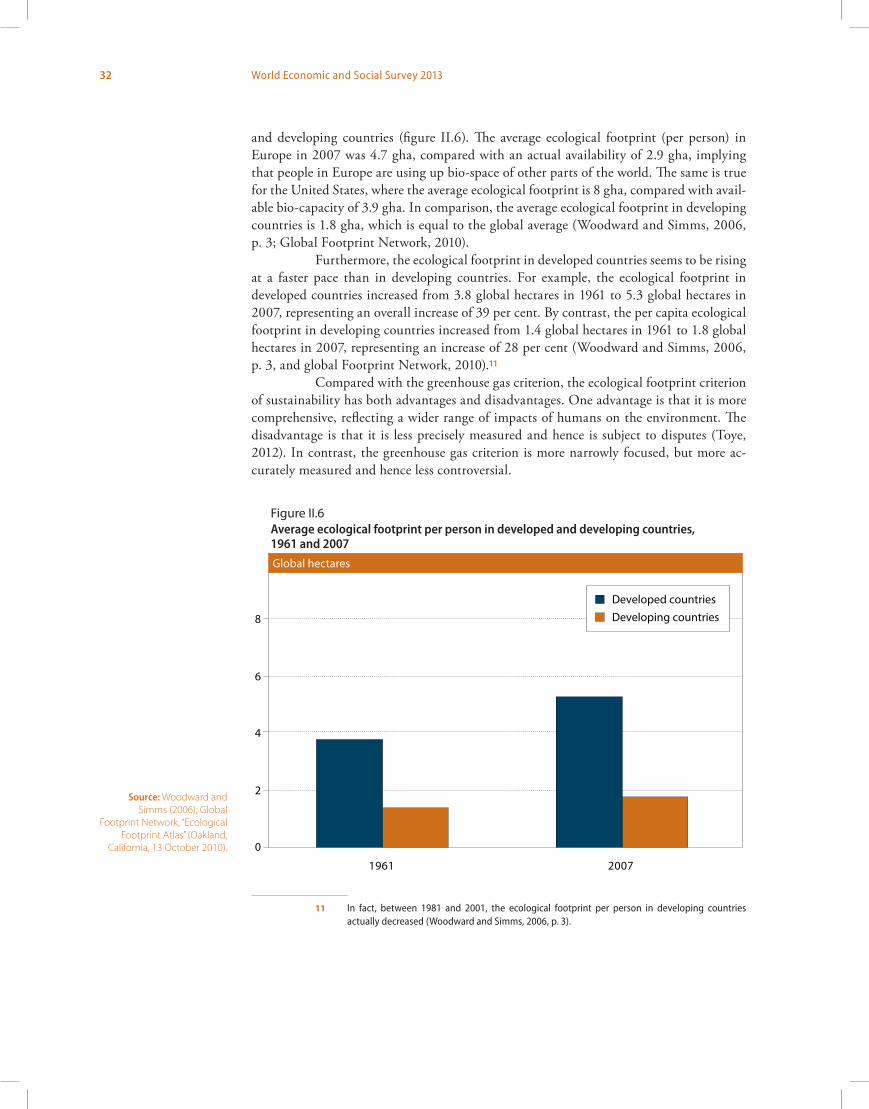
and developing countries (figure II.6). The average ecological footprint (per person) in Europe in 2007 was 4.7 gha, compared with an actual availability of 2.9 gha, implying that people in Europe are using up bio-space of other parts of the world. The same is true for the United States, where the average ecological footprint is 8 gha, compared with avail-able bio-capacity of 3.9 gha. In comparison, the average ecological footprint in developing countries is 1.8 gha, which is equal to the global average (Woodward and Simms, 2006, p. 3; Global Footprint Network, 2010).
Furthermore, the ecological footprint in developed countries seems to be rising at a faster pace than in developing countries. For example, the ecological footprint in developed countries increased from 3.8 global hectares in 1961 to 5.3 global hectares in 2007, representing an overall increase of 39 per cent. By contrast, the per capita ecological footprint in developing countries increased from 1.4 global hectares in 1961 to 1.8 global hectares in 2007, representing an increase of 28 per cent (Woodward and Simms, 2006, p. 3, and global Footprint Network, 2010).11
Compared with the greenhouse gas criterion, the ecological footprint criterion of sustainability has both advantages and disadvantages. One advantage is that it is more comprehensive, reflecting a wider range of impacts of humans on the environment. The disadvantage is that it is less precisely measured and hence is subject to disputes (Toye, 2012). In contrast, the greenhouse gas criterion is more narrowly focused, but more ac-curately measured and hence less controversial.
11 In fact, between 1981 and 2001, the ecological footprint per person in developing countries actually decreased (Woodward and Simms, 2006, p. 3).
Source: Woodward and Simms (2006); Global
Footprint Network, “Ecological Footprint Atlas” (Oakland,
California, 13 October 2010).
Global hectares
Figure II.6 Average ecological footprint per person in developed and developing countries, 1961 and 2007
Source: Woodward and Simms (2006), and Ecological Footprint Atlas 2010, Global Footprint Network.
0
2
4
6
8
1961 2007
Developed countriesDeveloping countries
Figure II.6 Average ecological footprint per person in developed and developing countries, 1961 and 2007
33Strategies for development and transformation
However, both the greenhouse gas criterion and the ecological footprint cri-terion reflect the same facts. First, the impact of human activities has already exceeded the capacity of the Earth to absorb it. Second, this breach has been due mainly to un-sustainable consumption in developed countries. Third, as developing countries try to emulate the consumption patterns and levels of developed countries, the breaches in the Earth’s planetary boundaries are becoming larger. For example, under current produc-tion technology, if the whole world wanted to consume at the 2001 level of the United States, resources equivalent to that of 15 planets like the Earth would be required (Simms, Johnson and Chowla, 2010, p. 5).
Thus, genuine movement by developed countries towards sustainable consump-tion will require sweeping changes in these countries. Until now, human development has generally been understood to consist in reduction of poverty, mortality rates, gender disparities in education, etc. The concept has therefore been perceived to be relevant to de-veloping countries only. However, a shift towards sustainable and equitable consumption will require significant changes in lifestyles and reorganization of the economy and society in developed countries too. Taken together, these changes will make up another phase of human development (figure II.5, step (c)). Understood in this way, human development will become a universal goal, instead of something applicable to developing countries only (figure II.5, step (d)).
Meanwhile, genuine moves towards sustainable and equitable consump-tion by developed countries may give rise to a new “aspiration model” for developing countries (figure II.5, step (e)), invoking a reciprocal response from the latter (figure II.5, step (f)). With regard to climate change, the new context may make it possible for develop-ing countries to accept sustainable greenhouse gas emissions levels as the ultimate goal, with the scope for overshooting those levels for a while (figure II.5, step (g)). It may be expected that the overshooting will not be as large in extent or for as long a period as has been the case for currently developed countries. Thus, sustainable greenhouse gas emissions levels may become a universal goal shared by both developed and developing countries (figure II.5, step (h)). A similar process may unfold with regard to other envi-ronmental goals.
On the human development side, the conventional goals of reduction of pover-ty, mortality, gender disparity, etc., will continue to be very much a part of the agenda for developing countries. However, these goals would now be pursued in a more sustainable way (figure II.5, step (i)). To the extent that the new aspiration model promotes equitable distribution in developing countries, it will become easier to achieve poverty reduction and other human development goals.
Overall, figure II.5 presents a framework within which both human develop-ment and environmental protection can become universal goals and be integrated, ending the current separation between their domains of application. This framework can provide the basis for the post-2015 agenda.
The ideas and the causal linkages presented in figure II.5 are abstract and very general. It is necessary to make them more concrete. By considering in some detail the changes that are necessary in developed and developing countries in order for the proposed framework to be effective, the next two sections attempt to provide that concreteness.
34 World Economic and Social Survey 2013
Strategies for transformation in developed countries
Role of technology in ensuring sustainability
The fact that the consumption pattern in developed countries is unsustainable has been known for quite some time. However, efforts to move away from this unsustainable pat-tern have so far focused mainly on technology.
The technological route to sustainability was supported by the concept of “decoupling” of economic growth from resource requirements (Pearce, Markandya and Barbier, 1989; Ocampo, 2009). The concept has in turn been interpreted in two ways. “Relative decoupling” implies an increase in output with a “less than proportion-ate” increase in the inputs required. “Absolute decoupling” implies an increase in output with “no” increase in inputs required. While there has been some progress in achieving relative decoupling, there is no evidence to support absolute decoupling (United Nations, 2011b). The aggregate volume of both resources used and waste generated continues to rise (Meadows and others, 1972; Meadows, Randers and Meadows, 2002; Turner, 2008).
The evidence, however, does not suggest that the importance of technology is to be discounted. Earlier predictions of resource exhaustion have been invalidated by tech-nological progress; and the advent of new technologies can serve as a “game changer” in future, too. For example, breakthroughs in hydrogen fuel technology and in technologies allowing extraction of carbon from the atmosphere to produce fuel can greatly reduce the greenhouse gas content of consumption. However, simply waiting for such technologies to arrive on the scene cannot be deemed a strategy (Brookes, 1990; Huesemann, 2003, 2004; Stern, 2007; United Nations, 2009). More importantly, the pace of development and adoption of new technologies depend on societal demand. Once the society decides on the kind of transformations that it wants to achieve, necessary technologies can develop in response to the demand. On the other hand, without such societal demand, even tech-nologies feasible in principle may remain undeveloped and unused (Jackson, 2010). It is therefore important to ascertain the ways in which consumption patterns need to change in order to achieve sustainability.
Shifts in consumption patterns
It may be anticipated that necessary changes in consumption patterns would move in some general directions.12 One desirable change would entail movement away from material towards non-material consumption. For example, reading e-books may be less greenhouse gas-intensive than cutting down forests and filling up wetlands in order to construct large houses, and commuting to work in sport utility vehicles (SUVs). It is instructive to note that some shift towards non-material consumption is occurring even within the current order of things, owing to the impact of Internet-based communications technology and as a result of increased awareness of the environmental impact of human activities. However, it is necessary to accelerate this shift through implementation of policies.
12 It should be noted in this regard that considerable variations across countries need to be accepted, as a reflection of their different physical and social conditions.
While technology has a key role to play in transiting
to sustainable consumption, developed countries need
to make conscious shifts from material to non-
material consumption, from a private to a public
mode of consumption, from one-time to multiple use of
products, and from use of non-biodegradable to use of
biodegradable material
35Strategies for development and transformation
Another desirable change would entail movement away from private to public modes of consumption. For example, use of public modes of transportation is less greenhouse gas-intensive than use of private cars. Similarly, use of a community pool is less energy- and resource-intensive than use by individual families of the private pool in their backyard.
Movement in a third direction of desirable change would consist in the reversal of the “one time use” mode of consumption. While this mode of consumption has its usefulness in certain spheres, such as health care, questions of overuse may be raised even here. In most other spheres, utilization of this mode of consumption is often unjustifiable, as it leads to overuse of resources and over-generation of waste.
A fourth direction of desirable change would entail discouraging development of spurious new models of essentially the same product, leading to unwarranted obsoles-cence of products and hence to wastage of resources and to generation of excessive waste.
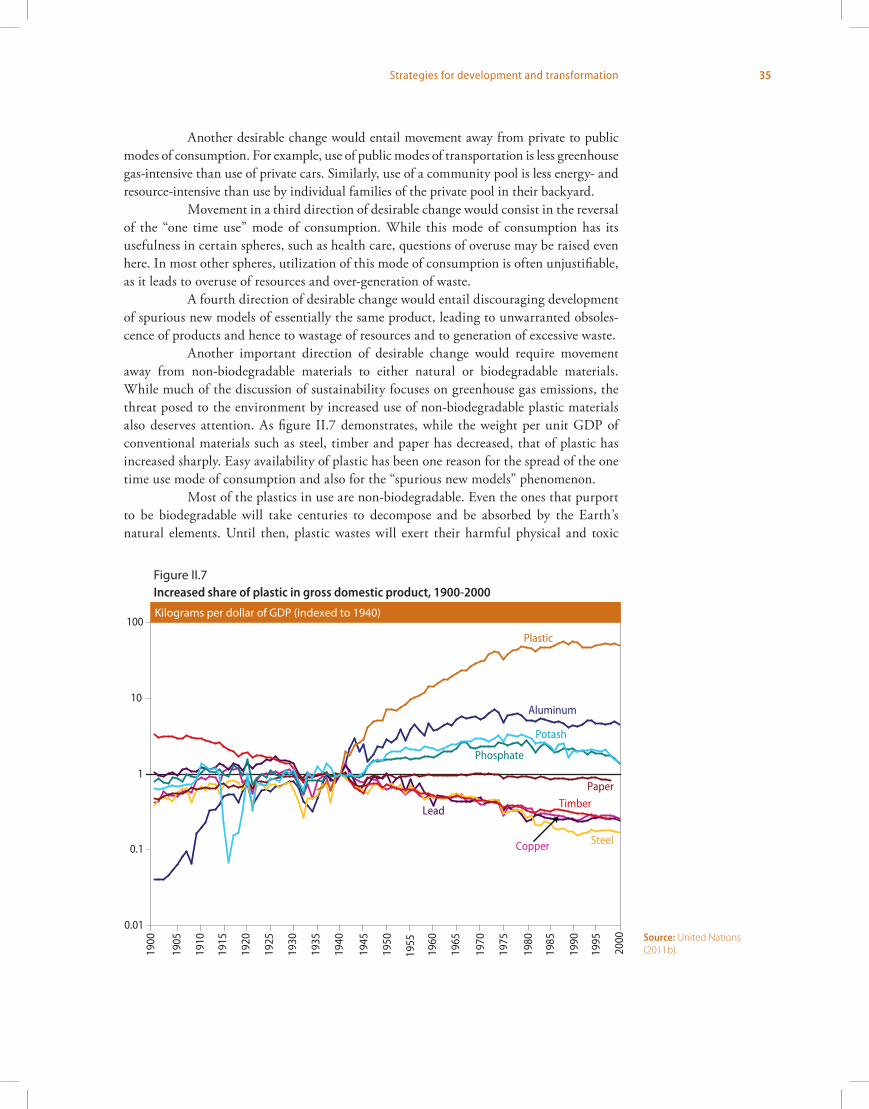
Another important direction of desirable change would require movement away from non-biodegradable materials to either natural or biodegradable materials. While much of the discussion of sustainability focuses on greenhouse gas emissions, the threat posed to the environment by increased use of non-biodegradable plastic materials also deserves attention. As figure II.7 demonstrates, while the weight per unit GDP of conventional materials such as steel, timber and paper has decreased, that of plastic has increased sharply. Easy availability of plastic has been one reason for the spread of the one time use mode of consumption and also for the “spurious new models” phenomenon.
Most of the plastics in use are non-biodegradable. Even the ones that purport to be biodegradable will take centuries to decompose and be absorbed by the Earth’s natural elements. Until then, plastic wastes will exert their harmful physical and toxic
Figure II.7Increased share of plastic in gross domestic product, 1900-2000
Source: United Nations (2011b).
Source: United Nations (2011).
Figure II.7 Increased share of plastic in gross domestic product, 1900-2000
Kilograms per dollar of GDP (indexed to 1940)
0.01
0.1
1
10
100
1900
1905
1910
1915
1920
1925
1930
1935
1940
1945
1950
1955
1960
1965
1970
1975
1980
1985
1990
1995
2000
Plastic
Aluminum
Potash
Phosphate
Paper
Steel
Timber
Copper
Lead
36 World Economic and Social Survey 2013
chemical influence on the Earth’s soil and water (Kaeb, 2011). Plastic waste has become a serious threat to inland water bodies, such as rivers and lakes, and even to the oceans and marine environment. Hence, substitution of plastic by natural fibre and production and use of rapidly decomposing plastic (in cases where natural substitutes are not avail-able) would represent an important direction of change in consumption and production practices post-2015.
The above discussion of desirable directions of change in consumption pat-terns is certainly not exhaustive. However, the general idea is clear: the changes have to be such that fewer resources are required and less waste is generated. The question is how such changes can be brought about.
Means of bringing about shifts in consumption patterns
In a market economy, prices can play an important role in moving consumption towards sustainability. It is well known that in the presence of externalities, market prices do not ensure efficient resource allocation and need to be corrected so as to internalize the exter-nalities. Thus, commodities and services involving high levels of greenhouse gas emissions need to be priced in such a way as to reflect the cost they impose through climate change. Similarly, products and services having a high plastic content need to be priced so as to reflect the cost that the disposal of plastic waste imposes on the environment. In most cases, necessary price corrections will have to take the form of taxes and subsidies.
There is strong evidence of the influence of price corrections on consump-tion behaviour. For example, high gasoline taxes in European countries and Japan have played a role in creating an environment where urbanization is more compact and public transportation is more important than in the United States, for example, and, currently, in China.
The necessity and importance of price correction are generally not denied. The challenge lies in determining which prices are to be changed and by how much, and in making these changes politically feasible. This in turn requires calculation of the damages and benefits from a particular product or activity to nature and society that are not captured by market prices. Environmental accounting therefore becomes important (Burritt, Hahn and Schaltegger, 2002; Nordhaus and Kokkelenburg, 1999; Owen, 2008; Pemberton and Ulph, 2000; Schaltegger and Burritt, 2000).
Environmental accounting
The report of the World Commission on Environment and Development (the Brundtland Commission) entitled Our Common Future (1987), had defined sustainable development as the process that “meets the needs of the present generation without compromising the ability of future generations to meet their own needs” (World Commission on Environment and Development, 1987). The concept inherent in this definition led to two versions of sustainability: “strong sustainability”, which does not allow substitut-ability between natural capital and produced capital (either physical or human), and “weak sustainability”, which allows such substitutability. In either case, proper account-ing (quantification and valuation) of natural capital and the services that it provides is
Means of bringing about desirable changes in
consumption include price corrections, taxes,
subsidies, environmental-economic accounting, and
emphasis on the strong concept of sustainability
37Strategies for development and transformation
a precondition for determining whether sustainability is ensured. The United Nations Environment Programme (UNEP) (2010a; 2011) has rightly noted that the world’s natu-ral capital “deserves a seat at the table”.
Preservation of capital for future generations also requires paying more at-tention to depreciation, in particular of natural capital (Kates, Parris and Leiserowitz, 2005). In fact, economists have shown that net concepts of output, such as net national product (NNP), are better measures of welfare than the corresponding gross measures, such as gross national product (GNP) (Asheim and Weitzman, 2001; Dasgupta, 1994; Dasgupta, Kristrom and Maler, 1997; Weitzman, 1976, 2000, 2003). One reason for the lesser prominence of the net measures of output, despite their theoretical optimality, is the difficulties encountered in the computation of depreciation (Hartwick, 1990; Weitzman, 1997). These difficulties are more salient in the case of natural capital, which itself has yet to be properly quantified and valuated (United Nations Environment Programme, 2005).
Fortunately, considerable progress has been made in this regard by the United Nations Statistics Division (UNSD), the Division for Sustainable Development of the United Nations Secretariat, UNEP and other organizations, and individual scholars. Through its System of Environmental-Economic Accounting (SEEA) project, UNSD has formulated guidelines for the quantification and valuation of natural capital and the various non-marketed services that it offers (box II.1). An important post-2015 goal may be to implement those guidelines and to make an estimation of natural capital and its depreciation part of national income accounts.
The fact that, initially, many difficulties and disagreements will remain with respect to the estimation of natural capital and its non-marketed services, is one reason why the concept of strong sustainability needs to be upheld. Otherwise, natural capital will quite possibly be underestimated and the decrease in natural capital will appear to be more than compensated by growth in produced capital. It is therefore important, within the context of encouraging implementation of environmental-economic accounting, that such undesirable unintended consequences be prevented.
Shifts in consumption and quality of life
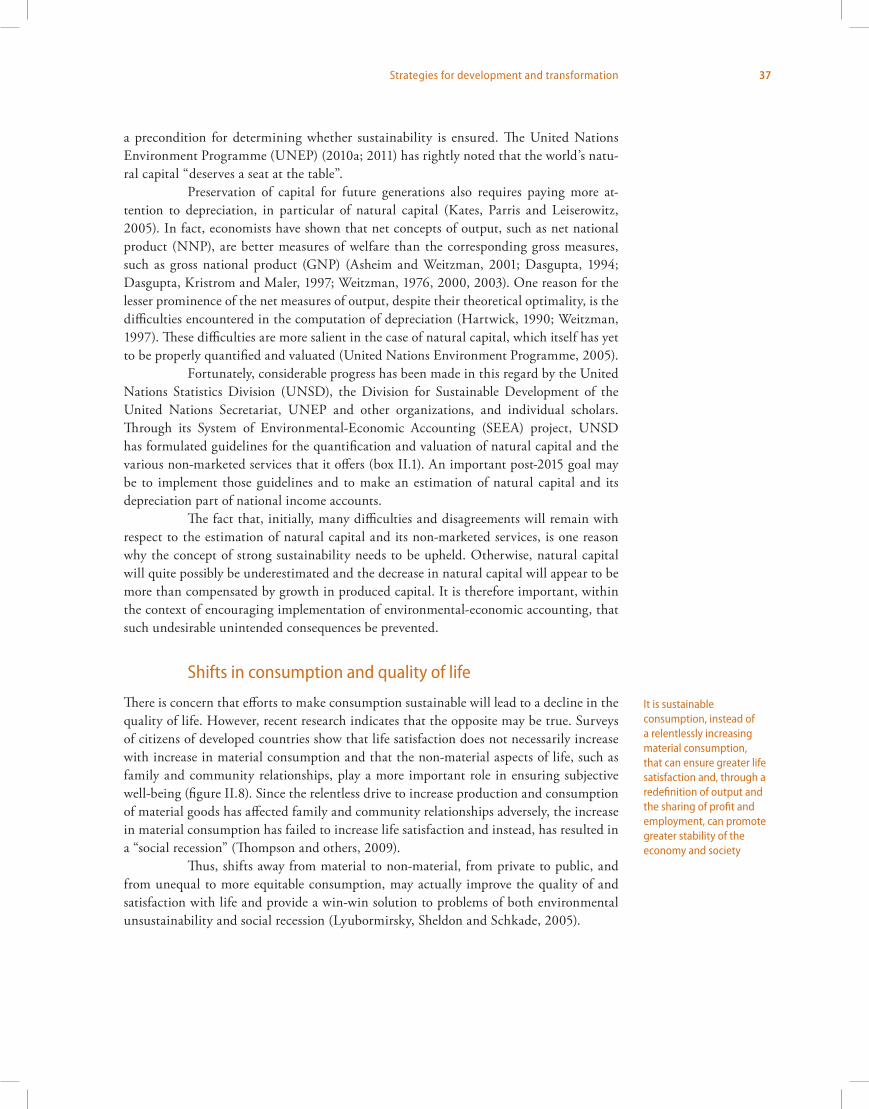
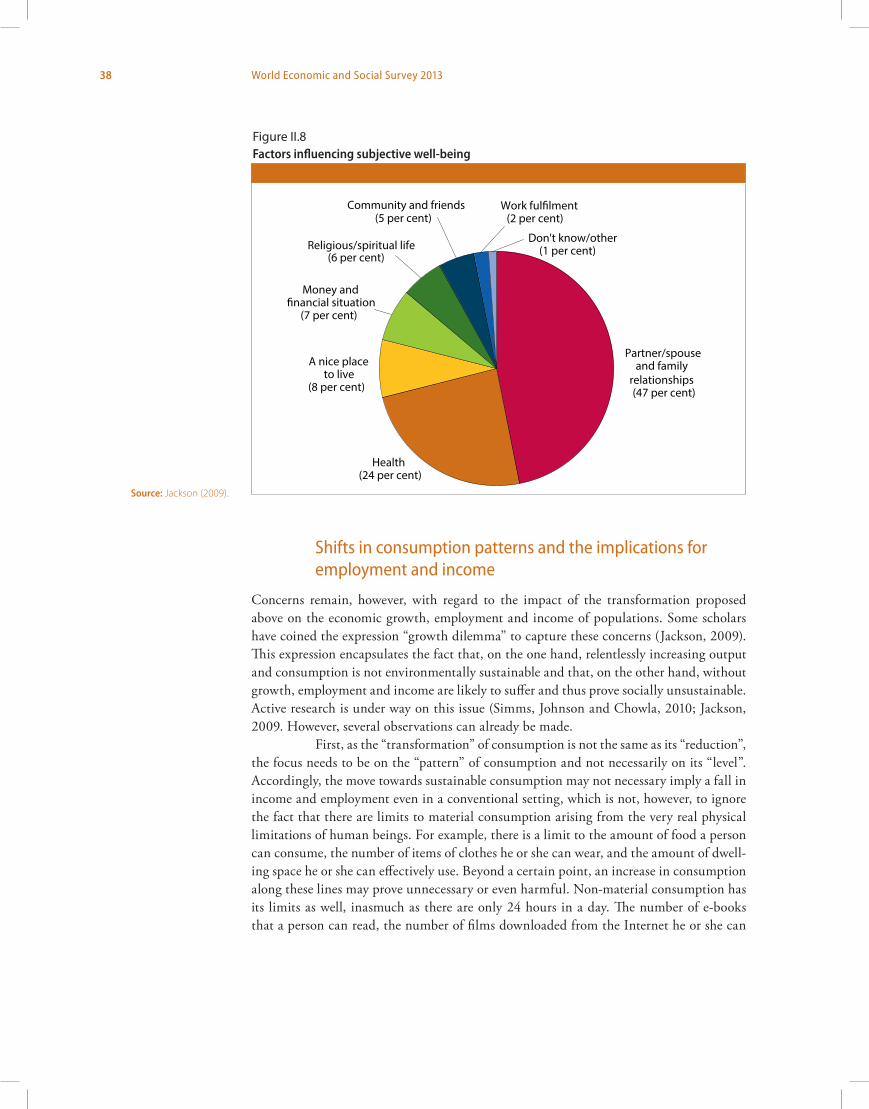
There is concern that efforts to make consumption sustainable will lead to a decline in the quality of life. However, recent research indicates that the opposite may be true. Surveys of citizens of developed countries show that life satisfaction does not necessarily increase with increase in material consumption and that the non-material aspects of life, such as family and community relationships, play a more important role in ensuring subjective well-being (figure II.8). Since the relentless drive to increase production and consumption of material goods has affected family and community relationships adversely, the increase in material consumption has failed to increase life satisfaction and instead, has resulted in a “social recession” (Thompson and others, 2009).
Thus, shifts away from material to non-material, from private to public, and from unequal to more equitable consumption, may actually improve the quality of and satisfaction with life and provide a win-win solution to problems of both environmental unsustainability and social recession (Lyubormirsky, Sheldon and Schkade, 2005).
It is sustainable consumption, instead of a relentlessly increasing material consumption, that can ensure greater life satisfaction and, through a redefinition of output and the sharing of profit and employment, can promote greater stability of the economy and society
38 World Economic and Social Survey 2013
Shifts in consumption patterns and the implications for employment and income
Concerns remain, however, with regard to the impact of the transformation proposed above on the economic growth, employment and income of populations. Some scholars have coined the expression “growth dilemma” to capture these concerns (Jackson, 2009). This expression encapsulates the fact that, on the one hand, relentlessly increasing output and consumption is not environmentally sustainable and that, on the other hand, without growth, employment and income are likely to suffer and thus prove socially unsustainable. Active research is under way on this issue (Simms, Johnson and Chowla, 2010; Jackson, 2009. However, several observations can already be made.
First, as the “transformation” of consumption is not the same as its “reduction”, the focus needs to be on the “pattern” of consumption and not necessarily on its “level”. Accordingly, the move towards sustainable consumption may not necessary imply a fall in income and employment even in a conventional setting, which is not, however, to ignore the fact that there are limits to material consumption arising from the very real physical limitations of human beings. For example, there is a limit to the amount of food a person can consume, the number of items of clothes he or she can wear, and the amount of dwell-ing space he or she can effectively use. Beyond a certain point, an increase in consumption along these lines may prove unnecessary or even harmful. Non-material consumption has its limits as well, inasmuch as there are only 24 hours in a day. The number of e-books that a person can read, the number of films downloaded from the Internet he or she can
Figure II.8 Factors in�uencing subjective well-being
Source: Jackson (2009).
Partner/spouse and family
relationships(47 per cent)
Health(24 per cent)
A nice place to live
(8 per cent)
Money and �nancial situation
(7 per cent)
Religious/spiritual life (6 per cent)
Community and friends (5 per cent)
Work ful�lment(2 per cent)
Don't know/other(1 per cent)
Figure II.8Factors influencing subjective well-being
Source: Jackson (2009).
39Strategies for development and transformation
view and the amount of time he or she can spend with family and friends are all limited. Thus, the issue of reorganization of the economy and society to deal with a situation where relentless quantitative growth of consumption is no longer desirable cannot be entirely sidestepped (Daly, 1991, 1996; Patel, 2010).
Second, the above considerations also point to the fact that the current meas-ures of output and income are not absolutes but rather social constructs of somewhat recent origin. As they reflect a particular arrangement of the economy and society, it is quite possible that those measures will be modified in the light of changing contexts and demands (Layard, 2005; Stiglitz, Sen and Fitoussi, 2010).13
Third, it may be noted that a shift of consumption towards non-material items may be complementary to an increase in productivity, because non-material consumption may require more leisure time.
The answer to the question of the potential impact of proposed changes in consumption on income and employment may therefore depend to a great extent on how distribution and the organization of the economy and society are carried out. If produc-tivity gains are shared widely, people may experience an increase in leisure time (to be devoted to non-material consumption, and family, friends, community and society) with-out suffering from a diminished income or unemployment. Thus, institutional changes facilitating sharing of employment and profit may be helpful in this regard. Weitzman (1984; 1985) and others have created models showing that a shared economy (where workers share profits of enterprises) produces better outcomes with regard to both employ-ment and productivity. Many business leaders are calling for a move away from profit and towards making “three P” (namely, people, planet and profit) the driving force behind business activities (Rahman, 2012). There is also a rising call for “social business”, under which entrepreneurs will be motivated by the desire to earn social recognition rather than private profit (Yunus, 2007; 2010). Implementing some of these concepts might be part of the post-2015 agenda. Strengthened political egalitarianism may be helpful in achieving wider distribution of productivity gains and in facilitating the move towards more socially motivated business operations.
Finally, it may be noted, in this connection, that transition to sustainable development will require development and diffusion of many new technologies, and that developed countries can provide leadership in this regard. Thus, the transition to sustain-able consumption may lead to the expansion of employment and income even within the traditional framework.
Having examined the broad directions of transformation necessary in devel-oped countries for sustainability, we now turn to a discussion of the directions of changes necessary for sustainability in developing countries.
13 In fact, some shifts from work and time devoted to the market to work and time devoted to non-market pursuits (family, community and society) can be helpful in improving life satisfaction. Devotion of more time to non-market activities may not imply unemployment per se but rather a more satisfying use of time. Redefining GDP to include non-marketed output with imputed values may ensure that the shifts mentioned above do not appear to signal a fall in a nation’s output level (see below).
40 World Economic and Social Survey 2013
System of Environmental-Economic Accounting 2012*
The System of Environmental-Economic Accounting 2012 (SEEA) provides a measurement framework within which to integrate environmental data in physical and monetary terms with economic data. SEEA organizes environmental information adopting a systems approach to stocks and flows, us-ing definitions and classifications that are consistent with those of the System of National Accounts (SNA).a The strength of the framework lies in the derivation of high-quality aggregates, which are comparable across countries, consistent over time and go beyond gross domestic product (GDP).
The System of Environmental-Economic Accounting 2012 Central Frameworkb (SEEA Central Framework (CF)) provides the statistical framework for categorizing and analysing stocks of indi-vidual environmental assets such as water, mineral and energy resources, timber, fish, land and soil, the flows of resources into the economy, the exchanges of products within the economy and the return of residuals from the economy. At its forty-third session in 2012, the Statistical Commission adopted the SEEA Central Framework as the initial version of the international statistical standard for environmental-economic accounts, on a par with the SNA, and encouraged a flexible and modular approach to its implementation, depending on country priorities and policy demands.c
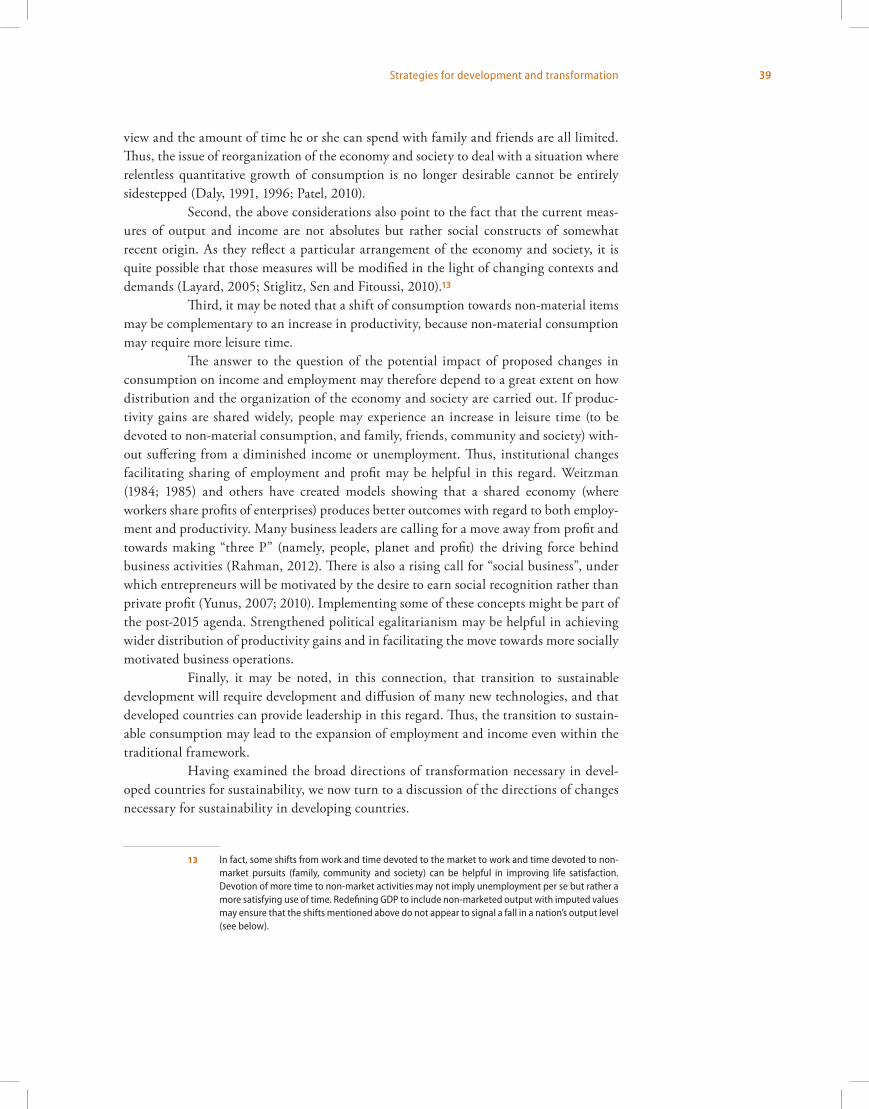
SEEA Applications and Extensions describes many indicators that may be generated through use of the SEEA Central Framework.d For example, the SEEA Central Framework may be used to calculate environmental efficiency (e.g., tons of CO2 generated per unit of GDP) and its evolving pattern over time so as to evaluate decoupling trends. Through its defined system for incorporating use of resources by industry, SEEA also permits evaluation of resource use over time by different industries and may be used to evaluate the generation of wastes discharged into the environment, by industry or sector. The figure above presents an application of data analysis through the SEEA
The United Nations Statistics Division has
developed a System of Environmental-Economic Accounting (SEEA), which
helps to reveal connections between the environment
and the economy. The SEEA Central Framework
is ready for use by all countries. SEEA has now
been extended to include Experimental Ecosystem
Accounting
Tons of CO2 per capita
Box II.2 Figure 2 Regional and global CO2-emissions per capita, from the production and consumption perspectives, based on data compiled for 27 European Union countries in 2006
Source: Eurostat.
ExportsDirect by private
households
Capital formationImports
Consumptionexpenditure
Domestic industries
Direct by privatehouseholds
0
2
4
6
8
10
12
Consumption Production
Final use in region
Regional and global CO2
emissions per capita, from the production and consumption perspectives, based on data compiled for 27 European countries in 2006
Source: Eurostat.
Box II.1
* Prepared by the United Nations Statistics Division.
** Available from http://unstats.un.org.a System of National
Accounts 2008 (United Nations publication,
Sales No. E.08.XVII.29).b United Nations
publication, forthcoming. The pre-edited text, issued as a white-cover publication.**
c See Official Records of the Economic and Social Council,
2012, Supplement No. 4 (E/2012/24), chap. I, sect. B,
decision 43/105. See also the background document,
entitled “Implementation strategy for the System of Environmental-Economic
Accounting (SEEA)”.** d See the background
document, entitled “System of Environmental-
Economic Accounting: SEEA Applications and
Extensions”.**
41Strategies for development and transformation
Sustainable development strategies in developing countries
A heterogeneous developing world
Developing countries have become more heterogeneous than they were when Agenda 21 was formulated. Some of them have proved successful in achieving industrialization and have reached per capita income levels close to those of developed countries. Others have not been so successful, and the difference between their per capita income levels and those of developed countries has increased further. This diversity among developing countries can be seen with regard to the achievement of the Millennium Development Goals as well. While some countries have made remarkable progress in achieving the Goals, others have lagged behind. These varied performances with regard to achievement of the Goals could be a point of departure in discussions concerning future efforts for sustainable development.
Further progress in achieving the current Millennium Development Goals
An important priority for developing countries post-2015 is therefore to consolidate the progress made, to overcome the weaknesses that remain and to strive to achieve further progress along the dimensions encompassed by the current Millennium Development Goals. With regard to Goal 1, as noted earlier, even countries that have done well in terms
Human development will remain the pre-eminent goal of developing countries, and further progress along existing dimensions of the Millennium Development Goals will require a more equitable distribution of endowments and income
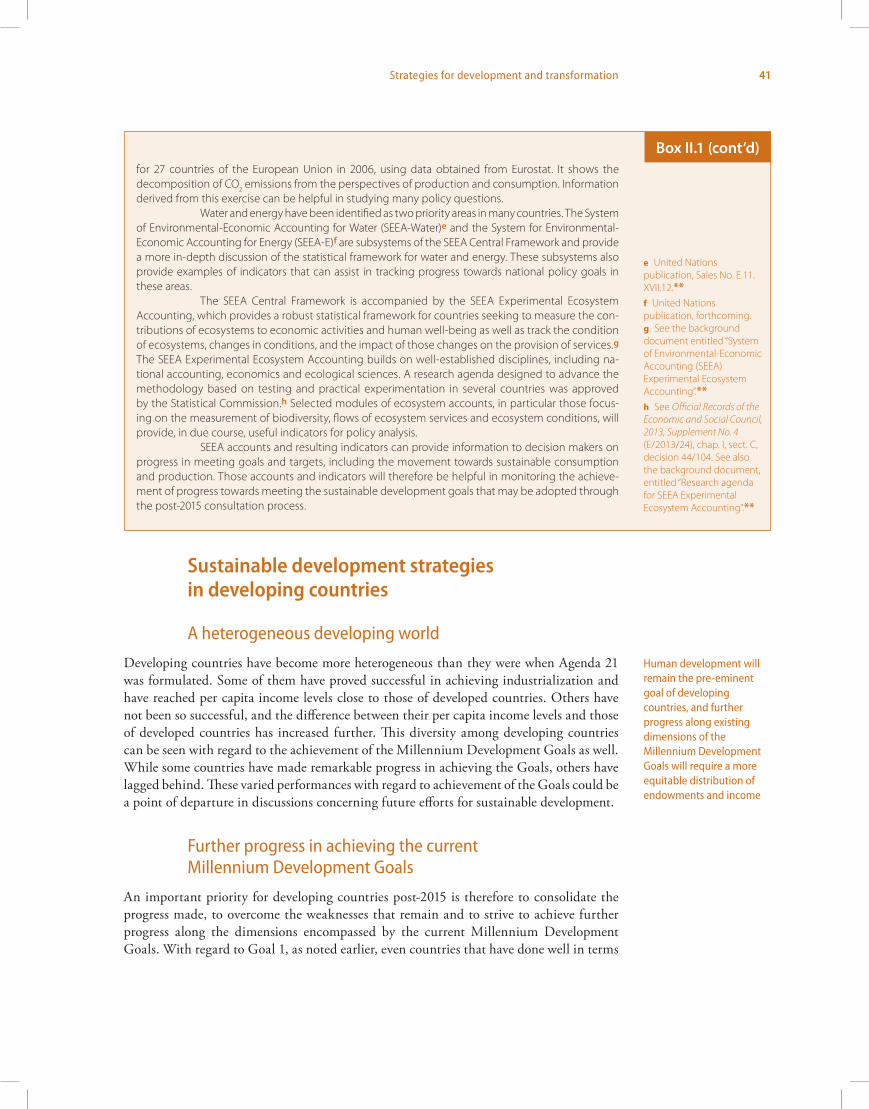
for 27 countries of the European Union in 2006, using data obtained from Eurostat. It shows the decomposition of CO2 emissions from the perspectives of production and consumption. Information derived from this exercise can be helpful in studying many policy questions.
Water and energy have been identified as two priority areas in many countries. The System of Environmental-Economic Accounting for Water (SEEA-Water)e and the System for Environmental-Economic Accounting for Energy (SEEA-E)f are subsystems of the SEEA Central Framework and provide a more in-depth discussion of the statistical framework for water and energy. These subsystems also provide examples of indicators that can assist in tracking progress towards national policy goals in these areas.
The SEEA Central Framework is accompanied by the SEEA Experimental Ecosystem Accounting, which provides a robust statistical framework for countries seeking to measure the con-tributions of ecosystems to economic activities and human well-being as well as track the condition of ecosystems, changes in conditions, and the impact of those changes on the provision of services.g
The SEEA Experimental Ecosystem Accounting builds on well-established disciplines, including na-tional accounting, economics and ecological sciences. A research agenda designed to advance the methodology based on testing and practical experimentation in several countries was approved by the Statistical Commission.h Selected modules of ecosystem accounts, in particular those focus-ing on the measurement of biodiversity, flows of ecosystem services and ecosystem conditions, will provide, in due course, useful indicators for policy analysis.
SEEA accounts and resulting indicators can provide information to decision makers on progress in meeting goals and targets, including the movement towards sustainable consumption and production. Those accounts and indicators will therefore be helpful in monitoring the achieve-ment of progress towards meeting the sustainable development goals that may be adopted through the post-2015 consultation process.
Box II.1 (cont’d)
e United Nations publication, Sales No. E.11.XVII.12.**f United Nations publication, forthcoming. g See the background document entitled “System of Environmental-Economic Accounting (SEEA) Experimental Ecosystem Accounting”.**h See Official Records of the Economic and Social Council, 2013, Supplement No. 4 (E/2013/24), chap. I, sect. C, decision 44/104. See also the background document, entitled “Research agenda for SEEA Experimental Ecosystem Accounting”.**
42 World Economic and Social Survey 2013
of the $1.25/day poverty line need to raise the income of their poor population further; otherwise, they may easily fall back into poverty, particularly because $1.25/day is a very low threshold for measuring poverty.
Second, in the post-2015 phase, it will be necessary to pay more attention to quality issues than was possible during the current phase. For example, as noted earlier, in an effort to achieve Millennium Development Goals 2 and 5, many countries made significant progress in raising school enrolment. However, less attention was paid to the quality of schooling. Quality issues are also important with regard to several other Goals, targets and indicators.
Third, more attention must be paid to coherence and compatibility of achieve-ment made along different dimensions. For example, improvement in schooling enrolment rates needs to match job creation rates. Thus, greater policy coherence at the national level must be an important characteristic of post-2015 development strategies.
The above discussion also suggests that it will be important in post-2015 strate-gies to pay greater attention to variations in temporal characteristics (such as duration, gestation lag, etc.) of various dimensions of human development efforts. For example, cash transfer programmes can exert rapid effects on poverty rates, and enrolment rates may also respond quickly to investments. However, for investment in education and health to be reflected (through human capital development) in a country’s economic (growth) performance, more time is required. It will therefore be important that a lack of return to investment in education and health in the short run not become a source of frustration. This also implies that much of the investment made by developing countries in health and education during the current Millennium Development Goals period may actually yield returns post-2015. The issues of policy coherence and gestation lags will be discussed in more detail later in this chapter.
Human development through more equitable distribution post-2015
An important lesson for post-2015 strategies learned from the current Millennium Development Goals experience is that equitable distribution of income, wealth and access to opportunities and resources helps greatly in achieving human development goals. This lesson was clear from the low elasticity of poverty reduction with respect to the increase in average and total income of a nation. Cross-country evidence provides additional sup-port for this lesson. For example, among Latin American countries, Brazil has been more successful in poverty reduction in part because it also succeeded in reducing inequality, countering the general trend in most other countries of an increase in inequality.
Research shows that redistribution of only 1 per cent of the income of the richest 20 per cent can provide as much additional income to the bottom 20 per cent of the population as would be derived from per capita income growth rate of between 8 and 25 per cent in the majority of developing countries, including almost all countries of Latin America and sub-Saharan Africa (Woodward and Simms, 2006, p. 19).
The fact that inequality in China rose as it succeeded in reducing the poverty rate does not negate the importance of equitable distribution for human development. It is well known that China and several other East Asian countries started off with a highly egalitarian distribution of physical and human capital which allowed the growth benefits to be distributed more widely and led to poverty reduction. A comparison with India
43Strategies for development and transformation
illustrates the point more clearly. Since India did not begin with an egalitarian distribution of its initial endowment, the impact on poverty reduction of its recent growth has been less dramatic than in China. Furthermore, the experiences of both China and India show that a highly unequal distribution is socially unsustainable. According to many observers, rising inequality is one reason behind the spread of insurgency in some parts of India.
The unequal distribution observed in developing countries is often the result of the imitation of the economic model and policies of developed countries. Moves towards more equitable distribution by developed countries will therefore be helpful in facilitating the switch towards greater equality in developing countries, too.
Development in a more environmentally constrained post-2015 world
While emphasis on further progress along existing dimensions of Millennium Development Goals is necessary, it is important to recall that unless human development and environ-mental protection goals are integrated, they will remain in competition, jeopardizing both sets of goals. It is therefore important that post-2015 strategies of human development internalize and reflect more thoroughly the environmental protection goal.
First of all, developing countries cannot ignore global environmental prob-lems, such as climate change. As a whole, they are no longer minor contributors to these problems. Without their playing an effective role, it will no longer be possible to solve global environmental problems.
At the same time, it is important to recall the heterogeneity of the developing world. There are now vast differences across developing countries with regard to their contribution to environmental problems and their potential role in resolving them. In particular, fast-growing large developing countries, such as China, India, Brazil and South Africa, currently assume an important role in dealing with global environmental as well as other problems. Their inclusion in the Group of Twenty (G20) reflects recognition of this changed reality.
On the other hand, a vast number of developing countries remain as marginal as before with regard to their role in creating global environmental problems and their po-tential for resolving them. Yet, many of them are, ironically, the worst sufferers from global environmental problems. Thus, many small island developing States, such as Maldives, face submergence due to the sea-level rise caused by climate change. The same situation is found in many least developed countries, such as Bangladesh, which is the world’s seventh largest country in terms of population (about 160 million inhabitants).
Industrialization causes not only global environmental problems but also severe local environmental problems. The processes that increase greenhouse gas emissions also lead to other types of air pollution whose impact is more local. Similarly, countries that engage in large-scale deforestation not only increase greenhouse gas emissions, but also suffer from landslides, the filling up of water bodies, and the diminution of biodiversity, etc. Rampant use and inappropriate disposal of plastic waste clog local drainage systems. Chemicalization of agriculture damages local water bodies, fish stock and the aquatic envi-ronment. Local adverse impact is another reason why developing countries may pay more attention to the environmental problems in their post-2015 strategies, within the framework of “common but differentiated responsibilities”.
Intense local consequences are another reason why developing countries may foster environmental protection
44 World Economic and Social Survey 2013
The South’s initiatives towards sustainable development
In fact, in recent years, many developing countries have been implementing initiatives that are more advanced than those of developed countries. For example, Ecuador has included the “rights of nature” in its 2008 constitution, thereby recognizing the inalien-able rights of ecosystems to exist and flourish. Under this initiative, individual citizens and organizations can petition and seek remedy in case of the violation of those rights, and the Government is obliged to offer such remedy (box II.2). Nature is thus considered a “subject” rather than, as in the traditional view, an “object”, to be conquered, occupied and exploited—or, at best, managed. Ecuador’s declaration of the rights of nature is part of the general initiative towards fostering buen vivir (the good life), which encompasses an alter-native view of development—one that, instead of focusing on material wealth, emphasizes harmony in the community and with nature. On the basis of this alternative philosophy of development, Ecuador has decided not to exploit the oil reserves in its Yasuni National Park in order to protect the forests of the Amazon. Many other developing countries have come forward with pioneering initiatives aimed towards sustainable development. Several developing countries, such as Bhutan, Costa Rica, Maldives and Tuvalu, have announced their goal of becoming carbon-neutral.14
The economics historian Alexander Gerschenkron coined the phrase “advan-tages of backwardness” to conceptualize the phenomenon whereby late industrializing countries benefit from technologies that were already developed by early industrializing countries.15 This concept may also be used in arguing for the leapfrogging of developing countries to more sustainable post-industrial consumption patterns and lifestyles.
There are several directions in which developing countries can go in making use of these advantages. One option is related to the fact that, in many cases, develop-ing countries face the task of “building anew” rather than modifying what has already been built. A clear example in this regard is provided by urbanization. Many developing countries need to create new urban spaces. In doing so, they can “plan from scratch” and make their cities environmentally more sustainable. Many developing countries are indeed doing just that. For example, China is creating brand-new “eco-cities”, which rely on public transportation and renewable energy, achieve high degrees of conservation and recycling and minimize carbon emissions and other waste. Similar initiatives can also be seen in Brazil, Cameroon, the Republic of Korea, the United Arab Emirates, etc.
Another direction along which such leapfrogging may be possible is that of promoting sustainable life practices. Members of the more environment-conscious segments of society in industrialized countries often revert to the practices of pre-industrial societies, albeit upgraded to a new level. They are returning to organic agriculture, non-motorized modes of transportation (walking and biking), use of non-fossil fuels as a source of en-ergy, vegetable-oriented diets, use of natural fibres instead of non-biodegradable ones, etc. Developing countries can make creative use of their pre-industrial heritage to promote these features of sustainable living. This does not mean, however, that sustainable development has to be a throwback to the past. Indeed, sustainable development has to be a forward-looking post-industrial goal which builds on the positive achievements of the industrial revolution.
14 Other countries and areas that have pledged carbon neutrality include Iceland, New Zealand, Norway, the Holy See and British Columbia.
15 Economists later used this conceptualization to explain the faster growth rates of many developing countries compared with richer economies.
Many countries of the South are going
beyond developed countries in promoting
sustainable consumption and protecting the
environment. The cooperation of developed countries can make these
initiatives of developing countries more successful
45Strategies for development and transformation
Success in leapfrogging of the above types will depend, to some extent, on the cooperation of developed countries. First, as shown in figure II.5, by presenting a new “aspiration model”, developed countries can encourage the leapfrogging process. Second, developed countries can provide technologies and market opportunities necessary for this process to be successful. For example, developing countries are eager to expand and switch to non-renewable sources of energy. Developed countries can develop large-capacity and cost-effective wind-power and solar-power technologies and make them available to devel-oping countries on favourable terms. Similarly, developed countries can open their market for organic produce from developing countries.
Diffusion of new energy technologies and expansion of organic agriculture in developing countries may also help developed countries switch to sustainable consumption. Thus, a virtuous cycle may unfold, confirming that achieving sustainable development has to be a joint task of both developing and developed countries. However, as shown above, the new aspiration model (based on sustainable consumption) does not necessarily have to be derived from developed countries. Based on their heritage and experience, developing countries are themselves offering aspiration models of sustainable development (box II.2).
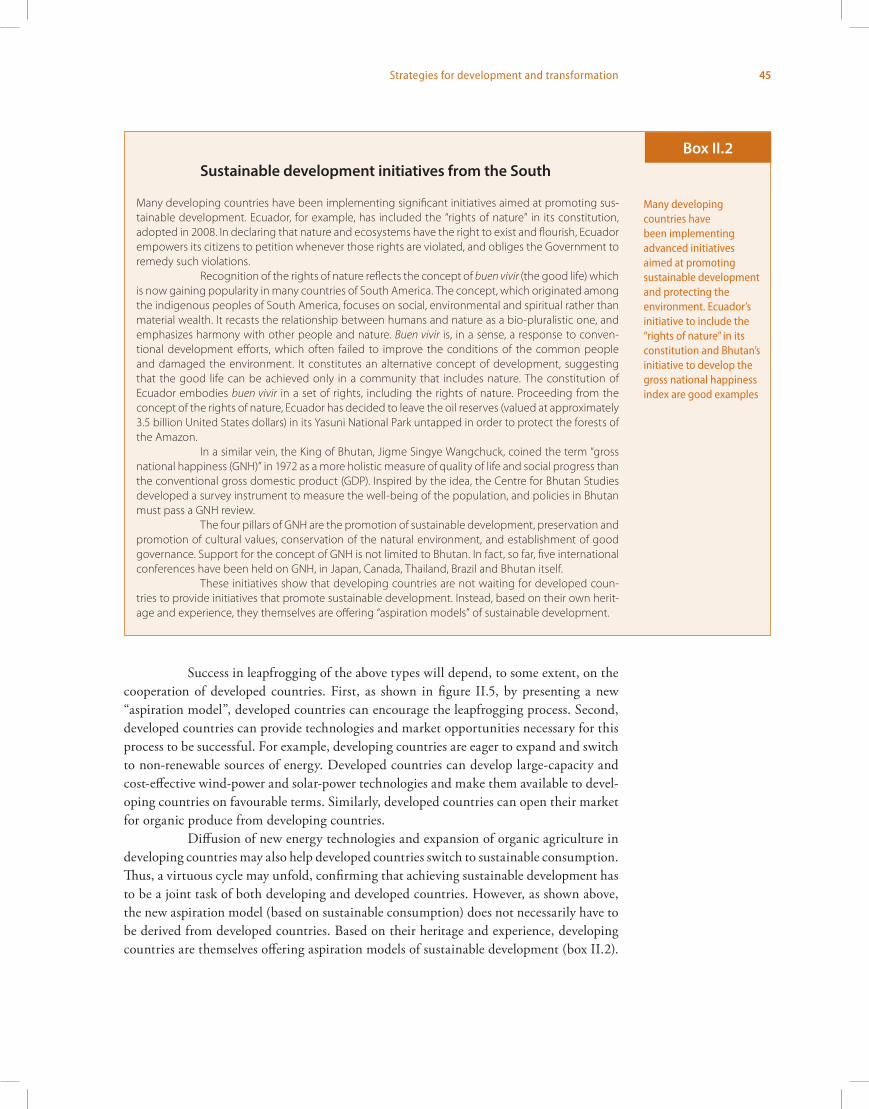
Sustainable development initiatives from the South
Many developing countries have been implementing significant initiatives aimed at promoting sus-tainable development. Ecuador, for example, has included the “rights of nature” in its constitution, adopted in 2008. In declaring that nature and ecosystems have the right to exist and flourish, Ecuador empowers its citizens to petition whenever those rights are violated, and obliges the Government to remedy such violations.
Recognition of the rights of nature reflects the concept of buen vivir (the good life) which is now gaining popularity in many countries of South America. The concept, which originated among the indigenous peoples of South America, focuses on social, environmental and spiritual rather than material wealth. It recasts the relationship between humans and nature as a bio-pluralistic one, and emphasizes harmony with other people and nature. Buen vivir is, in a sense, a response to conven-tional development efforts, which often failed to improve the conditions of the common people and damaged the environment. It constitutes an alternative concept of development, suggesting that the good life can be achieved only in a community that includes nature. The constitution of Ecuador embodies buen vivir in a set of rights, including the rights of nature. Proceeding from the concept of the rights of nature, Ecuador has decided to leave the oil reserves (valued at approximately 3.5 billion United States dollars) in its Yasuni National Park untapped in order to protect the forests of the Amazon.
In a similar vein, the King of Bhutan, Jigme Singye Wangchuck, coined the term “gross national happiness (GNH)” in 1972 as a more holistic measure of quality of life and social progress than the conventional gross domestic product (GDP). Inspired by the idea, the Centre for Bhutan Studies developed a survey instrument to measure the well-being of the population, and policies in Bhutan must pass a GNH review.
The four pillars of GNH are the promotion of sustainable development, preservation and promotion of cultural values, conservation of the natural environment, and establishment of good governance. Support for the concept of GNH is not limited to Bhutan. In fact, so far, five international conferences have been held on GNH, in Japan, Canada, Thailand, Brazil and Bhutan itself.
These initiatives show that developing countries are not waiting for developed coun-tries to provide initiatives that promote sustainable development. Instead, based on their own herit-age and experience, they themselves are offering “aspiration models” of sustainable development.
Many developing countries have been implementing advanced initiatives aimed at promoting sustainable development and protecting the environment. Ecuador’s initiative to include the “rights of nature” in its constitution and Bhutan’s initiative to develop the gross national happiness index are good examples
Box II.2
46 World Economic and Social Survey 2013
Challenges of financing human and sustainable development
As noticed above, overcoming the weaknesses in the achievement of the Millennium Development Goals on which apparent progress has been satisfactory and accelerating the pace with regard to the Goals on which progress so far has not been satisfactory remain important tasks for developing countries and the world community. Research shows that considerable financial challenges will have to be overcome if these tasks are to be accomplished. Evidence drawn from country-level economy-wide modelling analyses for 27 developing countries (with 18 from Latin America and 9 from Africa) suggests that achieving the Millennium Development Goals by 2015 will require a significant increase in public spending in developing countries.16 The analyses started with the establishment of a “business as usual” scenario which projected the progress towards targets of the Millennium Development Goals that would be achieved under the currently expected pace of economic growth and existing public spending priorities and budget financ-ing policies. This baseline scenario allows non-linearities in the effectiveness of social spending in achieving various targets of the Goals. The results showed that, although all 27 countries would make substantial progress towards achieving the Goals even under the business-as-usual scenario, only two countries (Chile and Cuba) would fully meet by 2015 a set of targets for primary school completion, reduction of child and maternal mortality rates, and expanded coverage of drinking water and basic sanitation.
The modelling analyses also probed a number of policy scenarios under which public spending was stepped up as much as needed to create a path towards meeting the human development goals by 2015. From a comparison of these policy scenarios and the business-as-usual scenario, it was found that 18 countries would need to raise their public spending by 2 percentage points of GDP on average for each year until 2015. For some countries, many of them least developed countries, this figure increases to about 7 per cent.
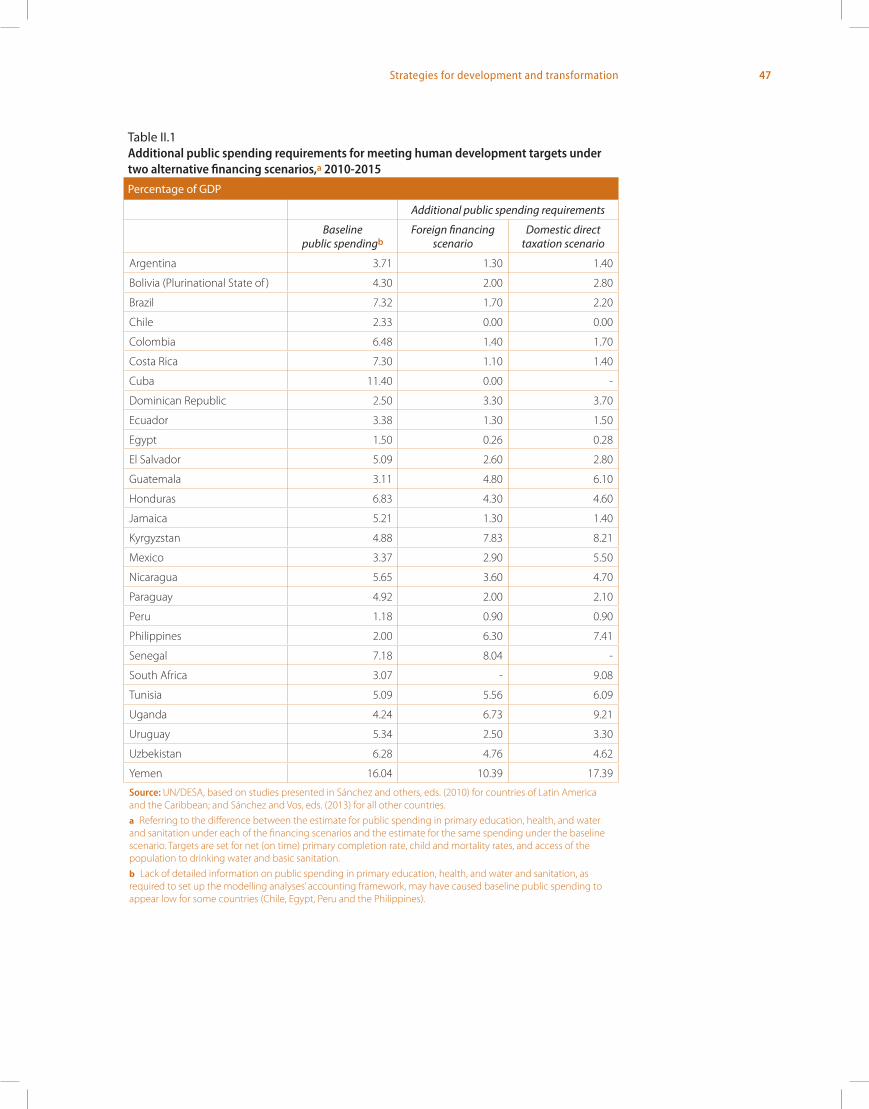
The modelling analyses were redone for six countries of Latin America and the Caribbean to take into consideration the effects of the recent global financial crisis which caused a growth slowdown in many countries, thereby requiring changes in the baseline assumptions (see Sánchez and Vos, 2010). It was found that the additional public spending requirements specifically owing to the crisis would range between 1.6 and 3.4 per cent of GDP per year between 2010 and 2015. These spending requirements are on top of those that were estimated for those six countries (table II.1).
16 These analyses were conducted by national researchers and government experts with technical support from UN/DESA and the World Bank. At the core of the economy-wide modelling framework used is a dynamic computable general equilibrium (CGE) model called Maquette for MDG Simulations (MAMS). This model was developed originally at the World Bank and was subsequently improved in numerous country-specific applications in collaboration with UN/DESA and national experts (Lofgren, Cicowiez and Diaz-Bonílla, 2013). The main results of the modelling analyses have been reported in Sánchez and Vos, eds. (2013) and Sánchez and others, eds. (2010) who covered, respectively, 9 case studies of countries of Africa and Asia and 18 case studies of countries of Latin America and the Caribbean.
47Strategies for development and transformation
Table II.1 Additional public spending requirements for meeting human development targets under two alternative financing scenarios,a 2010-2015
Percentage of GDP
Additional public spending requirements
Baseline public spendingb
Foreign financing scenario
Domestic direct taxation scenario
Argentina 3.71 1.30 1.40
Bolivia (Plurinational State of ) 4.30 2.00 2.80
Brazil 7.32 1.70 2.20
Chile 2.33 0.00 0.00
Colombia 6.48 1.40 1.70
Costa Rica 7.30 1.10 1.40
Cuba 11.40 0.00 -
Dominican Republic 2.50 3.30 3.70
Ecuador 3.38 1.30 1.50
Egypt 1.50 0.26 0.28
El Salvador 5.09 2.60 2.80
Guatemala 3.11 4.80 6.10
Honduras 6.83 4.30 4.60
Jamaica 5.21 1.30 1.40
Kyrgyzstan 4.88 7.83 8.21
Mexico 3.37 2.90 5.50
Nicaragua 5.65 3.60 4.70
Paraguay 4.92 2.00 2.10
Peru 1.18 0.90 0.90
Philippines 2.00 6.30 7.41
Senegal 7.18 8.04 -
South Africa 3.07 - 9.08
Tunisia 5.09 5.56 6.09
Uganda 4.24 6.73 9.21
Uruguay 5.34 2.50 3.30
Uzbekistan 6.28 4.76 4.62
Yemen 16.04 10.39 17.39
Source: UN/DESA, based on studies presented in Sánchez and others, eds. (2010) for countries of Latin America and the Caribbean; and Sánchez and Vos, eds. (2013) for all other countries.a Referring to the difference between the estimate for public spending in primary education, health, and water and sanitation under each of the financing scenarios and the estimate for the same spending under the baseline scenario. Targets are set for net (on time) primary completion rate, child and mortality rates, and access of the population to drinking water and basic sanitation.b Lack of detailed information on public spending in primary education, health, and water and sanitation, as required to set up the modelling analyses’ accounting framework, may have caused baseline public spending to appear low for some countries (Chile, Egypt, Peru and the Philippines).
48 World Economic and Social Survey 2013
The modelling analyses also yield results that help in examining and com-paring the implications of alternative ways of financing the additional spending require-ments mentioned above. The implications were gauged by the differential impact on GDP growth. It was found that domestic financing, using, for example, direct taxation, tends to yield a less positive impact on GDP growth than does foreign financing (except for Uzbekistan). This result is due to the fact that increased government taxation decreases private disposable incomes and hence aggregate domestic demand. Investors may foresee lower net profits for the future and therefore choose to reduce investments. The crowding out of private consumption and investment is what reduces GDP growth and employ-ment, hurting in the process private provisioning of, as well as the demand for, social services. This feedback effect requires the government to invest more to compensate for the loss of private spending in social sectors in order to ensure achievement of the human development goals, thereby incurring even more public spending.17 The “crowding in” from using tax revenues to finance public expenditures and investments may not take full effect in a short period of time, as explained further below.
There are trade-offs associated with foreign financing too. It is well known that the inflow of foreign currency, whether from borrowing or from receiving grant aid, may lead to real exchange-rate appreciation, harming the tradable sector. This will be particularly the case when the amounts are spent on non-tradable social services, as would be required to achieve the Millennium Development Goals. The appreciation of the real exchange rate may result in what is often labelled as Dutch disease if it leads to resource allocation away from export industries, resulting in an undesirable structural change en-tailing the move away from dynamic production activities.18 This shift would typically be difficult and time-consuming to reverse should other neutralizing and coherent policies not be put in place at the same time.
Regarding investments made to achieve the Millennium Development Goals, another important issue concerns the gestation lag for the fruition of these investments in terms of higher GDP growth. This is particularly true for investments in the education and health sectors. For example, children need to go through one or more educational cycles and there needs to be improved child and maternal health care today for there to be a pay-off in terms of healthier students and workers several years from now. Countries will require more rapid and sustained economic growth to reduce the costs associated with stepping up upfront public spending.
Important insights in this regard have also surfaced from another update of the modelling analyses for 4 of the 27 developing countries (Bolivia (Plurinational State of), Costa Rica, Uganda and Yemen) (see Sánchez and Cicowiez, 2013). These updates also extended the time frame of simulated scenarios to determine long-term pay-offs of Millennium Development Goals-related investments. First of all, it was found that, be-cause of the trade-offs discussed above, the growth effects of the increased Millennium Development Goals-related investment remain limited during the period up to 2015. The GDP growth rate in these countries was found to increase by 0.6-1.8 percentage points
17 The scenario analyses also indicate that tax financing would still be less costly as compared with the case where the government resorts to domestic borrowing in most cases, excluding countries where the “demand compression” effect of higher direct taxation appears to be particularly strong.
18 Repayment of newly acquired loans under a foreign borrowing scenario may offset some of the appreciation of the real exchange rate in the long term. The most important resource allocation effects from the relative price shift will occur, however, in the short term before the economy has had enough time to adjust.
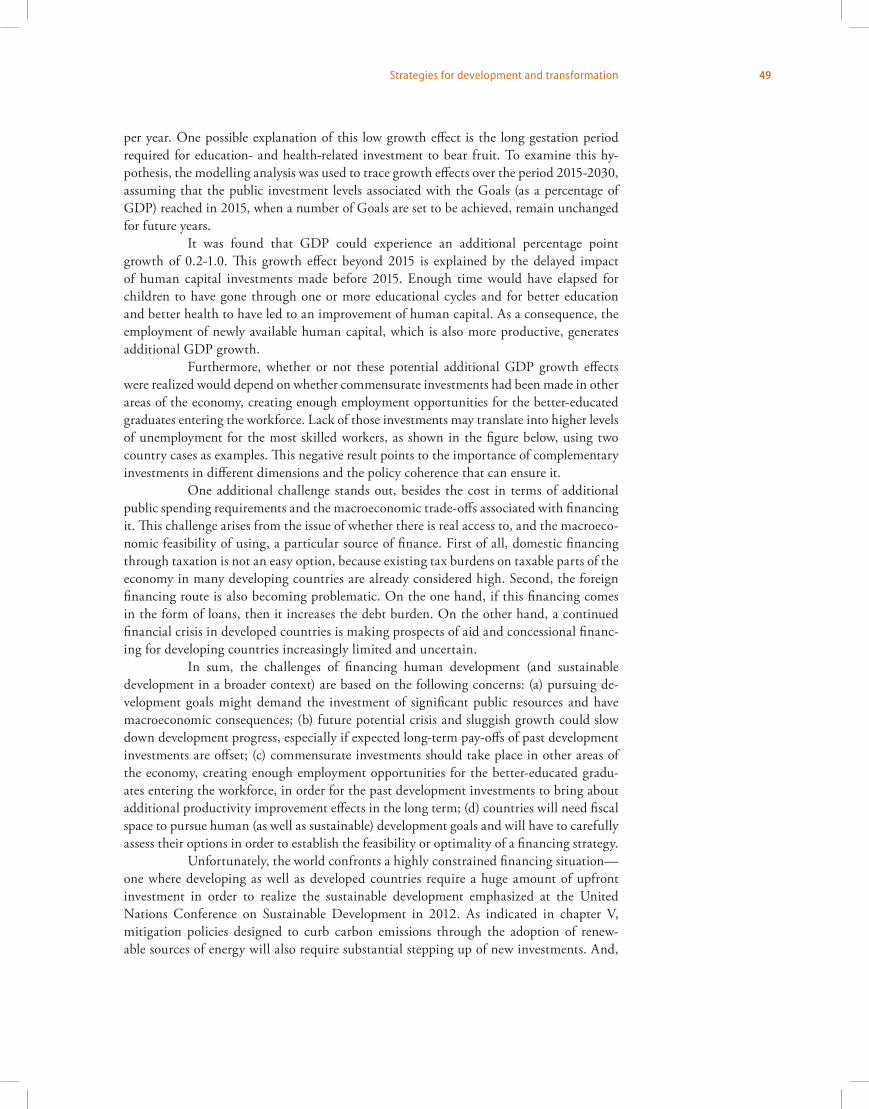
49Strategies for development and transformation
per year. One possible explanation of this low growth effect is the long gestation period required for education- and health-related investment to bear fruit. To examine this hy-pothesis, the modelling analysis was used to trace growth effects over the period 2015-2030, assuming that the public investment levels associated with the Goals (as a percentage of GDP) reached in 2015, when a number of Goals are set to be achieved, remain unchanged for future years.
It was found that GDP could experience an additional percentage point growth of 0.2-1.0. This growth effect beyond 2015 is explained by the delayed impact of human capital investments made before 2015. Enough time would have elapsed for children to have gone through one or more educational cycles and for better education and better health to have led to an improvement of human capital. As a consequence, the employment of newly available human capital, which is also more productive, generates additional GDP growth.
Furthermore, whether or not these potential additional GDP growth effects were realized would depend on whether commensurate investments had been made in other areas of the economy, creating enough employment opportunities for the better-educated graduates entering the workforce. Lack of those investments may translate into higher levels of unemployment for the most skilled workers, as shown in the figure below, using two country cases as examples. This negative result points to the importance of complementary investments in different dimensions and the policy coherence that can ensure it.
One additional challenge stands out, besides the cost in terms of additional public spending requirements and the macroeconomic trade-offs associated with financing it. This challenge arises from the issue of whether there is real access to, and the macroeco-nomic feasibility of using, a particular source of finance. First of all, domestic financing through taxation is not an easy option, because existing tax burdens on taxable parts of the economy in many developing countries are already considered high. Second, the foreign financing route is also becoming problematic. On the one hand, if this financing comes in the form of loans, then it increases the debt burden. On the other hand, a continued financial crisis in developed countries is making prospects of aid and concessional financ-ing for developing countries increasingly limited and uncertain.
In sum, the challenges of financing human development (and sustainable development in a broader context) are based on the following concerns: (a) pursuing de-velopment goals might demand the investment of significant public resources and have macroeconomic consequences; (b) future potential crisis and sluggish growth could slow down development progress, especially if expected long-term pay-offs of past development investments are offset; (c) commensurate investments should take place in other areas of the economy, creating enough employment opportunities for the better-educated gradu-ates entering the workforce, in order for the past development investments to bring about additional productivity improvement effects in the long term; (d) countries will need fiscal space to pursue human (as well as sustainable) development goals and will have to carefully assess their options in order to establish the feasibility or optimality of a financing strategy.
Unfortunately, the world confronts a highly constrained financing situation—one where developing as well as developed countries require a huge amount of upfront investment in order to realize the sustainable development emphasized at the United Nations Conference on Sustainable Development in 2012. As indicated in chapter V, mitigation policies designed to curb carbon emissions through the adoption of renew-able sources of energy will also require substantial stepping up of new investments. And,
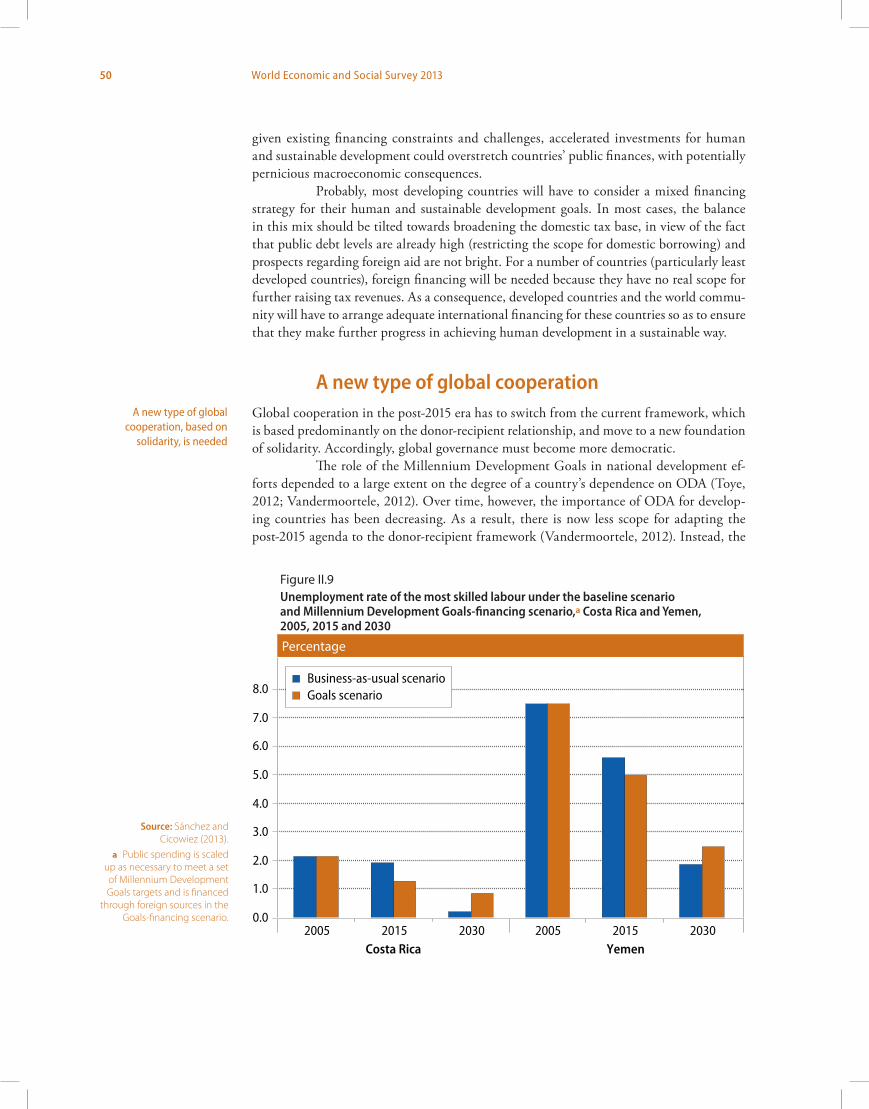
50 World Economic and Social Survey 2013
given existing financing constraints and challenges, accelerated investments for human and sustainable development could overstretch countries’ public finances, with potentially pernicious macroeconomic consequences.
Probably, most developing countries will have to consider a mixed financing strategy for their human and sustainable development goals. In most cases, the balance in this mix should be tilted towards broadening the domestic tax base, in view of the fact that public debt levels are already high (restricting the scope for domestic borrowing) and prospects regarding foreign aid are not bright. For a number of countries (particularly least developed countries), foreign financing will be needed because they have no real scope for further raising tax revenues. As a consequence, developed countries and the world commu-nity will have to arrange adequate international financing for these countries so as to ensure that they make further progress in achieving human development in a sustainable way.
A new type of global cooperation Global cooperation in the post-2015 era has to switch from the current framework, which is based predominantly on the donor-recipient relationship, and move to a new foundation of solidarity. Accordingly, global governance must become more democratic.
The role of the Millennium Development Goals in national development ef-forts depended to a large extent on the degree of a country’s dependence on ODA (Toye, 2012; Vandermoortele, 2012). Over time, however, the importance of ODA for develop-ing countries has been decreasing. As a result, there is now less scope for adapting the post-2015 agenda to the donor-recipient framework (Vandermoortele, 2012). Instead, the
A new type of global cooperation, based on
solidarity, is needed
Figure II.9Unemployment rate of the most skilled labour under the baseline scenario and Millennium Development Goals-financing scenario,a Costa Rica and Yemen, 2005, 2015 and 2030
Source: Sánchez and Cicowiez (2013).
a Public spending is scaled up as necessary to meet a set of Millennium Development Goals targets and is financed
through foreign sources in the Goals-financing scenario.
Percentage
Figure II.9 Unemployment rate of the most skilled labour under the baseline scenario and Millennium Development Goals-�nancing scenario,a Costa Rica and Yemen, 2005, 2015 and 2030
Source: Sánchez and Cicowiez (2013).a Public spending is scaled up as necessary to meet a set of Millennium Development Goal targets and is financed through foreign sources in the Goals-financing scenario.
0.0
1.0
2.0
3.0
4.0
5.0
6.0
7.0
8.0
2005 2015 2030 2005 2015 2030Costa Rica Yemen
Business-as-usual scenarioGoals scenario
51Strategies for development and transformation
framework has to be one of “solidarity”. The framework proposed in figure II.5 shows how this solidarity may be generated and utilized.
The traditional imbalances between various groups of countries are shifting with changes in economic strength (Toye, 2012). Often, as noted above, more of the advanced initiatives for achieving sustainable development are created by developing countries. Perhaps, through this changed reality, the old ways of thinking will ultimately be overcome, which will pave the way for cooperation among all countries of the world on the basis of solidarity.