Embed Size (px)
DESCRIPTION
Chapter XIX. Factor Analysis. Chapter Outline 1) Overview 2) Basic Concept 3) Factor Analysis Model 4) Statistics Associated with Factor Analysis. 5) Conducting Factor Analysis i. Problem Formulation ii. Construction of the Correlation Matrix - PowerPoint PPT Presentation
Citation preview
Chapter XIXChapter XIX
Factor AnalysisFactor Analysis
Chapter OutlineChapter Outline
1) Overview1) Overview
2) Basic Concept2) Basic Concept
3) Factor Analysis Model3) Factor Analysis Model
4) Statistics Associated with Factor Analysis 4) Statistics Associated with Factor Analysis
5) Conducting Factor Analysis
i. Problem Formulation
ii. Construction of the Correlation Matrix
iii. Method of Factor Analysis
iv. Number of of Factors
v. Rotation of Factors
vi. Interpretation of Factors
vii. Factor Scores
viii.Selection of Surrogate Variables
ix. Model Fit
6) Applications of Common Factor Analysis6) Applications of Common Factor Analysis
7) Internet and Computer Applications7) Internet and Computer Applications
8) Focus on Burke8) Focus on Burke
9) Summary9) Summary
10) Key Terms and Concepts10) Key Terms and Concepts
11) Acronyms11) Acronyms
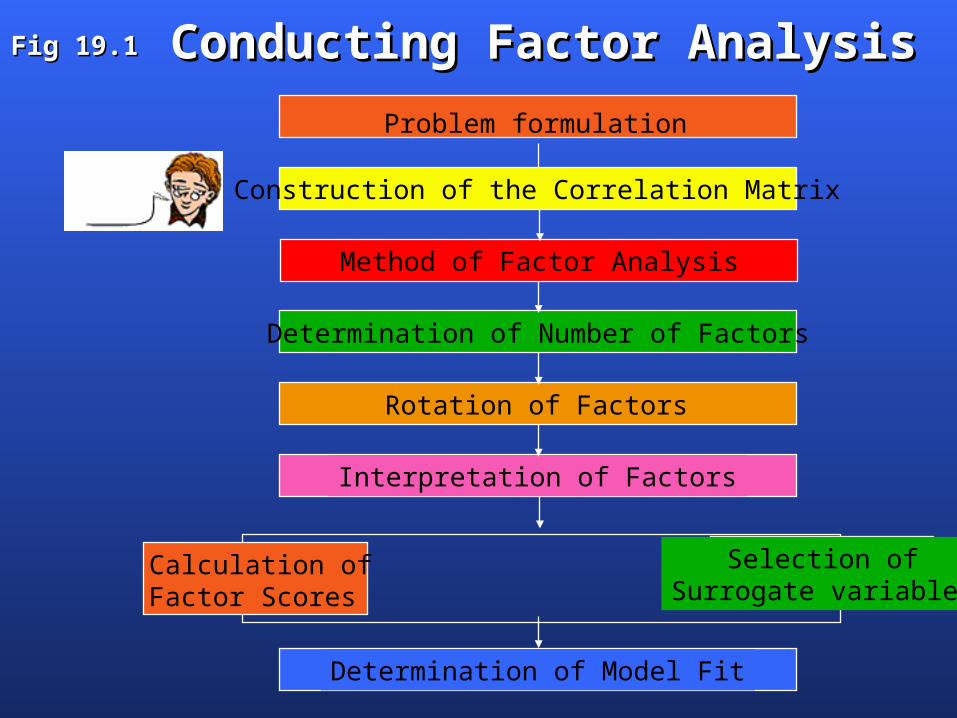
Conducting Factor AnalysisConducting Factor AnalysisFig 19.1Fig 19.1
Calculation ofFactor Scores
Problem formulation
Construction of the Correlation Matrix
Method of Factor Analysis
Determination of Number of Factors
Rotation of Factors
Interpretation of Factors
Selection ofSurrogate variables
Determination of Model Fit
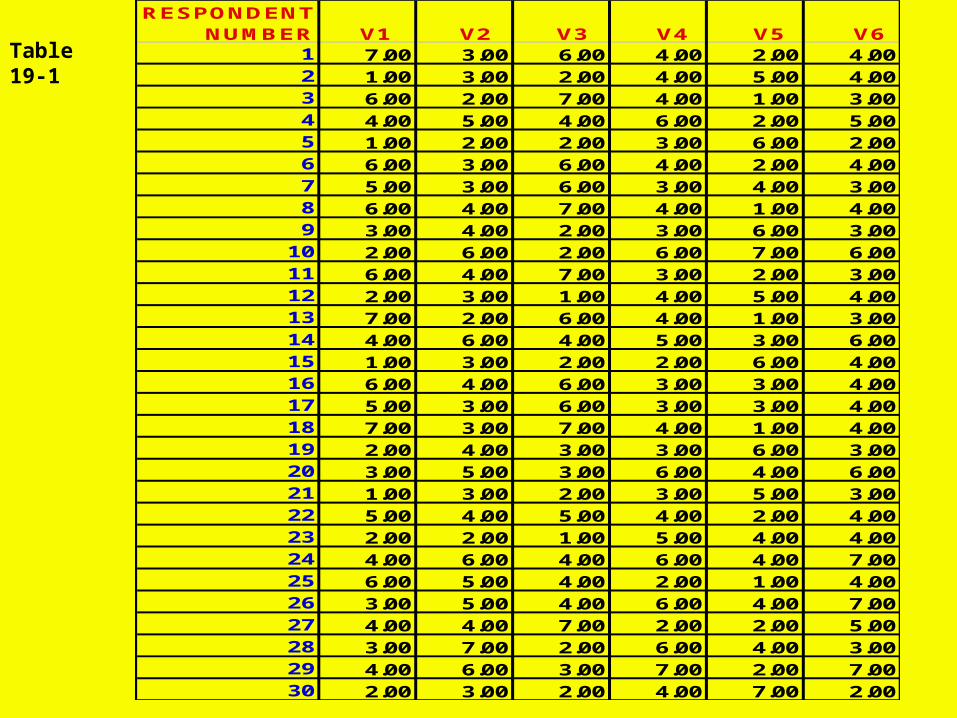
RESPONDENT NUMBER V1 V2 V3 V4 V5 V6
1 7.00 3.00 6.00 4.00 2.00 4.002 1.00 3.00 2.00 4.00 5.00 4.003 6.00 2.00 7.00 4.00 1.00 3.004 4.00 5.00 4.00 6.00 2.00 5.005 1.00 2.00 2.00 3.00 6.00 2.006 6.00 3.00 6.00 4.00 2.00 4.007 5.00 3.00 6.00 3.00 4.00 3.008 6.00 4.00 7.00 4.00 1.00 4.009 3.00 4.00 2.00 3.00 6.00 3.00
10 2.00 6.00 2.00 6.00 7.00 6.0011 6.00 4.00 7.00 3.00 2.00 3.0012 2.00 3.00 1.00 4.00 5.00 4.0013 7.00 2.00 6.00 4.00 1.00 3.0014 4.00 6.00 4.00 5.00 3.00 6.0015 1.00 3.00 2.00 2.00 6.00 4.0016 6.00 4.00 6.00 3.00 3.00 4.0017 5.00 3.00 6.00 3.00 3.00 4.0018 7.00 3.00 7.00 4.00 1.00 4.0019 2.00 4.00 3.00 3.00 6.00 3.0020 3.00 5.00 3.00 6.00 4.00 6.0021 1.00 3.00 2.00 3.00 5.00 3.0022 5.00 4.00 5.00 4.00 2.00 4.0023 2.00 2.00 1.00 5.00 4.00 4.0024 4.00 6.00 4.00 6.00 4.00 7.0025 6.00 5.00 4.00 2.00 1.00 4.0026 3.00 5.00 4.00 6.00 4.00 7.0027 4.00 4.00 7.00 2.00 2.00 5.0028 3.00 7.00 2.00 6.00 4.00 3.0029 4.00 6.00 3.00 7.00 2.00 7.0030 2.00 3.00 2.00 4.00 7.00 2.00
Table 19-1
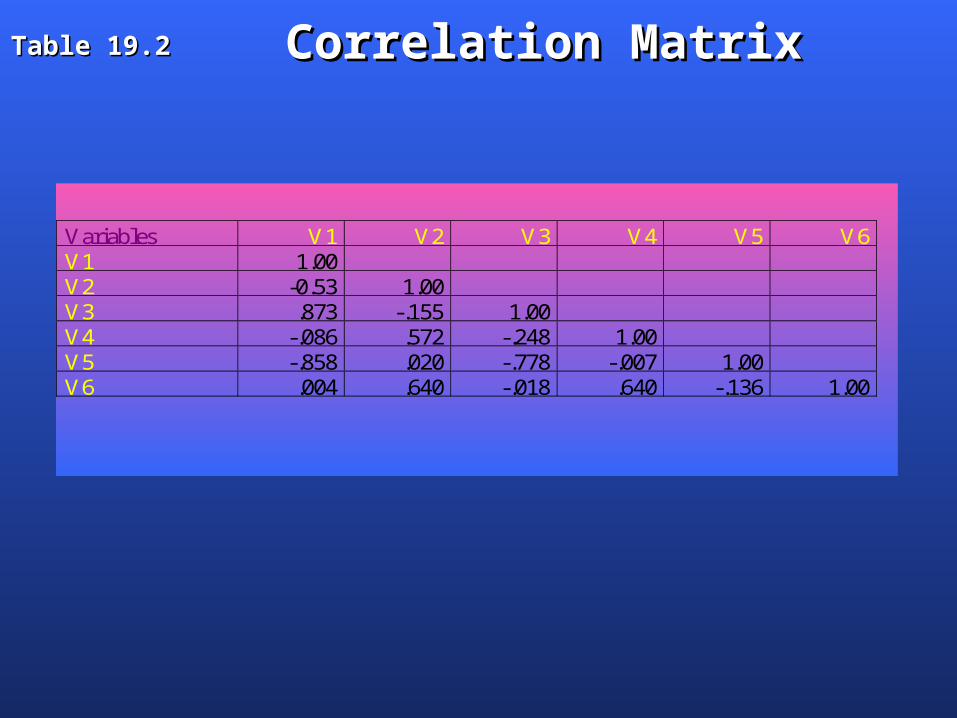
Correlation MatrixCorrelation MatrixTable 19.2Table 19.2
Variables V1 V2 V3 V4 V5 V6V1 1.00V2 -0.53 1.00V3 .873 -.155 1.00V4 -.086 .572 -.248 1.00V5 -.858 .020 -.778 -.007 1.00V6 .004 .640 -.018 .640 -.136 1.00
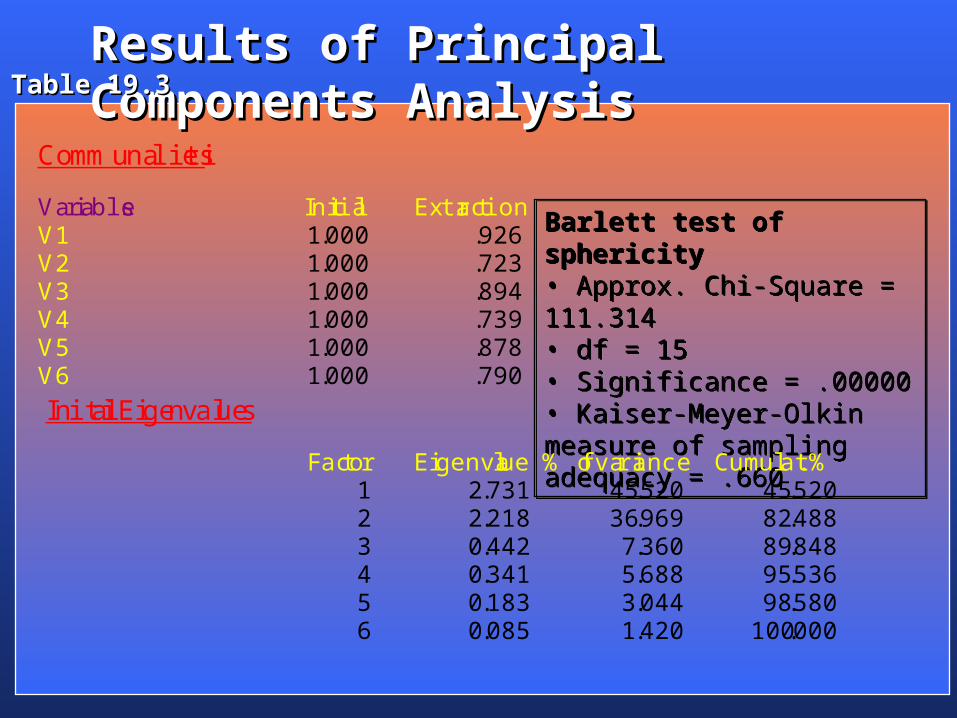
Results of Principal Components AnalysisResults of Principal Components AnalysisTable 19.3Table 19.3
Communalities
Variables Initial ExtractionV1 1.000 .926V2 1.000 .723V3 1.000 .894V4 1.000 .739V5 1.000 .878V6 1.000 .790
Barlett test of sphericity• Approx. Chi-Square = 111.314• df = 15• Significance = .00000• Kaiser-Meyer-Olkin measure of sampling adequacy = .660
Barlett test of sphericity• Approx. Chi-Square = 111.314• df = 15• Significance = .00000• Kaiser-Meyer-Olkin measure of sampling adequacy = .660
Initial Eigenvalues
Factor Eigenvalue % of variance Cumulat. %1 2.731 45.520 45.5202 2.218 36.969 82.4883 0.442 7.360 89.8484 0.341 5.688 95.5365 0.183 3.044 98.5806 0.085 1.420 100.000
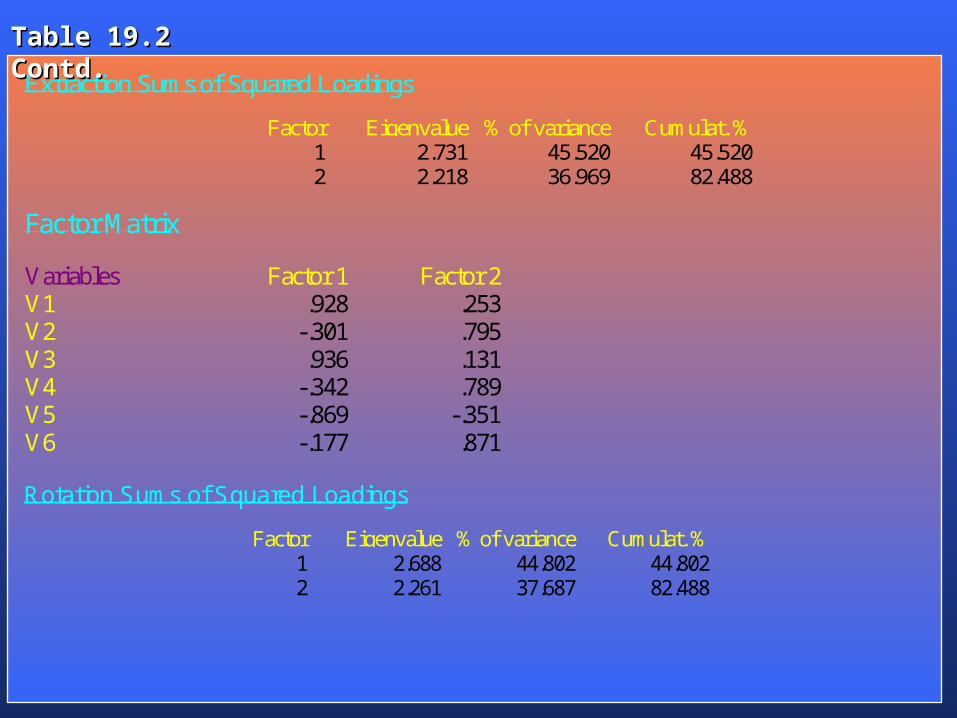
Extraction Sums of Squared Loadings
Factor Eigenvalue % of variance Cumulat. %1 2.731 45.520 45.5202 2.218 36.969 82.488
Factor Matrix
Variables Factor 1 Factor 2V1 .928 .253V2 -.301 .795V3 .936 .131V4 -.342 .789V5 -.869 -.351V6 -.177 .871
Rotation Sums of Squared Loadings
Factor Eigenvalue % of variance Cumulat. %1 2.688 44.802 44.8022 2.261 37.687 82.488
Table 19.2 Contd.Table 19.2 Contd.
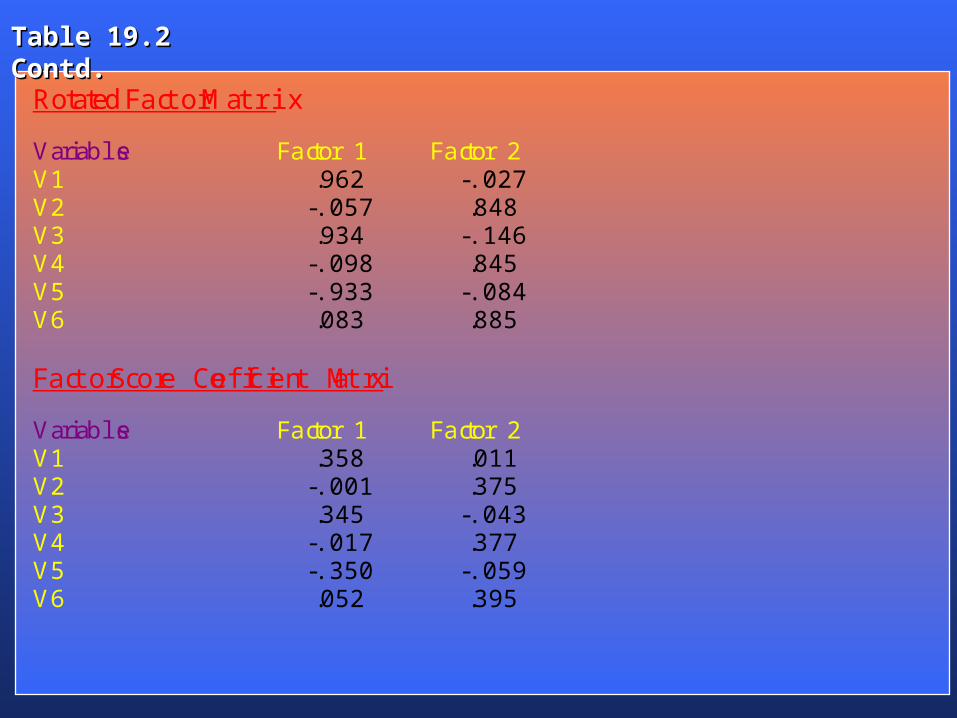
Rotated Factor Matrix
Variables Factor 1 Factor 2V1 .962 -.027V2 -.057 .848V3 .934 -.146V4 -.098 .845V5 -.933 -.084V6 .083 .885
Factor Score Coefficient Matrix
Variables Factor 1 Factor 2V1 .358 .011V2 -.001 .375V3 .345 -.043V4 -.017 .377V5 -.350 -.059V6 .052 .395
Table 19.2 Contd.Table 19.2 Contd.
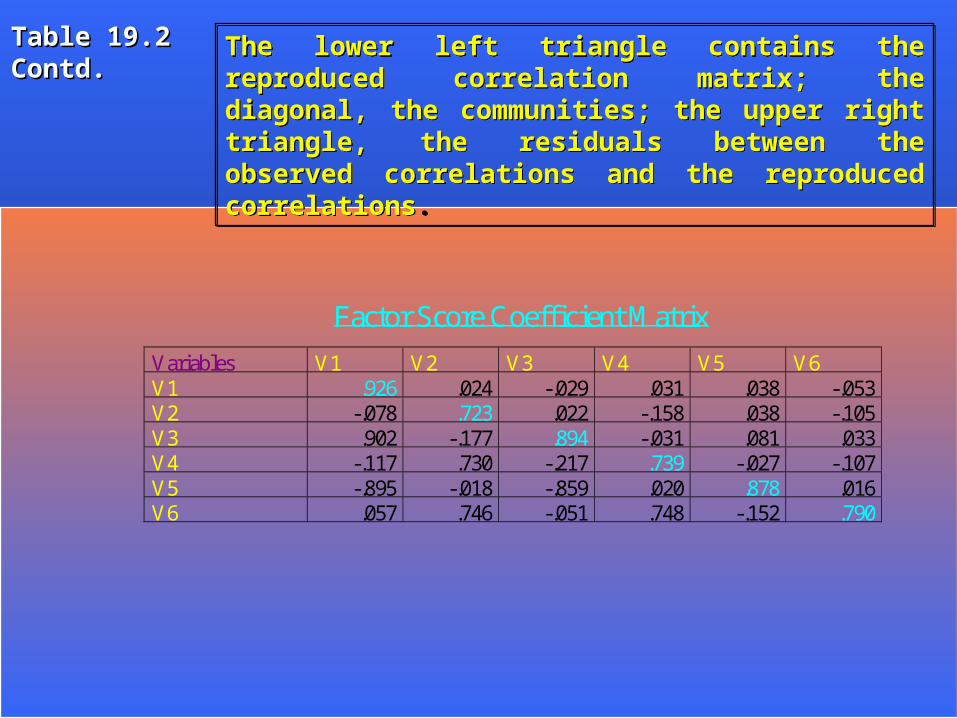
Factor Score Coefficient Matrix
Variables V1 V2 V3 V4 V5 V6V1 .926 .024 -.029 .031 .038 -.053V2 -.078 .723 .022 -.158 .038 -.105V3 .902 -.177 .894 -.031 .081 .033V4 -.117 .730 -.217 .739 -.027 -.107V5 -.895 -.018 -.859 .020 .878 .016V6 .057 .746 -.051 .748 -.152 .790
The lower left triangle contains the reproduced correlation matrix; the diagonal, the communities; the upper right triangle, the residuals between the observed correlations and the reproduced correlations.
The lower left triangle contains the reproduced correlation matrix; the diagonal, the communities; the upper right triangle, the residuals between the observed correlations and the reproduced correlations.
Table 19.2 Contd.Table 19.2 Contd.
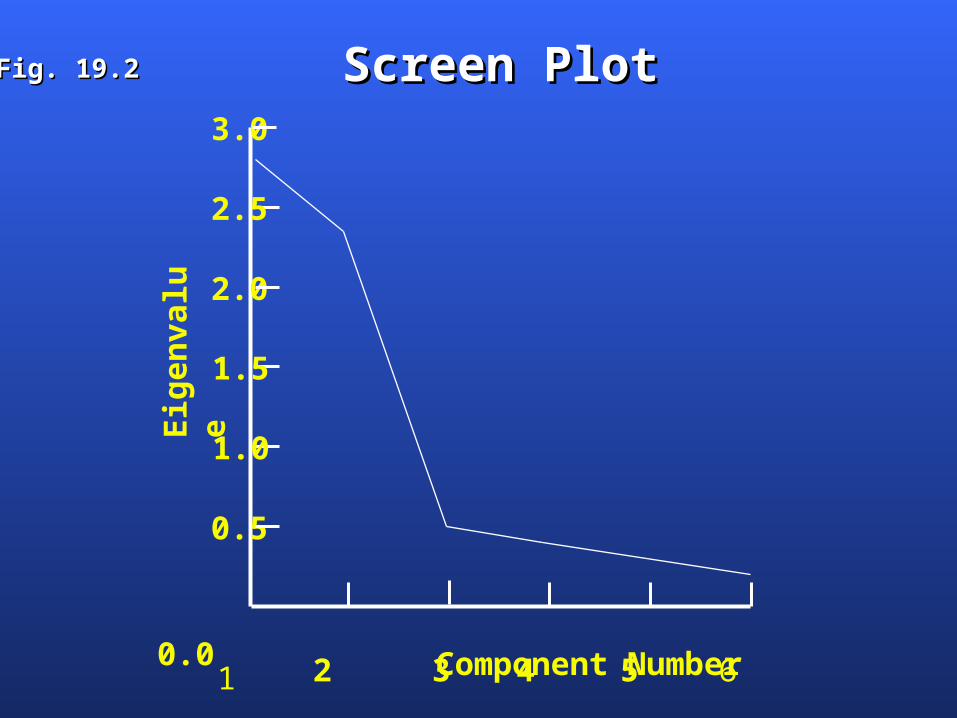
Screen PlotScreen Plot Fig. 19.2Fig. 19.2
0.5
2 5 4 3 6 Component Number
0.0
2.0
3.0 E
igen
valu
e
1.0
1.5
2.5
1
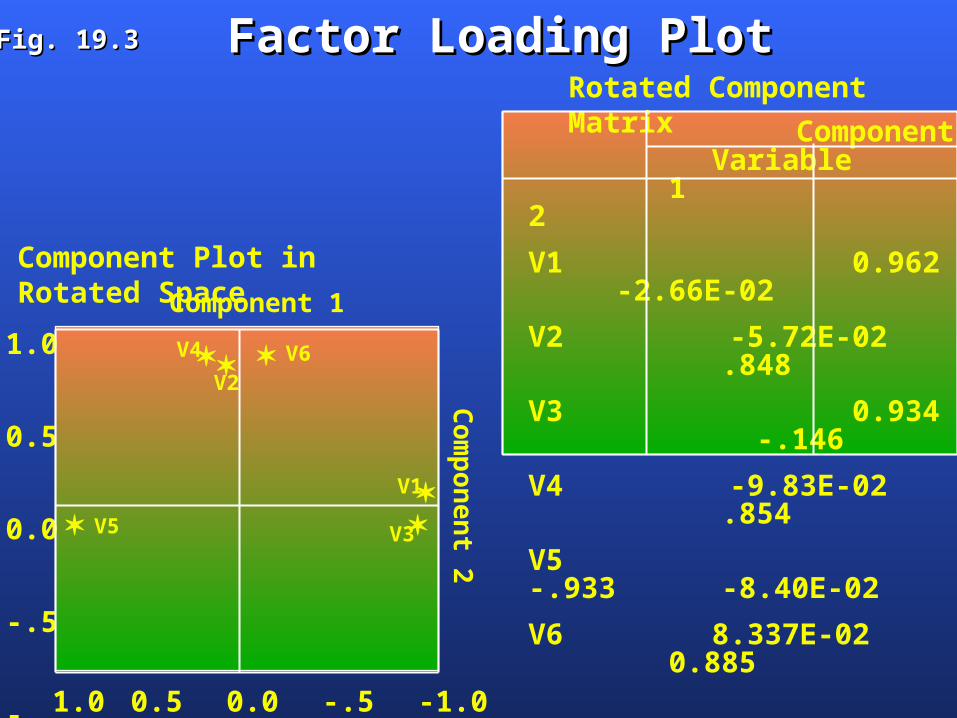
Factor Loading PlotFactor Loading Plot Fig. 19.3Fig. 19.3
1.0
0.5
0.0
-.5
-1.0
Com
pon
ent 2
Component 1
Component Variable 1 2
V1 0.962 -2.66E-02
V2 -5.72E-02 .848
V3 0.934 -.146
V4 -9.83E-02 .854
V5 -.933 -8.40E-02
V6 8.337E-02 0.885
Component Plot in Rotated Space
1.0 0.5 0.0 -.5 -1.0
V1
V3
V6 V2
V5
V4
Rotated Component Matrix
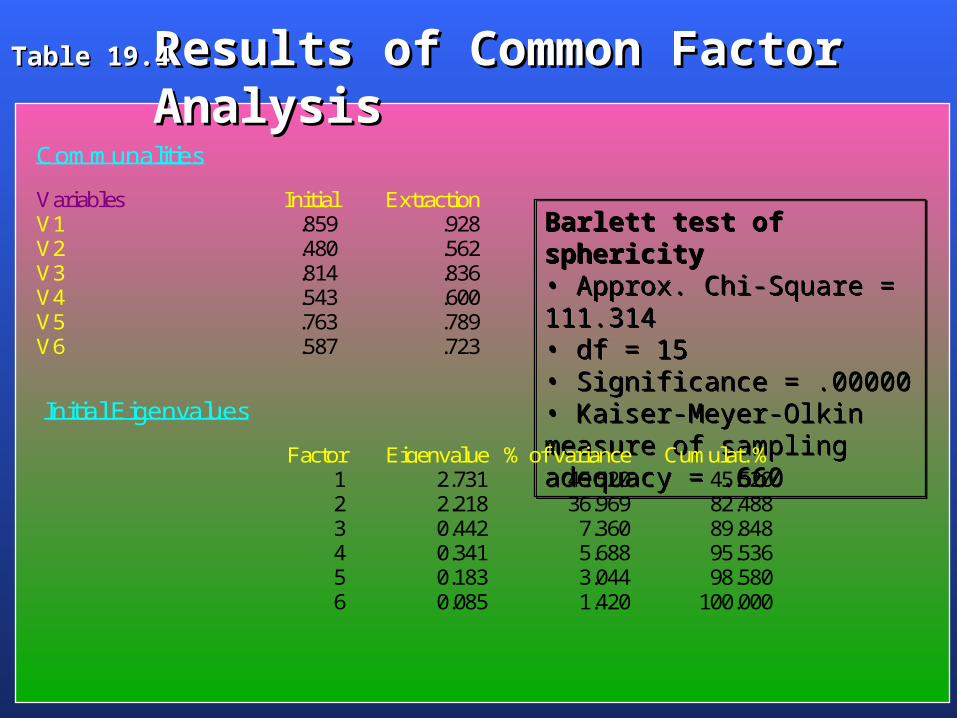
Results of Common Factor AnalysisResults of Common Factor AnalysisTable 19.4Table 19.4
Communalities
Variables Initial ExtractionV1 .859 .928V2 .480 .562V3 .814 .836V4 .543 .600V5 .763 .789V6 .587 .723
Barlett test of sphericity• Approx. Chi-Square = 111.314• df = 15• Significance = .00000• Kaiser-Meyer-Olkin measure of sampling adequacy = .660
Barlett test of sphericity• Approx. Chi-Square = 111.314• df = 15• Significance = .00000• Kaiser-Meyer-Olkin measure of sampling adequacy = .660
Initial Eigenvalues
Factor Eigenvalue % of variance Cumulat. %1 2.731 45.520 45.5202 2.218 36.969 82.4883 0.442 7.360 89.8484 0.341 5.688 95.5365 0.183 3.044 98.5806 0.085 1.420 100.000
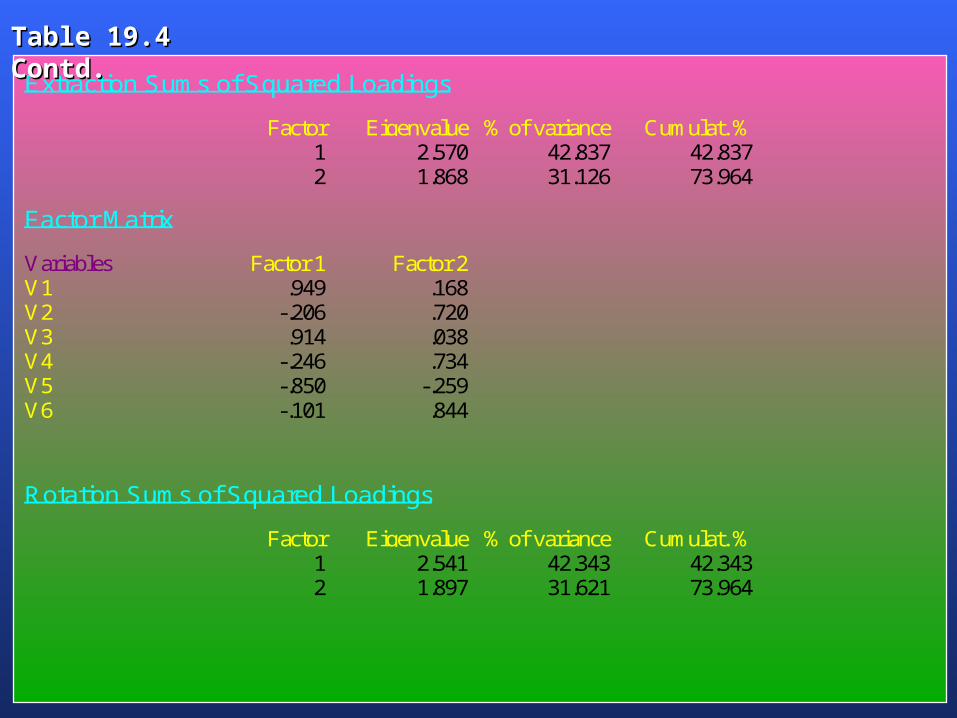
Extraction Sums of Squared Loadings
Factor Eigenvalue % of variance Cumulat. %1 2.570 42.837 42.8372 1.868 31.126 73.964
Factor Matrix
Variables Factor 1 Factor 2V1 .949 .168V2 -.206 .720V3 .914 .038V4 -.246 .734V5 -.850 -.259V6 -.101 .844
Rotation Sums of Squared Loadings
Factor Eigenvalue % of variance Cumulat. %1 2.541 42.343 42.3432 1.897 31.621 73.964
Table 19.4 Contd.Table 19.4 Contd.
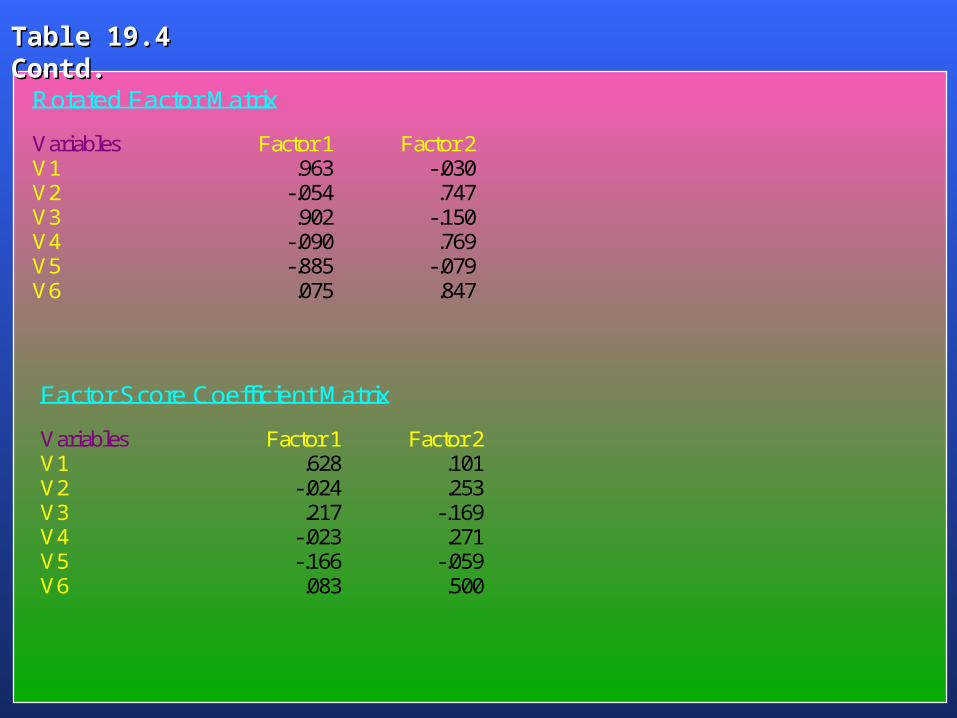
Rotated Factor Matrix
Variables Factor 1 Factor 2V1 .963 -.030V2 -.054 .747V3 .902 -.150V4 -.090 .769V5 -.885 -.079V6 .075 .847
Factor Score Coefficient Matrix
Variables Factor 1 Factor 2V1 .628 .101V2 -.024 .253V3 .217 -.169V4 -.023 .271V5 -.166 -.059V6 .083 .500
Table 19.4 Contd.Table 19.4 Contd.
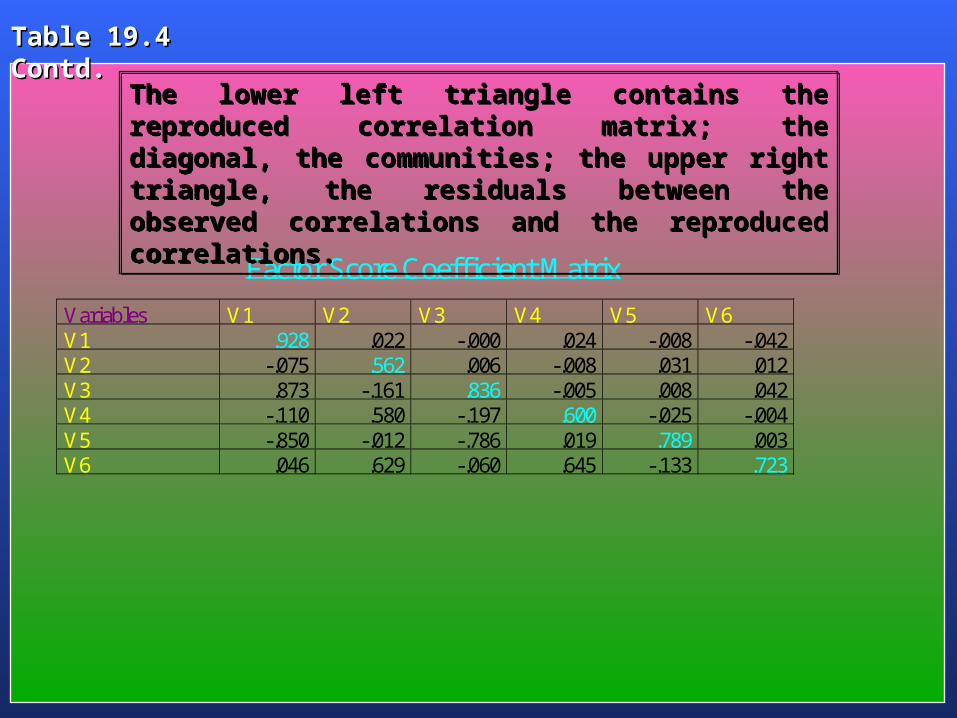
Factor Score Coefficient Matrix
Variables V1 V2 V3 V4 V5 V6V1 .928 .022 -.000 .024 -.008 -.042V2 -.075 .562 .006 -.008 .031 .012V3 .873 -.161 .836 -.005 .008 .042V4 -.110 .580 -.197 .600 -.025 -.004V5 -.850 -.012 -.786 .019 .789 .003V6 .046 .629 -.060 .645 -.133 .723
The lower left triangle contains the reproduced correlation matrix; the diagonal, the communities; the upper right triangle, the residuals between the observed correlations and the reproduced correlations.
The lower left triangle contains the reproduced correlation matrix; the diagonal, the communities; the upper right triangle, the residuals between the observed correlations and the reproduced correlations.
Table 19.4 Contd.Table 19.4 Contd.
Driving Nuts For BeetlesDriving Nuts For BeetlesRIP 19.1RIP 19.1
Generally, with time, consumer needs and tastes change. Consumer preferences for automobiles need to be continually tracked to identify changing demands and specifications. However, there is one car that is quite an exception - the Volkswagen Beetle. More than 21 million have been built since it was introduced in 1938. Surveys have been conducted in different countries to determine the reasons why people purchase Beetles. Principal components analyses of the variables measuring the reasons for owning Beetles have consistently revealed one dominant factor - fanatical loyalty. The company has long wished its natural death but without any effect. This noisy and cramped "bug" has inspired devotion in drivers.
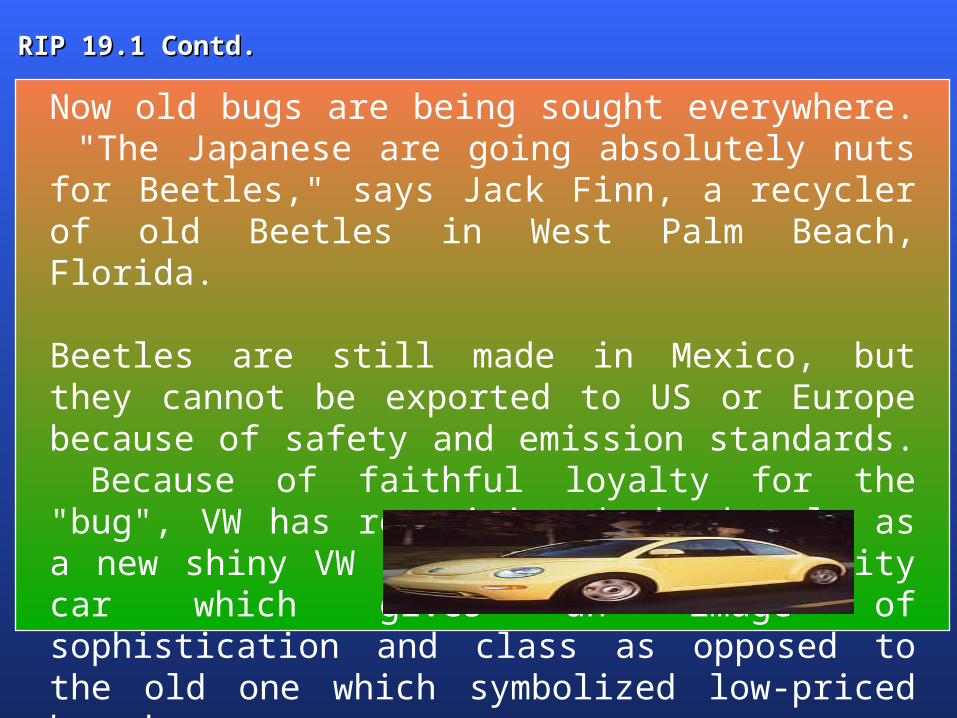
Now old bugs are being sought everywhere. "The Japanese are going absolutely nuts for Beetles," says Jack Finn, a recycler of old Beetles in West Palm Beach, Florida. Beetles are still made in Mexico, but they cannot be exported to US or Europe because of safety and emission standards. Because of faithful loyalty for the "bug", VW has repositioned the beetle as a new shiny VW Passat, a premium quality car which gives an image of sophistication and class as opposed to the old one which symbolized low-priced brand.
RIP 19.1 Contd.RIP 19.1 Contd.
Factors Predicting Unethical Factors Predicting Unethical Marketing Research Marketing Research
PracticesPractices
RIP 19.2RIP 19.2
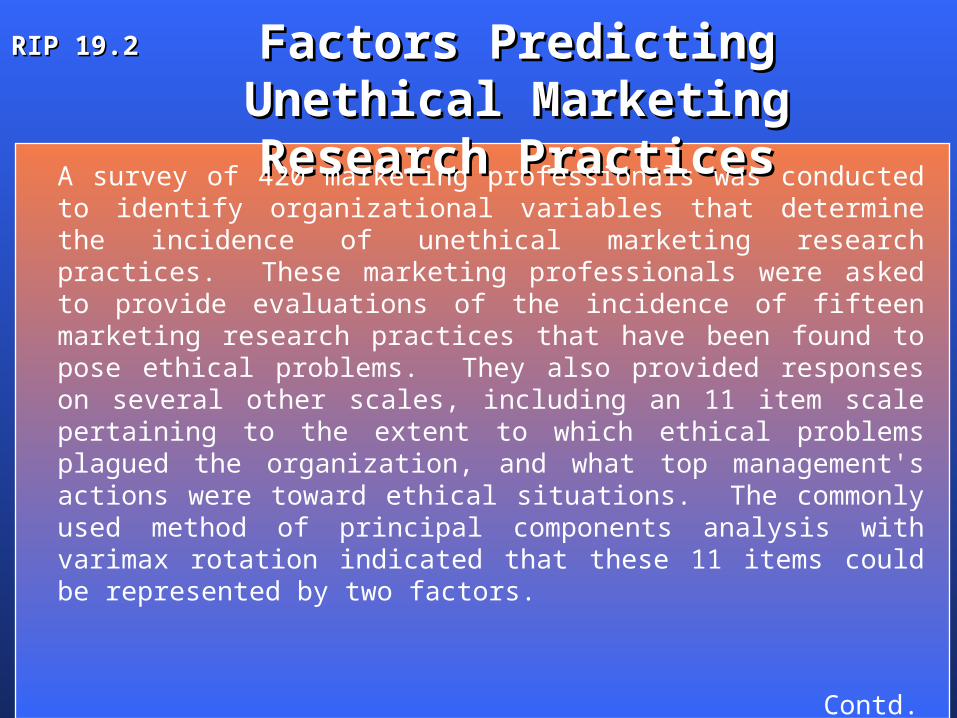
A survey of 420 marketing professionals was conducted to identify organizational variables that determine the incidence of unethical marketing research practices. These marketing professionals were asked to provide evaluations of the incidence of fifteen marketing research practices that have been found to pose ethical problems. They also provided responses on several other scales, including an 11 item scale pertaining to the extent to which ethical problems plagued the organization, and what top management's actions were toward ethical situations. The commonly used method of principal components analysis with varimax rotation indicated that these 11 items could be represented by two factors.
Contd.
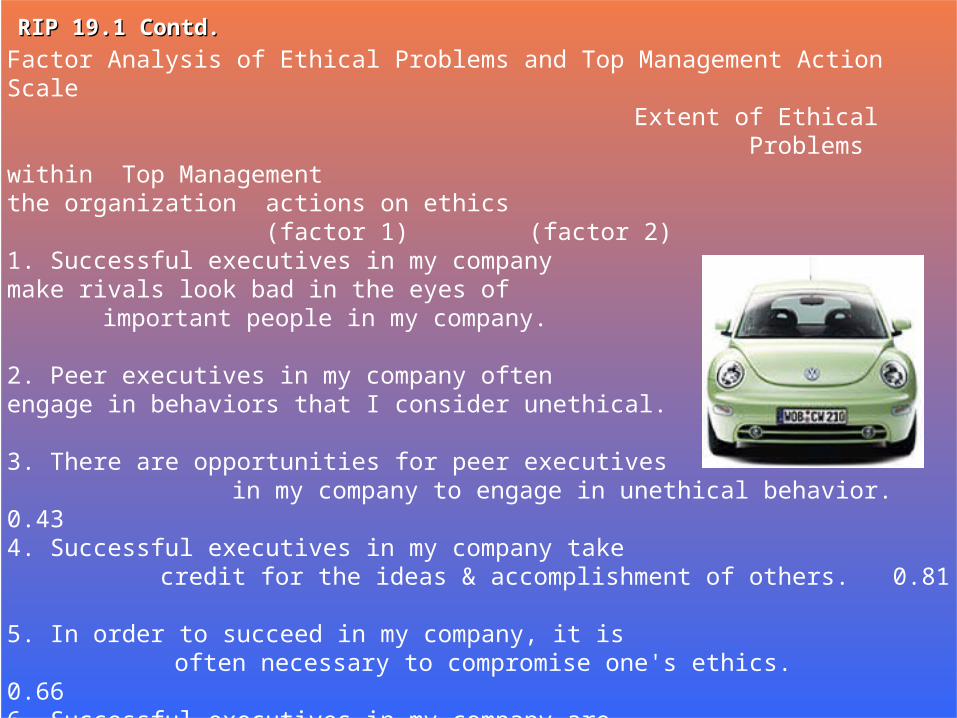
Factor Analysis of Ethical Problems and Top Management Action Scale Extent of Ethical
Problems within Top Management the organization actions on ethics (factor 1) (factor 2)
1. Successful executives in my company make rivals look bad in the eyes of important people in my company. 0.662. Peer executives in my company often engage in behaviors that I consider unethical. 0.683. There are opportunities for peer executives in my company to engage in unethical behavior. 0.434. Successful executives in my company take credit for the ideas & accomplishment of others. 0.815. In order to succeed in my company, it is often necessary to compromise one's ethics. 0.666. Successful executives in my company are generally more unethical than unsuccessful executives. 0.647. Successful executives in my company look for a "scapegoat" when they feel they may by associated with failure. 0.78
RIP 19.1 ContdRIP 19.1 Contd..
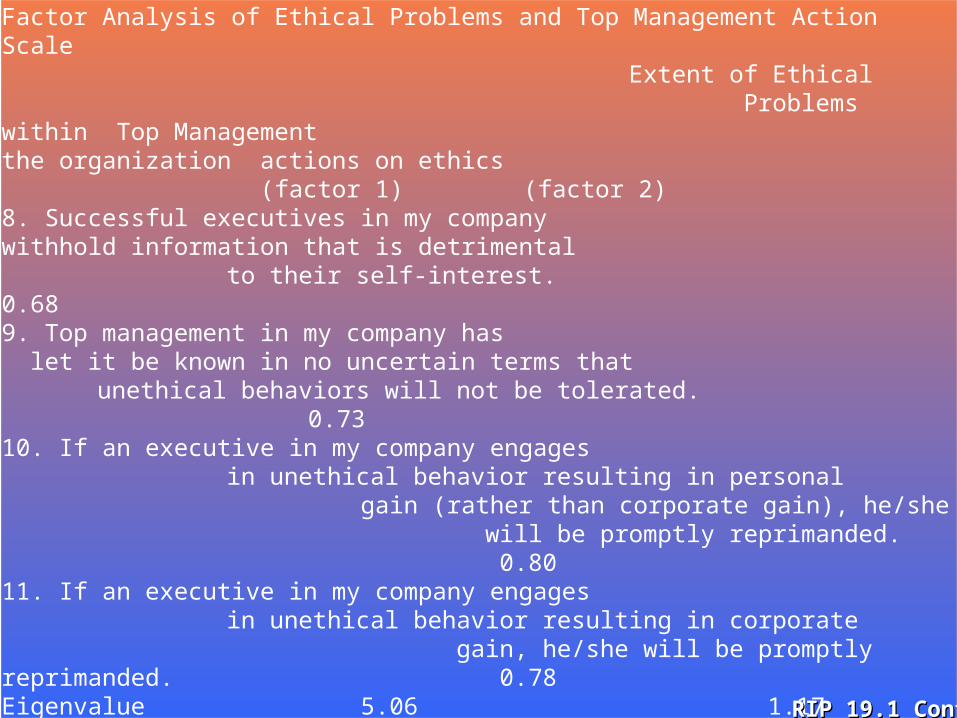
Factor Analysis of Ethical Problems and Top Management Action Scale Extent of Ethical
Problems within Top Management the organization actions on ethics (factor 1) (factor 2)
8. Successful executives in my company withhold information that is detrimental to their self-interest. 0.689. Top management in my company has let it be known in no uncertain terms that unethical behaviors will not be tolerated. 0.7310. If an executive in my company engages in unethical behavior resulting in personal gain (rather than corporate gain), he/she will be promptly reprimanded. 0.8011. If an executive in my company engages in unethical behavior resulting in corporate gain, he/she will be promptly reprimanded. 0.78
Eigenvalue 5.06 1.17 % of Variance Explained 46% 11% Coefficient Alpha 0.87 0.75
To simplify the table, only varimax-rotated loading of .40 or greater are reported. Each was rated on a five-point scale with 1 = "strongly agree" and 5 = "strongly disagree”
RIP 19.1 ContdRIP 19.1 Contd..
Factor Analysis of Ethical Problems and Top Management Action Scale
The first factor could be interpreted as the incidence of unethical practices, while the second factor denotes top management actions related to unethical practices. The two factors together account for more than half the variation in the data with the first factor being dominant. These two factors were then used along with four other variables as predictors in a multiple regression. The results indicated that they were the two best predictors of unethical marketing research practices.
RIP 19.1 ContdRIP 19.1 Contd..