Embed Size (px)
Citation preview
NCES 2017-072 U.S. DEPARTMENT OF EDUCATION
Characteristics of Public Elementary and Secondary School Teachers in the United States: Results From the 2015–16 National Teacher and Principal Survey First Look
Characteristics of Public Elementary and Secondary School Teachers in the United States: Results From the 2015–16 National Teacher and Principal Survey
First Look
AUGUST 2017
Soheyla Taie Rebecca Goldring Westat
Maura Spiegelman Project Officer National Center for Education Statistics
NCES 2017-072 U.S. DEPARTMENT OF EDUCATION

U.S. Department of Education Betsy DeVos Secretary
Institute of Education Sciences Thomas W. Brock Commissioner for Education Research Delegated Duties of the Director
National Center for Education Statistics Peggy G. Carr Acting Commissioner
The National Center for Education Statistics (NCES) is the primary federal entity for collecting, analyzing, and reporting data related to education in the United States and other nations. It fulfills a congressional mandate to collect, collate, analyze, and report full and complete statistics on the condition of education in the United States; conduct and publish reports and specialized analyses of the meaning and significance of such statistics; assist state and local education agencies in improving their statistical systems; and review and report on education activities in foreign countries.
NCES activities are designed to address high-priority education data needs; provide consistent, reliable, complete, and accurate indicators of education status and trends; and report timely, useful, and high-quality data to the U.S. Department of Education, the Congress, the states, other education policymakers, practitioners, data users, and the general public. Unless specifically noted, all information contained herein is in the public domain.
We strive to make our products available in a variety of formats and in language that is appropriate to a variety of audiences. You, as our customer, are the best judge of our success in communicating information effectively. If you have any comments or suggestions about this or any other NCES product or report, we would like to hear from you. Please direct your comments to:
NCES, IES, U.S. Department of Education Potomac Center Plaza 550 12th Street, SW Washington, DC 20202
August 2017
The NCES Home Page address is https://nces.ed.gov. The NCES Publications and Products address is https://nces.ed.gov/pubsearch.
This publication is only available online. To download, view, and print the report as a PDF file, go to the NCES Publications and Products address shown above.
This report was prepared for NCES under Contract No. ED-IES-12-D-005 with Westat. Mention of trade names, commercial products, or organizations does not imply endorsement by the U.S. Government.
Suggested Citation Taie, S., and Goldring, R. (2017). Characteristics of Public Elementary and Secondary School Teachers in the United States: Results From the 2015–16 National Teacher and Principal Survey First Look (NCES 2017-072). U.S. Department of Education. Washington, DC: National Center for Education Statistics. Retrieved [date] from https://nces.ed.gov/pubsearch/pubsinfo.asp?pubid=2017072.
Content Contact Maura Spiegelman (202) 245-6581 [email protected]
iii
Contents Page
List of Tables ................................................................................................................................... iv
Introduction ....................................................................................................................................... 1
Selected Findings .............................................................................................................................. 3
References ......................................................................................................................................... 5
Estimate Tables ................................................................................................................................. 6
Appendix A: Standard Error Tables ............................................................................................. A-1
Appendix B: Methodology and Technical Notes .......................................................................... B-1
Appendix C: Description of Variables .......................................................................................... C-1
iv
List of Tables Table Page
1. Total number of public school teachers and percentage distribution of public school teachers, by race/ethnicity and selected school characteristics: 2015–16 ....................................................................................................... 7
2. Average and median age of public school teachers and percentage distribution of teachers by age category, sex, and selected school characteristics: 2015–16 ....................................................................................................... 8
3. Percentage distribution of public school teachers based on years of teaching experience, average total years of teaching experience, percentage distribution of teachers based on years teaching at current school, and average years teaching at current school, by selected school characteristics: 2015–16 ....................................................................................................... 9
4. Percentage distribution of public school teachers, by highest degree earned, and selected school characteristics: 2015–16 ........................................................ 10
5. Number and percentage of public school teachers who are regular full-time teachers and average number of hours per week that regular full-time teachers spent on selected activities during a typical full week, by selected school characteristics: 2015–16 ......................................................................................... 11
6. Among regular full-time public school teachers, average base salary and earnings from all sources, percentage of teachers with earnings from various salary supplements, and among those teachers, the average amount earned from the supplement during the current school year, by selected school characteristics: 2015–16 ........................................................................... 12
7. Average class size in public primary schools, middle schools, high schools, and schools with combined grades, by classroom type and selected school characteristics: 2015–16 ........................................................................... 13
8. Percentage of public school teachers who took graduate or undergraduate courses before their first year of teaching in selected subject areas, by selected school characteristics: 2015–16 ........................................................................... 14
9. Percentage of public school teachers who thought that they have any influence over various policies at their school, by selected school characteristics: 2015–16 ..................................................................................................... 15
10. Percentage of public school teachers who responded that they have any control over various areas of planning and teaching in their classrooms, by selected school characteristics: 2015–16 ........................................................................... 16
v
Appendix A: Standard Error Tables Table Page
A-1. Standard errors for table 1: Total number of public school teachers and percentage distribution of public school teachers, by race/ethnicity and selected school characteristics: 2015–16 ......................................................................... A-2
A-2. Standard errors for table 2: Average and median age of public school teachers and percentage distribution of teachers by age category, sex, and selected school characteristics: 2015–16 ......................................................................... A-3
A-3. Standard errors for table 3: Percentage distribution of public school teachers based on years of teaching experience, average total years of teaching experience, percentage distribution of teachers based on years teaching at current school, and average years teaching at current school, by selected school characteristics: 2015–16 .................................................................... A-4
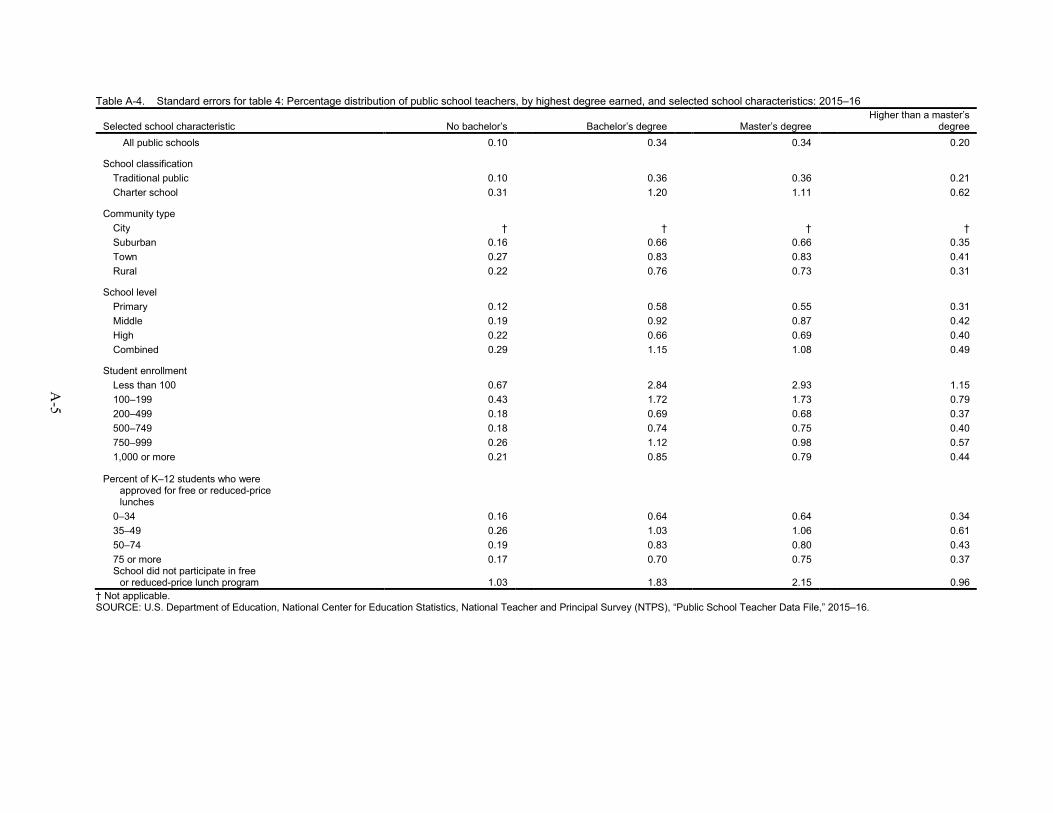
A-4. Standard errors for table 4: Percentage distribution of public school teachers, by highest degree earned, and selected school characteristics: 2015–16 ........................................................................................................................... A-5
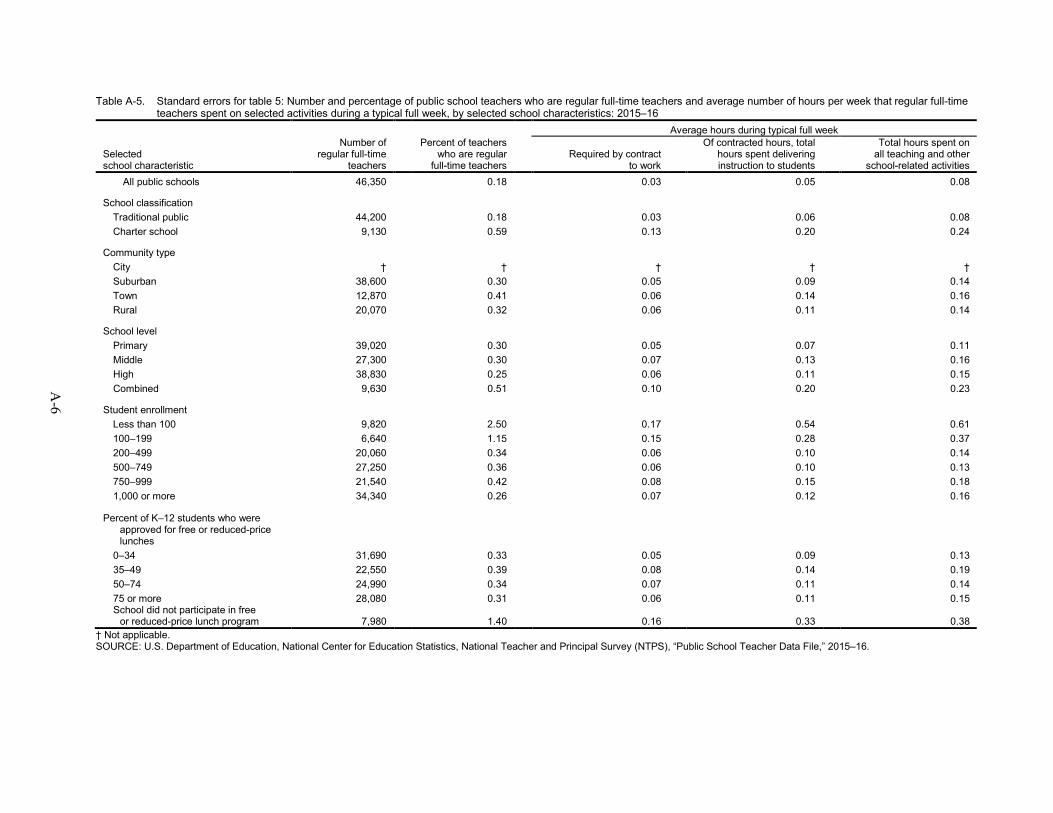
A-5. Standard errors for table 5: Number and percentage of public school teachers who are regular full-time teachers and average number of hours per week that regular full-time teachers spent on selected activities during a typical full week, by selected school characteristics: 2015–16 ..................................... A-6
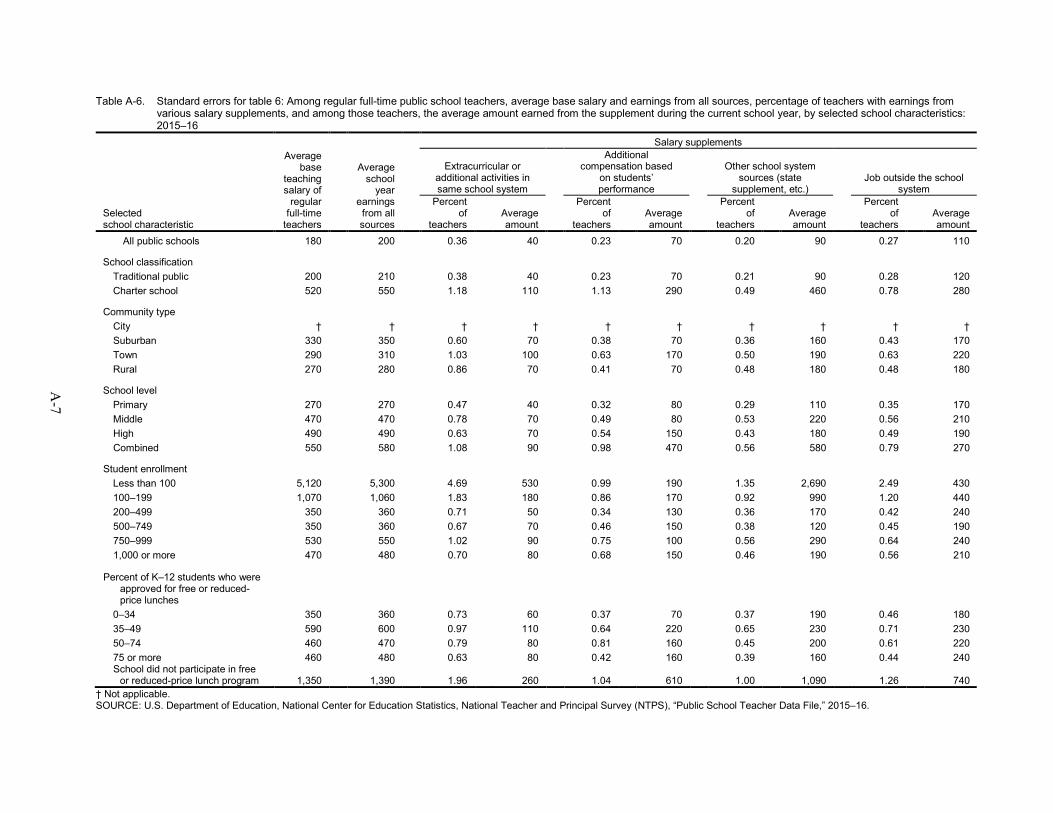
A-6. Standard errors for table 6: Among regular full-time public school teachers, average base salary and earnings from all sources, percentage of teachers with earnings from various salary supplements, and among those teachers, the average amount earned from the supplement during the current school year, by selected school characteristics: 2015–16 .................................... A-7
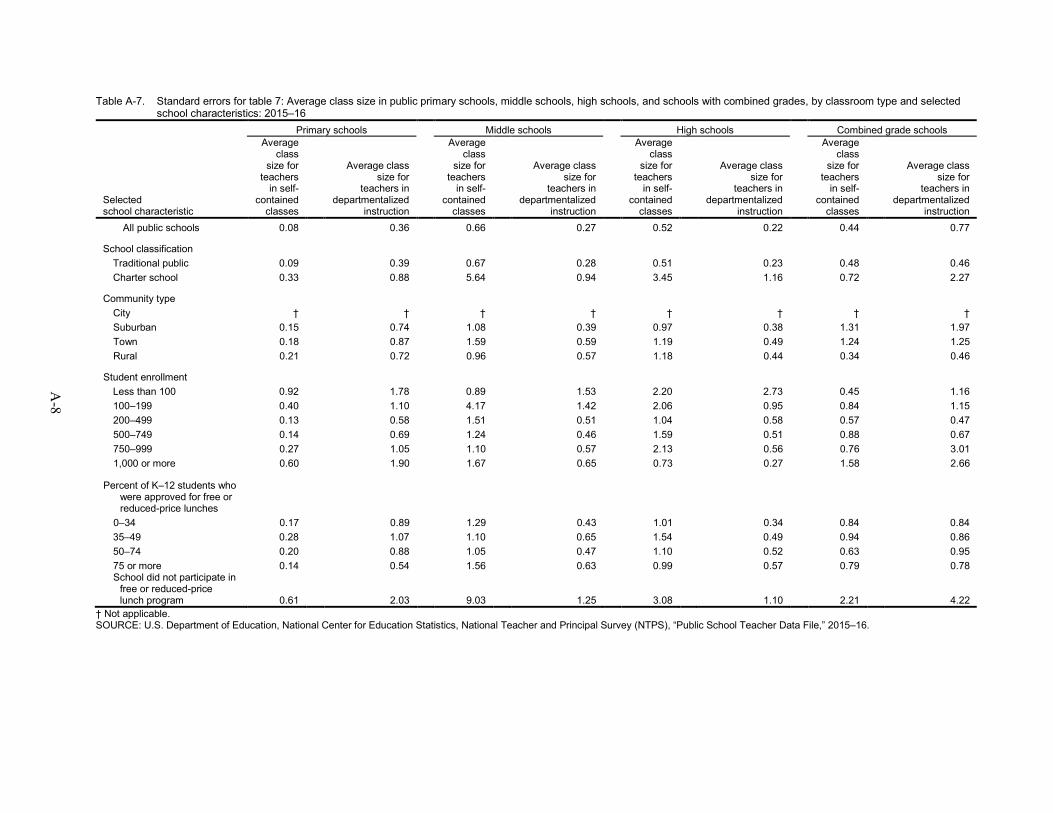
A-7. Standard errors for table 7: Average class size in public primary schools, middle schools, high schools, and schools with combined grades, by classroom type and selected school characteristics: 2015–16 .......................................... A-8
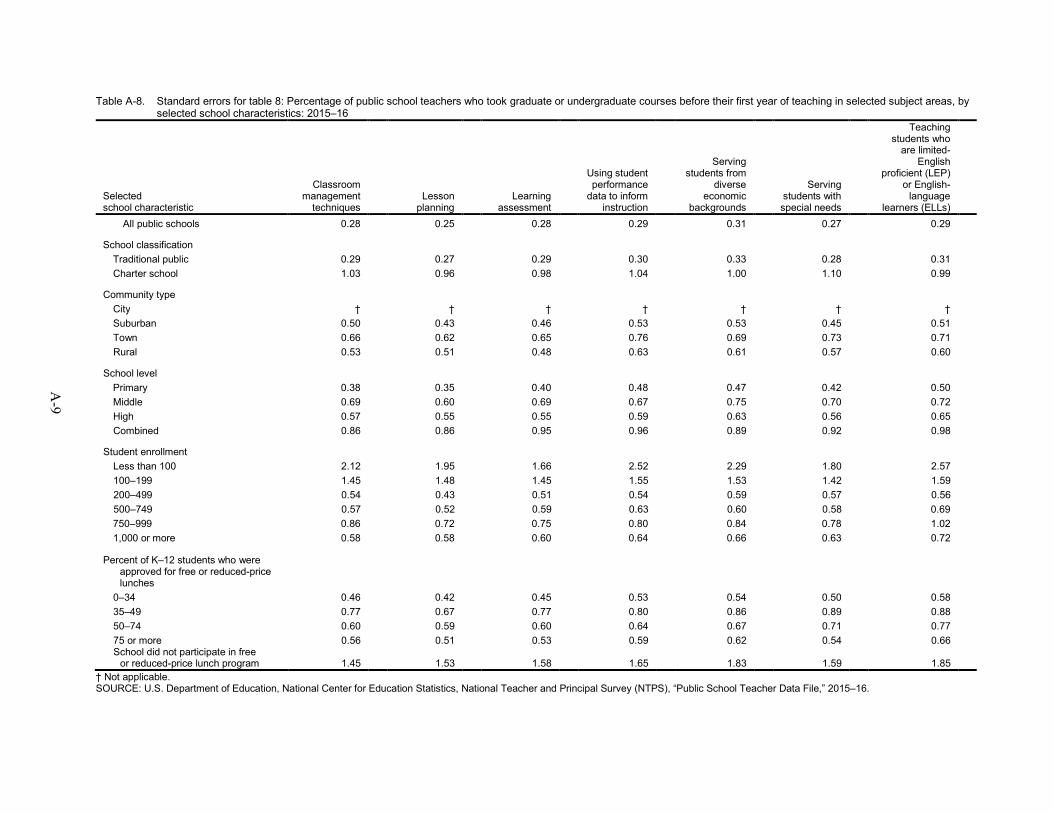
A-8. Standard errors for table 8: Percentage of public school teachers who took graduate or undergraduate courses before their first year of teaching in selected subject areas, by selected school characteristics: 2015–16 ................................ A-9
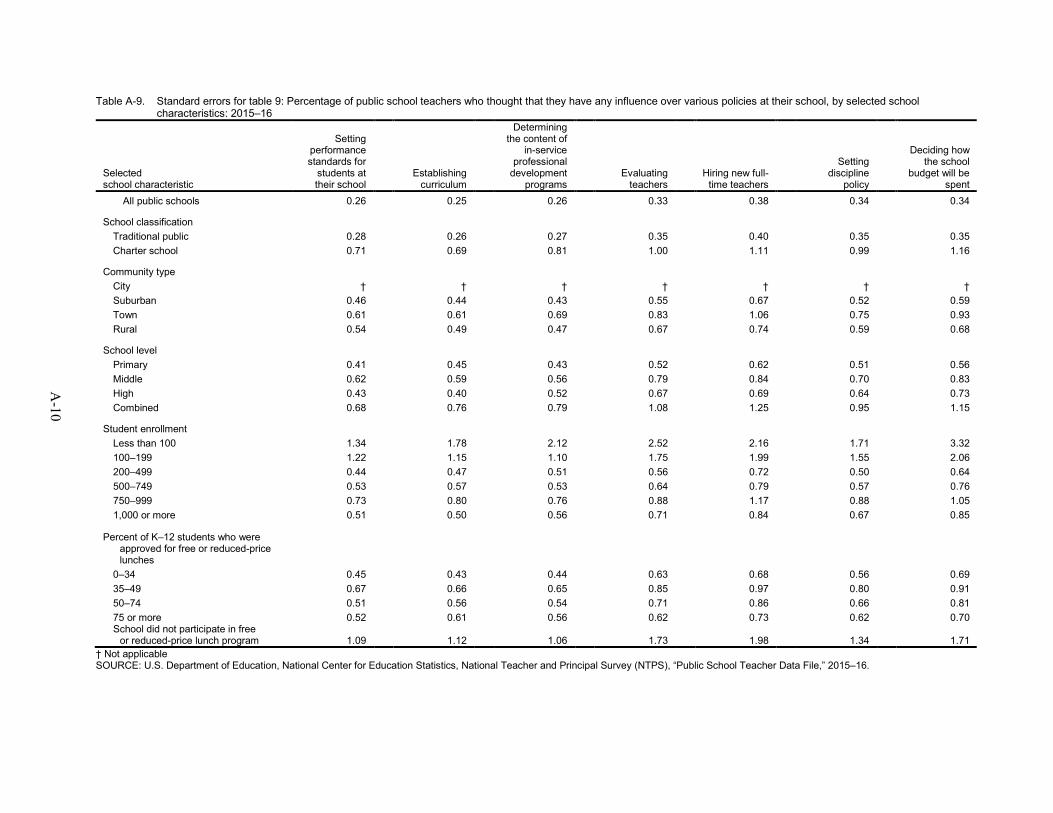
A-9. Standard errors for table 9: Percentage of public school teachers who thought that they have any influence over various policies at their school, by selected school characteristics: 2015–16 .................................................................. A-10
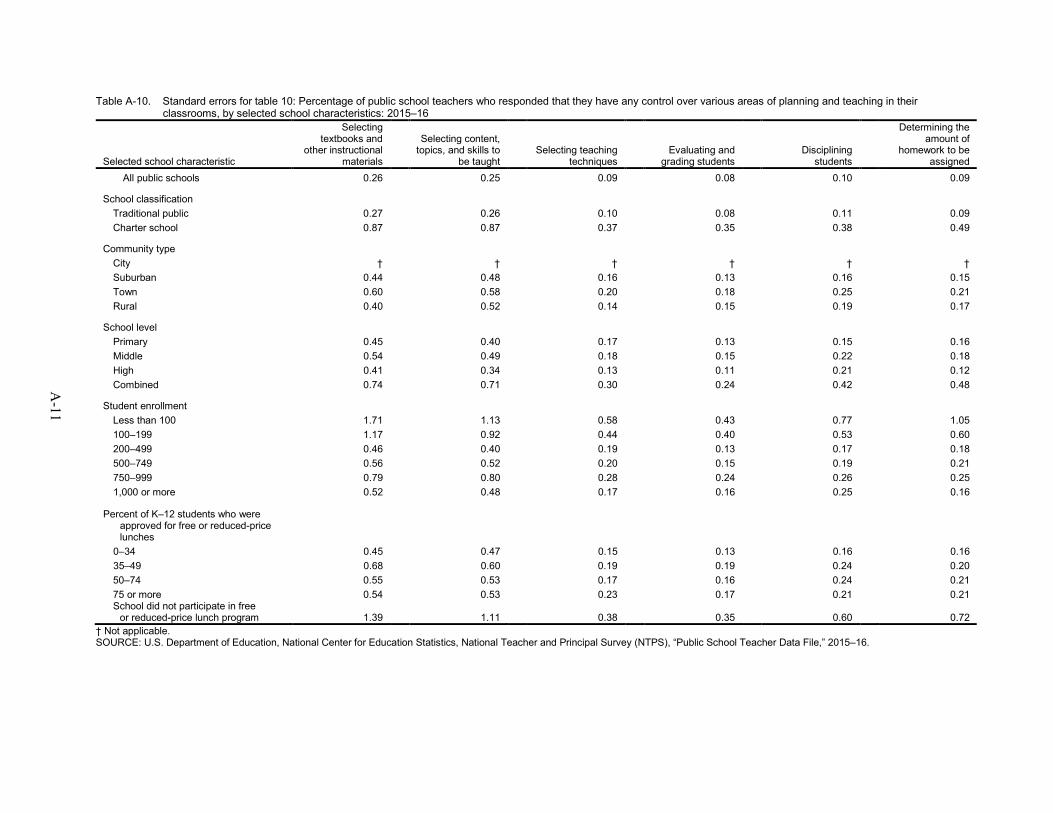
A-10. Standard errors for table 10: Percentage of public school teachers who responded that they have any control over various areas of planning and teaching in their classrooms, by selected school characteristics: 2015–16 .................... A-11
vi
Appendix B: Methodology and Technical Notes B-1. Weighted unit and overall response rates using initial base weight,
by survey: 2015–16 .......................................................................................................... B-5
B-2. Indication of potential sources of bias for public school teacher data at the national level based on comparisons between eligible teacher distribution and base-weighted or nonresponse-adjusted respondent distributions: 2015–16 ........................................................................................................................... B-7
B-3. Summary of weighted item response rates, by survey: 2015–16 ................................... B-10
Appendix C: Description of Variables C-1. Variables used in the Characteristics of Public Elementary and Secondary
School Teachers in the United States: Results From the National Teacher and Principal Survey report: 2015–16 ............................................................................. C-2
1
Introduction The 2015–16 National Teacher and Principal Survey (NTPS) is a nationally representative sample survey of public1 K–12 schools, principals, and teachers in the 50 states and the District of Columbia. This report presents selected findings from the Public School Teacher Data File of NTPS. NTPS is a redesign of the Schools and Staffing Survey (SASS). SASS was conducted on behalf of the National Center for Education Statistics (NCES) on a 4-year cycle, beginning with the 1987–88 school year and ending in the 2011–12 school year. NTPS maintains the same focus on schools, teachers, and administrators that was traditionally held by the SASS; however, it has a different structure and sample than previous administrations of SASS and operates on a 2-year survey cycle. NTPS collects data on core topics including teacher and principal preparation, classes taught, school characteristics, and demographics of the teacher and principal labor force. It is developed by the NCES of the Institute of Education Sciences within the U.S. Department of Education and conducted by the U.S. Census Bureau. This report represents the initial results of the first collection of NTPS.
The purpose of NTPS is to collect information that can provide a detailed picture of U.S. elementary and secondary schools and their staff. This information is collected through school, principal, and teacher surveys, and information can be linked across all three surveys.
The 2015–16 NTPS uses a school-based sample of public schools. Because of this school-based design, principals associated with public schools were included in the sample. Teachers associated with a selected school were sampled from a teacher list provided by the school, collected from school websites, or purchased from a vendor. The selected samples include about 8,300 traditional and charter public schools and public school principals, and 40,000 public school teachers. The samples were drawn to support estimates by geography, grade span, and charter school status. The reader is referred to the Survey Documentation for the 2015–16 National Teacher and Principal Survey (Cox et al. forthcoming) for details about these estimation domains and their precision criteria.
The data were collected via mailed questionnaires and internet instruments with telephone and in-person field follow-up. The first questionnaires were mailed in September 2015, and data collection ended in August 2016. The weighted unit response rate was 67.8 percent for public school teachers. For detailed information about response rates, bias analysis results, methodology, and design of the 2015–16 NTPS, please see the technical notes of this report in appendix B or the Survey Documentation for the 2015–16 National Teacher and Principal Survey (Cox et al. forthcoming).
The purpose of this First Look report is to introduce new data through the presentation of tables containing descriptive information. Selected findings chosen for this report demonstrate the range of information available on the 2015–16 NTPS Public School Teacher Restricted-Use Data File. The selected findings do not represent a complete review of all observed differences in the data and are not meant to emphasize any issue. This First Look report highlights findings from the NTPS public school teacher survey. Findings from the school and principal surveys will be presented in two companion First Look reports:
• Characteristics of Public Elementary and Secondary School Principals in the United States: Results From the 2015–16 National Teacher and Principal Survey First Look (NCES 2017-070); and
• Characteristics of Public Elementary and Secondary Schools in the United States: Results From the 2015–16 National Teacher and Principal Survey First Look (NCES 2017-071).
1 Public schools include traditional public and charter schools.
2
The tables in this report contain frequencies and percentages demonstrating bivariate relationships. All results have been weighted to reflect the sample design and to account for nonresponse and other adjustments. Comparisons drawn in the selected findings have been tested for statistical significance at the .05 level using Student’s t statistics to ensure that the differences are larger than those that might be expected due to sampling variation. While the selected findings include only statistically significant findings they do not include every statistically significant comparison. No adjustments were made for multiple comparisons. Many of the variables examined are related to one another, and complex interactions and relationships have not been explored. Statistical Analysis Software (SAS 9.4) and SUDAAN (11.1) were used to compute the statistics for this report. Tables of standard errors are provided in appendix A. Detailed information about the survey methodology is provided in appendix B. Appendix C contains a description of the variables used in this report.
More information about NTPS can be found at https://nces.ed.gov/surveys/ntps.
3
Selected Findings • In the 2015–16 school year, there were an estimated 3,827,100 teachers in public elementary and
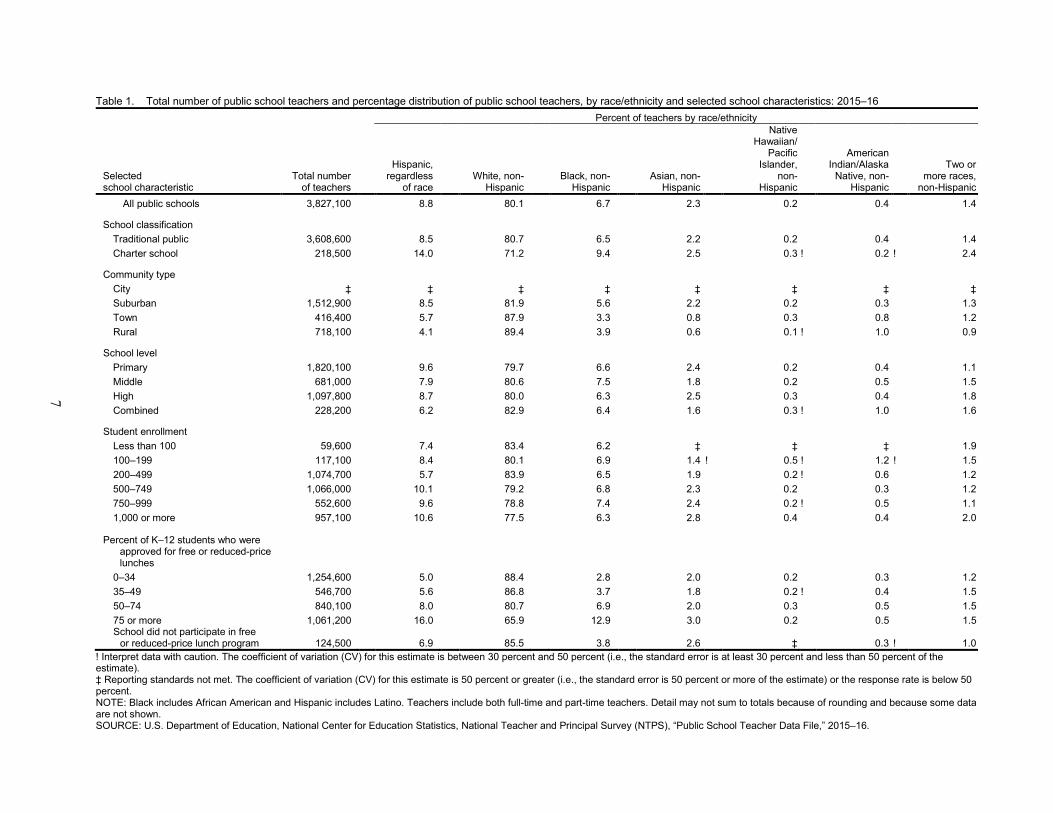
secondary schools in the United States. About 3,608,600 taught in traditional public schools and about 218,500 taught in charter schools. About 80 percent of all public school teachers were non-Hispanic White, 9 percent were Hispanic, 7 percent were non-Hispanic Black, and 2 percent were non-Hispanic Asian (table 1).
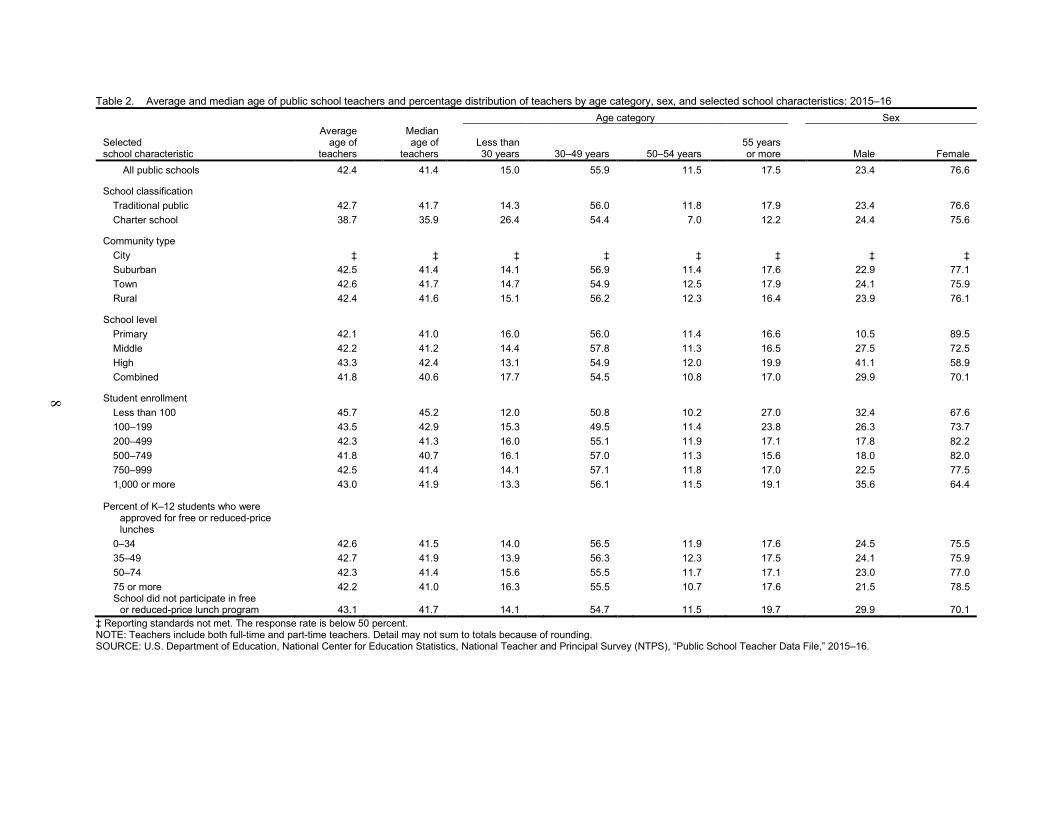
• Among public school teachers, 77 percent were female and 23 percent were male. In addition, relatively more women were teachers in primary schools (89 percent) than in middle schools (73 percent), combined schools (70 percent), and high schools (59 percent) (table 2).
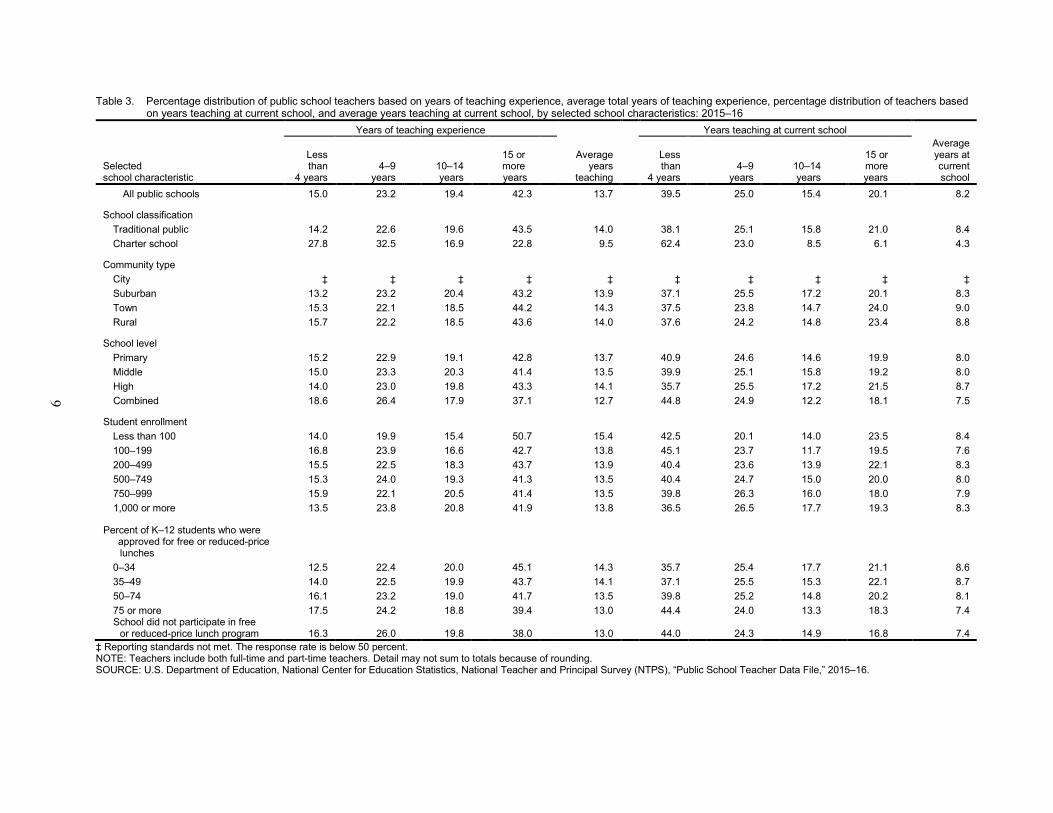
• On average, public school teachers had about 14 years of experience. In addition, teachers in traditional public schools had relatively more teaching experience on average (14 years) than teachers in public charter schools (10 years) (table 3).
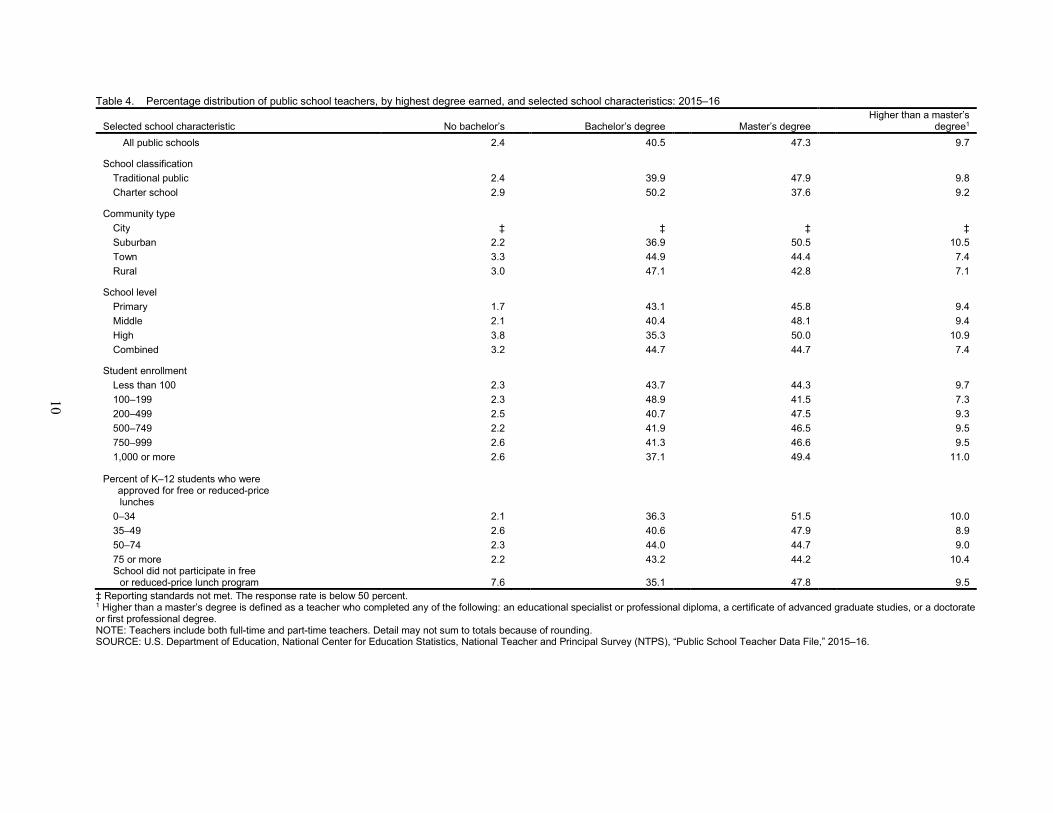
• The largest percentage of public school teachers listed a master’s degree as their highest degree earned (47 percent), followed by a bachelor’s degree (41 percent). Relatively more teachers in traditional public schools listed a master’s degree as their highest degree (48 percent) than those in public charter schools (38 percent) (table 4).
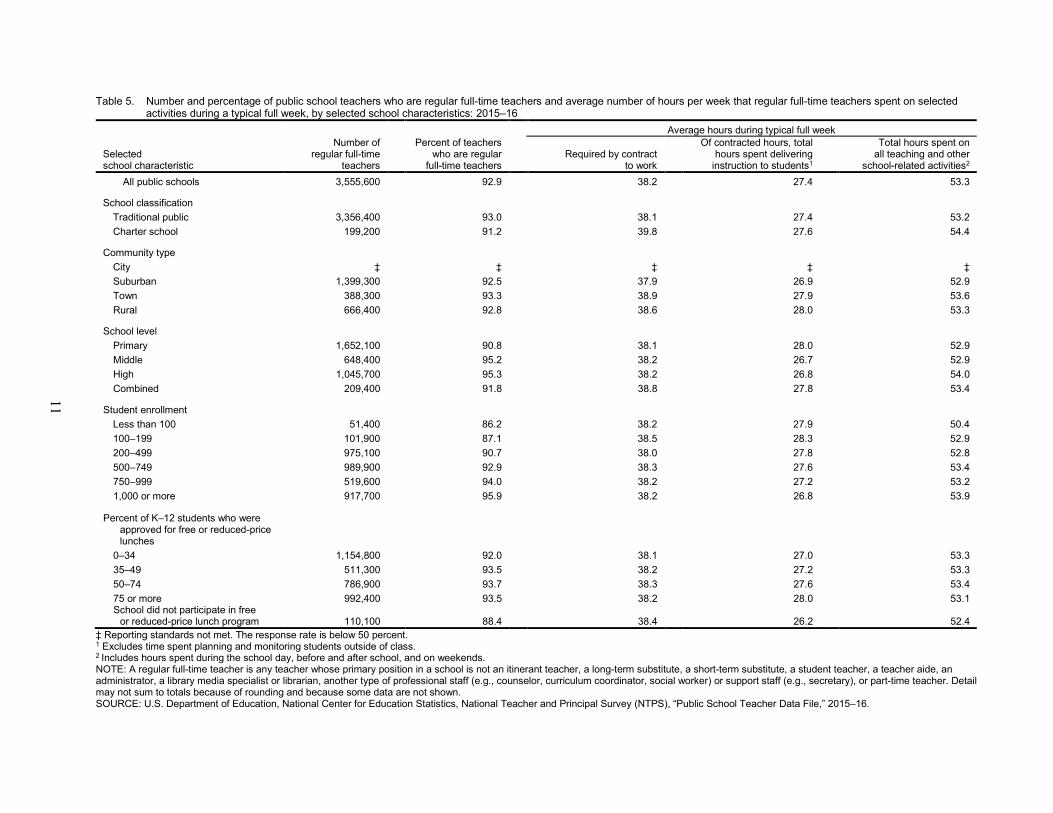
• On average, regular full-time teachers in public schools spent 53 hours per week on all school-related activities, including 27 hours that they were paid to deliver instruction to students during a typical full week. Public school teachers were required to work an average of 38 hours per week to receive their base pay (table 5).
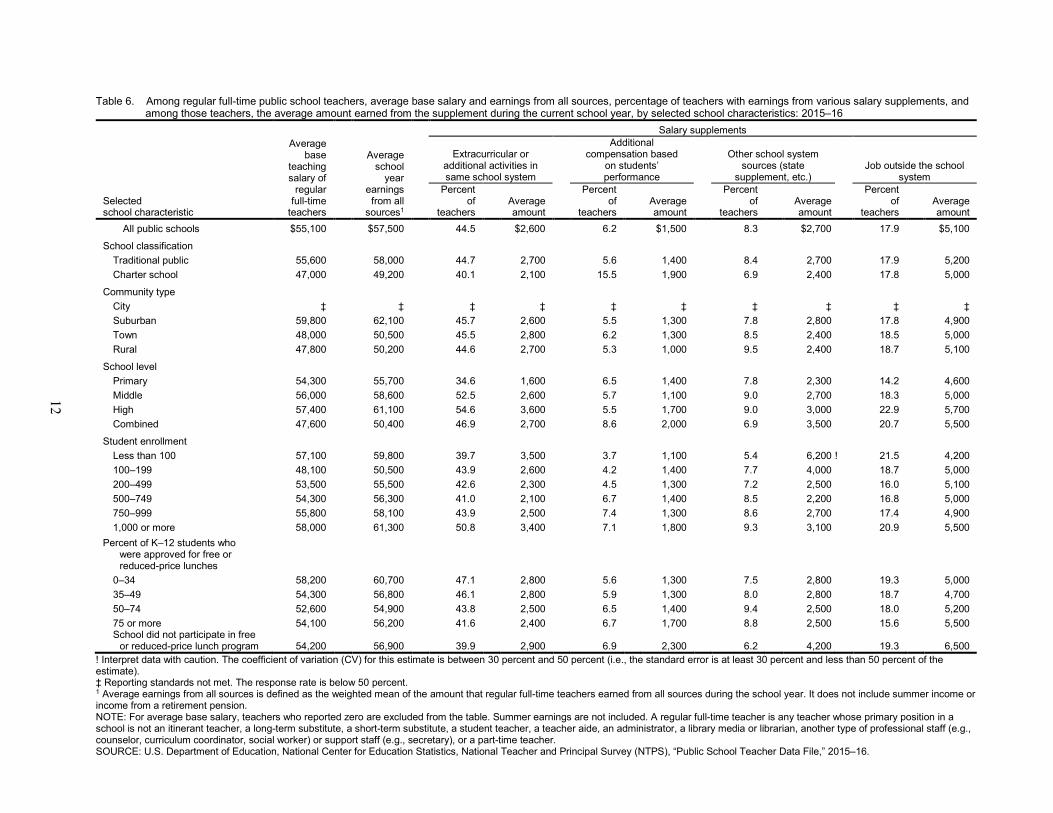
• In 2015–16, the average base salary2 of regular full-time teachers in public schools was $55,100. Among public school teachers reporting earnings from their school system for extracurricular or additional activities during the school year, the average amount was $2,600. Similarly, the average amount earned from jobs outside the school system by public teachers reporting this income source was $5,100 (table 6).
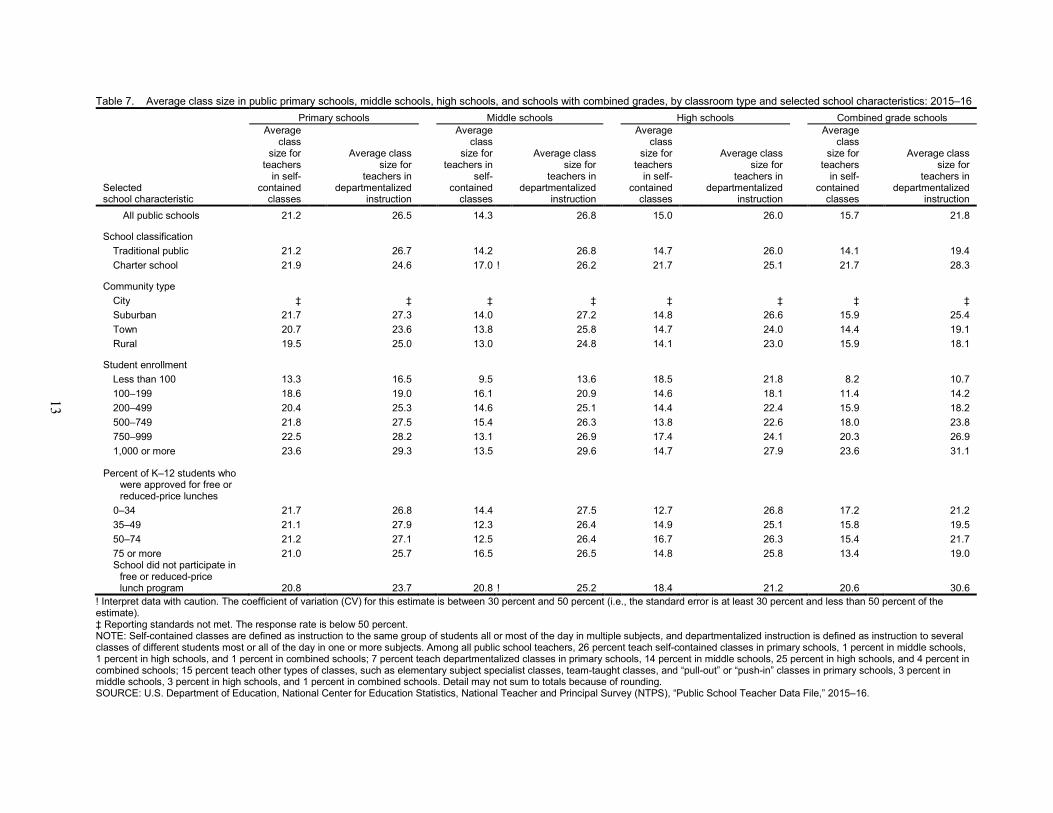
• Among teachers in self-contained classrooms, the average class size was 21 students in primary schools, 14 students in middle schools, 15 students for high schools, and 16 students for combined-grade schools. Among departmentalized teachers, the average class size was 27 for primary and middle schools, 26 for high schools, and 22 for combined-grade schools (table 7).
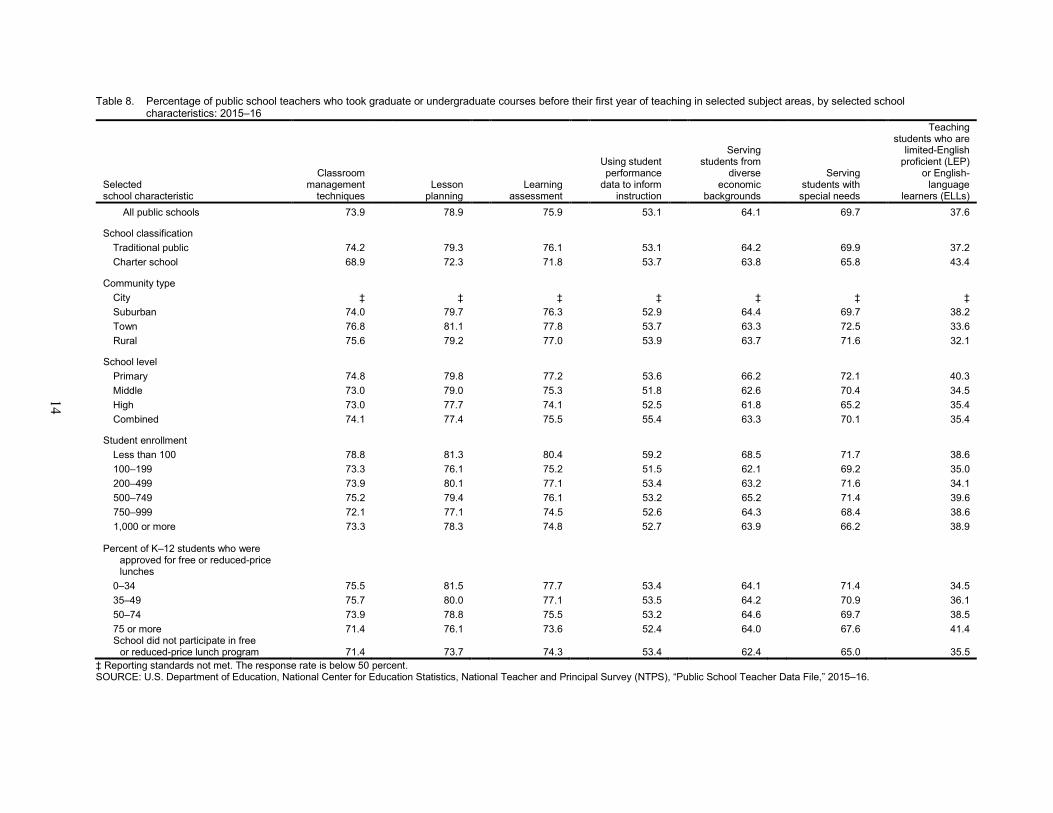
• Among all public schools teachers who took graduate or undergraduate courses before their first year of teaching, about 79 percent had any courses on lesson planning, 76 percent had any courses on learning assessment, 74 percent on classroom management techniques, 70 percent on serving students with special needs, 64 percent on serving students from diverse economic backgrounds, 53 percent on using student performance data to inform instruction, and 38 percent on teaching students who are limited-English proficient or English-language learners (table 8).
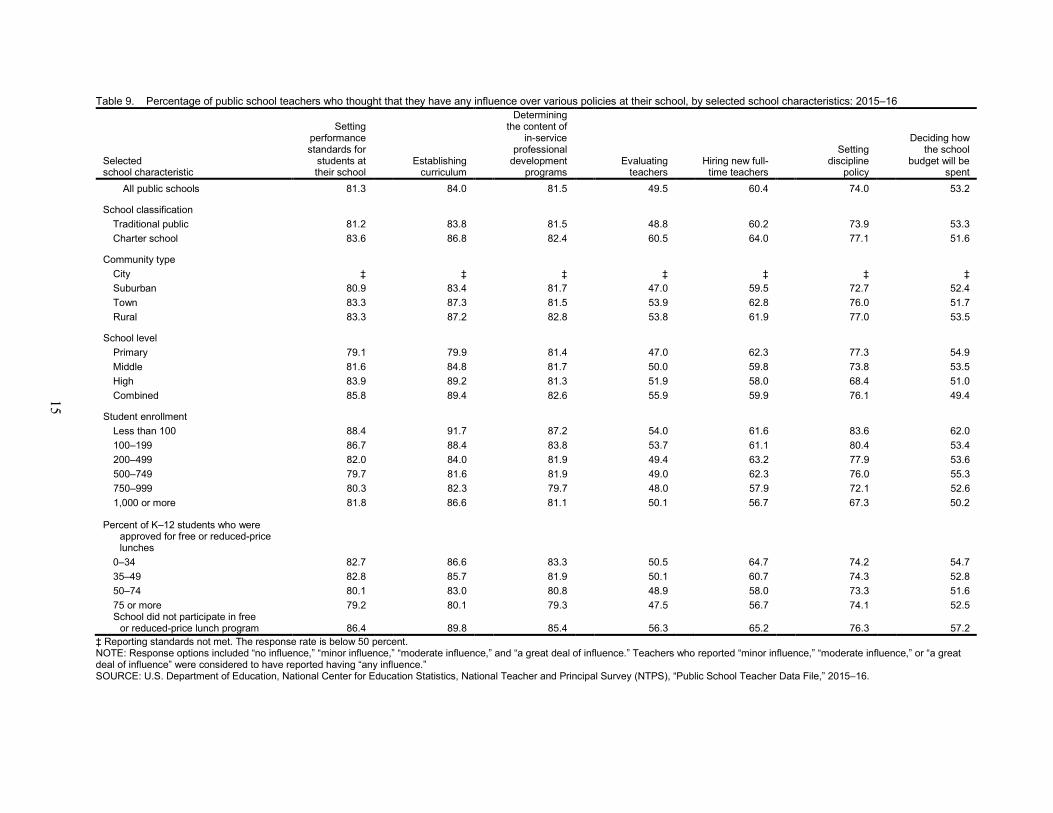
• Among all public school teachers, 84 percent thought they had any influence3 on establishing curriculum, 82 percent thought they had any influence on determining the content of in-service programs, 81 percent thought they had any influence on setting performance standards for students at their school, 74 percent thought they had any influence on setting discipline policy, 60 percent thought they had any influence on hiring new full-time teachers, 53 percent thought they had any influence on deciding how the school budget would be spent, and 49 percent thought they had any influence on evaluating teachers (table 9).
2 Average base salary is for the school year; summer earnings are not included. Teachers who reported a base salary of zero are excluded. 3 Teachers who reported “minor influence,” “moderate influence,” or “a great deal of influence” were considered to have reported having “any
influence.”
4
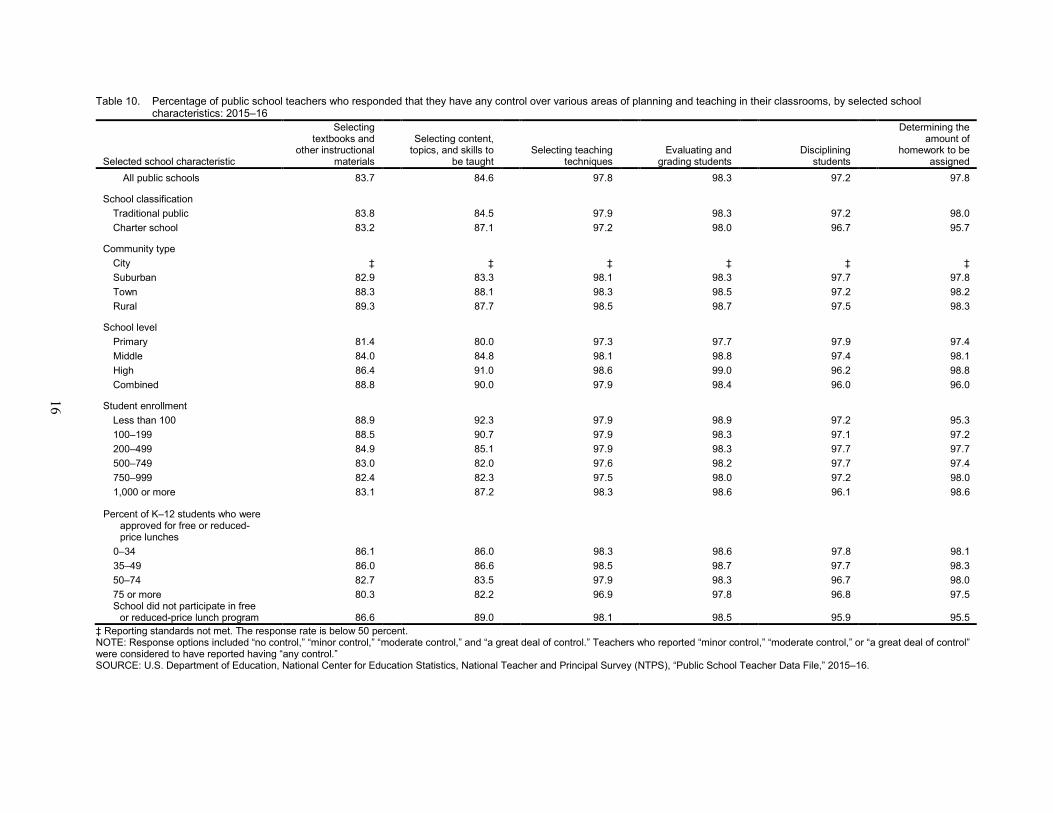
• About 98 percent of all public school teachers reported that they had any control4 over evaluating and grading students, selecting teaching techniques, and determining the amount of homework to be assigned. In addition, about 97 percent of teachers responded that they had any control over disciplining students, 85 percent on selecting content, topics, and skills to be taught, and 84 percent on selecting textbooks and other instructional materials (table10).
4 Teachers who reported “minor control,” “moderate control,” or “a great deal of control” were considered to have reported having “any control.”
5
References Cochran, W.G. (1977). Sampling Techniques. New York: John Wiley & Sons.
Cox, C., Gilary, A., Simon, D., and Thomas, T. (forthcoming). Survey Documentation for the 2015–16 National Teacher and Principal Survey. U.S. Department of Education. Washington, DC: National Center for Education Statistics.
Goldring, R., Taie, S., Rizzo, L., and Riddles, M. (2017). User’s Manual for the 2015–16 National Teacher and Principal Survey, Volumes 1–4 (NCES 2017-131 through 2017-134). U.S. Department of Education. Washington, DC: National Center for Education Statistics.
U.S. Department of Education, National Center for Education Statistics. (2012). 2012 Revision of NCES Statistical Standards: Final (NCES 2014-097). U.S. Department of Education. Washington, DC: National Center for Education Statistics. Retrieved [date], from https://nces.ed.gov/pubsearch/pubsinfo.asp?pubid=2014097.

6
Estimate Tables
7
Table 1. Total number of public school teachers and percentage distribution of public school teachers, by race/ethnicity and selected school characteristics: 2015–16
Selected school characteristic
Total number of teachers
Percent of teachers by race/ethnicity
Hispanic, regardless
of race White, non-
Hispanic Black, non-
Hispanic Asian, non-
Hispanic
Native Hawaiian/
Pacific Islander,
non- Hispanic
American Indian/Alaska
Native, non-Hispanic
Two or more races,
non-Hispanic All public schools 3,827,100 8.8 80.1 6.7 2.3 0.2 0.4 1.4
School classification Traditional public 3,608,600 8.5 80.7 6.5 2.2 0.2 0.4 1.4 Charter school 218,500 14.0 71.2 9.4 2.5 0.3 ! 0.2 ! 2.4
Community type City ‡ ‡ ‡ ‡ ‡ ‡ ‡ ‡ Suburban 1,512,900 8.5 81.9 5.6 2.2 0.2 0.3 1.3 Town 416,400 5.7 87.9 3.3 0.8 0.3 0.8 1.2 Rural 718,100 4.1 89.4 3.9 0.6 0.1 ! 1.0 0.9
School level Primary 1,820,100 9.6 79.7 6.6 2.4 0.2 0.4 1.1 Middle 681,000 7.9 80.6 7.5 1.8 0.2 0.5 1.5 High 1,097,800 8.7 80.0 6.3 2.5 0.3 0.4 1.8 Combined 228,200 6.2 82.9 6.4 1.6 0.3 ! 1.0 1.6
Student enrollment Less than 100 59,600 7.4 83.4 6.2 ‡ ‡ ‡ 1.9 100–199 117,100 8.4 80.1 6.9 1.4 ! 0.5 ! 1.2 ! 1.5 200–499 1,074,700 5.7 83.9 6.5 1.9 0.2 ! 0.6 1.2 500–749 1,066,000 10.1 79.2 6.8 2.3 0.2 0.3 1.2 750–999 552,600 9.6 78.8 7.4 2.4 0.2 ! 0.5 1.1 1,000 or more 957,100 10.6 77.5 6.3 2.8 0.4 0.4 2.0
Percent of K–12 students who were approved for free or reduced-price lunches
0–34 1,254,600 5.0 88.4 2.8 2.0 0.2 0.3 1.2 35–49 546,700 5.6 86.8 3.7 1.8 0.2 ! 0.4 1.5 50–74 840,100 8.0 80.7 6.9 2.0 0.3 0.5 1.5 75 or more 1,061,200 16.0 65.9 12.9 3.0 0.2 0.5 1.5 School did not participate in free
or reduced-price lunch program 124,500 6.9 85.5 3.8 2.6 ‡ 0.3 ! 1.0 ! Interpret data with caution. The coefficient of variation (CV) for this estimate is between 30 percent and 50 percent (i.e., the standard error is at least 30 percent and less than 50 percent of the estimate). ‡ Reporting standards not met. The coefficient of variation (CV) for this estimate is 50 percent or greater (i.e., the standard error is 50 percent or more of the estimate) or the response rate is below 50 percent. NOTE: Black includes African American and Hispanic includes Latino. Teachers include both full-time and part-time teachers. Detail may not sum to totals because of rounding and because some data are not shown. SOURCE: U.S. Department of Education, National Center for Education Statistics, National Teacher and Principal Survey (NTPS), “Public School Teacher Data File,” 2015–16.
8
Table 2. Average and median age of public school teachers and percentage distribution of teachers by age category, sex, and selected school characteristics: 2015–16
Selected school characteristic
Average age of
teachers
Median age of
teachers
Age category
Sex
Less than 30 years 30–49 years 50–54 years
55 years or more Male
Female All public schools 42.4 41.4 15.0 55.9 11.5 17.5 23.4 76.6
School classification Traditional public 42.7 41.7 14.3 56.0 11.8 17.9 23.4 76.6 Charter school 38.7 35.9 26.4 54.4 7.0 12.2 24.4 75.6
Community type City ‡ ‡ ‡ ‡ ‡ ‡ ‡ ‡ Suburban 42.5 41.4 14.1 56.9 11.4 17.6 22.9 77.1 Town 42.6 41.7 14.7 54.9 12.5 17.9 24.1 75.9 Rural 42.4 41.6 15.1 56.2 12.3 16.4 23.9 76.1
School level Primary 42.1 41.0 16.0 56.0 11.4 16.6 10.5 89.5 Middle 42.2 41.2 14.4 57.8 11.3 16.5 27.5 72.5 High 43.3 42.4 13.1 54.9 12.0 19.9 41.1 58.9 Combined 41.8 40.6 17.7 54.5 10.8 17.0 29.9 70.1
Student enrollment Less than 100 45.7 45.2 12.0 50.8 10.2 27.0 32.4 67.6 100–199 43.5 42.9 15.3 49.5 11.4 23.8 26.3 73.7 200–499 42.3 41.3 16.0 55.1 11.9 17.1 17.8 82.2 500–749 41.8 40.7 16.1 57.0 11.3 15.6 18.0 82.0 750–999 42.5 41.4 14.1 57.1 11.8 17.0 22.5 77.5 1,000 or more 43.0 41.9 13.3 56.1 11.5 19.1 35.6 64.4
Percent of K–12 students who were approved for free or reduced-price lunches
0–34 42.6 41.5 14.0 56.5 11.9 17.6 24.5 75.5 35–49 42.7 41.9 13.9 56.3 12.3 17.5 24.1 75.9 50–74 42.3 41.4 15.6 55.5 11.7 17.1 23.0 77.0 75 or more 42.2 41.0 16.3 55.5 10.7 17.6 21.5 78.5 School did not participate in free
or reduced-price lunch program 43.1 41.7 14.1 54.7 11.5 19.7 29.9 70.1 ‡ Reporting standards not met. The response rate is below 50 percent. NOTE: Teachers include both full-time and part-time teachers. Detail may not sum to totals because of rounding. SOURCE: U.S. Department of Education, National Center for Education Statistics, National Teacher and Principal Survey (NTPS), “Public School Teacher Data File,” 2015–16.
9
Table 3. Percentage distribution of public school teachers based on years of teaching experience, average total years of teaching experience, percentage distribution of teachers based on years teaching at current school, and average years teaching at current school, by selected school characteristics: 2015–16
Selected school characteristic
Years of teaching experience
Average years
teaching
Years teaching at current school Average years at current school
Less than
4 years 4–9
years 10–14 years
15 or more years
Less than
4 years 4–9
years 10–14 years
15 or more
years All public schools 15.0 23.2 19.4 42.3 13.7 39.5 25.0 15.4 20.1 8.2
School classification Traditional public 14.2 22.6 19.6 43.5 14.0 38.1 25.1 15.8 21.0 8.4 Charter school 27.8 32.5 16.9 22.8 9.5 62.4 23.0 8.5 6.1 4.3
Community type City ‡ ‡ ‡ ‡ ‡ ‡ ‡ ‡ ‡ ‡ Suburban 13.2 23.2 20.4 43.2 13.9 37.1 25.5 17.2 20.1 8.3 Town 15.3 22.1 18.5 44.2 14.3 37.5 23.8 14.7 24.0 9.0 Rural 15.7 22.2 18.5 43.6 14.0 37.6 24.2 14.8 23.4 8.8
School level Primary 15.2 22.9 19.1 42.8 13.7 40.9 24.6 14.6 19.9 8.0 Middle 15.0 23.3 20.3 41.4 13.5 39.9 25.1 15.8 19.2 8.0 High 14.0 23.0 19.8 43.3 14.1 35.7 25.5 17.2 21.5 8.7 Combined 18.6 26.4 17.9 37.1 12.7 44.8 24.9 12.2 18.1 7.5
Student enrollment Less than 100 14.0 19.9 15.4 50.7 15.4 42.5 20.1 14.0 23.5 8.4 100–199 16.8 23.9 16.6 42.7 13.8 45.1 23.7 11.7 19.5 7.6 200–499 15.5 22.5 18.3 43.7 13.9 40.4 23.6 13.9 22.1 8.3 500–749 15.3 24.0 19.3 41.3 13.5 40.4 24.7 15.0 20.0 8.0 750–999 15.9 22.1 20.5 41.4 13.5 39.8 26.3 16.0 18.0 7.9 1,000 or more 13.5 23.8 20.8 41.9 13.8 36.5 26.5 17.7 19.3 8.3
Percent of K–12 students who were approved for free or reduced-price lunches
0–34 12.5 22.4 20.0 45.1 14.3 35.7 25.4 17.7 21.1 8.6 35–49 14.0 22.5 19.9 43.7 14.1 37.1 25.5 15.3 22.1 8.7 50–74 16.1 23.2 19.0 41.7 13.5 39.8 25.2 14.8 20.2 8.1 75 or more 17.5 24.2 18.8 39.4 13.0 44.4 24.0 13.3 18.3 7.4 School did not participate in free
or reduced-price lunch program 16.3 26.0 19.8 38.0 13.0 44.0 24.3 14.9 16.8 7.4 ‡ Reporting standards not met. The response rate is below 50 percent. NOTE: Teachers include both full-time and part-time teachers. Detail may not sum to totals because of rounding. SOURCE: U.S. Department of Education, National Center for Education Statistics, National Teacher and Principal Survey (NTPS), “Public School Teacher Data File,” 2015–16.
10
Table 4. Percentage distribution of public school teachers, by highest degree earned, and selected school characteristics: 2015–16
Selected school characteristic No bachelor’s Bachelor’s degree Master’s degree Higher than a master’s
degree1 All public schools 2.4 40.5 47.3 9.7
School classification Traditional public 2.4 39.9 47.9 9.8 Charter school 2.9 50.2 37.6 9.2
Community type City ‡ ‡ ‡ ‡ Suburban 2.2 36.9 50.5 10.5 Town 3.3 44.9 44.4 7.4 Rural 3.0 47.1 42.8 7.1
School level Primary 1.7 43.1 45.8 9.4 Middle 2.1 40.4 48.1 9.4 High 3.8 35.3 50.0 10.9 Combined 3.2 44.7 44.7 7.4
Student enrollment Less than 100 2.3 43.7 44.3 9.7 100–199 2.3 48.9 41.5 7.3 200–499 2.5 40.7 47.5 9.3 500–749 2.2 41.9 46.5 9.5 750–999 2.6 41.3 46.6 9.5 1,000 or more 2.6 37.1 49.4 11.0
Percent of K–12 students who were approved for free or reduced-price lunches
0–34 2.1 36.3 51.5 10.0 35–49 2.6 40.6 47.9 8.9 50–74 2.3 44.0 44.7 9.0 75 or more 2.2 43.2 44.2 10.4 School did not participate in free
or reduced-price lunch program 7.6 35.1 47.8 9.5 ‡ Reporting standards not met. The response rate is below 50 percent. 1 Higher than a master’s degree is defined as a teacher who completed any of the following: an educational specialist or professional diploma, a certificate of advanced graduate studies, or a doctorate or first professional degree. NOTE: Teachers include both full-time and part-time teachers. Detail may not sum to totals because of rounding. SOURCE: U.S. Department of Education, National Center for Education Statistics, National Teacher and Principal Survey (NTPS), “Public School Teacher Data File,” 2015–16.
11
Table 5. Number and percentage of public school teachers who are regular full-time teachers and average number of hours per week that regular full-time teachers spent on selected activities during a typical full week, by selected school characteristics: 2015–16
Selected school characteristic
Number of regular full-time
teachers
Percent of teachers who are regular
full-time teachers
Average hours during typical full week
Required by contract to work
Of contracted hours, total hours spent delivering
instruction to students1
Total hours spent on all teaching and other
school-related activities2 All public schools 3,555,600 92.9 38.2 27.4 53.3
School classification Traditional public 3,356,400 93.0 38.1 27.4 53.2 Charter school 199,200 91.2 39.8 27.6 54.4
Community type City ‡ ‡ ‡ ‡ ‡ Suburban 1,399,300 92.5 37.9 26.9 52.9 Town 388,300 93.3 38.9 27.9 53.6 Rural 666,400 92.8 38.6 28.0 53.3
School level Primary 1,652,100 90.8 38.1 28.0 52.9 Middle 648,400 95.2 38.2 26.7 52.9 High 1,045,700 95.3 38.2 26.8 54.0 Combined 209,400 91.8 38.8 27.8 53.4
Student enrollment Less than 100 51,400 86.2 38.2 27.9 50.4 100–199 101,900 87.1 38.5 28.3 52.9 200–499 975,100 90.7 38.0 27.8 52.8 500–749 989,900 92.9 38.3 27.6 53.4 750–999 519,600 94.0 38.2 27.2 53.2 1,000 or more 917,700 95.9 38.2 26.8 53.9
Percent of K–12 students who were approved for free or reduced-price lunches
0–34 1,154,800 92.0 38.1 27.0 53.3 35–49 511,300 93.5 38.2 27.2 53.3 50–74 786,900 93.7 38.3 27.6 53.4 75 or more 992,400 93.5 38.2 28.0 53.1 School did not participate in free
or reduced-price lunch program 110,100 88.4 38.4 26.2 52.4 ‡ Reporting standards not met. The response rate is below 50 percent. 1 Excludes time spent planning and monitoring students outside of class. 2 Includes hours spent during the school day, before and after school, and on weekends. NOTE: A regular full-time teacher is any teacher whose primary position in a school is not an itinerant teacher, a long-term substitute, a short-term substitute, a student teacher, a teacher aide, an administrator, a library media specialist or librarian, another type of professional staff (e.g., counselor, curriculum coordinator, social worker) or support staff (e.g., secretary), or part-time teacher. Detail may not sum to totals because of rounding and because some data are not shown. SOURCE: U.S. Department of Education, National Center for Education Statistics, National Teacher and Principal Survey (NTPS), “Public School Teacher Data File,” 2015–16.
12
Table 6. Among regular full-time public school teachers, average base salary and earnings from all sources, percentage of teachers with earnings from various salary supplements, and among those teachers, the average amount earned from the supplement during the current school year, by selected school characteristics: 2015–16
Selected school characteristic
Average base
teaching salary of
regular full-time
teachers
Average school
year earnings from all
sources1
Salary supplements
Extracurricular or additional activities in same school system
Additional compensation based
on students’ performance
Other school system sources (state
supplement, etc.) Job outside the school
system Percent
of teachers
Average amount
Percent of
teachers Average amount
Percent of
teachers Average amount
Percent of
teachers Average amount
All public schools $55,100 $57,500 44.5 $2,600 6.2 $1,500 8.3 $2,700 17.9 $5,100
School classification Traditional public 55,600 58,000 44.7 2,700 5.6 1,400 8.4 2,700 17.9 5,200 Charter school 47,000 49,200 40.1 2,100 15.5 1,900 6.9 2,400 17.8 5,000
Community type City ‡ ‡ ‡ ‡ ‡ ‡ ‡ ‡ ‡ ‡ Suburban 59,800 62,100 45.7 2,600 5.5 1,300 7.8 2,800 17.8 4,900 Town 48,000 50,500 45.5 2,800 6.2 1,300 8.5 2,400 18.5 5,000 Rural 47,800 50,200 44.6 2,700 5.3 1,000 9.5 2,400 18.7 5,100
School level Primary 54,300 55,700 34.6 1,600 6.5 1,400 7.8 2,300 14.2 4,600 Middle 56,000 58,600 52.5 2,600 5.7 1,100 9.0 2,700 18.3 5,000 High 57,400 61,100 54.6 3,600 5.5 1,700 9.0 3,000 22.9 5,700 Combined 47,600 50,400 46.9 2,700 8.6 2,000 6.9 3,500 20.7 5,500
Student enrollment Less than 100 57,100 59,800 39.7 3,500 3.7 1,100 5.4 6,200 ! 21.5 4,200 100–199 48,100 50,500 43.9 2,600 4.2 1,400 7.7 4,000 18.7 5,000 200–499 53,500 55,500 42.6 2,300 4.5 1,300 7.2 2,500 16.0 5,100 500–749 54,300 56,300 41.0 2,100 6.7 1,400 8.5 2,200 16.8 5,000 750–999 55,800 58,100 43.9 2,500 7.4 1,300 8.6 2,700 17.4 4,900 1,000 or more 58,000 61,300 50.8 3,400 7.1 1,800 9.3 3,100 20.9 5,500
Percent of K–12 students who were approved for free or reduced-price lunches
0–34 58,200 60,700 47.1 2,800 5.6 1,300 7.5 2,800 19.3 5,000 35–49 54,300 56,800 46.1 2,800 5.9 1,300 8.0 2,800 18.7 4,700 50–74 52,600 54,900 43.8 2,500 6.5 1,400 9.4 2,500 18.0 5,200 75 or more 54,100 56,200 41.6 2,400 6.7 1,700 8.8 2,500 15.6 5,500 School did not participate in free
or reduced-price lunch program 54,200 56,900 39.9 2,900 6.9 2,300 6.2 4,200 19.3 6,500 ! Interpret data with caution. The coefficient of variation (CV) for this estimate is between 30 percent and 50 percent (i.e., the standard error is at least 30 percent and less than 50 percent of the estimate). ‡ Reporting standards not met. The response rate is below 50 percent. 1 Average earnings from all sources is defined as the weighted mean of the amount that regular full-time teachers earned from all sources during the school year. It does not include summer income or income from a retirement pension. NOTE: For average base salary, teachers who reported zero are excluded from the table. Summer earnings are not included. A regular full-time teacher is any teacher whose primary position in a school is not an itinerant teacher, a long-term substitute, a short-term substitute, a student teacher, a teacher aide, an administrator, a library media or librarian, another type of professional staff (e.g., counselor, curriculum coordinator, social worker) or support staff (e.g., secretary), or a part-time teacher. SOURCE: U.S. Department of Education, National Center for Education Statistics, National Teacher and Principal Survey (NTPS), “Public School Teacher Data File,” 2015–16.
13
Table 7. Average class size in public primary schools, middle schools, high schools, and schools with combined grades, by classroom type and selected school characteristics: 2015–16
Selected school characteristic
Primary schools
Middle schools
High schools
Combined grade schools Average
class size for
teachers in self-
contained classes
Average class size for
teachers in departmentalized
instruction
Average class
size for teachers in
self-contained
classes
Average class size for
teachers in departmentalized
instruction
Average class
size for teachers
in self-contained
classes
Average class size for
teachers in departmentalized
instruction
Average class
size for teachers
in self-contained
classes
Average class size for
teachers in departmentalized
instruction All public schools 21.2 26.5 14.3 26.8 15.0 26.0 15.7 21.8
School classification Traditional public 21.2 26.7 14.2 26.8 14.7 26.0 14.1 19.4 Charter school 21.9 24.6 17.0 ! 26.2 21.7 25.1 21.7 28.3
Community type City ‡ ‡ ‡ ‡ ‡ ‡ ‡ ‡ Suburban 21.7 27.3 14.0 27.2 14.8 26.6 15.9 25.4 Town 20.7 23.6 13.8 25.8 14.7 24.0 14.4 19.1 Rural 19.5 25.0 13.0 24.8 14.1 23.0 15.9 18.1
Student enrollment Less than 100 13.3 16.5 9.5 13.6 18.5 21.8 8.2 10.7 100–199 18.6 19.0 16.1 20.9 14.6 18.1 11.4 14.2 200–499 20.4 25.3 14.6 25.1 14.4 22.4 15.9 18.2 500–749 21.8 27.5 15.4 26.3 13.8 22.6 18.0 23.8 750–999 22.5 28.2 13.1 26.9 17.4 24.1 20.3 26.9 1,000 or more 23.6 29.3 13.5 29.6 14.7 27.9 23.6 31.1
Percent of K–12 students who were approved for free or reduced-price lunches
0–34 21.7 26.8 14.4 27.5 12.7 26.8 17.2 21.2 35–49 21.1 27.9 12.3 26.4 14.9 25.1 15.8 19.5 50–74 21.2 27.1 12.5 26.4 16.7 26.3 15.4 21.7 75 or more 21.0 25.7 16.5 26.5 14.8 25.8 13.4 19.0 School did not participate in
free or reduced-price lunch program 20.8 23.7 20.8 ! 25.2 18.4 21.2 20.6 30.6
! Interpret data with caution. The coefficient of variation (CV) for this estimate is between 30 percent and 50 percent (i.e., the standard error is at least 30 percent and less than 50 percent of the estimate). ‡ Reporting standards not met. The response rate is below 50 percent. NOTE: Self-contained classes are defined as instruction to the same group of students all or most of the day in multiple subjects, and departmentalized instruction is defined as instruction to several classes of different students most or all of the day in one or more subjects. Among all public school teachers, 26 percent teach self-contained classes in primary schools, 1 percent in middle schools, 1 percent in high schools, and 1 percent in combined schools; 7 percent teach departmentalized classes in primary schools, 14 percent in middle schools, 25 percent in high schools, and 4 percent in combined schools; 15 percent teach other types of classes, such as elementary subject specialist classes, team-taught classes, and “pull-out” or “push-in” classes in primary schools, 3 percent in middle schools, 3 percent in high schools, and 1 percent in combined schools. Detail may not sum to totals because of rounding. SOURCE: U.S. Department of Education, National Center for Education Statistics, National Teacher and Principal Survey (NTPS), “Public School Teacher Data File,” 2015–16.
14
Table 8. Percentage of public school teachers who took graduate or undergraduate courses before their first year of teaching in selected subject areas, by selected school characteristics: 2015–16
Selected school characteristic
Classroom management
techniques Lesson
planning Learning
assessment
Using student performance
data to inform instruction
Serving students from
diverse economic
backgrounds
Serving students with special needs
Teaching students who are
limited-English proficient (LEP)
or English-language
learners (ELLs) All public schools 73.9 78.9 75.9 53.1 64.1 69.7 37.6
School classification Traditional public 74.2 79.3 76.1 53.1 64.2 69.9 37.2 Charter school 68.9 72.3 71.8 53.7 63.8 65.8 43.4
Community type City ‡ ‡ ‡ ‡ ‡ ‡ ‡ Suburban 74.0 79.7 76.3 52.9 64.4 69.7 38.2 Town 76.8 81.1 77.8 53.7 63.3 72.5 33.6 Rural 75.6 79.2 77.0 53.9 63.7 71.6 32.1
School level Primary 74.8 79.8 77.2 53.6 66.2 72.1 40.3 Middle 73.0 79.0 75.3 51.8 62.6 70.4 34.5 High 73.0 77.7 74.1 52.5 61.8 65.2 35.4 Combined 74.1 77.4 75.5 55.4 63.3 70.1 35.4
Student enrollment Less than 100 78.8 81.3 80.4 59.2 68.5 71.7 38.6 100–199 73.3 76.1 75.2 51.5 62.1 69.2 35.0 200–499 73.9 80.1 77.1 53.4 63.2 71.6 34.1 500–749 75.2 79.4 76.1 53.2 65.2 71.4 39.6 750–999 72.1 77.1 74.5 52.6 64.3 68.4 38.6 1,000 or more 73.3 78.3 74.8 52.7 63.9 66.2 38.9
Percent of K–12 students who were approved for free or reduced-price lunches
0–34 75.5 81.5 77.7 53.4 64.1 71.4 34.5 35–49 75.7 80.0 77.1 53.5 64.2 70.9 36.1 50–74 73.9 78.8 75.5 53.2 64.6 69.7 38.5 75 or more 71.4 76.1 73.6 52.4 64.0 67.6 41.4 School did not participate in free
or reduced-price lunch program 71.4 73.7 74.3 53.4 62.4 65.0 35.5 ‡ Reporting standards not met. The response rate is below 50 percent. SOURCE: U.S. Department of Education, National Center for Education Statistics, National Teacher and Principal Survey (NTPS), “Public School Teacher Data File,” 2015–16.
15
Table 9. Percentage of public school teachers who thought that they have any influence over various policies at their school, by selected school characteristics: 2015–16
Selected school characteristic
Setting performance standards for
students at their school
Establishing curriculum
Determining the content of
in-service professional
development programs
Evaluating teachers
Hiring new full-time teachers
Setting discipline
policy
Deciding how the school
budget will be spent
All public schools 81.3 84.0 81.5 49.5 60.4 74.0 53.2
School classification Traditional public 81.2 83.8 81.5 48.8 60.2 73.9 53.3 Charter school 83.6 86.8 82.4 60.5 64.0 77.1 51.6
Community type City ‡ ‡ ‡ ‡ ‡ ‡ ‡ Suburban 80.9 83.4 81.7 47.0 59.5 72.7 52.4 Town 83.3 87.3 81.5 53.9 62.8 76.0 51.7 Rural 83.3 87.2 82.8 53.8 61.9 77.0 53.5
School level Primary 79.1 79.9 81.4 47.0 62.3 77.3 54.9 Middle 81.6 84.8 81.7 50.0 59.8 73.8 53.5 High 83.9 89.2 81.3 51.9 58.0 68.4 51.0 Combined 85.8 89.4 82.6 55.9 59.9 76.1 49.4
Student enrollment Less than 100 88.4 91.7 87.2 54.0 61.6 83.6 62.0 100–199 86.7 88.4 83.8 53.7 61.1 80.4 53.4 200–499 82.0 84.0 81.9 49.4 63.2 77.9 53.6 500–749 79.7 81.6 81.9 49.0 62.3 76.0 55.3 750–999 80.3 82.3 79.7 48.0 57.9 72.1 52.6 1,000 or more 81.8 86.6 81.1 50.1 56.7 67.3 50.2
Percent of K–12 students who were approved for free or reduced-price lunches
0–34 82.7 86.6 83.3 50.5 64.7 74.2 54.7 35–49 82.8 85.7 81.9 50.1 60.7 74.3 52.8 50–74 80.1 83.0 80.8 48.9 58.0 73.3 51.6 75 or more 79.2 80.1 79.3 47.5 56.7 74.1 52.5 School did not participate in free
or reduced-price lunch program 86.4 89.8 85.4 56.3 65.2 76.3 57.2 ‡ Reporting standards not met. The response rate is below 50 percent. NOTE: Response options included “no influence,” “minor influence,” “moderate influence,” and “a great deal of influence.” Teachers who reported “minor influence,” “moderate influence,” or “a great deal of influence” were considered to have reported having “any influence.” SOURCE: U.S. Department of Education, National Center for Education Statistics, National Teacher and Principal Survey (NTPS), “Public School Teacher Data File,” 2015–16.
16
Table 10. Percentage of public school teachers who responded that they have any control over various areas of planning and teaching in their classrooms, by selected school characteristics: 2015–16
Selected school characteristic
Selecting textbooks and
other instructional materials
Selecting content, topics, and skills to
be taught Selecting teaching
techniques Evaluating and
grading students Disciplining
students
Determining the amount of
homework to be assigned
All public schools 83.7 84.6 97.8 98.3 97.2 97.8
School classification Traditional public 83.8 84.5 97.9 98.3 97.2 98.0 Charter school 83.2 87.1 97.2 98.0 96.7 95.7
Community type City ‡ ‡ ‡ ‡ ‡ ‡ Suburban 82.9 83.3 98.1 98.3 97.7 97.8 Town 88.3 88.1 98.3 98.5 97.2 98.2 Rural 89.3 87.7 98.5 98.7 97.5 98.3
School level Primary 81.4 80.0 97.3 97.7 97.9 97.4 Middle 84.0 84.8 98.1 98.8 97.4 98.1 High 86.4 91.0 98.6 99.0 96.2 98.8 Combined 88.8 90.0 97.9 98.4 96.0 96.0
Student enrollment Less than 100 88.9 92.3 97.9 98.9 97.2 95.3 100–199 88.5 90.7 97.9 98.3 97.1 97.2 200–499 84.9 85.1 97.9 98.3 97.7 97.7 500–749 83.0 82.0 97.6 98.2 97.7 97.4 750–999 82.4 82.3 97.5 98.0 97.2 98.0 1,000 or more 83.1 87.2 98.3 98.6 96.1 98.6
Percent of K–12 students who were approved for free or reduced- price lunches
0–34 86.1 86.0 98.3 98.6 97.8 98.1 35–49 86.0 86.6 98.5 98.7 97.7 98.3 50–74 82.7 83.5 97.9 98.3 96.7 98.0 75 or more 80.3 82.2 96.9 97.8 96.8 97.5 School did not participate in free
or reduced-price lunch program 86.6 89.0 98.1 98.5 95.9 95.5 ‡ Reporting standards not met. The response rate is below 50 percent. NOTE: Response options included “no control,” “minor control,” “moderate control,” and “a great deal of control.” Teachers who reported “minor control,” “moderate control,” or “a great deal of control” were considered to have reported having “any control.” SOURCE: U.S. Department of Education, National Center for Education Statistics, National Teacher and Principal Survey (NTPS), “Public School Teacher Data File,” 2015–16.

A-1
Appendix A: Standard Error Tables
A-2
Table A-1. Standard errors for table 1: Total number of public school teachers and percentage distribution of public school teachers, by race/ethnicity and selected school characteristics: 2015–16
Selected school characteristic
Total number of teachers
Percent of teachers by race/ethnicity
Hispanic, regardless
of race White, non-
Hispanic Black, non-
Hispanic Asian, non-
Hispanic
Native Hawaiian/
Pacific Islander,
non- Hispanic
American Indian/Alaska
Native, non-Hispanic
Two or more races,
non-Hispanic All public schools 49,470 0.22 0.34 0.21 0.09 0.03 0.04 0.07
School classification Traditional public 46,930 0.23 0.35 0.22 0.10 0.03 0.04 0.07 Charter school 9,870 1.13 1.35 0.79 0.33 0.10 0.09 0.34
Community type City † † † † † † † † Suburban 41,610 0.38 0.49 0.27 0.16 0.05 0.05 0.11 Town 13,620 0.42 0.59 0.31 0.14 0.07 0.15 0.15 Rural 21,370 0.41 0.55 0.33 0.10 0.04 0.13 0.11
School level Primary 43,440 0.41 0.60 0.36 0.15 0.04 0.05 0.10 Middle 28,930 0.60 0.89 0.58 0.22 0.06 0.11 0.17 High 40,780 0.43 0.65 0.39 0.21 0.06 0.08 0.15 Combined 10,330 0.62 1.07 0.75 0.24 0.11 0.18 0.24
Student enrollment Less than 100 10,040 1.82 1.70 1.52 † † † 0.74 100–199 7,360 1.18 1.54 1.06 0.45 0.18 0.38 0.32 200–499 22,090 0.38 0.62 0.41 0.18 0.05 0.09 0.11 500–749 29,670 0.55 0.78 0.46 0.21 0.05 0.06 0.15 750–999 22,790 0.76 1.11 0.57 0.32 0.06 0.11 0.16 1,000 or more 36,100 0.56 0.75 0.41 0.24 0.08 0.08 0.17
Percent of K–12 students who were approved for free or reduced-price lunches
0–34 34,280 0.30 0.47 0.22 0.18 0.05 0.06 0.12 35–49 23,800 0.55 0.81 0.38 0.27 0.09 0.12 0.20 50–74 26,450 0.53 0.75 0.49 0.23 0.07 0.11 0.16 75 or more 29,450 0.63 0.84 0.59 0.22 0.05 0.08 0.14 School did not participate in free
or reduced-price lunch program 8,740 0.99 1.24 0.80 0.61 † 0.13 0.28 † Not applicable. SOURCE: U.S. Department of Education, National Center for Education Statistics, National Teacher and Principal Survey (NTPS), “Public School Teacher Data File,” 2015–16.
A-3
Table A-2. Standard errors for table 2: Average and median age of public school teachers and percentage distribution of teachers by age category, sex, and selected school characteristics: 2015–16
Selected school characteristic
Average age of
teachers
Median age of
teachers
Age category
Sex
Less than 30 years 30–49 years 50–54 years
55 years or more Male
Female All public schools 0.07 0.12 0.23 0.32 0.18 0.25 0.34 0.34
School classification Traditional public 0.08 0.12 0.24 0.33 0.18 0.26 0.35 0.35 Charter school 0.24 0.30 1.02 1.04 0.50 0.63 0.95 0.95
Community type City † † † † † † † † Suburban 0.13 0.21 0.40 0.52 0.30 0.40 0.57 0.57 Town 0.16 0.29 0.53 0.75 0.47 0.56 0.96 0.96 Rural 0.15 0.22 0.49 0.62 0.42 0.49 0.66 0.66
School level Primary 0.12 0.19 0.39 0.50 0.30 0.39 0.26 0.26 Middle 0.17 0.27 0.49 0.67 0.38 0.52 0.60 0.60 High 0.14 0.20 0.41 0.56 0.33 0.46 0.58 0.58 Combined 0.27 0.36 0.85 0.92 0.59 0.71 0.85 0.85
Student enrollment Less than 100 0.51 0.56 1.28 2.13 1.04 1.89 2.29 2.29 100–199 0.39 0.62 1.24 1.59 0.95 1.37 1.62 1.62 200–499 0.13 0.18 0.45 0.53 0.36 0.45 0.48 0.48 500–749 0.15 0.24 0.48 0.67 0.38 0.49 0.50 0.50 750–999 0.22 0.36 0.71 0.90 0.55 0.65 0.79 0.79 1,000 or more 0.17 0.28 0.48 0.66 0.41 0.56 0.63 0.63
Percent of K–12 students who were approved for free or reduced-price lunches
0–34 0.12 0.21 0.36 0.58 0.35 0.41 0.58 0.58 35–49 0.18 0.30 0.58 0.79 0.51 0.61 0.84 0.84 50–74 0.18 0.24 0.54 0.67 0.40 0.56 0.72 0.72 75 or more 0.16 0.27 0.51 0.64 0.37 0.51 0.57 0.57 School did not participate in free
or reduced-price lunch program 0.41 0.81 1.10 1.30 0.93 1.19 1.89 1.89 † Not applicable. SOURCE: U.S. Department of Education, National Center for Education Statistics, National Teacher and Principal Survey (NTPS), “Public School Teacher Data File,” 2015–16.
A-4
Table A-3. Standard errors for table 3: Percentage distribution of public school teachers based on years of teaching experience, average total years of teaching experience, percentage distribution of teachers based on years teaching at current school, and average years teaching at current school, by selected school characteristics: 2015–16
Selected school characteristic
Years of teaching experience
Average years
teaching
Years teaching at current school Average years at current school
Less than
4 years 4–9
years 10–14 years
15 or more
years
Less than
4 years 4–9
years 10–14 years
15 or more
years All public schools 0.23 0.28 0.22 0.33 0.07 0.36 0.29 0.24 0.29 0.06
School classification Traditional public 0.23 0.29 0.23 0.35 0.07 0.37 0.30 0.26 0.31 0.07 Charter school 1.04 1.03 0.70 1.07 0.21 1.34 0.96 0.63 0.67 0.18
Community type City † † † † † † † † † † Suburban 0.37 0.47 0.40 0.57 0.11 0.59 0.46 0.39 0.48 0.10 Town 0.56 0.58 0.57 0.72 0.14 0.79 0.64 0.59 0.69 0.14 Rural 0.47 0.48 0.48 0.62 0.11 0.67 0.56 0.48 0.56 0.11
School level Primary 0.38 0.41 0.33 0.52 0.10 0.59 0.45 0.37 0.42 0.09 Middle 0.57 0.60 0.53 0.78 0.16 0.80 0.61 0.57 0.65 0.14 High 0.37 0.48 0.46 0.62 0.12 0.63 0.53 0.48 0.58 0.12 Combined 0.84 0.91 0.73 1.09 0.21 1.12 0.86 0.61 0.92 0.19
Student enrollment Less than 100 1.41 3.04 1.41 4.31 0.64 4.74 3.10 2.66 4.89 0.95 100–199 1.11 1.19 1.15 1.57 0.31 1.78 1.29 1.02 1.45 0.30 200–499 0.43 0.47 0.48 0.59 0.11 0.71 0.51 0.45 0.53 0.12 500–749 0.48 0.52 0.43 0.61 0.13 0.68 0.53 0.43 0.49 0.10 750–999 0.69 0.70 0.62 0.96 0.18 1.04 0.75 0.74 0.78 0.17 1,000 or more 0.43 0.55 0.49 0.63 0.13 0.73 0.59 0.51 0.58 0.12
Percent of K–12 students who were approved for free or reduced-price lunches
0–34 0.35 0.48 0.38 0.58 0.11 0.59 0.54 0.47 0.50 0.10 35–49 0.66 0.67 0.60 0.80 0.17 0.85 0.72 0.55 0.70 0.15 50–74 0.53 0.62 0.49 0.71 0.15 0.68 0.63 0.54 0.59 0.13 75 or more 0.53 0.56 0.38 0.71 0.13 0.75 0.55 0.46 0.60 0.12 School did not participate in free
or reduced-price lunch program 1.12 1.33 1.33 1.62 0.34 1.73 1.44 1.22 1.42 0.30 † Not applicable. SOURCE: U.S. Department of Education, National Center for Education Statistics, National Teacher and Principal Survey (NTPS), “Public School Teacher Data File,” 2015–16.
A-5
Table A-4. Standard errors for table 4: Percentage distribution of public school teachers, by highest degree earned, and selected school characteristics: 2015–16
Selected school characteristic No bachelor’s Bachelor’s degree Master’s degree Higher than a master’s
degree All public schools 0.10 0.34 0.34 0.20
School classification Traditional public 0.10 0.36 0.36 0.21 Charter school 0.31 1.20 1.11 0.62
Community type City † † † † Suburban 0.16 0.66 0.66 0.35 Town 0.27 0.83 0.83 0.41 Rural 0.22 0.76 0.73 0.31
School level Primary 0.12 0.58 0.55 0.31 Middle 0.19 0.92 0.87 0.42 High 0.22 0.66 0.69 0.40 Combined 0.29 1.15 1.08 0.49
Student enrollment Less than 100 0.67 2.84 2.93 1.15 100–199 0.43 1.72 1.73 0.79 200–499 0.18 0.69 0.68 0.37 500–749 0.18 0.74 0.75 0.40 750–999 0.26 1.12 0.98 0.57 1,000 or more 0.21 0.85 0.79 0.44
Percent of K–12 students who were approved for free or reduced-price lunches
0–34 0.16 0.64 0.64 0.34 35–49 0.26 1.03 1.06 0.61 50–74 0.19 0.83 0.80 0.43 75 or more 0.17 0.70 0.75 0.37 School did not participate in free
or reduced-price lunch program 1.03 1.83 2.15 0.96 † Not applicable. SOURCE: U.S. Department of Education, National Center for Education Statistics, National Teacher and Principal Survey (NTPS), “Public School Teacher Data File,” 2015–16.
A-6
Table A-5. Standard errors for table 5: Number and percentage of public school teachers who are regular full-time teachers and average number of hours per week that regular full-time teachers spent on selected activities during a typical full week, by selected school characteristics: 2015–16
Selected school characteristic
Number of regular full-time
teachers
Percent of teachers who are regular
full-time teachers
Average hours during typical full week
Required by contract to work
Of contracted hours, total hours spent delivering instruction to students
Total hours spent on all teaching and other
school-related activities All public schools 46,350 0.18 0.03 0.05 0.08
School classification Traditional public 44,200 0.18 0.03 0.06 0.08 Charter school 9,130 0.59 0.13 0.20 0.24
Community type City † † † † † Suburban 38,600 0.30 0.05 0.09 0.14 Town 12,870 0.41 0.06 0.14 0.16 Rural 20,070 0.32 0.06 0.11 0.14
School level Primary 39,020 0.30 0.05 0.07 0.11 Middle 27,300 0.30 0.07 0.13 0.16 High 38,830 0.25 0.06 0.11 0.15 Combined 9,630 0.51 0.10 0.20 0.23
Student enrollment Less than 100 9,820 2.50 0.17 0.54 0.61 100–199 6,640 1.15 0.15 0.28 0.37 200–499 20,060 0.34 0.06 0.10 0.14 500–749 27,250 0.36 0.06 0.10 0.13 750–999 21,540 0.42 0.08 0.15 0.18 1,000 or more 34,340 0.26 0.07 0.12 0.16
Percent of K–12 students who were approved for free or reduced-price lunches
0–34 31,690 0.33 0.05 0.09 0.13 35–49 22,550 0.39 0.08 0.14 0.19 50–74 24,990 0.34 0.07 0.11 0.14 75 or more 28,080 0.31 0.06 0.11 0.15 School did not participate in free
or reduced-price lunch program 7,980 1.40 0.16 0.33 0.38 † Not applicable. SOURCE: U.S. Department of Education, National Center for Education Statistics, National Teacher and Principal Survey (NTPS), “Public School Teacher Data File,” 2015–16.
A-7
Table A-6. Standard errors for table 6: Among regular full-time public school teachers, average base salary and earnings from all sources, percentage of teachers with earnings from various salary supplements, and among those teachers, the average amount earned from the supplement during the current school year, by selected school characteristics: 2015–16
Selected school characteristic
Average base
teaching salary of
regular full-time
teachers
Average school
year earnings from all sources
Salary supplements
Extracurricular or additional activities in same school system
Additional compensation based
on students’ performance
Other school system sources (state
supplement, etc.) Job outside the school
system Percent
of teachers
Average amount
Percent of
teachers Average amount
Percent of
teachers Average amount
Percent of
teachers Average amount
All public schools 180 200 0.36 40 0.23 70 0.20 90 0.27 110
School classification Traditional public 200 210 0.38 40 0.23 70 0.21 90 0.28 120 Charter school 520 550 1.18 110 1.13 290 0.49 460 0.78 280
Community type City † † † † † † † † † † Suburban 330 350 0.60 70 0.38 70 0.36 160 0.43 170 Town 290 310 1.03 100 0.63 170 0.50 190 0.63 220 Rural 270 280 0.86 70 0.41 70 0.48 180 0.48 180
School level Primary 270 270 0.47 40 0.32 80 0.29 110 0.35 170 Middle 470 470 0.78 70 0.49 80 0.53 220 0.56 210 High 490 490 0.63 70 0.54 150 0.43 180 0.49 190 Combined 550 580 1.08 90 0.98 470 0.56 580 0.79 270
Student enrollment Less than 100 5,120 5,300 4.69 530 0.99 190 1.35 2,690 2.49 430 100–199 1,070 1,060 1.83 180 0.86 170 0.92 990 1.20 440 200–499 350 360 0.71 50 0.34 130 0.36 170 0.42 240 500–749 350 360 0.67 70 0.46 150 0.38 120 0.45 190 750–999 530 550 1.02 90 0.75 100 0.56 290 0.64 240 1,000 or more 470 480 0.70 80 0.68 150 0.46 190 0.56 210
Percent of K–12 students who were approved for free or reduced- price lunches
0–34 350 360 0.73 60 0.37 70 0.37 190 0.46 180 35–49 590 600 0.97 110 0.64 220 0.65 230 0.71 230 50–74 460 470 0.79 80 0.81 160 0.45 200 0.61 220 75 or more 460 480 0.63 80 0.42 160 0.39 160 0.44 240 School did not participate in free
or reduced-price lunch program 1,350 1,390 1.96 260 1.04 610 1.00 1,090 1.26 740 † Not applicable. SOURCE: U.S. Department of Education, National Center for Education Statistics, National Teacher and Principal Survey (NTPS), “Public School Teacher Data File,” 2015–16.
A-8
Table A-7. Standard errors for table 7: Average class size in public primary schools, middle schools, high schools, and schools with combined grades, by classroom type and selected school characteristics: 2015–16
Selected school characteristic
Primary schools
Middle schools
High schools
Combined grade schools Average
class size for
teachers in self-
contained classes
Average class size for
teachers in departmentalized
instruction
Average class
size for teachers
in self-contained
classes
Average class size for
teachers in departmentalized
instruction
Average class
size for teachers
in self-contained
classes
Average class size for
teachers in departmentalized
instruction
Average class
size for teachers
in self-contained
classes
Average class size for
teachers in departmentalized
instruction All public schools 0.08 0.36 0.66 0.27 0.52 0.22 0.44 0.77
School classification Traditional public 0.09 0.39 0.67 0.28 0.51 0.23 0.48 0.46 Charter school 0.33 0.88 5.64 0.94 3.45 1.16 0.72 2.27
Community type City † † † † † † † † Suburban 0.15 0.74 1.08 0.39 0.97 0.38 1.31 1.97 Town 0.18 0.87 1.59 0.59 1.19 0.49 1.24 1.25 Rural 0.21 0.72 0.96 0.57 1.18 0.44 0.34 0.46
Student enrollment Less than 100 0.92 1.78 0.89 1.53 2.20 2.73 0.45 1.16 100–199 0.40 1.10 4.17 1.42 2.06 0.95 0.84 1.15 200–499 0.13 0.58 1.51 0.51 1.04 0.58 0.57 0.47 500–749 0.14 0.69 1.24 0.46 1.59 0.51 0.88 0.67 750–999 0.27 1.05 1.10 0.57 2.13 0.56 0.76 3.01 1,000 or more 0.60 1.90 1.67 0.65 0.73 0.27 1.58 2.66
Percent of K–12 students who were approved for free or reduced-price lunches
0–34 0.17 0.89 1.29 0.43 1.01 0.34 0.84 0.84 35–49 0.28 1.07 1.10 0.65 1.54 0.49 0.94 0.86 50–74 0.20 0.88 1.05 0.47 1.10 0.52 0.63 0.95 75 or more 0.14 0.54 1.56 0.63 0.99 0.57 0.79 0.78 School did not participate in
free or reduced-price lunch program 0.61 2.03 9.03 1.25 3.08 1.10 2.21 4.22
† Not applicable. SOURCE: U.S. Department of Education, National Center for Education Statistics, National Teacher and Principal Survey (NTPS), “Public School Teacher Data File,” 2015–16.
A-9
Table A-8. Standard errors for table 8: Percentage of public school teachers who took graduate or undergraduate courses before their first year of teaching in selected subject areas, by selected school characteristics: 2015–16
Selected school characteristic
Classroom management
techniques Lesson
planning Learning
assessment
Using student performance
data to inform instruction
Serving students from
diverse economic
backgrounds
Serving students with special needs
Teaching students who
are limited-English
proficient (LEP) or English-
language learners (ELLs)
All public schools 0.28 0.25 0.28 0.29 0.31 0.27 0.29
School classification Traditional public 0.29 0.27 0.29 0.30 0.33 0.28 0.31 Charter school 1.03 0.96 0.98 1.04 1.00 1.10 0.99
Community type City † † † † † † † Suburban 0.50 0.43 0.46 0.53 0.53 0.45 0.51 Town 0.66 0.62 0.65 0.76 0.69 0.73 0.71 Rural 0.53 0.51 0.48 0.63 0.61 0.57 0.60
School level Primary 0.38 0.35 0.40 0.48 0.47 0.42 0.50 Middle 0.69 0.60 0.69 0.67 0.75 0.70 0.72 High 0.57 0.55 0.55 0.59 0.63 0.56 0.65 Combined 0.86 0.86 0.95 0.96 0.89 0.92 0.98
Student enrollment Less than 100 2.12 1.95 1.66 2.52 2.29 1.80 2.57 100–199 1.45 1.48 1.45 1.55 1.53 1.42 1.59 200–499 0.54 0.43 0.51 0.54 0.59 0.57 0.56 500–749 0.57 0.52 0.59 0.63 0.60 0.58 0.69 750–999 0.86 0.72 0.75 0.80 0.84 0.78 1.02 1,000 or more 0.58 0.58 0.60 0.64 0.66 0.63 0.72
Percent of K–12 students who were approved for free or reduced-price lunches
0–34 0.46 0.42 0.45 0.53 0.54 0.50 0.58 35–49 0.77 0.67 0.77 0.80 0.86 0.89 0.88 50–74 0.60 0.59 0.60 0.64 0.67 0.71 0.77 75 or more 0.56 0.51 0.53 0.59 0.62 0.54 0.66 School did not participate in free
or reduced-price lunch program 1.45 1.53 1.58 1.65 1.83 1.59 1.85 † Not applicable. SOURCE: U.S. Department of Education, National Center for Education Statistics, National Teacher and Principal Survey (NTPS), “Public School Teacher Data File,” 2015–16.
A-10
Table A-9. Standard errors for table 9: Percentage of public school teachers who thought that they have any influence over various policies at their school, by selected school characteristics: 2015–16
Selected school characteristic
Setting performance standards for
students at their school
Establishing curriculum
Determining the content of
in-service professional
development programs
Evaluating teachers
Hiring new full-time teachers
Setting discipline
policy
Deciding how the school
budget will be spent
All public schools 0.26 0.25 0.26 0.33 0.38 0.34 0.34
School classification Traditional public 0.28 0.26 0.27 0.35 0.40 0.35 0.35 Charter school 0.71 0.69 0.81 1.00 1.11 0.99 1.16
Community type City † † † † † † † Suburban 0.46 0.44 0.43 0.55 0.67 0.52 0.59 Town 0.61 0.61 0.69 0.83 1.06 0.75 0.93 Rural 0.54 0.49 0.47 0.67 0.74 0.59 0.68
School level Primary 0.41 0.45 0.43 0.52 0.62 0.51 0.56 Middle 0.62 0.59 0.56 0.79 0.84 0.70 0.83 High 0.43 0.40 0.52 0.67 0.69 0.64 0.73 Combined 0.68 0.76 0.79 1.08 1.25 0.95 1.15
Student enrollment Less than 100 1.34 1.78 2.12 2.52 2.16 1.71 3.32 100–199 1.22 1.15 1.10 1.75 1.99 1.55 2.06 200–499 0.44 0.47 0.51 0.56 0.72 0.50 0.64 500–749 0.53 0.57 0.53 0.64 0.79 0.57 0.76 750–999 0.73 0.80 0.76 0.88 1.17 0.88 1.05 1,000 or more 0.51 0.50 0.56 0.71 0.84 0.67 0.85
Percent of K–12 students who were approved for free or reduced-price lunches
0–34 0.45 0.43 0.44 0.63 0.68 0.56 0.69 35–49 0.67 0.66 0.65 0.85 0.97 0.80 0.91 50–74 0.51 0.56 0.54 0.71 0.86 0.66 0.81 75 or more 0.52 0.61 0.56 0.62 0.73 0.62 0.70 School did not participate in free
or reduced-price lunch program 1.09 1.12 1.06 1.73 1.98 1.34 1.71 † Not applicable SOURCE: U.S. Department of Education, National Center for Education Statistics, National Teacher and Principal Survey (NTPS), “Public School Teacher Data File,” 2015–16.
A-11
Table A-10. Standard errors for table 10: Percentage of public school teachers who responded that they have any control over various areas of planning and teaching in their classrooms, by selected school characteristics: 2015–16
Selected school characteristic
Selecting textbooks and
other instructional materials
Selecting content, topics, and skills to
be taught Selecting teaching
techniques Evaluating and
grading students Disciplining
students
Determining the amount of
homework to be assigned
All public schools 0.26 0.25 0.09 0.08 0.10 0.09
School classification Traditional public 0.27 0.26 0.10 0.08 0.11 0.09 Charter school 0.87 0.87 0.37 0.35 0.38 0.49
Community type City † † † † † † Suburban 0.44 0.48 0.16 0.13 0.16 0.15 Town 0.60 0.58 0.20 0.18 0.25 0.21 Rural 0.40 0.52 0.14 0.15 0.19 0.17
School level Primary 0.45 0.40 0.17 0.13 0.15 0.16 Middle 0.54 0.49 0.18 0.15 0.22 0.18 High 0.41 0.34 0.13 0.11 0.21 0.12 Combined 0.74 0.71 0.30 0.24 0.42 0.48
Student enrollment Less than 100 1.71 1.13 0.58 0.43 0.77 1.05 100–199 1.17 0.92 0.44 0.40 0.53 0.60 200–499 0.46 0.40 0.19 0.13 0.17 0.18 500–749 0.56 0.52 0.20 0.15 0.19 0.21 750–999 0.79 0.80 0.28 0.24 0.26 0.25 1,000 or more 0.52 0.48 0.17 0.16 0.25 0.16
Percent of K–12 students who were approved for free or reduced-price lunches
0–34 0.45 0.47 0.15 0.13 0.16 0.16 35–49 0.68 0.60 0.19 0.19 0.24 0.20 50–74 0.55 0.53 0.17 0.16 0.24 0.21 75 or more 0.54 0.53 0.23 0.17 0.21 0.21 School did not participate in free
or reduced-price lunch program 1.39 1.11 0.38 0.35 0.60 0.72 † Not applicable. SOURCE: U.S. Department of Education, National Center for Education Statistics, National Teacher and Principal Survey (NTPS), “Public School Teacher Data File,” 2015–16.
B-1
Appendix B: Methodology and Technical Notes
B-2
Overview of the NTPS Teacher Survey The National Teacher and Principal Survey (NTPS) is sponsored by the National Center for Education Statistics (NCES) of the Institute of Education Sciences within the U.S. Department of Education and is conducted by the U.S. Census Bureau. NTPS is a nationally representative sample survey of public K–12 schools, principals, and teachers in the 50 states and the District of Columbia. This is the first year of NTPS.
The 2015–16 NTPS consisted of questionnaires for three types of respondents: public schools, public school principals, and public school teachers. The information can be linked across teachers, principals, and schools. There is a separate data file for each type of respondent (school, principal, and teacher). For the content of the questionnaires, see https://nces.ed.gov/surveys/ntps/question1516.asp.
NTPS was designed to produce national estimates for public elementary and secondary schools, principals, and teachers, including national estimates for public charter schools and the principals and teachers within them. Additionally, the teacher survey was designed to produce national estimates of teachers by subject matter taught and by full-time or part-time status.
For additional information on the specific NTPS-related topics discussed in this appendix, consult the Survey Documentation for the 2015–16 National Teacher and Principal Survey (Cox et al. forthcoming) or the User’s Manual for the 2015–16 National Teacher and Principal Survey, Volumes 1–4 (Goldring et al. 2017). To access additional general information on NTPS or for electronic copies of the questionnaires, go to the NTPS home page (https://nces.ed.gov/surveys/ntps).
Sampling Frames and Sample Selection
Teachers were defined as staff members who teach regularly scheduled classes to students in any of grades K–12. Teacher Listing Forms (i.e., teacher rosters) were collected from sampled schools, by mail and online. When this failed, Teacher Listing Forms were obtained, where possible, via clerical look-up or vendor purchase and compiled at the Census Bureau. This compilation was done on an ongoing basis throughout the roster collection period. Along with the names and e-mail addresses of teachers, sampled schools were asked to provide information about each teacher’s teaching status (full or part time) and subject matter taught (special education, general elementary, math, science, English/language arts, social studies, vocational/technical, or other).
Sampling was done on an ongoing basis throughout the roster collection period. Prior to allocating teachers to strata, the Census Bureau first allocated an overall number of teachers to be selected. An average of six to eight teachers were selected per school, depending on the school’s grade range, urbanicity, and poverty status. Within each sampled school, teachers were stratified by subject, as follows: math, science, English/language arts, social studies, and everything else. No oversampling was performed. Teachers within a school domain and teacher stratum were sorted by the subject matter taught and the teacher line number code. The teacher line number is a unique number assigned to identify the individual within the teacher list. Within each teacher stratum in each school, teachers were selected systematically with equal probability.
The maximum number of sampled teachers per school was set at 20, in order to avoid overburdening a school by sampling too large a proportion of its teachers. An average of six to eight teachers were sampled per school. About 16 percent of the eligible public schools did not provide teacher lists that could be used for sampling teachers. For the remaining 84 percent of the eligible public schools, teacher lists
B-3
were obtained either by a clerical look-up operation or a list purchased from a vendor. About 40,000 public school teachers were sampled.
Teacher Listing Forms were collected from schools in the 2015–16 NTPS public schools sampling frame. The starting point of this sampling frame was the preliminary 2013–14 Common Core of Data (CCD) Nonfiscal School Universe data file.1 The sampling frame was adjusted from the CCD to fit the definition of a school eligible for NTPS. To be eligible for NTPS, a school was defined as an institution or part of an institution that provides classroom instruction to students, has one or more teachers to provide instruction, serves students in one or more of grades 1–12 or the ungraded equivalent, and is located in one or more buildings apart from a private home. It was possible for two or more schools to share the same building; in that case, they were treated as different schools if they had different administrators (i.e., principal or school head). This definition is unchanged from the Schools and Staffing Survey (SASS).
The 2015–16 NTPS universe of schools is confined to the 50 states plus the District of Columbia and excludes the other jurisdictions, Department of Defense overseas schools, and CCD schools that do not offer teacher-provided classroom instruction in grades 1–12 or the ungraded equivalent. This last group includes schools that are essentially administrative units that may oversee entities that provide classroom instruction or may only provide funding and oversight. Although Bureau of Indian Education-funded (BIE) schools are included in NTPS, these schools were not oversampled and the data do not support separate BIE estimates.
The NTPS definition of a school is generally similar to the CCD definition, with some exceptions. NTPS allows schools to define themselves. During SASS collection, Census Bureau staff observed that in situations where two or more schools have the same administration, these schools were reported separately on CCD but generally reported as one entity for SASS. Thus, CCD schools with the same location, address, and phone number were collapsed during the frame building on the assumption that the respondent would consider them to be one school. Due to similarities with SASS, NTPS also followed the same type of collapsing procedure. A set of rules was applied to determine in which instances school records should be collapsed together. When school records were collapsed together, the student and teacher counts, grade ranges, and names as reported to CCD were all modified to reflect the change.
Finally, since CCD and NTPS differ in scope and their definition of a school, some records were deleted, added, or modified to provide better coverage and a more efficient sample design for NTPS. For a detailed list of frame modifications, see the Survey Documentation for the 2015–16 National Teacher and Principal Survey (Cox et al. forthcoming). After deleting, collapsing, and adding school records, the NTPS public school sampling frame consisted of about 87,600 traditional public schools and 6,500 public charter schools.
NTPS uses a systematic, probability proportionate to size (PPS) sample (for an explanation of PPS sampling, see Cochran 1977). Unlike SASS, NTPS did not stratify schools prior to sampling. Rather, some types of schools were oversampled based on specific characteristics such as the following:
• School grade level (primary, middle, high, combined); • Collapsed urbanicity (city, suburban, town, rural); and • Charter status.
In addition to oversampling based on specific school characteristics, sample sizes were inflated for schools in the six states with the smallest number of schools: Alaska, District of Columbia, Hawaii, Rhode Island, Vermont, and Wyoming.
1 For more information about CCD, see https://nces.ed.gov/ccd/.
B-4
Prior to sampling, schools were sorted by the following:
• charter status; • school grade level (four categories); • urbanicity (four categories); • poverty status (four categories); • school size category (based on full-time equivalent [FTE] teachers; two categories for middle and
combined charter schools, three categories for all other schools); • school type for noncharter schools (four categories); • state; and • the number of FTE teachers.
These sampling procedures resulted in a total public school sample of about 7,130 traditional public schools and 1,170 public charter schools.
Data Collection Procedures
In 2015–16, NTPS employed a combined mail-based and internet survey approach, with subsequent telephone and in-person follow-up. Data collection included the Teacher Listing Form (TLF), the Principal Questionnaire, the School Questionnaire, and the Teacher Questionnaire. This report focuses on the Teacher Questionnaire. In preparation for school-level data collection, advance letters were mailed to the sampled schools in June 2015 to verify their addresses. Initial school packages were mailed in September 2015.2 Next, schools were telephoned using a computer-assisted telephone-interviewing instrument to verify school information, establish a survey coordinator, and follow up on the TLF if the school had not already provided an electronic teacher list. Teacher questionnaires were mailed to schools on a flow basis as teachers were sampled on an ongoing basis from the data provided on the TLF or electronic teacher list. The in-person follow-up period was preceded by phone calls from the telephone centers to remind the survey coordinators to have staff complete and return all forms. Nonresponding teachers were also called from the telephone centers and asked to complete the questionnaire by phone. Data collection ended in August 2016.
One of the main goals of the data collection plan for the 2015–16 NTPS was to target the schools that presented a challenge to data collection during previous administrations of SASS. These “known difficult” schools have resulted in poor response rates for certain school types (e.g., large schools in urban areas). Sampled schools that have a known large impact on weighting were targeted, as well. These schools were identified during sampling, and their data collection priority flag was set accordingly. Contact strategies that were more proactive during the early phases of data collection were employed during 2015–16 NTPS data collection to mitigate potential low response rates for these cases. Survey coordinators also were utilized during data collection. The role of the survey coordinator was to be the primary contact person at the school. A survey coordinator’s duties included facilitating data collection by passing out questionnaires to the appropriate staff, reminding the staff to complete their questionnaires, and collecting the questionnaires to return. The data collection follow‐up strategies for schools with a survey coordinator were different from schools without a survey coordinator, with the more proactive approach taken for those schools without a survey coordinator.
2 The NTPS school package contained a letter to the principal, an interior envelope containing a letter to the survey coordinator, the Teacher Listing Form, the Principal Questionnaire, the School Questionnaire, and postage-paid return envelopes.
B-5
Data Processing and Imputation
The Census Bureau checked returned questionnaires, keyed the data, and implemented quality control procedures. Questionnaires that had a preliminary classification of a complete interview were submitted to a series of computer edits consisting of a range check, a consistency edit,3 a blanking edit,4 and a logic edit.5 After these edits were run and reviewed by analysts, the records were put through another edit to make a final determination as to whether the case was eligible for the survey and whether sufficient data had been collected for the case to be classified as a complete interview.
After the final edits were run, cases with “not-answered” values for items remained. Values were imputed for these cases using two main approaches. First, donor respondent methods, such as hot-deck imputation, were used. Second, if no suitable donor case could be matched, the few remaining items were imputed using mean or mode from groups of similar cases to impute a value to the item with missing data. After each stage of imputation, computer edits were run again to verify that the imputed data were consistent with the existing questionnaire data. If that was not the case, an imputed value was blanked out by one of these computer edits due to inconsistency with other data within the same questionnaire or because it was out of the range of acceptable values. In these situations, Census Bureau analysts looked at the items and tried to determine an appropriate value. Edit and imputation flags, indicating which edit or imputation method was used, were assigned to each relevant survey variable. For further information, see the sections on data processing and imputation in the Survey Documentation for the 2015–16 National Teacher and Principal Survey (Cox et al. forthcoming).
Response Rates
Unit response rates. The unit response rate indicates the percentage of sampled cases that met the definition of a complete interview. The weighted NTPS unit response rate was produced by dividing the weighted number of respondents who completed questionnaires by the weighted number of eligible sampled cases, using the initial base weight (the inverse of the probability of selection).6 Table B-1 summarizes the weighted unit response rates for each survey type.
Table B-1. Weighted unit and overall response rates using initial base weight, by survey: 2015–16
Survey Unit response rate
(percent) Overall response
rate (percent)
Public School Teacher Listing Form 84.4 † Public School Teacher 67.8 57.2 † Not applicable. NOTE: Response rates were weighted using the inverse of the probability of selection (initial base weight). SOURCE: U.S. Department of Education, National Center for Education Statistics, National Teacher and Principal Survey (NTPS), “Public School Teacher Documentation Data File,” 2015–16.
Overall response rate. The overall response rate represents the response rate to the survey taking into consideration each stage of the survey. For teachers, the overall response rate is calculated as the product
3 The consistency edits identified inconsistent entries within each case and, whenever possible, corrected them. If the inconsistencies could not be
corrected, the inconsistent entries were deleted. 4 Blanking edits delete answers to questions that should not have been filled in (e.g., if a respondent followed a wrong skip pattern). 5 Data were added to questionnaire records during the logic edits, which filled in some items where data were missing or incomplete using other
information on the same questionnaire or from other related data sources. 6 For the formula used to calculate the unit response rate, see 2012 Revision of NCES Statistical Standards: Final (NCES 2014-097).
B-6
of the response rate to two stages: the TLF and the teacher questionnaire.7 The weighted overall response rate using the initial base weight for public school teachers was 57.2 percent.
Unit nonresponse bias analysis. Because the NCES Statistical Standards (4-4) require analysis of nonresponse bias for any survey stage with a base-weighted response rate less than 85 percent, the NTPS teacher file was evaluated for potential bias. National-level estimates were first examined for potential bias. The base-weighted8 unit response rate was calculated. The following frame characteristics were used for the Public School Teachers Data File:
• Charter status: noncharter, charter • Enrollment: less than 200, 200 to less than 500, 500 to less than 750, 750 to less than 1,000,
1,000 or more • Percent of enrollment with race other than White: less than 5 percent, 5 to less than 10 percent,
10 to less than 20 percent, 20 to less than 30 percent, 30 to less than 50 percent, 50 percent or more
• Percent free or reduced-price lunch eligible: less than 35 percent, 35 to less than 50 percent, 50 to less than 75 percent, 75 percent or more
• Community type (locale): city, suburb, town, rural • Pupil-teacher ratio: less than 10, 10 to less than 15, 15 to less than 20, 20 or more • Grade level: primary, middle, high, combined • Region: Northeast, Midwest, South, West • Number of teachers: less than 10, 10 to less than 25, 25 to less than 50, 50 to less than 75, 75 or
more • Title I status: Title I program, Title I noneligible, Title I eligible but no Title I program • Teacher status: full-time, part-time, not reported • Subject taught: special education, general elementary, math, science, English/language arts,
social studies, vocational/technical, other, not reported
As shown in table B-1, the weighted response rate using the initial base weight for the Teacher Listing Form (TLF) was 84.4 for public schools. The weighted questionnaire response rate using the initial base weight for the teacher survey was 67.8 percent for public school teachers.
For the teacher survey, nonresponse can occur both at the school level and at the teacher level. Some schools did not provide a TLF and teachers could not be sampled from schools for which a list was not obtained. Some sampled teachers from schools that provided a TLF did not participate in the survey. To reflect this, national estimates were examined for potential bias at the school level and at the teacher level.
For the TLF, the school base-weighted distribution of TLF respondents was compared to the base-weighted distribution of eligible schools through t tests to find any school groups with potential bias prior to TLF nonresponse adjustments. Table B-2 presents national-level school groups with a statistically significant difference in base-weighted percentages between the eligible cases and respondents.
7 For the formula used to calculate the overall response rate, see 2012 Revision of NCES Statistical Standards: Final (NCES 2014-097). 8 Unit nonresponse bias analysis was conducted using the base weight, defined as the product of the initial base weight (the inverse of the probability of selection) and the sampling adjustment factor. The sampling adjustment factor is an adjustment that accounts for circumstances that affect the school’s probability of selection that are identified after the data collection has begun, such as a merger, duplication, or incorrect building-level collapsing (e.g., a junior high school and a senior high school merge to become a junior/senior high school).
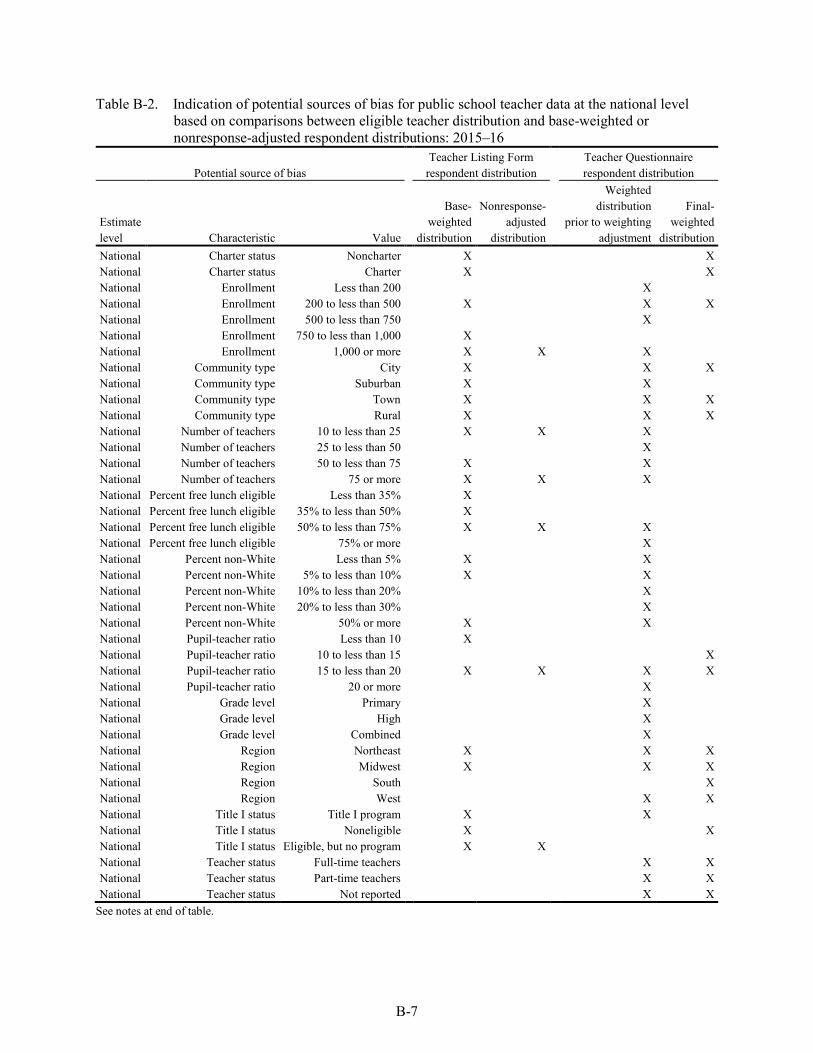
B-7
Table B-2. Indication of potential sources of bias for public school teacher data at the national level based on comparisons between eligible teacher distribution and base-weighted or nonresponse-adjusted respondent distributions: 2015–16
Potential source of bias Teacher Listing Form
respondent distribution Teacher Questionnaire
respondent distribution
Estimate level Characteristic Value
Base-
weighted distribution
Nonresponse-adjusted
distribution
Weighted distribution
prior to weighting adjustment
Final-weighted
distribution National Charter status Noncharter X X National Charter status Charter X X National Enrollment Less than 200 X National Enrollment 200 to less than 500 X X X National Enrollment 500 to less than 750 X National Enrollment 750 to less than 1,000 X National Enrollment 1,000 or more X X X National Community type City X X X National Community type Suburban X X National Community type Town X X X National Community type Rural X X X National Number of teachers 10 to less than 25 X X X National Number of teachers 25 to less than 50 X National Number of teachers 50 to less than 75 X X National Number of teachers 75 or more X X X National Percent free lunch eligible Less than 35% X National Percent free lunch eligible 35% to less than 50% X National Percent free lunch eligible 50% to less than 75% X X X National Percent free lunch eligible 75% or more X National Percent non-White Less than 5% X X National Percent non-White 5% to less than 10% X X National Percent non-White 10% to less than 20% X National Percent non-White 20% to less than 30% X National Percent non-White 50% or more X X National Pupil-teacher ratio Less than 10 X National Pupil-teacher ratio 10 to less than 15 X National Pupil-teacher ratio 15 to less than 20 X X X X National Pupil-teacher ratio 20 or more X National Grade level Primary X National Grade level High X National Grade level Combined X National Region Northeast X X X National Region Midwest X X X National Region South X National Region West X X National Title I status Title I program X X National Title I status Noneligible X X National Title I status Eligible, but no program X X National Teacher status Full-time teachers X X National Teacher status Part-time teachers X X National Teacher status Not reported X X
See notes at end of table.
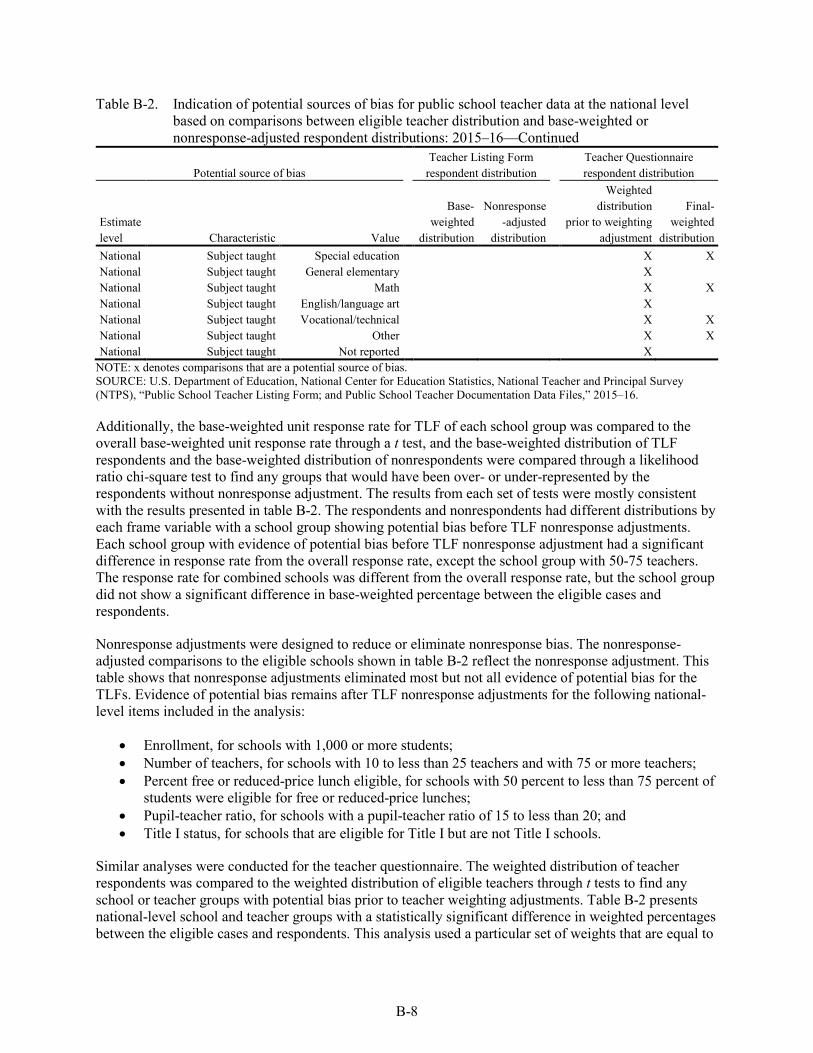
B-8
Table B-2. Indication of potential sources of bias for public school teacher data at the national level based on comparisons between eligible teacher distribution and base-weighted or nonresponse-adjusted respondent distributions: 2015–16—Continued
Potential source of bias Teacher Listing Form
respondent distribution Teacher Questionnaire
respondent distribution
Estimate level Characteristic Value
Base-weighted
distribution
Nonresponse-adjusted
distribution
Weighted distribution
prior to weighting adjustment
Final-weighted
distribution National Subject taught Special education X X National Subject taught General elementary X National Subject taught Math X X National Subject taught English/language art X National Subject taught Vocational/technical X X National Subject taught Other X X National Subject taught Not reported X
NOTE: x denotes comparisons that are a potential source of bias. SOURCE: U.S. Department of Education, National Center for Education Statistics, National Teacher and Principal Survey (NTPS), “Public School Teacher Listing Form; and Public School Teacher Documentation Data Files,” 2015–16.
Additionally, the base-weighted unit response rate for TLF of each school group was compared to the overall base-weighted unit response rate through a t test, and the base-weighted distribution of TLF respondents and the base-weighted distribution of nonrespondents were compared through a likelihood ratio chi-square test to find any groups that would have been over- or under-represented by the respondents without nonresponse adjustment. The results from each set of tests were mostly consistent with the results presented in table B-2. The respondents and nonrespondents had different distributions by each frame variable with a school group showing potential bias before TLF nonresponse adjustments. Each school group with evidence of potential bias before TLF nonresponse adjustment had a significant difference in response rate from the overall response rate, except the school group with 50-75 teachers. The response rate for combined schools was different from the overall response rate, but the school group did not show a significant difference in base-weighted percentage between the eligible cases and respondents.
Nonresponse adjustments were designed to reduce or eliminate nonresponse bias. The nonresponse-adjusted comparisons to the eligible schools shown in table B-2 reflect the nonresponse adjustment. This table shows that nonresponse adjustments eliminated most but not all evidence of potential bias for the TLFs. Evidence of potential bias remains after TLF nonresponse adjustments for the following national-level items included in the analysis:
• Enrollment, for schools with 1,000 or more students; • Number of teachers, for schools with 10 to less than 25 teachers and with 75 or more teachers; • Percent free or reduced-price lunch eligible, for schools with 50 percent to less than 75 percent of
students were eligible for free or reduced-price lunches; • Pupil-teacher ratio, for schools with a pupil-teacher ratio of 15 to less than 20; and • Title I status, for schools that are eligible for Title I but are not Title I schools.
Similar analyses were conducted for the teacher questionnaire. The weighted distribution of teacher respondents was compared to the weighted distribution of eligible teachers through t tests to find any school or teacher groups with potential bias prior to teacher weighting adjustments. Table B-2 presents national-level school and teacher groups with a statistically significant difference in weighted percentages between the eligible cases and respondents. This analysis used a particular set of weights that are equal to
B-9
the base weights of the teacher’s school, multiplied by the TLF nonresponse adjustment factors of the teacher’s school and divided by the teacher’s selection probability within the school. Additionally, the base-weighted response rate for the teacher questionnaire of each school and teacher group was compared to the overall base-weighted unit response rate through a t test and the base-weighted distribution of teacher respondents and the base-weighted distribution of nonrespondents were compared through a likelihood ratio chi-square test to find any groups that would have been over- or under- represented by the respondents without weighting adjustment for teachers. The results from each set of tests were mostly consistent with the results presented in table B-2. Each school and teacher group listed with evidence of potential bias before teacher weighting adjustment had a significant difference in response rate from the overall response rate. The respondents and nonrespondents had different distributions by each frame variable with a school/teacher group showing potential bias before weighting adjustments for teachers, except the Title I status variable.
Weighting adjustments for teachers were designed to reduce or eliminate nonresponse bias and to reduce the variance introduced due to sampling by adjusting the sample estimates to known totals from the frame. The final-weighted comparisons to eligible cases shown in table B-2 reflect the effect of weighting adjustment. This table shows that weighting adjustments eliminated some but not all evidence of potential bias and introduced potential bias for some items. Evidence of potential bias remains after weighting adjustments for the following national-level items included in the analysis:
• Enrollment, for teachers in schools with 200 to less than 500; • Community type, for teachers in city schools, town schools, and rural schools; • Pupil-teacher ratio, for teachers in schools with a pupil-teacher ratio of 15 to less than 20; • Region, for teachers in schools in the Northeast region, in the Midwest region, and in the West
region; • Teacher status, for full-time teachers, part-time teachers, and teacher with no reported status; and • Subject taught, for teacher with a main subject of special education, math, vocational/technical,
and other.
Evidence of potential bias formed after nonresponse adjustments for the following national-level for teacher items included in the analysis:
• Charter status, for teachers in charter schools and noncharter schools; • Pupil-teacher ratio, for teachers in schools with a pupil-teacher ratio of 10 to less than 15; • Region, for teachers in schools in the South region; and • Title I status, for teachers in Title I schools that are not eligible for Title I.
For further information on unit response rates and nonresponse bias analysis, see the Survey Documentation for the 2015–16 National Teacher and Principal Survey (Cox et al. forthcoming).
Item response rates. The item response rate indicates the percentage of respondents who answered a given survey question or item. The weighted NTPS item response rate is calculated by dividing the weighted number of respondents who provided an answer to an item by the weighted number of respondents who were eligible to answer that item.9 Table B-3 provides a summary of the weighted item response rates. For the public school teacher data, ten of the survey items included in this report have item response rates less than 85 percent. Those items were: (1) question 2-13d[8], number of students from the eighth subject the teacher reported teaching; (2) and (3) question 2-13d[9], the ninth subject the teacher reported teaching and the number of students for the subject; (4) and (5) question 2-13d[10], the tenth subject the teacher reported teaching and the number of students for the subject; (6) question 4-3c[2], 9 For the formula to calculate the item response rate, see 2012 Revision of NCES Statistical Standards: Final (NCES 2014-097).
B-10
grade range of teaching certificate; (7) and (8) question 4-3e[1] additional content area and its grade range certification; (9) question 8-1b-[1] whether summer earnings working a non-teaching job came from current school; and (10) question 8-8 amount of retirement pension check from a teacher retirement system. For further information on item response rates and bias analysis, see the Survey Documentation for the 2015–16 National Teacher and Principal Survey (Cox et al. forthcoming).
Table B-3. Summary of weighted item response rates, by survey: 2015–16
Survey
Percent of items with a response rate of
85 percent or more
Percent of items with a response rate of
less than 85 percent
Public School Teacher 96.6 3.4 SOURCE: U.S. Department of Education, National Center for Education Statistics, National Teacher and Principal Survey (NTPS), “Public School Teacher Listing Forms; and Public School Teacher Documentation Data Files,” 2015–16.
Weighting
The general purpose of weighting is to scale up the sample estimates to represent the target survey population. The base weight for teacher sampling is generated by taking the base weight for school sampling (representing the reciprocal of the probability of selection of the school), adjusted for sample schools for which a TLF is not obtained, and multiplying this by the reciprocal of the probability of selection of the teacher within the school (from the TLF). Teacher samples are only drawn from schools for which a TLF is obtained, so adjustment needs to be made for schools for which TLFs are not obtained. The teacher sample is drawn from the TLF in a probability sample.
Next, a nonresponse adjustment factor for teacher nonresponse is calculated and applied based on a weighting cell adjustment. Weighting cells for teacher nonresponse are developed using tree search algorithms. These cells are selected to be homogeneous in response propensity within cells and heterogeneous in response propensity across cells (response propensity is the underlying “chance” that a particular sample unit will respond by completing the questionnaire: its individual response rate). The adjustment is the inverse of the weighted teacher response rate within each cell, and each respondent in the cell receives this adjustment. Nonrespondents are given weights of zero: the respondents are reweighted to represent the nonrespondents. The variables examined for potential bias were the same as those used by the tree search algorithms. All subgroups that showed potential bias as given in table B-2 above were used as cell generators by the tree search algorithms, as well as other subgroups which are related, and may show differential response conditional on other subgroups (i.e., they may be chosen as cell generators by the tree search algorithm within particular branches).
For the Public School Teacher Data File, a raking factor is calculated and applied to the sample to adjust the sample totals to CCD frame totals for FTE teachers, so that the sum of the weights within each of the specified cells is equal to the corresponding CCD frame total for the cell. These cells are defined based on school level, urbanicity, and percentage of students eligible for free or reduced-price lunch. The first dimension combines school level and the percentage of students eligible for free or reduced-price lunch. The second dimension combines school level and urbanicity. The weights are adjusted to these frame totals by an iterative process, referred to as raking, until the weights simultaneously aggregate to be equal to each set of frame totals. In some cases, extreme weights may be trimmed back to a cutoff value. This all improves the precision of survey estimates.
The product of these factors is the final weight for each NTPS respondent, which appears as TFNLWGT on the NTPS Public School Teacher Data File.
B-11
The counts in table 1 (in the Estimate Tables section) do not necessarily match the frame counts because some cases in the frame were found to be ineligible (i.e., out of scope).
Variance Estimation
In surveys with complex sample designs, such as NTPS, direct estimates of sampling errors that assume a simple random sample typically underestimate the variability in the estimates. The NTPS sample design and estimation include procedures that deviate from the assumption of simple random sampling, such as sampling with differential probabilities.
One method of calculating sampling errors of complex sample designs is jackknife replication. Jackknife replication methods involve dropping a small portion of the sample from the full sample and computing the statistic of interest for the retained and reweighted sample (the jackknife replicate). The sum of squares of the replicate estimates around the full sample estimate provides an estimate of the variance of the statistic. The NTPS teacher data file includes a set of 200 replicate weights designed to produce variance estimates. The set of replicate weights for each file should be applied to the respondents in that file. The replicate weights for NTPS respondents are TREPWT1–TREPWT200 for teachers.
Reliability of Data
NTPS estimates are based on samples. The sample estimates may differ somewhat from the values that would be obtained from the universe of respondents using the same questionnaire, instructions, and field representatives. The difference occurs because a sample survey estimate is subject to two types of errors: nonsampling and sampling. Estimates of the magnitude of sampling error for NTPS data can be derived or calculated. Nonsampling errors are attributed to many sources, including definitional difficulties, the inability or unwillingness of respondents to provide correct information, differences in the interpretation of questions, an inability to recall information, errors made in collection (e.g., in recording or coding the data), errors made in processing the data, and errors made in estimating values for missing data. Quality control and edit procedures were used to reduce errors made by respondents, coders, and interviewers.
Comparability to SASS
NTPS is a new survey that is strongly based on SASS. However, care must be taken in estimating changes over time in data elements that both surveys have in common because some of the change measured may not be attributable to a change in the education system.
Some of the change may be due to changes in the sampling frame, changes in the questionnaire item wording, or other changes. Additionally, NTPS is a different survey than SASS and pulls data from a larger variety of sources and timeframes than SASS did. While SASS collected data on student race/ethnicity, special programs, and high school graduation, the 2015–16 NTPS gets this information from external sources. Data on student gender and race/ethnicity are taken from the 2014–15 CCD, while graduation rates come from the 2014–15 EdFacts data and information on special programs10 came from the 2013–14 Civil Rights Data Collection.
10 Special programs include: magnet programs, gifted programs, disciplinary programs, Advanced Placement classes, and International Baccalaureate classes.
B-12
Additionally, the 2015–16 NTPS is not representative at the state level, and comparisons to SASS may only be made at the national level. Private sector schools were not included in the 2015–16 NTPS. The next round of NTPS, in 2017–18, will include private sector schools and be representative at the state level.
C-1
Appendix C: Description of Variables
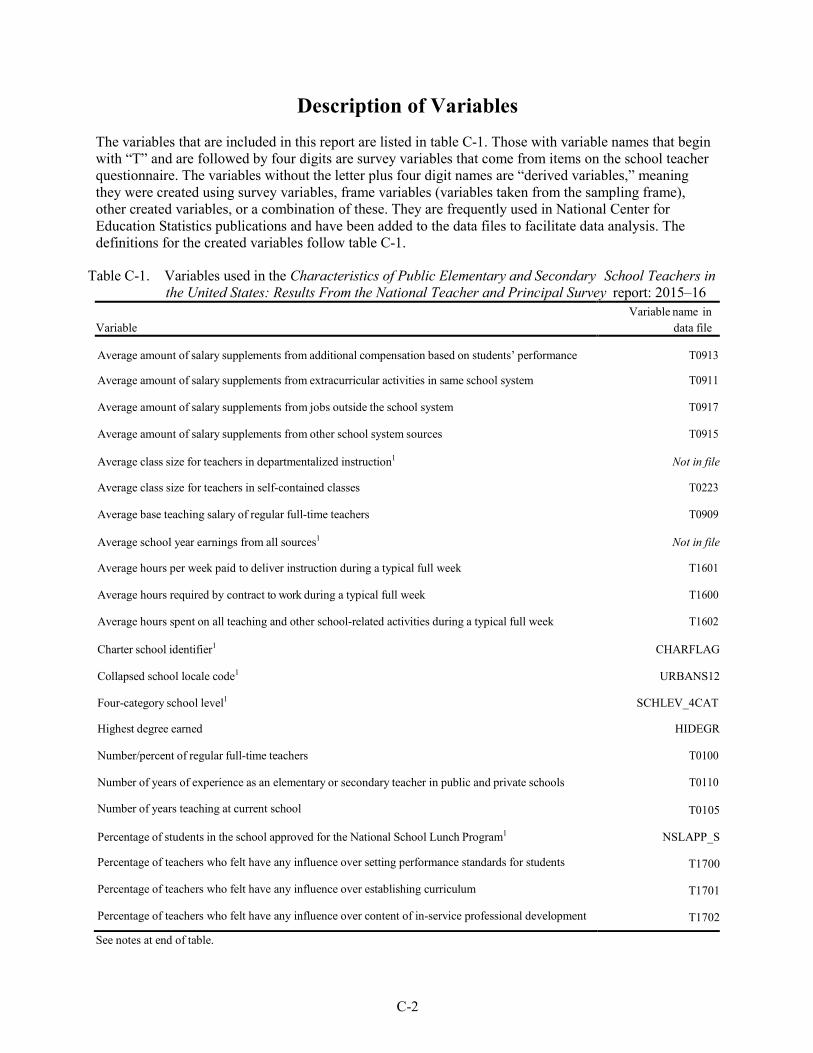
C-2
Description of Variables The variables that are included in this report are listed in table C-1. Those with variable names that begin with “T” and are followed by four digits are survey variables that come from items on the school teacher questionnaire. The variables without the letter plus four digit names are “derived variables,” meaning they were created using survey variables, frame variables (variables taken from the sampling frame), other created variables, or a combination of these. They are frequently used in National Center for Education Statistics publications and have been added to the data files to facilitate data analysis. The definitions for the created variables follow table C-1.
Table C-1. Variables used in the Characteristics of Public Elementary and Secondary School Teachers in
the United States: Results From the National Teacher and Principal Survey report: 2015–16 Variable
Variable name in data file
Average amount of salary supplements from additional compensation based on students’ performance
T0913
Average amount of salary supplements from extracurricular activities in same school system T0911
Average amount of salary supplements from jobs outside the school system T0917
Average amount of salary supplements from other school system sources T0915
Average class size for teachers in departmentalized instruction1 Not in file
Average class size for teachers in self-contained classes T0223
Average base teaching salary of regular full-time teachers T0909
Average school year earnings from all sources1 Not in file
Average hours per week paid to deliver instruction during a typical full week T1601
Average hours required by contract to work during a typical full week T1600
Average hours spent on all teaching and other school-related activities during a typical full week T1602
Charter school identifier1 CHARFLAG
Collapsed school locale code1 URBANS12
Four-category school level1 SCHLEV_4CAT
Highest degree earned HIDEGR
Number/percent of regular full-time teachers T0100
Number of years of experience as an elementary or secondary teacher in public and private schools T0110
Number of years teaching at current school T0105
Percentage of students in the school approved for the National School Lunch Program1 NSLAPP_S
Percentage of teachers who felt have any influence over setting performance standards for students T1700
Percentage of teachers who felt have any influence over establishing curriculum T1701
Percentage of teachers who felt have any influence over content of in-service professional development T1702
See notes at end of table.
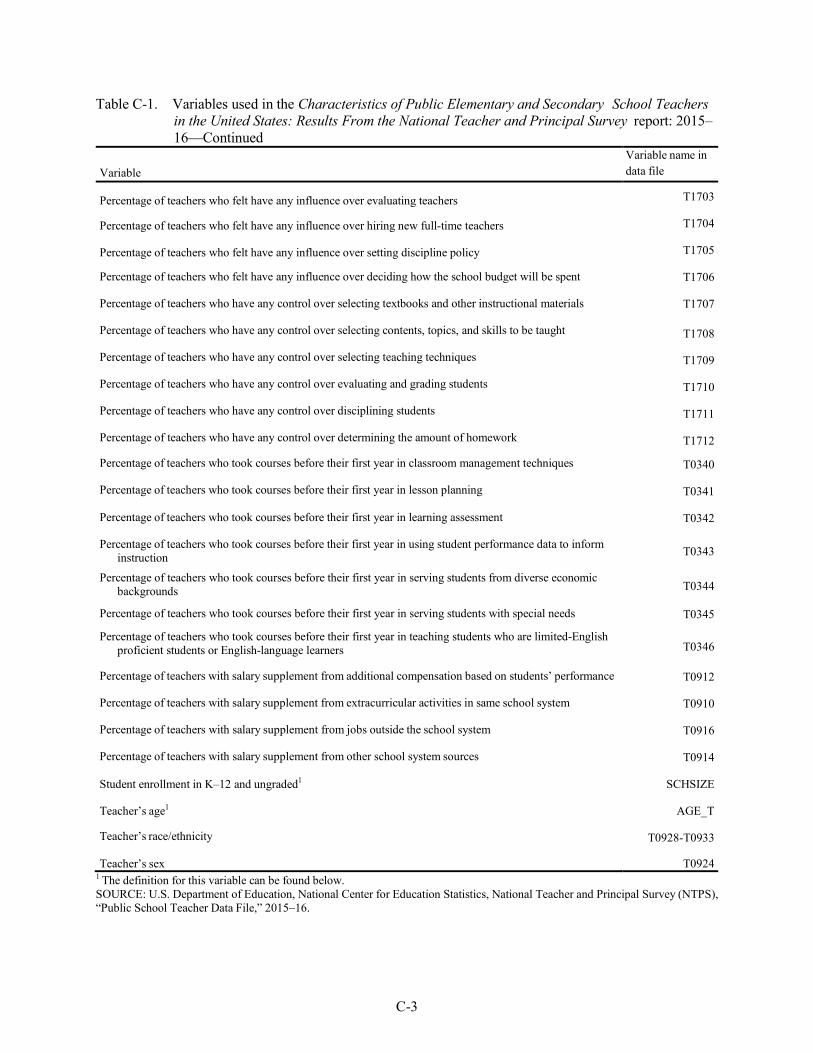
C-3
Table C-1. Variables used in the Characteristics of Public Elementary and Secondary School Teachers in the United States: Results From the National Teacher and Principal Survey report: 2015–16—Continued
Variable
Variable name in data file
Percentage of teachers who felt have any influence over evaluating teachers T1703
Percentage of teachers who felt have any influence over hiring new full-time teachers T1704
Percentage of teachers who felt have any influence over setting discipline policy T1705
Percentage of teachers who felt have any influence over deciding how the school budget will be spent T1706
Percentage of teachers who have any control over selecting textbooks and other instructional materials T1707
Percentage of teachers who have any control over selecting contents, topics, and skills to be taught T1708
Percentage of teachers who have any control over selecting teaching techniques T1709
Percentage of teachers who have any control over evaluating and grading students T1710
Percentage of teachers who have any control over disciplining students T1711
Percentage of teachers who have any control over determining the amount of homework T1712
Percentage of teachers who took courses before their first year in classroom management techniques T0340
Percentage of teachers who took courses before their first year in lesson planning T0341
Percentage of teachers who took courses before their first year in learning assessment T0342
Percentage of teachers who took courses before their first year in using student performance data to inform instruction T0343
Percentage of teachers who took courses before their first year in serving students from diverse economic backgrounds T0344
Percentage of teachers who took courses before their first year in serving students with special needs T0345
Percentage of teachers who took courses before their first year in teaching students who are limited-English proficient students or English-language learners T0346
Percentage of teachers with salary supplement from additional compensation based on students’ performance T0912
Percentage of teachers with salary supplement from extracurricular activities in same school system T0910
Percentage of teachers with salary supplement from jobs outside the school system T0916
Percentage of teachers with salary supplement from other school system sources T0914
Student enrollment in K–12 and ungraded1 SCHSIZE
Teacher’s age1 AGE_T
Teacher’s race/ethnicity T0928-T0933
Teacher’s sex T0924 1 The definition for this variable can be found below. SOURCE: U.S. Department of Education, National Center for Education Statistics, National Teacher and Principal Survey (NTPS), “Public School Teacher Data File,” 2015–16.
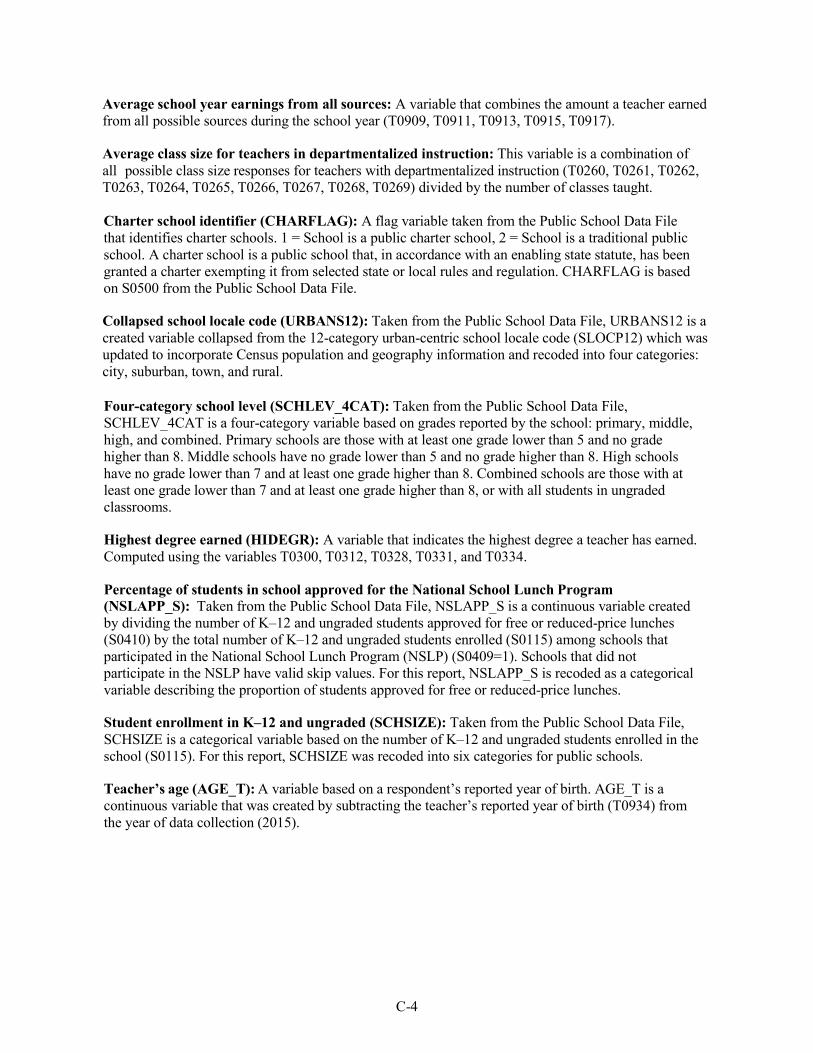
C-4
Average school year earnings from all sources: A variable that combines the amount a teacher earned from all possible sources during the school year (T0909, T0911, T0913, T0915, T0917).
Average class size for teachers in departmentalized instruction: This variable is a combination of all possible class size responses for teachers with departmentalized instruction (T0260, T0261, T0262, T0263, T0264, T0265, T0266, T0267, T0268, T0269) divided by the number of classes taught.
Charter school identifier (CHARFLAG): A flag variable taken from the Public School Data File that identifies charter schools. 1 = School is a public charter school, 2 = School is a traditional public school. A charter school is a public school that, in accordance with an enabling state statute, has been granted a charter exempting it from selected state or local rules and regulation. CHARFLAG is based on S0500 from the Public School Data File.
Collapsed school locale code (URBANS12): Taken from the Public School Data File, URBANS12 is a created variable collapsed from the 12-category urban-centric school locale code (SLOCP12) which was updated to incorporate Census population and geography information and recoded into four categories: city, suburban, town, and rural.
Four-category school level (SCHLEV_4CAT): Taken from the Public School Data File, SCHLEV_4CAT is a four-category variable based on grades reported by the school: primary, middle, high, and combined. Primary schools are those with at least one grade lower than 5 and no grade higher than 8. Middle schools have no grade lower than 5 and no grade higher than 8. High schools have no grade lower than 7 and at least one grade higher than 8. Combined schools are those with at least one grade lower than 7 and at least one grade higher than 8, or with all students in ungraded classrooms.
Highest degree earned (HIDEGR): A variable that indicates the highest degree a teacher has earned. Computed using the variables T0300, T0312, T0328, T0331, and T0334.
Percentage of students in school approved for the National School Lunch Program (NSLAPP_S): Taken from the Public School Data File, NSLAPP_S is a continuous variable created by dividing the number of K–12 and ungraded students approved for free or reduced-price lunches (S0410) by the total number of K–12 and ungraded students enrolled (S0115) among schools that participated in the National School Lunch Program (NSLP) (S0409=1). Schools that did not participate in the NSLP have valid skip values. For this report, NSLAPP_S is recoded as a categorical variable describing the proportion of students approved for free or reduced-price lunches.
Student enrollment in K–12 and ungraded (SCHSIZE): Taken from the Public School Data File, SCHSIZE is a categorical variable based on the number of K–12 and ungraded students enrolled in the school (S0115). For this report, SCHSIZE was recoded into six categories for public schools.
Teacher’s age (AGE_T): A variable based on a respondent’s reported year of birth. AGE_T is a continuous variable that was created by subtracting the teacher’s reported year of birth (T0934) from the year of data collection (2015).