Embed Size (px)
Citation preview
Eastern Michigan UniversityDigitalCommons@EMU
Master's Theses and Doctoral Dissertations Master's Theses, and Doctoral Dissertations, andGraduate Capstone Projects
2002
Characterization of the autotrophic component inperiphyton upon Typha angustifolia detritus in afreshwater wetlandEric J. Warda
Follow this and additional works at: http://commons.emich.edu/theses
Part of the Biology Commons
This Open Access Thesis is brought to you for free and open access by the Master's Theses, and Doctoral Dissertations, and Graduate Capstone Projectsat DigitalCommons@EMU. It has been accepted for inclusion in Master's Theses and Doctoral Dissertations by an authorized administrator ofDigitalCommons@EMU. For more information, please contact [email protected].
Recommended CitationWarda, Eric J., "Characterization of the autotrophic component in periphyton upon Typha angustifolia detritus in a freshwater wetland"(2002). Master's Theses and Doctoral Dissertations. 68.http://commons.emich.edu/theses/68
CHARACTERIZATION OF THE AUTOTROPHIC COMPONENT IN
PERIPHYTON UPON TYPHA ANGUSTIFOLIA DETRITUS IN A
FRESHWATER WETLAND
By
Eric J. Warda
Thesis
Submitted to the Biology Department,
Eastern Michigan University
in partial fulfillment of the requirements
for the degree of
MASTER OF SCIENCE
in
Biology
2002
Ypsilanti, Michigan
ii
APPROVAL
CHARACTERIZATION OF THE AUTOTROPHIC COMPONENT IN PERIPHYTON
UPON TYPHA ANGUSTIFOLIA DETRITUS IN A FRESHWATER WETLAND
By
Eric J. Warda
APPROVED
Dr. Robert Neely _____________________________ ______________
Advisor and Department Head date
Dr. Gary Hannan ______________________________ ______________
Committee Member date
Dr. Dennis Jackson ______________________________ ______________
Committee Member date
Dr. Robert Holkeboer ______________________________ ______________
Dean of Graduate Studies and Research date
iii
ACKNOWLEDGEMENTS
I would like to express many thanks to my friends and family for their continuous
support throughout this experience. I would especially like to thank Laura Garrett and
Bill Seib whose camaraderie, sense of humor and constant pestering lifted my spirits and
pushed me along, when I thought I could go on no more.
I also would like to thank the faculty and staff from the Biology Department of
Eastern Michigan University for the wonderful opportunities, support and confidence, for
without them, this document would not exist.
Many thanks go to my graduate committee, Dr. Gary Hannan and Dr. Dennis
Jackson. Dr. Jackson’s kind words of support as well as his love for science, teaching
and algae also helped me along when I had stumbled. I would also like to thank Dr.
Catherine Bach, an original member of my graduate committee, for opening my eyes to
the fantastic world of ecology.
Most importantly, I would like to thank my graduate advisor, Dr. Robert Neely.
Dr. Neely, I am sure I tested the limits of your wonderful guidance, keen knowledge and
incredible patience and you only flinched a couple of times! Thank you sir, your gentle
guidance, cooperation and dedication has made this entire experience well worth the
while!
In addition, I would like to thank the Graduate School of Eastern Michigan
University for the fantastic opportunity of being a Graduate Teaching Assistant and
providing financial support. Also I would like to express many thanks to the Department

iv
of Biology at Eastern Michigan University for the Meta D. Hellwig Graduate Research
Award, which also provided funding for this study.
v
ABSTRACT
The autotrophic component of periphyton on Typha angustifolia detritus was
characterized in a freshwater wetland during a single growing season. 58 genera of algae
and cyanobacteria, representing six divisions, were observed throughout the study period.
Although the combined algae-cyanobacteria density from within and outside the Typha
stands were significantly affected by both sample date and the combination of date and
location, no significant differences occurred in biovolume. Similarly, no clear evidence
of successional patterns was observed.
Although few significant interactions were observed, Typha detritus provided a
substratum for vast numbers and biomass of periphyton. A combined density for the
observed taxa within the Typha stand averaged 134,588 cells cm-2
, while the density
outside the stand averaged 108,853 cells cm-2
. The average total biovolume for the taxa
within the Typha stand was 245 x 106 ± 23 x 10
6 and 136 x 10
3 ± 314 x 10
6 um
3 cm
-2
outside.
vi
TABLE OF CONTENTS
APPROVAL............................................................................................................……ii
ACKNOWLEDGEMENTS.....................................................................................……iii
ABSTRACT..............................................................................................................…...v
LIST OF FIGURES……………………………………………………………………..viii
LIST OF TABLES………………………………………………………………………ix
CHAPTER I. INTRODUCTION………………………………………………………1
CHAPTER II. LITERATURE REVIEW………………………………………………4
CHAPTER III. METHODS AND MATERIALS……………………………………..17
CHAPTER IV. RESULTS……………………………………………………………..21
CHAPTER V. DISCUSSION………………………………………………………….42
CITED REFERENCES…………………………………………………………………49
APPENDIX 1: The total density, average biovolume, and total biovolume for
all the algal taxa observed on the surface of Typha angustifolia
from May to November, 1998 at Willow Pond, Matthaei Botanical
Gardens, Ann Arbor, MI………………………………………………54
APPENDIX 2: Mean density and total biovolume of the dominant algal-
cyanobacteria divisions observed upon the surface of Typha
angustifolia from May to November, 1998 at Willow Pond,
Matthaei Botanical Gardens, Ann Arbor,
MI……………………………………………………………………..55
APPENDIX 3: Mean density of dominant algae and cyanobacteria observed
on the surface of Typha angustifolia from May to November,
1998 in Willow Pond, Matthaei Botanical Gardens, Ann Arbor,
MI……………………………………………………………………..57
APPENDIX 4: Total biovolume of dominant algae and cyanobacteria observed
on the surface of Typha angustifolia from May to November,
1998 in Willow Pond, Matthaei Botanical Gardens, Ann Arbor,
MI……………………………………………………………………..60
vii
APPENDIX 5: Percentage of the Bacillariophyta, represented by 6 size classes,
observed on the surface of Typha angustifolia from May to
November, 1998 in Willow Pond, Matthaei Botanical Gardens,
Ann Arbor, MI……………………………………………………….63
APPENDIX 6: Percentage of the Chlorophyta, represented by 6 size classes,
observed on the surface of Typha angustifolia from May to
November, 1998 in Willow Pond, Matthaei Botanical Gardens,
Ann Arbor, MI……………………………………………………….64
APPENDIX 7: Percentage of the Cyanophyta, represented by 6 size classes,
observed on the surface of Typha angustifolia from May to
November, 1998 in Willow Pond, Matthaei Botanical Gardens,
Ann Arbor, MI……………………………………………………….65
viii
LIST OF FIGURES
Page
Figure 1. The total density, the average biovolume, and total biovolume
for all the algal taxa observed on the surface of Typha
angustifolia from May to November, 1998 in Willow Pond,
Matthaei Botanical Gardens, Ann Arbor, MI. ................................…..23
Figure 2. Mean density and total biovolume of the dominant algae-
cyanobacteria divisions observed on the surface of Typha
angustifolia.......................................................................................…..25
Figure 3. Mean density of the dominant algae-cyanobacteria taxa observed
on the surface of Typha angustifolia...................................…………...29
Figure 4. Total biovolume of the dominant algae-cyanobacteria taxa observed
on the surface of Typha angustifolia...................................…………...32
Figure 5. Percentage of total biovolume represented by six cell size classes in
the Bacillariophyta, observed on the surface of Typha angustifolia…..33
Figure 6. Percentage of total biovolume represented by six cell size classes in
the Chlorophyta, observed on the surface of Typha angustifolia......….37
Figure 7. Percentage of total biovolume represented by six cell size classes in
the Cyanophyta, observed on the surface of Typha angustifolia........…39
ix
LIST OF TABLES
Page
Table 1. Algal taxa observed on the surface of Typha angustifolia
detritus..................................................................................................22
Table 2. Average density and mean total biovolume ( ± SE) for all
algal taxa in their divisions observed on the surface of Typha
angustifolia detritus..............................................................................27
Table 3. ANOVA of sample date and sample location (±SE) on densities
and total biovolumes of the algae-cyanobacteria divisions
observed on the surface of Typha angustifolia detritus........................28
Table 4. ANOVA of sample date and sample location (±SE) on densities
and total biovolumes of the algae-cyanobacteria genera observed
on the surface of Typha angustifolia detritus........................................31
Table 5. Potential densities and biovolumes of dominant algal-
cyanobacteria genera for the Typha spp. stand.................................…41
1
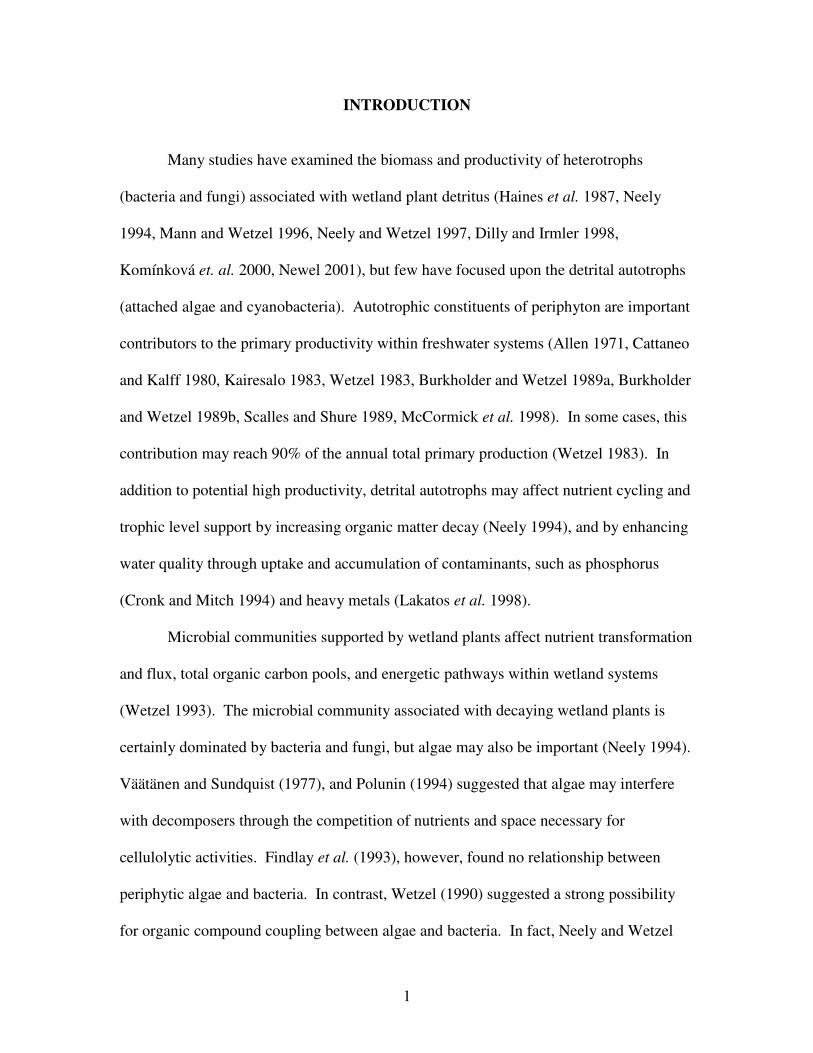
INTRODUCTION
Many studies have examined the biomass and productivity of heterotrophs
(bacteria and fungi) associated with wetland plant detritus (Haines et al. 1987, Neely
1994, Mann and Wetzel 1996, Neely and Wetzel 1997, Dilly and Irmler 1998,
Komínková et. al. 2000, Newel 2001), but few have focused upon the detrital autotrophs
(attached algae and cyanobacteria). Autotrophic constituents of periphyton are important
contributors to the primary productivity within freshwater systems (Allen 1971, Cattaneo
and Kalff 1980, Kairesalo 1983, Wetzel 1983, Burkholder and Wetzel 1989a, Burkholder
and Wetzel 1989b, Scalles and Shure 1989, McCormick et al. 1998). In some cases, this
contribution may reach 90% of the annual total primary production (Wetzel 1983). In
addition to potential high productivity, detrital autotrophs may affect nutrient cycling and
trophic level support by increasing organic matter decay (Neely 1994), and by enhancing
water quality through uptake and accumulation of contaminants, such as phosphorus
(Cronk and Mitch 1994) and heavy metals (Lakatos et al. 1998).
Microbial communities supported by wetland plants affect nutrient transformation
and flux, total organic carbon pools, and energetic pathways within wetland systems
(Wetzel 1993). The microbial community associated with decaying wetland plants is
certainly dominated by bacteria and fungi, but algae may also be important (Neely 1994).
Väätänen and Sundquist (1977), and Polunin (1994) suggested that algae may interfere
with decomposers through the competition of nutrients and space necessary for
cellulolytic activities. Findlay et al. (1993), however, found no relationship between
periphytic algae and bacteria. In contrast, Wetzel (1990) suggested a strong possibility
for organic compound coupling between algae and bacteria. In fact, Neely and Wetzel
2
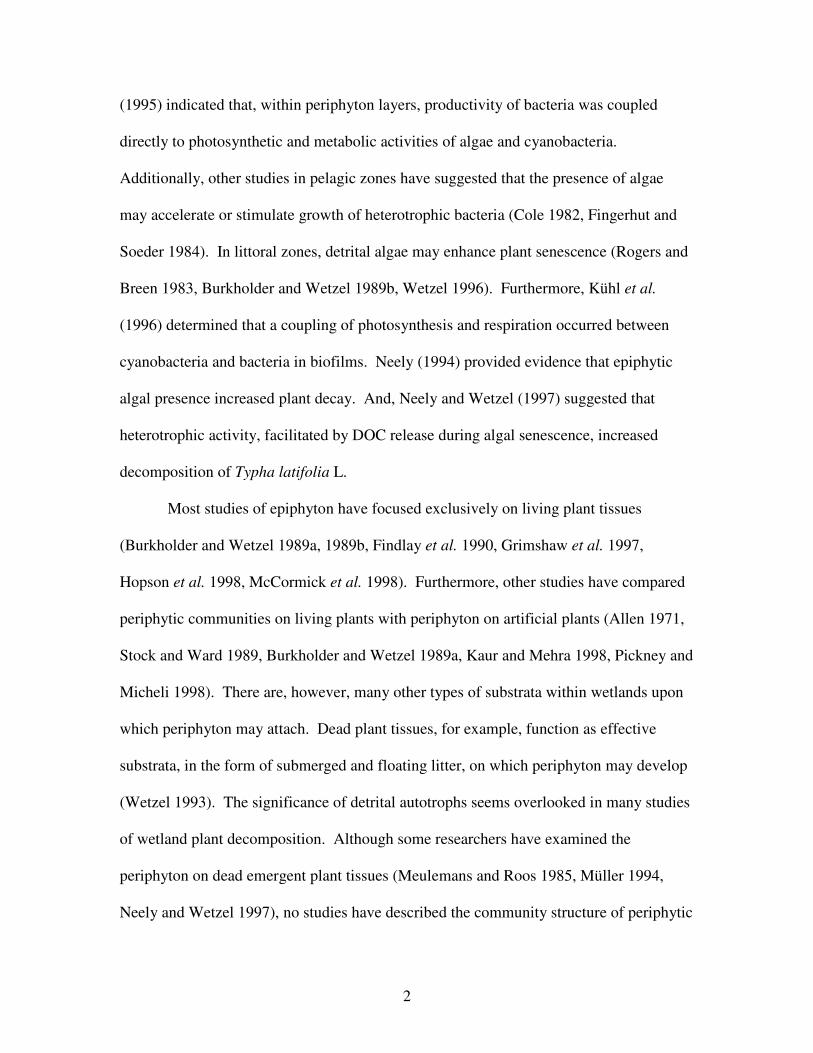
(1995) indicated that, within periphyton layers, productivity of bacteria was coupled
directly to photosynthetic and metabolic activities of algae and cyanobacteria.
Additionally, other studies in pelagic zones have suggested that the presence of algae
may accelerate or stimulate growth of heterotrophic bacteria (Cole 1982, Fingerhut and
Soeder 1984). In littoral zones, detrital algae may enhance plant senescence (Rogers and
Breen 1983, Burkholder and Wetzel 1989b, Wetzel 1996). Furthermore, Kühl et al.
(1996) determined that a coupling of photosynthesis and respiration occurred between
cyanobacteria and bacteria in biofilms. Neely (1994) provided evidence that epiphytic
algal presence increased plant decay. And, Neely and Wetzel (1997) suggested that
heterotrophic activity, facilitated by DOC release during algal senescence, increased
decomposition of Typha latifolia L.
Most studies of epiphyton have focused exclusively on living plant tissues
(Burkholder and Wetzel 1989a, 1989b, Findlay et al. 1990, Grimshaw et al. 1997,
Hopson et al. 1998, McCormick et al. 1998). Furthermore, other studies have compared
periphytic communities on living plants with periphyton on artificial plants (Allen 1971,
Stock and Ward 1989, Burkholder and Wetzel 1989a, Kaur and Mehra 1998, Pickney and
Micheli 1998). There are, however, many other types of substrata within wetlands upon
which periphyton may attach. Dead plant tissues, for example, function as effective
substrata, in the form of submerged and floating litter, on which periphyton may develop
(Wetzel 1993). The significance of detrital autotrophs seems overlooked in many studies
of wetland plant decomposition. Although some researchers have examined the
periphyton on dead emergent plant tissues (Meulemans and Roos 1985, Müller 1994,
Neely and Wetzel 1997), no studies have described the community structure of periphytic
3
autotrophs attached to plant litter. Thus, the objective of this study was to characterize
the autotrophic component in epiphyton on toppled Typha angustifolia litter in a
freshwater wetland during a single growing season. Community structure attributes were
defined as taxonomic composition, community architecture, species diversity, species
dominance, species density and species biovolume.
Light is an important determinant of autotroph community structure in epiphyton
(Müller 1994), and because light intensity is conversely proportional to the thickness of
the periphytic layer, the algal community may be affected (Meulemans and Roos 1985).
Murkin et al. (1992) determined that light was limiting to epiphytic algal production,
despite high nutrient availability, in Delta Marsh. Furthermore, Harrison and Hildrew
(1998) suggested that light was a limiting factor to periphytic algal abundance. Wellnitz
and Ward (1998) determined that light, in combination with algal grazers, affected
periphytic algal species composition and standing crop. Given the effect of light on
periphyton communities, a second objective of this study was to compare detrital
autotrophic communities between periphyton-colonized litter in a well-lighted zone
outside a Typha angustifolia stand and the periphyton developing in dense, shaded areas
within the Typha stand.
4
LITERATURE REVIEW
Introduction
Periphyton is defined as an association of aquatic organisms that grow upon
submerged substrates (Weitzel 1979, Wetzel 1983). Submerged substrates include rock
(epilithic), sediment (epilipelic), animals (epizoic), sand (episammic), wood (epidendric)
and plants (epiphytic). These organisms include both autotrophs and heterotrophs. The
autotrophs include the cyanobacteria (blue-green algae) and many eukaryotic algae such
as the chlorophytes (Green algae) and bacillariophytes (Diatoms). The heterotrophic
components include fungi, protozoa, small invertebrates and some types of bacteria.
Epiphyton typically consists of two components: an adnate component with the main cell
axis in direct contact with the macrophyte and the loosely attached component that
develops away from the macrophyte. These organisms not only contribute to the overall
quality of the aquatic system, but may act as a precursor, in addition to bacteria, to the
successional sequence of other epiphytes and organisms.
Algae are fundamental to many processes that occur within the aquatic ecosystem,
particularly with regard to the nutrient cycles and trophic level support. Periphyton also
enhance water quality and function as pollution indicators. Lakato el al. (1998)
determined that the efficiency of contaminant elimination, filtration and accumulation
within a reed belt was increased by periphyton, which improved the surrounding water
quality. And, Cronk and Mitsch (1994) found that periphyton contributed to nutrient
uptake and waterborne solid removal in constructed freshwater wetlands.
The autotrophic component of periphyton contributes significantly to overall
production within freshwater systems. Allen (1971) determined that epiphytic algae
5
contributed 21.4% of the total annual production in a temperate lake and 31.3% of the
total littoral production in the same lake. Cattaneo and Kalff (1980) and Kairesalo (1983)
found that epiphytes attached to macrophytes can play an important role in total primary
production, by fixing carbon in greater amounts than surrounding macrophytes, even
though periphyton biomass was significantly lower than that of the macrophytes. In
many lakes, periphyton contribute as much as 90% of the annual total primary production
(Wetzel 1983). Burkholder and Wetzel (1989a) estimated that epiphytic algae were
significant contributors to the primary production in a hard water lake. Furthermore,
Schalles and Shure (1989) determined that algae in the littoral zone of a shallow wetland
in the Carolina Bays contributed as much as one-third of the net primary production
within that wetland. In addition, McCormick et al. (1998) also found that the majority of
the productivity in the sloughs of the Everglades was accounted for by periphyton.
In wetlands, epiphytic algae on emergent plant litter have the potential to affect
nutrient and energy pathways by increasing decay of detritus and utilization of dissolved
organic matter by microbes (Neely 1994). This is an important consideration because the
production and decomposition of plant material are dominant processes of wetlands, and
many wetland ecosystem attributes are regulated by the metabolism of microbes
supported by emergent plants (Wetzel 1993). Such attributes include nutrient
accumulation and storage, organic carbon availability and energetic pathways.
Periphyton also regulate nutrient dynamics (Wetzel 1990, 1993) by the release and
immobilization of nutrients during decomposition, thereby affecting the chemistry of the
surrounding waters (Neely and Baker 1989).
6
Development of Periphyton on Submersed, Living Leaves
Although the roles of autotrophs in periphyton are many, examination of
community structure, colonization, and changes through time are critical to understanding
the contribution of algae and cyanobacteria to wetland functions. Hoagland et al. (1982)
described the dynamics of diatom communities upon suspended artificial substrates as
being similar to higher plant succession. However, because Korte and Blinn (1982)
reported development of an organic biofilm within 2 hours upon artificial surfaces in a
stream, periphyton communities potentially develop substantially faster than do
communities of higher plants. The well-developed organic biofilm may modify the
surface charge and serve as a prerequisite of bacterial attachment. Bacteria were attached
to the coated substrata by use of mucilaginous strands and, although the bacteria did not
seem to be a prerequisite for specific algal assembles, opportunistic diatoms began to
attach after the bacteria. These diatoms included taxa that have mucilaginous coats or
produce short stalks, e.g. species of Gomphonema and Navicula. As parts of these genera
began to develop, other diatoms colonized, such as Fragilaria and Nitzschia. These
predominately adnate diatoms were then followed by long-stalked diatoms (other species
of Gomphonema), large rosettes of diatoms including species of Nitzschia and Synedra
and finally the filamentous green alga Stigeoclonium. In addition, Muelemans and Roos
(1985) described a particular architecture of three distinct layers growing upon dead
stems of Phragmites australis (Cav.) Trin. ex Steudel. The organisms that occurred
during original colonization represented the basal and intermediate layers, and a later-
developing layer was called the uppermost layer. The basal layer can be directly
influenced by the shading of the uppermost layer, which may cause the basal layer to
7
deteriorate and separate from the substratum. In addition, microtopographic features of
the substrata may influence the activity of the basal layer (Stock and Ward 1989).
Periphyton also occurs on submersed and emergent living plant structures
(epiphyton). Periphyton (epiphyton) development on submersed living leaves has been
closely examined. In fact, most studies of periphyton consider exclusively living plant
structures (Burkholder and Wetzel 1989a, Burkholder and Wetzel 1989b, Grimshaw et al.
1997, Findlay et al. 1990, McCormick et al. 1998, Hopson et al. 1998). In one study,
Burkholder and Wetzel (1990) examined the epiphytic colonization of the submersed
macrophyte Scirpus subterminalis in a Michigan lake. The study considered specifically
an epiphytic community of 102 taxa located on the oldest leaves. Almost 43% of the
community was comprised of diatoms and 26% were Cyanobacteria. Common diatom
taxa were Cyclotella, Cymbella, Navicula, Achnanthes minutissima, and Synedra.
Common Cyanobacteria taxa included Aphanocapsa, Aphanothece, Gleocapsa,
Pelogloea, and Synechococcus. Diatoms were present in a greater proportion of the total
cell count during November-April, while the Cyanobacteria represented the majority
during July. The study also demonstrated that different diatom cell types were present at
different times during the growing season. From May to mid-June, pennate diatom
species represented 48% of the total diatom biovolume and from mid-June through the
rest of the growing season, pinnate taxa represented approximately 91% of the diatom
biovolume. Cyclotella, a centric diatom, contributed 7% on average of the total diatom
cells and 28% of the total diatom biovolume during May-October. Furthermore,
Cyclotella represented 25% of the total algal biovolume in June and 32% in April. On
8
average, only 12% of the biovolume consisted of vyanophytes. Other taxa were
observed, but only contributed 4% of the total algal biovolume during May-October.
Romo and Galanti (1998) examined the distribution and composition of epiphyton
on Trapa natans over a four-month period (June-September) in a shallow eutrophic lake.
The total algal biomass was positively correlated with the seasonal growth of T. natans.
Algal succession was initiated by colonization of adnate forms, followed by basally-
attached forms, and subsequently leading to the loosely-attached forms (i.e. stalk-
formers) and finally colonized with filamentous forms. The lamina and petiole of T.
natans had a higher mean algal biomass and abundance than the stem and roots. Algal
density, biomass and epiphytic abundance declined vertically from the petiole to the
lowest root segment. Abundance of cyanobacteria was greatest on the lamina, whereas
green algae were most abundant on the petiole and diatoms dominated the stem and root
sections. Algal assemblages on the lamina and petiole were distinctly different than on
the stems and roots. Early in the growing season (June), the upper portions of T. natans
were colonized by Gleocystis cf. gigas, Cocconeis placentula, Achnanthes minitissima,
Scenedesmus lunatus, and Tetraedron minimum. The latter two taxa were present at
lower densities than the former taxa. Gleocystis cf. gigas contributed 40-72% of the total
abundance in June. By the beginning of July, the lamina and petiole were dominated by
Achnanthes minutissima, Gomphonema parvulum, and Spondylosium planum. In mid-
late July, Achnanthes minutissima and Podohedra falcata dominated the petiole; whole
G. parvulum, Nostoc spongiaeforme and Anabaena anomala were subdominant. The
Cyanobacteria were not as dominant on the petiole as were G. parvulum, Euastrum
9
denticulatum and P. falcata. The stem was dominated by A. minutissima, whereas the
upper roots were dominated by Cymbella cesatii and a species of Heteroleiblenia sp.
During the first half of August, Nostoc spongiaeforme and Anabaena anomala
dominated the petiole (34%). The upper stem and root were dominated by Achnanthes
minutissima, C. cesatii, and Cyclotella ocellata. The lower roots were dominated by
different taxa consisting of Heteroleiblenia sp. and Oocystis sp. In late August, the
Cyanobacteria upon the lamina declined, communities upon the petiole remained
unchanged and the stem and root assemblages were similar, consisting of Heteroleiblenia
sp., Oocystis sp., Scenedesmus ecornis, Tetraedron minimum, Cyclotella ocellata and
Cymbella cesatii.
By the end of the growing season and at the onset of Trapa senescence, new alga
taxa appeared on the lamina and petiole. Some examples included Merismopedia
punctata, Cosmarium sp., Desmidium swartzii, Synedra acus, and S. ulna.
In another study, Hopsen et al. (1998) examined the abundance and community
composition of epiphyton on various plant taxa, including species of Najas and Hydrilla,
occurring in Lake Okeechobee, Florida, a shallow, sub-tropical lake. This study was
conducted during a 13-month period, beginning in December 1990. Diatoms were found
to represent the greatest percentage of every sample site examined. Furthermore, diatoms
were the dominant taxa found upon each host plant type.
Living vs. Artificial Leaf Surfaces
Artificial surfaces have long been a popular means for study of periphyton
(Cattaneo and Amireault 1992). And, in fact, many studies make direct comparisons of
periphyton colonization upon artificial and natural substrates (Allen 1971, Stock and
10
Ward 1989, Burkholder and Wetzel 1989a, Kaur and Mehra 1998, Pickney and Micheli
1998). Some periphyton studies used artificial substrates exclusively (Hoagland et al.
1982, Korte and Blinn 1983, Bothwell et al. 1993, Francoeur and Lowe 1998, Wellinitz
and Ward 1998).
Over a 14-week study period (June-September), Burkholder and Wetzel (1989)
compared periphyton colonization on natural and artificial Potamogeton illinoensis in a
phosphorus-limited hard water lake. Early in the growing season, algal cell number was
approximately 15-fold greater on the artificial plants. In addition, algal biovolume on the
artificial Potamogeton was approximately 17-fold greater than on the live plants. As the
growing season continued (8 weeks), biovolume and cell counts were only two-fold
greater on the artificial plants. By the end of the growing season, (14 weeks), comparable
biovolumes and cell counts occurred on the two substrata.
Throughout the growing season, the loosely attached periphyton composition
differed between the two substrates. Diatom contribution to total algal biovolume on the
artificial leaves was greatest early in the growing season. The most abundant diatoms
were species of Gomphonema, contributing 30% of the total algal biovolume in July (8
weeks). By the end of the growing season, Gomphonema spp. had declined to 15% of the
total biovolume while Cymbella spp.and Cyclotella spp. increased to 21% and 15%,
respectively. During week 8 (July) of the study, maximum cyanobacteria biovolume
occurred and both the cyanobacteria and chlorophyta contributed equally to total algal
biomass. Cyanobacteria biovolume increased to 30% of total algal biovolume by week
14 (September) as green algae decreased to insignificant numbers. Early in the growing
season, Stichogloea deoderleinii accounted for 25% of the loosely attached algal
11
biovolume upon the natural Potamogeton. Later in the growing season, (late July),
diatoms represented 85% of the total biovolume. During that time, the dominant diatom
genus was Cymbella, which comprised about 24% of the total biovolume. By the latter
part of the growing season, (mid-September), loosely attached cyanobacteria increased to
50% of the total algal biomass.
The Burkholder and Wetzel (1989) study also examined the adnate portion of the
epiphytic community on P. illinoensis. On both artificial and natural substrates, bacteria
were the initial colonizers. On young natural leaves, bacterial cell numbers were 1000-
fold greater than artificial leaves. Although adnate algae were rarely found on young and
artificially simulated young leaves, some colonization did occur. However, adnate cell
numbers were insignificant on both types of substrata when compared to the loosely
attached component of the periphyton. The adnate diatom taxa were Achnanthes
minutissima, Cocconeis placentula, Cymbella minuta, Eunotia arcus, Gomphonema spp.,
Navicula microcephala, and Synedra spp. The adnate Cyanobacteria component
consisted primarily of Anabaena spp., which contributed to a higher percentage of the
population on the artificial leaves.
Kaur and Mehra (1998) compared periphyton colonization on natural and
artificial Eichhornia crassipes. The study was conducted in laboratory conditions over a
3-week period. Both artificial and natural substrates displayed similar colonization and
successional patterns. Species, found on both substrate types, included Cyclotella
meneghiniana, Cymatopluera solea, Fragilaria capucina, Navicula palea, Synedra ulna,
Oscillatoria formosa, Euglena deses, and Closterium acerosum. Diatoms comprised the
major portion of the algal assemblages on both substrates. Species composition and
12
density differences did, however, occur. Species found only on natural substrates
included Eudorina elegans and Dinobryon sertularia. Neidium productum, Navicula
rhyncocephala and Cyclotella meneghiniana were observed on living plants before the
artificial plants.
Development of Periphyton on Dead, Emergent Plant Tissues
In freshwater wetlands, high productivity of vegetation, coupled with low
herbivory, results in large amounts of detrital biomass. Similar to submersed living plant
tissues, dead emergent plant tissues provide substrata for development of periphyton.
The standing-dead biomass, as well as detrital litter, provides potentially a large surface
area for periphyton development (Wetzel 1993). Relative to periphyton upon submerged
plants, algae upon dead emergent plant tissues and detrital litter has been poorly studied.
Meulemans and Roos (1985), however, described the periphytic community
structure upon dead Phragmites australis stems in an oligo-mesotrophic lake. Clear
seasonal differences occurred with maximum diatom cell numbers in winter and
minimum diatoms in summer. During the summer months, green and red algae
contributed to more than 50% of total chlorophyll. The diatom community occurred as
three main layers. The lowest layer, or basal layer, consisted of species of Achnanthes,
Amphora, Cocconeis, Eunotia, and Synedra. The intermediate layer was comprised of
species of Cymbella, Gomphonema, and Rhoicospaenia. The top-most layer included
species of Diatoma, Fragilaria, Melosira and Tabellaria. Although Gomphonema
increased in autumn, the cell numbers in the intermediate layer was relatively constant.
In January, Achnanthes and Fragilaria density increased in the basal and upper-most
13
layers, respectively. From January through May, a six-fold increase in diatom density
was mainly comprised of those species located in the uppermost layer. Furthermore,
increases in cell volume were proportionally greater than cell density. Cell volume
increased by 30-fold during late winter and early spring, relative to summer and fall. Red
algae, including Batrachospermum and Auduoinella, were present in small numbers on
Phragmites throughout the year. However, from June to September, Batrachospermum
reached numbers that produced macroscopic cultures. The green algae Oedogonium,
Bulbochaete and Mougeotia were present from June to the end of the year.
A more recent study investigated the development of periphyton on Phragmites
australis in a eutrophic lake over a three-year period (Müller 1994). Epiphytic biomass,
determined by chlorophyll concentrations, averaged approximately 22.76 ug
chlorophyll-a cm-2
, and reached a maximum in April. A second short-lived maximum,
after a marked decrease in biomass, occurred in late spring. A chlorophyll-a minimum
occurred in July or August, averaging approximately 1.29 ug cm-2
. Diatoms were the
most abundant algal group, contributing to approximately 80% of the total biomass in
autumn and winter, and over 95% during the spring maximum. Green algae dominated in
early April and exhibited a second maximum in June and July. The Cyanobacteria were
most abundant during June and July, but accounted for no more than 22% of the total
biomass.
Diatom biovolume during the spring peak was 3.310 mm3 cm
-2 in 1989, 1.480
mm3 cm
-2 in 1990 and 1.780 mm
3 cm
-2 in 1991. Diatom biovolume, however, declined
rapidly after the spring maximum to less than 0.250 mm3 cm
-2 and never recovered. The
most abundant diatom taxa during the spring maximum consisted of those that were
14
loosely attached in intermediate and upper-most layers. Taxa within these two layers
included Cymbella lanceolata, C. cymbiformis, C. prostrata, Fragilaria capucina var.
vaucheriae, F. ulna var. acus, Gomphonema acuminatum and G. olicium. Adnate or
basal species increased during later summer and dominated during the autumn and winter
months. This layer was mainly composed of diatom taxa such as Epithemia adnata, E.
sorex, E. turgida, Achnanthes minutissima, Navicula tripunctata, Navicula spp., and
Rhoicosphenia abbreviata. During late summer, Gomphonema acuminatum and G.
gracile were the dominant diatom species, while Cocconeis plancentula, Epithemia spp.,
and Rhopalodia gibba dominated the autumn and winter months.
The green algae were the highest in May and June. For those months, the average
biovolume was 0.298 mm3 cm
-2 in 1989, 0.151 mm
3 cm
-2 in 1990, and 0.492 mm
3 cm
-2 in
1991. Oedogonium cf. irregulare var. condensatum, was the most abundant, but
Mougeotia sp., and Spirogyra sp. were the dominant taxa, when considering biovolume.
Cyanobacteria were present throughout the year, but only in small numbers. Maximum
abundance occurred during May and July with biovolumes of 0.036 mm3 cm
-2 in 1989,
0.038 mm3 cm
-2 in 1990, and 0.039 mm
3 cm
-2 in 1991. The predominant species
included Lyngbya spp., Phromidium spp., and Plectonema spp.
Combined, the aforementioned studies of periphyton suggest a consistent scheme
of colonization and architectural development upon both natural and artificial substrata.
Although detritus potentially provides a significant substratum for periphyton
development, the natural substrates examined in the studies have been confined to living
and senescing organisms (mostly plants). Thus, critical questions remain about algal
colonization on toppled emergent plant litter and other types of detritus.
15
Role of Epiphytic Algae in the Degradation of Organic Matter
Many studies have focused on the effects of heterotrophic bacteria and fungi
associated with decaying plants (Haines et al. 1987, Neely 1994, Mann and Wetzel 1996,
Neely and Wetzel 1997, Dilly and Irmler 1998), but few studies have explored the role
attached autotrophs might play in decomposition. Given known roles of periphyton and
heterotroph-algal couplings in pelagic systems, this seems to be an important oversight.
A complete understanding of periphyton function on decaying emergent plants seems
critical to developing a more complete model of plant decay within wetlands.
Some researchers have suggested that algae interfere with decomposers by
competing for space and nutrients; however, this avenue needs further investigation
(Väätänen and Sundquist 1977, Polunin 1984). Studies of stream periphyton have
suggested that interactions between periphytic bacteria and algae do not exist, or are
negligible (Findlay et al. 1993). Wetzel (1996), on the other hand, suggested that more
often, heterotrophs seem to benefit by the presence of autotrophic communities. These
benefits may be provided by the couplings of organic compounds between the
autotrophic and heterotrophic organisms within the periphytic community. For example,
autotrophs provide dissolved organic carbon (DOC) and oxygen required by some
heterotrophs for metabolic processes. In addition, Wetzel (1990) suggested that the
probability of couplings of organic compounds between bacteria and algae are as likely
as those between the macrophytes and attached epiphytes, organisms with well-
documented interactions. Neely (1994) provided evidence suggesting that epiphytic
algae are major contributors to the decay of Typha latifolia and observed that higher algal
16
densities increased the rate of plant decay. Kühl et al. (1996) reported a coupling of
photosynthesis and respiration in biofilms between Cyanobacteria and heterotrophic
bacteria. Furthermore, Neely and Wetzel (1997) suggested that T. angustifolia
decomposition varies with solar radiation, and perhaps algal photosynthesis. Epiphytic
algae may stimulate decay through releases of DOC, oxygen or other means, which may
facilitate heterotrophic activity.
The many roles of periphyton in freshwater wetlands are becoming increasingly
appreciated. These organisms contribute to nutrient availability, water quality, and may
provide substances that are important to the overall quality of the freshwater system.
Also, Wetzel (1984) suggested that the stability of the overall aquatic system depends on
the energy stored within the detrital organic matter. Because decomposition of organic
matter is important to the energy and nutrient flux in aquatic systems, understanding such
interactions involving decomposers and algae should substantially advance our
knowledge of fundamental wetland processes.
17
METHODS
Study Site Description
The study was conducted in Willow Pond, located at the University of Michigan
Matthaei Botanical Gardens (Washtenaw County, Superior Township, Sec. 24, T2S, R6E,
approximately 0.18 miles east of Dixboro Road, 17’ 57.51” N, 39’ 42.82” W). Willow
Pond is a small lacustrine system with dense beds of Chara sp. in the deeper areas and
dense clones of Typha angustifolia L. bordering the edge. The pond, which is
approximately 55 meters wide and 185 meters long, is fed by Parker Brook from the
north side and has a small outlet on the east end. The general depth of the pond within
the sampling area is approximately 3 feet.
Sampling
Detritus sampling began in May 1998 and continued biweekly though November
1998. On every sampling date, four samples were randomly collected from each of two
different locations within Willow Pond, for a total of eight samples per sampling date.
The sample locations within Willow Pond consisted of an area inside the T. angustifolia
stand and another area located exterior to the stand toward the center of the pond.
Overall, a total of 112 samples were collected throughout the 14 sampling dates. Size,
condition, and age of the leaf litter were not considered during collection. Each sample
consisted of three 5 mm plugs, removed through use of a cork borer, from a single piece
of toppled T. angustifolia leaf litter floating in Willow Pond. The three plugs were then
placed into a single Falcon tube containing 5 ml of preservative and labeled. The
preservative consisted of either 2.5% glutaraldehyde or diluted 6:3:1 solution. The 6:3:1
18
solution consisted of 6 parts H2O, 3 parts ethanol and 1 part formalin; this solution was
then diluted to 33% (Prescott 1979).
Additionally, light intensity (at water surface), water temperature, and dissolved
oxygen content were measured at both sample locations (inside and outside of the T.
angustifolia stand) on every sampling date. Light intensity was measured with a LyCor
Radiometer light photometer and measured approximately 1 cm above the water surface
at each of the sampling locations. Sampling time was not consistent throughout the study
period. Dissolved oxygen content and water temperature were assessed at each sample
location with an YSI model 57 combined temperature-oxygen meter.
On October 29, 1998 a 30-meter transect was established along the fringe of
Willow Pond through the T. angustifolia stand in order to collect cattail data. Along the
30-meter transect, a 0.25 m2 hoop was randomly dropped every 2 meters and the cattails
inside the hoop were counted to estimate density of T. angustifolia at Willow Pond.
Cattails from both the 1997 and 1998 growing seasons were counted. Additionally,
twenty-five cattail stalks, including leaves, were randomly collected along the 30 meter
transect to facilitate determining the approximate surface area available for periphyton
community establishment. Surface area of the collected cattails was measured through
use of a caliper and ruler.
Identification and Enumeration of Epiphytic Algae and Cyanobacteria
For every sample date, two of the four collected samples from each of the two
locations were examined (two samples collected inside the cattail stand and two collected
outside the cattail stand). Prior to microscopic analysis, each sample tube was shaken,
19
using a Vortex mixer, for approximately 10 seconds to assist in the detachment of the
epiphyton from the three collected plugs. Each of the three litter plugs were then
removed from the sample tube and both sides were scraped with a razor blade to detach
any periphyton remaining on the plug. The scraped material was then rinsed off the razor
blade and back into the sample tube using the preservative from the corresponding
sample tube. To ensure homogeneity, the sample tube was shaken again with the Vortex
mixer for 10 seconds. Immediately following the second mixing, an aliquot of the
material was removed from the sample tube, placed on a Palmer depressed counting
slide, and covered with a glass cover slip. This aliquot was examined and represented the
sample from which it was removed.
Each sample was examined by use of a Leica DMRB light microscope at 200X
total magnification. Cell counts were performed using a horizontal transect, in some
cases multiple transects, along the Palmer slide, until 300 cells were counted. Length and
width of algal cells were recorded, and each counted algal cell was identified to genus
(Patrick and Reimer 1967, Prescott 1979, Krammer and Lange-Bertalot 1986). Cell
counts included algal fragments observed within each transect. These fragments typically
consisted of damaged cells and/or diatom frustules. The number of algal cells per
transect was used to calculate algal density for each genus. Calculations for densities
were conducted by using the following formulae:
� Area of Palmer depression / area of transect(s) = A
� Genus cell density ∗ A = density of cells in Palmer slide
� Density of cells in Palmer slide / 0.1 ml ∗ (5 ml) = density of genus in sample tube
� Density of cells in sample / surface area on litter (cm2) = density (cells cm
-2)
20
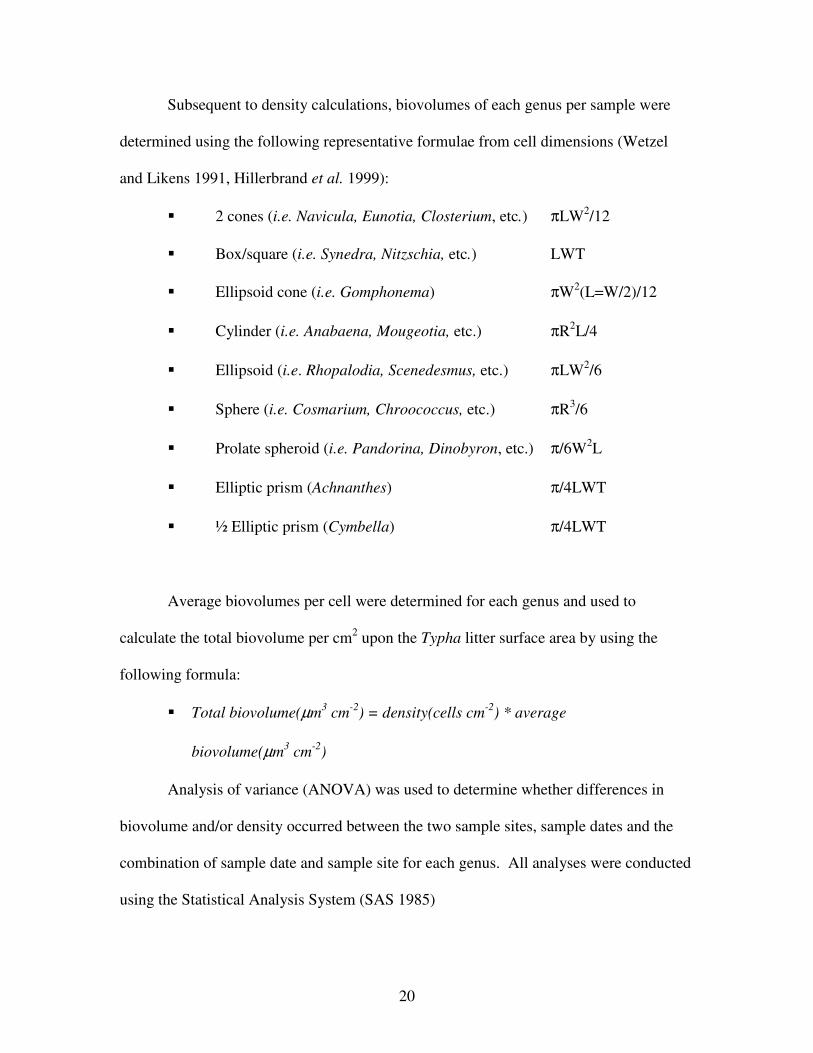
Subsequent to density calculations, biovolumes of each genus per sample were
determined using the following representative formulae from cell dimensions (Wetzel
and Likens 1991, Hillerbrand et al. 1999):
� 2 cones (i.e. Navicula, Eunotia, Closterium, etc.) πLW2/12
� Box/square (i.e. Synedra, Nitzschia, etc.) LWT
� Ellipsoid cone (i.e. Gomphonema) πW2(L=W/2)/12
� Cylinder (i.e. Anabaena, Mougeotia, etc.) πR2L/4
� Ellipsoid (i.e. Rhopalodia, Scenedesmus, etc.) πLW2/6
� Sphere (i.e. Cosmarium, Chroococcus, etc.) πR3/6
� Prolate spheroid (i.e. Pandorina, Dinobyron, etc.) π/6W2L
� Elliptic prism (Achnanthes) π/4LWT
� ½ Elliptic prism (Cymbella) π/4LWT
Average biovolumes per cell were determined for each genus and used to
calculate the total biovolume per cm2 upon the Typha litter surface area by using the
following formula:
� Total biovolume(µm3 cm
-2) = density(cells cm
-2) * average
biovolume(µm3 cm
-2)
Analysis of variance (ANOVA) was used to determine whether differences in
biovolume and/or density occurred between the two sample sites, sample dates and the
combination of sample date and sample site for each genus. All analyses were conducted
using the Statistical Analysis System (SAS 1985)
21
RESULTS
General Habitat Description
The emergent vegetation forming the cattail stand consisted primarily of Typha
angustifolia. Also present in and near the stand were culms of T. latifolia as well as
Lythrum salicaria. However, the latter two species were not found within the sampling
area. Average water temperature during the study period inside and outside of the cattail
stand was 19.5º C and 19.7º C, respectively. Average dissolved oxygen content inside of
the cattail stand was 7.38 ± 0.79 (SE) mg l-2
, compared with 11.35 ± 0.73 mg l-2
outside
the stand. During the growing season, light intensity was approximately four times
higher over the open water relative to within the T. angustifolia stand.
Composition of Periphyton Community
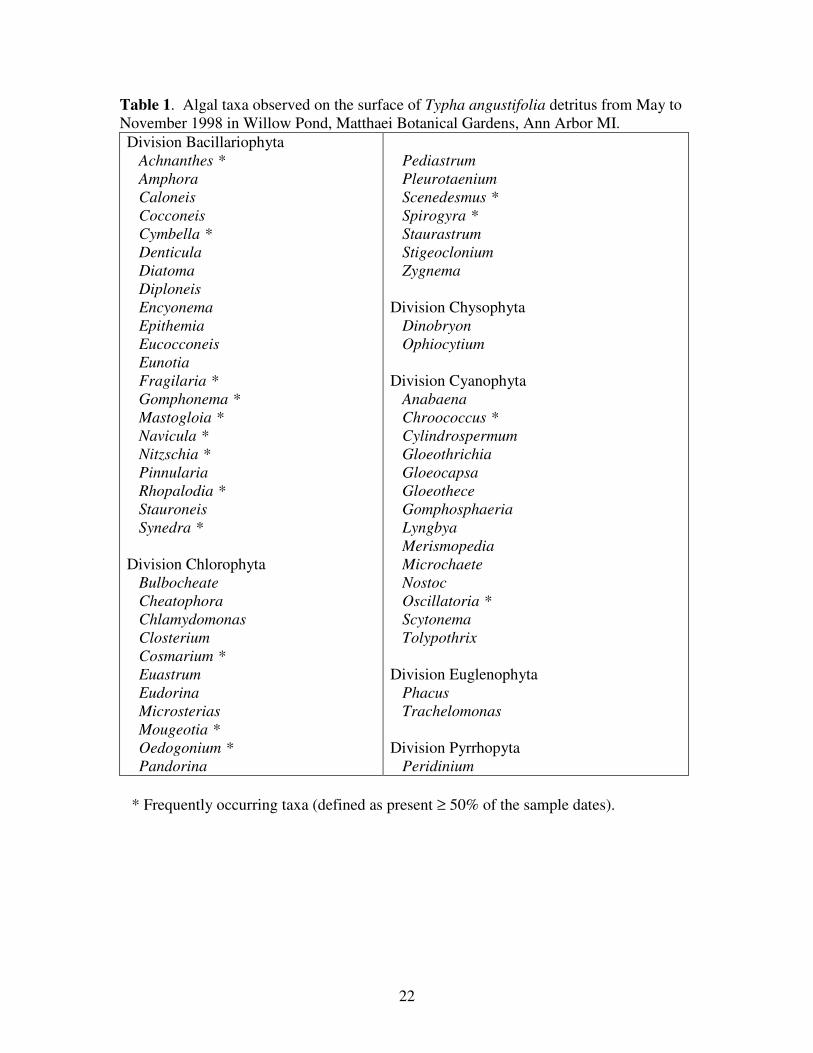
During the study period, 58 genera, representing 6 divisions (Table 1) of algae
and cyanobacteria were identified on T. angustifolia litter. Approximately 39% of the
taxa were diatoms (Bacillariophyta), 31% were green algae (Chlorophyta), and 24% were
cyanobacteria (Cyanophyta). Within these divisions, 16 genera occurred frequently and
were considered dominant taxa (defined as present on ≥ 50% of the sample dates).
Frequent diatom genera included Achnanthes, Cymbella, Fragilaria, Gomphonema,
Mastogloia, Navicula, Nitzschia, Rhopalodia, and Synedra. The most frequent green
algae were Cosmarium, Mougeotia, Oedogonium, and Spirogyra. The most frequently
occurring cyanobacteria consisted of Chroococcus and Oscillatoria.
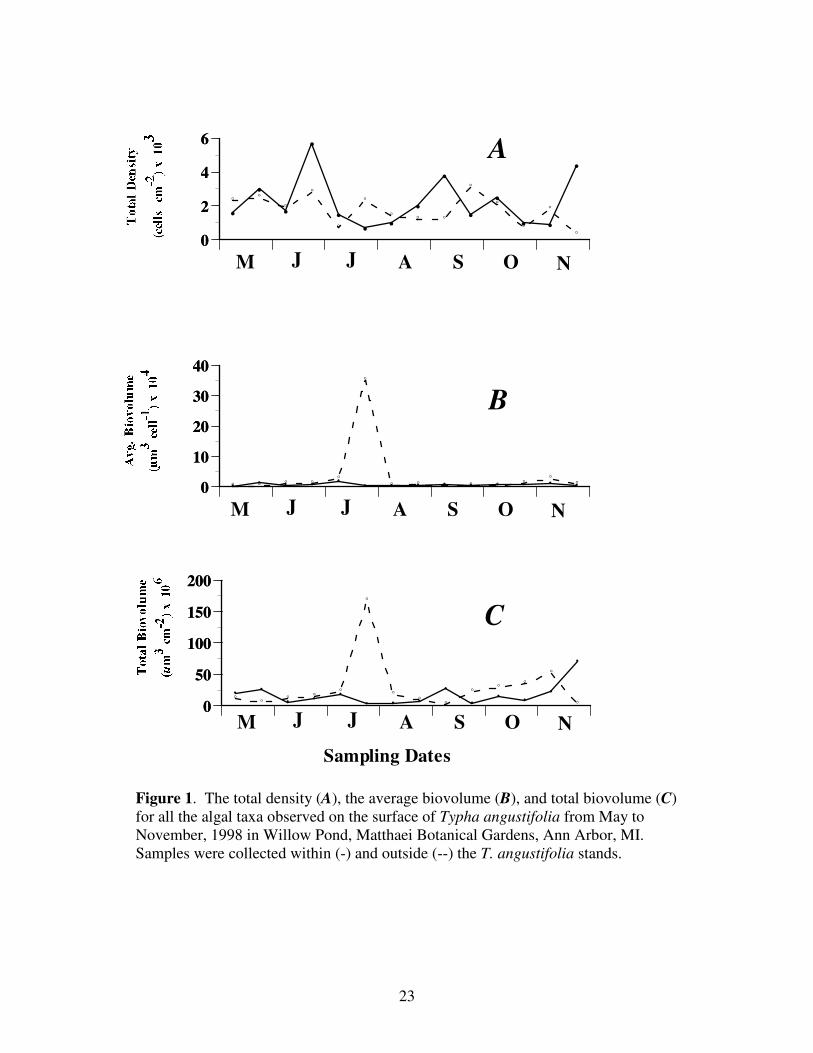
Figure 1 depicts the total density, average biovolume and the total biovolume for
all algal and cyanobacteria taxa observed during the study period of May-November.
22
Table 1. Algal taxa observed on the surface of Typha angustifolia detritus from May to
November 1998 in Willow Pond, Matthaei Botanical Gardens, Ann Arbor MI.
Division Bacillariophyta
Achnanthes *
Amphora
Caloneis
Cocconeis
Cymbella *
Denticula
Diatoma
Diploneis
Encyonema
Epithemia
Eucocconeis
Eunotia
Fragilaria *
Gomphonema *
Mastogloia *
Navicula *
Nitzschia *
Pinnularia
Rhopalodia *
Stauroneis
Synedra *
Division Chlorophyta
Bulbocheate
Cheatophora
Chlamydomonas
Closterium
Cosmarium *
Euastrum
Eudorina
Microsterias
Mougeotia *
Oedogonium *
Pandorina
Pediastrum
Pleurotaenium
Scenedesmus *
Spirogyra *
Staurastrum
Stigeoclonium
Zygnema
Division Chysophyta
Dinobryon
Ophiocytium
Division Cyanophyta
Anabaena
Chroococcus *
Cylindrospermum
Gloeothrichia
Gloeocapsa
Gloeothece
Gomphosphaeria
Lyngbya
Merismopedia
Microchaete
Nostoc
Oscillatoria *
Scytonema
Tolypothrix
Division Euglenophyta
Phacus
Trachelomonas
Division Pyrrhopyta
Peridinium
* Frequently occurring taxa (defined as present ≥ 50% of the sample dates).
23
•
•
•
•
•• •
•
•
•
•
• •
•
° °
°
°
°
°
° ° °
°
°
°
°
°
0
2
4
6
0
2
4
6
• • • ••
• • • • • • • • •° ° ° °°
°
° ° ° ° ° °°
°0
10
20
30
40
0
10
20
30
40
••
• ••
• • •
•
••
••
•
°°
° °°
°
°°
°
°°
°
°
°0
50
100
150
200
0
50
100
150
200
A
B
C
Sampling Dates
A OM J J S N
A OM J J S N
A OM J J S N
Figure 1. The total density (A), the average biovolume (B), and total biovolume (C)
for all the algal taxa observed on the surface of Typha angustifolia from May to
November, 1998 in Willow Pond, Matthaei Botanical Gardens, Ann Arbor, MI.
Samples were collected within (-) and outside (--) the T. angustifolia stands.
24
The average density for taxa comprising the aforementioned divisions inside the Typha
stand averaged 134,588 cells ± 62,946 (SE) cm-2
over the course of the growing season.
Similarly, mean density outside Typha stands was 108,853 cells ± 47,705 cm-2
. The
combined algae-cyanobacteria density (both inside and outside) was significantly
affected by the sampling date (p=0.03), as well as the interaction of date and location
(p=0.05). Location, however, did not have a significant effect on total algae-
cyanobacteria density; i.e., inside and outside locations were not significantly different.
The average algae-cyanobacteria cell biovolume was 6,865 ± 32,119 and 33 x 103 ± 697
x 103 um
3 cell
-1 inside and outside the Typha stands, respectively. The average total
biovolume for the community within the Typha stand was 245 x 106 ± 251 x 10
6 and 136
x 103 ± 3,435 x 10
6 um
3 cm
-2 outside. In no instances were differences significant for
either the total or average biovolume between the interior and exterior samples. The
Shannon-Weiner Index of species diversity was 1.014 within the stand and 1.022 exterior
to the stand.
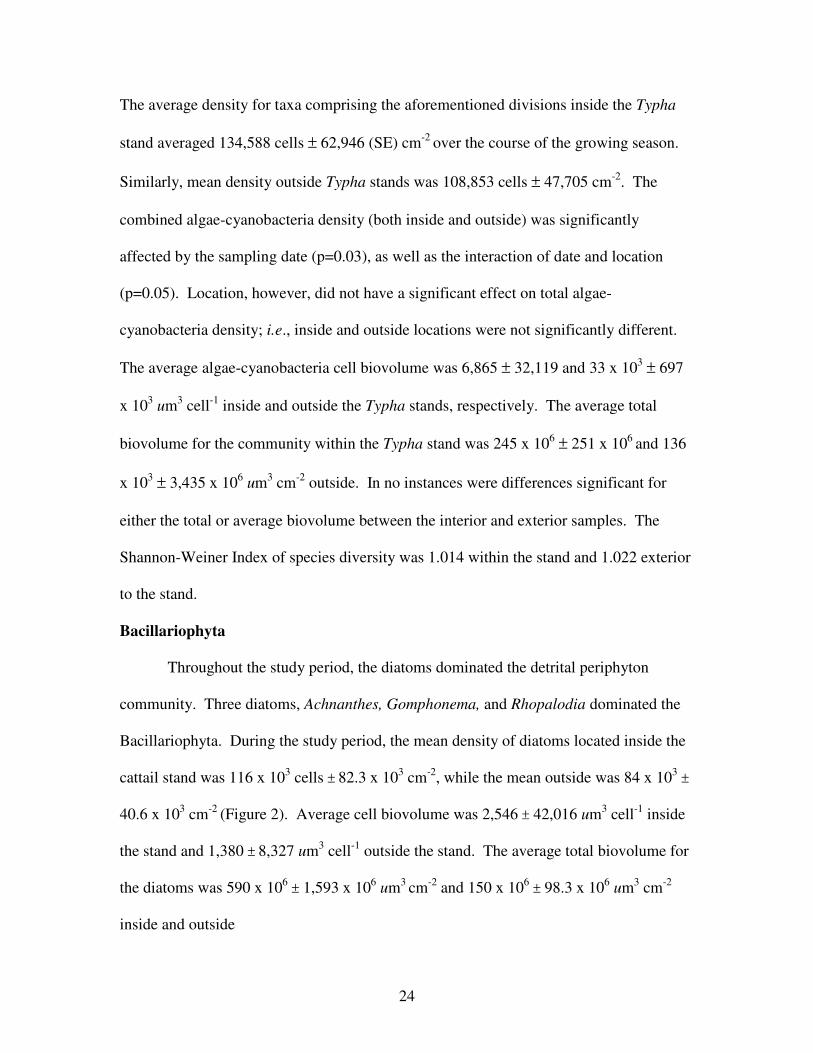
Bacillariophyta
Throughout the study period, the diatoms dominated the detrital periphyton
community. Three diatoms, Achnanthes, Gomphonema, and Rhopalodia dominated the
Bacillariophyta. During the study period, the mean density of diatoms located inside the
cattail stand was 116 x 103 cells ± 82.3 x 10
3 cm
-2, while the mean outside was 84 x 10
3 ±
40.6 x 103 cm
-2 (Figure 2). Average cell biovolume was 2,546 ± 42,016 um
3 cell
-1 inside
the stand and 1,380 ± 8,327 um3 cell
-1 outside the stand. The average total biovolume for
the diatoms was 590 x 106 ± 1,593 x 10
6 um
3 cm
-2 and 150 x 10
6 ± 98.3 x 10
6 um
3 cm
-2
inside and outside
25
•
•
•
•
•
••
•
•
•
•
• •
•
°°
°
°
°
°
° °
°
°
°
°
°
°0
10
20
30
40
0
10
20
30
40
•
•
••
•
•
••
•
•
•
•• •
°
°
°
°
° °
°
°
°
°
° °
°
°0
2
4
0
2
4
• • • • •• •
• ••
•• •
•
° ° °
°
°°
° ° °° °
° °°0
5
10
15
0
5
10
15
• • •
•
• • • ••
• • • • •° ° ° °° ° ° ° °
° ° °°
°0
3500
7000
0
3500
7000
• • • • • • • • • • • • • •° ° ° ° °
°
° ° ° ° ° ° ° °0
50000
100000
0
50000
100000
••
• • • • • ••
•• •
•
•
º º º ºº
ºº º º
ºº º º
º0
2000
4000
0
2000
4000
M J J A S NO M J J A S NO
M J J A S NO M J J A S NO
M J J A S NO M J J A S NO
Cyanophyta
Chlorophyta
Bacillariophyta
SAMPLING DATE
Bacillariophyta
Chlorophyta
Cyanophyta
Figure 2. Mean density and total biovolume of the dominant algae-cyanobacteria
divisions observed on the surface of Typha angustifolia. Samples were collected
inside (-) and outside (--) of T. angustifolia stands from May to November, 1998 in
Willow Pond, Matthaei Botanical Gardens, Ann Arbor, MI.
26
the Typha stands, respectively (Table 2). Differences between the outside and inside
diatoms were not significant (Table 3).
Maximum diatom density and biovolume occurred on June 24 inside of the Typha
stand. The mean density was 32,800 cells ± 263,083, the average cell biovolume was
13,684 ± 56,855 um3 cell
-1, and the total biovolume was 6,292 x 10
6 ± 5,768 x 10
6 um
3
cm-2
(Figure1). Outside the stand, however, maximum diatom density and total
biovolume occurred on September 16, (14.4 x 10⁴ ± 53,473 and 290 x 10
6 ± 193.6 x
106,
respectively), and the maximum average cell biovolume of 2,141 ± 5,038 um3 cm
-2
occurred on July 27.
Achnanthes was the most abundant diatom taxon both inside and outside of the
cattail stand with mean densities of 36,943 cells ± 33,309 and 25,289 cells ± 17,746,
respectively, over the season (Figure 3). Fragilaria, on the other hand, was the least
abundant dominant diatom within and outside of the cattail stand with a mean density of
1,036 cells ± 780 and 1,399 cells ± 808, respectively (Figure 3). The mean density of
Achnanthes reached a maximum on June 24 inside (137 x 103 cells ± 110 x 10
3) and on
June 10 outside (59 x 103 cells ± 26,880) of the cattail stand. Although Achnanthes was
the most abundant diatom in both locations, its small size resulted in low measures of
biovolume (Figure 4). In fact, at both locations, the presence of Achnanthes resulted in
both the lowest average cell biovolume and total biovolume, accounting for < 1% of the
Bacillariophyta. Within the Typha stand, average cell biovolume for Achnanthes was 18
± 2.08 um3 cell
-1, and the total biovolume was 624 x 10
3 ± 509 x 10
3 um
3 cm
-2. Outside
of the stand, the average cell biovolume of Achnanthes was 18.4 ± 2.2 um3 cell
-1, and
total biovolume was 457 x 103 ± 328 x 10
3 um
3 cm
-2.
27
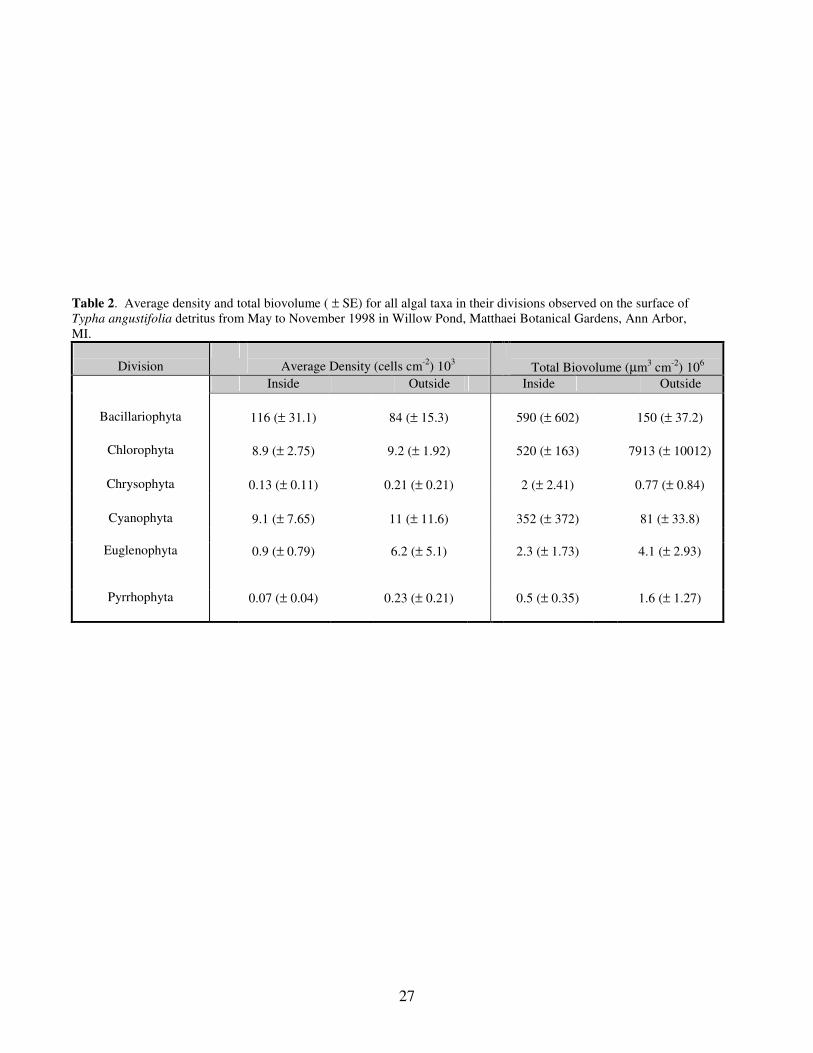
Table 2. Average density and total biovolume ( ± SE) for all algal taxa in their divisions observed on the surface of
Typha angustifolia detritus from May to November 1998 in Willow Pond, Matthaei Botanical Gardens, Ann Arbor,
MI.
Division
Average Density (cells cm-2
) 103
Total Biovolume (µm3 cm
-2) 10
6
Inside Outside Inside Outside
Bacillariophyta
116 (± 31.1)
84 (± 15.3)
590 (± 602)
150 (± 37.2)
Chlorophyta 8.9 (± 2.75) 9.2 (± 1.92) 520 (± 163) 7913 (± 10012)
Chrysophyta 0.13 (± 0.11) 0.21 (± 0.21) 2 (± 2.41) 0.77 (± 0.84)
Cyanophyta 9.1 (± 7.65) 11 (± 11.6) 352 (± 372) 81 (± 33.8)
Euglenophyta 0.9 (± 0.79) 6.2 (± 5.1)
2.3 (± 1.73) 4.1 (± 2.93)
Pyrrhophyta 0.07 (± 0.04) 0.23 (± 0.21) 0.5 (± 0.35) 1.6 (± 1.27)
28
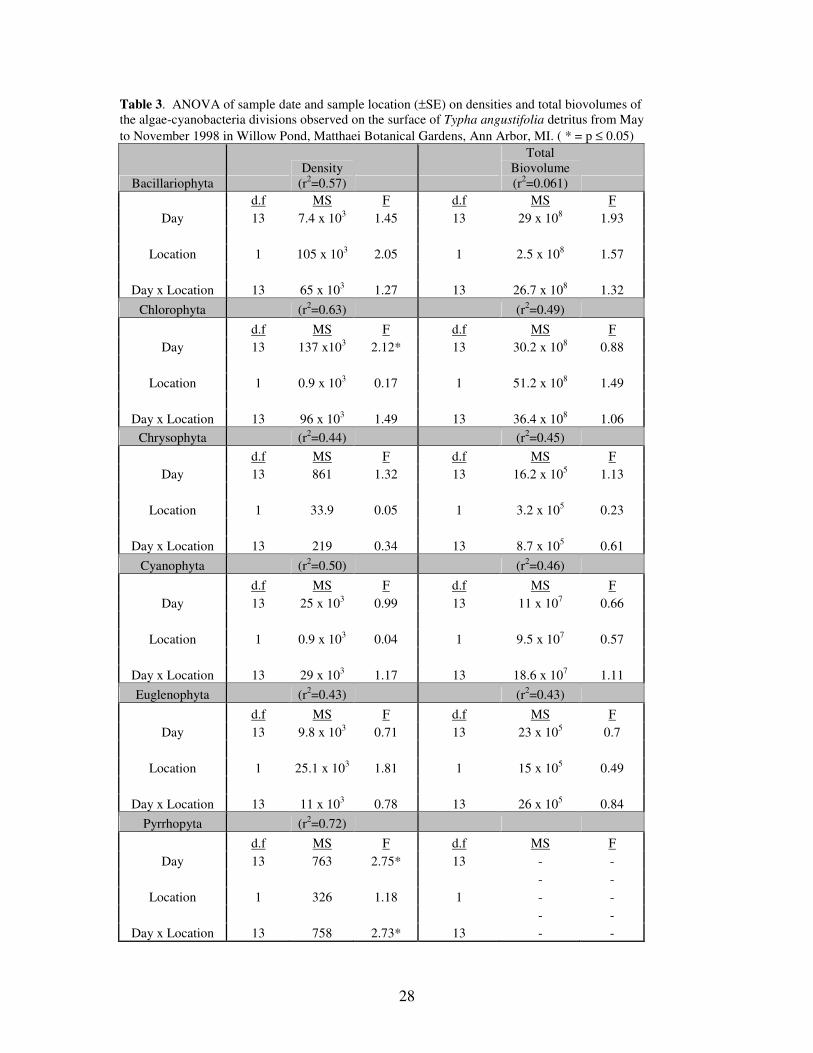
Table 3. ANOVA of sample date and sample location (±SE) on densities and total biovolumes of
the algae-cyanobacteria divisions observed on the surface of Typha angustifolia detritus from May
to November 1998 in Willow Pond, Matthaei Botanical Gardens, Ann Arbor, MI. ( * = p ≤ 0.05)
Bacillariophyta
Density
(r2=0.57)
Total
Biovolume
(r2=0.061)
d.f MS F d.f MS F
Day 13 7.4 x 10³ 1.45 13 29 x 10
8 1.93
Location 1 105 x 103 2.05 1 2.5 x 10
8 1.57
Day x Location 13 65 x 103 1.27 13 26.7 x 10
8 1.32
Chlorophyta (r2=0.63) (r
2=0.49)
d.f MS F d.f MS F
Day 13 137 x103 2.12* 13 30.2 x 10
8 0.88
Location 1 0.9 x 10³ 0.17 1 51.2 x 10
8 1.49
Day x Location 13 96 x 103 1.49 13 36.4 x 10
8 1.06
Chrysophyta (r2=0.44) (r
2=0.45)
d.f MS F d.f MS F
Day 13 861 1.32 13 16.2 x 10⁵ 1.13
Location 1 33.9 0.05 1 3.2 x 10⁵ 0.23
Day x Location 13 219 0.34 13 8.7 x 10⁵ 0.61
Cyanophyta (r2=0.50) (r
2=0.46)
d.f MS F d.f MS F
Day 13 25 x 103 0.99 13 11 x 10
7 0.66
Location 1 0.9 x 10³ 0.04 1 9.5 x 10
7 0.57
Day x Location 13 29 x 103 1.17 13 18.6 x 10
7 1.11
Euglenophyta (r2=0.43) (r
2=0.43)
d.f MS F d.f MS F
Day 13 9.8 x 10³ 0.71 13 23 x 10
5 0.7
Location 1 25.1 x 10³ 1.81 1 15 x 10
5 0.49
Day x Location 13 11 x 103 0.78 13 26 x 10
5 0.84
Pyrrhopyta (r2=0.72)
d.f MS F d.f MS F
Day 13 763 2.75* 13 - -
- -
Location 1 326 1.18 1 - -
- -
Day x Location 13 758 2.73* 13 - -
29
•
•
•
•
• • ••
•
• •• •
•°°
° °° °
° ° °
° °
° °°0
100
200
0
100
200Achnanthes
•• • •
•• • •
•
•
•
• ••° °
°
°
°
°
°
°°
°°
°
°
°0
5
10
0
5
10Chroococcus
••
• • • ••
•
•
•
•• • •
°
°
°°
°°
°°
°
°
°
°°
°0
5
0
5Cosmarium
•• •
•
• • • •
•
• • • • •°
°° ° °
° ° ° °°
° ° °°0
10
20
30
0
10
20
30Cymbella
•
•
••
• • • • • • • • • •
°°
° ° °
°
° ° ° ° ° ° ° °0
5
10
0
5
10Fragilaria
•• •
•
• • •
•• • •
• •
•
°° °
°°
° ° °°
° ° ° °°0
75
150
0
75
150
Gomphonema
M J J A S NO
SAMPLING DATE
• • •
•
• • • •
•
••
• ••° ° °
°° °
° ° °°
°
° ° °0
30
60
0
30
60•
• •
•• • • • • • • •
• •
°
° °°
° °°
° ° °
°° °
°0
15
30
0
15
30
•
•
•
•
• • • •
•
•
•
•• •
°°
°
°
°
°
°
°°
°
°°
°°
0
30
60
0
30
60
•
••
•
•
• •• •
• •• •
•°
°
° °°
° °° ° ° ° °
°
°0
10
0
10
• • •• • • •
•
• • • • • •° ° °
°
°
°
°° ° ° °
° ° °0
10
0
10
•
• •
•
•
•• •
•
•
•
• ••°
°°
°
° °
° °
°
°
°°
°
°0
10
20
0
10
20
• • • •
•
•
•
• • •
•
• • •° ° °
°
° °°
° ° °°
°
°
°0
5
0
5•
•
• • • • • •
•
• •• • •°
°° °
°°
°
°°
°
°
°
°°0
10
0
10
•
•
••
•• •
•• •
• • • •
° °
°° °
°°
°
°
° °°
°
°0
10
20
0
10
20
M J J A S NO M J J A S NO M J J A S NO
M J J A S NO M J J A S NO M J J A S NO
M J J A S NO
M J J A S NO M J J A S NO M J J A S NO
Mastogloia
Navicula Oedogonium Oscillatoria
Rhopalodia Scenedesmus Spirogyra Synedra
•• •
•
••
•
• • ••
• •
•
°
°°
°
°°
°
°
°
°
°
°
°
°0
15
30
0
15
30Nitzschia
M J J A S NO
M J J A S NO
M J J A S NOM J J A S NO
M J J A S NO
Mougeotia
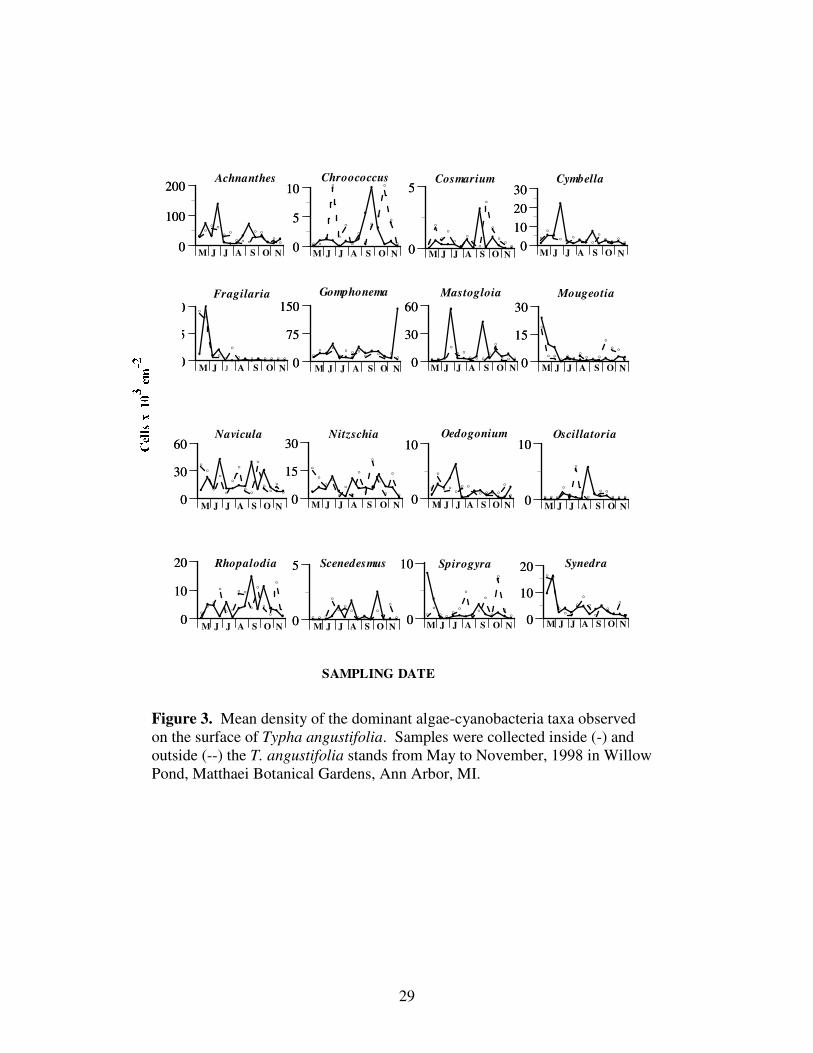
Figure 3. Mean density of the dominant algae-cyanobacteria taxa observed
on the surface of Typha angustifolia. Samples were collected inside (-) and
outside (--) the T. angustifolia stands from May to November, 1998 in Willow
Pond, Matthaei Botanical Gardens, Ann Arbor, MI.
30
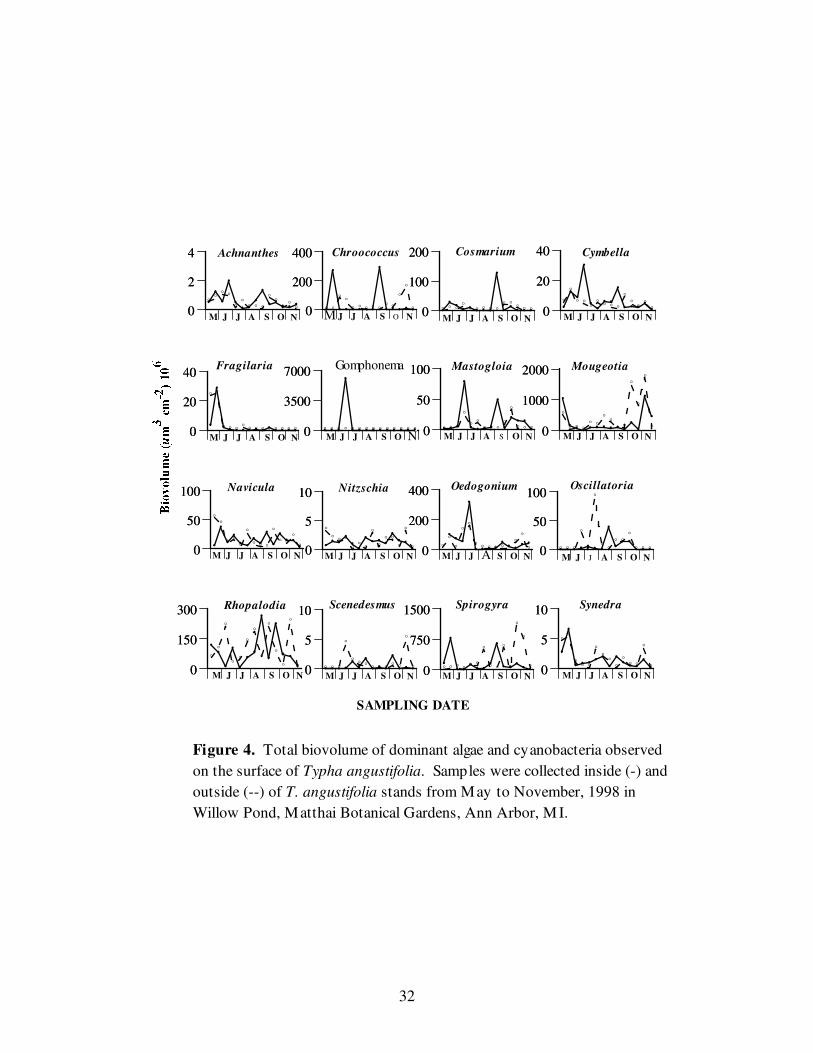
The dominant diatom (cellular and total biovolume) was Gomphonema with both
the highest average cell biovolume and total biovolume inside the cattail stand of 20,065
± 72,638 um3 cell
–1 and 443,323 x 10
3 ± 1,604,386 x 10
3 um
3 cm
-2, respectively.
Although Gomphonema had the greatest cellular and total biovolume inside of the cattail
stand, Rhopalodia dominated outside of the stand, with a mean cell biovolume of 19,162
± 3,784 um3 cell
–1and a total biovolume, 99,542 x 10
3 ± 90,435 x 10
3 um
3 cm
-2 (Figure
4). On June 24, the average cell biovolume and total biovolume of Gomphonema reached
maxima of 272 x 103 ± 273 x 10
3 um
3 cell
–1 and 6,027,456 x 10
3 ± 5,992,520 x 10
3 um
3
cm-2
, respectively. The maximum average cell biovolume for Rhopalodia of 24,307 ±
697 um3 cell
–1 was reached on May 27 within the stand, while the maximum mean total
biovolume of 236,220 x 103 ± 227,254 x 10
3 um
3 cm
-2 was reached outside on October
29.
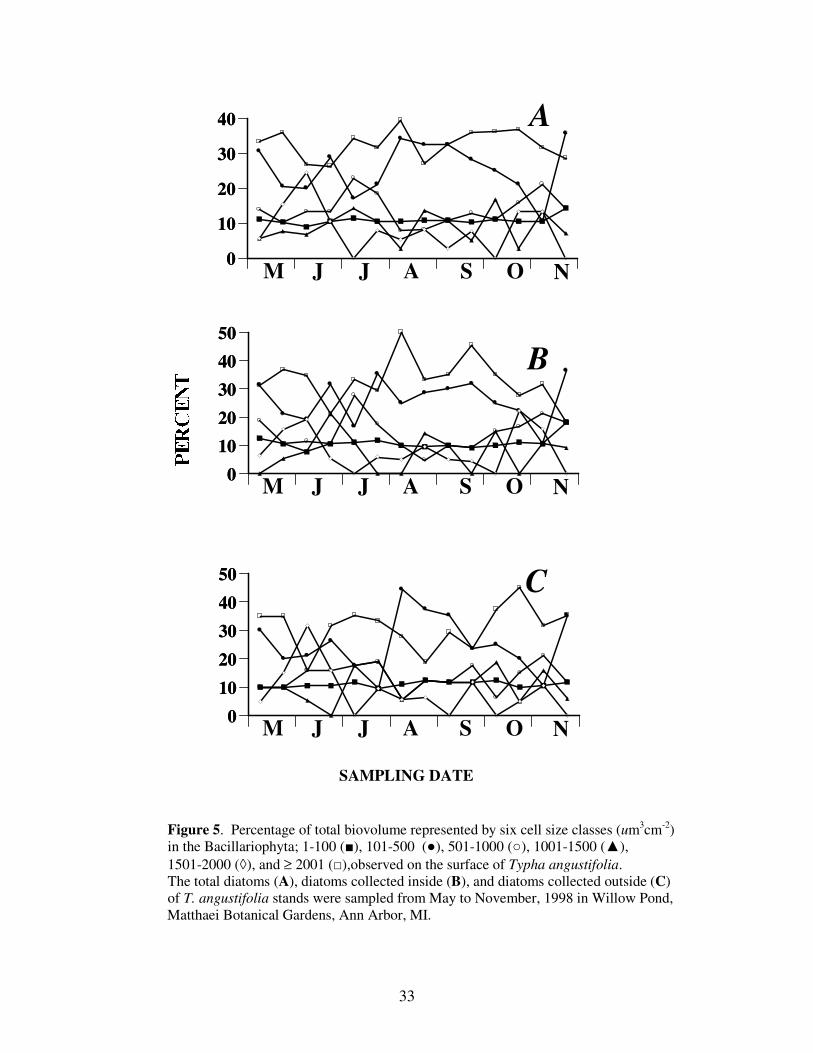
Although the densities of the smaller diatom Achnanthes were many times that of
the larger diatoms, the larger diatoms accounted for much more biovolume. Throughout
the study period, the largest size class of diatoms (≥ 2001 um3 cm
-2) typically accounted
for more than 30% of the diatom biovolume (Figure 5), and the percentage of the smallest
size class (1-100) remained nearly constant at approximately 10%.
Although no significant differences were found for the diatoms examined as a
division, two significant differences were found when the diatom genera were examined
separately (Table 4). The sampling date significantly affected (p≥0.05) the density and
total biovolume of Fragilaria and Synedra. The interaction of date and location
significantly affected Navicula.

31
32
•
•
•
•
•• •
•
•
• •• • •°
°° °
°°
° ° °
°°
° °°0
2
4
0
2
4
•
•
• • • • • •
•
• • • • •° °
° °° ° ° ° °
° °
°
°
°0
200
400
0
200
400
•• •
• • • • •
•
••
• • •° ° °°
° ° ° ° °° ° ° ° °0
100
200
0
100
200
•
••
•
••
• •
•
• • ••
•°
°
° °°
° ° ° °
°°
°°
°0
20
40
0
20
40
•
•
• • • • • • • • • • • •
° °
° ° ° ° ° ° ° ° ° ° ° °0
20
40
0
20
40
• • •
•
• • • • • • • • • •° ° ° ° ° ° ° ° ° ° ° ° ° °0
3500
7000
0
3500
7000
• • •
•
• • • •
•
•
• • ••° ° °
°
° °° ° °
°
°
° ° °0
50
100
0
50
100
•
• • • • • • • • ••
•
•
•°
° ° °° °
°°
° °
°
°
°
°0
1000
2000
0
1000
2000
•
•
••
• ••
•
•
•
•• •
•
°°
° °°
°
° ° °
°
° °°
°0
50
100
0
50
100
•• •
••
•
•• • •
•• •
•
°° ° °
°° °
°
°° °
°
°
°0
5
10
0
5
10
•• •
•
• • • ••
• •• •
°°
°
°°
° ° ° ° ° °°
°
°0
200
400
0
200
400
• • • • • • •
•
•• •
• • •° ° °
°
°
°
°°
° °°
° ° °0
50
100
0
50
100
••
•
•
•
••
•
•
•
• ••
°°
°
°°
°
°
°
°
°
°
°
°0
150
300
0
150
300
• • • ••
••
• • •
•
• • •° ° °
°
° ° ° ° ° ° ° °
°
°0
5
10
0
5
10
•
•
• ••
• ••
•
• • •• •° ° ° ° ° °
°
° °
°
°
°
°
°0
750
1500
0
750
1500
•
•
• • • • •
•
•• • •
••
°°
°° °
°°
°°
°° °
°
°0
5
10
0
5
10
M J J A S NO M J J A S NO M J J A S NO M J J A S NO
M J J A S NO M J J A S NO M J J A S NO M J J A S NO
M J J A S NO M J J A S NO M J J A S NO M J J A S NO
M J J A S NO M J J A S NO M J J A S NO M J J A S NO
Chroococcus Cosmarium Cymbella
Fragilaria Gomphonema Mastogloia Mougeotia
Navicula Nitzschia Oedogonium Oscillatoria
Rhopalodia Scenedesmus Spirogyra Synedra
SAMPLING DATE
Achnanthes
Figure 4. Total biovolume of dominant algae and cyanobacteria observed
on the surface of Typha angustifolia. Samples were collected inside (-) and
outside (--) of T. angustifolia stands from May to November, 1998 in
Willow Pond, Matthai Botanical Gardens, Ann Arbor, M I.
33
0
10
20
30
40
0
10
20
30
40
0
10
20
30
40
50
0
10
20
30
40
50
0
10
20
30
40
50
0
10
20
30
40
50
A
B
C
M J J A S NO
M J J A S NO
M J J A S NO
SAMPLING DATE
Figure 5. Percentage of total biovolume represented by six cell size classes (um
3cm
-2)
in the Bacillariophyta; 1-100 (■), 101-500 (●), 501-1000 (○), 1001-1500 (▲),
1501-2000 (◊), and ≥ 2001 (□),observed on the surface of Typha angustifolia.
The total diatoms (A), diatoms collected inside (B), and diatoms collected outside (C)
of T. angustifolia stands were sampled from May to November, 1998 in Willow Pond,
Matthaei Botanical Gardens, Ann Arbor, MI.
34
Chlorophyta
Although the Chlorophytes were not as abundant as the diatoms, both average cell
biovolume and mean total biovolume were greater. Although there were no statistically
significant differences, the Chlorophytes outside of the cattail stand were both greater in
mean cell biovolume and total biovolume than inside the stand. Inside the Typha stand,
the mean density for the growing season was 8,869 cells ± 7,268 cm-2
, while outside the
mean density was 9,225 ± 5,078 cm-2
(Table 2). Within the stand, the average cell
biovolume was 15,519 ± 47,014 um3 cell
–1 and the total biovolume was 520 x 10
6 ± 431
x 106 um
3 cm
-2. Outside of the stand, the average cell biovolume was 105,471 ±
1,272,130 um3 cell
–1 and the total biovolume was 7,913 x 10
6 ± 26,490 x 10
6 um
3 cm
-2.
Chlorophyta density ranged from 2,006-32,259 cells cm-2
inside and 1,033-19,762
cells cm-2
outside, reaching a maximum for both locations on May 13 (Figure 2).
Maximum average cell biovolume (59,295 ± 137,875 um3 cell
–1) of the Chlorophytes
occurred on July 8 inside the cattail stand. The maximum total biovolume inside was
reached on October 29 (1,206 x 106 ± 258 x 10
6 um
3 cm
-2). On July 27, both the
maximum average cell biovolume (1,150 x 106 ± 4.8 x 10
6 um
3 cell
–1) and the maximum
total biovolume (99,644 x 106 ± 99,300 x 10
6 um
3 cm
-2) (Figure 2) for the outside
community was reached. Although the density of the Chlorophyta varied significantly
among sampling dates, no other significant differences occurred between the
Chlorophytes inside and outside the Typha stand (Table 3).
Mougeotia was the most abundant green alga in the Chlorophyta for the growing
season, accounting for 44% and 42% of all Chlorophytes inside and outside the T.
angustifolia stand, respectively. The average density for Mougeotia inside the cattail
35
stand was 3,897 cells ± 5,129, while outside the density was 3,852 ± 4,265 cells cm-2
.
Although mean density for Mougeotia was similar both outside and inside the cattail
stand, the maximum density occurred within the stand (23,540 ± 11,333 cells cm-2
) on
May 13 (Figure 3). The maximum average cell biovolume and total biovolume (Figure
4) within the stand was reached on October 29 (306,302 ± 117,291 um3 cell
–1 and 1,105
x 106 ± 1050 x 10
6 um
3 cm
-2, respectively).
The maximum mean density for Mougeotia outside of the stand (17,437 cells cm-2
± 6,393) occurred on May 13 (Figure 3). On October 29, the mean biovolume and total
biovolume reached maxima of 609 x 103 ± 328 x 10
3 um
3 cell
–1 and 1,716 x 10
6 ± 1,171
x 106, um
3 cm
-2, respectively.
Inside the cattail stand, Oedogonium had the second greatest mean density and
biovolume after Mougeotia, and was followed by Spirogyra and Cosmarium, respectively
(Figures 3 & 4). Outside of the stand, Spirogyra had the second greatest mean density
(Figure 3), average biovolume and total biovolume (Figure 3) followed by Oedogonium.
Cosmarium had the lowest numbers of the four dominant Chlorophytes.
Interestingly, while Cosmarium was the least abundant green alga in density and
biovolume, it was the only Chlorophyta where both the sampling date, as well as the
interaction between the sample date and location, had a significant effect on the density
(Table 4). However, this significant interaction can be explained by the observation that
Cosmarium, within the cattail stand, reached a maximum total biovolume on September 2
(Figure 4) that was at least 5 times greater than any other time or location during the
study period. Mougeotia density also varied among the sampling dates.
36
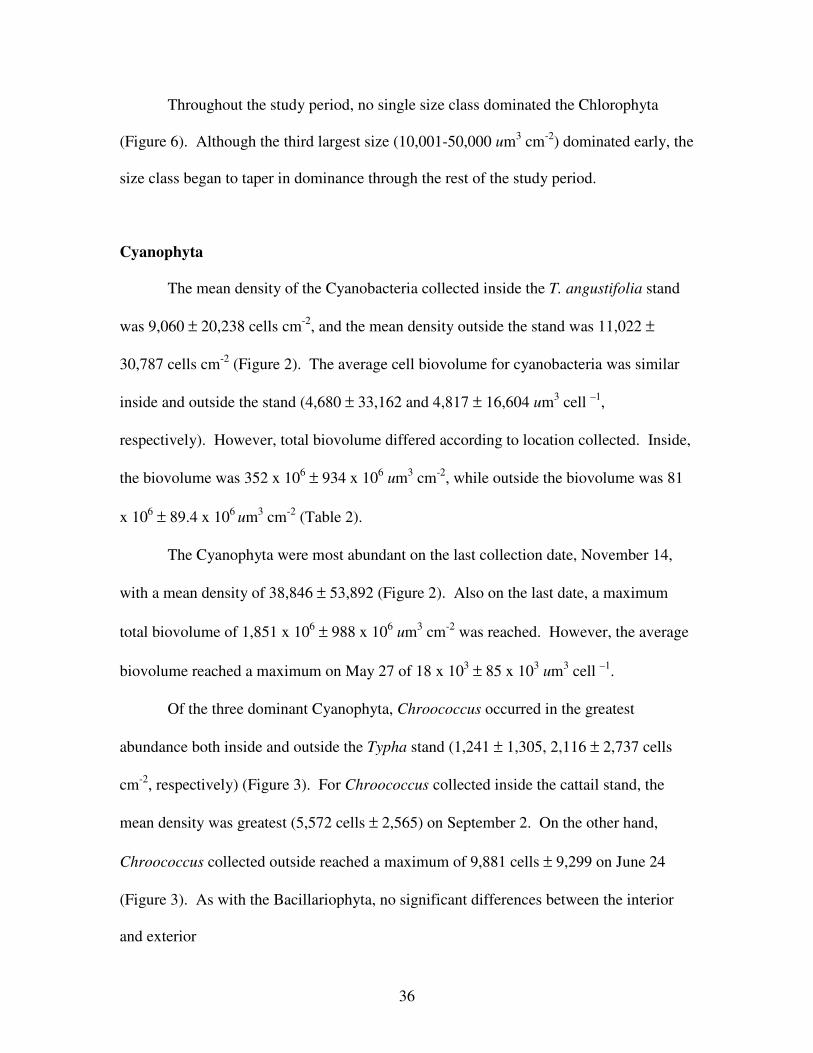
Throughout the study period, no single size class dominated the Chlorophyta
(Figure 6). Although the third largest size (10,001-50,000 um3 cm
-2) dominated early, the
size class began to taper in dominance through the rest of the study period.
Cyanophyta
The mean density of the Cyanobacteria collected inside the T. angustifolia stand
was 9,060 ± 20,238 cells cm-2
, and the mean density outside the stand was 11,022 ±
30,787 cells cm-2
(Figure 2). The average cell biovolume for cyanobacteria was similar
inside and outside the stand (4,680 ± 33,162 and 4,817 ± 16,604 um3 cell
–1,
respectively). However, total biovolume differed according to location collected. Inside,
the biovolume was 352 x 106 ± 934 x 10
6 um
3 cm
-2, while outside the biovolume was 81
x 106 ± 89.4 x 10
6 um
3 cm
-2 (Table 2).
The Cyanophyta were most abundant on the last collection date, November 14,
with a mean density of 38,846 ± 53,892 (Figure 2). Also on the last date, a maximum
total biovolume of 1,851 x 106 ± 988 x 10
6 um
3 cm
-2 was reached. However, the average
biovolume reached a maximum on May 27 of 18 x 103 ± 85 x 10
3 um
3 cell
–1.
Of the three dominant Cyanophyta, Chroococcus occurred in the greatest
abundance both inside and outside the Typha stand (1,241 ± 1,305, 2,116 ± 2,737 cells
cm-2
, respectively) (Figure 3). For Chroococcus collected inside the cattail stand, the
mean density was greatest (5,572 cells ± 2,565) on September 2. On the other hand,
Chroococcus collected outside reached a maximum of 9,881 cells ± 9,299 on June 24
(Figure 3). As with the Bacillariophyta, no significant differences between the interior
and exterior
37
0
10
20
30
40
50
60
0
10
20
30
40
50
60
010203040506070
010203040506070
0
10
20
30
40
50
60
0
10
20
30
40
50
60
SAMPLING DATE
M J J A S NO
M J J A S NO
M J J A S NO
A
B
C
Figure 6. Percentage of total biovolume represented by six cell size classes (um3cm
-2)
in the Chlorophyta; 1-2000 (■), 2001-10000 (●), 10001-50000 (○), 50001-100000 (▲),
100001-500000 (◊), and ≥ 500001 (□),observed on the surface of Typha angustifolia.
The total chlorophytes (A), those collected inside (B), and those collected outside (C)
of T. angustifolia stands were sampled from May to November, 1998 in Willow Pond,
Matthaei Botanical Gardens, Ann Arbor, MI.
38
samples occurred. No significant differences were found between the interior and
exterior samples for any genus of Cyanophyta.
In addition to being the most abundant cyanobacterium, Chroococcus was also the
largest (Figure 4). Inside the Typha stand, the average biovolume of Chroococcus was
3.7 x 10³ ± 122 x 10
3 um
3 cell
–1, while the total biovolume was 42.2 x 10
6 ± 101 x 10
6
um3 cm
-2. Outside the stand, the average biovolume of Chroococcus was 17,776 ±
35,253 um3 cell
–1, while the total biovolume was 322 x 10
6 ± 43.8 x 10
6 um
3 cm
-2. On
May 27, the average biovolume of Cyanophyta reached a maximum, as did the average
biovolume for Chroococcus collected inside the stand (45.8 x 10⁴ ± 45 x 10
4 um
3 cell
–1)
(Figure 4). And, similar to mean density, total biovolume for the Chroococcus collected
within the Typha stand reached a maximum (292 x 106 ± 275 x 10
6 um
3 cm
-2) on
September 2. Exterior to the Typha stand, the average Chroococcus biovolume reached a
maximum of 118 x 103 ± 117 x 10
3 um
3 cell
–1 on October 15. Similar to the Cyanophyta,
total biovolume for Chroococcus collected outside reached a maximum of 156 x 106 ±
55.2 x 10⁶ um
3 cm
-2 on October 29 (Figure 4).
Although Chroococcus was present on all but one sampling date, Oscillatoria was
observed on only eight sampling dates (Figure 3). The mean densities for Oscillatoria
were 697 ± 1,406 and 770 ± 1,295 inside and outside the Typha stand, respectively.
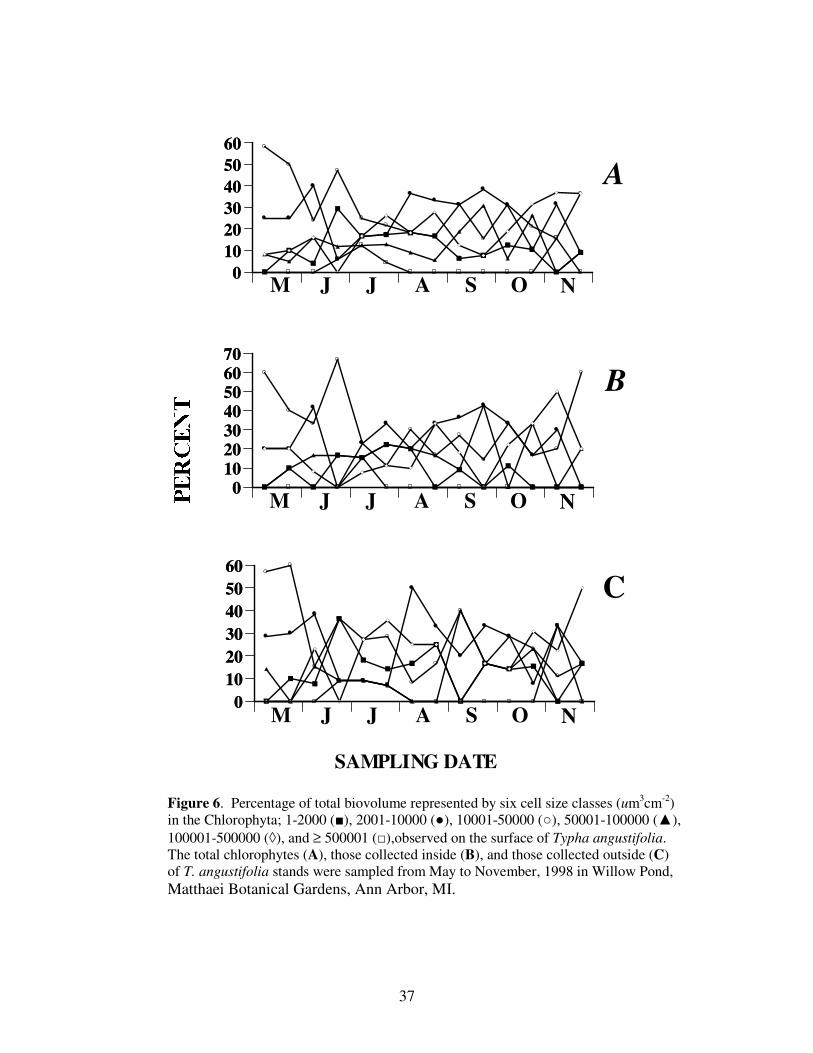
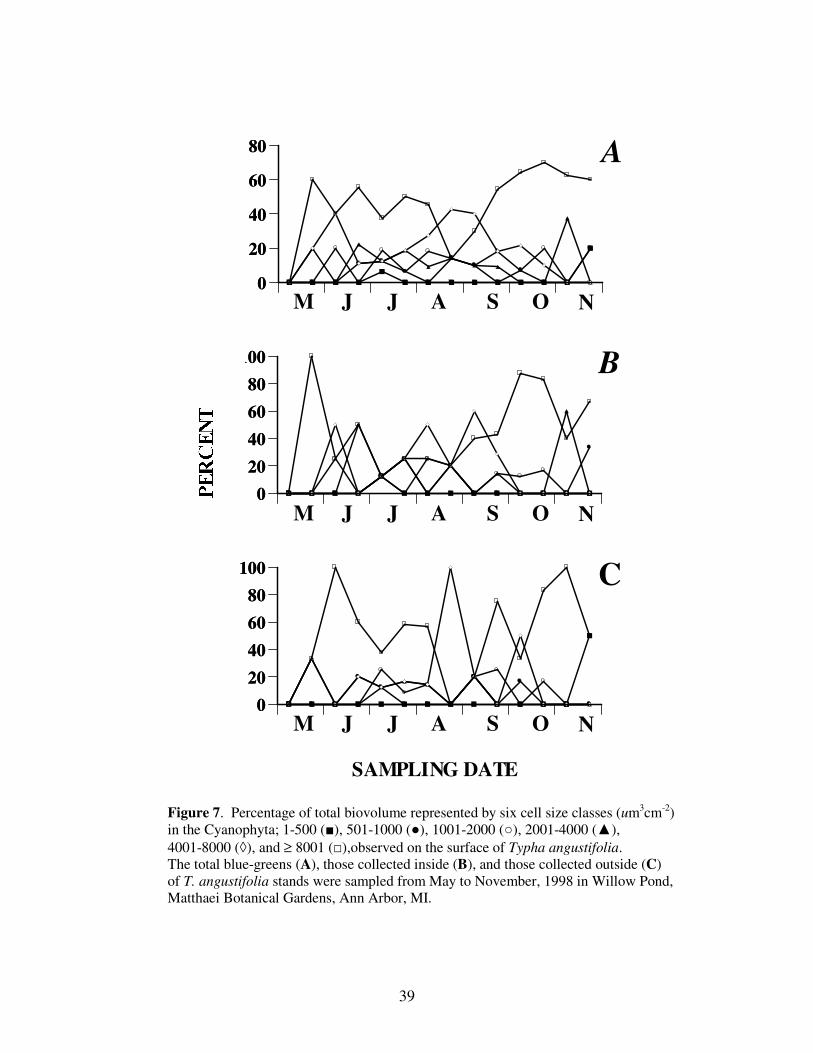
In a manner similar to the diatoms, the largest cell size class (≥ 8,001 um3 cm
-2)
dominated the Cyanophyta throughout the study period (Figure 7). When separated
according to collection site, the largest and second largest (4,001-8,000 um3 cm
-2) size
39
0
20
40
60
80
0
20
40
60
80
0
20
40
60
80
100
0
20
40
60
80
100
0
20
40
60
80
100
0
20
40
60
80
100
SAMPLING DATE
M J J A S NO
M J J A S NO
M J J A S NO
A
B
C
Figure 7. Percentage of total biovolume represented by six cell size classes (um3cm
-2)
in the Cyanophyta; 1-500 (■), 501-1000 (●), 1001-2000 (○), 2001-4000 (▲),
4001-8000 (◊), and ≥ 8001 (□),observed on the surface of Typha angustifolia.
The total blue-greens (A), those collected inside (B), and those collected outside (C)
of T. angustifolia stands were sampled from May to November, 1998 in Willow Pond,
Matthaei Botanical Gardens, Ann Arbor, MI.
40
classes dominated over the smaller sizes. In fact, the proportion of cyanobacteria small
size classes (1- 500 um3 cm
-2) was negligible. However, toward the end of the study
period, the second size class diminished dramatically and disappeared on the last
sampling date (November 14).
Cattail Stand Characteristics
Along a 30-meter transect within the study area, the average density of Typha spp.
was 55.25 plants m-2
in 1998 and 97.25 plants m-2
in 1997. The average surface area of
T. angustifolia (leaves & stems) observed at the study site was 2,507.85 cm2
plant-1
. The
potential surface area for periphyton attachment in 1998 (combining plants from both
1997 and 1998) was 381,193 cm2 m
-2 of the marsh. Algal densities calculated for the
entire cattail stand are approximate and based on the assumption that the observed
densities were representative of the study area. For example, using the observed densities
for Willow Pond, the potential density of Achnanthes, the most abundant alga observed,
would have been approximately 1.41 x 10¹⁰
m-2
on cattail tissue only,( i.e., not including
epipelic algae). The overall study site total biovolume of Gomphonema, the largest
diatom observed inside the stand, would have been approximately 1.69 x 10¹⁴
um3 m
-2
(Table 5). And, taken as a whole, the potential mean algae-cyanobacteria density within
the stand was approximately 5.03 x 10¹⁰
cm2 m
-2 and the total algae-cyanobacteria
biovolume was approximately 5.58 x 10¹⁴
um3 m
-2 inside the cattail stand (Table 5).
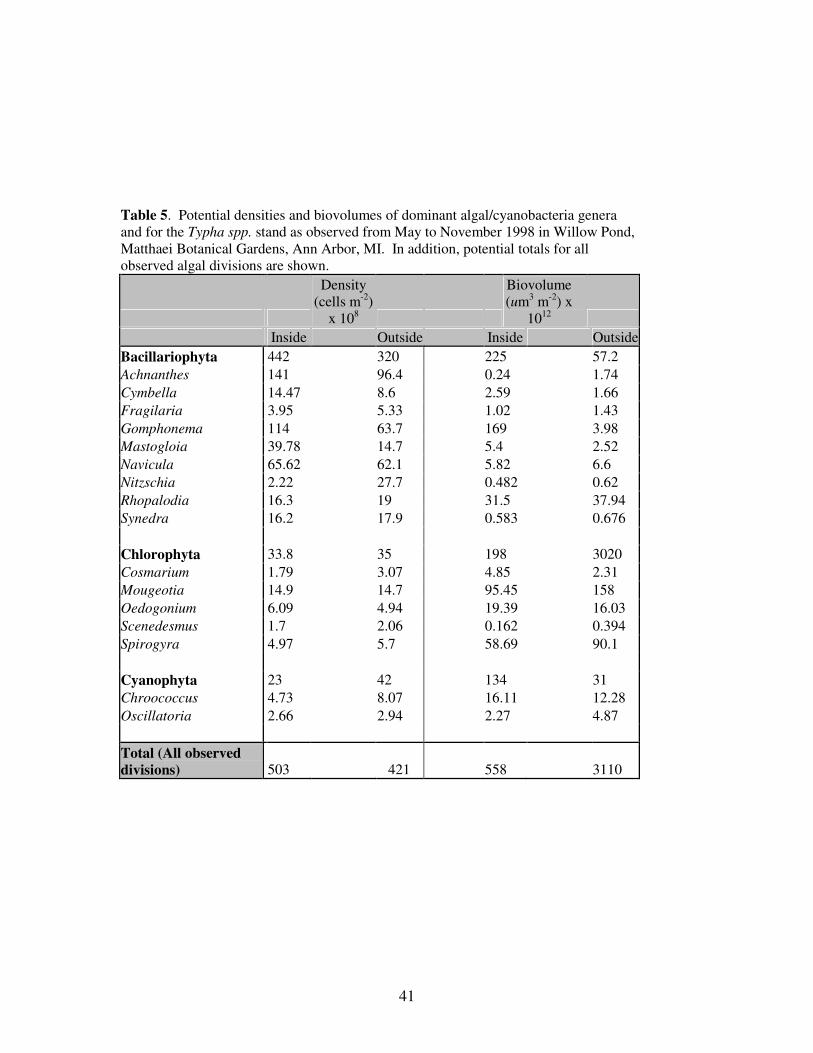
41
Table 5. Potential densities and biovolumes of dominant algal/cyanobacteria genera
and for the Typha spp. stand as observed from May to November 1998 in Willow Pond,
Matthaei Botanical Gardens, Ann Arbor, MI. In addition, potential totals for all
observed algal divisions are shown.
Density
(cells m-2
)
x 108
Biovolume
(um3 m
-2) x
1012
Inside Outside Inside Outside
Bacillariophyta 442 320 225 57.2
Achnanthes 141 96.4 0.24 1.74
Cymbella 14.47 8.6 2.59 1.66
Fragilaria 3.95 5.33 1.02 1.43
Gomphonema 114 63.7 169 3.98
Mastogloia 39.78 14.7 5.4 2.52
Navicula 65.62 62.1 5.82 6.6
Nitzschia 2.22 27.7 0.482 0.62
Rhopalodia 16.3 19 31.5 37.94
Synedra 16.2 17.9 0.583 0.676
Chlorophyta 33.8 35 198 3020
Cosmarium 1.79 3.07 4.85 2.31
Mougeotia 14.9 14.7 95.45 158
Oedogonium 6.09 4.94 19.39 16.03
Scenedesmus 1.7 2.06 0.162 0.394
Spirogyra 4.97 5.7 58.69 90.1
Cyanophyta 23 42 134 31
Chroococcus 4.73 8.07 16.11 12.28
Oscillatoria 2.66 2.94 2.27 4.87
Total (All observed
divisions) 503 421 558 3110
42
DISCUSSION
The many functions of periphyton in freshwater ecosystems have been well
established, including the significant roles they play in primary production, the filtration
of contaminants, and food chain support. Dead biomass and detrital litter have been
recognized as a potentially large substratum for periphyton development (Wetzel 1993),
although very few studies have examined periphyton upon detritus. Therefore, the
purpose of this study was to characterize the epiphytic autotroph community living upon
a detrital substratum (Typha angustifolia) in a freshwater wetland system.
Characterization included calculating the magnitude of the autotrophic component of the
epiphyton upon the detritus and the determination of the effects of season and sample
location.
Although only a few studies of detrital periphyton exist, the development of
periphyton upon living and artificial leaves has been closely examined. In one study, for
example, Burkholder and Wetzel (1989b) observed epiphytic algae upon living Scirpus
subterminalis. The epiphytic community they observed consisted of over 100 taxa and
represented 7 divisions. In other studies, Hoagland et al. (1982) observed 93 taxa
representing 23 genera of diatoms, Kaur and Mehra (1998) observed 50 taxa representing
7 divisions in a study comparing periphyton upon natural and artificial substrates, and a
total of 104 algal species representing 5 main algal groups were observed by Romo and
Galanti (1998) during their study of Trapa natans. Typha angustifolia detritus examined
from Willow Pond provided substrata for 58 genera of algae and cyanobacteria
representing 6 divisions (Table 1). In their study, Burkholder and Wetzel (1989b)
observed that diatoms made up 43% of the community and the Cyanobacteria made up
43
26%. Comparable to the aforementioned study, the detrital community observed from
Willow Pond consisted of 39% diatoms, 24% cyanobacteria and 31% green algae. The
most common genera observed in this study, including Achnanthes, Oedogonium, and
Chlorococcus, were observed in other similar studies of living, artificial and dead
substrata (Meulemans and Roos 1985, Burkholder and Wetzel 1989b, Burkholder and
Wetzel 1990, Kaur and Mehra 1998, Romo and Galanti 1998). Similar to other studies,
the diatoms observed in this study represented the most abundant of the six taxonomic
divisions observed. For example, throughout their 13-month study of epiphytic
communities upon submersed macrophytes, Hopsen et al. (1998) observed that diatoms
represented the greatest percentage of every sample site. During this study, the seasonal
average densities of the diatoms observed constituted approximately 87% of the algae
observed upon detritus outside the Typha stand and approximately 77% of those observed
within the stand. Chlorophyta or Cyanophyta were the 2nd
and 3rd
most dominant
divisions, respectively. Densities of these divisions were similar as observed outside and
within the cattail stand (Table 2).
The dominance of the diatoms observed in this study may be explained by first
reviewing the development of periphyton upon other substrata (e.g. artificial and living
plants). The development of the periphyton community upon solid substrata has been the
subject of much study (Hoagland et al. 1982, Korte and Blinn 1982, Meulemans and
Roos 1985, Burkholder and Wetzel 1989a, 1989b, Romo and Galanti 1998). Meulemans
and Roos (1985) described the epiphyton community as structured into three distinct
layers: the basal, the intermediate, and the uppermost layer. Hoagland et al. (1982)
described typical cell types within the three layers. Opportunistic algal cells within the
44
basal layer were adnate and having mucilaginous coats or producing short stalks. The
intermediate layer was comprised mostly of long-stalked diatoms and large rosettes of
diatoms, and the uppermost layer consisted primarily of filamentous green algae.
Therefore, because each of the layers of the community has the potential to be occupied
by diatoms, the diatoms would potentially be the most abundant. For example, during
this study, one of the dominant diatom genera observed was Navicula. Species of
Navicula are known to form mucilaginous coats (e.g. N. menisculus var. upsaliensis)
thereby attaching adnate to the substrate and likely found within the basal layer of
periphytic communities. Another dominant diatom genus observed in this study,
Gomphonema, includes species which produce both short and long stalks and, in doing
so, may be included in both the basal and intermediate layers. Three other dominant
diatom genera observed in this study, Fragilaria, Nitzschia, and Synedra produce
mucilaginous pads by which they form apical rosettes. The shorter rosettes of Fragilaria
and Nitzschia would be observed in the upper basal and lower intermediate layers, while
the lengthy rosettes of Synedra would be observed in the upper intermediate and lower
uppermost layers.
Although other studies observed distinct differences in the taxonomic makeup of
different substrata over time (Meulemans and Roos 1985, Burkholder and Wetzel 1990,
Burkholder and Wetzel 1989b, Kaur and Mehra 1998), no distinct successional patterns
were observed during this study. One explanation for the absence of distinct successional
patterns during this study is the method by which the study was conducted. Specifically,
while other studies have sampled periphyton using a controlled environment, artificial
substrates and living plants or other immobile substrata, this study used toppled leaves of
45
Typha angustifolia floating in Willow Pond without consideration of the age of the litter
collected. Therefore, because community development over time was not considered,
successional patterns for the entire detrital periphyton community of Willow Pond could
not be clearly distinguished and were not found in this study.
However, some of the algae and cyanobacteria observed in this study
demonstrated typical periphyton successional behaviors. For example, similar to other
studies, Fragilaria, which is considered to be an early opportunistic diatom (Korte and
Blinn 1982), was more abundant during the beginning of the study period (Figure 3).
Cosmarium, noted as a late successional alga (Romo and Galanti 1998), was observed in
greater abundance later in the growing season (Figure 3). In addition, although Synedra,
a genus usually observed toward the latter portions of community development (Korte
and Blinn 1982), was observed to be more abundant, as well as larger, during the
beginning of the study period (Figures 3 and 4), Meulemans and Roos (1985) observed
that the uppermost layer reached maximum development in May, which is the same
month Synedra was most abundant. Meulemans and Roos (1985), observed filamentous
green algae maxima during the month of May, which coincides with the abundance of
Mougeotia, Oedogonium, and Spirogyra at Willow Pond.
Although no distinct successional patterns were observed during this study, the
total algae-cyanobacteria density varied significantly over time as well as the interaction
of sample date and location. However, sample date only significantly affected the
densities of 2 of the 6 taxonomic divisions (Chlorophyta and Pyrrhopyta) and had no
significant affect on the total biovolume (Table 3). Nevertheless, when each dominant
genus was examined, sample date had a significant effect on the densities of Cosmarium,
46
Fragilaria, Mougeotia, and Synedra as well as the total biovolumes of Fragilaria and
Synedra (Table 4).
During the study period, light intensity was approximately four times higher
outside the Typha stand than within the stand. Although light is often limiting to
periphytic abundance and is an important contributor to the composition of the
periphyton community (Müller 1994, Meulemans and Roos 1985, Harrison and Hildrew
1998, Wellnitz and Ward 1998), no significant differences in density or biovolume
occurred between the locations for any dominant taxonomic division or genus observed
during this study. The different effects of light intensity on algal biomass, abundance,
species composition, and community structure may explain the lack of significant
differences between the two locations may be. For example, Meulemans and Heinis
(1981) observed that, although light intensity was higher outside a reed stand, periphyton
biomass was low. Furthermore, Meulemans (1988) described that the photosynthetic
capacity of epiphytic algae is strongly reduced during the summer and suggests that high
light intensities may inhibit algae during the spring months. And, Meulemans and Roos
(1985) observed that that self-shading by the uppermost layer of the periphyton has a
detrimental effect on the basal layer. Many studies suggest that ultraviolet radiation
penetrating the earth’s atmosphere can have a detrimental effect on periphyton
productivity, cause photoinhibition or alter the DNA structure of algae (Bothwell et al.
1993, Moeller 1994, Vinebrooke and Leavitt 1996, Buma et al. 1997). Kairesalo (1983)
found that in the spring, periphyton biomass declines due to the shading of macrophytic
growth. However, some algae are low-light adapted and may not be affected by shading
(Garcia and Purdie 1992, Veldhuis and Kraay 1993). Although light has been suggested
47
to affect periphytic algae species composition (Wellnitz and Ward 1998, Romo and
Galanti 1998), the Shannon-Weiner Index of species diversity for samples observed
inside and outside the T. angustifolia stand did not significantly differ (1.014 and 1.022,
respectively). Therefore, algal shade adaptation within the cattail stand, in combination
with possible photoinhibition effects outside of the stand, may have been enough to
suppress any significant differences in algal density or biovolume.
Similar to light, other environmental factors, specifically temperature and oxygen,
contribute to autotroph abundance in periphyton. Slight changes in temperature and light
intensity affect the availability of important elements such as oxygen and carbon and
temperature is the most important environmental factor that regulates oxygen
concentrations (Horne and Goldman 1994). Oxygen limitation alone may directly
influence both herbivore distribution and herbivory intensity. During our study, only
slight differences in temperature and dissolved oxygen were observed between the two
sample locations. Although herbivory was not quantified in this study, the observed
similar environmental conditions, in association with the lack of significant differences
between the locations, suggest that herbivory as well as temperature and oxygen had little
or no effect on the communities observed.
In freshwater wetlands, low herbivory, together with high productivity of
vegetation, results in large amounts of detrital biomass. Wetzel (1993) observed that the
standing-dead biomass, including detrital litter, potentially provides a very large surface
area of substrata where periphyton may flourish. Moreover, Wetzel and Neely (1997)
found that emergent plant litter provides surface area upon which complex microbiota
communities may develop and produce intense autotrophic activity. The is study is no
48
exception to the aforementioned observations. The average surface area of T.
angustifolia at the study area, for instance, was 2,507.85 cm-2
per plant. And, similar to
the observations of Burkholder and Wetzel (1989b) and Romo and Galanti (1998) of
periphyton on living leaves, this study demonstrated that detritus provides an ample
substratum for an enormous amount of periphyton. For example, considering the surface
area of the average T. angustifolia observed during this study and using only the diatom
densities observed within the cattail stand, the potential number of diatoms per plant
would be nearly 3 billion. Furthermore, the potential diatom density would be over 76
billion cells m-2
upon the total surface area of T. angustifolia for periphyton at the study
area.
In summary, T. angustifolia detritus was observed to provide ample substratum
for an enormous amount of periphytic algae and cyanobacteria. Although algal-
cyanobacteria density was significantly affected by location and sample date, two factors
considered to be of importance, algal-cyanobacteria biovolume was not significantly
affected. In addition, observations in this study provided no clear evidence to
demonstrate periphyton community development. However, while other studies of
periphyton community development utilized static substrata (both natural and artificial),
this study sampled litter in a natural dynamic environment. Furthermore, timing of litter
deposition was not considered in this study. Therefore, the lack of significant evidence
to demonstrate periphyton community development suggests that the age (time of
deposition) and state (static vs. dynamic) of the litter (or substrate) may be important
considerations in studies of the autotrophic component in periphyton.
49
LITERATURE CITED
Allen HL. 1971. Primary productivity, chemo-organotrophy, and nutritional interactions
of epiphytic algae and bacteria on macrophytes in the littoral of a lake.
Ecological Monographs 41:97-126.
Blinn DW, 1993. Diatom community structure along physicochemical gradients in saline
lakes. Ecology 74:1246-1263.
Bothwell ML, Sherbert D. 1993. Influence of natural ultraviolet radiation on lotic
periphytic diatom community growth, biomass accrual and species composition:
short-term versus long-term effects. Journal of Phycology 29:24-35.
Burkholder JM, Wetzel RG. 1989. Epiphytic microaglae on natural substrata in a
hardwater lake: seasonal dynamics of community structure, biomass and ATP
content. Archiv Für Hydrobiologie, Suppl. 83 1:1-56.
Burkholder JM, Wetzel RG. 1989. Microbial colonization on natural and artificial
macrophytes in a phosphorus-limited hardwater lake. Journal of Phycology
25:55-65.
Cattaneo A, Kalff J. 1979. Primary production of algae growing on natural and artificial
aquatic plants: A study of interactions between epiphytes and their substrate.
Limnology and Oceanography 24:1031-1037.
Cattaneo A, Kalff J. 1980. The relative contribution of aquatic macrophytes and their
epiphytes to the production of macrophyte beds. Limnology and Oceanography
25:280-289.
Cronk JK, Mitsch WJ. 1994. Periphyton productivity on artificial and natural surfaces in
constructed freshwater wetlands under different hydrologic regimes. Aquatic
Botany 48:325-341.
Dilly O, Irmler U. 1998. Succession in the food web during the decomposition of leaf
litter in a black alder (Alnus glutinosa (Gaertn.) L.) forest. Pedobiologia 42:109-
123.
Findlay S, Howe K, Austin HK. 1990. Comparison of detritus dynamics in two tidal
freshwater wetlands. Ecology 71:288-295.
Findlay SEG, Arsuffi TL. 1989. Microbial growth and detritus transformations during
composition of leaf litter in a stream. Freshwater Biology 21:261-269.
Findlay S, Howe K, Fontvielle D. 1993. Bacterial-algal relationships in streams of the
Hubbard Brook Experimental Forest. Ecology 74:2326-2336.
50
Fingerhut U, Soeder, Jülich CJ. 1984. Growth and acetate utilization of Scenedesmus
falcatus and Pseudomonas aeruginosa in axenic and mixed continuous cultures.
Archiv Für Hydrobiologie Beib. Ergebn. Limnol. 19:281-287.
Francoeur SN, Lowe RL. 1998. Effects of ambient ultraviolet radiation on littoral
periphyton: biomass accrual and taxon-specific responses. Journal of Freshwater
Ecology 13:29-37.
Garcia, VMT, Purdie DA. 1992. The influence of irradiance on growth, photosynthesis
and respiration of Gyrodinium cf. aureolum. Journal of Plankton Research
14:1251-1265.
Grimshaw HJ, Wetzel RG, Brandenburg M, Segerblom K, Wenkert LJ, Marsh GA,
Charnetzky W, Haky JE, Carraher C. 1997. Shading of periphyton communities
by wetland emergent macrophytes: Decoupling of algal photosynthesis from
microbial nutrient retention. Archiv Für Hydrobiologie 139:17-27.
Haines DW, Rogers KH, Rogers FEJ. 1987. Loose and firmly attached epiphyton: their
relative contributions to algal and bacterial carbon productivity in a Phragmites
marsh. Aquatic Botany 29:169-176.
Hoagland KD, Roemer SC, Rosowski JR. 1982. Colonization and community structure
of two periphyton assemblages, with emphasis on the diatoms
(Bacillariophyceae). American Journal of Botany 69:188-213.
Hopson MS, Zimba PV, Phlips EJ, Fernades CA, Davis JS. 1998. Temporal variations
in biomass of the algal epiphytes associated with the dominant submersed
macrophytes in Lake Okeechobee, Florida (USA). Verh. Internat. Nerein.
Limnol. 26:1716-1720.
Horne AJ, Goldman CR. 1994. Limnology, 2nd
Edition. McGraw-Hill Inc. New York.
Kairresalo T. 1983. Dynamics of epiphytic communities on Equisetum fluviatile L.
Response to short-term variation in environmental conditions. Periphyton of
Freshwater Ecosystems. Wetzel RG (ed.), Dr W. Junk Publishers. The Hague.
Kaur P, Mehra NK. 1998. Laboratory studies on the colonization and succession
patterns of periphytic microbiota on artificial and natural substrates. Verh.
Internat. Verein. Limnol. 26:1614-1620.
Komínková D, Kuehn KA, Büsing K, Steiner D, Gessner MO. 2000. Microbial biomass,
growth, and respiration associated with submerged litter of Phragmites australis
decomposing in a littoral reed stand of a large lake. Aquatic Microbial Ecology
22: 271-282.
51
Korte VL and Blinn DW. 1983. Diatom colonization on artificial substrata in pool and
riffle zones studied by light and scanning electronic microscopy. Journal of
Phycology 19:332-341.
Kühl M, Glud RN, Ploug H, Ramsing NB. 1996. Microenvironmental control of
photosynthesis and photosynthesis-coupled respiration in an epilithic
cyanobacterial biofilm. Journal of Phycology 32:799-812.
Lakatos G, Grigorszky, Birό P. 1998. Reed-periphyton complex in the littoral of shallow
lakes. Verh. Internat. Verein. Limnol. 26:1852-1856.
Mann CJ, Weztel RG. 1996. Loading and utilization of dissolved organic carbon from
emergent macrophytes. Aquatic Botany 53:61-72.
McCormick PV, Shuford III RBE, Backus JG, Kennedy WC. 1998. Spatial and seasonal
patterns of periphyton biomass and productivity in the northern Everglades,
Florida, U.S.A. Hydrobiologia 362:185-208.
Meulemans JT, Heinis F. 1983. Biomass and production of periphyton attached to dead
reed stems in Lake Maarsseveen. Periphyton of Freshwater Ecosystems. Wetzel
RG (ed.), Dr W. Junk Publishers. The Hague.
Meulemans JT, Roos PJ. 1985. Structure and architecture of the periphytic community
on dead reed stems in Lake Maarsseveen. Archiv Für Hydrobiologie 102:487-
502.
Meulemans JT. 1988. Seasonal changes in biomass and production of periphyton
growing upon reed in Lake Maarsseveen I. Archiv Für Hydrobiologie 112:21-42.
Moeller RE, Burkholder JM, Wetzel RG. 1988. Significance of sedimentary phosphorus
to a rooted submersed macrophyte (Najas flexilis (Willd.) Rost. and Schmidt) and
its algal epiphytes. Aquatic Botany 32:261-281.
Moeller RE. 1994. Contribution of ultraviolet radiation (UV-A, UV-B) to
photoinhibition of epilimnetic phytoplankton in lake of differing UV
transparency. Archiv Für Hydrobiologie Belh Ergeben. Limnol. 43:157-170.
Müller U. 1994. Seasonal development of epiphytic algae on Phragmites australis
(Cav.) Trin. Ex Stein. in a eutrophic lake. Archiv Für Hydrobiologie 129:273-
292.
Murkin, E.J., H.R. Murkin, and R.D. Titman. 1992. Nektonic invertebrate abundance and
distribution at the emergent vegetation - open water interface in the Delta Marsh,
Manitoba, Canada. Wetlands 12:45-52.
52
Neely RK, Baker JL. 1989. Nitrogen and phosphorus dynamics and the fate of
agricultural runoff. Northern Prairie Wetlands, van der Valk AG (ed.) Iowa State
University Press, Ames, Iowa.
Neely RK. 1994. Evidence for positive interactions between epiphytic algae and
heterotrophic decomposers during the decomposition of Typha latifolia. Archiv
Für Hydrobiologie 129:443-57.
Neely RK, Wetzel RG. 1995. Simultaneous use of 14
C and 3H to determine autotrophic
production and bacterial protein production in periphyton. Microbial Ecology
30:227-237.
Neely RK, Wetzel RG. 1997. Autumnal production by bacteria and autotrophs attached
to Typha latifolia L. detritus. Journal of Freshwater Ecology 12:253-267.
Newell SY. 2001. Fungal biomass and productivity in standing-decaying leaves of black
needlerush (Juncus roemerianus). Marine Freshwater Research 52:249-255.
Pinckney JL, Micheli F. 1998. Microalgae on seagrass mimics: does epiphyte
community structure differ from live seagrasses? Journal of Experimental Marine
Biology and Ecology 221:59-70.
Polunin NVC. 1984. The decomposition of emergent macrophytes in freshwater.
Advanced Ecology Research 14:155-166.
Prescott GW. 1979. How to know freshwater algae. 3rd
Edition. Wm. C. Porown
Company Publishers. Dubuque, Iowa.
Romo S, Galanti G. 1998. Vertical and seasonal distribution of epiphytic algae on water
chestnut (Trapa natans). Archiv Für Hydrobiologie 141:483-504.
Stock MS, Ward AK. 1989. Establishment of a bedrock epilithic community in a small
stream: microbial (algal and bacterial) metabolism and physical structure.
Canadian Journal Fisheries and Aquatic Sciences 46:1874-1883.
Väätänen P, Sundquist J. 1977. Microbial cellulolytic activity of the brackish water in
the Tvärminne area, Northern Baltic Sea. Int. Revue. ges. Hydrobiol. 62: 797-
804.
Veldhuis MJW, Kraay GW. 1993. Cell abundance and fluorescence of picoplankton in
relation to growth irradiance and nitrogen availability in the Red Sea.
Netherlands Journal of Sea Research 31:135-145.
Weitzel RL. 1979. Periphyton measurements and applications. Methods and
Measurements of Periphyton Communities: A Review. Weitzel RL (ed.)
American Society for Testing and Materials, Philadelphia, PA.
53
Wellnitz TA, Ward JV. 1998. Does light intensity modify the effect mayfly grazers have
on periphyton? Freshwater Biology 39:135-149.
Wellnitz TA, Rinne B. 1999. Photosynthetic response of stream periphyton to
fluctuating light regimes. Journal of Phycology 35:667-672.
Wetzel, RG. 1983. Limnology 2nd
Edition. Saunders College Publishing, New York.
Wetzel RG. 1984. Detrial dissolved and particulate organic carbon functions in aquatic
ecosystems. Bulletin of Marine Science 33:503-509.
Wetzel RG. 1990. Land-water interfaces: Metabolic and limnological regulators. Verb.
Internat. Verein. Limnol. 24:6-24.
Wetzel RG. 1993. Microcommunities and microgradients: linking nutrient regeneration,
microbial mutualism and high sustained aquatic primary production. Netherlands
Journal of Aquatic Ecology 27:3-9.

54
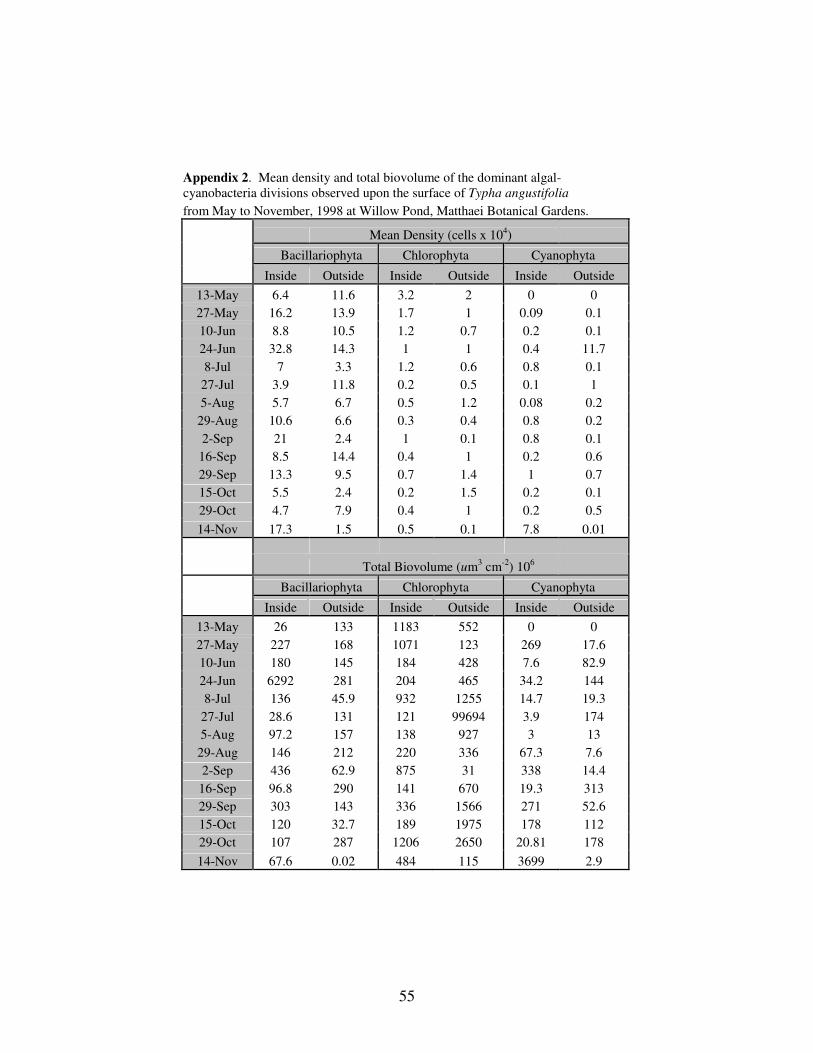
55
Appendix 2. Mean density and total biovolume of the dominant algal-
cyanobacteria divisions observed upon the surface of Typha angustifolia
from May to November, 1998 at Willow Pond, Matthaei Botanical Gardens.
Mean Density (cells x 104)
Bacillariophyta Chlorophyta Cyanophyta
Inside Outside Inside Outside Inside Outside
13-May 6.4 11.6 3.2 2 0 0
27-May 16.2 13.9 1.7 1 0.09 0.1
10-Jun 8.8 10.5 1.2 0.7 0.2 0.1
24-Jun 32.8 14.3 1 1 0.4 11.7
8-Jul 7 3.3 1.2 0.6 0.8 0.1
27-Jul 3.9 11.8 0.2 0.5 0.1 1
5-Aug 5.7 6.7 0.5 1.2 0.08 0.2
29-Aug 10.6 6.6 0.3 0.4 0.8 0.2
2-Sep 21 2.4 1 0.1 0.8 0.1
16-Sep 8.5 14.4 0.4 1 0.2 0.6
29-Sep 13.3 9.5 0.7 1.4 1 0.7
15-Oct 5.5 2.4 0.2 1.5 0.2 0.1
29-Oct 4.7 7.9 0.4 1 0.2 0.5
14-Nov 17.3 1.5 0.5 0.1 7.8 0.01
Total Biovolume (um3 cm
-2) 10
6
Bacillariophyta Chlorophyta Cyanophyta
Inside Outside Inside Outside Inside Outside
13-May 26 133 1183 552 0 0
27-May 227 168 1071 123 269 17.6
10-Jun 180 145 184 428 7.6 82.9
24-Jun 6292 281 204 465 34.2 144
8-Jul 136 45.9 932 1255 14.7 19.3
27-Jul 28.6 131 121 99694 3.9 174
5-Aug 97.2 157 138 927 3 13
29-Aug 146 212 220 336 67.3 7.6
2-Sep 436 62.9 875 31 338 14.4
16-Sep 96.8 290 141 670 19.3 313
29-Sep 303 143 336 1566 271 52.6
15-Oct 120 32.7 189 1975 178 112
29-Oct 107 287 1206 2650 20.81 178
14-Nov 67.6 0.02 484 115 3699 2.9
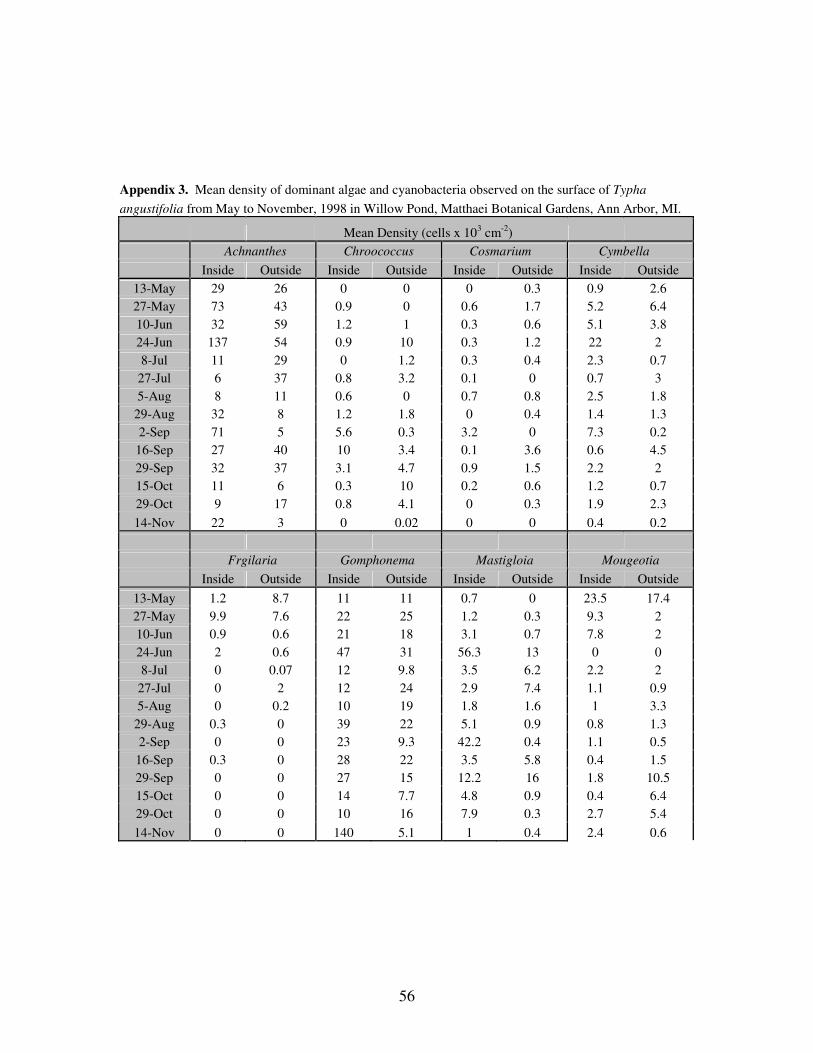
56
Appendix 3. Mean density of dominant algae and cyanobacteria observed on the surface of Typha
angustifolia from May to November, 1998 in Willow Pond, Matthaei Botanical Gardens, Ann Arbor, MI.
Mean Density (cells x 103 cm
-2)
Achnanthes Chroococcus Cosmarium Cymbella
Inside Outside Inside Outside Inside Outside Inside Outside
13-May 29 26 0 0 0 0.3 0.9 2.6
27-May 73 43 0.9 0 0.6 1.7 5.2 6.4
10-Jun 32 59 1.2 1 0.3 0.6 5.1 3.8
24-Jun 137 54 0.9 10 0.3 1.2 22 2
8-Jul 11 29 0 1.2 0.3 0.4 2.3 0.7
27-Jul 6 37 0.8 3.2 0.1 0 0.7 3
5-Aug 8 11 0.6 0 0.7 0.8 2.5 1.8
29-Aug 32 8 1.2 1.8 0 0.4 1.4 1.3
2-Sep 71 5 5.6 0.3 3.2 0 7.3 0.2
16-Sep 27 40 10 3.4 0.1 3.6 0.6 4.5
29-Sep 32 37 3.1 4.7 0.9 1.5 2.2 2
15-Oct 11 6 0.3 10 0.2 0.6 1.2 0.7
29-Oct 9 17 0.8 4.1 0 0.3 1.9 2.3
14-Nov 22 3 0 0.02 0 0 0.4 0.2
Frgilaria Gomphonema Mastigloia Mougeotia
Inside Outside Inside Outside Inside Outside Inside Outside
13-May 1.2 8.7 11 11 0.7 0 23.5 17.4
27-May 9.9 7.6 22 25 1.2 0.3 9.3 2
10-Jun 0.9 0.6 21 18 3.1 0.7 7.8 2
24-Jun 2 0.6 47 31 56.3 13 0 0
8-Jul 0 0.07 12 9.8 3.5 6.2 2.2 2
27-Jul 0 2 12 24 2.9 7.4 1.1 0.9
5-Aug 0 0.2 10 19 1.8 1.6 1 3.3
29-Aug 0.3 0 39 22 5.1 0.9 0.8 1.3
2-Sep 0 0 23 9.3 42.2 0.4 1.1 0.5
16-Sep 0.3 0 28 22 3.5 5.8 0.4 1.5
29-Sep 0 0 27 15 12.2 16 1.8 10.5
15-Oct 0 0 14 7.7 4.8 0.9 0.4 6.4
29-Oct 0 0 10 16 7.9 0.3 2.7 5.4
14-Nov 0 0 140 5.1 1 0.4 2.4 0.6
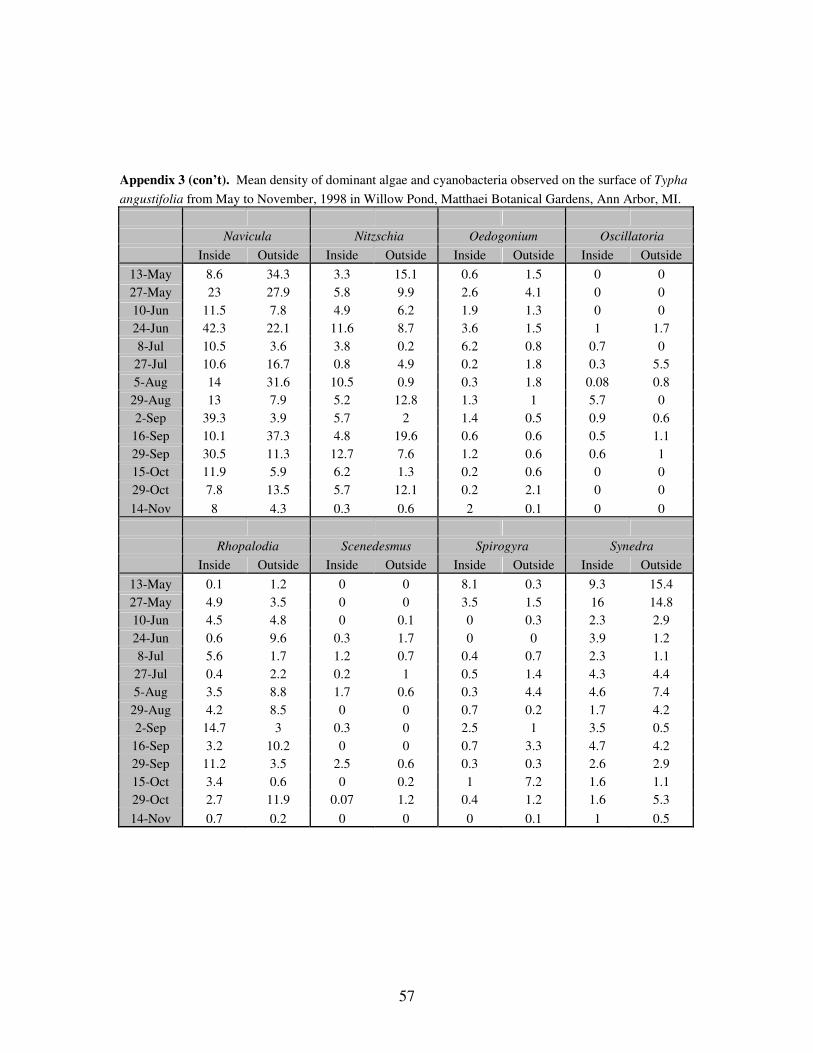
57
Appendix 3 (con’t). Mean density of dominant algae and cyanobacteria observed on the surface of Typha
angustifolia from May to November, 1998 in Willow Pond, Matthaei Botanical Gardens, Ann Arbor, MI.
Navicula Nitzschia Oedogonium Oscillatoria
Inside Outside Inside Outside Inside Outside Inside Outside
13-May 8.6 34.3 3.3 15.1 0.6 1.5 0 0
27-May 23 27.9 5.8 9.9 2.6 4.1 0 0
10-Jun 11.5 7.8 4.9 6.2 1.9 1.3 0 0
24-Jun 42.3 22.1 11.6 8.7 3.6 1.5 1 1.7
8-Jul 10.5 3.6 3.8 0.2 6.2 0.8 0.7 0
27-Jul 10.6 16.7 0.8 4.9 0.2 1.8 0.3 5.5
5-Aug 14 31.6 10.5 0.9 0.3 1.8 0.08 0.8
29-Aug 13 7.9 5.2 12.8 1.3 1 5.7 0
2-Sep 39.3 3.9 5.7 2 1.4 0.5 0.9 0.6
16-Sep 10.1 37.3 4.8 19.6 0.6 0.6 0.5 1.1
29-Sep 30.5 11.3 12.7 7.6 1.2 0.6 0.6 1
15-Oct 11.9 5.9 6.2 1.3 0.2 0.6 0 0
29-Oct 7.8 13.5 5.7 12.1 0.2 2.1 0 0
14-Nov 8 4.3 0.3 0.6 2 0.1 0 0
Rhopalodia Scenedesmus Spirogyra Synedra
Inside Outside Inside Outside Inside Outside Inside Outside
13-May 0.1 1.2 0 0 8.1 0.3 9.3 15.4
27-May 4.9 3.5 0 0 3.5 1.5 16 14.8
10-Jun 4.5 4.8 0 0.1 0 0.3 2.3 2.9
24-Jun 0.6 9.6 0.3 1.7 0 0 3.9 1.2
8-Jul 5.6 1.7 1.2 0.7 0.4 0.7 2.3 1.1
27-Jul 0.4 2.2 0.2 1 0.5 1.4 4.3 4.4
5-Aug 3.5 8.8 1.7 0.6 0.3 4.4 4.6 7.4
29-Aug 4.2 8.5 0 0 0.7 0.2 1.7 4.2
2-Sep 14.7 3 0.3 0 2.5 1 3.5 0.5
16-Sep 3.2 10.2 0 0 0.7 3.3 4.7 4.2
29-Sep 11.2 3.5 2.5 0.6 0.3 0.3 2.6 2.9
15-Oct 3.4 0.6 0 0.2 1 7.2 1.6 1.1
29-Oct 2.7 11.9 0.07 1.2 0.4 1.2 1.6 5.3
14-Nov 0.7 0.2 0 0 0 0.1 1 0.5
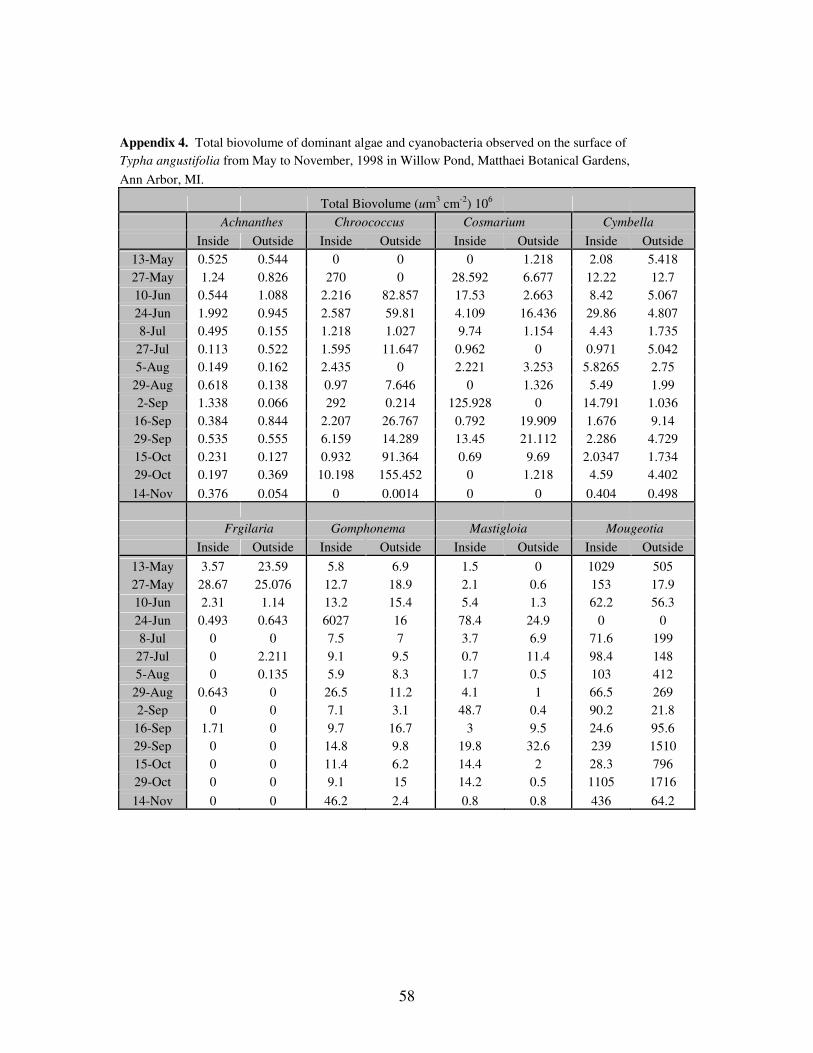
58
Appendix 4. Total biovolume of dominant algae and cyanobacteria observed on the surface of
Typha angustifolia from May to November, 1998 in Willow Pond, Matthaei Botanical Gardens,
Ann Arbor, MI.
Total Biovolume (um3 cm
-2) 10
6
Achnanthes Chroococcus Cosmarium Cymbella
Inside Outside Inside Outside Inside Outside Inside Outside
13-May 0.525 0.544 0 0 0 1.218 2.08 5.418
27-May 1.24 0.826 270 0 28.592 6.677 12.22 12.7
10-Jun 0.544 1.088 2.216 82.857 17.53 2.663 8.42 5.067
24-Jun 1.992 0.945 2.587 59.81 4.109 16.436 29.86 4.807
8-Jul 0.495 0.155 1.218 1.027 9.74 1.154 4.43 1.735
27-Jul 0.113 0.522 1.595 11.647 0.962 0 0.971 5.042
5-Aug 0.149 0.162 2.435 0 2.221 3.253 5.8265 2.75
29-Aug 0.618 0.138 0.97 7.646 0 1.326 5.49 1.99
2-Sep 1.338 0.066 292 0.214 125.928 0 14.791 1.036
16-Sep 0.384 0.844 2.207 26.767 0.792 19.909 1.676 9.14
29-Sep 0.535 0.555 6.159 14.289 13.45 21.112 2.286 4.729
15-Oct 0.231 0.127 0.932 91.364 0.69 9.69 2.0347 1.734
29-Oct 0.197 0.369 10.198 155.452 0 1.218 4.59 4.402
14-Nov 0.376 0.054 0 0.0014 0 0 0.404 0.498
Frgilaria Gomphonema Mastigloia Mougeotia
Inside Outside Inside Outside Inside Outside Inside Outside
13-May 3.57 23.59 5.8 6.9 1.5 0 1029 505
27-May 28.67 25.076 12.7 18.9 2.1 0.6 153 17.9
10-Jun 2.31 1.14 13.2 15.4 5.4 1.3 62.2 56.3
24-Jun 0.493 0.643 6027 16 78.4 24.9 0 0
8-Jul 0 0 7.5 7 3.7 6.9 71.6 199
27-Jul 0 2.211 9.1 9.5 0.7 11.4 98.4 148
5-Aug 0 0.135 5.9 8.3 1.7 0.5 103 412
29-Aug 0.643 0 26.5 11.2 4.1 1 66.5 269
2-Sep 0 0 7.1 3.1 48.7 0.4 90.2 21.8
16-Sep 1.71 0 9.7 16.7 3 9.5 24.6 95.6
29-Sep 0 0 14.8 9.8 19.8 32.6 239 1510
15-Oct 0 0 11.4 6.2 14.4 2 28.3 796
29-Oct 0 0 9.1 15 14.2 0.5 1105 1716
14-Nov 0 0 46.2 2.4 0.8 0.8 436 64.2

59

60

61
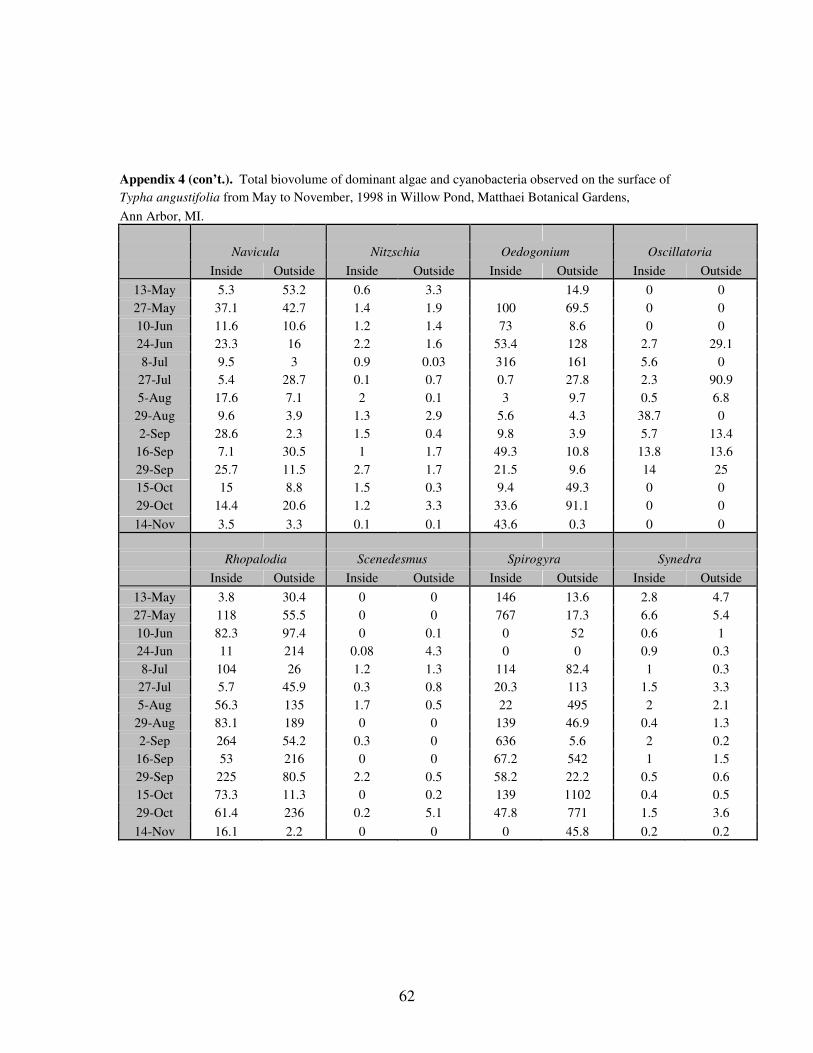
62
Appendix 4 (con’t.). Total biovolume of dominant algae and cyanobacteria observed on the surface of
Typha angustifolia from May to November, 1998 in Willow Pond, Matthaei Botanical Gardens,
Ann Arbor, MI.
Navicula Nitzschia Oedogonium Oscillatoria
Inside Outside Inside Outside Inside Outside Inside Outside
13-May 5.3 53.2 0.6 3.3 14.9 0 0
27-May 37.1 42.7 1.4 1.9 100 69.5 0 0
10-Jun 11.6 10.6 1.2 1.4 73 8.6 0 0
24-Jun 23.3 16 2.2 1.6 53.4 128 2.7 29.1
8-Jul 9.5 3 0.9 0.03 316 161 5.6 0
27-Jul 5.4 28.7 0.1 0.7 0.7 27.8 2.3 90.9
5-Aug 17.6 7.1 2 0.1 3 9.7 0.5 6.8
29-Aug 9.6 3.9 1.3 2.9 5.6 4.3 38.7 0
2-Sep 28.6 2.3 1.5 0.4 9.8 3.9 5.7 13.4
16-Sep 7.1 30.5 1 1.7 49.3 10.8 13.8 13.6
29-Sep 25.7 11.5 2.7 1.7 21.5 9.6 14 25
15-Oct 15 8.8 1.5 0.3 9.4 49.3 0 0
29-Oct 14.4 20.6 1.2 3.3 33.6 91.1 0 0
14-Nov 3.5 3.3 0.1 0.1 43.6 0.3 0 0
Rhopalodia Scenedesmus Spirogyra Synedra
Inside Outside Inside Outside Inside Outside Inside Outside
13-May 3.8 30.4 0 0 146 13.6 2.8 4.7
27-May 118 55.5 0 0 767 17.3 6.6 5.4
10-Jun 82.3 97.4 0 0.1 0 52 0.6 1
24-Jun 11 214 0.08 4.3 0 0 0.9 0.3
8-Jul 104 26 1.2 1.3 114 82.4 1 0.3
27-Jul 5.7 45.9 0.3 0.8 20.3 113 1.5 3.3
5-Aug 56.3 135 1.7 0.5 22 495 2 2.1
29-Aug 83.1 189 0 0 139 46.9 0.4 1.3
2-Sep 264 54.2 0.3 0 636 5.6 2 0.2
16-Sep 53 216 0 0 67.2 542 1 1.5
29-Sep 225 80.5 2.2 0.5 58.2 22.2 0.5 0.6
15-Oct 73.3 11.3 0 0.2 139 1102 0.4 0.5
29-Oct 61.4 236 0.2 5.1 47.8 771 1.5 3.6
14-Nov 16.1 2.2 0 0 0 45.8 0.2 0.2
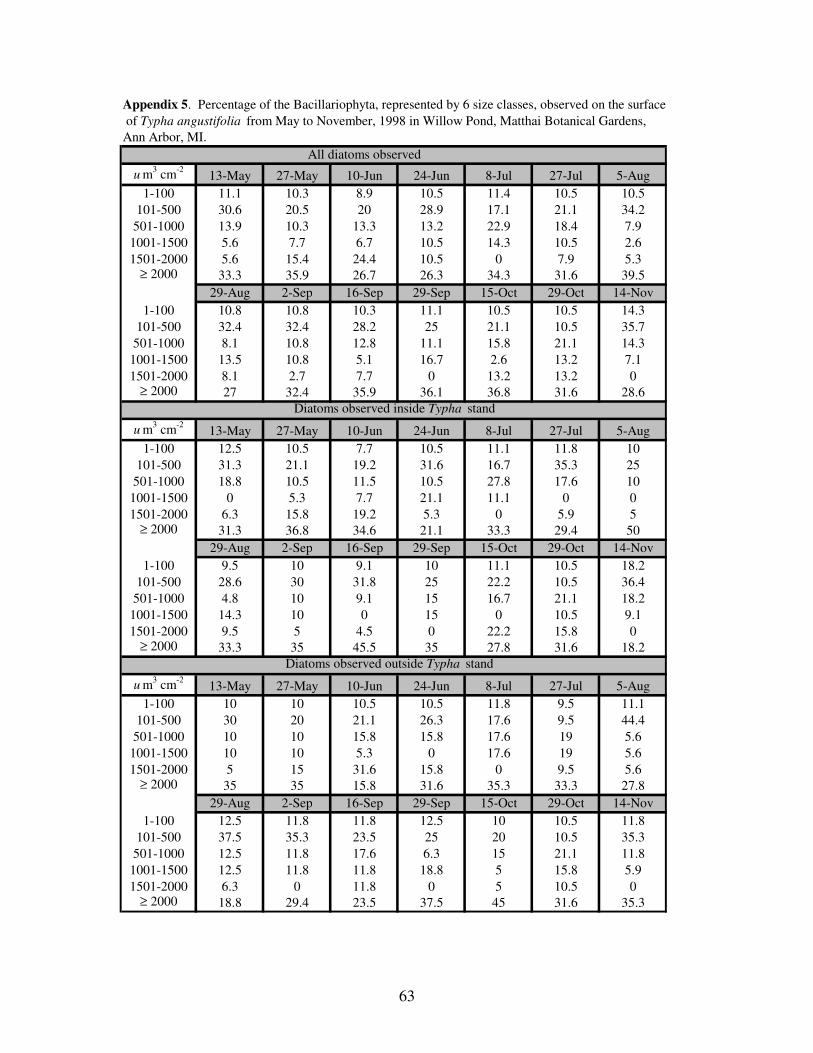
63
Appendix 5. Percentage of the Bacillariophyta, represented by 6 size classes, observed on the surface
of Typha angustifolia from May to November, 1998 in Willow Pond, Matthai Botanical Gardens,
Ann Arbor, MI.
All diatoms observed
u m3 cm
-213-May 27-May 10-Jun 24-Jun 8-Jul 27-Jul 5-Aug
1-100 11.1 10.3 8.9 10.5 11.4 10.5 10.5
101-500 30.6 20.5 20 28.9 17.1 21.1 34.2
501-1000 13.9 10.3 13.3 13.2 22.9 18.4 7.9
1001-1500 5.6 7.7 6.7 10.5 14.3 10.5 2.6
1501-2000 5.6 15.4 24.4 10.5 0 7.9 5.3≥ 2000 33.3 35.9 26.7 26.3 34.3 31.6 39.5
29-Aug 2-Sep 16-Sep 29-Sep 15-Oct 29-Oct 14-Nov
1-100 10.8 10.8 10.3 11.1 10.5 10.5 14.3
101-500 32.4 32.4 28.2 25 21.1 10.5 35.7
501-1000 8.1 10.8 12.8 11.1 15.8 21.1 14.3
1001-1500 13.5 10.8 5.1 16.7 2.6 13.2 7.1
1501-2000 8.1 2.7 7.7 0 13.2 13.2 0≥ 2000 27 32.4 35.9 36.1 36.8 31.6 28.6
Diatoms observed inside Typha stand
u m3 cm
-213-May 27-May 10-Jun 24-Jun 8-Jul 27-Jul 5-Aug
1-100 12.5 10.5 7.7 10.5 11.1 11.8 10
101-500 31.3 21.1 19.2 31.6 16.7 35.3 25
501-1000 18.8 10.5 11.5 10.5 27.8 17.6 10
1001-1500 0 5.3 7.7 21.1 11.1 0 0
1501-2000 6.3 15.8 19.2 5.3 0 5.9 5≥ 2000 31.3 36.8 34.6 21.1 33.3 29.4 50
29-Aug 2-Sep 16-Sep 29-Sep 15-Oct 29-Oct 14-Nov
1-100 9.5 10 9.1 10 11.1 10.5 18.2
101-500 28.6 30 31.8 25 22.2 10.5 36.4
501-1000 4.8 10 9.1 15 16.7 21.1 18.2
1001-1500 14.3 10 0 15 0 10.5 9.1
1501-2000 9.5 5 4.5 0 22.2 15.8 0≥ 2000 33.3 35 45.5 35 27.8 31.6 18.2
Diatoms observed outside Typha stand
u m3 cm
-213-May 27-May 10-Jun 24-Jun 8-Jul 27-Jul 5-Aug
1-100 10 10 10.5 10.5 11.8 9.5 11.1
101-500 30 20 21.1 26.3 17.6 9.5 44.4
501-1000 10 10 15.8 15.8 17.6 19 5.6
1001-1500 10 10 5.3 0 17.6 19 5.6
1501-2000 5 15 31.6 15.8 0 9.5 5.6≥ 2000 35 35 15.8 31.6 35.3 33.3 27.8
29-Aug 2-Sep 16-Sep 29-Sep 15-Oct 29-Oct 14-Nov
1-100 12.5 11.8 11.8 12.5 10 10.5 11.8
101-500 37.5 35.3 23.5 25 20 10.5 35.3
501-1000 12.5 11.8 17.6 6.3 15 21.1 11.8
1001-1500 12.5 11.8 11.8 18.8 5 15.8 5.9
1501-2000 6.3 0 11.8 0 5 10.5 0≥ 2000 18.8 29.4 23.5 37.5 45 31.6 35.3
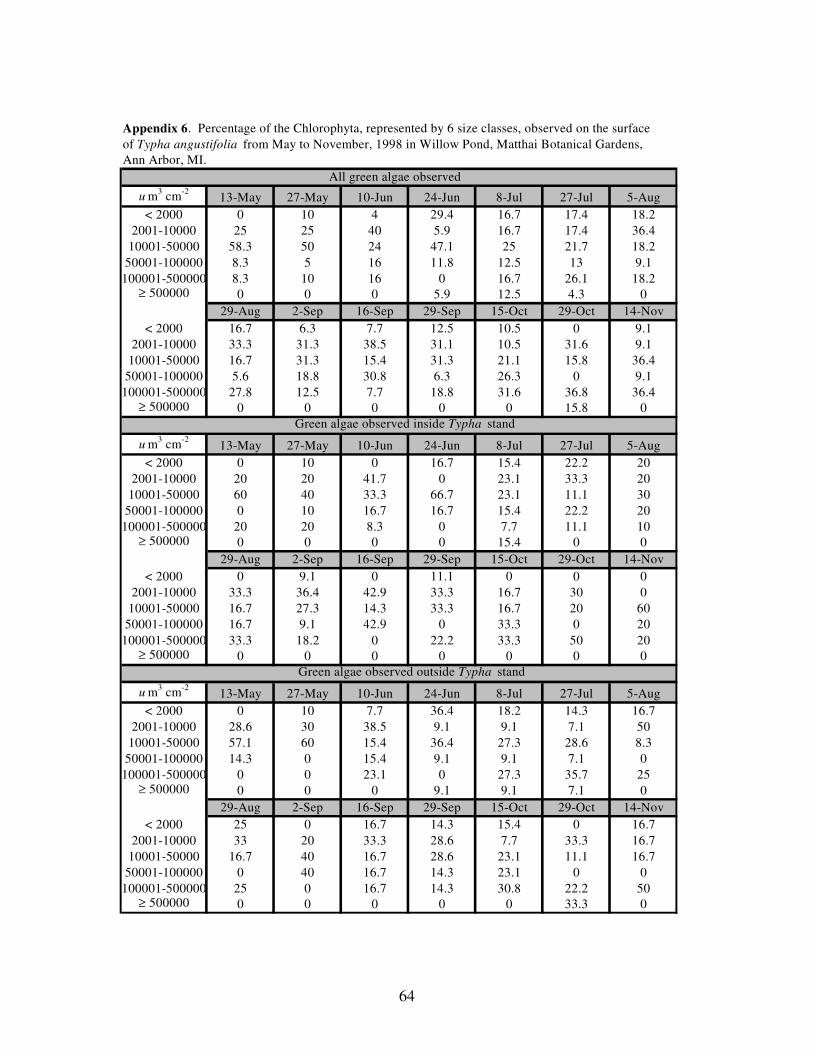
64
Appendix 6. Percentage of the Chlorophyta, represented by 6 size classes, observed on the surface
of Typha angustifolia from May to November, 1998 in Willow Pond, Matthai Botanical Gardens,
Ann Arbor, MI.
All green algae observed
u m3 cm
-213-May 27-May 10-Jun 24-Jun 8-Jul 27-Jul 5-Aug
< 2000 0 10 4 29.4 16.7 17.4 18.2
2001-10000 25 25 40 5.9 16.7 17.4 36.4
10001-50000 58.3 50 24 47.1 25 21.7 18.2
50001-100000 8.3 5 16 11.8 12.5 13 9.1
100001-500000 8.3 10 16 0 16.7 26.1 18.2≥ 500000 0 0 0 5.9 12.5 4.3 0
29-Aug 2-Sep 16-Sep 29-Sep 15-Oct 29-Oct 14-Nov
< 2000 16.7 6.3 7.7 12.5 10.5 0 9.1
2001-10000 33.3 31.3 38.5 31.1 10.5 31.6 9.1
10001-50000 16.7 31.3 15.4 31.3 21.1 15.8 36.4
50001-100000 5.6 18.8 30.8 6.3 26.3 0 9.1
100001-500000 27.8 12.5 7.7 18.8 31.6 36.8 36.4≥ 500000 0 0 0 0 0 15.8 0
Green algae observed inside Typha stand
u m3 cm
-213-May 27-May 10-Jun 24-Jun 8-Jul 27-Jul 5-Aug
< 2000 0 10 0 16.7 15.4 22.2 20
2001-10000 20 20 41.7 0 23.1 33.3 20
10001-50000 60 40 33.3 66.7 23.1 11.1 30
50001-100000 0 10 16.7 16.7 15.4 22.2 20
100001-500000 20 20 8.3 0 7.7 11.1 10≥ 500000 0 0 0 0 15.4 0 0
29-Aug 2-Sep 16-Sep 29-Sep 15-Oct 29-Oct 14-Nov
< 2000 0 9.1 0 11.1 0 0 0
2001-10000 33.3 36.4 42.9 33.3 16.7 30 0
10001-50000 16.7 27.3 14.3 33.3 16.7 20 60
50001-100000 16.7 9.1 42.9 0 33.3 0 20
100001-500000 33.3 18.2 0 22.2 33.3 50 20≥ 500000 0 0 0 0 0 0 0
Green algae observed outside Typha stand
u m3 cm
-213-May 27-May 10-Jun 24-Jun 8-Jul 27-Jul 5-Aug
< 2000 0 10 7.7 36.4 18.2 14.3 16.7
2001-10000 28.6 30 38.5 9.1 9.1 7.1 50
10001-50000 57.1 60 15.4 36.4 27.3 28.6 8.3
50001-100000 14.3 0 15.4 9.1 9.1 7.1 0
100001-500000 0 0 23.1 0 27.3 35.7 25≥ 500000 0 0 0 9.1 9.1 7.1 0
29-Aug 2-Sep 16-Sep 29-Sep 15-Oct 29-Oct 14-Nov
< 2000 25 0 16.7 14.3 15.4 0 16.7
2001-10000 33 20 33.3 28.6 7.7 33.3 16.7
10001-50000 16.7 40 16.7 28.6 23.1 11.1 16.7
50001-100000 0 40 16.7 14.3 23.1 0 0
100001-500000 25 0 16.7 14.3 30.8 22.2 50≥ 500000 0 0 0 0 0 33.3 0
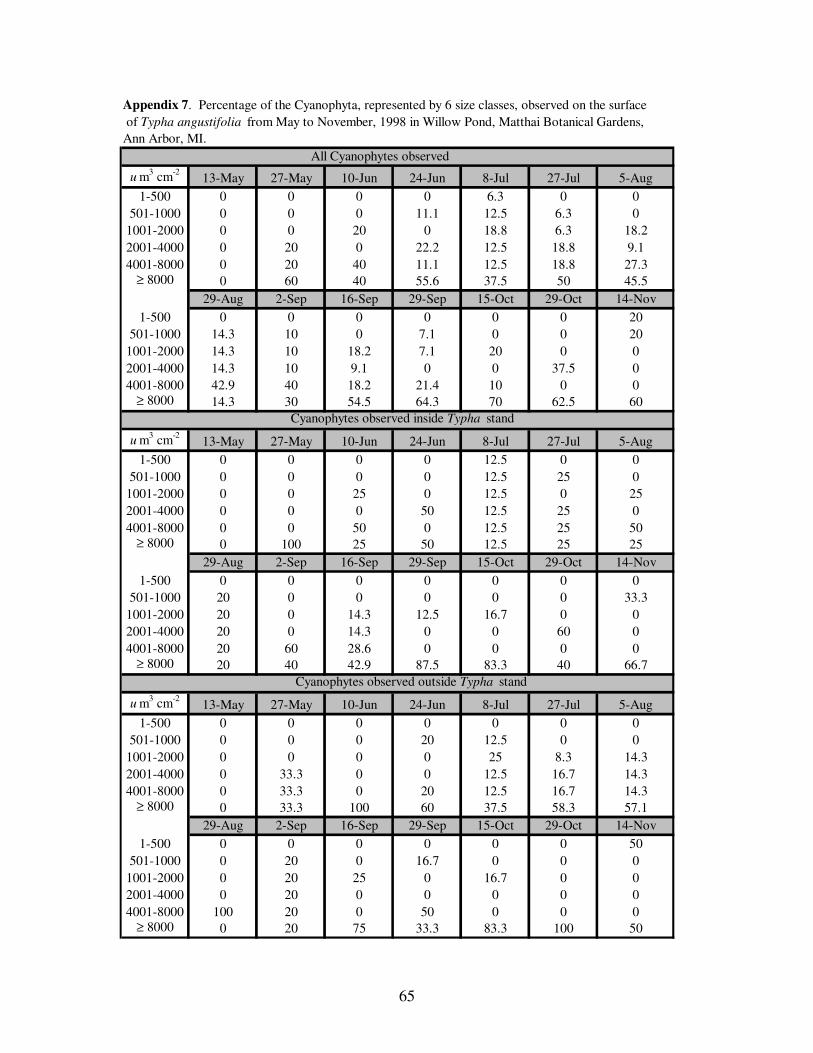
65
Appendix 7. Percentage of the Cyanophyta, represented by 6 size classes, observed on the surface
of Typha angustifolia from May to November, 1998 in Willow Pond, Matthai Botanical Gardens,
Ann Arbor, MI.
All Cyanophytes observed
u m3 cm
-213-May 27-May 10-Jun 24-Jun 8-Jul 27-Jul 5-Aug
1-500 0 0 0 0 6.3 0 0
501-1000 0 0 0 11.1 12.5 6.3 0
1001-2000 0 0 20 0 18.8 6.3 18.2
2001-4000 0 20 0 22.2 12.5 18.8 9.1
4001-8000 0 20 40 11.1 12.5 18.8 27.3
≥ 8000 0 60 40 55.6 37.5 50 45.5
29-Aug 2-Sep 16-Sep 29-Sep 15-Oct 29-Oct 14-Nov
1-500 0 0 0 0 0 0 20
501-1000 14.3 10 0 7.1 0 0 20
1001-2000 14.3 10 18.2 7.1 20 0 0
2001-4000 14.3 10 9.1 0 0 37.5 0
4001-8000 42.9 40 18.2 21.4 10 0 0
≥ 8000 14.3 30 54.5 64.3 70 62.5 60
Cyanophytes observed inside Typha stand
u m3 cm
-213-May 27-May 10-Jun 24-Jun 8-Jul 27-Jul 5-Aug
1-500 0 0 0 0 12.5 0 0
501-1000 0 0 0 0 12.5 25 0
1001-2000 0 0 25 0 12.5 0 25
2001-4000 0 0 0 50 12.5 25 0
4001-8000 0 0 50 0 12.5 25 50
≥ 8000 0 100 25 50 12.5 25 25
29-Aug 2-Sep 16-Sep 29-Sep 15-Oct 29-Oct 14-Nov
1-500 0 0 0 0 0 0 0
501-1000 20 0 0 0 0 0 33.3
1001-2000 20 0 14.3 12.5 16.7 0 0
2001-4000 20 0 14.3 0 0 60 0
4001-8000 20 60 28.6 0 0 0 0
≥ 8000 20 40 42.9 87.5 83.3 40 66.7
Cyanophytes observed outside Typha stand
u m3 cm
-213-May 27-May 10-Jun 24-Jun 8-Jul 27-Jul 5-Aug
1-500 0 0 0 0 0 0 0
501-1000 0 0 0 20 12.5 0 0
1001-2000 0 0 0 0 25 8.3 14.3
2001-4000 0 33.3 0 0 12.5 16.7 14.3
4001-8000 0 33.3 0 20 12.5 16.7 14.3
≥ 8000 0 33.3 100 60 37.5 58.3 57.1
29-Aug 2-Sep 16-Sep 29-Sep 15-Oct 29-Oct 14-Nov
1-500 0 0 0 0 0 0 50
501-1000 0 20 0 16.7 0 0 0
1001-2000 0 20 25 0 16.7 0 0
2001-4000 0 20 0 0 0 0 0
4001-8000 100 20 0 50 0 0 0
≥ 8000 0 20 75 33.3 83.3 100 50
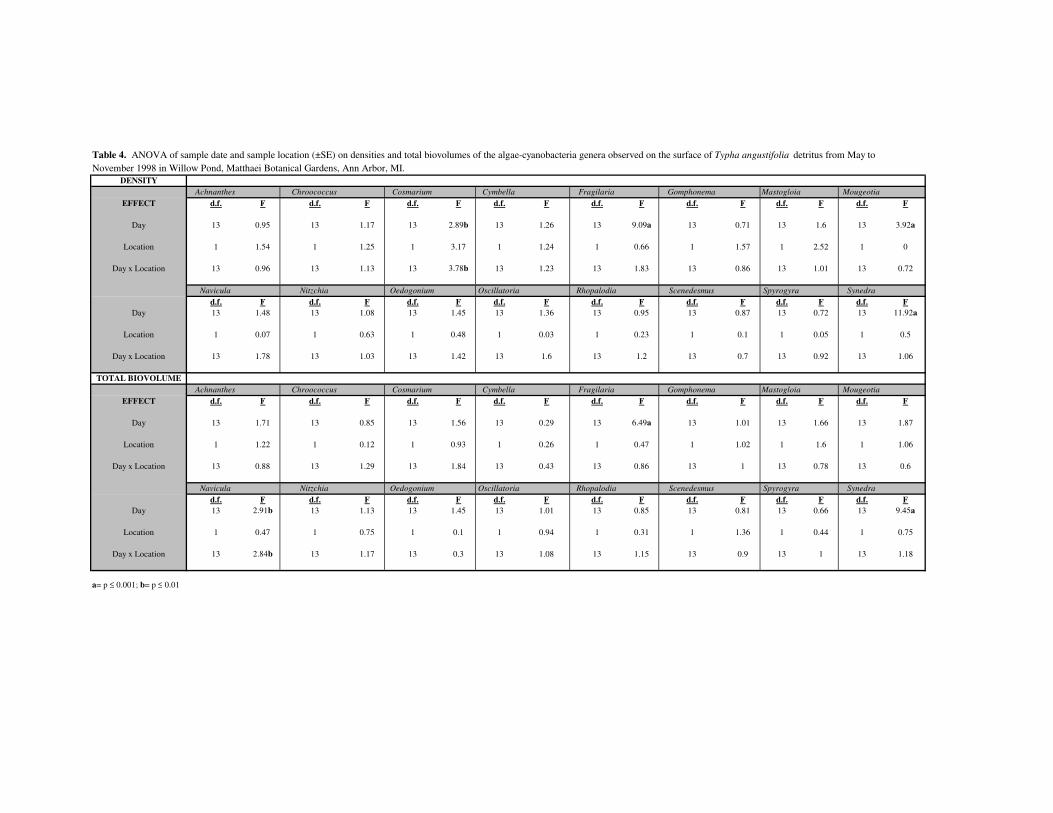
Table 4. ANOVA of sample date and sample location (±SE) on densities and total biovolumes of the algae-cyanobacteria genera observed on the surface of Typha angustifolia detritus from May to
November 1998 in Willow Pond, Matthaei Botanical Gardens, Ann Arbor, MI.
DENSITY
Achnanthes Chroococcus Cosmarium Cymbella Fragilaria Gomphonema Mastogloia Mougeotia
EFFECT d.f. F d.f. F d.f. F d.f. F d.f. F d.f. F d.f. F d.f. F
Day 13 0.95 13 1.17 13 2.89b 13 1.26 13 9.09a 13 0.71 13 1.6 13 3.92a
Location 1 1.54 1 1.25 1 3.17 1 1.24 1 0.66 1 1.57 1 2.52 1 0
Day x Location 13 0.96 13 1.13 13 3.78b 13 1.23 13 1.83 13 0.86 13 1.01 13 0.72
Navicula Nitzchia Oedogonium Oscillatoria Rhopalodia Scenedesmus Spyrogyra Synedra
d.f. F d.f. F d.f. F d.f. F d.f. F d.f. F d.f. F d.f. F
Day 13 1.48 13 1.08 13 1.45 13 1.36 13 0.95 13 0.87 13 0.72 13 11.92a
Location 1 0.07 1 0.63 1 0.48 1 0.03 1 0.23 1 0.1 1 0.05 1 0.5
Day x Location 13 1.78 13 1.03 13 1.42 13 1.6 13 1.2 13 0.7 13 0.92 13 1.06
TOTAL BIOVOLUME
Achnanthes Chroococcus Cosmarium Cymbella Fragilaria Gomphonema Mastogloia Mougeotia
EFFECT d.f. F d.f. F d.f. F d.f. F d.f. F d.f. F d.f. F d.f. F
Day 13 1.71 13 0.85 13 1.56 13 0.29 13 6.49a 13 1.01 13 1.66 13 1.87
Location 1 1.22 1 0.12 1 0.93 1 0.26 1 0.47 1 1.02 1 1.6 1 1.06
Day x Location 13 0.88 13 1.29 13 1.84 13 0.43 13 0.86 13 1 13 0.78 13 0.6
Navicula Nitzchia Oedogonium Oscillatoria Rhopalodia Scenedesmus Spyrogyra Synedra
d.f. F d.f. F d.f. F d.f. F d.f. F d.f. F d.f. F d.f. F
Day 13 2.91b 13 1.13 13 1.45 13 1.01 13 0.85 13 0.81 13 0.66 13 9.45a
Location 1 0.47 1 0.75 1 0.1 1 0.94 1 0.31 1 1.36 1 0.44 1 0.75
Day x Location 13 2.84b 13 1.17 13 0.3 13 1.08 13 1.15 13 0.9 13 1 13 1.18
a= p ≤ 0.001; b= p ≤ 0.01