Embed Size (px)
Citation preview
Characterization of the electronics for Micromegas (Micro-MEsh Gaseous Structure)detector at the n TOF experiment at CERN
Luca Pizzimento,Christina Weiss1
1Summer Student, Supervisor(Dated: 24/9/2015)
ABSTRACT
At the neutron time-of-flight facility n TOF, Micromegas (Micro-MEsh Gaseous Structure) detec-tors are used for neutron induced cross-section measurements and neutron beam monitoring. Forthe optimum performance, the read-out chain has to be adjusted to the electronic properties of suchdetectors. The current signal of the Micromegas detector was measured to find a suitable inputsignal for the electronic calibration of preamplifiers. Consecutively, different current and chargeamplifiers were characterized for their response to a Micromegas current pulse, in order to preparefor the measurement of the achievable energy resolution of the detector. Finally the measurementsdirectly with the MGAS detectors are reported.
I. INTRODUCTION
The aim of this project is to find the most suitablepreamplifier electronics for the MGAS detectors at then TOF facility. The electronics actually in use for theMGAS detectors at the n TOF facility is a charge pream-plifer. One of the aim of this project is to see if it ispossible to use a different kind of preamplifier such as acurrent preamplifier or a fast charge preamplifier in orderto minimize pileup signals during the measurements inthe n TOF neutron beam. In order to achieve these ob-jectives, different kind of measurements were performed.In the first part of the report a brief introduction to thedetector, to the n TOF experiment and to the experi-mental setup used is given (Section II-III). In the secondpart the calibration done on different preamplifiers andthe measurements done with the MGAS-like signal anddirectly with the MGAS detector are reported on (Sec-tion IV-V-VI).
II. N TOF FACILITY AND MGAS DETECTOR
A. Neutron Time-Of-Light facility
The neutron Time-Of-Flight facility (n TOF) atCERN is based on a spallation neutron source and ismainly dedicated to neutron induced cross section mea-surements as capture (n,γ) and fission(n,ff). There aretwo experimental areas working in parallel:
� Experimental ARea 1 (EAR1) located 200 m fromthe spallation target, positioned along the incomingproton beam horizontal direction, upstream.
� Experimental ARea 2 (EAR2) located 20 m on thevertical direction above the target.
The energy of the neutron beam goes from mev to GeVwith intensity of about 106 neutron/pulse.
B. Micro-mesh GAseous Structure detector
The MGAS (Micro-mesh GAseous Structure) detectoris able to detect charged particles by using a gas mixtureas active material. The main feature of this detector isthat the active zone is divided in two separated parts.This separation is realized using a micromesh structure.The zone that goes from cathode to mesh is called driftzone. In this zone the charged particles ionize and gener-ate pairs of ions and electrons, which drift to the mesh.The electrical field is applied in a way to permit elec-trons to pass through the mesh and reach the secondzone. This zone is called amplification zone. Here theelectrical field applied is so high that the electrons com-ing from the drift zone gain energy and they are able toionize and to generate avalanches of ions and electrons.Thanks to this amplification process the induced signalcan be read on the mesh and on the anode. The analogsignal from such detectors consists of a very fast electronpeak and a long ion tail. The MGAS detector at n TOFis used for neutron induced cross-section measurementsand neutron beam monitoring. One of the main featuresthat makes this detector very suitable for the differentkind of measurements at the n TOF facility is the trans-parency to neutrons. Indeed this detector is composed byvery thin layers of material that are almost transparent toneutrons, which allows positioning this detector directlyinto the beam without perturbing the beam itself.
III. EXPERIMENTAL SETUP
The experimental setup used for all the measurementsis composed by:
1. Pulse generators:
� RF pulser from CIVIDEC and a capacitor of35pF that generate a fixed pulse of 250 mVwith rise time of 300 ps and FWHM 2.5 ns
2
� Arbitrary wave generator with a minimumreachable pulse of 2 mV , FWHM of 8 ns anda rise time of 4 ns.
2. Attenuator with an attenuation from 0db to 120db.
3. Preamplifiers:
� Current Preamplifier used: CIVIDEC C2-TCT 2 Ghz Broadband Amplifier (labelled asC2BDA) and custom made fast preamplifierfrom INFN-LNS Catania (labelled as CC).
� Charge Preamplifier used: custom made boxfrom INFN Bari composed of 16 preamplifiersdivided in 2 groups of 8 similar preamplifiers.
4. Two Micromegas detectors with mesh-anode dis-tance of 50µm and drift gap of 9 mm for the detec-tor 1 and 12 mm for the detector 2.
IV. ELECTRONIC CALIBRATION
The electronic calibration was done to characterize andto define the main properties of the available preampli-fiers for fast input signals. The study of the Output shapeand time properties, the Amplification calibration andthe Noise characterization were performed.
A. Output shape and time properties
The Output shape and its time properties were studiedusing the CIVIDEC pulse generator to produce a fast sig-nal that was used as input for each preamplifiers tested.The response of each preamplifier to this kind of signalwas analyzed.
Time (ns)0 10 20 30 40 50
Am
plitu
de
0
0.2
0.4
0.6
0.8
1
RF Pulser Signal
Figure 1: Input signal generated by RF pulser + 35 pFcalibration capacitance
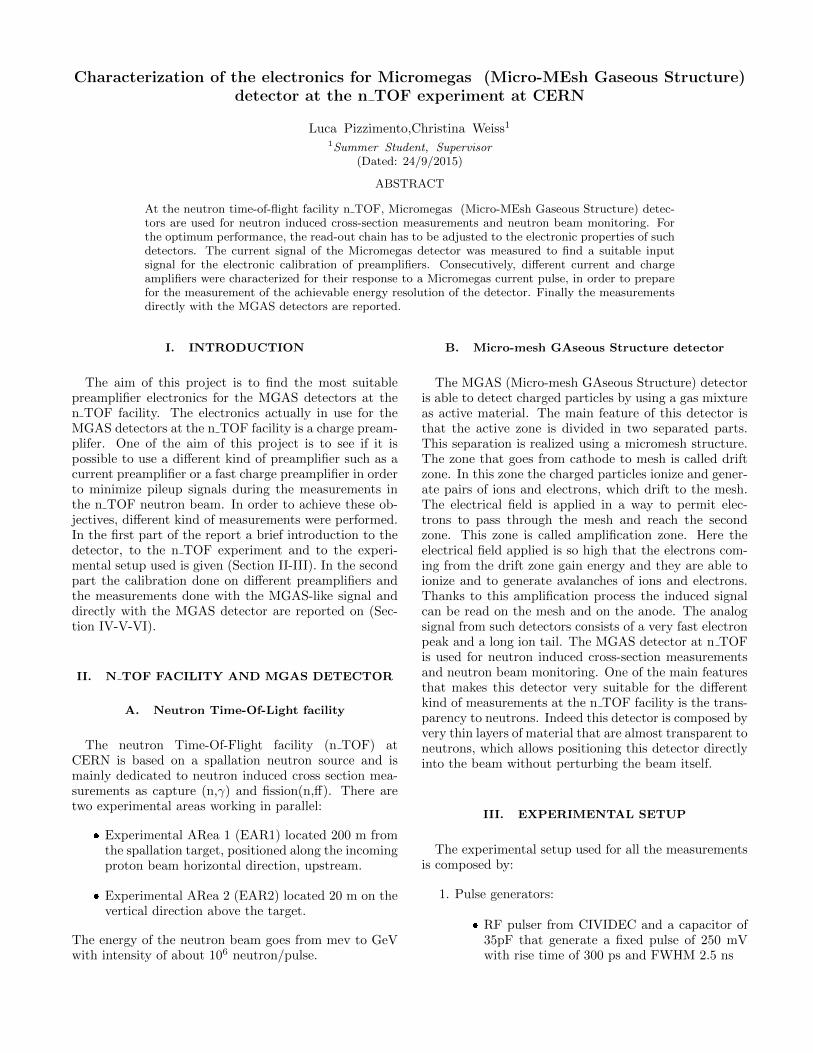
The current preamplifier does not modify the shape ofthe input signal neither the time window that remainsthe same as the input signal (see figure 1). The chargepreamplifier instead will modify the input shape givingon the output a signal with an amplitude proportionalto the integral of the input signal and an exponential
Time (ns)0 10 20 30 40 50
Am
plitu
de
0
0.2
0.4
0.6
0.8
1
Current Amplifier Output
Time (ns)-200 0 200 400 600 800
Am
plitu
de
-0.2
0
0.2
0.4
0.6
0.8
1
Charge Amplifier Output
Figure 2: Output from current preamplifier on the left; Outputfrom charge preamplifier on the right
discharge strictly related with the time constant of thepreamplifier (see figure 2). In this case the time proper-ties of the output are very different from the input ones.In the following table the time properties of each signalsare reported.
Time Properties
Signal Width (ns) Risetime (ns)
Input 2.5 0.3
Current Output 2.5 0.3
Charge Output 75 25
Table I: Time properties of the current (C2BDA) and the charge(Box 2) preamplifiers
B. Amplification calibration
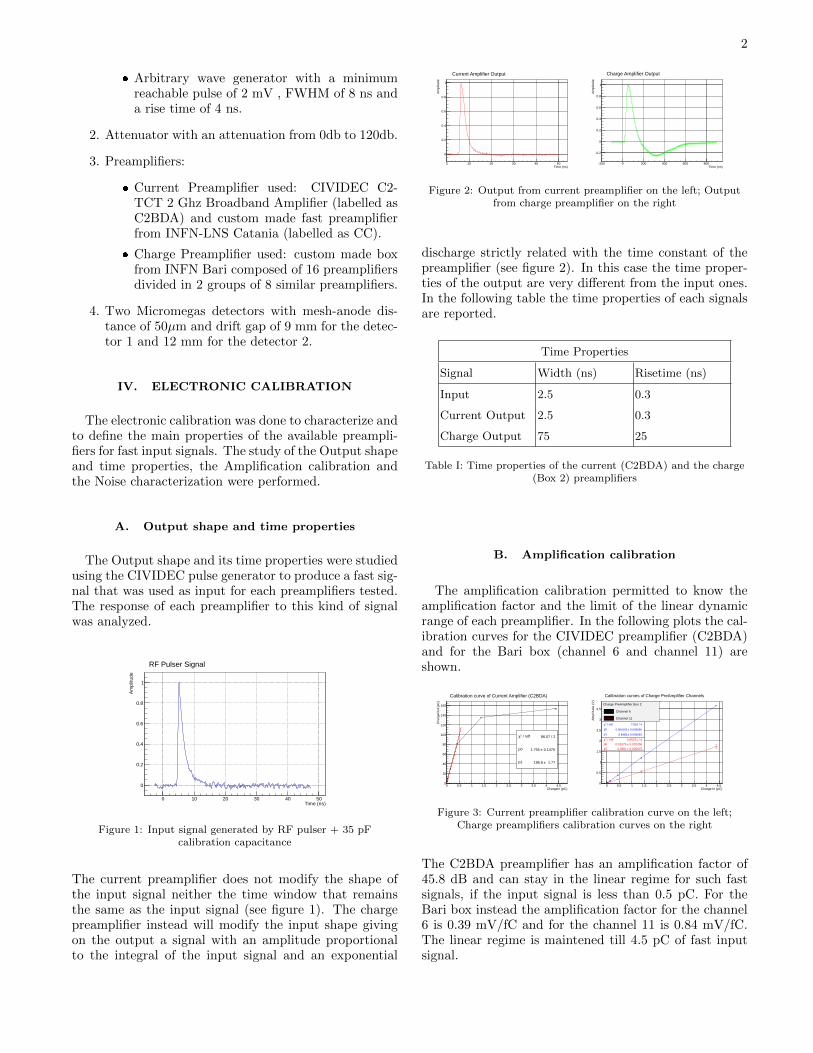
The amplification calibration permitted to know theamplification factor and the limit of the linear dynamicrange of each preamplifier. In the following plots the cal-ibration curves for the CIVIDEC preamplifier (C2BDA)and for the Bari box (channel 6 and channel 11) areshown.
ChargeIn (pC)0 0.5 1 1.5 2 2.5 3 3.5 4 4.5
Cha
rgeO
ut (
pC)
0
20
40
60
80
100
120
140
160
/ ndf 2χ 86.07 / 2
p0 0.1475± 1.755
p1 1.77± 195.6
/ ndf 2χ 86.07 / 2
p0 0.1475± 1.755
p1 1.77± 195.6
Calibration curve of Current Amplifier (C2BDA)
Charge In (pC)0 0.5 1 1.5 2 2.5 3 3.5 4 4.5
Am
plitu
de (
V)
0
0.5
1
1.5
2
2.5
3
3.5
/ ndf 2χ 7.816 / 4
p0 0.003695± 0.004181
p1 0.005893± 0.8483
/ ndf 2χ 0.05371 / 4p0 0.001356± 0.01075 p1 0.006615± 0.3901
Calibration curves of Charge PreAmplifier Channels
Charge PreAmplifier Box 2
Channel 6
Channel 11
Figure 3: Current preamplifier calibration curve on the left;Charge preamplifiers calibration curves on the right
The C2BDA preamplifier has an amplification factor of45.8 dB and can stay in the linear regime for such fastsignals, if the input signal is less than 0.5 pC. For theBari box instead the amplification factor for the channel6 is 0.39 mV/fC and for the channel 11 is 0.84 mV/fC.The linear regime is maintened till 4.5 pC of fast inputsignal.
3
C. Noise characterization
The noise of the electronics setup is one of the mostimportant parameters. The noise can be characterize byusing the Signal to Noise Ratio (SNR) parameter. In thefollowing table the value of SNR for each preamplifier isreported, using as input a signal of 2.5 mV and 0.4 pC.
Noise characterization
Preamplifier σ (mV) Signal (mV) SNR
C2BDA 2.64 85.3 32.2
Box channel 11 0.8 27.5 31.8
Box channel 6 1.6 37.2 23.3
Table II: Noise characterization for a fast input signal of 2.5 mVand 0.4 pC
V. CALIBRATION OF CURRENTPREAMPLIFIERS WITH MICROMEGAS-LIKE
INPUT SIGNAL
After the preliminar calibrations, the next aim was tostudy the properties of the real signal coming from aMGAS detector. The most suitable electronics to do so isthe current preamplifier because this kind of preamplifierdoes not modify the shape and the time properties of thesignal. Before measuring directly with the MGAS detec-tor, the current preamplifiers available, C2BDA and CC,were tested to see if they could handle the signal comingfrom the detector. The signal of the MGAS detector wassimulated using an Arbitrary wave Generator producinga signal with an amplitude of 5 mV, 100 ns FWHM and80 ns of rise time. Using this MGAS-like signal the Am-plification calibration and the Frequency calibration weredone. The amplification calibration was made to verify ifthe preamplifiers can still work in the linear regime withthis kind of input signal. The frequency calibration in-stead was made to understand if these preamplifiers candigest a signal that is as slow as the one coming from theMGAS detector.
Width In (ns) 0 50 100 150 200 250 300
Wid
th O
ut (
ns)
0
50
100
150
200
250
300
Calibration in frequency of c2bda
Width In (ns) 0 50 100 150 200 250 300
Wid
th O
ut (
ns)
10
20
30
40
50
60
Calibration in frequency of CC
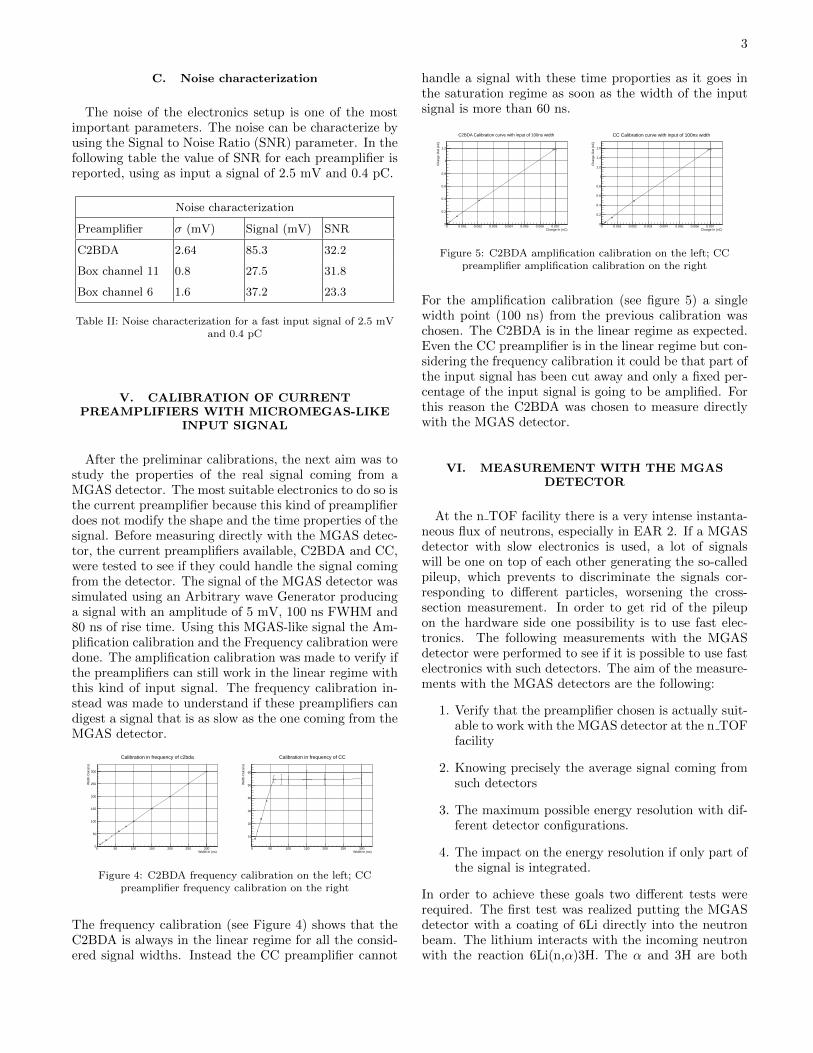
Figure 4: C2BDA frequency calibration on the left; CCpreamplifier frequency calibration on the right
The frequency calibration (see Figure 4) shows that theC2BDA is always in the linear regime for all the consid-ered signal widths. Instead the CC preamplifier cannot
handle a signal with these time proporties as it goes inthe saturation regime as soon as the width of the inputsignal is more than 60 ns.
Charge In (nC)0 0.001 0.002 0.003 0.004 0.005 0.006 0.007
Cha
rge
Out
(nC
)
0
0.2
0.4
0.6
0.8
1
1.2
C2BDA Calibration curve with input of 100ns width
Charge In (nC)0 0.001 0.002 0.003 0.004 0.005 0.006 0.007
Cha
rge
Out
(nC
)
0
0.2
0.4
0.6
0.8
1
1.2
1.4
1.6
CC Calibration curve with input of 100ns width
Figure 5: C2BDA amplification calibration on the left; CCpreamplifier amplification calibration on the right
For the amplification calibration (see figure 5) a singlewidth point (100 ns) from the previous calibration waschosen. The C2BDA is in the linear regime as expected.Even the CC preamplifier is in the linear regime but con-sidering the frequency calibration it could be that part ofthe input signal has been cut away and only a fixed per-centage of the input signal is going to be amplified. Forthis reason the C2BDA was chosen to measure directlywith the MGAS detector.
VI. MEASUREMENT WITH THE MGASDETECTOR
At the n TOF facility there is a very intense instanta-neous flux of neutrons, especially in EAR 2. If a MGASdetector with slow electronics is used, a lot of signalswill be one on top of each other generating the so-calledpileup, which prevents to discriminate the signals cor-responding to different particles, worsening the cross-section measurement. In order to get rid of the pileupon the hardware side one possibility is to use fast elec-tronics. The following measurements with the MGASdetector were performed to see if it is possible to use fastelectronics with such detectors. The aim of the measure-ments with the MGAS detectors are the following:
1. Verify that the preamplifier chosen is actually suit-able to work with the MGAS detector at the n TOFfacility
2. Knowing precisely the average signal coming fromsuch detectors
3. The maximum possible energy resolution with dif-ferent detector configurations.
4. The impact on the energy resolution if only part ofthe signal is integrated.
In order to achieve these goals two different tests wererequired. The first test was realized putting the MGASdetector with a coating of 6Li directly into the neutronbeam. The lithium interacts with the incoming neutronwith the reaction 6Li(n,α)3H. The α and 3H are both
4
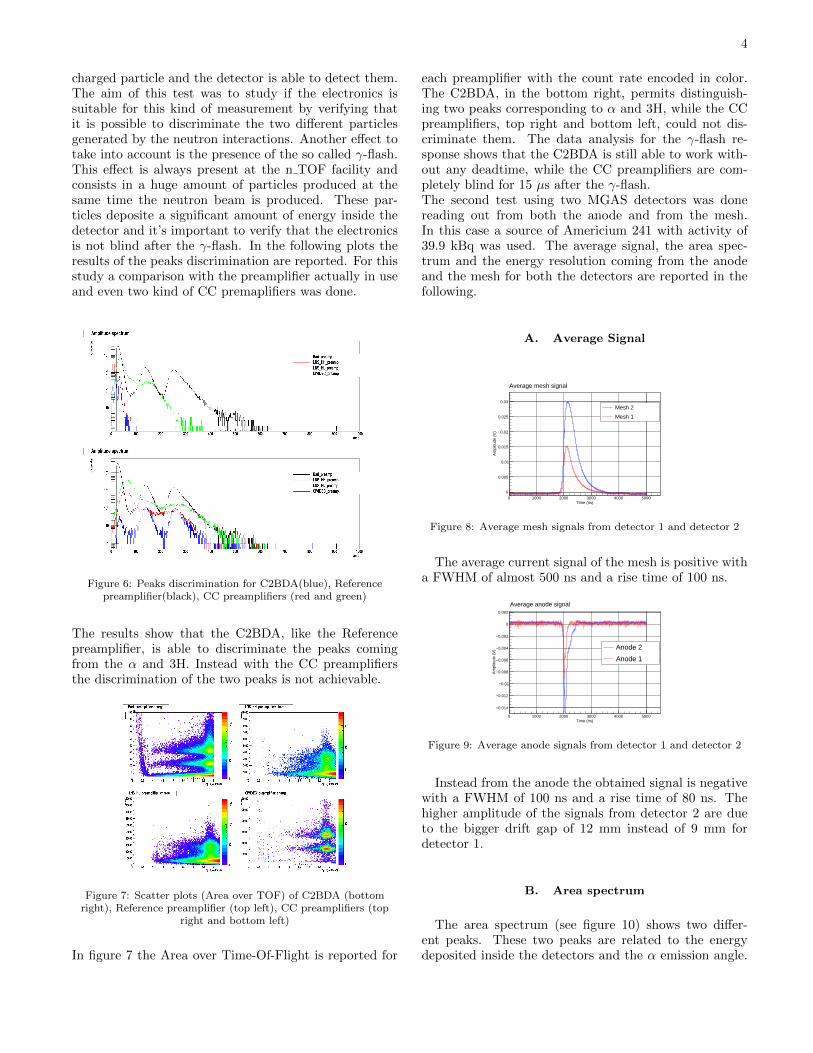
charged particle and the detector is able to detect them.The aim of this test was to study if the electronics issuitable for this kind of measurement by verifying thatit is possible to discriminate the two different particlesgenerated by the neutron interactions. Another effect totake into account is the presence of the so called γ-flash.This effect is always present at the n TOF facility andconsists in a huge amount of particles produced at thesame time the neutron beam is produced. These par-ticles deposite a significant amount of energy inside thedetector and it’s important to verify that the electronicsis not blind after the γ-flash. In the following plots theresults of the peaks discrimination are reported. For thisstudy a comparison with the preamplifier actually in useand even two kind of CC premaplifiers was done.
Figure 6: Peaks discrimination for C2BDA(blue), Referencepreamplifier(black), CC preamplifiers (red and green)
The results show that the C2BDA, like the Referencepreamplifier, is able to discriminate the peaks comingfrom the α and 3H. Instead with the CC preamplifiersthe discrimination of the two peaks is not achievable.
Figure 7: Scatter plots (Area over TOF) of C2BDA (bottomright), Reference preamplifier (top left), CC preamplifiers (top
right and bottom left)
In figure 7 the Area over Time-Of-Flight is reported for
each preamplifier with the count rate encoded in color.The C2BDA, in the bottom right, permits distinguish-ing two peaks corresponding to α and 3H, while the CCpreamplifiers, top right and bottom left, could not dis-criminate them. The data analysis for the γ-flash re-sponse shows that the C2BDA is still able to work with-out any deadtime, while the CC preamplifiers are com-pletely blind for 15 µs after the γ-flash.The second test using two MGAS detectors was donereading out from both the anode and from the mesh.In this case a source of Americium 241 with activity of39.9 kBq was used. The average signal, the area spec-trum and the energy resolution coming from the anodeand the mesh for both the detectors are reported in thefollowing.
A. Average Signal
Time (ns)0 1000 2000 3000 4000 5000
Am
plitu
de (
V)
0
0.005
0.01
0.015
0.02
0.025
0.03
Average mesh signal
Mesh 2
Mesh 1
Figure 8: Average mesh signals from detector 1 and detector 2
The average current signal of the mesh is positive witha FWHM of almost 500 ns and a rise time of 100 ns.
Time (ns)0 1000 2000 3000 4000 5000
Am
plitu
de (
V)
0.014−
0.012−
0.01−
0.008−
0.006−
0.004−
0.002−
0
0.002
Average anode signal
Anode 2
Anode 1
Figure 9: Average anode signals from detector 1 and detector 2
Instead from the anode the obtained signal is negativewith a FWHM of 100 ns and a rise time of 80 ns. Thehigher amplitude of the signals from detector 2 are dueto the bigger drift gap of 12 mm instead of 9 mm fordetector 1.
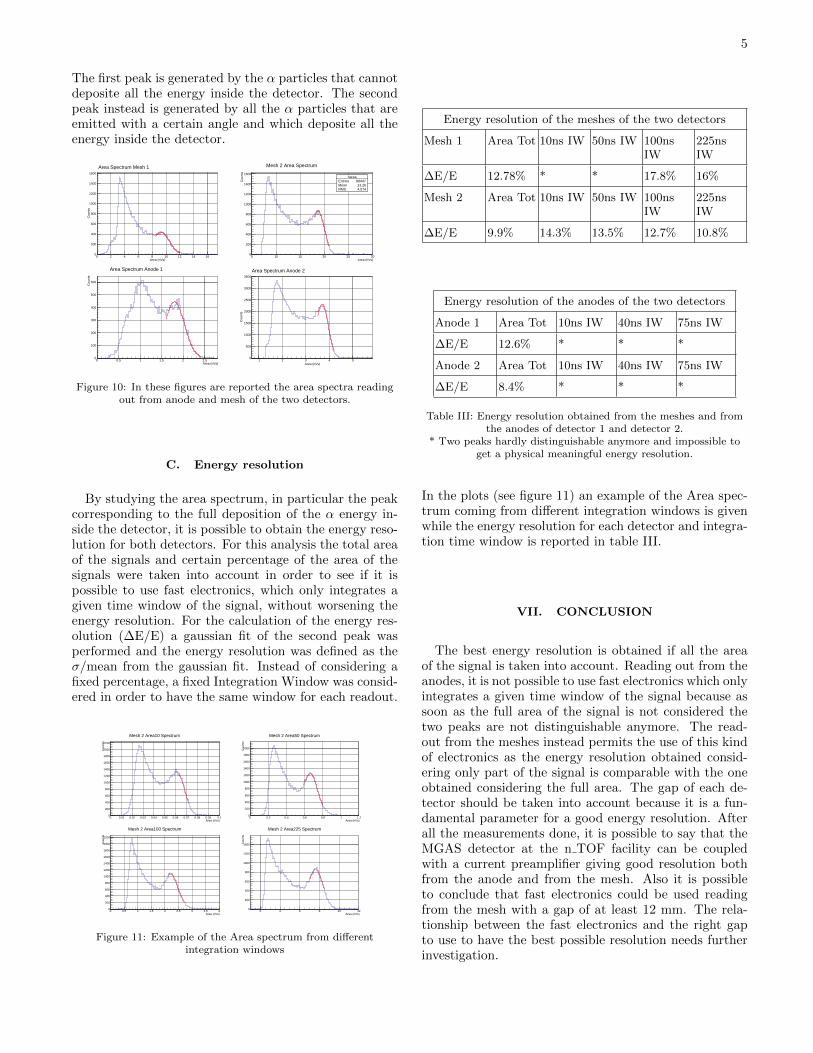
B. Area spectrum
The area spectrum (see figure 10) shows two differ-ent peaks. These two peaks are related to the energydeposited inside the detectors and the α emission angle.
5
The first peak is generated by the α particles that cannotdeposite all the energy inside the detector. The secondpeak instead is generated by all the α particles that areemitted with a certain angle and which deposite all theenergy inside the detector.
Area (nVs)0 2 4 6 8 10 12 14 16
Cou
nts
0
200
400
600
800
1000
1200
1400
1600
Area Spectrum Mesh 1
hareaEntries 88447Mean 13.26RMS 4.074
Area (nVs)5 10 15 20 25 30
Cou
nts
0
200
400
600
800
1000
1200
1400
1600harea
Entries 88447Mean 13.26RMS 4.074
Mesh 2 Area Spectrum
Area (nVs)0 0.5 1 1.5 2 2.5
Cou
nts
0
100
200
300
400
500
600
Area Spectrum Anode 1
Area (nVs)1 2 3 4 5
Cou
nts
0
500
1000
1500
2000
2500
3000
3500
Area Spectrum Anode 2
Figure 10: In these figures are reported the area spectra readingout from anode and mesh of the two detectors.
C. Energy resolution
By studying the area spectrum, in particular the peakcorresponding to the full deposition of the α energy in-side the detector, it is possible to obtain the energy reso-lution for both detectors. For this analysis the total areaof the signals and certain percentage of the area of thesignals were taken into account in order to see if it ispossible to use fast electronics, which only integrates agiven time window of the signal, without worsening theenergy resolution. For the calculation of the energy res-olution (∆E/E) a gaussian fit of the second peak wasperformed and the energy resolution was defined as theσ/mean from the gaussian fit. Instead of considering afixed percentage, a fixed Integration Window was consid-ered in order to have the same window for each readout.
Area (nVs)0 0.01 0.02 0.03 0.04 0.05 0.06 0.07 0.08 0.09 0.1
Cou
nts
0
200
400
600
800
1000
1200
1400
1600
1800
2000
2200
Mesh 2 Area10 Spectrum
Area (nVs)0 0.2 0.4 0.6 0.8 1 1.2
Cou
nts
0
200
400
600
800
1000
1200
1400
1600
1800
2000
Mesh 2 Area50 Spectrum
Area (nVs)0 0.5 1 1.5 2 2.5 3 3.5 4
Cou
nts
0
200
400
600
800
1000
1200
1400
1600
1800
2000
2200
Mesh 2 Area100 Spectrum
Area (nVs)2 4 6 8 10 12
Cou
nts
0
200
400
600
800
1000
1200
1400
Mesh 2 Area225 Spectrum
Figure 11: Example of the Area spectrum from differentintegration windows
Energy resolution of the meshes of the two detectors
Mesh 1 Area Tot 10ns IW 50ns IW 100nsIW
225nsIW
∆E/E 12.78% * * 17.8% 16%
Mesh 2 Area Tot 10ns IW 50ns IW 100nsIW
225nsIW
∆E/E 9.9% 14.3% 13.5% 12.7% 10.8%
Energy resolution of the anodes of the two detectors
Anode 1 Area Tot 10ns IW 40ns IW 75ns IW
∆E/E 12.6% * * *
Anode 2 Area Tot 10ns IW 40ns IW 75ns IW
∆E/E 8.4% * * *
Table III: Energy resolution obtained from the meshes and fromthe anodes of detector 1 and detector 2.
* Two peaks hardly distinguishable anymore and impossible toget a physical meaningful energy resolution.
In the plots (see figure 11) an example of the Area spec-trum coming from different integration windows is givenwhile the energy resolution for each detector and integra-tion time window is reported in table III.
VII. CONCLUSION
The best energy resolution is obtained if all the areaof the signal is taken into account. Reading out from theanodes, it is not possible to use fast electronics which onlyintegrates a given time window of the signal because assoon as the full area of the signal is not considered thetwo peaks are not distinguishable anymore. The read-out from the meshes instead permits the use of this kindof electronics as the energy resolution obtained consid-ering only part of the signal is comparable with the oneobtained considering the full area. The gap of each de-tector should be taken into account because it is a fun-damental parameter for a good energy resolution. Afterall the measurements done, it is possible to say that theMGAS detector at the n TOF facility can be coupledwith a current preamplifier giving good resolution bothfrom the anode and from the mesh. Also it is possibleto conclude that fast electronics could be used readingfrom the mesh with a gap of at least 12 mm. The rela-tionship between the fast electronics and the right gapto use to have the best possible resolution needs furtherinvestigation.

6
ACKNOWLEDGEMENTS
The contributes of CIVIDEC Instrumentation GmbH,which provided the calibration electronics and preampli-fiers, as well as INFN-LNS Catania, providing the CCcurrent amplifier, is greatly acknowledged.