Embed Size (px)
Citation preview
ORIGINAL RESEARCHpublished: 23 March 2017
doi: 10.3389/fpsyg.2017.00416
Frontiers in Psychology | www.frontiersin.org 1 March 2017 | Volume 8 | Article 416
Edited by:
Geraint A. Wiggins,
Queen Mary University of London, UK
Reviewed by:
Dipanjan Roy,
Allahabad University, India
Lin Guo,
University of Pennsylvania, USA
*Correspondence:
Blair Kaneshiro
Specialty section:
This article was submitted to
Cognition,
a section of the journal
Frontiers in Psychology
Received: 24 October 2017
Accepted: 06 March 2017
Published: 23 March 2017
Citation:
Kaneshiro B, Ruan F, Baker CW and
Berger J (2017) Characterizing
Listener Engagement with Popular
Songs Using Large-Scale Music
Discovery Data. Front. Psychol. 8:416.
doi: 10.3389/fpsyg.2017.00416
Characterizing Listener Engagementwith Popular Songs UsingLarge-Scale Music Discovery Data
Blair Kaneshiro 1, 2*, Feng Ruan 3, Casey W. Baker 2 and Jonathan Berger 1
1Center for Computer Research in Music and Acoustics, Stanford University, Stanford, CA, USA, 2 Shazam Entertainment,
Ltd., Redwood City, CA, USA, 3Department of Statistics, Stanford University, Stanford, CA, USA
Music discovery in everyday situations has been facilitated in recent years by audio
content recognition services such as Shazam. The widespread use of such services
has produced a wealth of user data, specifying where and when a global audience takes
action to learnmore about music playing around them. Here, we analyze a large collection
of Shazam queries of popular songs to study the relationship between the timing of
queries and corresponding musical content. Our results reveal that the distribution of
queries varies over the course of a song, and that salient musical events drive an increase
in queries during a song. Furthermore, we find that the distribution of queries at the time
of a song’s release differs from the distribution following a song’s peak and subsequent
decline in popularity, possibly reflecting an evolution of user intent over the “life cycle” of
a song. Finally, we derive insights into the data size needed to achieve consistent query
distributions for individual songs. The combined findings of this study suggest that music
discovery behavior, and other facets of the human experience of music, can be studied
quantitatively using large-scale industrial data.
Keywords: Shazam, popular music, music discovery, multimedia search, music information retrieval, musical
engagement, social media
1. INTRODUCTION
Discovering new music is a popular pastime, and opportunities for music discovery presentthemselves throughout everyday life. However, relatively little is known about this behaviorand what drives it. In a recent interview study, Laplante and Downie (2011) found that theactive, deliberate search for music information—whether finding new music or information aboutmusic—is generally considered both useful and intrinsically enjoyable. In an earlier diary study,however, Cunningham et al. (2007) report that the majority of exposures to new music occurin passive encounters—that is, when a listener was not actively seeking to discover new music.Furthermore, while participants in that study reacted positively to over 60% of their encounterswith new music, they also reported that passive music encounters were difficult to act upon in themoment. Since the publication of that study, the rise of mobile services and ubiquitous internetnow facilitate instantaneous music discovery during everyday life, whether music is actively soughtor passively encountered. Accompanying the widespread use of such services is an unprecedentedvolume of user data bearing potential insights into where and when people discover music, as
Kaneshiro et al. Large-Scale Music Discovery
well as what music they choose to discover. These datasurpass what can be collected through controlled laboratoryor ethnographic studies in terms of size, scope, and ecologicalvalidity.
In recent years, industrial user data reflecting a variety ofmusical behaviors—including but not limited to social sharing,consumption, and information seeking—have been utilized inmusic informatics research. Twitter, being freely available foraggregation, currently serves as the most common source ofdata and has been used to explore a variety of topics includingartist and music similarity (Schedl, 2010; Schedl et al., 2014),music recommendation (Zangerle et al., 2012; Pichl et al., 2014,2015), geographical attributes of music consumption (Schedl,2013; Moore et al., 2014), and hit prediction (Kim et al., 2014;Zangerle et al., 2016). Music consumption and sharing hasalso been approached using Spotify URLs shared via Twitter(Pichl et al., 2014, 2015) and music download data from theMixRadio database (Bansal and Woolhouse, 2015). A number ofthese studies have contributed or made use of publicly availableresearch corpuses, including the Million Musical Tweets Dataset,containing temporal and geographical information linked tomusic-related tweets (Hauger et al., 2013); the continuallyupdated #nowplaying dataset of music-related tweets (Zangerleet al., 2014); and Gracenote’s GNMID14 dataset, which includesannotated music identification matches (Summers et al., 2016).
In the present study, we explore large-scale music discoverybehavior using query data from the audio identification serviceShazam1. In particular, we investigate whether the timing ofaudio identification queries within a song can be related backto specific musical events. We aggregate and analyze a largecollection of Shazam query offsets—that moment in a song whena user initiates a query—over a set ofmassively popular songs.Wefirst verify that the distribution of query offsets is not uniformbut in fact varies over the course of a song. Next, we showthat the overall shape of a query offset histogram also variesover the “life cycle” of a hit song, with more queries occurringtoward the start of a song once the song has achieved widespreadpopularity. We then demonstrate that salient musical events—such as the start of a song, onset of vocals, and start of firstchorus—are followed by a rise in query activity. We concludewith an assessment of histogram consistency as a function ofdata size in order to determine what constitutes a sufficientdata size for this type of analysis. The findings from this studyprovide first insights into the types of musical events thatengage listeners at a large scale, compelling them to take actionto obtain more information about a piece of music. To ourknowledge, this is the first time that engagement with specificmusical events has been studied with an ecologically valid, large-scale dataset. Findings from this study will advance knowledgeof consumption of popular music, information seeking aboutmusic, and—more broadly—how and when a large audiencechooses to engage with music in their environment. Finally,to promote further research on music discovery, the dataset ofover 188 million Shazam queries analyzed in this study is madepublicly available.
1http://www.shazam.com.
2. MATERIALS AND METHODS
2.1. Audio Content Recognition withShazamShazam is a service that returns the identity of a prerecordedaudio excerpt—usually a song—in response to a userquery. Over 20 million Shazam queries are performed eachday by more than 100 million monthly users worldwide;incoming queries are matched over a deduplicated catalogcomprising over 30 million audio tracks. Shazam’s audiorecognition algorithm is based on fast combinatorial hashingof spectrogram peaks, and was developed with real-worlduse cases in mind. As a result, Shazam’s performance isrobust to noise and distortion; provides fast performanceover a large database of music; and offers a high recognition(true-positive) rate with a low false-positive rate (Wang,2003).
Shazam queries typically involve a single button press once theapplication is loaded. For queries initiated from mobile devices,2
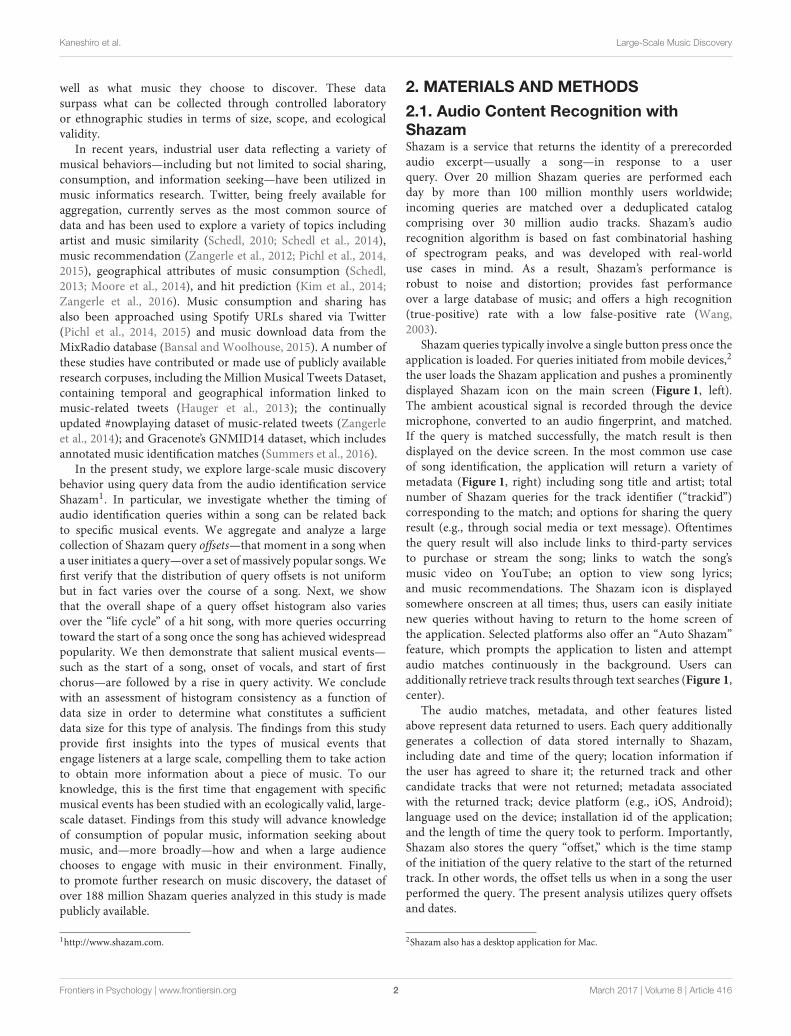
the user loads the Shazam application and pushes a prominentlydisplayed Shazam icon on the main screen (Figure 1, left).The ambient acoustical signal is recorded through the devicemicrophone, converted to an audio fingerprint, and matched.If the query is matched successfully, the match result is thendisplayed on the device screen. In the most common use caseof song identification, the application will return a variety ofmetadata (Figure 1, right) including song title and artist; totalnumber of Shazam queries for the track identifier (“trackid”)corresponding to the match; and options for sharing the queryresult (e.g., through social media or text message). Oftentimesthe query result will also include links to third-party servicesto purchase or stream the song; links to watch the song’smusic video on YouTube; an option to view song lyrics;and music recommendations. The Shazam icon is displayedsomewhere onscreen at all times; thus, users can easily initiatenew queries without having to return to the home screen ofthe application. Selected platforms also offer an “Auto Shazam”feature, which prompts the application to listen and attemptaudio matches continuously in the background. Users canadditionally retrieve track results through text searches (Figure 1,center).
The audio matches, metadata, and other features listedabove represent data returned to users. Each query additionallygenerates a collection of data stored internally to Shazam,including date and time of the query; location information ifthe user has agreed to share it; the returned track and othercandidate tracks that were not returned; metadata associatedwith the returned track; device platform (e.g., iOS, Android);language used on the device; installation id of the application;and the length of time the query took to perform. Importantly,Shazam also stores the query “offset,” which is the time stampof the initiation of the query relative to the start of the returnedtrack. In other words, the offset tells us when in a song the userperformed the query. The present analysis utilizes query offsetsand dates.
2Shazam also has a desktop application for Mac.
Frontiers in Psychology | www.frontiersin.org 2 March 2017 | Volume 8 | Article 416
Kaneshiro et al. Large-Scale Music Discovery
FIGURE 1 | Shazam application screenshots. Shazam audio queries are typically initiated from a mobile device. (Left) Upon loading the application, the Shazamicon is prominently displayed on the main screen. (Center) Queries can also be initiated through a text search. (Right) A successful audio query or selection from textquery results returns the track page for the song of interest. Information returned to the user on the track page includes basic metadata about the song, as well asrelated media including the music video and lyrics when available. The Shazam logo is ubiquitously displayed as users navigate the application; thus, new queries canbe initiated at any time. Image used with permission.
2.2. Dataset2.2.1. Song SetAs this study is a first quantitative analysis of Shazam queryoffsets, we chose to limit the number of songs used for analysis,but to select songs that would each offer an abundance ofShazam queries while also reflecting a widespread listeningaudience. For these reasons, we chose as our song set thetop 20 songs from the Billboard Year End Hot 100 chartfor 2015, which lists the most popular songs across genresfor the entire year, as determined by radio impressions, sales,and streaming activity3. An additional advantage of selectingsongs from this particular chart is that the Billboard Hot 100chart is released weekly; therefore, our analyses can probemusic discovery behavior at specific stages of song popularity.Billboard charts in general are considered a standard industrymeasure of song popularity, and weekly Billboard Hot 100charts in particular have been used as a benchmark of songpopularity in a number of previous studies (Kim et al., 2014;Nunes and Ordanini, 2014; Nunes et al., 2015; Zangerle et al.,2016).
The set of songs is summarized in Table 1. The 15th-rankedsong on the Billboard chart (“Bad Blood” by Taylor Swift
3http://www.billboard.com/charts/year-end/2015/hot-100-songs.
Feat. Kendrick Lamar) was excluded from analysis due to aknown problem with the query data. We therefore include the21st-ranked song in the set in order to have a set totaling20 songs.
2.2.1.1. Song metadataAs the selected set of songs all achieved widespread popularity,it was possible to aggregate additional information about thesongs from a variety of public sources. We obtained releasedates from each song’s Wikipedia page. Peak Billboard chartdates were obtained from the Billboard Hot 100 weeklycharts and verified against Wikipedia when possible. For songsthat held their peak chart position for multiple weeks, weused the date of the first week that the peak position wasreached.
To identify the most “correct” version of the audio for eachsong, we followed the Amazon purchase link, when it wasavailable, from the Shazam track page corresponding to theprimary trackid of the song. If the Amazon link was missingor led to a clearly incorrect destination, we located the songon Amazon manually or through an alternate Shazam trackid.We purchased digital versions of all tracks from their resolvedAmazon destinations, and then verified the song lengths againstprimary Spotify results when possible.
Frontiers in Psychology | www.frontiersin.org 3 March 2017 | Volume 8 | Article 416
Kaneshiro et al. Large-Scale Music Discovery
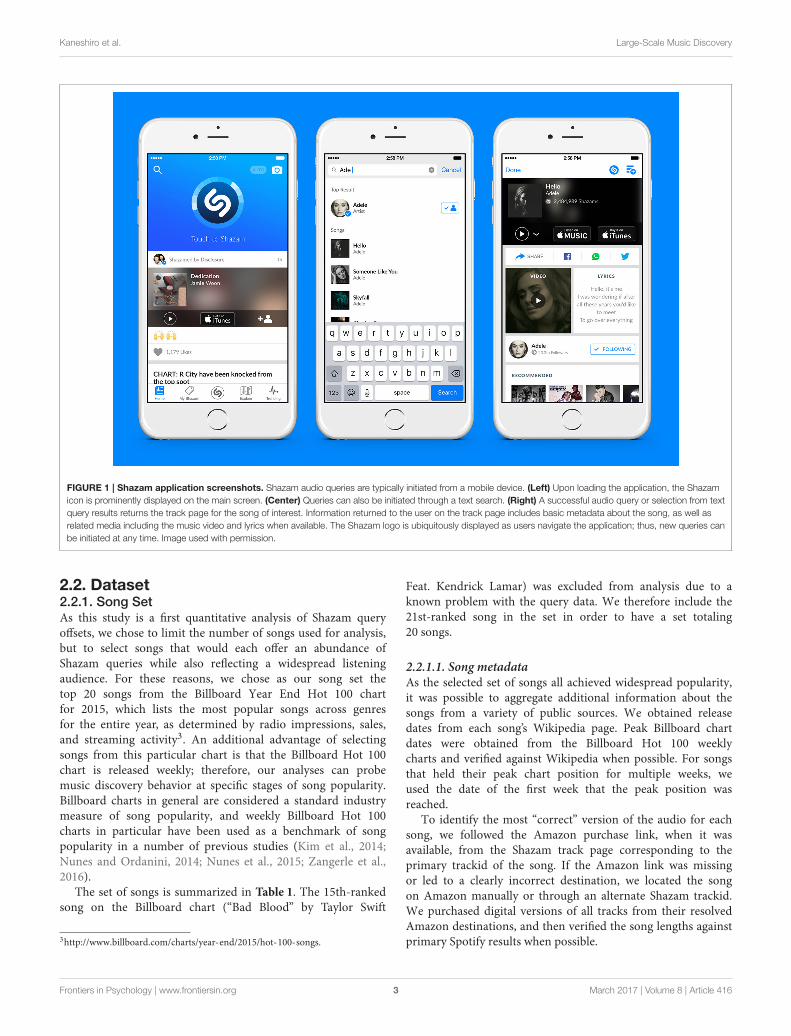
TABLE 1 | Song and dataset information.
Rank Title Artist Length (s) Shazam query offsets
% usable # usable
1 Uptown Funk! Mark Ronson Feat. Bruno Mars 270 98.57 13,855,245
2 Thinking Out Loud Ed Sheeran 282 98.97 17,142,656
3 See You Again Wiz Khalifa Feat. Charlie Puth 230 98.73 12,522,399
4 Trap Queen Fetty Wap 223 98.77 6,072,939
5 Sugar Maroon 5 236 98.92 5,811,731
6 Shut Up and Dance Walk the Moon 200 98.47 5,034,637
7 Blank Space Taylor Swift 232 98.11 6,764,128
8 Watch Me Silento 186 96.99 4,463,863
9 Earned It (Fifty Shades of Grey) The Weeknd 252 98.66 7,514,440
10 The Hills The Weeknd 243 99.08 8,657,473
11 Cheerleader (Felix Jaehn Remix) OMI 182 96.84 17,933,224
12 Can’t Feel My Face The Weeknd 214 99.34 8,675,375
13 Love Me Like You Do Ellie Goulding 251 99.56 9,925,090
14 Take Me to Church Hozier 242 98.82 15,854,482
16 Lean On Major Lazer & DJ Snake Feat. M0 177 99.10 19,974,795
17 Want to Want Me Jason Derulo 208 98.89 9,885,505
18 Shake It Off Taylor Swift 220 95.90 3,162,707
19 Where Are Ü Now Skrillex & Diplo with Justin Bieber 251 99.44 7,639,899
20 Fight Song Rachel Platten 205 99.23 4,359,870
21 679 Fetty Wap Feat. Remy Boyz 197 98.71 3,020,785
TOTAL 188,271,243
Shazam queries corresponding to 20 top-ranked songs from the Billboard Year End Hot 100 chart for 2015 were analyzed in the study. Song lengths are rounded up to the nearest
second. The percent usable and number of usable queries reflect the cleaned datasets. Song 15 is omitted from analysis.
2.2.1.2. Coding of salient musical eventsPortions of our analysis focus on the onset of vocals andonset of the first occurrence of the chorus. While the songsanalyzed here broadly represent “popular music,” assigningconventional pop-song labels, such as verses and choruses, to thestructural elements of the songs proved somewhat challengingand subjective. Therefore, for an objective identification ofchorus elements within each song, we used lyrics from the Geniuswebsite,4 which are both fully licensed5 and annotated withstructural song-part labels such as “Verse” and “Chorus.” For thefirst onset of vocals, we used the audio timing linked to the firstoccurrence of labeled (e.g., “Verse” or “Bridge”) content in thelyrics, ignoring “Intro” content. For the first occurrence of thechorus, we identified the timing of the audio corresponding to thefirst instance of “Chorus” or “Hook” material in the lyrics. Thesetimes are not necessarily disjoint for a given song—e.g., the firstentrance of vocals could be an instance of the chorus.
Additional metadata for the song set, including Shazam andAmazon track identifiers, release and peak Billboard dates, andonset times of vocals and choruses, are included in the Table S1.
2.2.2. Shazam Data Aggregation and PreprocessingFor the selected songs, we aggregated worldwide Shazam querydates and offsets from the Shazam database over the date
4http://genius.com.5http://genius.com/static/licensing.
range January 1, 2014 through May 31, 2016, inclusive. Allbut one song were released after January 1, 2014, and songspeaked on Billboard between September 6, 2014 and October 31,2015. Therefore, we consider this date range representative ofa song’s journey through the Billboard charts. Aggregated datainclude audio queries only—no text queries—and do not includeAuto Shazam queries or queries performed through the desktopapplication.
Offset values are given in seconds with sub-millisecondprecision. Dates are resolved by day, based on GMT timestamps.To clean the data, we removed incomplete queries (missing dateor offset values) as well as queries with offsets less than or equalto zero, or greater than the length of the corresponding audiorecording. We did not exclude queries whose date preceded therelease date, as listed release dates for songs as singles couldcome after the release date for an album on which the song wasincluded.
The number of usable queries per song ranged from 3,020,785to 19,974,795, with a median value of 8,148,686 queries. Between95.90 and 99.56% of the original number of queries for each songwere usable after data cleaning. In total, the dataset comprises188,271,243 queries across the 20 songs. The cleaned datasets arepublicly available for download in .csv format from the StanfordDigital Repository (Shazam Entertainment, Ltd., 2016)6.
6http://purl.stanford.edu/fj396zz8014.
Frontiers in Psychology | www.frontiersin.org 4 March 2017 | Volume 8 | Article 416
Kaneshiro et al. Large-Scale Music Discovery
2.3. AnalysisAll data preprocessing and analyses were performed using Rsoftware, version 3.2.2 (R Core Team, 2015).
2.3.1. Tests of UniformityAs the present study rests on the assumption that volumesof Shazam queries are higher at some points of a song thanothers, our first analysis was to determine whether the volumeof query offsets for a given song indeed varies over time. Toaddress this first question, we performed two-sided Kolmogorov-Smirnov tests (Conover, 1971) on the distributions of offsets foreach song, comparing each distribution of offsets to a uniformdistribution over the interval [0, songLength]. Under the nullhypothesis of uniformly distributed query offsets, Shazam querieswould be equally likely to occur at any point during a song,precluding further exploration of musical events that drive peaksin the query offset histograms. Due to the possibility of ties withour present data size, we added a small perturbation to eachoffset (uniformly distributed random variables over the interval[−0.000005, 0.000005]) before performing the tests.
2.3.2. Assessing Changes in Histogram ShapeOur second question concerned changes in histogram shape overtime. Anecdotal analyses of Shazam query offsets have suggestedthat once a song becomes popular, the distribution of queryoffsets shifts closer to the beginning of the song.
To approach this problem quantitatively required both atemporal metric of song popularity and a definition for whatportion of a song constitutes its “beginning.” To address thefirst point, we selected three points of interest in the life cycleof each song: The song’s release date; the date of its peak onthe Billboard Hot 100 chart; and the end dates of the dataset.Ranges of time between these three events varied by song. Songspeaked on Billboard between 19 and 463 days after release, witha median release-to-peak delay of 127 days. The time rangebetween peaking on Billboard and the last date in the datasetranged from 213 to 633 days, with a median value of 374 days.Dates and latencies between dates are reported in Table S1.
For the second point, instead of choosing an arbitrary,fixed duration (e.g., 30 s) to denote the beginning of eachsong, we devised an analysis that would compare distributionsover all possible beginning durations db using the followingprocedure. For each song, we first extracted the first 100,000queries following release and peak Billboard dates, and the final100,000 queries, by date, in the dataset. Following that, for dbincreasing from 1 to the length of the song in seconds, weperformed Chi-squared tests of proportions on Billboard peakdate vs. release date, end of dataset vs. release date, and endof dataset vs. Billboard peak date. Because we were specificallyinterested in assessing whether queries migrated toward thebeginning of the song for the later set of queries, we performedone-sided tests with the alternative hypothesis being that theproportion of queries less than db was greater for the set ofqueries corresponding to the later time point.
Due to data size, the p-values resulting from these testswere generally so small as to be uninformative. Therefore,we focus on percentile Chi-squared statistics over increasing
db for each song, and report these results across songs. Thisanalysis comprises a total of 13,503 multiple comparisons(three comparisons per time point per song times 4,501total time points across all songs). Therefore, as we do notcorrect here for multiple comparisons, we use a conservativesignificance threshold of p < 10−10, keeping us well underthe statistical significance threshold of α = 0.01, hada Bonferroni correction been performed (Bonferroni, 1936;McDonald, 2014).
2.3.3. Computing Histogram Slopes at Salient
Musical EventsFor our third analysis, we wished to test the hypothesis thatsalient musical events drive a subsequent increase in queryvolume. For the present analysis we chose three salient structuralevents that were present in every song: Beginning of song, initialonset of vocals, and initial onset of chorus/hook section.
We devised an exploratory analysis of the query offset volumearound these musical events by focusing on offset histogramslopes following these events. As our previous analysis revealeda leftward shift in offset distributions for later dates, we usedonly the first 1,000,000 queries for each song (by date) forthis computation. We first used local polynomial regression(Fan and Gijbels, 1996) to estimate histogram slopes overtime for each song, with a temporal resolution of 1 s. Wethen converted each song’s estimated histogram slopes to slopepercentiles in order to bring the data to a more commonscale across songs. As the timing of onset of vocals andchorus can vary from song to song, we extracted 15-s analysiswindows starting from the onset of each event, and then foreach event type (beginning, vocals, chorus) we aggregated thewindows across songs so that the 15-s intervals were nowaligned according to the onsets of the musical event of interest—similar to the approach taken by Tsai et al. (2014) in analyzingphysiological responses at chorus onsets across a set of popularsongs.
For each of the musical events of interest, we report themedian of histogram slope percentiles over time across the songs,along with first and third quartiles. For reference, we also reportresults from the same analysis, using randomly selected windowstart times for each song.
2.3.4. Data Size and Histogram ConsistencyOur final analysis examined the relationship between data sizeand histogram consistency. One reason for selecting massivelypopular songs was to have millions of queries to work with foreach. But do the underlying distributions of the data require suchlarge collections of queries, or is a smaller sample size sufficient?
To investigate this matter further, we assessed consistencyof query offset distributions, computing histogram distancebetween disjoint data subsets of varying sample size forindividual songs. For songs whose data comprised morethan 8 million queries, we drew a random subsample of8 million queries for the following analysis. On a per-songbasis we randomly partitioned the collection of queries intotwo halves. For an increasing number of trials ni from 1to nTotalTrials/2, we normalized the cumulative histograms
Frontiers in Psychology | www.frontiersin.org 5 March 2017 | Volume 8 | Article 416
Kaneshiro et al. Large-Scale Music Discovery
of the two halves into discrete probability densities (eachsumming to 1), and then used the total variation distance(Levin et al., 2009) to measure the distance between thesetwo probability distributions. This partitioning procedure wasrepeated over 100 randomization iterations for each song. Wethen computed the mean output across randomization iterationsfor each song. We report the median, across songs, of theseresults.
3. RESULTS
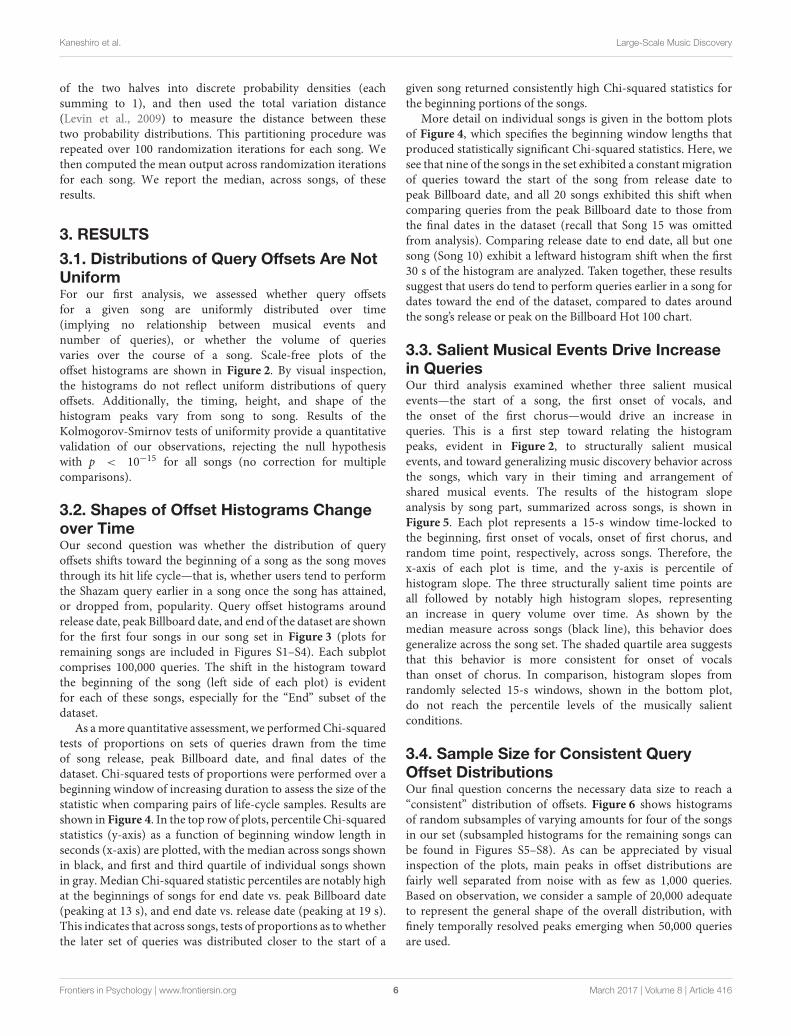
3.1. Distributions of Query Offsets Are NotUniformFor our first analysis, we assessed whether query offsetsfor a given song are uniformly distributed over time(implying no relationship between musical events andnumber of queries), or whether the volume of queriesvaries over the course of a song. Scale-free plots of theoffset histograms are shown in Figure 2. By visual inspection,the histograms do not reflect uniform distributions of queryoffsets. Additionally, the timing, height, and shape of thehistogram peaks vary from song to song. Results of theKolmogorov-Smirnov tests of uniformity provide a quantitativevalidation of our observations, rejecting the null hypothesiswith p < 10−15 for all songs (no correction for multiplecomparisons).
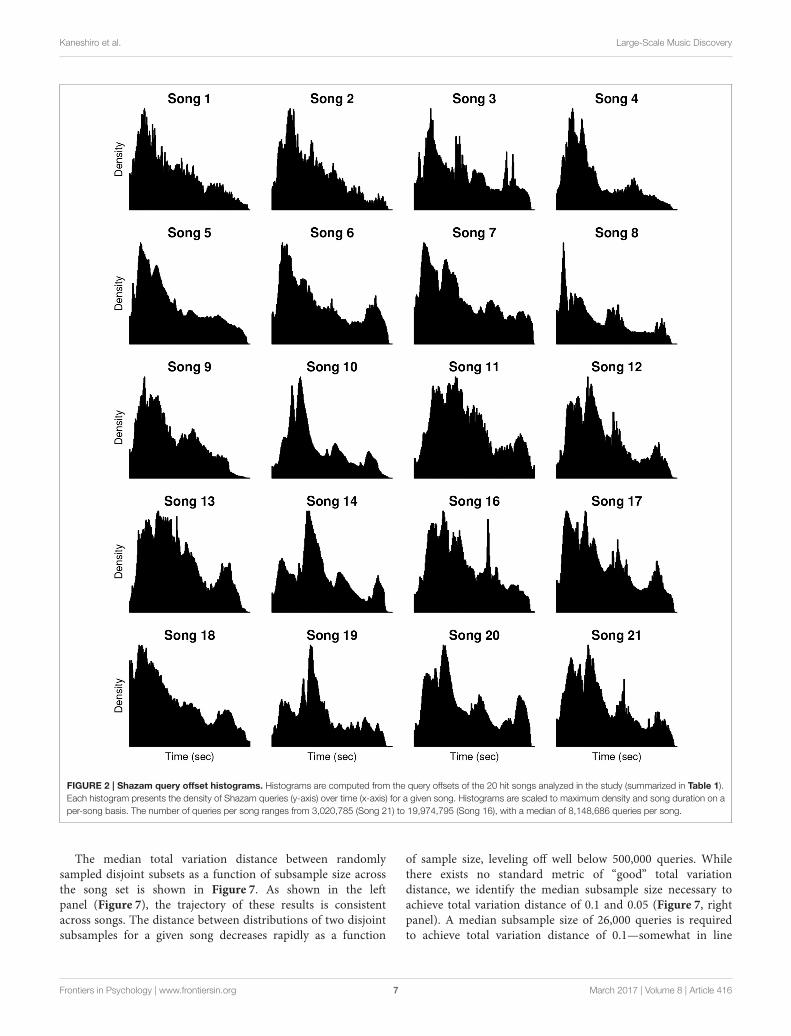
3.2. Shapes of Offset Histograms Changeover TimeOur second question was whether the distribution of queryoffsets shifts toward the beginning of a song as the song movesthrough its hit life cycle—that is, whether users tend to performthe Shazam query earlier in a song once the song has attained,or dropped from, popularity. Query offset histograms aroundrelease date, peak Billboard date, and end of the dataset are shownfor the first four songs in our song set in Figure 3 (plots forremaining songs are included in Figures S1–S4). Each subplotcomprises 100,000 queries. The shift in the histogram towardthe beginning of the song (left side of each plot) is evidentfor each of these songs, especially for the “End” subset of thedataset.
As amore quantitative assessment, we performed Chi-squaredtests of proportions on sets of queries drawn from the timeof song release, peak Billboard date, and final dates of thedataset. Chi-squared tests of proportions were performed over abeginning window of increasing duration to assess the size of thestatistic when comparing pairs of life-cycle samples. Results areshown in Figure 4. In the top row of plots, percentile Chi-squaredstatistics (y-axis) as a function of beginning window length inseconds (x-axis) are plotted, with the median across songs shownin black, and first and third quartile of individual songs shownin gray. Median Chi-squared statistic percentiles are notably highat the beginnings of songs for end date vs. peak Billboard date(peaking at 13 s), and end date vs. release date (peaking at 19 s).This indicates that across songs, tests of proportions as to whetherthe later set of queries was distributed closer to the start of a
given song returned consistently high Chi-squared statistics forthe beginning portions of the songs.
More detail on individual songs is given in the bottom plotsof Figure 4, which specifies the beginning window lengths thatproduced statistically significant Chi-squared statistics. Here, wesee that nine of the songs in the set exhibited a constant migrationof queries toward the start of the song from release date topeak Billboard date, and all 20 songs exhibited this shift whencomparing queries from the peak Billboard date to those fromthe final dates in the dataset (recall that Song 15 was omittedfrom analysis). Comparing release date to end date, all but onesong (Song 10) exhibit a leftward histogram shift when the first30 s of the histogram are analyzed. Taken together, these resultssuggest that users do tend to perform queries earlier in a song fordates toward the end of the dataset, compared to dates aroundthe song’s release or peak on the Billboard Hot 100 chart.
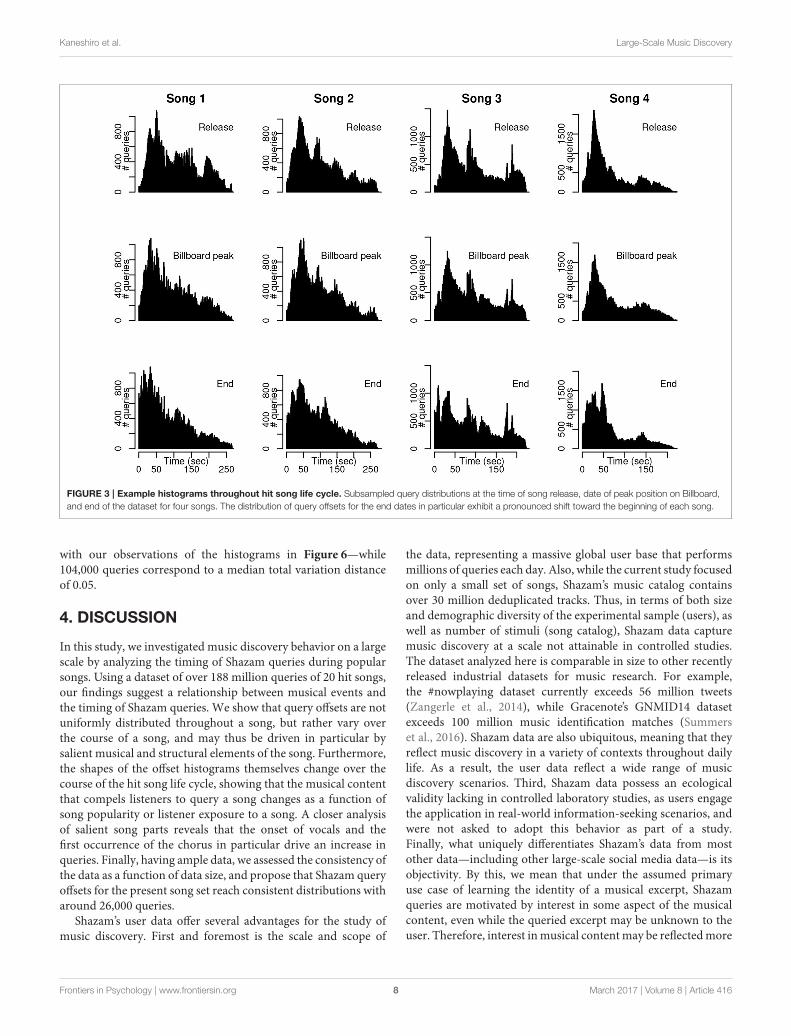
3.3. Salient Musical Events Drive Increasein QueriesOur third analysis examined whether three salient musicalevents—the start of a song, the first onset of vocals, andthe onset of the first chorus—would drive an increase inqueries. This is a first step toward relating the histogrampeaks, evident in Figure 2, to structurally salient musicalevents, and toward generalizing music discovery behavior acrossthe songs, which vary in their timing and arrangement ofshared musical events. The results of the histogram slopeanalysis by song part, summarized across songs, is shown inFigure 5. Each plot represents a 15-s window time-locked tothe beginning, first onset of vocals, onset of first chorus, andrandom time point, respectively, across songs. Therefore, thex-axis of each plot is time, and the y-axis is percentile ofhistogram slope. The three structurally salient time points areall followed by notably high histogram slopes, representingan increase in query volume over time. As shown by themedian measure across songs (black line), this behavior doesgeneralize across the song set. The shaded quartile area suggeststhat this behavior is more consistent for onset of vocalsthan onset of chorus. In comparison, histogram slopes fromrandomly selected 15-s windows, shown in the bottom plot,do not reach the percentile levels of the musically salientconditions.
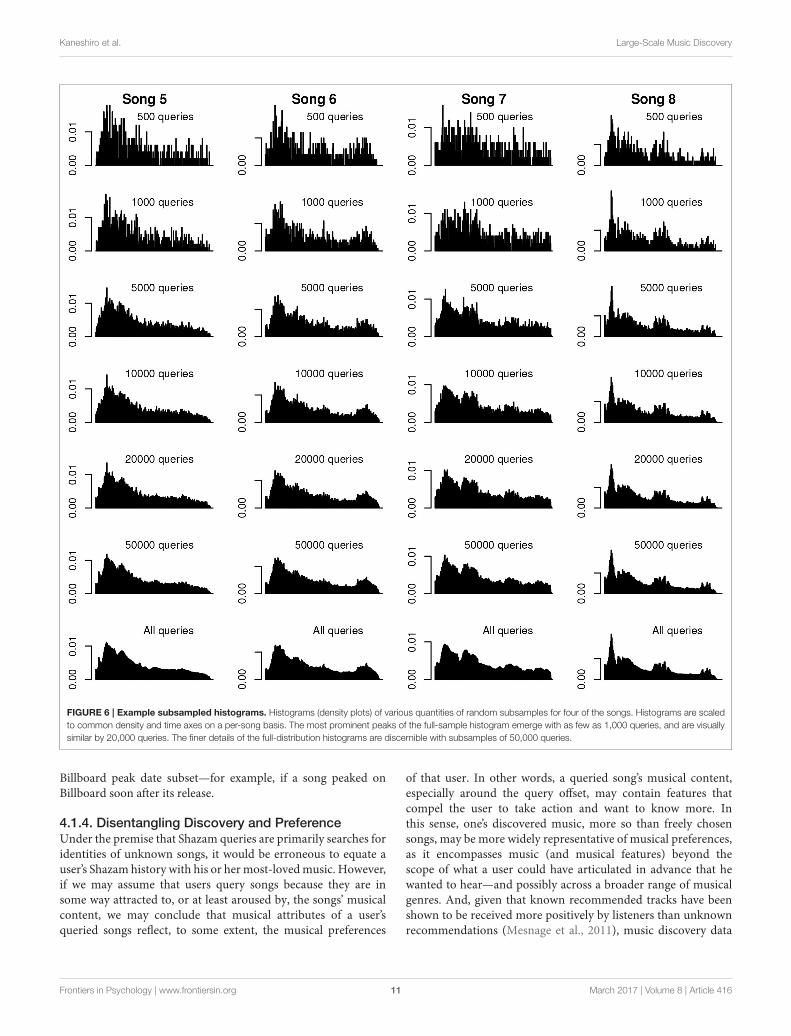
3.4. Sample Size for Consistent QueryOffset DistributionsOur final question concerns the necessary data size to reach a“consistent” distribution of offsets. Figure 6 shows histogramsof random subsamples of varying amounts for four of the songsin our set (subsampled histograms for the remaining songs canbe found in Figures S5–S8). As can be appreciated by visualinspection of the plots, main peaks in offset distributions arefairly well separated from noise with as few as 1,000 queries.Based on observation, we consider a sample of 20,000 adequateto represent the general shape of the overall distribution, withfinely temporally resolved peaks emerging when 50,000 queriesare used.
Frontiers in Psychology | www.frontiersin.org 6 March 2017 | Volume 8 | Article 416
Kaneshiro et al. Large-Scale Music Discovery
FIGURE 2 | Shazam query offset histograms. Histograms are computed from the query offsets of the 20 hit songs analyzed in the study (summarized in Table 1).Each histogram presents the density of Shazam queries (y-axis) over time (x-axis) for a given song. Histograms are scaled to maximum density and song duration on aper-song basis. The number of queries per song ranges from 3,020,785 (Song 21) to 19,974,795 (Song 16), with a median of 8,148,686 queries per song.
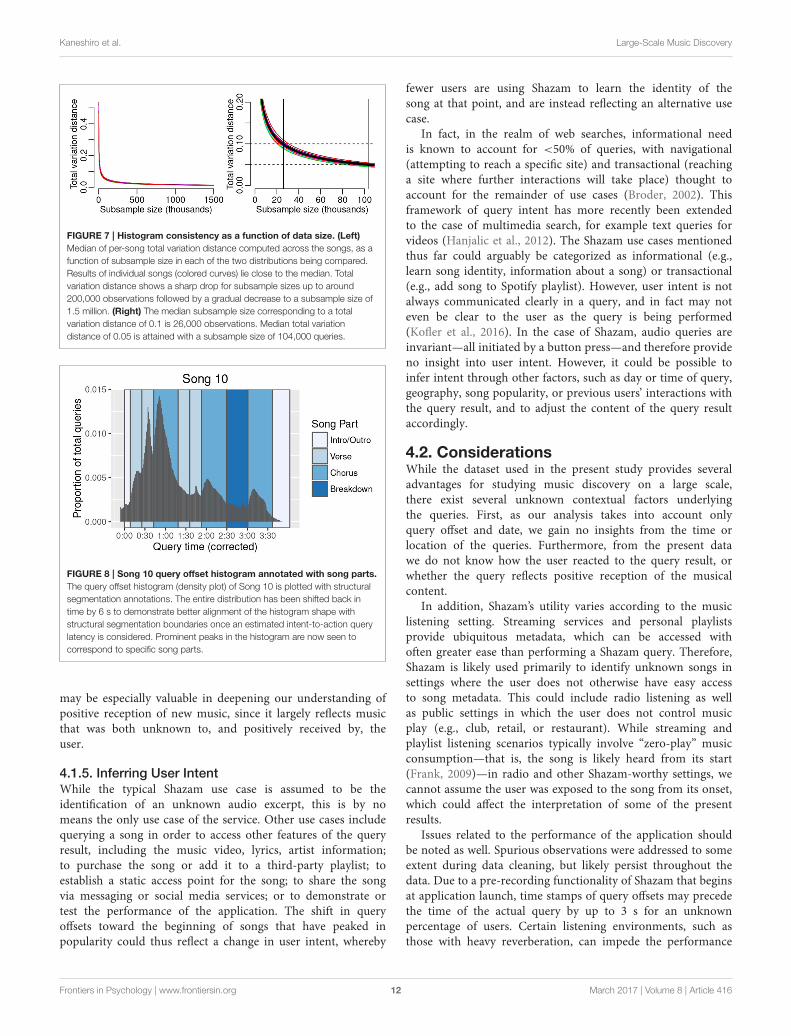
The median total variation distance between randomlysampled disjoint subsets as a function of subsample size acrossthe song set is shown in Figure 7. As shown in the leftpanel (Figure 7), the trajectory of these results is consistentacross songs. The distance between distributions of two disjointsubsamples for a given song decreases rapidly as a function
of sample size, leveling off well below 500,000 queries. Whilethere exists no standard metric of “good” total variationdistance, we identify the median subsample size necessary toachieve total variation distance of 0.1 and 0.05 (Figure 7, rightpanel). A median subsample size of 26,000 queries is requiredto achieve total variation distance of 0.1—somewhat in line
Frontiers in Psychology | www.frontiersin.org 7 March 2017 | Volume 8 | Article 416
Kaneshiro et al. Large-Scale Music Discovery
FIGURE 3 | Example histograms throughout hit song life cycle. Subsampled query distributions at the time of song release, date of peak position on Billboard,and end of the dataset for four songs. The distribution of query offsets for the end dates in particular exhibit a pronounced shift toward the beginning of each song.
with our observations of the histograms in Figure 6—while104,000 queries correspond to a median total variation distanceof 0.05.
4. DISCUSSION
In this study, we investigated music discovery behavior on a largescale by analyzing the timing of Shazam queries during popularsongs. Using a dataset of over 188 million queries of 20 hit songs,our findings suggest a relationship between musical events andthe timing of Shazam queries. We show that query offsets are notuniformly distributed throughout a song, but rather vary overthe course of a song, and may thus be driven in particular bysalient musical and structural elements of the song. Furthermore,the shapes of the offset histograms themselves change over thecourse of the hit song life cycle, showing that the musical contentthat compels listeners to query a song changes as a function ofsong popularity or listener exposure to a song. A closer analysisof salient song parts reveals that the onset of vocals and thefirst occurrence of the chorus in particular drive an increase inqueries. Finally, having ample data, we assessed the consistency ofthe data as a function of data size, and propose that Shazam queryoffsets for the present song set reach consistent distributions witharound 26,000 queries.
Shazam’s user data offer several advantages for the study ofmusic discovery. First and foremost is the scale and scope of
the data, representing a massive global user base that performsmillions of queries each day. Also, while the current study focusedon only a small set of songs, Shazam’s music catalog containsover 30 million deduplicated tracks. Thus, in terms of both sizeand demographic diversity of the experimental sample (users), aswell as number of stimuli (song catalog), Shazam data capturemusic discovery at a scale not attainable in controlled studies.The dataset analyzed here is comparable in size to other recentlyreleased industrial datasets for music research. For example,the #nowplaying dataset currently exceeds 56 million tweets(Zangerle et al., 2014), while Gracenote’s GNMID14 datasetexceeds 100 million music identification matches (Summerset al., 2016). Shazam data are also ubiquitous, meaning that theyreflect music discovery in a variety of contexts throughout dailylife. As a result, the user data reflect a wide range of musicdiscovery scenarios. Third, Shazam data possess an ecologicalvalidity lacking in controlled laboratory studies, as users engagethe application in real-world information-seeking scenarios, andwere not asked to adopt this behavior as part of a study.Finally, what uniquely differentiates Shazam’s data from mostother data—including other large-scale social media data—is itsobjectivity. By this, we mean that under the assumed primaryuse case of learning the identity of a musical excerpt, Shazamqueries are motivated by interest in some aspect of the musicalcontent, even while the queried excerpt may be unknown to theuser. Therefore, interest inmusical contentmay be reflectedmore
Frontiers in Psychology | www.frontiersin.org 8 March 2017 | Volume 8 | Article 416

Kaneshiro et al. Large-Scale Music Discovery
FIGURE 4 | Changes in histogram shape during the hit song life cycle. We performed Chi-squared tests of proportions to assess whether distributions of queryoffsets migrate toward the beginning of the song as a song achieves popularity. One-sided tests compared each later-vs.-earlier pair of subsamples using a beginningwindow of increasing duration. (Top) Median percentile Chi-squared statistics, across songs, with first and third quartiles, for each pairwise test over beginningwindows of increasing length. We converted statistics to percentiles on a per-song basis to impose a common scale across songs. For peak Billboard vs. end dateand release date vs. end date, window lengths of around 50 s or less produce notably high Chi-squared statistics, demonstrating that query offsets for the latest datesare more concentrated at the beginnings of songs. (Bottom) Raster plot of beginning window lengths producing p < 10−10 in the tests of proportions for individualsongs (no correction for multiple comparisons).
directly in Shazam queries than in other formats such as tweets,where the content of a posted tweet (and decision whether topost it) has been mediated by the user, reflecting a confluenceof musical taste and the user’s conscious awareness of how theposted content aligns with his or her expressed identity (Lonsdaleand North, 2011; Rentfrow, 2012).
4.1. Musical Correlates of Shazam Queries4.1.1. Query Volume Varies Throughout a SongIn our first analysis, we tested the uniformity of the offsethistograms. Visual inspection of the offset histograms of oursong set (Figure 2) and results of statistical tests indicate thatthe query offset distributions are not uniform, and that queriesare more likely to occur at some points during the songsthan others. In this way, Shazam query offset histograms mayfacilitate the “locate” research proposed by Honing (2010), in thatthey reveal points in a song that a number of listeners foundengaging.
The timing and heights of histogram peaks vary from songto song. We surmised that this was a reflection of the variationin song structure (e.g., arrangement of choruses, verses, andother elements) across the song set, but that the peaks mightreflect structurally salient events that occur across the songs.By analyzing regions of the histograms time-locked to suchevents, we were able to show that the initial onset of vocals
and occurrence of the first chorus drive increases in queryvolume—represented by high percentiles of histogram slopes—ina consistent fashion across songs.
In relating offset histogram peaks to musical events, it isimportant to keep in mind that users are assumed to successfullyquery a given broadcast of a song only once. This is reflectedto some extent in the overall downward trend in query volumeover the duration of a song. Musical content driving Shazamqueries may be better characterized, then, as the first contentin a song that compelled a user to take action and perform thequery. Therefore, this content was presumably more engagingthan content that came before, but not necessarily more engagingthan content that comes after—the user just would not needto query the song a second time, as he had already receivedthe benefit of the query result. Under this reasoning, songsfor which the highest histogram peak is not the first peak (forexample, Song 14, Song 19, and Song 20) may be of particularinterest, as these represent a break from the conventionalhistogram shape, and may highlight especially engaging musicalmaterial occurring later in the song. Furthermore, as shownin Figure 8, histogram peak heights can vary even acrossoccurrences of the same song part (here, most notably forthe second verse compared to the first), which may reflectchanges in texture, instrumentation, or other musical content.Finally, our present analysis used histogram slopes as indicators
Frontiers in Psychology | www.frontiersin.org 9 March 2017 | Volume 8 | Article 416
Kaneshiro et al. Large-Scale Music Discovery
FIGURE 5 | Slopes of histograms after salient musical events. Median(black) with first and third quartiles (gray) of histogram slopes across songs areplotted, time-locked to specific musical events. Histogram slopes for eachsong were converted to percentiles prior to plotting. Histogram slopesincrease following the start of the song (top plot), the first onset of vocals inthe song (second plot), and the onset of the first chorus (third plot). Inparticular, histogram slopes are consistently high across songs around 9 safter the first onset of vocals and first onset of the chorus. (Bottom plot)
When randomly selected time points, rather than salient musical events, areconsidered, the median histogram slope across songs over time peaks aroundthe 50th percentile.
of upcoming histogram peaks; future analyses could utilizeother histogram features, such as the density or timing of thepeaks themselves, or the local minima interspersed between thepeaks.
4.1.2. Inferring Intent-to-Query TimeA Shazam query typically does not occur at the exact momentthe user was compelled to perform the query. In many cases,the user must retrieve his or her mobile device, unlock it,and load the Shazam application before the query can beperformed. Therefore, there exists in the offset data an unknownlatency between intent-to-query and query time, which canrange from 0 to 10 s or more. We did not attempt to estimateor correct for this latency in our present analyses. However,the histogram slopes following salient musical events may
provide some insight into the duration of this delay. If ourmusical events of interest in fact drive increased queries, wemight interpret the time point after such events, at whichhistogram slopes are consistently high across songs, as anestimate of the mean latency between onset of the song partand initiation of the query. Based on the present results(shown in Figure 5), histogram slopes become consistentlyhigh around 9 s after the onset of vocals or the firstchorus.
We find that peaks and troughs of an offset histogramare better aligned with structural segmentation boundariesof the song when the histogram is shifted to account foran estimated latency. For example, Figure 8 shows theoffset histogram for Song 10, with structural segmentationboundaries visualized in the background. When alloffsets are shifted back by 6 s as shown in the figure,the resulting histogram aligns well with the structuralsegmentation boundaries. Visualizing the other songs ina similar fashion reveals some variation in adjustmentsrequired to optimally align histograms with song partboundaries.
Even so, the assumption that histogram slope percentiles orminima convey the intent-to-action delay remains speculativeat this stage. Furthermore, the histogram slopes over our timewindow of interest vary from song to song, as does the optimaltime shifting of histograms to align local minima with song-part boundaries. Therefore, additional research—perhaps ina controlled experimental setting—will be required to bettercharacterize this delay, and to determine whether our currentproposed approaches for inferring it are appropriate.
4.1.3. Impact of Hit Song Life CycleAs shown in our second analysis, the shapes of offset histogramschange over the life cycle of the hit songs in our song set.As a song attained and receded from its peak position onthe Billboard chart, queries tended to occur closer to the startof the song. Therefore, even though the underlying musicalcontent was unchanged, users tended to query the audio earlieronce a song became successful. As we will later discuss, theintent of the query may have changed, e.g., users querying laterin the life cycle may have been doing so for reasons otherthan to learn the identity of the song. However, it may alsobe that repeated exposures to such popular songs, which—even while the identity of the song may remain unknown—enhance familiarity, processing fluency, and even preference(Nunes et al., 2015), could compel the user to query thesong earlier than he would have done prior to so manyexposures. Therefore, it would be interesting to repeat thisanalysis with songs that never achieved ubiquitous broadcastand widespread popularity, in order to assess in finer detail theimpact of popularity and exposure on changes in music discoverybehavior.
In interpreting the changes in histogram shape over a song’slife cycle, we note that the earliest and latest subsets of data(release date and end date) are always disjoint, but that repeatedobservations may exist with either of these subsets and the
Frontiers in Psychology | www.frontiersin.org 10 March 2017 | Volume 8 | Article 416
Kaneshiro et al. Large-Scale Music Discovery
FIGURE 6 | Example subsampled histograms. Histograms (density plots) of various quantities of random subsamples for four of the songs. Histograms are scaledto common density and time axes on a per-song basis. The most prominent peaks of the full-sample histogram emerge with as few as 1,000 queries, and are visuallysimilar by 20,000 queries. The finer details of the full-distribution histograms are discernible with subsamples of 50,000 queries.
Billboard peak date subset—for example, if a song peaked onBillboard soon after its release.
4.1.4. Disentangling Discovery and PreferenceUnder the premise that Shazam queries are primarily searches foridentities of unknown songs, it would be erroneous to equate auser’s Shazam history with his or hermost-lovedmusic. However,if we may assume that users query songs because they are insome way attracted to, or at least aroused by, the songs’ musicalcontent, we may conclude that musical attributes of a user’squeried songs reflect, to some extent, the musical preferences
of that user. In other words, a queried song’s musical content,especially around the query offset, may contain features thatcompel the user to take action and want to know more. Inthis sense, one’s discovered music, more so than freely chosensongs, may be more widely representative of musical preferences,as it encompasses music (and musical features) beyond thescope of what a user could have articulated in advance that hewanted to hear—and possibly across a broader range of musicalgenres. And, given that known recommended tracks have beenshown to be received more positively by listeners than unknownrecommendations (Mesnage et al., 2011), music discovery data
Frontiers in Psychology | www.frontiersin.org 11 March 2017 | Volume 8 | Article 416
Kaneshiro et al. Large-Scale Music Discovery
FIGURE 7 | Histogram consistency as a function of data size. (Left)
Median of per-song total variation distance computed across the songs, as afunction of subsample size in each of the two distributions being compared.Results of individual songs (colored curves) lie close to the median. Totalvariation distance shows a sharp drop for subsample sizes up to around200,000 observations followed by a gradual decrease to a subsample size of1.5 million. (Right) The median subsample size corresponding to a totalvariation distance of 0.1 is 26,000 observations. Median total variationdistance of 0.05 is attained with a subsample size of 104,000 queries.
FIGURE 8 | Song 10 query offset histogram annotated with song parts.
The query offset histogram (density plot) of Song 10 is plotted with structuralsegmentation annotations. The entire distribution has been shifted back intime by 6 s to demonstrate better alignment of the histogram shape withstructural segmentation boundaries once an estimated intent-to-action querylatency is considered. Prominent peaks in the histogram are now seen tocorrespond to specific song parts.
may be especially valuable in deepening our understanding ofpositive reception of new music, since it largely reflects musicthat was both unknown to, and positively received by, theuser.
4.1.5. Inferring User IntentWhile the typical Shazam use case is assumed to be theidentification of an unknown audio excerpt, this is by nomeans the only use case of the service. Other use cases includequerying a song in order to access other features of the queryresult, including the music video, lyrics, artist information;to purchase the song or add it to a third-party playlist; toestablish a static access point for the song; to share the songvia messaging or social media services; or to demonstrate ortest the performance of the application. The shift in queryoffsets toward the beginning of songs that have peaked inpopularity could thus reflect a change in user intent, whereby
fewer users are using Shazam to learn the identity of thesong at that point, and are instead reflecting an alternative usecase.
In fact, in the realm of web searches, informational needis known to account for <50% of queries, with navigational(attempting to reach a specific site) and transactional (reachinga site where further interactions will take place) thought toaccount for the remainder of use cases (Broder, 2002). Thisframework of query intent has more recently been extendedto the case of multimedia search, for example text queries forvideos (Hanjalic et al., 2012). The Shazam use cases mentionedthus far could arguably be categorized as informational (e.g.,learn song identity, information about a song) or transactional(e.g., add song to Spotify playlist). However, user intent is notalways communicated clearly in a query, and in fact may noteven be clear to the user as the query is being performed(Kofler et al., 2016). In the case of Shazam, audio queries areinvariant—all initiated by a button press—and therefore provideno insight into user intent. However, it could be possible toinfer intent through other factors, such as day or time of query,geography, song popularity, or previous users’ interactions withthe query result, and to adjust the content of the query resultaccordingly.
4.2. ConsiderationsWhile the dataset used in the present study provides severaladvantages for studying music discovery on a large scale,there exist several unknown contextual factors underlyingthe queries. First, as our analysis takes into account onlyquery offset and date, we gain no insights from the time orlocation of the queries. Furthermore, from the present datawe do not know how the user reacted to the query result, orwhether the query reflects positive reception of the musicalcontent.
In addition, Shazam’s utility varies according to the musiclistening setting. Streaming services and personal playlistsprovide ubiquitous metadata, which can be accessed withoften greater ease than performing a Shazam query. Therefore,Shazam is likely used primarily to identify unknown songs insettings where the user does not otherwise have easy accessto song metadata. This could include radio listening as wellas public settings in which the user does not control musicplay (e.g., club, retail, or restaurant). While streaming andplaylist listening scenarios typically involve “zero-play” musicconsumption—that is, the song is likely heard from its start(Frank, 2009)—in radio and other Shazam-worthy settings, wecannot assume the user was exposed to the song from its onset,which could affect the interpretation of some of the presentresults.
Issues related to the performance of the application shouldbe noted as well. Spurious observations were addressed to someextent during data cleaning, but likely persist throughout thedata. Due to a pre-recording functionality of Shazam that beginsat application launch, time stamps of query offsets may precedethe time of the actual query by up to 3 s for an unknownpercentage of users. Certain listening environments, such asthose with heavy reverberation, can impede the performance
Frontiers in Psychology | www.frontiersin.org 12 March 2017 | Volume 8 | Article 416
Kaneshiro et al. Large-Scale Music Discovery
of the application and could therefore require multiple queryattempts in order to obtain a result. The presence of vocalsduring a song may also complicate interpretation of results.While we might interpret a connection between vocals andincreased queries as a reflection of musical engagement, itcould also be the case that portions of the song with highlyprominent vocals may be easier for the Shazam algorithm tomatch successfully. Prominent vocals may also be easier for ahuman listener to pick out in a noisy environment. Therefore,disentangling “vocalness” from “catchiness” (by which we meanengaging in the moment, not necessarily memorable in the longterm; Burgoyne et al., 2013) could be a useful topic for futureresearch.
In sum, conclusions from the current study must be taken inthe context of various unknowns pertaining to users, listeningsettings, application performance, and other uncontrolledfactors. The research questions addressed here could thereforebenefit from further investigation in a human-subjects laboratorystudy setting, where potential confounds and unknowns can becontrolled.
4.3. Future Work4.3.1. Hooks and CatchinessThrough an analysis of offset histogram slopes, this studyprovides first insights into Shazam queries following songstarts, initial onsets of vocals, and first occurrences of choruses.This approach could be broadened to consider more generallythe role of “hooks” in music discovery. Musical hooks aredefined in many ways, largely describing the part(s) of a songthat grab the listener’s attention and stand out from othercontent (Burns, 1987). Hooks need not be restricted only topopular music (Mercer-Taylor, 1999), but are often discussedin the context of popular songs and are thought to occurprimarily at structural segmentation boundaries (i.e., startsof song parts; Burns, 1987; Mercer-Taylor, 1999; Burgoyneet al., 2013). The construction of a hook can involve musicalfeatures such as rhythm, melody, and harmony, as well asproduction decisions such as editing and mix (Burns, 1987).The study of musical hooks historically involved human analysisof hand-picked excerpts (Mercer-Taylor, 1999; Kronengold,2005); in recent years, computational approaches have alsoevolved (Burgoyne et al., 2013; Van Balen et al., 2013,2015), which may facilitate hook research over large audiocorpuses.
Singability is considered to be a characteristic of hooks(Kronengold, 2005), and is thought to increase listenerengagement, both by increasing familiarity and by inspiring thelistener to sing along (Frank, 2009). In addition to such intrinsicfactors as singability or catchiness, the arrangement of structuralelements within a song is also critical to engaging the listener(Mercer-Taylor, 1999). Shazam query offset histograms couldprove useful in exploring all of these topics further. While weused annotated lyrics to guide our identification of salient songparts, future research could consider computational models ofcatchiness—perhaps constructed from computationally extractedaudio features (McFee et al., 2015),7 higher-level musical
7https://github.com/librosa/librosa.
features (Van Balen et al., 2015),8 and structural segmentationboundaries (Nieto and Bello, 2016)9—and use Shazam querydistributions to validate the models. Alternatively, a model couldbe learned directly from features of the audio corresponding tothe histogram peaks themselves. In addition to increasing ourunderstanding of what types of musical features attract listeners,these analyses have the potential to explain the appearanceof higher histogram peaks later in a song, as in Song 10(Figure 8).
4.3.2. Modeling and Prediction of Hit SongsLarge-scale music discovery data may also provide new insightsinto modeling and predicting hit songs. Hit prediction remainsan open area of research (Pachet and Roy, 2008; Pachet, 2012),and has been attempted with audio and lyrics features (Dhanarajand Logan, 2005; Herremans et al., 2014) and Twitter data(Kim et al., 2014; Zangerle et al., 2016) with varying success.Other recent studies have found instrumentation (Nunes andOrdanini, 2014) and lexical repetition (Nunes et al., 2015) tobe predictive of peak chart position for past Billboard hits.The potential of Shazam’s data for hit prediction has beendiscussed in news articles.10 Audio, lyrics, instrumentation,and other features found to be predictive of success in thepast studies mentioned above could be explored using queryoffset histograms. While the present analysis considered onlyhit songs, query offsets—or other Shazam data attributes—of a song set with more variation in popularity could leadto the formulation of unique predictors of eventual songsuccess.
4.3.3. Other Time-Based AnalysesWhen thinking about Shazam queries, time can signify manythings. Our present analyses considered two types of time: Thetiming of queries over the course of a song, and the longer-termtime scale of the hit song life cycle, spanning several months.Other approaches to time could include day of week—known toimpact listening behavior (Schedl, 2013) as well as Shazam queryvolume—and time of day.
4.3.4. Other Behaviors and Data AttributesThe present study provides novel insights into music discovery,using only two of Shazam’s many data attributes. A varietyof additional musical questions could be addressed usingShazam user data. User interactions with the applicationafter receiving a query result could provide insight into userpreference and user intent. Other analyses could model musicdiscovery or preference by considering specific geographies,musical genres, or even individual users. Large-scale data havebeen used to address specific musical questions including thelong tail in music-related microblogs (Schedl et al., 2014),social media behavior of Classical music fans (Schedl andTkalcic, 2014), the relationship between musical taste andpersonality factors (Bansal and Woolhouse, 2015), and Twitteractivity around a specific musical event (Iren et al., 2016).
8https://github.com/jvbalen/catchy.9https://github.com/urinieto/msaf.10http://www.theatlantic.com/magazine/archive/2014/12/the-shazam-effect/
382237/.
Frontiers in Psychology | www.frontiersin.org 13 March 2017 | Volume 8 | Article 416
Kaneshiro et al. Large-Scale Music Discovery
Using Shazam data in this way—to address specific musicalquestions—promises interesting approaches for future researchendeavors.
AUTHOR CONTRIBUTIONS
Conceived and designed the research: BK, FR, CB, JB. Aggregatedthe data: BK, CB. Analyzed the data: BK, FR. Wrote the paper:BK, FR, CB, JB.
FUNDING
This research was supported by the Wallenberg NetworkInitiative: Culture, Brain, Learning (BK, JB), the Roberta
Bowman Denning Fund for Humanities and Technology (BK,JB), Shazam Entertainment, Ltd. (BK, CB), and the E. K. PotterStanford Graduate Fellowship (FR).
ACKNOWLEDGMENTS
The authors thank Martha Larson, Fabio Santini, and JuliusSmith for helpful discussions relating to this study.
SUPPLEMENTARY MATERIAL
The Supplementary Material for this article can be foundonline at: http://journal.frontiersin.org/article/10.3389/fpsyg.2017.00416/full#supplementary-material
REFERENCES
Bansal, J., and Woolhouse, M. (2015). “Predictive power of personality on music-
genre exclusivity,” in Proceedings of the 16th International Society for Music
Information Retrieval Conference (Malaga), 652–658.
Bonferroni, C. E. (1936). Teoria Statistica delle Classi e Calcolo delle Probabilita.
Libreria Internazionale Seeber.
Broder, A. (2002). A taxonomy of web search. SIGIR Forum 36, 3–10.
doi: 10.1145/792550.792552
Burgoyne, J. A., Bountouridis, D., Van Balen, J., and Honing, H. (2013). “Hooked:
a game for discovering what makes music catchy,” in Proceedings of the 16th
International Society for Music Information Retrieval Conference (Curitiba),
245–250.
Burns, G. (1987). A typology of ‘hooks’ in popular records. Popular Music 6, 1–20.
doi: 10.1017/S0261143000006577
Conover, W. J. (1971). Practical Nonparametric Statistics. New York, NY: John
Wiley and Sons.
Cunningham, S. J., Bainbridge, D., and McKay, D. (2007). “Finding new music: a
diary study of everyday encounters with novel songs,” in Proceedings of the 8th
International Conference on Music Information Retrieval (Vienna), 83–88.
Dhanaraj, R., and Logan, B. (2005). “Automatic prediction of hit songs,” in
Proceedings of the 6th International Conference on Music Information Retrieval
(London), 488–491.
Fan, J., and Gijbels, I. (1996). Local Polynomial Modelling and Its Applications:
Monographs on Statistics and Applied Probability, Vol. 66. New York, NY: CRC
Press.
Frank, J. (2009). Futurehit.DNA: How the Digital Revolution is Changing Top 10
Songs. Nashville, TN: Futurehit, Inc.
Hanjalic, A., Kofler, C., and Larson, M. (2012). “Intent and its discontents: the
user at the wheel of the online video search engine,” in Proceedings of the 20th
ACM International Conference onMultimedia, MM ’12, (New York, NY: ACM),
1239–1248. doi: 10.1145/2393347.2396424
Hauger, D., Schedl, M., Košir, A., and Tkalcic, M. (2013). “The million musical
tweets dataset: what can we learn from microblogs,” in Proceedings of the 14th
International Society for Music Information Retrieval Conference (Curitiba),
189–194.
Herremans, D., Martens, D., and Sörensen, K. (2014). Dance hit song prediction.
J. New Music Res. 43, 291–302. doi: 10.1080/09298215.2014.881888
Honing, H. (2010). Lure(d) into listening: the potential of cognition-based music
information retrieval. Empirical Musicol. Rev. 5, 121–126.
Iren, D., Liem, C. C. S., Yang, J., and Bozzon, A. (2016). “Using social media to
reveal social and collective perspectives on music,” in Proceedings of the 8th
ACM Conference on Web Science, WebSci ’16 (New York, NY: ACM), 296–300.
doi: 10.1145/2908131.2908178
Kim, Y., Suh, B., and Lee, K. (2014). “#nowplaying the future Billboard:
mining music listening behaviors of Twitter users for hit song prediction,”
in Proceedings of the First International Workshop on Social Media
Retrieval and Analysis, SoMeRA ’14 (New York, NY: ACM), 51–56.
doi: 10.1145/2632188.2632206
Kofler, C., Larson, M., and Hanjalic, A. (2016). User intent in multimedia search:
a survey of the state of the art and future challenges. ACM Comput. Surv. 49,
36:1–36:37. doi: 10.1145/2954930
Kronengold, C. (2005). Accidents, hooks and theory. Popular Music 24, 381–397.
doi: 10.1017/S0261143005000589
Laplante, A., and Downie, J. S. (2011). The utilitarian and hedonic outcomes of
music information-seeking in everyday life. Libr. Inform. Sci. Res. 33, 202–210.
doi: 10.1016/j.lisr.2010.11.002
Levin, D. A., Peres, Y., andWilmer, E. L. (2009).Markov Chains and Mixing Times.
Providence, RI: American Mathematical Society.
Lonsdale, A. J., and North, A. C. (2011). Why do we listen to music?
A uses and gratifications analysis. Br. J. Psychol. 102, 108–134.
doi: 10.1348/000712610X506831
McDonald, J. H. (2014).Handbook of Biological Statistics, 3rd Edn. Baltimore, MD:
Sparky House Publishing.
McFee, B., Raffel, C., Liang, D., Ellis, D. P., McVicar, M., Battenberg,
E., et al. (2015). “librosa: audio and music signal analysis in Python,”
in Proceedings of the 14th Python in Science Conference (Austin, TX),
18–25.
Mercer-Taylor, P. (1999). Two-and-a-half centuries in the life of a Hook. Popul.
Music Soc. 23, 1–15. doi: 10.1080/03007769908591729
Mesnage, C. S., Rafiq, A., Dixon, S., and Brixtel, R. P. (2011). “Music discovery with
social networks,” in 2nd Workshop on Music Recommendation and Discovery
(Chicago, IL).
Moore, J. L., Joachims, T., and Turnbull, D. (2014). “Taste space versus the world:
an embedding analysis of listening habits and geography,” in Proceedings of the
15th International Society for Music Information Retrieval Conference (Taipei),
439–444.
Nieto, O., and Bello, J. P. (2016). “Systematic exploration of computational music
structure research,” in Proceedings of the 17th International Society for Music
Information Retrieval Conference, 547–553.
Nunes, J. C., and Ordanini, A. (2014). I like the way it sounds: the influence of
instrumentation on a pop song’s place in the charts. Music. Sci. 18, 392–409.
doi: 10.1177/1029864914548528
Nunes, J. C., Ordanini, A., and Valsesia, F. (2015). The power of repetition:
repetitive lyrics in a song increase processing fluency and drive market
success. J. Consum. Psychol. 25, 187–199. doi: 10.1016/j.jcps.2014.
12.004
Pachet, F. (2012). “Hit Song Science,” inMusic Data Mining, eds T. Li, M. Ogihara,
and G. Tzanetakis (Boca Raton, FL: CRC Press), 305–326.
Pachet, F., and Roy, P. (2008). “Hit song science is not yet a science,” in
Proceedings of the 9th International Conference on Music Information Retrieval
(Philadelphia, PA), 355–360.
Pichl, M., Zangerle, E., and Specht, G. (2014). “Combining Spotify and Twitter
data for generating a recent and public dataset for music recommendation,” in
Frontiers in Psychology | www.frontiersin.org 14 March 2017 | Volume 8 | Article 416
Kaneshiro et al. Large-Scale Music Discovery
Proceedings of the 26th GI-Workshop on Foundations of Databases (Grundlagen
von Datenbanken) (Bozen).
Pichl, M., Zangerle, E., and Specht, G. (2015). “#nowplaying on #spotify: leveraging
Spotify information on Twitter for artist recommendations,” in Current Trends
in Web Engineering: 15th International Conference, ICWE 2015 (Rotterdam),
163–174. doi: 10.1007/978-3-319-24800-4_14
R Core Team (2015). R: A Language and Environment for Statistical Computing.
Vienna: R Foundation for Statistical Computing.
Rentfrow, P. J. (2012). The role of music in everyday life: current directions in
the social psychology of music. Soc. Personal. Psychol. Compass 6, 402–416.
doi: 10.1111/j.1751-9004.2012.00434.x
Schedl, M. (2010). “On the use of microblogging posts for similarity estimation
and artist labeling,” in Proceedings of the 11th International Society for Music
Information Retrieval Conference (Utrecht), 447–452.
Schedl, M. (2013). “Leveraging microblogs for spatiotemporal music information
retrieval,” in Advances in Information Retrieval: 35th European Conference
on Information Retrieval, ECIR 2013 (Berlin; Heidelberg: Springer), 796–799.
doi: 10.1007/978-3-642-36973-5_87
Schedl, M., Hauger, D., and Urbano, J. (2014). Harvesting microblogs for
contextual music similarity estimation: a co-occurrence-based framework.
Multimedia Syst. 20, 693–705. doi: 10.1007/s00530-013-0321-5
Schedl, M., and Tkalcic, M. (2014). “Genre-based analysis of social media data
on music listening behavior: are fans of classical music really averse to
social media?,” in Proceedings of the First International Workshop on Internet-
Scale Multimedia Management, WISMM ’14 (New York, NY: ACM), 9–13.
doi: 10.1145/2661714.2661717
Shazam Entertainment, Ltd. (2016). “Shazam research dataset—offsets (SRD-O),”
in Stanford Digital Repository. Available online at: http://purl.stanford.edu/
fj396zz8014
Summers, C., Tronel, G., Cramer, J., Vartakavi, A., and Popp, P. (2016).
“GNMID14: a collection of 110 million global music identification matches,”
in Proceedings of the 39th International ACM SIGIR Conference on Research
and Development in Information Retrieval, SIGIR ’16 (New York, NY: ACM),
693–696. doi: 10.1145/2911451.2914679
Tsai, C.-G., Chen, R.-S., and Tsai, T.-S. (2014). The arousing and cathartic
effects of popular heartbreak songs as revealed in the physiological
responses of listeners. Music. Sci. 18, 410–422. doi: 10.1177/1029864914
542671
Van Balen, J., Burgoyne, J. A., Wiering, F., and Veltkamp, R. C. (2013). “An
analysis of chorus features in popular song,” in Proceedings of the 14th
International Society for Music Information Retrieval Conference (Curitiba),
107–112.
Van Balen, J. M. H., Burgoyne, J. A., Bountouridis, D., Müllensiefen, D., and
Veltkamp, R. C. (2015). “Corpus analysis tools for computational hook
discovery,” in Proceedings of the 16th International Society forMusic Information
Retrieval Conference, 227–233.
Wang, A. (2003). “An industrial strength audio search algorithm,” in Proceedings
of the 4th International Conference on Music Information Retrieval (Baltimore,
MD), 7–13.
Zangerle, E., Gassler, W., and Specht, G. (2012). “Exploiting Twitter’s collective
knowledge for music recommendations,” in 2nd Workshop on Making Sense of
Microposts (#MSM) (Lyon), 14–17.
Zangerle, E., Pichl, M., Gassler, W., and Specht, G. (2014). “#nowplaying music
dataset: extracting listening behavior from Twitter,” in Proceedings of the First
International Workshop on Internet-Scale Multimedia Management, WISMM
’14 (New York, NY: ACM), 21–26. doi: 10.1145/2661714.2661719
Zangerle, E., Pichl, M., Hupfauf, B., and Specht, G. (2016). “Canmicroblogs predict
music charts? An analysis of the relationship between #nowplaying tweets
and music charts,” in Proceedings of the 17th International Society for Music
Information Retrieval Conference (New York, NY), 365–371.
Conflict of Interest Statement: Authors BK and CB are present or former paid
employees of Shazam Entertainment, Ltd. Authors FR and JB declare that the
research was conducted in the absence of any commercial or financial relationships
that could be construed as a potential conflict of interest.
Copyright © 2017 Kaneshiro, Ruan, Baker and Berger. This is an open-access article
distributed under the terms of the Creative Commons Attribution License (CC BY).
The use, distribution or reproduction in other forums is permitted, provided the
original author(s) or licensor are credited and that the original publication in this
journal is cited, in accordance with accepted academic practice. No use, distribution
or reproduction is permitted which does not comply with these terms.
Frontiers in Psychology | www.frontiersin.org 15 March 2017 | Volume 8 | Article 416