Embed Size (px)
Citation preview
AFRL-RX-TY-TR-2013-0022
CHEMICAL AND BIOLOGICAL RESISTANT CLOTHING
Mickael Havel Arkema, Inc 900 First Avenue King of Prussia, PA 19406
Dale W. Schaefer and Naiping Hu University of Cincinnati University Hall, Suite 530 51 Goodman Drive, P.O. Box 21022 Cincinnati, OH 45221-0222
Tom Martin Lion Apparel 7200 Poe Avenue, Suite 400 Dayton, OH 45414
Contract No. FA4819-11-C-0013
April 2013
DISTRIBUTION A. Approved for public release; distribution unlimited.
88ABW-2013-3230; 15 July 2013.
AIR FORCE RESEARCH LABORATORY MATERIALS AND MANUFACTURING DIRECTORATE
Air Force Materiel Command United States Air Force Tyndall Air Force Base, FL 32403-5323
DISCLAIMER
Reference herein to any specific commercial product, process, or service by trade name,
trademark, manufacturer, or otherwise does not constitute or imply its endorsement,
recommendation, or approval by the United States Air Force. The views and opinions of
authors expressed herein do not necessarily state or reflect those of the United States Air
Force.
This report was prepared as an account of work sponsored by the United States Air Force.
Neither the United States Air Force, nor any of its employees, makes any warranty,
expressed or implied, or assumes any legal liability or responsibility for the accuracy,
completeness, or usefulness of any information, apparatus, product, or process disclosed, or
represents that its use would not infringe privately owned rights.
NOTICE AND SIGNATURE PAGE Using Government drawings, specifications, or other data included in this document for any purpose other than Government procurement does not in any way obligate the U.S. Government. The fact that the Government formulated or supplied the drawings, specifications, or other data does not license the holder or any other person or corporation; or convey any rights or permission to manufacture, use, or sell any patented invention that may relate to them. This report was cleared for public release by the and is aa and is nationals. Copies may be obtained from the Defense Technical Information Center (DTIC) (http://www.dtic.mil). HAS BEEN REVIEWED AND IS APPROVED FOR PUBLICATION IN ACCORDANCE WITH ASSIGNED DISTRIBUTION STATEMENT. ______________________________________ _______________________________________ ______________________________________ This report is published in the interest of scientific and technical information exchange, and its publication does not constitute the Government’s approval or disapproval of its ideas or findings.
88th Air Base Wing Public Affairs Office atWright Patterson Air Force Base, Ohio available to the general public, including foreign
AFRL-RX-TY-TR-2013-0022
Deputy Chief, Airbase Technologies Division
DONNA L. PILSON, Lt Col, USAF
Work Unit Manager
KURT D. SILSBY, 1st Lt, USAF
Program Manager
JOSEPH D. WANDER, PhD
///SIGNED/// ///SIGNED///
///SIGNED///
Standard Form 298 (Rev. 8/98)
REPORT DOCUMENTATION PAGE
Prescribed by ANSI Std. Z39.18
Form Approved OMB No. 0704-0188
The public reporting burden for this collection of information is estimated to average 1 hour per response, including the time for reviewing instructions, searching existing data sources, gathering and maintaining the data needed, and completing and reviewing the collection of information. Send comments regarding this burden estimate or any other aspect of this collection of information, including suggestions for reducing the burden, to Department of Defense, Washington Headquarters Services, Directorate for Information Operations and Reports (0704-0188), 1215 Jefferson Davis Highway, Suite 1204, Arlington, VA 22202-4302. Respondents should be aware that notwithstanding any other provision of law, no person shall be subject to any penalty for failing to comply with a collection of information if it does not display a currently valid OMB control number. PLEASE DO NOT RETURN YOUR FORM TO THE ABOVE ADDRESS. 1. REPORT DATE (DD-MM-YYYY) 2. REPORT TYPE 3. DATES COVERED (From - To)
4. TITLE AND SUBTITLE 5a. CONTRACT NUMBER
5b. GRANT NUMBER
5c. PROGRAM ELEMENT NUMBER
5d. PROJECT NUMBER
5e. TASK NUMBER
5f. WORK UNIT NUMBER
6. AUTHOR(S)
7. PERFORMING ORGANIZATION NAME(S) AND ADDRESS(ES) 8. PERFORMING ORGANIZATION REPORT NUMBER
9. SPONSORING/MONITORING AGENCY NAME(S) AND ADDRESS(ES) 10. SPONSOR/MONITOR'S ACRONYM(S)
11. SPONSOR/MONITOR'S REPORT NUMBER(S)
12. DISTRIBUTION/AVAILABILITY STATEMENT
13. SUPPLEMENTARY NOTES
14. ABSTRACT
15. SUBJECT TERMS
16. SECURITY CLASSIFICATION OF: a. REPORT b. ABSTRACT c. THIS PAGE
17. LIMITATION OF ABSTRACT
18. NUMBER OF PAGES
19a. NAME OF RESPONSIBLE PERSON
19b. TELEPHONE NUMBER (Include area code)
09-APR-2013 Final Technical Report 28-SEP-2011 -- 28-FEB-2013
Chemical and Biological Resistant Clothing FA4819-11-C-0013
0909999F
GOVT
L0
X0G2 (QL102028)
*Havel, Mickael; **Schaefer, Dale W.; **Hu, Naiping; ***Martin, Tom
*Arkema Inc, 900 First Avenue, King of Prussia, PA 19406 **University of Cincinnati, University Hall, Suite 530 51 Goodman Drive, P.O. Box 210222, Cincinnati, OH 45221-0222 ***Lion Apparel, 7200 Poe Avenue, Suite 400, Dayton, OH 45414
Air Force Research Laboratory Materials and Manufacturing Directorate Airbase Technologies Division 139 Barnes Drive, Suite 2 Tyndall Air Force Base, FL 32403-5323
AFRL/RXQ
AFRL-RX-TY-TR-2013-0022
Distribution A: Approved for public release; distribution unlimited.
Ref Public Affairs Case # 88ABW-2013-3230; 15 July 2013. Document contains color images.
The research team composed of Arkema, Lion Apparel and University of Cincinnati (UC) successfully identified new barrier materials that exceed current technology for protective garments. These materials are novel semi-permeable membranes (SPMs) based on an amphiphilic block copolymers (BCPs) blended in a high-strength host polymer. This innovation was enabled by Arkema's Blocbuilder® controlled radical BCP polymerization technology, which generates tailored polymer architectures. The water transport properties and chemical warfare agent (CWA) rejection were measured at Arkema and UC. UC also developed characterization methods and computer simulation models to relate the permeation properties to the composition and nano scale morphology of the membranes.
membrane, film, breathable, chemical resistance, biological resistance, selectivity
U U U SAR 70
Kurt Silsby
Reset
i
DISTRIBUTION A. Approved for public release; distribution unlimited.
88ABW-2013-3230; 15 July 2013
TABLE OF CONTENTS
LIST OF FIGURES ....................................................................................................................... iii
LIST OF TABLES ...........................................................................................................................v
ACKNOWLEDGEMENTS ........................................................................................................... vi
1. SUMMARY .........................................................................................................................1
2. INTRODUCTION ...............................................................................................................2
3. METHODS AND PROCEDURES .....................................................................................3
3.1. BCP Synthesis ......................................................................................................................3
3.2. BCP Blend Membrane Preparation ......................................................................................5
3.2.1. Block Copolymer Blend Preparation at Arkema .................................................................5
3.2.2. BCP Blend Membrane Preparation at UC ...........................................................................5
3.3. Characterization ...................................................................................................................6
3.3.1. Permeation Tests ..................................................................................................................6
3.3.2. Polymer Characterization ...................................................................................................12
3.3.3. Modeling of Structure–property Relationship ...................................................................15
4. BENCHMARK CURRENT TECHNOLOGIES AND EXISTING MATERIALS ..........18
4.1. Current Technologies .........................................................................................................18
4.1.1. Existing Commercial Arkema BCPs (P1, P2, L1, L2, and N2, N3) ..................................18
5. BLOCK COPOLYMER SYNTHESIS AND CHARACTERIZATION ...........................20
5.1. Block Copolymer Synthesis ...............................................................................................20
5.1.1. Route 1: P(A-co-monomer)-b-P(W1) ................................................................................20
5.1.2. Route 2: P(E-co-W1)-b-P(A) .............................................................................................21
5.1.3. Route 3: P(E-co-W2)-b-P(A) .............................................................................................26
5.2. Block Copolymer Characterization ....................................................................................28
5.2.1. P(A-co-B)-b-(W1) Family .................................................................................................28
5.2.2. P(W1-co-E)-b-P(A) Family ...............................................................................................30
5.2.3. P(W2-co-E)-b-P(A) Family ...............................................................................................31
5.3. Summary ............................................................................................................................32
6. BLOCK COPOLYMER BLEND PREPARATION AND CHARACTERIZATION ......33
6.1.1. P(A-co-B)-b-P(W1) BCP ...................................................................................................33
6.1.2. P(E-co-W1)-b-P(A) BCP ...................................................................................................33
6.1.3. Summary of BCP Blend WVTRs ......................................................................................34
6.1.4. Evaluation of Mechanical Properties on BCP Blend Films ...............................................36
6.1.5. Effect of Temperature on WVTR ......................................................................................36
6.1.6. Effect of the Host Matrix ...................................................................................................37
6.2. Blend Preparation ...............................................................................................................38
6.2.1. Glassy Transition Temperature of Host Polymers N2 and N3 ..........................................38
6.2.2. Determination of Host Polymers and Blending Ratios ......................................................38
6.2.3. Domain Size by Neutron Scattering ..................................................................................38
6.2.4. Interface Morphology by Neutron Reflectivity .................................................................40
6.3. Evaluation of Block Copolymers and Block Copolymer Blends ......................................42
6.3.1. Room-temperature Transport of Water Vapor, DMMP, TBP and MS..............................42
6.3.2. Selectivity of Water Vapor/DMMP, TBP, and MS ...........................................................44
6.3.3. High-temperature Permeability ..........................................................................................45
6.3.4. Permeability and Selectivity Against Water–DMMP Mixture (co-feed) ..........................46
6.3.5. Total Heat Loss (THL).......................................................................................................48
ii
DISTRIBUTION A. Approved for public release; distribution unlimited.
88ABW-2013-3230; 15 July 2013
7. MODELING ......................................................................................................................51
7.1. Water and DMMP Permeability Mechanism by Single-gas Permeability Test ................51
7.2. HSP Calculation Based on Group Contribution ................................................................53
7.3. Diffusion Correction ..........................................................................................................55
7.3.1. Domain Size Calculated by Chain Length (Corrected Random Walk) .............................55
7.3.2. Domain Size Calculated from SANS Data ........................................................................56
7.4. HSP Model Combined with Diffusion Correction .............................................................57
8. OPTIMIZATION ...............................................................................................................58
8.1. Optimization on BCP Group 1 ...........................................................................................58
8.2. Optimization on BCP group 2............................................................................................59
8.3. Performance of Optimized BCPs .......................................................................................59
9. CONCLUSIONS AND RECOMMENDATIONS ............................................................61
9.1. Conclusions ........................................................................................................................61
9.2. Recommendations ..............................................................................................................61
10. REFERENCES ..................................................................................................................62
LIST OF SYMBOLS, ABBREVIATIONS, AND ACRONYMS .................................................63
INDEX ...........................................................................................................................................64
iii
DISTRIBUTION A. Approved for public release; distribution unlimited.
88ABW-2013-3230; 15 July 2013
LIST OF FIGURES
Page
Figure 1. Chemical Structure of BlocBuilder®
MA Alkoxyamine ...................................................3
Figure 2. Pictures of the Plastic Box with Several Glass Vials Filled with Water ..........................7
Figure 3. Cell Test from Permatran-W®
Model 398 Operator’s Manual, Sect. 1-5 ........................8
Figure 4. Acetone Permeation Test ..................................................................................................8
Figure 5. Measurement of Water/simulant Vapor Transport at Room Temperature .......................9
Figure 6. Schematic For Transient Single-Gas Permeation Measurements ....................................9
Figure 7. Schematic of Steady-State Water Permeation Test System ...........................................10
Figure 8. Water/DMMP Mixture Permeation System ...................................................................11
Figure 9. MVTR (top) and Selectivity (Water/DMMP) (bottom) .................................................18
Figure 10. MVTR and Selectivity (Water/DMMP) of Arkema Commercial Brands Compared
with JSLIST .......................................................................................................................19
Figure 11. Polymerization of (W1) ................................................................................................21
Figure 12. Polymerizations of (W1) ..............................................................................................22
Figure 13. Overall Weight Conversion ..........................................................................................23
Figure 14. Polymerizations of A onto P(E-co-W1) .......................................................................25
Figure 15. Polymerizations of A ....................................................................................................26
Figure 16. Copolymerizations of E ................................................................................................27
Figure 17. BCPs Synthesized of the Family P(A-co-B)-b-P(W1) .................................................28
Figure 18. WVTR of Neat BCP Films ...........................................................................................29
Figure 19. BCP Synthesized of the Family P(W1-co-E)-b-P(A) ...................................................30
Figure 20. WVTR of Neat BCP Films ...........................................................................................31
Figure 21. BCPs Synthesized of the Family P(W2-co-E)-b-P(A) .................................................31
Figure 22. WVTR of Different BCPs in Blend with K1 in NMP ..................................................33
Figure 23.WVTR of BCPs in Blend with K1 in DMSO................................................................34
Figure 24. WVTR of BCP Blends with K1 in NMP or DMSO .....................................................34
Figure 25. Body-temperature WVTR (Not Normalized for Thickness) of BCP Blended with
K1 at Four Loadings ..........................................................................................................35
Figure 26. Body-Temperature Permeability (Normalized for Thickness) of BCP Blended
with K1 at Four Loadings ..................................................................................................35
Figure 27. Tensile Strength Evaluation .........................................................................................36
Figure 28. Permeation vs Temperature of BCP 84 at Different K1 Loadings ...............................36
Figure 29. Permeation vs. Temperature of BCP 88 at Different K1 Loadings ..............................37
Figure 30. Permeation vs. Temperature of BCP 158, 115 and 128 (Different K1 Loadings) .......37
Figure 31. Permeation of BCP 84, 88 and 158 in three host polymers: K0, K1 and K2 ...............37
Figure 32. DSC and TGA Results for N2 and N3 Host Polymers .................................................38
Figure 33. Evolution of the SANS Profile with mol% Hydrophilic Content of the BCP ..............39
Figure 34. Relationship Between the Domain Spacing (ETA) and Membrane Selectivity as a
Function of Hydrophilic Content in the BCP ....................................................................39
Figure 35. Change in SANS Profile of BCP/K1 Blends on Exposure to Heavy Water ................40
Figure 36. NR Data and SLD Profile for Pure BCP88 ..................................................................41
Figure 37. NR Data and SLD Profile for Pure K1 .........................................................................41
Figure 38. NR Data And SLD Profile For BCP88/K1 Blend in the Dry State and in the
Presence of Saturated D2O Vapor ......................................................................................41
iv
DISTRIBUTION A. Approved for public release; distribution unlimited.
88ABW-2013-3230; 15 July 2013
Figure 39. Transport Rate (in g/day/m2) of Water Vapor, DMMP, TBP and MS through
Arkema Membranes in Comparison with JSLIST Material ..............................................43
Figure 40. Ideal Selectivity of Water over DMMP, TBP and MS .................................................44
Figure 41. MVTR and Permeability of BCP/K1 (50/50) Membrane at 24 (left) and 37 °C .........45
Figure 42. GC Calibrations for DMMP Measurement (Data from Samples with and without
the Addition of Particulate Zeolite Sorbents) ....................................................................46
Figure 43. (A) Comparison of Water Flux for Different Membranes and (B) Water/DMMP
Selectivity for Different Membranes .................................................................................47
Figure 44. Evolution of Position of Peak d1 (Taken from q2×I vs q) as a Function of RH and
Temperature for Series 88 (left) and Series 112 (right) .....................................................50
Figure 45. Evolution of Position of Peak d1 (Taken from q2×I vs q) as a Function of RH and
Temperature for Series 128 (left) and Series 147 (right) ...................................................50
Figure 46. Single-gas Permeability as a Function of Kinetic Diameter of Permeates Including
(left) and Excluding (right) DMMP and Water .................................................................52
Figure 47. A Representative Simulation System with 200 Repeat Units of BCP N2 in a
Periodic Cube .....................................................................................................................52
Figure 48. Sorption Results from GCMC Calculation for Single Gases by BCP N2 ....................53
Figure 49. HSP Model Prediction of Water/DMMP Selectivity on BCPs N2 and N3
Compared with Experimental Data ....................................................................................54
Figure 50. HSP Model Prediction (Red Dashed Line) Compared with Experimental
Measurement (at RT) on K1–159 as a Function of BCP Weight Fraction in the Blend. ..55
Figure 51. Diffusion-Corrected HSP Model Prediction after Diffusion Correction by Chain
Length Calculation .............................................................................................................56
Figure 52. SANS Data (left) and Correction between Selectivity and Domain Size from
Fitting of SANS Data (right)..............................................................................................56
Figure 53. Water/DMMP Selectivity as a Function of Weight Fraction of BCP 159 in Blend
with K1...............................................................................................................................57
Figure 54. UC Model Predictions Compared with Experimental Data. The Final UC Model
(HSP Combined with Diffusion Correction (k = 0.7)) is the Optimal Model....................57
Figure 55. Structure–Property Relationship (from the UC Model) Correlating Selectivity to
Total Molecular Weight and the W1 Mol Ratio (in Final BCP Structure) ........................58
Figure 56. Hansen Solubility Parameter Correlated to the Total Molecular Weight and the
W1 Mol Ratio (in Final BCP) ............................................................................................59
Figure 57. Structure–Property Relationship Correlating Selectivity to Total Molecular
Weight and W1 Mol Ratio (in Final BCP) in Arkema BCPs (by Second Synthetic
Route) .................................................................................................................................59
Figure 58. MVTR of K1–5 and K1–6 Compared with Previously Studied Arkema BCPs at
Same Weight Ratio ............................................................................................................60
Figure 59. Water/DMMP Selectivity of BCP 5 and BCP 6 Compared to Previously Studied
BCPs. K1–6 Shows Selectivity Comparable to That of ChemPak XRT ...........................60
v
DISTRIBUTION A. Approved for public release; distribution unlimited.
88ABW-2013-3230; 15 July 2013
LIST OF TABLES
Page
Table 1. Selected Monomers and Their Functions ..........................................................................4
Table 2 Advantages and Disadvantages of Using N and K as Host Polymer .................................5
Table 3. Route 1—First block: P(A-co-B); Effect of B concentration ..........................................20
Table 4. Route 1 to Diblock: P(A-co-B)-b-PW1; Mn First block = 1 AU .....................................21
Table 5. Route 2 to First block: P(W1) in DMSO .........................................................................22
Table 6. Route 2 to First Block: P(E-co-W1); Variation of Initiator Concentration .....................23
Table 7. Route 2—First Block: P(E-co-W1) to Be Used in Second Step ......................................24
Table 8. Copolymerizations of E with W1 ....................................................................................24
Table 9. Route 2—Diblock: P(E-co-W1)-b-P(A); Mn = 1.25 AU .................................................24
Table 10. Route 2—Diblock: P(E-co-W1)-b-P(A); Mn = 2.25 AU ...............................................25
Table 11. Route 2 – Diblock: P(E-co-W1)-b-P(A); Mn = 2 AU ....................................................25
Table 12. Route 3—First Block: P(E-co-W2); Impact of Temperature ........................................27
Table 13. Route 3—Diblock: P(E-co-W2)-b-P(A) ........................................................................28
Table 14. Diblock Copolymers Summary and Films Characterization. ........................................29
Table 15. Diblock Copolymer Summary and Film Characterizations. ..........................................30
Table 16. Saturated Vapor Pressure (PSaturated) at Room Temperature ..........................................42
Table 17. WVTR Values for Different Temperatures ...................................................................45
Table 18. Permeation of Materials by DMMP (56 Pa)–Water Vapor (1,474 Pa) Mixture after
48 h at 24 °C ......................................................................................................................48
Table 19. Total Heat Loss by 8 × 8-in Samples of the Most-breathable Films .............................48
Table 20. Characteristic Distances in BCP 88 Extracted from q2 × I vs. q 1D SAXS Profiles
(Series 88) ..........................................................................................................................49
Table 21. Gas Permeance and Permeability Results for BCP N2 Membrane ...............................51
Table 22. Perm-Selectivity* of Water Vapor over Another Gas i (αo
H2O/i) ...................................51
Table 23. Calculated HSP Values ..................................................................................................53
Table 24. Number of Group Contributions in Two BCPs .............................................................53
Table 25. Selectivity of Two BCPs ................................................................................................54
vi
DISTRIBUTION A. Approved for public release; distribution unlimited.
88ABW-2013-3230; 15 July 2013
ACKNOWLEDGEMENTS
Support for this project was provided by the DoD. The neutron reflectivity data were collected at
Spallation Neutron Source (SNS) at Oak Ridge National Laboratory (ORNL). SANS data were
collected using the General-Purpose Small-Angle Neutron Scattering Diffractometer at High
Flux Isotope Reactor (HFIR) at Oak Ridge National Laboratory (ORNL). We thank Drs. James
Browning and Ken Littrell for their support on data collection and analysis on the SANS and NR
data. Research performed at SNS and HIFR at ORNL was sponsored by the Scientific User
Facilities Division, Office of Basic Energy Sciences, U.S. Department of Energy.
1
DISTRIBUTION A. Approved for public release; distribution unlimited.
88ABW-2013-3230; 15 July 2013
1. SUMMARY
The research team composed of Arkema, Lion Apparel and University of Cincinnati (UC)
successfully identified new barrier materials that exceed current technology for protective
garments. These materials are novel semi-permeable membranes (SPMs) based on amphiphilic
block copolymers (BCPs) blended in a high-strength host polymer. This innovation was enabled
by Arkema’s Blocbuilder®
controlled radical BCP polymerization technology, which generates
tailored polymer architectures. The water and chemical warfare agent (CWA) transport
properties were measured at Arkema and UC. UC also developed characterization methods and
computer simulation models to relate the permeation properties to the composition and nanoscale
morphology of the membranes.
The new SPMs selectively transport moisture vapor (perspiration) while blocking ChemBio
agents. In addition, the membranes maintain performance and mechanical integrity over a broad
range of temperatures, resulting in a more protective and lighter weight garment than exists
today. By comparison with the Military JSLIST combat garment, which implements the Saratoga
carbon-absorption technology, the best performing candidates show a combination of high water
vapor transmission rate (same level as JSLIST) and much higher water selectivity.
2
DISTRIBUTION A. Approved for public release; distribution unlimited.
88ABW-2013-3230; 15 July 2013
2. INTRODUCTION
Effective personal protection against exposure to toxic chemical agents in vapor form is critical
in the military and in civilian defense due to threats of chemical-biological agents and industrial
toxins.1 Earlier technology was based on butyl rubber (i.e., linear poly(methylpropene-co-2-
methyl-1,3-butadiene)), working on the principle of total blockage.2 The lack of breathability of
butyl rubber, however, results in fatigue and exhaustion due to heat stress and ineffective
evaporative cooling.1, 3
To reduce the heat load, permeable clothing was developed implementing PBI Saratoga carbon
pellet technology,4,5
a carbonaceous-sorbent technology.6 In this type of permeable clothing, a
layer of finely distributed active carbon, either bound in polyurethane foam or as particles of
carbon, is dispersed between two layers of textile. The highly porous, active-carbon layer permits
water vapor released from the body to pass through, but adsorbs chemical warfare agents
(CWAs) and thereby limits skin exposure.
The U. S. Department of Defense currently uses protective garments (Military JSLIST suit)
made with three layers of open-cell polyurethane loaded with activated carbon.1 These garments
are bulky and heavy (PBI Saratoga weighs approximately 460 g/m2).
5b Therefore, lighter
membranes are considered a high priority. In addition, protective garments based on activated
carbon absorption are not effective against bio hazards or aerosols, are not suited for petroleum
and oil environments, are not fire resistant, and have limited shelf and field service lifetimes.
Recent research in protective clothing seeks improved performance against the environment,
thermo-physiological comfort, improved compatibility between and within different components
in the clothing assembly, reduction in weight and bulk, ballistic protection, and reduction of life
cycle costs.7 High-performance nanofibers, highly functional and high-performance fabrics
(including breathable fabrics by GORE-TEX®
and laminated hydrophilic membranes) are
emerging trends in protective clothing development.7 Another promising area of development
involves working enhanced SPMs using BCP blends in a host polymer. In this project we
implemented the SPM strategy by synthesizing and identifying a group of copolymer blends to
meet current JSLIST water permeation properties and display better CWA rejection.
3
DISTRIBUTION A. Approved for public release; distribution unlimited.
88ABW-2013-3230; 15 July 2013
3. METHODS AND PROCEDURES
3.1. BCP Synthesis
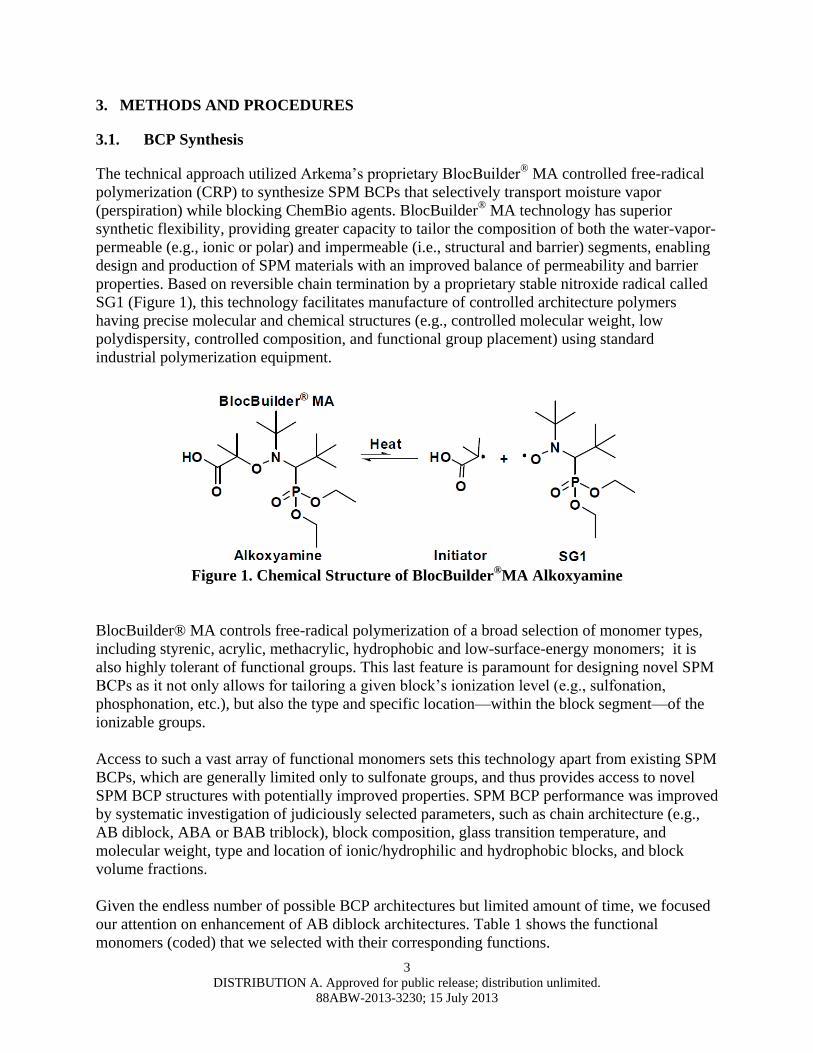
The technical approach utilized Arkema’s proprietary BlocBuilder®
MA controlled free-radical
polymerization (CRP) to synthesize SPM BCPs that selectively transport moisture vapor
(perspiration) while blocking ChemBio agents. BlocBuilder®
MA technology has superior
synthetic flexibility, providing greater capacity to tailor the composition of both the water-vapor-
permeable (e.g., ionic or polar) and impermeable (i.e., structural and barrier) segments, enabling
design and production of SPM materials with an improved balance of permeability and barrier
properties. Based on reversible chain termination by a proprietary stable nitroxide radical called
SG1 (Figure 1), this technology facilitates manufacture of controlled architecture polymers
having precise molecular and chemical structures (e.g., controlled molecular weight, low
polydispersity, controlled composition, and functional group placement) using standard
industrial polymerization equipment.
Figure 1. Chemical Structure of BlocBuilder
®MA Alkoxyamine
BlocBuilder® MA controls free-radical polymerization of a broad selection of monomer types,
including styrenic, acrylic, methacrylic, hydrophobic and low-surface-energy monomers; it is
also highly tolerant of functional groups. This last feature is paramount for designing novel SPM
BCPs as it not only allows for tailoring a given block’s ionization level (e.g., sulfonation,
phosphonation, etc.), but also the type and specific location—within the block segment—of the
ionizable groups.
Access to such a vast array of functional monomers sets this technology apart from existing SPM
BCPs, which are generally limited only to sulfonate groups, and thus provides access to novel
SPM BCP structures with potentially improved properties. SPM BCP performance was improved
by systematic investigation of judiciously selected parameters, such as chain architecture (e.g.,
AB diblock, ABA or BAB triblock), block composition, glass transition temperature, and
molecular weight, type and location of ionic/hydrophilic and hydrophobic blocks, and block
volume fractions.
Given the endless number of possible BCP architectures but limited amount of time, we focused
our attention on enhancement of AB diblock architectures. Table 1 shows the functional
monomers (coded) that we selected with their corresponding functions.
4
DISTRIBUTION A. Approved for public release; distribution unlimited.
88ABW-2013-3230; 15 July 2013
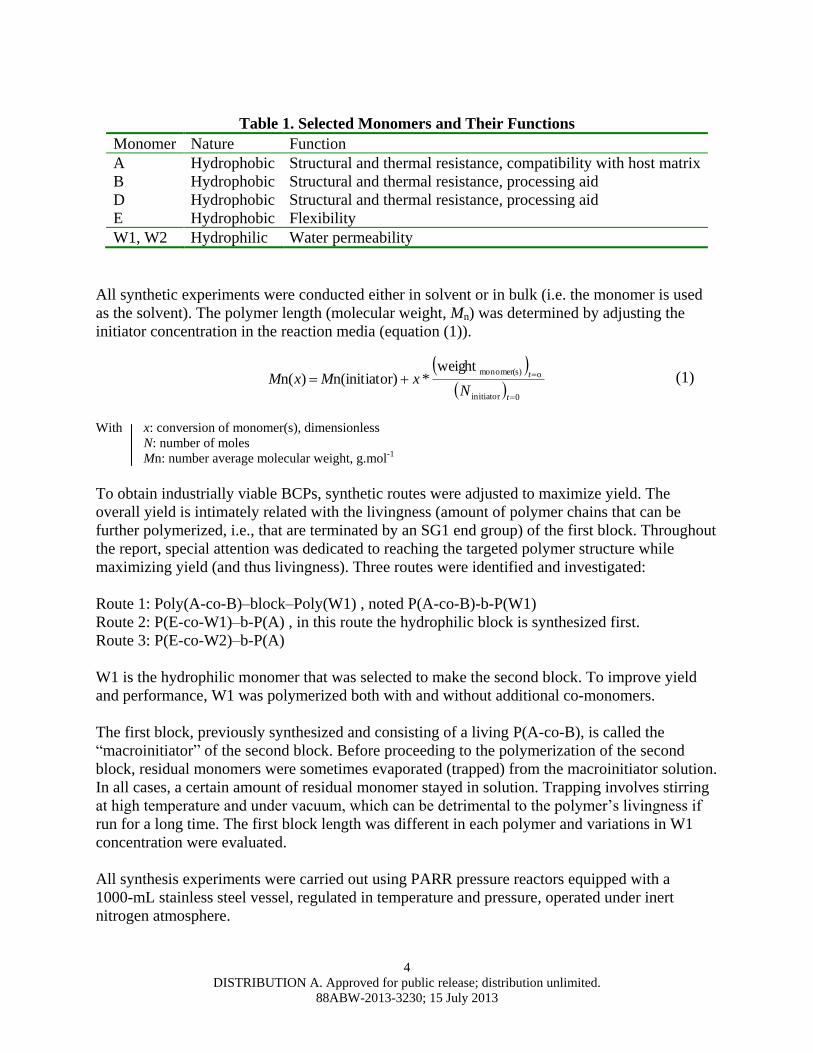
Table 1. Selected Monomers and Their Functions
Monomer Nature Function
A Hydrophobic Structural and thermal resistance, compatibility with host matrix
B Hydrophobic Structural and thermal resistance, processing aid
D Hydrophobic Structural and thermal resistance, processing aid
E Hydrophobic Flexibility
W1, W2 Hydrophilic Water permeability
All synthetic experiments were conducted either in solvent or in bulk (i.e. the monomer is used
as the solvent). The polymer length (molecular weight, Mn) was determined by adjusting the
initiator concentration in the reaction media (equation (1)).
0initiator
omonomer(s)weight*r)n(initiato)n(
t
t
NxMxM (1)
With x: conversion of monomer(s), dimensionless
N: number of moles
Mn: number average molecular weight, g.mol-1
To obtain industrially viable BCPs, synthetic routes were adjusted to maximize yield. The
overall yield is intimately related with the livingness (amount of polymer chains that can be
further polymerized, i.e., that are terminated by an SG1 end group) of the first block. Throughout
the report, special attention was dedicated to reaching the targeted polymer structure while
maximizing yield (and thus livingness). Three routes were identified and investigated:
Route 1: Poly(A-co-B)–block–Poly(W1) , noted P(A-co-B)-b-P(W1)
Route 2: P(E-co-W1)–b-P(A) , in this route the hydrophilic block is synthesized first.
Route 3: P(E-co-W2)–b-P(A)
W1 is the hydrophilic monomer that was selected to make the second block. To improve yield
and performance, W1 was polymerized both with and without additional co-monomers.
The first block, previously synthesized and consisting of a living P(A-co-B), is called the
“macroinitiator” of the second block. Before proceeding to the polymerization of the second
block, residual monomers were sometimes evaporated (trapped) from the macroinitiator solution.
In all cases, a certain amount of residual monomer stayed in solution. Trapping involves stirring
at high temperature and under vacuum, which can be detrimental to the polymer’s livingness if
run for a long time. The first block length was different in each polymer and variations in W1
concentration were evaluated.
All synthesis experiments were carried out using PARR pressure reactors equipped with a
1000-mL stainless steel vessel, regulated in temperature and pressure, operated under inert
nitrogen atmosphere.
5
DISTRIBUTION A. Approved for public release; distribution unlimited.
88ABW-2013-3230; 15 July 2013
3.2. BCP Blend Membrane Preparation
3.2.1. Block Copolymer Blend Preparation at Arkema
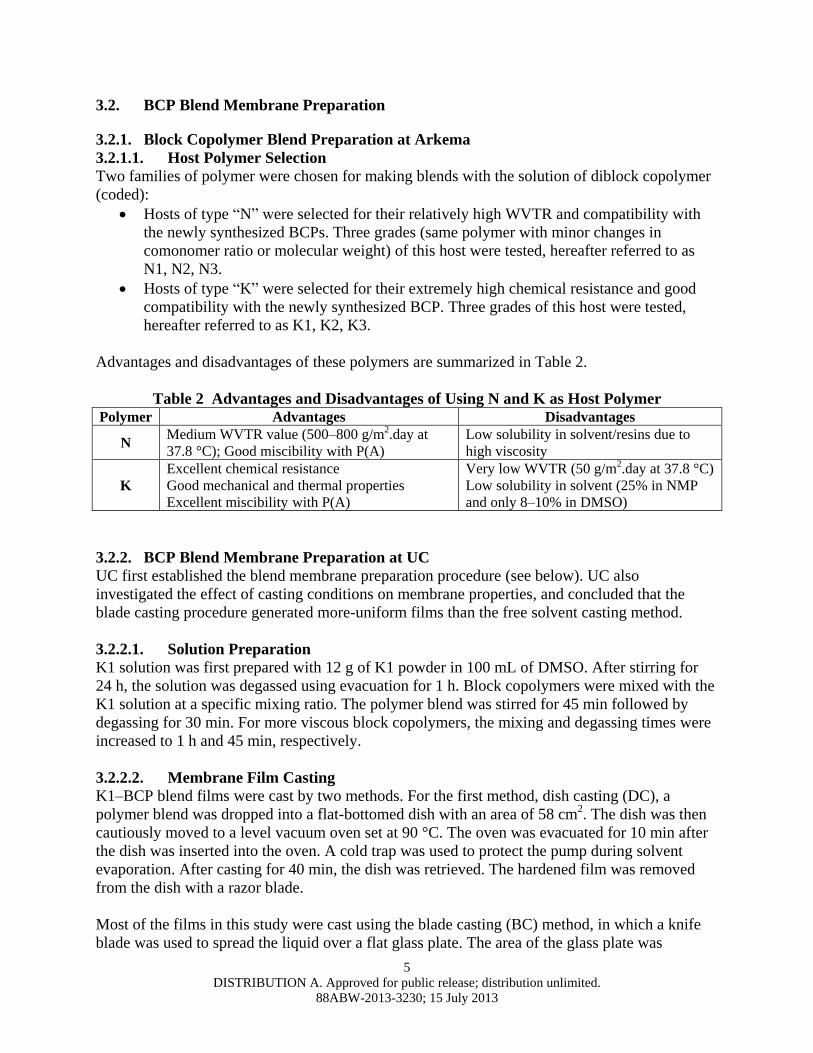
3.2.1.1. Host Polymer Selection
Two families of polymer were chosen for making blends with the solution of diblock copolymer
(coded):
Hosts of type “N” were selected for their relatively high WVTR and compatibility with
the newly synthesized BCPs. Three grades (same polymer with minor changes in
comonomer ratio or molecular weight) of this host were tested, hereafter referred to as
N1, N2, N3.
Hosts of type “K” were selected for their extremely high chemical resistance and good
compatibility with the newly synthesized BCP. Three grades of this host were tested,
hereafter referred to as K1, K2, K3.
Advantages and disadvantages of these polymers are summarized in Table 2.
Table 2 Advantages and Disadvantages of Using N and K as Host Polymer Polymer Advantages Disadvantages
N Medium WVTR value (500–800 g/m2.day at
37.8 °C); Good miscibility with P(A)
Low solubility in solvent/resins due to
high viscosity
K
Excellent chemical resistance
Good mechanical and thermal properties
Excellent miscibility with P(A)
Very low WVTR (50 g/m2.day at 37.8 °C)
Low solubility in solvent (25% in NMP
and only 8–10% in DMSO)
3.2.2. BCP Blend Membrane Preparation at UC
UC first established the blend membrane preparation procedure (see below). UC also
investigated the effect of casting conditions on membrane properties, and concluded that the
blade casting procedure generated more-uniform films than the free solvent casting method.
3.2.2.1. Solution Preparation
K1 solution was first prepared with 12 g of K1 powder in 100 mL of DMSO. After stirring for
24 h, the solution was degassed using evacuation for 1 h. Block copolymers were mixed with the
K1 solution at a specific mixing ratio. The polymer blend was stirred for 45 min followed by
degassing for 30 min. For more viscous block copolymers, the mixing and degassing times were
increased to 1 h and 45 min, respectively.
3.2.2.2. Membrane Film Casting
K1–BCP blend films were cast by two methods. For the first method, dish casting (DC), a
polymer blend was dropped into a flat-bottomed dish with an area of 58 cm2. The dish was then
cautiously moved to a level vacuum oven set at 90 °C. The oven was evacuated for 10 min after
the dish was inserted into the oven. A cold trap was used to protect the pump during solvent
evaporation. After casting for 40 min, the dish was retrieved. The hardened film was removed
from the dish with a razor blade.
Most of the films in this study were cast using the blade casting (BC) method, in which a knife
blade was used to spread the liquid over a flat glass plate. The area of the glass plate was
6
DISTRIBUTION A. Approved for public release; distribution unlimited.
88ABW-2013-3230; 15 July 2013
250 cm2. The polymer blend had to be spread on the plate immediately before it was moved into
the oven because a thickness gradient formed as soon as the solution was dispersed on the plate.
For this method the casting time was extended to 50 min.
3.2.2.3. Annealing
UC investigated the effect of annealing temperature and type of substrate surface on film
properties. Host polymers N2 and N3 were selected to carry out this study.
3.2.2.3.1. Annealing temperature
Two annealing temperatures were used (120 and 150 °C). At both temperatures, the films were
placed in a vacuum oven overnight. A more uniform film resulted at 120 °C; treatment at 150 °C
sometimes degraded portions of the films.
3.2.2.3.2. Substrate
Teflon and glass dishes were used as the substrate for annealing. Thin-film polymers annealed in
Teflon dishes showed a patchy interface with some translucent regions. These translucent
regions were not observed in unannealed films. Therefore we decided to cast all BCP blend films
on glass plates.
3.3. Characterization
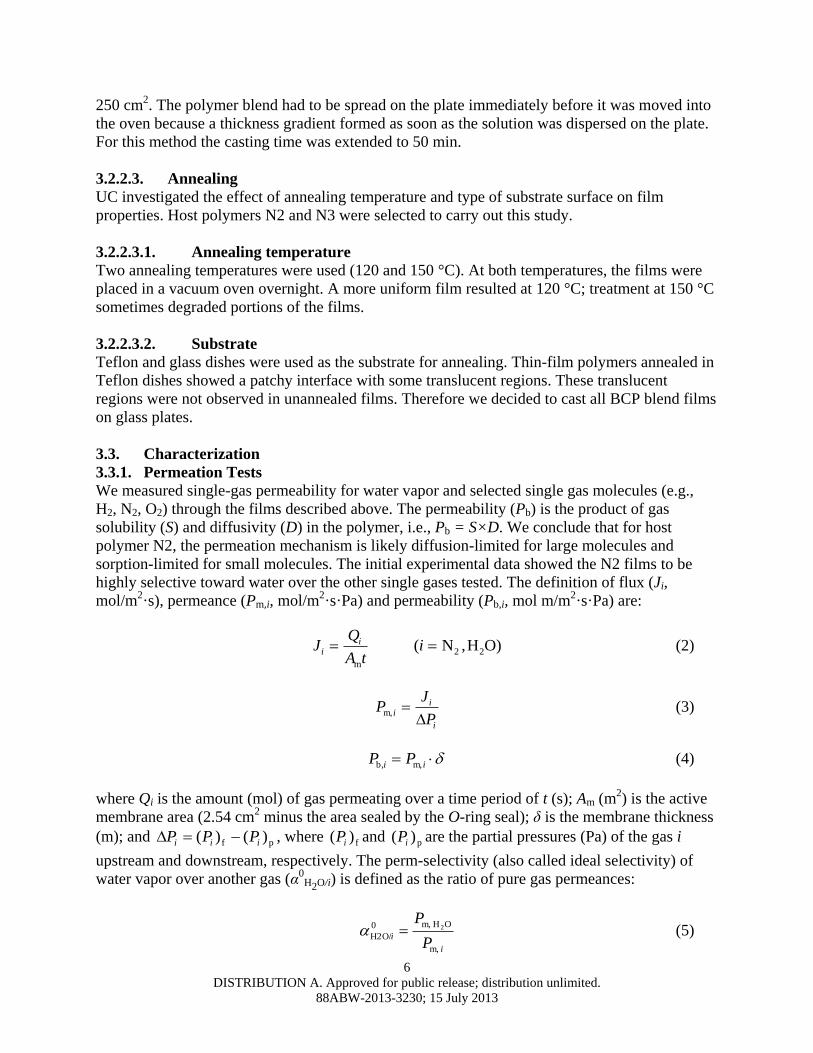
3.3.1. Permeation Tests
We measured single-gas permeability for water vapor and selected single gas molecules (e.g.,
H2, N2, O2) through the films described above. The permeability (Pb) is the product of gas
solubility (S) and diffusivity (D) in the polymer, i.e., Pb = S×D. We conclude that for host
polymer N2, the permeation mechanism is likely diffusion-limited for large molecules and
sorption-limited for small molecules. The initial experimental data showed the N2 films to be
highly selective toward water over the other single gases tested. The definition of flux (Ji,
mol/m2·s), permeance (Pm,i, mol/m
2·s·Pa) and permeability (Pb,i, mol m/m
2·s·Pa) are:
)OH,N( 22
m
itA
QJ i
i (2)
i
ii
P
JP
m, (3)
ii PP m,b, (4)
where Qi is the amount (mol) of gas permeating over a time period of t (s); Am (m2) is the active
membrane area (2.54 cm2 minus the area sealed by the O-ring seal); δ is the membrane thickness
(m); and pf )()( iii PPP , where f)( iP and p)( iP are the partial pressures (Pa) of the gas i
upstream and downstream, respectively. The perm-selectivity (also called ideal selectivity) of
water vapor over another gas (α0
H2O/i) is defined as the ratio of pure gas permeances:
i
iP
P
m,
OH m,0
H2O/2 (5)
7
DISTRIBUTION A. Approved for public release; distribution unlimited.
88ABW-2013-3230; 15 July 2013
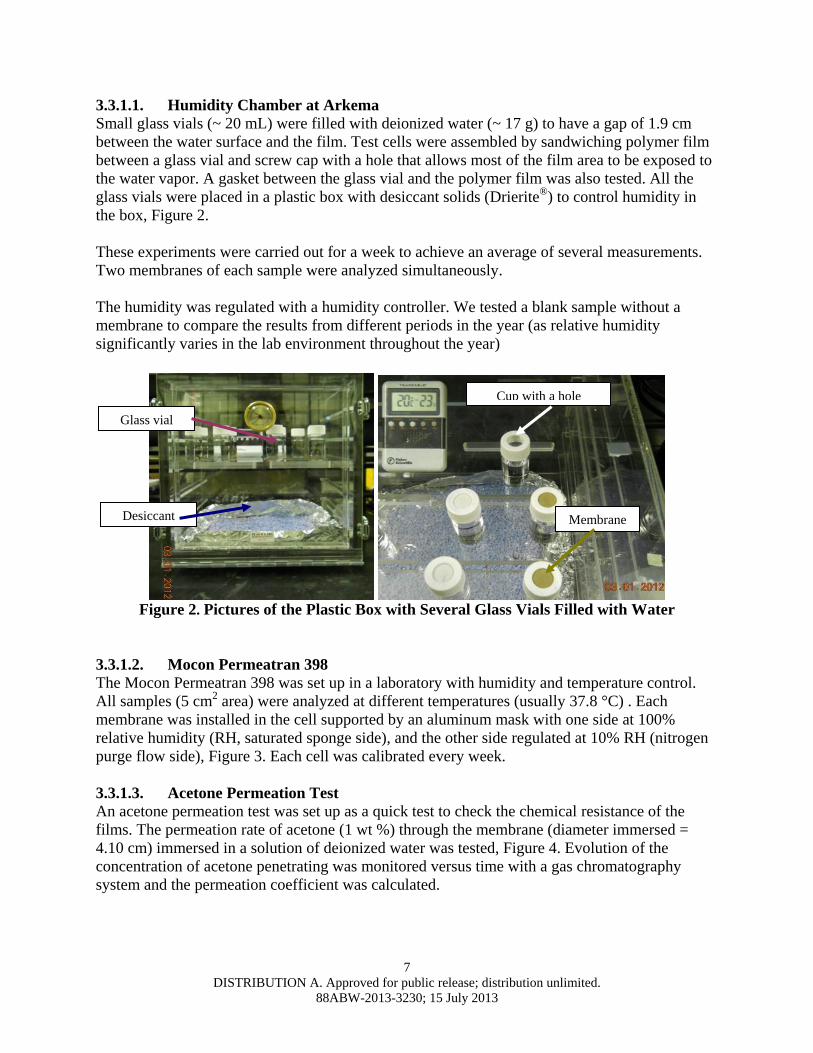
3.3.1.1. Humidity Chamber at Arkema
Small glass vials (~ 20 mL) were filled with deionized water (~ 17 g) to have a gap of 1.9 cm
between the water surface and the film. Test cells were assembled by sandwiching polymer film
between a glass vial and screw cap with a hole that allows most of the film area to be exposed to
the water vapor. A gasket between the glass vial and the polymer film was also tested. All the
glass vials were placed in a plastic box with desiccant solids (Drierite®
) to control humidity in
the box, Figure 2.
These experiments were carried out for a week to achieve an average of several measurements.
Two membranes of each sample were analyzed simultaneously.
The humidity was regulated with a humidity controller. We tested a blank sample without a
membrane to compare the results from different periods in the year (as relative humidity
significantly varies in the lab environment throughout the year)
Figure 2. Pictures of the Plastic Box with Several Glass Vials Filled with Water
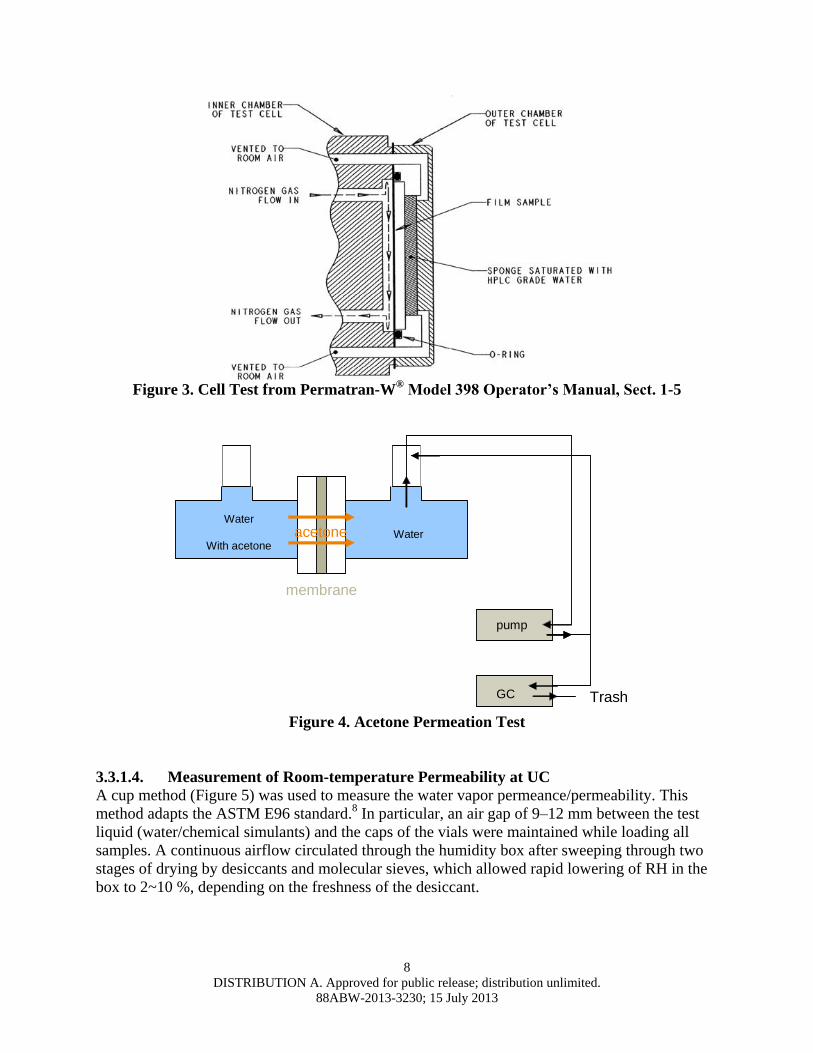
3.3.1.2. Mocon Permeatran 398
The Mocon Permeatran 398 was set up in a laboratory with humidity and temperature control.
All samples (5 cm2 area) were analyzed at different temperatures (usually 37.8 °C) . Each
membrane was installed in the cell supported by an aluminum mask with one side at 100%
relative humidity (RH, saturated sponge side), and the other side regulated at 10% RH (nitrogen
purge flow side), Figure 3. Each cell was calibrated every week.
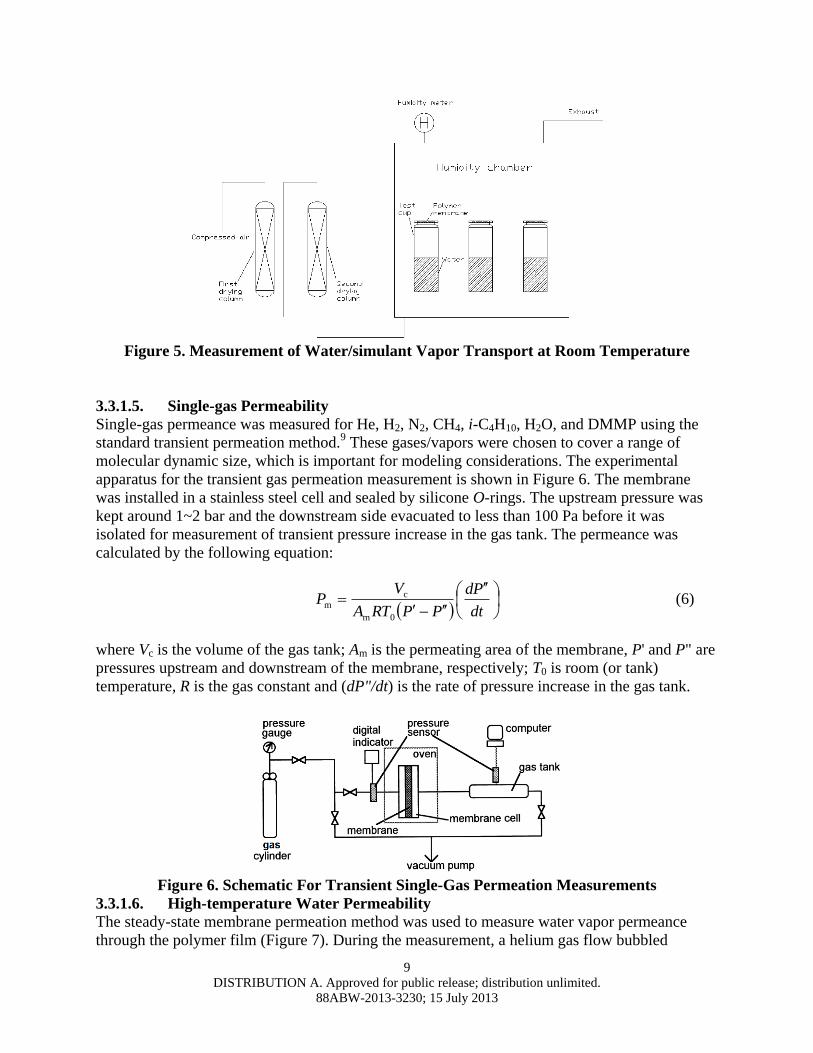
3.3.1.3. Acetone Permeation Test
An acetone permeation test was set up as a quick test to check the chemical resistance of the
films. The permeation rate of acetone (1 wt %) through the membrane (diameter immersed =
4.10 cm) immersed in a solution of deionized water was tested, Figure 4. Evolution of the
concentration of acetone penetrating was monitored versus time with a gas chromatography
system and the permeation coefficient was calculated.
Desiccant
Glass vial
Cup with a hole
Membrane
8
DISTRIBUTION A. Approved for public release; distribution unlimited.
88ABW-2013-3230; 15 July 2013
Figure 3. Cell Test from Permatran-W
® Model 398 Operator’s Manual, Sect. 1-5
pump
GC
Water
With acetone
membrane
Water acetone
Trash
Figure 4. Acetone Permeation Test
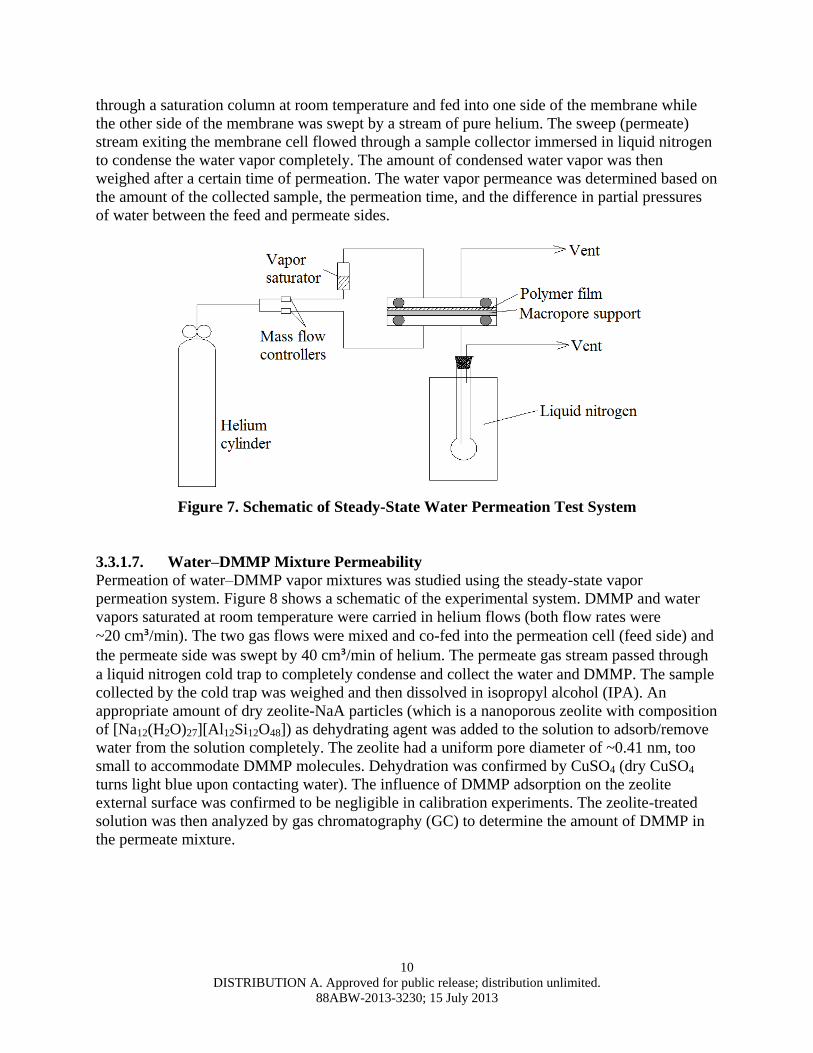
3.3.1.4. Measurement of Room-temperature Permeability at UC
A cup method (Figure 5) was used to measure the water vapor permeance/permeability. This
method adapts the ASTM E96 standard.8 In particular, an air gap of 9–12 mm between the test
liquid (water/chemical simulants) and the caps of the vials were maintained while loading all
samples. A continuous airflow circulated through the humidity box after sweeping through two
stages of drying by desiccants and molecular sieves, which allowed rapid lowering of RH in the
box to 2~10 %, depending on the freshness of the desiccant.
9
DISTRIBUTION A. Approved for public release; distribution unlimited.
88ABW-2013-3230; 15 July 2013
Figure 5. Measurement of Water/simulant Vapor Transport at Room Temperature
3.3.1.5. Single-gas Permeability
Single-gas permeance was measured for He, H2, N2, CH4, i-C4H10, H2O, and DMMP using the
standard transient permeation method.9 These gases/vapors were chosen to cover a range of
molecular dynamic size, which is important for modeling considerations. The experimental
apparatus for the transient gas permeation measurement is shown in Figure 6. The membrane
was installed in a stainless steel cell and sealed by silicone O-rings. The upstream pressure was
kept around 1~2 bar and the downstream side evacuated to less than 100 Pa before it was
isolated for measurement of transient pressure increase in the gas tank. The permeance was
calculated by the following equation:
dt
Pd
PPRTA
VP
0m
c
m (6)
where Vc is the volume of the gas tank; Am is the permeating area of the membrane, P' and P" are
pressures upstream and downstream of the membrane, respectively; T0 is room (or tank)
temperature, R is the gas constant and (dP"/dt) is the rate of pressure increase in the gas tank.
Figure 6. Schematic For Transient Single-Gas Permeation Measurements
3.3.1.6. High-temperature Water Permeability
The steady-state membrane permeation method was used to measure water vapor permeance
through the polymer film (Figure 7). During the measurement, a helium gas flow bubbled
10
DISTRIBUTION A. Approved for public release; distribution unlimited.
88ABW-2013-3230; 15 July 2013
through a saturation column at room temperature and fed into one side of the membrane while
the other side of the membrane was swept by a stream of pure helium. The sweep (permeate)
stream exiting the membrane cell flowed through a sample collector immersed in liquid nitrogen
to condense the water vapor completely. The amount of condensed water vapor was then
weighed after a certain time of permeation. The water vapor permeance was determined based on
the amount of the collected sample, the permeation time, and the difference in partial pressures
of water between the feed and permeate sides.
Figure 7. Schematic of Steady-State Water Permeation Test System
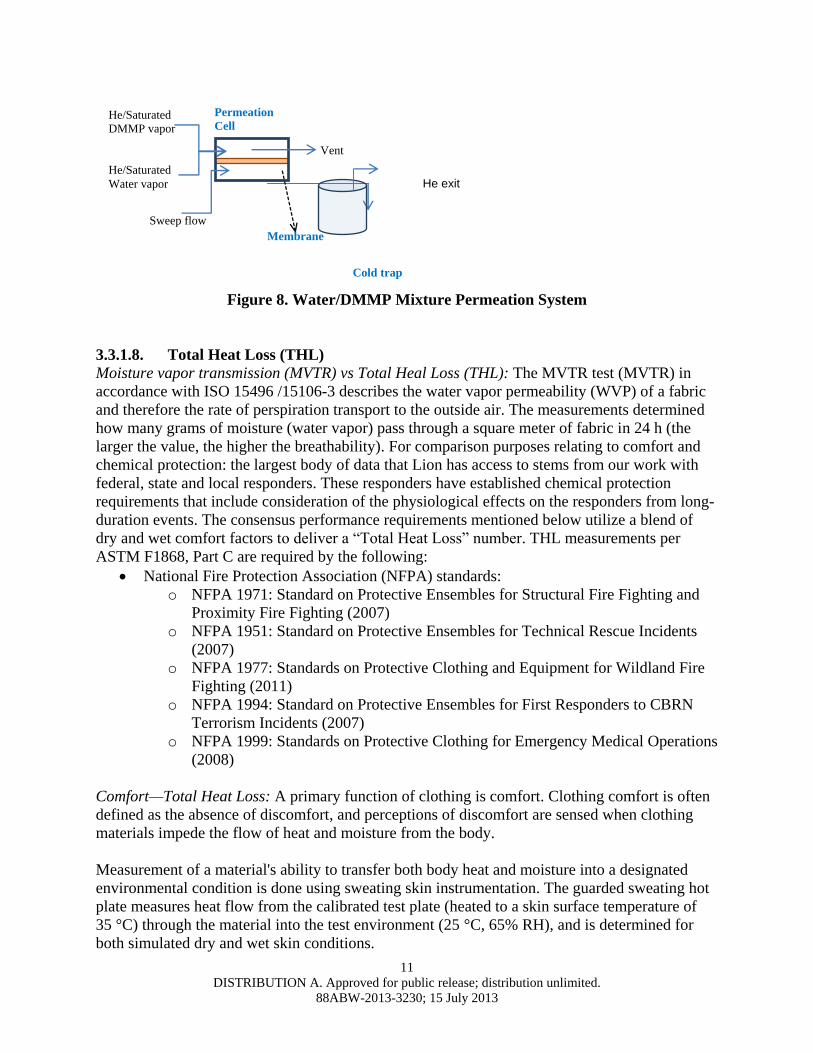
3.3.1.7. Water–DMMP Mixture Permeability
Permeation of water–DMMP vapor mixtures was studied using the steady-state vapor
permeation system. Figure 8 shows a schematic of the experimental system. DMMP and water
vapors saturated at room temperature were carried in helium flows (both flow rates were
~20 cm³/min). The two gas flows were mixed and co-fed into the permeation cell (feed side) and
the permeate side was swept by 40 cm³/min of helium. The permeate gas stream passed through
a liquid nitrogen cold trap to completely condense and collect the water and DMMP. The sample
collected by the cold trap was weighed and then dissolved in isopropyl alcohol (IPA). An
appropriate amount of dry zeolite-NaA particles (which is a nanoporous zeolite with composition
of [Na12(H2O)27][Al12Si12O48]) as dehydrating agent was added to the solution to adsorb/remove
water from the solution completely. The zeolite had a uniform pore diameter of ~0.41 nm, too
small to accommodate DMMP molecules. Dehydration was confirmed by CuSO4 (dry CuSO4
turns light blue upon contacting water). The influence of DMMP adsorption on the zeolite
external surface was confirmed to be negligible in calibration experiments. The zeolite-treated
solution was then analyzed by gas chromatography (GC) to determine the amount of DMMP in
the permeate mixture.
11
DISTRIBUTION A. Approved for public release; distribution unlimited.
88ABW-2013-3230; 15 July 2013
Figure 8. Water/DMMP Mixture Permeation System
3.3.1.8. Total Heat Loss (THL)
Moisture vapor transmission (MVTR) vs Total Heal Loss (THL): The MVTR test (MVTR) in
accordance with ISO 15496 /15106-3 describes the water vapor permeability (WVP) of a fabric
and therefore the rate of perspiration transport to the outside air. The measurements determined
how many grams of moisture (water vapor) pass through a square meter of fabric in 24 h (the
larger the value, the higher the breathability). For comparison purposes relating to comfort and
chemical protection: the largest body of data that Lion has access to stems from our work with
federal, state and local responders. These responders have established chemical protection
requirements that include consideration of the physiological effects on the responders from long-
duration events. The consensus performance requirements mentioned below utilize a blend of
dry and wet comfort factors to deliver a “Total Heat Loss” number. THL measurements per
ASTM F1868, Part C are required by the following:
National Fire Protection Association (NFPA) standards:
o NFPA 1971: Standard on Protective Ensembles for Structural Fire Fighting and
Proximity Fire Fighting (2007)
o NFPA 1951: Standard on Protective Ensembles for Technical Rescue Incidents
(2007)
o NFPA 1977: Standards on Protective Clothing and Equipment for Wildland Fire
Fighting (2011)
o NFPA 1994: Standard on Protective Ensembles for First Responders to CBRN
Terrorism Incidents (2007)
o NFPA 1999: Standards on Protective Clothing for Emergency Medical Operations
(2008)
Comfort—Total Heat Loss: A primary function of clothing is comfort. Clothing comfort is often
defined as the absence of discomfort, and perceptions of discomfort are sensed when clothing
materials impede the flow of heat and moisture from the body.
Measurement of a material's ability to transfer both body heat and moisture into a designated
environmental condition is done using sweating skin instrumentation. The guarded sweating hot
plate measures heat flow from the calibrated test plate (heated to a skin surface temperature of
35 °C) through the material into the test environment (25 °C, 65% RH), and is determined for
both simulated dry and wet skin conditions.
Cold trap
He exit
Membrane
He/Saturated
DMMP vapor
He/Saturated
Water vapor
Sweep flow
Vent
Permeation
Cell
12
DISTRIBUTION A. Approved for public release; distribution unlimited.
88ABW-2013-3230; 15 July 2013
The sweating skin instrumentation, when used in a dry state, measures dry heat transfer with
outputs used to calculate thermal resistance/insulation values. Following the dry test, the
instrument is fed water and made to "sweat." The instrument, when used in a sweating state, uses
the heat transfer results to calculate evaporative resistance. These measurements also provide a
picture of the permeability, breathability, and heat loss from sweat evaporation.
Measurements obtained from both the dry and wet test plates were combined to calculate total
heat loss (RHL) in W/m². THL is the heat transferred through the test material from a fully
sweating test plate surface into the test environment. THL, measured at a 100% wet skin
condition, indicates the highest predicted metabolic activity level that a wearer may sustain and
still maintain body thermal comfort while in a highly stressed state in the test environment.
Because, the sweating hot plate does not consider effects such as insulating air layers, garment
design or fit, the THL value represents the highest theoretically possible amount of heat that can
be transferred through a material system for a given set of environmental conditions without
active cooling or ventilation.
All heat and moisture transfer properties were calculated from measurements of thermal
transport made with the large skin model hot plate instrumentation. These measurements were
made in accordance with the requirements of ASTM F1868 and/or ISO 11092.
3.3.2. Polymer Characterization
For polymer characterization (polymer composition, chemical structure), several techniques were
used.
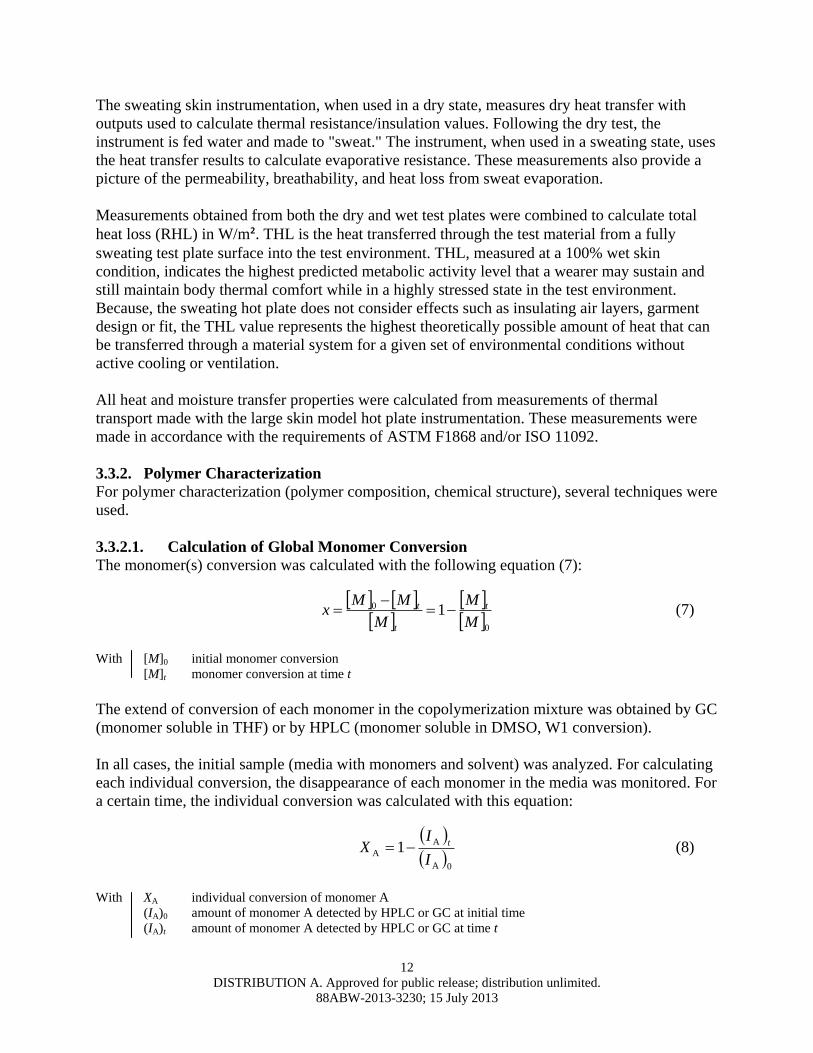
3.3.2.1. Calculation of Global Monomer Conversion
The monomer(s) conversion was calculated with the following equation (7):
0
0 1M
M
M
MMx t
t
t
(7)
With [M]0 initial monomer conversion
[M]t monomer conversion at time t
The extend of conversion of each monomer in the copolymerization mixture was obtained by GC
(monomer soluble in THF) or by HPLC (monomer soluble in DMSO, W1 conversion).
In all cases, the initial sample (media with monomers and solvent) was analyzed. For calculating
each individual conversion, the disappearance of each monomer in the media was monitored. For
a certain time, the individual conversion was calculated with this equation:
0A
A
A 1I
IX t (8)
With XA individual conversion of monomer A
(IA)0 amount of monomer A detected by HPLC or GC at initial time
(IA)t amount of monomer A detected by HPLC or GC at time t
13
DISTRIBUTION A. Approved for public release; distribution unlimited.
88ABW-2013-3230; 15 July 2013
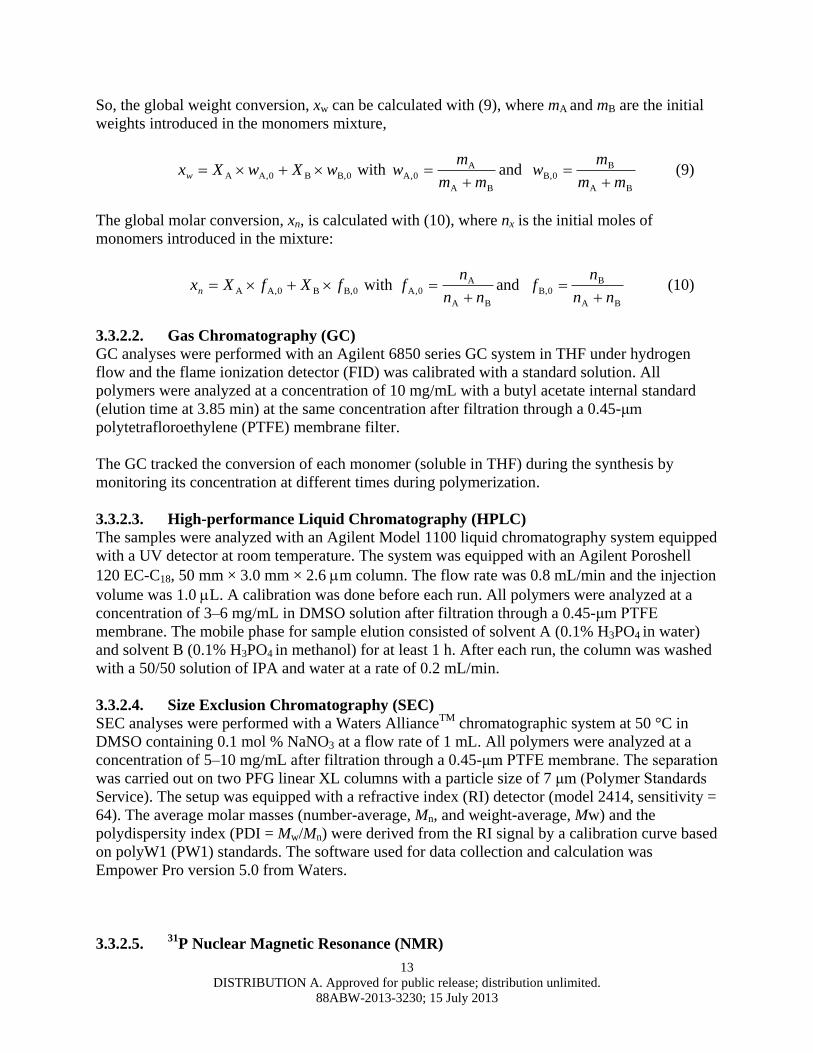
So, the global weight conversion, xw can be calculated with (9), where mA and mB are the initial
weights introduced in the monomers mixture,
0,BB0,AA wXwXxw with BA
A0,A
mm
mw
and
BA
B0,B
mm
mw
(9)
The global molar conversion, xn, is calculated with (10), where nx is the initial moles of
monomers introduced in the mixture:
0,BB0,AA fXfXxn with BA
A0,A
nn
nf
and
BA
B0,B
nn
nf
(10)
3.3.2.2. Gas Chromatography (GC)
GC analyses were performed with an Agilent 6850 series GC system in THF under hydrogen
flow and the flame ionization detector (FID) was calibrated with a standard solution. All
polymers were analyzed at a concentration of 10 mg/mL with a butyl acetate internal standard
(elution time at 3.85 min) at the same concentration after filtration through a 0.45-μm
polytetrafloroethylene (PTFE) membrane filter.
The GC tracked the conversion of each monomer (soluble in THF) during the synthesis by
monitoring its concentration at different times during polymerization.
3.3.2.3. High-performance Liquid Chromatography (HPLC)
The samples were analyzed with an Agilent Model 1100 liquid chromatography system equipped
with a UV detector at room temperature. The system was equipped with an Agilent Poroshell
120 EC-C18, 50 mm × 3.0 mm × 2.6 m column. The flow rate was 0.8 mL/min and the injection
volume was 1.0 L. A calibration was done before each run. All polymers were analyzed at a
concentration of 3–6 mg/mL in DMSO solution after filtration through a 0.45-μm PTFE
membrane. The mobile phase for sample elution consisted of solvent A (0.1% H3PO4 in water)
and solvent B (0.1% H3PO4 in methanol) for at least 1 h. After each run, the column was washed
with a 50/50 solution of IPA and water at a rate of 0.2 mL/min.
3.3.2.4. Size Exclusion Chromatography (SEC)
SEC analyses were performed with a Waters AllianceTM
chromatographic system at 50 °C in
DMSO containing 0.1 mol % NaNO3 at a flow rate of 1 mL. All polymers were analyzed at a
concentration of 5–10 mg/mL after filtration through a 0.45-μm PTFE membrane. The separation
was carried out on two PFG linear XL columns with a particle size of 7 μm (Polymer Standards
Service). The setup was equipped with a refractive index (RI) detector (model 2414, sensitivity =
64). The average molar masses (number-average, Mn, and weight-average, Mw) and the
polydispersity index (PDI = Mw/Mn) were derived from the RI signal by a calibration curve based
on polyW1 (PW1) standards. The software used for data collection and calculation was
Empower Pro version 5.0 from Waters.
3.3.2.5. 31P Nuclear Magnetic Resonance (NMR)
14
DISTRIBUTION A. Approved for public release; distribution unlimited.
88ABW-2013-3230; 15 July 2013
d6-DMSO was added to all samples to provide a lock signal. All spectra were collected at 25 °C. 31
P NMR spectra were collected on a Bruker AV400 spectrometer equipped with a 10-mm Broad
Band Observe (BBO) probe.
Phosphorus NMR is an analytical technique for tracking the livingness of these copolymers. To
synthesize a multiblock copolymer, we need to attach the SG1 function at the end of each chain.
This moiety contains a 31
P nucleus, which can be detected by 31
P NMR. Homolytic separation of
SG1 initiates polymerization of the second block. The 31
P NMR measurement identifies the
amount of material available for the second block polymerization.
3.3.2.6. 13C NMR
The 13
C NMR measures the chemical composition of the diblock copolymers. d6-DMSO was
added to samples as a lock signal. All spectra were collected at 25 °C. Spectra were collected on
the Bruker AV400 using a 10-mm BBO probe..
3.3.2.7. Glass Transition Temperature (Tg) measurement
We measured the Tgs for BCP samples N2 and N3 host polymers using differential scanning
calorimetry (DSC). The thermal stability of these polymers at high temperature (annealing
temperature) was also tested by thermo gravimetric analysis (TGA).
3.3.2.8. Small-angle Neutron Scattering
Small-angle neutron scattering (SANS) measures the nanoscale phase separation that is
responsible for the unique properties of these block copolymers. The nature of this phase
separation is determined by the block ratios and compositions as well as by the film deposition
conditions. Both the size scale and the morphology (sheets, rods, spheres) of the domains impact
transport and needed be taken into account in modeling transport phenomena.
SANS is very sensitive to the presence of deuterium, so by exposing the films to heavy water
vapor (D2O) we were able to track the ingress of water into the film and determine the evolution
of the domain morphology as a function of BCP composition and blending ratio.
SANS was performed at the CG-2 beamline at the High Flux Isotope Reactor (HIFR) at Oak
Ridge National Laboratory (ORNL; Oak Ridge, TN, USA). Scattering data were collected as the
scattered intensity versus the modulus of the momentum transfer wave vector, q. Specifically we
measured the differential scattering cross section per unit volume on an absolute scale, which is
referred to as the intensity, I(q). The data were subject to Unified-fit using the Argonne National
Laboratory routines in Irena macros package.10
3.3.2.9. Neutron Reflectivity (NR)
Neutron reflectivity (NR) was used to elucidate the interfacial structure of cast BCP films. NR is
used to probe the density and chemical composition change at interfaces and reveals how BCP
phase separation is affected by casting. Upon exposure to D2O, NR revealed the location of the
hydrophilic phase relative to the interface position.
In the NR experiments, each sample was irradiated by the incident neutron beam at a very small
incident angle, θ. The ratio of the fluxes of the reflected beam to the incident beam was
measured as a function of scattering vector, q. The relationship between θ and q is
15
DISTRIBUTION A. Approved for public release; distribution unlimited.
88ABW-2013-3230; 15 July 2013
sin4q (11)
where λ is the wavelength of the incident beam. For NR, θ is fixed and a broad spectrum of
wavelengths impinges on the sample (1.5 Å <λ< 16 Å), to obtain a range of q values. The actual
λ of any particular detected neutron is calculated by time of flight.
The normalized reflected intensity (R) is plotted against q. The Rq curve results from the
superposition of waves scattered by the interface. The amplitude and attenuation of each wave
are determined by the thickness, roughness and scattering length density (SLD) of each layer.
Thickness and roughness represent structural information while the SLD reveals the chemical
composition:
i
bM
N
molecule
ASLD (12)
where ρ is the mass density, NA is Avogadro’s number, M is the molecular weight, bi is the
atomic scattering length of atom i, and is molecular number density. is the sum
over scattering lengths of all atoms present in one molecule.
The R–q data were analyzed using Irena macros 2.35 for Igor Pro 6.20 to extract the SLD profile
(SLD as function of perpendicular distance from substrate). Neutron reflectivity was performed
using the Liquids Reflectometer (LR), Spallation Neutron Source (SNS) at ORNL.
3.3.2.10. Small-Angle X-ray Scattering (SAXS)
Samples were analyzed by SAXS to better understand their morphology as a function of
temperature (24 °C, 38 °C) and RH (40%, 90%). SAXS measurements were conducted on the x-
ray scattering instrument at the Laboratory for Research on the Structure of Matter (LRSM)
facility at the University of Pennsylvania using the environmental chamber.
Radiation Cu Kα, 40 kV, 85 mA. Distance from the chamber to the detector = 150 cm.
Exposure time = 600–900 s. Bruker–Nonius FR-591 rotating anode (0.2- 0.2-mm² filament,
~0.3 mm² on sample). Pinhole collimation slits (3) with confocal Max-Flux optics. Bruker AXS
Hi-Star multiwire area detector.
Data manipulation was done using the datasqueeze software v2.1.9. Scattering data were
obtained by averaging integrated intensities with the following q (scattering vector) and
(rotation angle around the x-ray beam axis) ranges:
Q = [710-3
; 0.14] with 510-4
steps. = [-120; +220]
3.3.3. Modeling of Structure–property Relationship
3.3.3.1. Hansen Solubility Parameter Calculation
The permeation mechanism of water vapor and chemical simulants was first investigated by
comparison of water/DMMP permeability to those of single-gas molecules. The single-gas
16
DISTRIBUTION A. Approved for public release; distribution unlimited.
88ABW-2013-3230; 15 July 2013
permeability was obtained using the apparatus described in Figure 6. The sorption component (S)
in permeability (P = D × S, where D is the diffusion coefficient) is associated to the Hansen
solubility parameter.11
A group-contribution-based sorption model was developed that calculates the Hansen solubility
parameter (HSP) from the chemical composition of the BCPs. Empirical parameters from a
literature database11
were used in this model. Parameters from experiments and molecular
simulation were calculated to set up a database valid for PMMA-based BCPs.
m
vap
m
coh2
tV
RTH
V
E (13)
2
h
2
p
2
d
2
t (14)
Water
h
BCP
h
Water
p
BCP
p
Water
d
BCP
dWaterBCP, 444 (15)
DMMP
h
BCP
h
DMMP
p
BCP
p
DMMP
d
BCP
dDMMPBCP, 444 (16)
where Ecoh is the cohesive energy density of the BCP, ΔHvap is the heat of evaporation of the
BCP, Vm is the molecular volume of the BCP chain, δt is the total HSP, and δt, δp, and δh are the
dispersion, polar, and hydrogen bonding components of the total HSP, respectively. Solubility of
water and DMMP can be predicted by Eq. (15) and Eq. (16), respectively. The higher the values
from Eqs (15) and (16), the higher the solubility of water or DMMP is in this BCP. Selectivity of
water/DMMP is the ratio of Eqs (15) and (16).
3.3.3.2. Molecular Dynamic Simulation
Molecular dynamics and grand canonical Monte Carlo (GCMC) simulation were used to predict
solubility based on sorption isotherms for single-gas molecules. The solubility, therefore, was
used to validate the model and establish the database. The COMPASS force field (Condensed-
phase Optimized Molecular Potentials for Atomistic Simulation Studies) 12
was used for all
simulations. The simulation results were used to understand the water and DMMP permeation
mechanism and to calculate energy parameters for the database to use in HSP calculations (for
specific groups for which energies terms were unavailable in literature).
First, chains of BCPs with 200 repeat units were prepared using an initial cis–trans
conformation. The COMPASS force field and the charge group method for electrostatic
interactions were used. The polymer chain was minimized for 1000 steps and used to construct a
periodic amorphous cell using the explicit image convention. Based on a conventional rotational
isomeric state (RIS) model, a stepwise chain construction scheme using the torsion potential
obtained from COMPASS generated the initial structure. A 100-step minimization process was
used to refine the resulting cells and eliminate any bad contacts (overlapping or close contacts of
atoms). This process was followed by an annealing procedure during which the periodic cell was
heated from 300 to 600 K at intervals of 50 K and then cooled back to 298 K. At each step of the
cycle, the cells were subjected to 50 ps (ps = picoseconds) of NPT (fixed values of number of
atoms, pressure and temperature) dynamics. Next, a 50-ps interval of dynamics at fixed values of
17
DISTRIBUTION A. Approved for public release; distribution unlimited.
88ABW-2013-3230; 15 July 2013
number of atoms, volume and temperature was used to further relax the polymer structure with
the cell density fixed at the average value obtained from the 50-ps NPT dynamics calculation.
This sequence was followed by an additional 150 ps of NPT dynamics. The first 50 ps of
dynamics were discarded and the remaining 100 ps were saved as a history file. The polymer cell
was used for GCMC simulation of solubility at 298 K. Single-gas (He, N2, CH4, CO2, and i-C4H10,
H2O and DMMP vapor) concentrations were determined at pressure increments of 1 kPa over a
range from 0 to 12 kPa. A total of 200,000 steps were used for each gas sorption measurement.
3.3.3.3. Diffusion Correction Based on Domain Size
The domain size affects the diffusivity coefficients of both water and chemical simulants, and
therefore the permeability and selectivity. In BCP–K1 blend systems, the difference between
hydrophilic and hydrophobic domain sizes determined the diffusion components of the
selectivity parameter. In general, the effect of domain size on diffusivity is determined by
n
R
R
D
D
p
s
0
m 1 (17)
where Dm and D0 are the diffusivity before and after correction by porous size, Rs is the diameter
of permeate, and Rp is the diameter of domain size, n is an empirical parameter that is often given
the value 4.0.
18
DISTRIBUTION A. Approved for public release; distribution unlimited.
88ABW-2013-3230; 15 July 2013
4. BENCHMARK CURRENT TECHNOLOGIES AND EXISTING MATERIALS
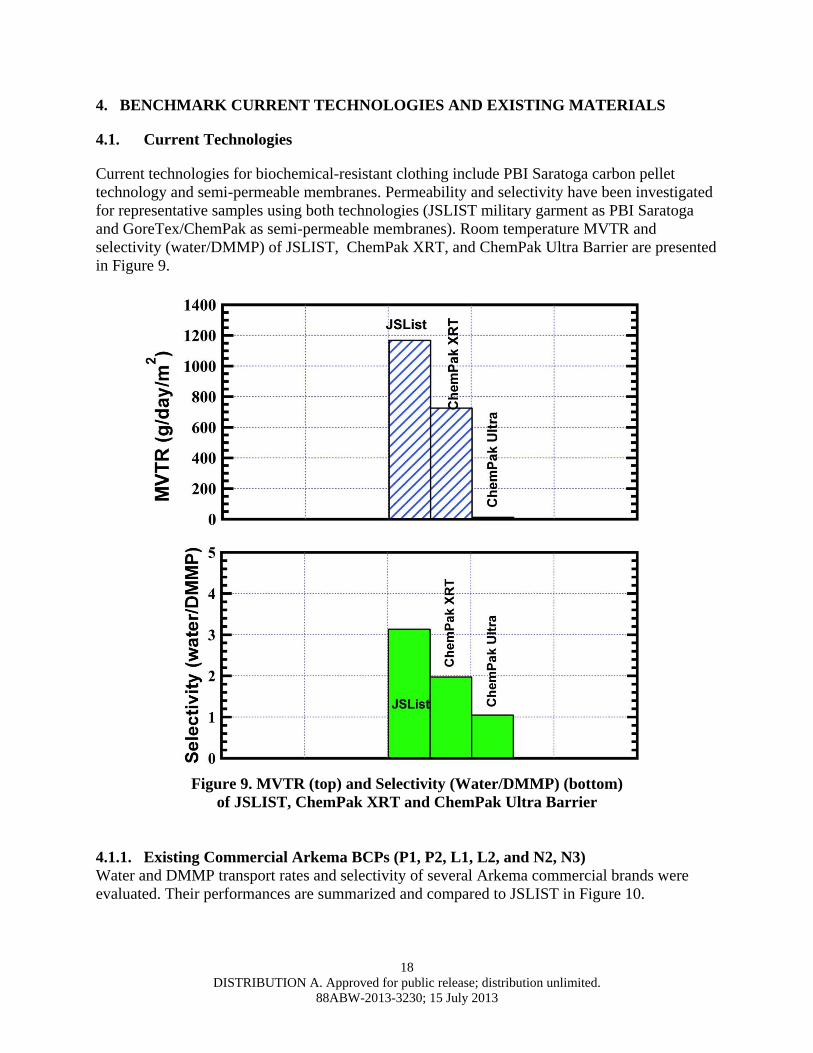
4.1. Current Technologies
Current technologies for biochemical-resistant clothing include PBI Saratoga carbon pellet
technology and semi-permeable membranes. Permeability and selectivity have been investigated
for representative samples using both technologies (JSLIST military garment as PBI Saratoga
and GoreTex/ChemPak as semi-permeable membranes). Room temperature MVTR and
selectivity (water/DMMP) of JSLIST, ChemPak XRT, and ChemPak Ultra Barrier are presented
in Figure 9.
Figure 9. MVTR (top) and Selectivity (Water/DMMP) (bottom)
of JSLIST, ChemPak XRT and ChemPak Ultra Barrier
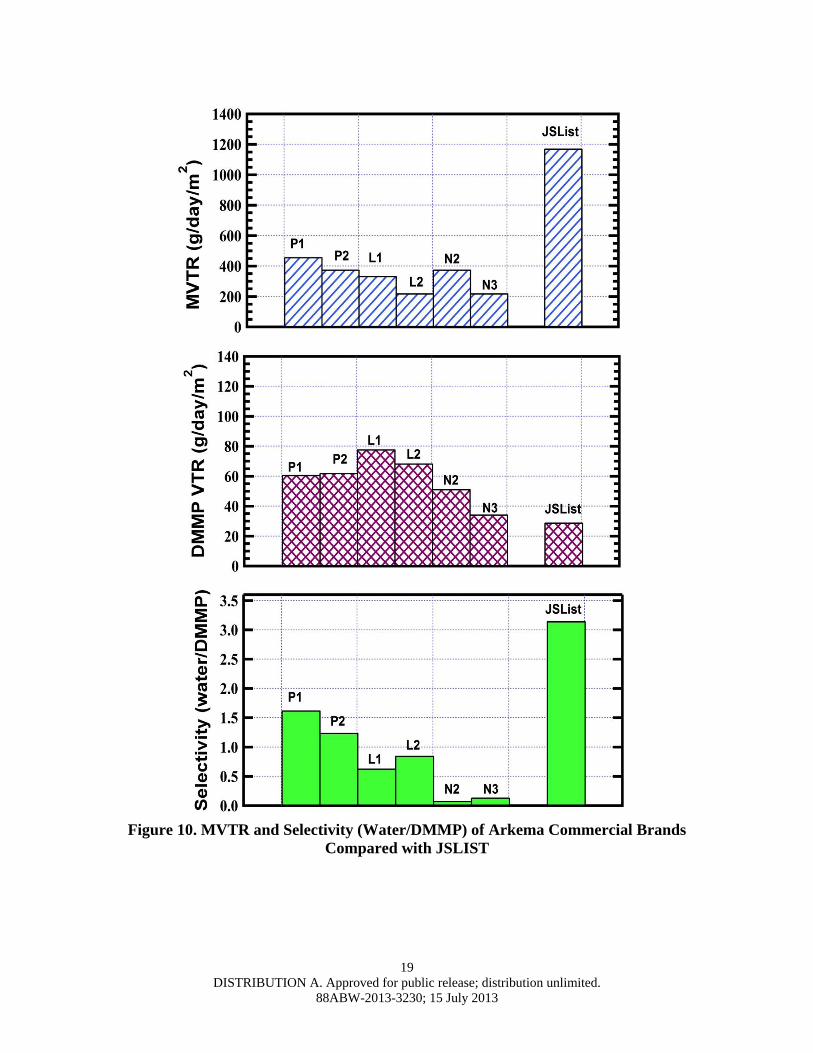
4.1.1. Existing Commercial Arkema BCPs (P1, P2, L1, L2, and N2, N3)
Water and DMMP transport rates and selectivity of several Arkema commercial brands were
evaluated. Their performances are summarized and compared to JSLIST in Figure 10.
19
DISTRIBUTION A. Approved for public release; distribution unlimited.
88ABW-2013-3230; 15 July 2013
Figure 10. MVTR and Selectivity (Water/DMMP) of Arkema Commercial Brands
Compared with JSLIST
20
DISTRIBUTION A. Approved for public release; distribution unlimited.
88ABW-2013-3230; 15 July 2013
5. BLOCK COPOLYMER SYNTHESIS AND CHARACTERIZATION
5.1. Block Copolymer Synthesis
5.1.1. Route 1: P(A-co-monomer)-b-P(W1)
For this route, the first block was a P(A-co-B)-based copolymer in which A and B were
randomly copolymerized. It is important to note that a high level of livingness of the first block
was desired to permit restarting the polymerization to obtain the second block. This concept was
a strong driver for all improvements to polymerization conditions thereafter.
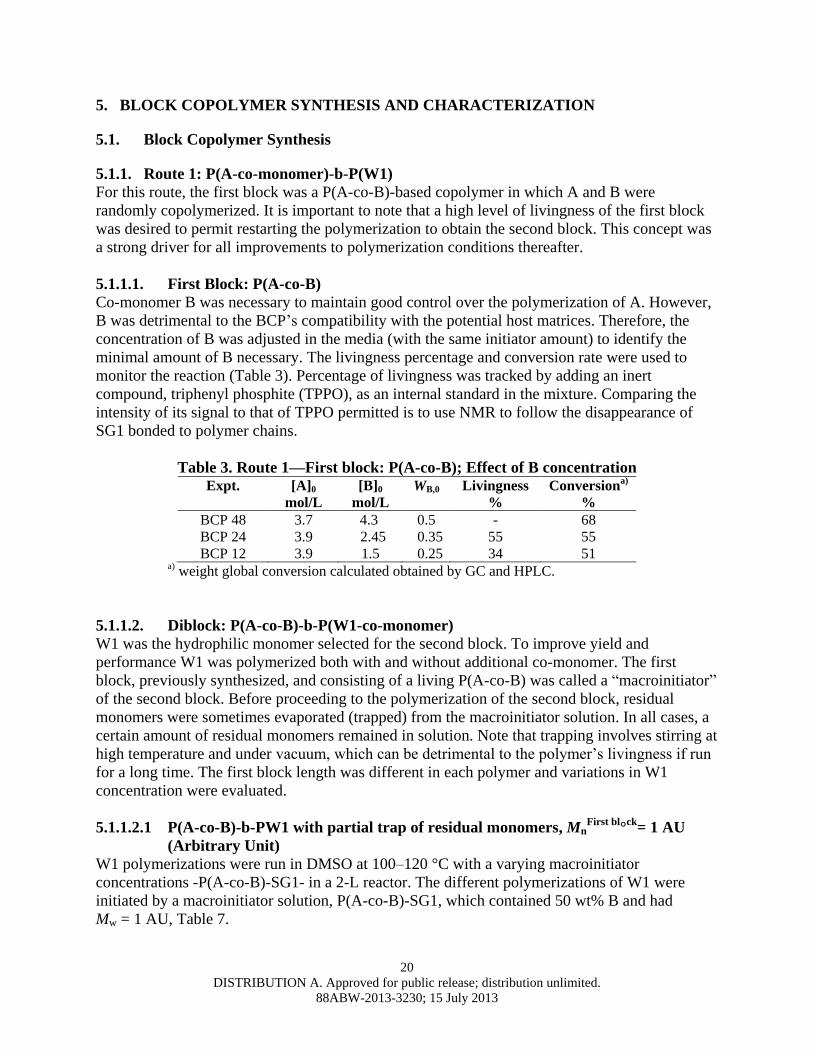
5.1.1.1. First Block: P(A-co-B)
Co-monomer B was necessary to maintain good control over the polymerization of A. However,
B was detrimental to the BCP’s compatibility with the potential host matrices. Therefore, the
concentration of B was adjusted in the media (with the same initiator amount) to identify the
minimal amount of B necessary. The livingness percentage and conversion rate were used to
monitor the reaction (Table 3). Percentage of livingness was tracked by adding an inert
compound, triphenyl phosphite (TPPO), as an internal standard in the mixture. Comparing the
intensity of its signal to that of TPPO permitted is to use NMR to follow the disappearance of
SG1 bonded to polymer chains.
Table 3. Route 1—First block: P(A-co-B); Effect of B concentration Expt. [A]0
mol/L
[B]0
mol/L
WB,0 Livingness
%
Conversiona)
%
BCP 48 3.7 4.3 0.5 - 68
BCP 24 3.9 2.45 0.35 55 55
BCP 12 3.9 1.5 0.25 34 51 a) weight global conversion calculated obtained by GC and HPLC.
5.1.1.2. Diblock: P(A-co-B)-b-P(W1-co-monomer)
W1 was the hydrophilic monomer selected for the second block. To improve yield and
performance W1 was polymerized both with and without additional co-monomer. The first
block, previously synthesized, and consisting of a living P(A-co-B) was called a “macroinitiator”
of the second block. Before proceeding to the polymerization of the second block, residual
monomers were sometimes evaporated (trapped) from the macroinitiator solution. In all cases, a
certain amount of residual monomers remained in solution. Note that trapping involves stirring at
high temperature and under vacuum, which can be detrimental to the polymer’s livingness if run
for a long time. The first block length was different in each polymer and variations in W1
concentration were evaluated.
5.1.1.2.1 P(A-co-B)-b-PW1 with partial trap of residual monomers, MnFirst bl
°ck
= 1 AU
(Arbitrary Unit)
W1 polymerizations were run in DMSO at 100–120 °C with a varying macroinitiator
concentrations -P(A-co-B)-SG1- in a 2-L reactor. The different polymerizations of W1 were
initiated by a macroinitiator solution, P(A-co-B)-SG1, which contained 50 wt% B and had
Mw = 1 AU, Table 7.
21
DISTRIBUTION A. Approved for public release; distribution unlimited.
88ABW-2013-3230; 15 July 2013
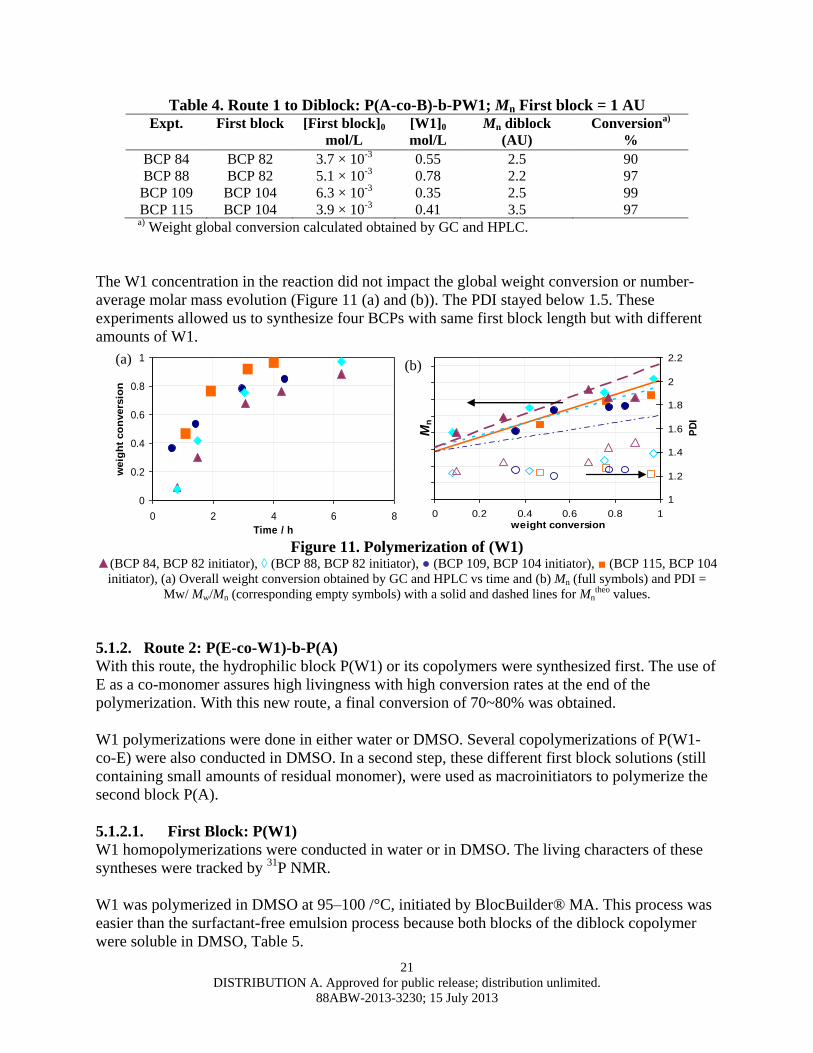
Table 4. Route 1 to Diblock: P(A-co-B)-b-PW1; Mn First block = 1 AU Expt. First block
[First block]0 mol/L
[W1]0 mol/L
Mn diblock
(AU) Conversion
a) %
BCP 84 BCP 82 3.7 × 10⁻³ 0.55 2.5 90
BCP 88 BCP 82 5.1 × 10⁻³ 0.78 2.2 97
BCP 109 BCP 104 6.3 × 10⁻³ 0.35 2.5 99
BCP 115 BCP 104 3.9 × 10⁻³ 0.41 3.5 97 a) Weight global conversion calculated obtained by GC and HPLC.
The W1 concentration in the reaction did not impact the global weight conversion or number-
average molar mass evolution (Figure 11 (a) and (b)). The PDI stayed below 1.5. These
experiments allowed us to synthesize four BCPs with same first block length but with different
amounts of W1.
0
0.2
0.4
0.6
0.8
1
0 2 4 6 8
Time / h
weig
ht
co
nvers
ion
0
10000
20000
30000
40000
50000
60000
70000
80000
0 0.2 0.4 0.6 0.8 1weight conversion
Mn
g/m
ol
1
1.2
1.4
1.6
1.8
2
2.2
PD
I
Figure 11. Polymerization of (W1)
▲(BCP 84, BCP 82 initiator), ◊ (BCP 88, BCP 82 initiator), ● (BCP 109, BCP 104 initiator), ■ (BCP 115, BCP 104
initiator), (a) Overall weight conversion obtained by GC and HPLC vs time and (b) Mn (full symbols) and PDI =
Mw/ Mw/Mn (corresponding empty symbols) with a solid and dashed lines for Mntheo values.
5.1.2. Route 2: P(E-co-W1)-b-P(A)
With this route, the hydrophilic block P(W1) or its copolymers were synthesized first. The use of
E as a co-monomer assures high livingness with high conversion rates at the end of the
polymerization. With this new route, a final conversion of 70~80% was obtained.
W1 polymerizations were done in either water or DMSO. Several copolymerizations of P(W1-
co-E) were also conducted in DMSO. In a second step, these different first block solutions (still
containing small amounts of residual monomer), were used as macroinitiators to polymerize the
second block P(A).
5.1.2.1. First Block: P(W1)
W1 homopolymerizations were conducted in water or in DMSO. The living characters of these
syntheses were tracked by 31
P NMR.
W1 was polymerized in DMSO at 95–100 /°C, initiated by BlocBuilder® MA. This process was
easier than the surfactant-free emulsion process because both blocks of the diblock copolymer
were soluble in DMSO, Table 5.
(a) (b)
Mn
22
DISTRIBUTION A. Approved for public release; distribution unlimited.
88ABW-2013-3230; 15 July 2013
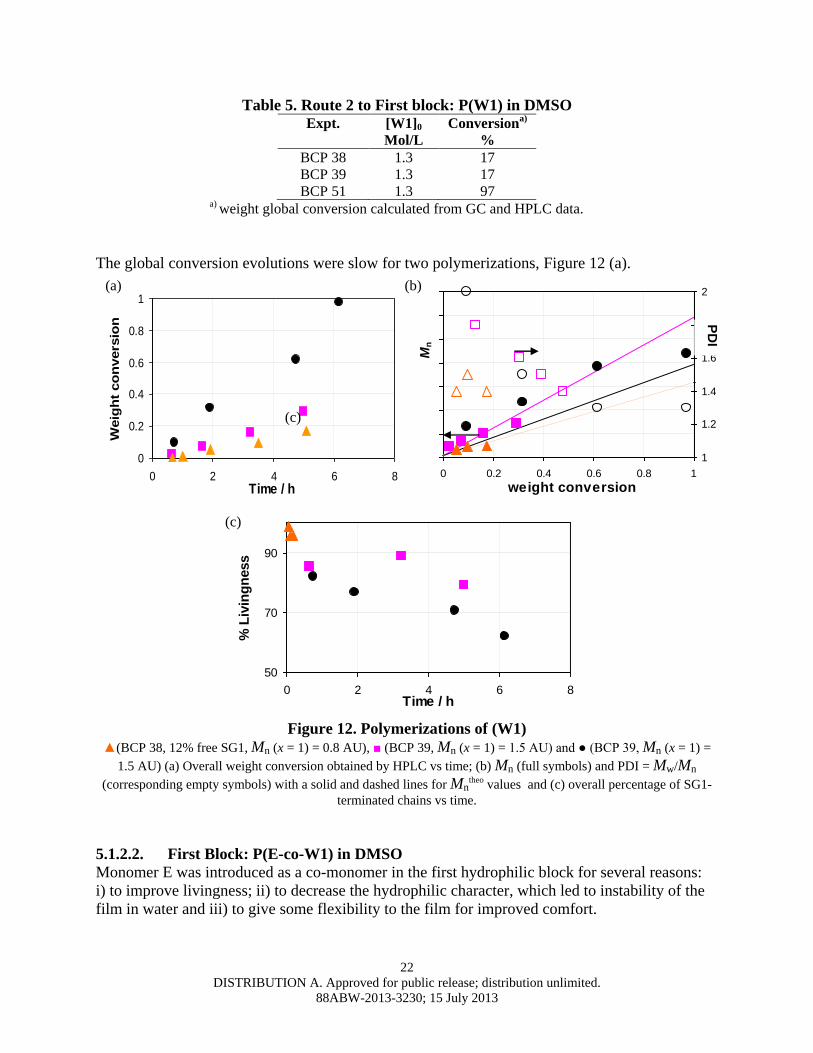
Table 5. Route 2 to First block: P(W1) in DMSO Expt. [W1]0
Mol/L
Conversiona)
%
BCP 38 1.3 17
BCP 39 1.3 17
BCP 51 1.3 97 a) weight global conversion calculated from GC and HPLC data.
The global conversion evolutions were slow for two polymerizations, Figure 12 (a).
0
0.2
0.4
0.6
0.8
1
0 2 4 6 8Time / h
Weig
ht
co
nvers
ion
0
5000
10000
15000
20000
25000
30000
35000
0 0.2 0.4 0.6 0.8 1
weight conversion
Mn
g/m
ol
1
1.2
1.4
1.6
1.8
2
DP
I
50
70
90
0 2 4 6 8Time / h
% L
ivin
gn
ess
Figure 12. Polymerizations of (W1)
▲(BCP 38, 12% free SG1, Mn (x = 1) = 0.8 AU), ■ (BCP 39, Mn (x = 1) = 1.5 AU) and ● (BCP 39, Mn (x = 1) =
1.5 AU) (a) Overall weight conversion obtained by HPLC vs time; (b) Mn (full symbols) and PDI = Mw/Mn
(corresponding empty symbols) with a solid and dashed lines for Mntheo values and (c) overall percentage of SG1-
terminated chains vs time.
5.1.2.2. First Block: P(E-co-W1) in DMSO
Monomer E was introduced as a co-monomer in the first hydrophilic block for several reasons:
i) to improve livingness; ii) to decrease the hydrophilic character, which led to instability of the
film in water and iii) to give some flexibility to the film for improved comfort.
(a)
(c)
PD
I
(b)
Mn
(c)
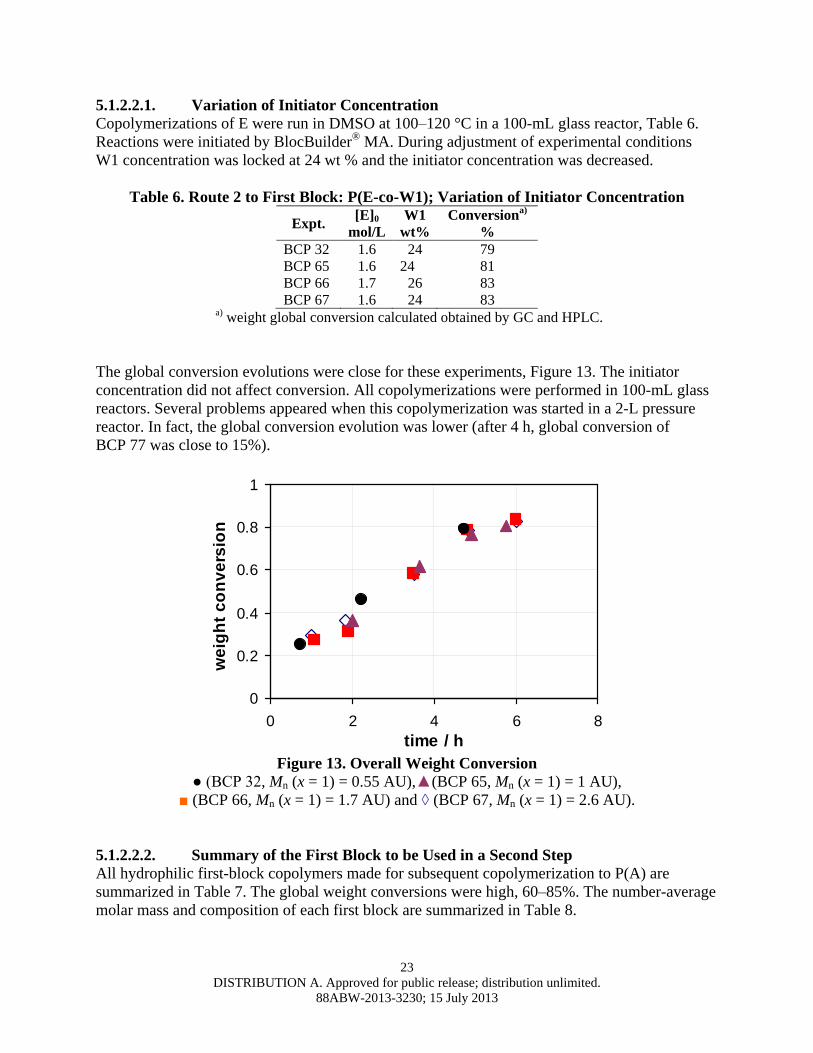
23
DISTRIBUTION A. Approved for public release; distribution unlimited.
88ABW-2013-3230; 15 July 2013
5.1.2.2.1. Variation of Initiator Concentration
Copolymerizations of E were run in DMSO at 100–120 °C in a 100-mL glass reactor, Table 6.
Reactions were initiated by BlocBuilder®
MA. During adjustment of experimental conditions
W1 concentration was locked at 24 wt % and the initiator concentration was decreased.
Table 6. Route 2 to First Block: P(E-co-W1); Variation of Initiator Concentration
Expt. [E]0
mol/L W1
wt% Conversion
a) %
BCP 32 1.6 24 79
BCP 65 1.6 24 81
BCP 66 1.7 26 83
BCP 67 1.6 24 83 a) weight global conversion calculated obtained by GC and HPLC.
The global conversion evolutions were close for these experiments, Figure 13. The initiator
concentration did not affect conversion. All copolymerizations were performed in 100-mL glass
reactors. Several problems appeared when this copolymerization was started in a 2-L pressure
reactor. In fact, the global conversion evolution was lower (after 4 h, global conversion of
BCP 77 was close to 15%).
0
0.2
0.4
0.6
0.8
1
0 2 4 6 8
time / h
we
igh
t c
on
ve
rsio
n
Figure 13. Overall Weight Conversion
● (BCP 32, Mn (x = 1) = 0.55 AU),▲(BCP 65, Mn (x = 1) = 1 AU),
■ (BCP 66, Mn (x = 1) = 1.7 AU) and ◊ (BCP 67, Mn (x = 1) = 2.6 AU).
5.1.2.2.2. Summary of the First Block to be Used in a Second Step
All hydrophilic first-block copolymers made for subsequent copolymerization to P(A) are
summarized in Table 7. The global weight conversions were high, 60–85%. The number-average
molar mass and composition of each first block are summarized in Table 8.
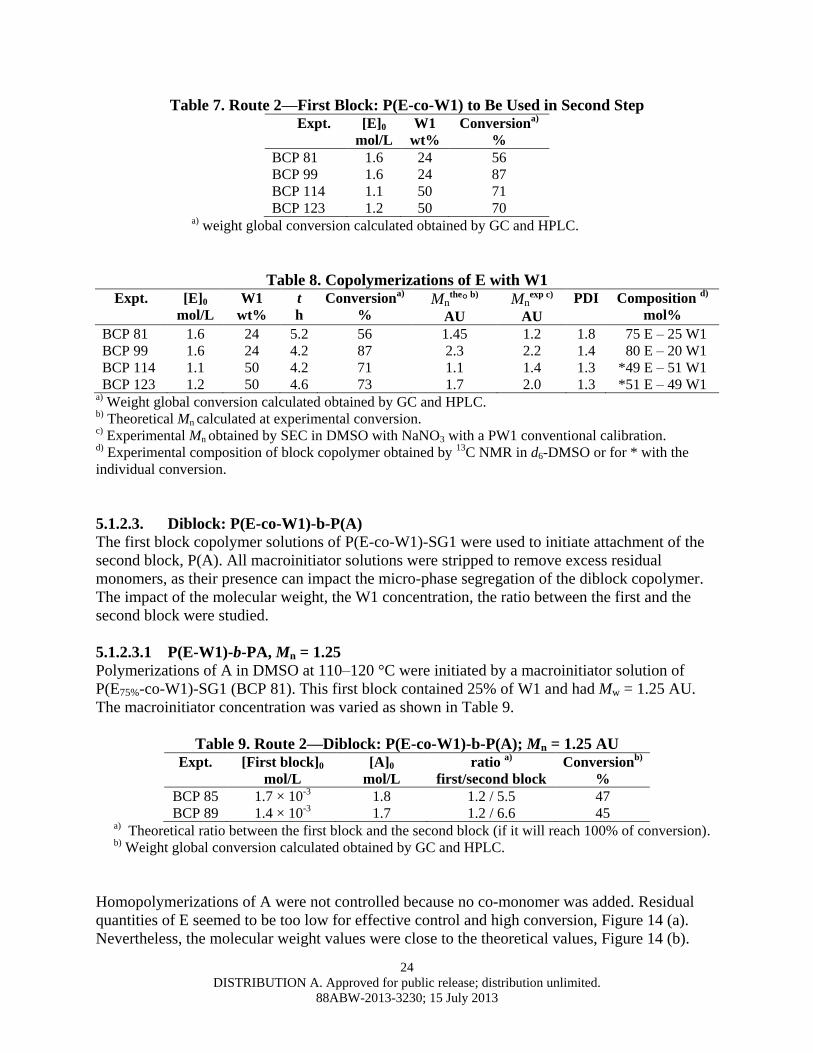
24
DISTRIBUTION A. Approved for public release; distribution unlimited.
88ABW-2013-3230; 15 July 2013
Table 7. Route 2—First Block: P(E-co-W1) to Be Used in Second Step Expt. [E]0
mol/L W1
wt% Conversion
a) %
BCP 81 1.6 24 56 BCP 99 1.6 24 87 BCP 114 1.1 50 71 BCP 123 1.2 50 70
a) weight global conversion calculated obtained by GC and HPLC.
Table 8. Copolymerizations of E with W1 Expt. [E]0
mol/L W1
wt% t h
Conversiona)
% Mn
the°
b)
AU Mn
exp c)
AU
PDI Composition d)
mol%
BCP 81 1.6 24 5.2 56 1.45 1.2 1.8 75 E – 25 W1 BCP 99 1.6 24 4.2 87 2.3 2.2 1.4 80 E – 20 W1 BCP 114 1.1 50 4.2 71 1.1 1.4 1.3 *49 E – 51 W1 BCP 123 1.2 50 4.6 73 1.7 2.0 1.3 *51 E – 49 W1
a) Weight global conversion calculated obtained by GC and HPLC. b) Theoretical Mn calculated at experimental conversion. c) Experimental Mn obtained by SEC in DMSO with NaNO3 with a PW1 conventional calibration. d) Experimental composition of block copolymer obtained by 13C NMR in d6-DMSO or for * with the
individual conversion.
5.1.2.3. Diblock: P(E-co-W1)-b-P(A)
The first block copolymer solutions of P(E-co-W1)-SG1 were used to initiate attachment of the
second block, P(A). All macroinitiator solutions were stripped to remove excess residual
monomers, as their presence can impact the micro-phase segregation of the diblock copolymer.
The impact of the molecular weight, the W1 concentration, the ratio between the first and the
second block were studied.
5.1.2.3.1 P(E-W1)-b-PA, Mn = 1.25
Polymerizations of A in DMSO at 110–120 °C were initiated by a macroinitiator solution of
P(E75%-co-W1)-SG1 (BCP 81). This first block contained 25% of W1 and had Mw = 1.25 AU.
The macroinitiator concentration was varied as shown in Table 9.
Table 9. Route 2—Diblock: P(E-co-W1)-b-P(A); Mn = 1.25 AU Expt. [First block]0
mol/L [A]0
mol/L ratio
a)
first/second block Conversion
b) %
BCP 85 1.7 × 10⁻³ 1.8 1.2 / 5.5 47
BCP 89 1.4 × 10⁻³ 1.7 1.2 / 6.6 45 a) Theoretical ratio between the first block and the second block (if it will reach 100% of conversion). b) Weight global conversion calculated obtained by GC and HPLC.
Homopolymerizations of A were not controlled because no co-monomer was added. Residual
quantities of E seemed to be too low for effective control and high conversion, Figure 14 (a).
Nevertheless, the molecular weight values were close to the theoretical values, Figure 14 (b).
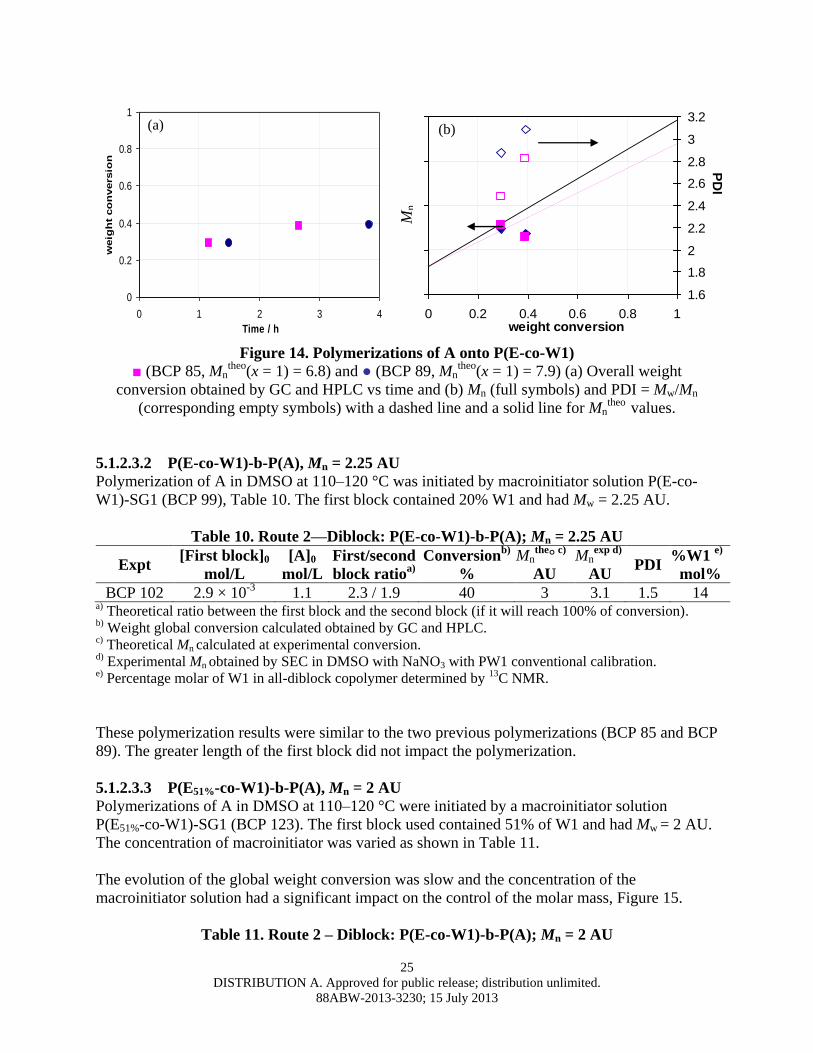
25
DISTRIBUTION A. Approved for public release; distribution unlimited.
88ABW-2013-3230; 15 July 2013
PD
I
0
0.2
0.4
0.6
0.8
1
0 1 2 3 4
Time / h
weig
ht
co
nversio
n
0
40000
80000
120000
160000
0 0.2 0.4 0.6 0.8 1weight conversion
Mn
g/m
ol
1.6
1.8
2
2.2
2.4
2.6
2.8
3
3.2
DP
I
Figure 14. Polymerizations of A onto P(E-co-W1)
■ (BCP 85, Mntheo
(x = 1) = 6.8) and ● (BCP 89, Mntheo
(x = 1) = 7.9) (a) Overall weight
conversion obtained by GC and HPLC vs time and (b) Mn (full symbols) and PDI = Mw/Mn
(corresponding empty symbols) with a dashed line and a solid line for Mntheo
values.
5.1.2.3.2 P(E-co-W1)-b-P(A), Mn = 2.25 AU
Polymerization of A in DMSO at 110–120 °C was initiated by macroinitiator solution P(E-co-
W1)-SG1 (BCP 99), Table 10. The first block contained 20% W1 and had Mw = 2.25 AU.
Table 10. Route 2—Diblock: P(E-co-W1)-b-P(A); Mn = 2.25 AU
Expt [First block]0
mol/L
[A]0
mol/L
First/second
block ratioa)
Conversionb)
%
Mnthe
° c)
AU
Mnexp d)
AU PDI
%W1 e)
mol%
BCP 102 2.9 × 10⁻³
1.1 2.3 / 1.9 40 3 3.1 1.5 14 a) Theoretical ratio between the first block and the second block (if it will reach 100% of conversion). b) Weight global conversion calculated obtained by GC and HPLC. c) Theoretical Mn calculated at experimental conversion. d) Experimental Mn obtained by SEC in DMSO with NaNO3 with PW1 conventional calibration. e) Percentage molar of W1 in all-diblock copolymer determined by 13C NMR.
These polymerization results were similar to the two previous polymerizations (BCP 85 and BCP
89). The greater length of the first block did not impact the polymerization.
5.1.2.3.3 P(E51%-co-W1)-b-P(A), Mn = 2 AU
Polymerizations of A in DMSO at 110–120 °C were initiated by a macroinitiator solution
P(E51%-co-W1)-SG1 (BCP 123). The first block used contained 51% of W1 and had Mw = 2 AU.
The concentration of macroinitiator was varied as shown in Table 11.
The evolution of the global weight conversion was slow and the concentration of the
macroinitiator solution had a significant impact on the control of the molar mass, Figure 15.
Table 11. Route 2 – Diblock: P(E-co-W1)-b-P(A); Mn = 2 AU
(a) (b)
Mn
26
DISTRIBUTION A. Approved for public release; distribution unlimited.
88ABW-2013-3230; 15 July 2013
PD
I Expt. [First block]0
mol/L [A]0
mol/L ratio
a) first/second
block Conversion
b) %
BCP 127 1.0 × 10⁻³ 2.0 2 / 10.3 44 BCP 128 1.7 × 10⁻³ 1.5 2 / 4.5 46 BCP 143 3.1 × 10⁻³ 0.5 2 / 1.2 63
a) Theoretical ratio between the first block and the second block (if it reached 100%
conversion). b) Weight global conversion calculated from GC and HPLC data.
0
0.2
0.4
0.6
0.8
1
0 1 2 3 4 5
Time / h
weig
ht
co
nvers
ion
0
50000
100000
150000
200000
250000
0 0.2 0.4 0.6 0.8 1
weight conversion
Mn
g/m
ol
1
1.1
1.2
1.3
1.4
1.5
1.6
1.7
1.8
1.9
DP
I
Figure 15. Polymerizations of A
■ (BCP 127, Mntheo
(x = 1) = 12.3 AU), ● (BCP 128, Mntheo
(x = 1) = 6.5 AU) and ▲ (BCP 143,
Mnthe
°(x = 1) = 3.3 AU) (a) Overall weight conversion obtained by GC and HPLC vs time and (b)
Mn (full symbols) and PDI = Mw/Mn (corresponding empty symbols) with dashed and solid lines
for Mntheo
values.
5.1.3. Route 3: P(E-co-W2)-b-P(A)
In this route, a new hydrophilic monomer was tested. W2 was chosen because of its established
performance in membranes for water filtration. For these copolymers, the effect of the ratio
between the first and the second block and also the effect of the concentration in W2 was
investigated. Monomer E was used as a co-monomer of W2 in the first block for the same
reasons as in the second route.
5.1.3.1. First Block: P(E-co-W2)
Copolymerizations of E with a certain amount of W2 (20 and 35 wt%) were done in bulk. The
concentration of BlockBuilder®
MA was varied. The temperature in the reactor and the control
of exotherm at the beginning of these reactions had a significant impact on the control of these
copolymerizations.
5.1.3.1.1. Impact of Temperature
The impact of the temperature ramp at the beginning of this reaction was studied. These
copolymerizations were done in bulk at 90–110˚C, Table 12.
(a) (b)
Mn
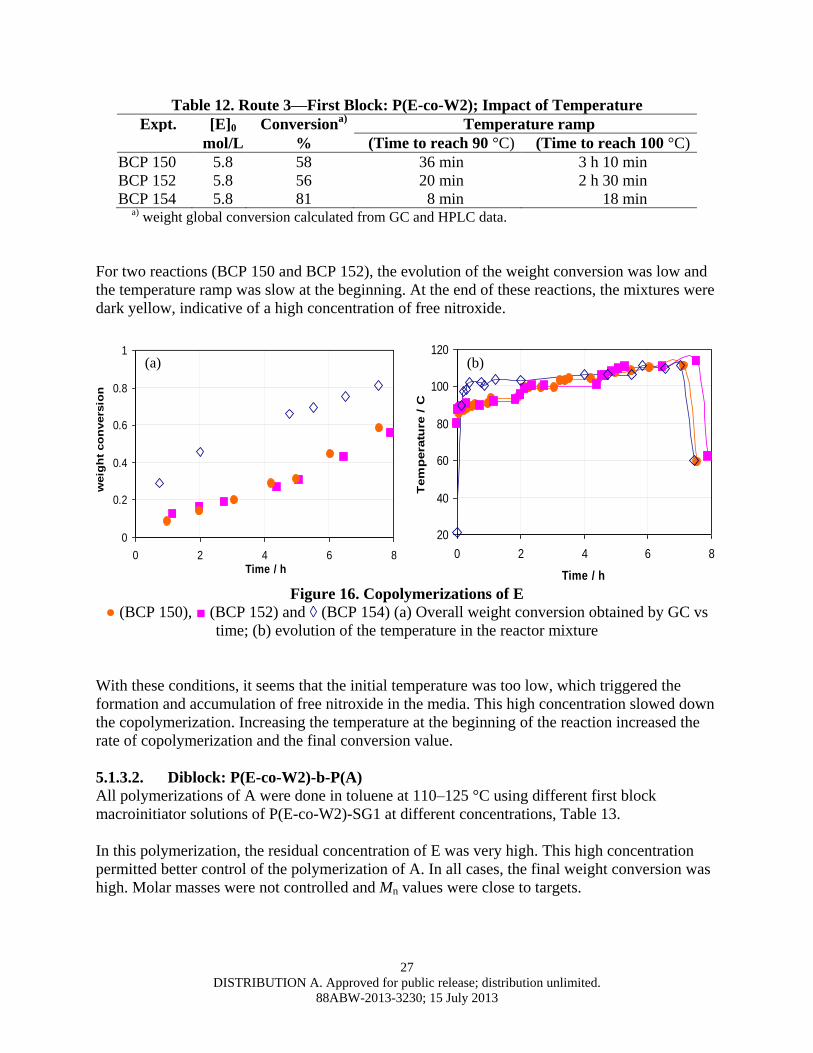
27
DISTRIBUTION A. Approved for public release; distribution unlimited.
88ABW-2013-3230; 15 July 2013
Table 12. Route 3—First Block: P(E-co-W2); Impact of Temperature
Expt. [E]0 Conversiona)
Temperature ramp
mol/L % (Time to reach 90 °C) (Time to reach 100 °C)
BCP 150 5.8 58 36 min 3 h 10 min
BCP 152 5.8 56 20 min 2 h 30 min
BCP 154 5.8 81 8 min 18 min a) weight global conversion calculated from GC and HPLC data.
For two reactions (BCP 150 and BCP 152), the evolution of the weight conversion was low and
the temperature ramp was slow at the beginning. At the end of these reactions, the mixtures were
dark yellow, indicative of a high concentration of free nitroxide.
0
0.2
0.4
0.6
0.8
1
0 2 4 6 8Time / h
weig
ht
co
nvers
ion
20
40
60
80
100
120
0 2 4 6 8
Time / h
Tem
pera
ture
/ C
Figure 16. Copolymerizations of E
● (BCP 150), ■ (BCP 152) and ◊ (BCP 154) (a) Overall weight conversion obtained by GC vs
time; (b) evolution of the temperature in the reactor mixture
With these conditions, it seems that the initial temperature was too low, which triggered the
formation and accumulation of free nitroxide in the media. This high concentration slowed down
the copolymerization. Increasing the temperature at the beginning of the reaction increased the
rate of copolymerization and the final conversion value.
5.1.3.2. Diblock: P(E-co-W2)-b-P(A)
All polymerizations of A were done in toluene at 110–125 °C using different first block
macroinitiator solutions of P(E-co-W2)-SG1 at different concentrations, Table 13.
In this polymerization, the residual concentration of E was very high. This high concentration
permitted better control of the polymerization of A. In all cases, the final weight conversion was
high. Molar masses were not controlled and Mn values were close to targets.
(a) (b)
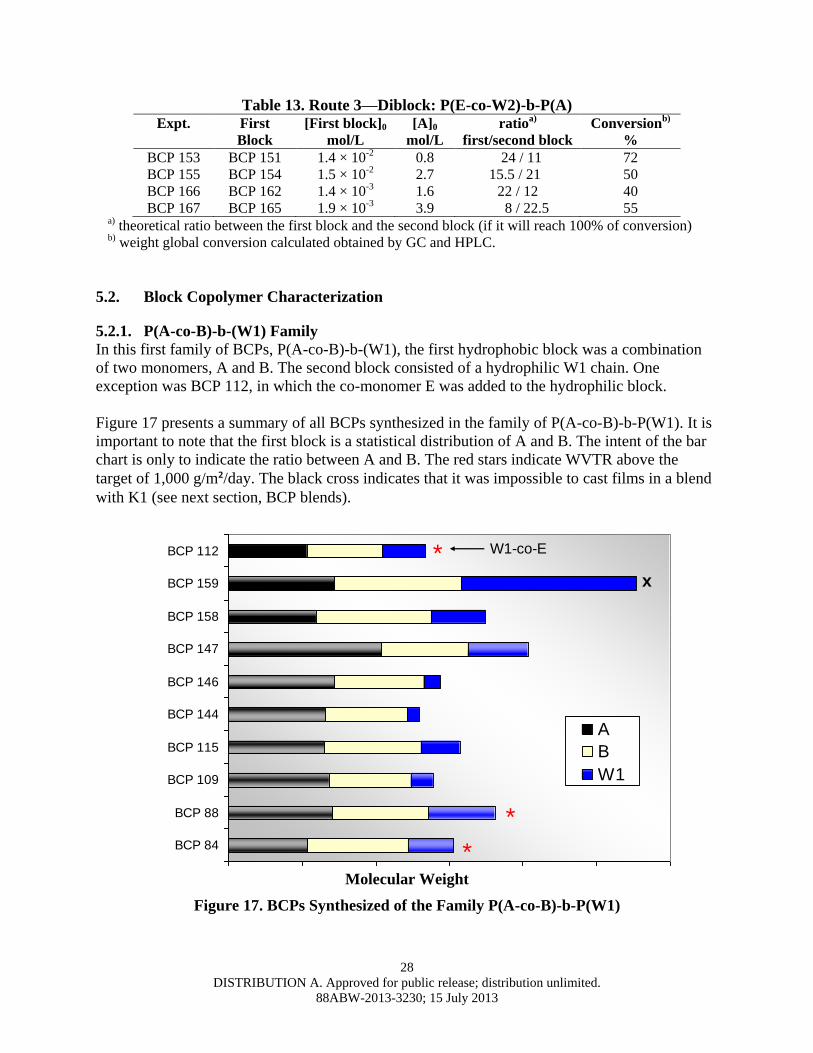
28
DISTRIBUTION A. Approved for public release; distribution unlimited.
88ABW-2013-3230; 15 July 2013
Table 13. Route 3—Diblock: P(E-co-W2)-b-P(A) Expt. First
Block [First block]0
mol/L [A]0
mol/L ratio
a)
first/second block Conversion
b) %
BCP 153 BCP 151 1.4 × 10⁻² 0.8 24 / 11 72 BCP 155 BCP 154 1.5 × 10⁻² 2.7 15.5 / 21 50 BCP 166 BCP 162 1.4 × 10⁻³ 1.6 22 / 12 40 BCP 167 BCP 165 1.9 × 10⁻³ 3.9 8 / 22.5 55
a) theoretical ratio between the first block and the second block (if it will reach 100% of conversion) b) weight global conversion calculated obtained by GC and HPLC.
5.2. Block Copolymer Characterization
5.2.1. P(A-co-B)-b-(W1) Family
In this first family of BCPs, P(A-co-B)-b-(W1), the first hydrophobic block was a combination
of two monomers, A and B. The second block consisted of a hydrophilic W1 chain. One
exception was BCP 112, in which the co-monomer E was added to the hydrophilic block.
Figure 17 presents a summary of all BCPs synthesized in the family of P(A-co-B)-b-P(W1). It is
important to note that the first block is a statistical distribution of A and B. The intent of the bar
chart is only to indicate the ratio between A and B. The red stars indicate WVTR above the
target of 1,000 g/m²/day. The black cross indicates that it was impossible to cast films in a blend
with K1 (see next section, BCP blends).
P(AcoB)-b-PW1
BCP 84
BCP 88
BCP 109
BCP 115
BCP 144
BCP 146
BCP 147
BCP 158
BCP 159
BCP 112
Molecular Weigth
A
B
W1
*
*
*x
W1-co-E
Molecular Weight
Figure 17. BCPs Synthesized of the Family P(A-co-B)-b-P(W1)
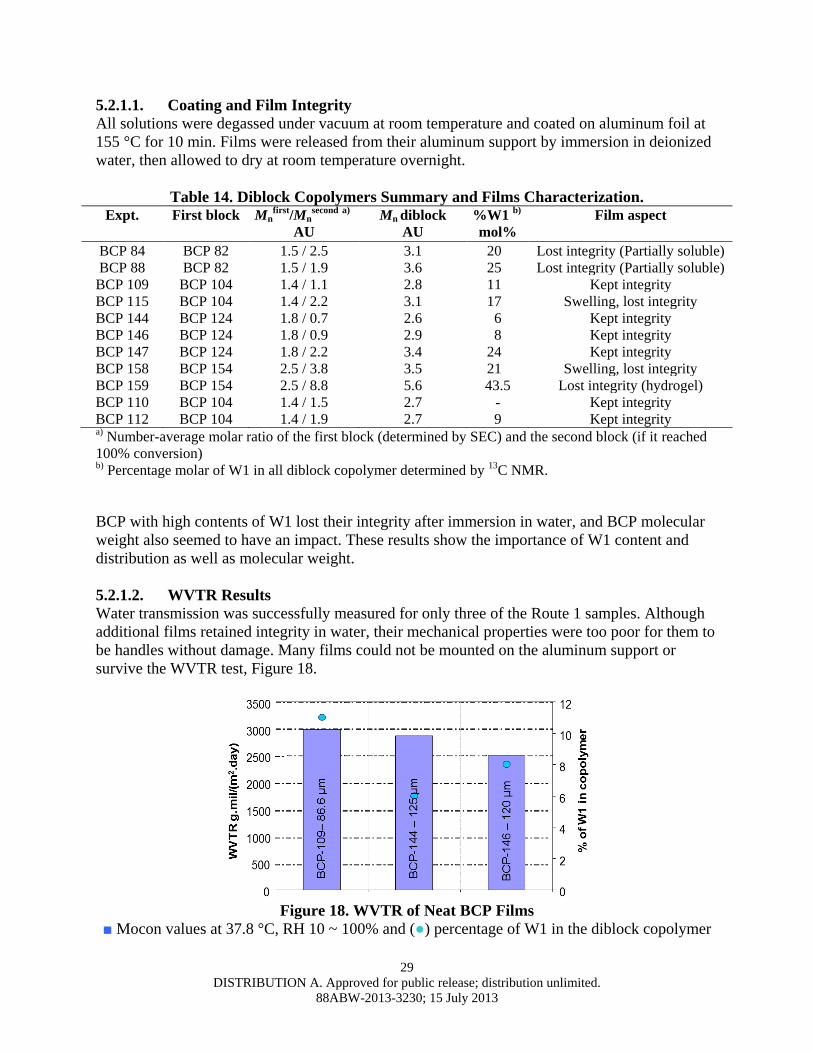
29
DISTRIBUTION A. Approved for public release; distribution unlimited.
88ABW-2013-3230; 15 July 2013
5.2.1.1. Coating and Film Integrity
All solutions were degassed under vacuum at room temperature and coated on aluminum foil at
155 °C for 10 min. Films were released from their aluminum support by immersion in deionized
water, then allowed to dry at room temperature overnight.
Table 14. Diblock Copolymers Summary and Films Characterization. Expt. First block
Mnfirst
/Mnsecond
a)
AU Mn diblock
AU
%W1 b)
mol% Film aspect
BCP 84 BCP 82 1.5 / 2.5 3.1 20 Lost integrity (Partially soluble) BCP 88 BCP 82 1.5 / 1.9 3.6 25 Lost integrity (Partially soluble)
BCP 109 BCP 104 1.4 / 1.1 2.8 11 Kept integrity BCP 115 BCP 104 1.4 / 2.2 3.1 17 Swelling, lost integrity BCP 144 BCP 124 1.8 / 0.7 2.6 6 Kept integrity BCP 146 BCP 124 1.8 / 0.9 2.9 8 Kept integrity BCP 147 BCP 124 1.8 / 2.2 3.4 24 Kept integrity BCP 158 BCP 154 2.5 / 3.8 3.5 21 Swelling, lost integrity BCP 159 BCP 154 2.5 / 8.8 5.6 43.5 Lost integrity (hydrogel) BCP 110 BCP 104 1.4 / 1.5 2.7 - Kept integrity BCP 112 BCP 104 1.4 / 1.9 2.7 9 Kept integrity a) Number-average molar ratio of the first block (determined by SEC) and the second block (if it reached
100% conversion) b) Percentage molar of W1 in all diblock copolymer determined by 13C NMR.
BCP with high contents of W1 lost their integrity after immersion in water, and BCP molecular
weight also seemed to have an impact. These results show the importance of W1 content and
distribution as well as molecular weight.
5.2.1.2. WVTR Results
Water transmission was successfully measured for only three of the Route 1 samples. Although
additional films retained integrity in water, their mechanical properties were too poor for them to
be handles without damage. Many films could not be mounted on the aluminum support or
survive the WVTR test, Figure 18.
Figure 18. WVTR of Neat BCP Films
■ Mocon values at 37.8 °C, RH 10 ~ 100% and (●) percentage of W1 in the diblock copolymer
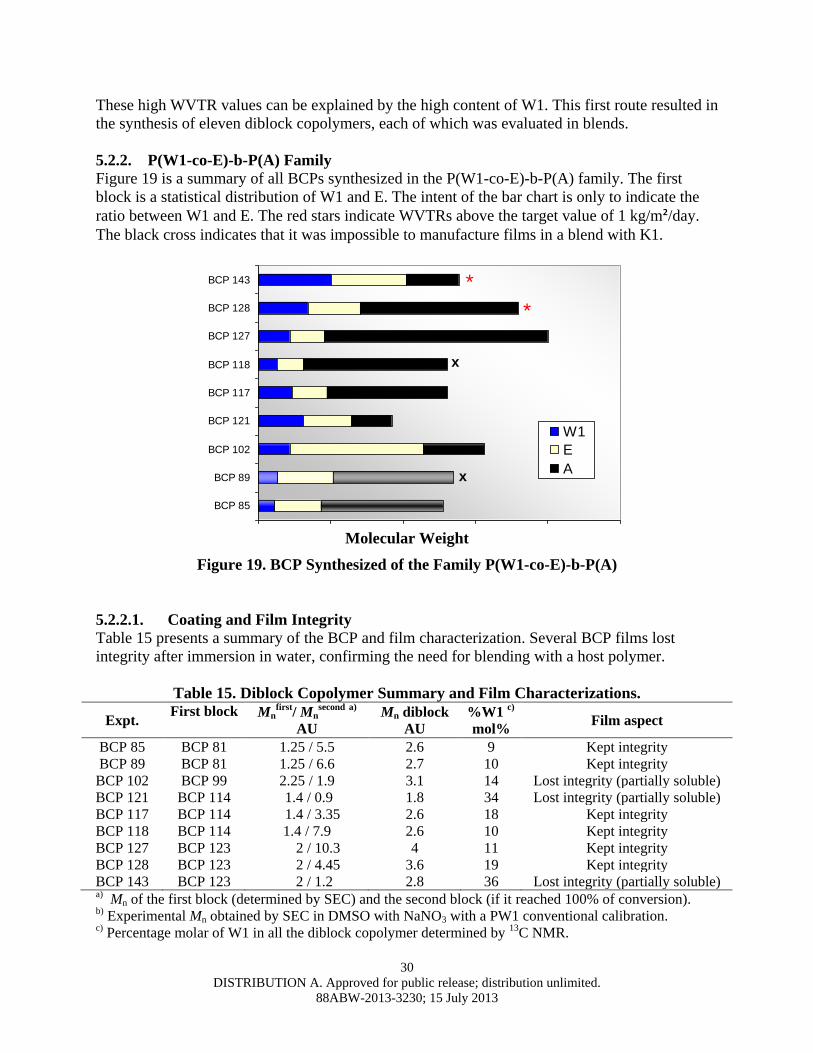
30
DISTRIBUTION A. Approved for public release; distribution unlimited.
88ABW-2013-3230; 15 July 2013
These high WVTR values can be explained by the high content of W1. This first route resulted in
the synthesis of eleven diblock copolymers, each of which was evaluated in blends.
5.2.2. P(W1-co-E)-b-P(A) Family
Figure 19 is a summary of all BCPs synthesized in the P(W1-co-E)-b-P(A) family. The first
block is a statistical distribution of W1 and E. The intent of the bar chart is only to indicate the
ratio between W1 and E. The red stars indicate WVTRs above the target value of 1 kg/m²/day.
The black cross indicates that it was impossible to manufacture films in a blend with K1.
P(W1coE)-b-PA
BCP 85
BCP 89
BCP 102
BCP 121
BCP 117
BCP 118
BCP 127
BCP 128
BCP 143
Molecular Weigth
W1
E
A
*
x
x
*
Molecular Weight
Figure 19. BCP Synthesized of the Family P(W1-co-E)-b-P(A)
5.2.2.1. Coating and Film Integrity
Table 15 presents a summary of the BCP and film characterization. Several BCP films lost
integrity after immersion in water, confirming the need for blending with a host polymer.
Table 15. Diblock Copolymer Summary and Film Characterizations.
Expt. First block
Mn
first/ Mn
second a)
AU Mn diblock
AU
%W1 c)
mol% Film aspect
BCP 85 BCP 81 1.25 / 5.5 2.6 9 Kept integrity BCP 89 BCP 81 1.25 / 6.6 2.7 10 Kept integrity
BCP 102 BCP 99 2.25 / 1.9 3.1 14 Lost integrity (partially soluble) BCP 121 BCP 114 1.4 / 0.9 1.8 34 Lost integrity (partially soluble) BCP 117 BCP 114 1.4 / 3.35 2.6 18 Kept integrity BCP 118 BCP 114 1.4 / 7.9 2.6 10 Kept integrity BCP 127 BCP 123 2 / 10.3 4 11 Kept integrity BCP 128 BCP 123 2 / 4.45 3.6 19 Kept integrity BCP 143 BCP 123 2 / 1.2 2.8 36 Lost integrity (partially soluble) a) Mn of the first block (determined by SEC) and the second block (if it reached 100% of conversion). b) Experimental Mn obtained by SEC in DMSO with NaNO3 with a PW1 conventional calibration. c) Percentage molar of W1 in all the diblock copolymer determined by 13C NMR.
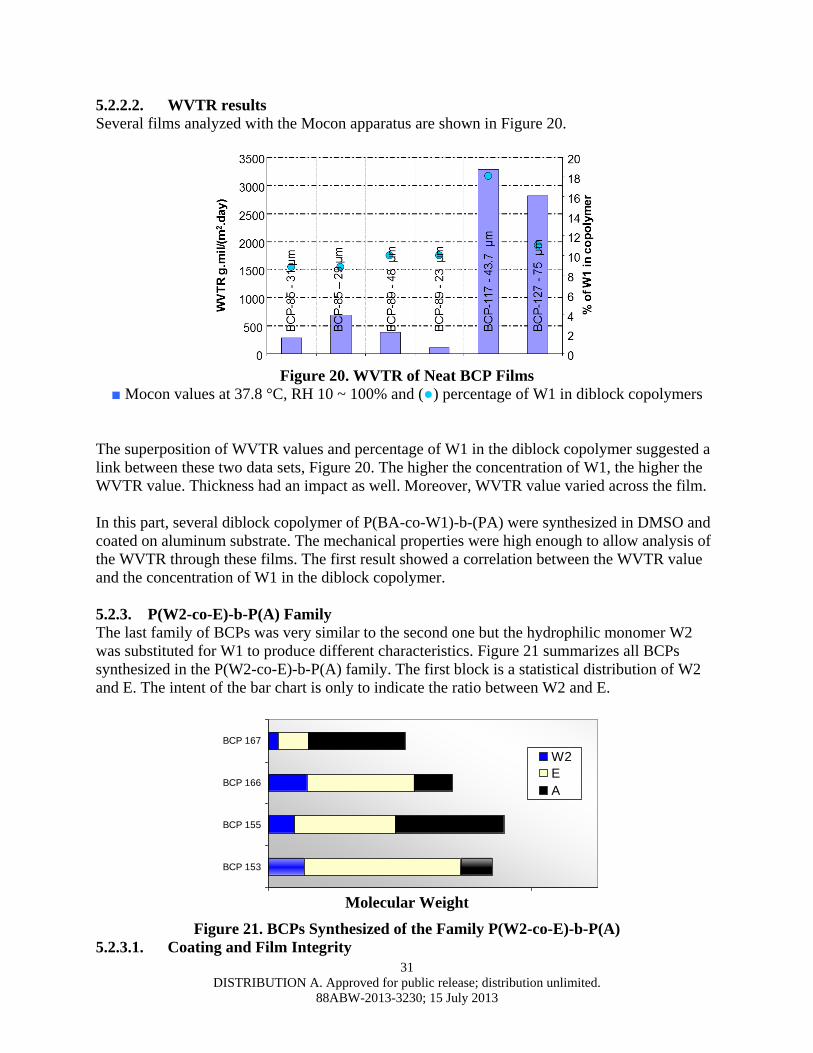
31
DISTRIBUTION A. Approved for public release; distribution unlimited.
88ABW-2013-3230; 15 July 2013
5.2.2.2. WVTR results
Several films analyzed with the Mocon apparatus are shown in Figure 20.
Figure 20. WVTR of Neat BCP Films
■ Mocon values at 37.8 °C, RH 10 ~ 100% and (●) percentage of W1 in diblock copolymers
The superposition of WVTR values and percentage of W1 in the diblock copolymer suggested a
link between these two data sets, Figure 20. The higher the concentration of W1, the higher the
WVTR value. Thickness had an impact as well. Moreover, WVTR value varied across the film.
In this part, several diblock copolymer of P(BA-co-W1)-b-(PA) were synthesized in DMSO and
coated on aluminum substrate. The mechanical properties were high enough to allow analysis of
the WVTR through these films. The first result showed a correlation between the WVTR value
and the concentration of W1 in the diblock copolymer.
5.2.3. P(W2-co-E)-b-P(A) Family
The last family of BCPs was very similar to the second one but the hydrophilic monomer W2
was substituted for W1 to produce different characteristics. Figure 21 summarizes all BCPs
synthesized in the P(W2-co-E)-b-P(A) family. The first block is a statistical distribution of W2
and E. The intent of the bar chart is only to indicate the ratio between W2 and E.
P(W2coE)-b-PA
BCP 153
BCP 155
BCP 166
BCP 167
Molecular Weigth
W2
E
A
Molecular Weight
Figure 21. BCPs Synthesized of the Family P(W2-co-E)-b-P(A)
5.2.3.1. Coating and Film Integrity
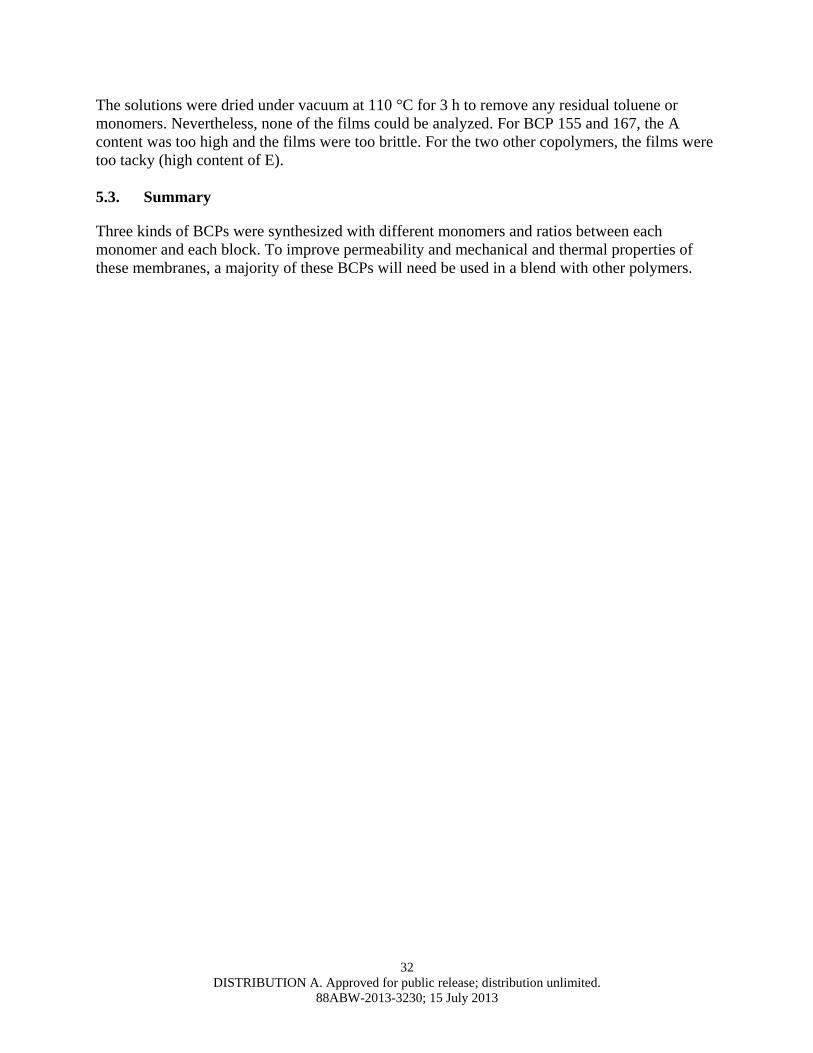
32
DISTRIBUTION A. Approved for public release; distribution unlimited.
88ABW-2013-3230; 15 July 2013
The solutions were dried under vacuum at 110 °C for 3 h to remove any residual toluene or
monomers. Nevertheless, none of the films could be analyzed. For BCP 155 and 167, the A
content was too high and the films were too brittle. For the two other copolymers, the films were
too tacky (high content of E).
5.3. Summary
Three kinds of BCPs were synthesized with different monomers and ratios between each
monomer and each block. To improve permeability and mechanical and thermal properties of
these membranes, a majority of these BCPs will need be used in a blend with other polymers.
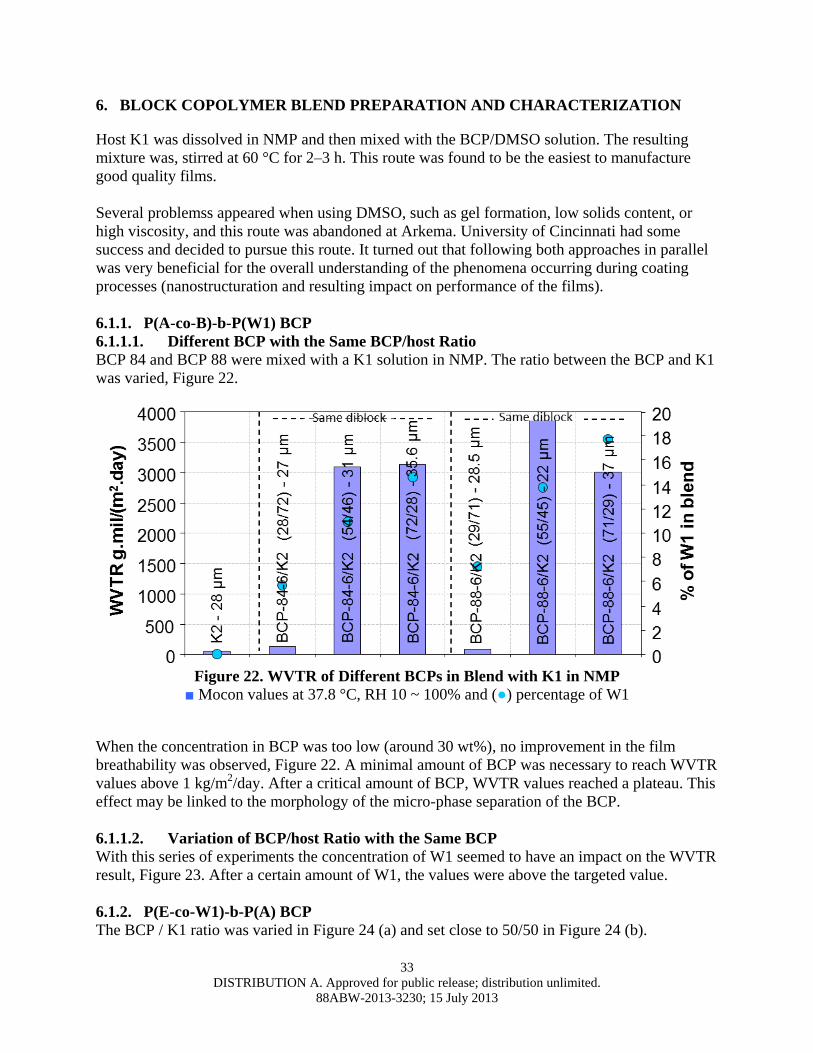
33
DISTRIBUTION A. Approved for public release; distribution unlimited.
88ABW-2013-3230; 15 July 2013
6. BLOCK COPOLYMER BLEND PREPARATION AND CHARACTERIZATION
Host K1 was dissolved in NMP and then mixed with the BCP/DMSO solution. The resulting
mixture was, stirred at 60 °C for 2–3 h. This route was found to be the easiest to manufacture
good quality films.
Several problemss appeared when using DMSO, such as gel formation, low solids content, or
high viscosity, and this route was abandoned at Arkema. University of Cincinnati had some
success and decided to pursue this route. It turned out that following both approaches in parallel
was very beneficial for the overall understanding of the phenomena occurring during coating
processes (nanostructuration and resulting impact on performance of the films).
6.1.1. P(A-co-B)-b-P(W1) BCP
6.1.1.1. Different BCP with the Same BCP/host Ratio
BCP 84 and BCP 88 were mixed with a K1 solution in NMP. The ratio between the BCP and K1
was varied, Figure 22.
Figure 22. WVTR of Different BCPs in Blend with K1 in NMP
■ Mocon values at 37.8 °C, RH 10 ~ 100% and (●) percentage of W1
When the concentration in BCP was too low (around 30 wt%), no improvement in the film
breathability was observed, Figure 22. A minimal amount of BCP was necessary to reach WVTR
values above 1 kg/m2/day. After a critical amount of BCP, WVTR values reached a plateau. This
effect may be linked to the morphology of the micro-phase separation of the BCP.
6.1.1.2. Variation of BCP/host Ratio with the Same BCP
With this series of experiments the concentration of W1 seemed to have an impact on the WVTR
result, Figure 23. After a certain amount of W1, the values were above the targeted value.
6.1.2. P(E-co-W1)-b-P(A) BCP
The BCP / K1 ratio was varied in Figure 24 (a) and set close to 50/50 in Figure 24 (b).
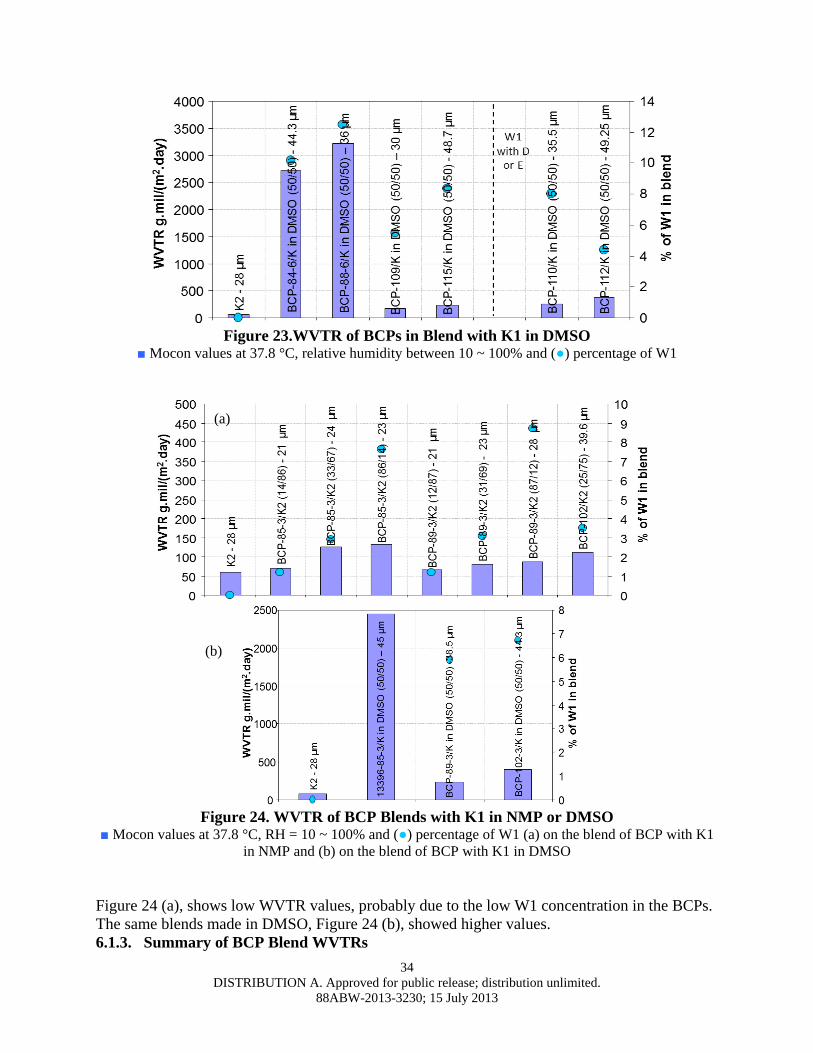
34
DISTRIBUTION A. Approved for public release; distribution unlimited.
88ABW-2013-3230; 15 July 2013
Figure 23.WVTR of BCPs in Blend with K1 in DMSO
■ Mocon values at 37.8 °C, relative humidity between 10 ~ 100% and (●) percentage of W1
Figure 24. WVTR of BCP Blends with K1 in NMP or DMSO
■ Mocon values at 37.8 °C, RH = 10 ~ 100% and (●) percentage of W1 (a) on the blend of BCP with K1
in NMP and (b) on the blend of BCP with K1 in DMSO
Figure 24 (a), shows low WVTR values, probably due to the low W1 concentration in the BCPs.
The same blends made in DMSO, Figure 24 (b), showed higher values.
6.1.3. Summary of BCP Blend WVTRs
(a)
(b)
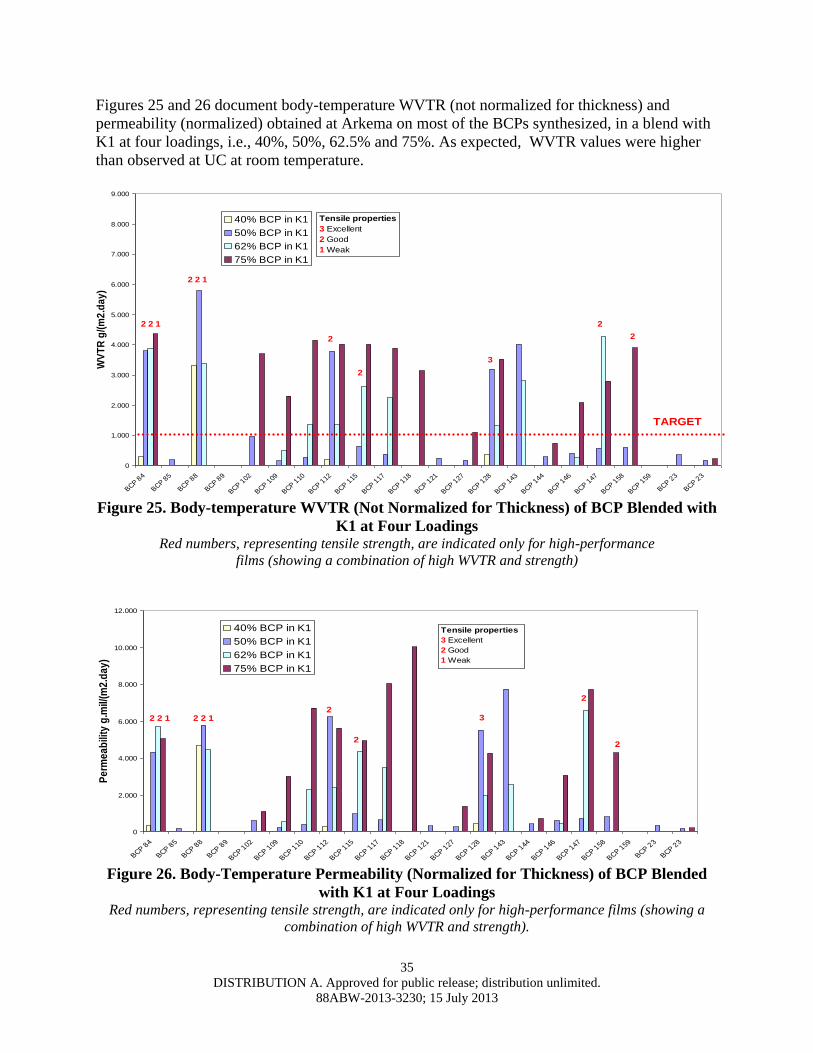
35
DISTRIBUTION A. Approved for public release; distribution unlimited.
88ABW-2013-3230; 15 July 2013
Figures 25 and 26 document body-temperature WVTR (not normalized for thickness) and
permeability (normalized) obtained at Arkema on most of the BCPs synthesized, in a blend with
K1 at four loadings, i.e., 40%, 50%, 62.5% and 75%. As expected, WVTR values were higher
than observed at UC at room temperature.
WVTR at body temperature (not normalized with thickness)
0
1.000
2.000
3.000
4.000
5.000
6.000
7.000
8.000
9.000
BCP 84
BCP 85
BCP 88
BCP 89
BCP 102
BCP 109
BCP 110
BCP 112
BCP 115
BCP 117
BCP 118
BCP 121
BCP 127
BCP 128
BCP 143
BCP 144
BCP 146
BCP 147
BCP 158
BCP 159
BCP 23
BCP 23
WV
TR
g/(
m2
.da
y)
40% BCP in K1
50% BCP in K1
62% BCP in K1
75% BCP in K1
TARGET
2 2 1
2 2 1
2 2
2
3
2
Tensile properties
3 Excellent
2 Good
1 Weak
Figure 25. Body-temperature WVTR (Not Normalized for Thickness) of BCP Blended with
K1 at Four Loadings Red numbers, representing tensile strength, are indicated only for high-performance
films (showing a combination of high WVTR and strength)
Permeability at body temperature
0
2.000
4.000
6.000
8.000
10.000
12.000
BCP 84
BCP 85
BCP 88
BCP 89
BCP 102
BCP 109
BCP 110
BCP 112
BCP 115
BCP 117
BCP 118
BCP 121
BCP 127
BCP 128
BCP 143
BCP 144
BCP 146
BCP 147
BCP 158
BCP 159
BCP 23
BCP 23
Pe
rme
ab
ility
g.m
il/(m
2.d
ay
)
40% BCP in K1
50% BCP in K1
62% BCP in K1
75% BCP in K1
2 2 12 2 12
2
2
3
2
Tensile properties
3 Excellent
2 Good
1 Weak
Figure 26. Body-Temperature Permeability (Normalized for Thickness) of BCP Blended
with K1 at Four Loadings Red numbers, representing tensile strength, are indicated only for high-performance films (showing a
combination of high WVTR and strength).
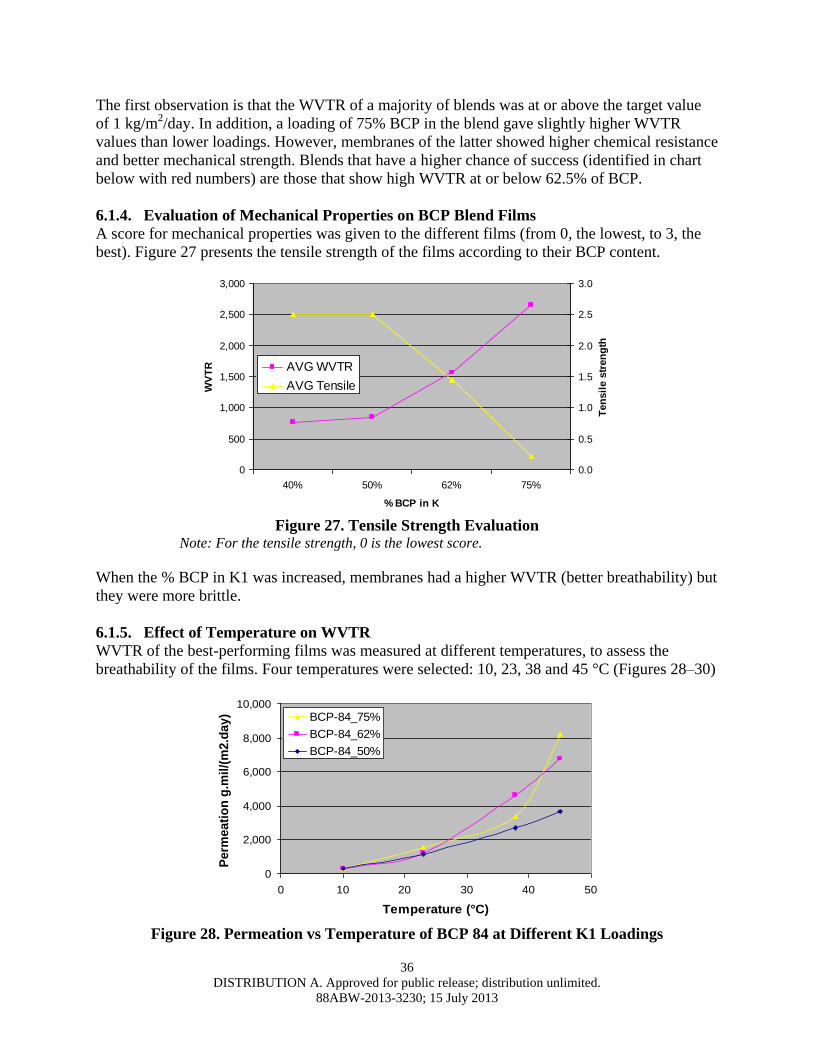
36
DISTRIBUTION A. Approved for public release; distribution unlimited.
88ABW-2013-3230; 15 July 2013
The first observation is that the WVTR of a majority of blends was at or above the target value
of 1 kg/m2/day. In addition, a loading of 75% BCP in the blend gave slightly higher WVTR
values than lower loadings. However, membranes of the latter showed higher chemical resistance
and better mechanical strength. Blends that have a higher chance of success (identified in chart
below with red numbers) are those that show high WVTR at or below 62.5% of BCP.
6.1.4. Evaluation of Mechanical Properties on BCP Blend Films
A score for mechanical properties was given to the different films (from 0, the lowest, to 3, the
best). Figure 27 presents the tensile strength of the films according to their BCP content.
0
500
1,000
1,500
2,000
2,500
3,000
40% 50% 62% 75%
% BCP in K
WV
TR
0.0
0.5
1.0
1.5
2.0
2.5
3.0
Ten
sil
e s
tren
gth
AVG WVTR
AVG Tensile
Figure 27. Tensile Strength Evaluation
Note: For the tensile strength, 0 is the lowest score.
When the % BCP in K1 was increased, membranes had a higher WVTR (better breathability) but
they were more brittle.
6.1.5. Effect of Temperature on WVTR
WVTR of the best-performing films was measured at different temperatures, to assess the
breathability of the films. Four temperatures were selected: 10, 23, 38 and 45 °C (Figures 28–30)
0
2,000
4,000
6,000
8,000
10,000
0 10 20 30 40 50
Temperature (°C)
Perm
eati
on
g.m
il/(
m2.d
ay) BCP-84_75%
BCP-84_62%
BCP-84_50%
Figure 28. Permeation vs Temperature of BCP 84 at Different K1 Loadings
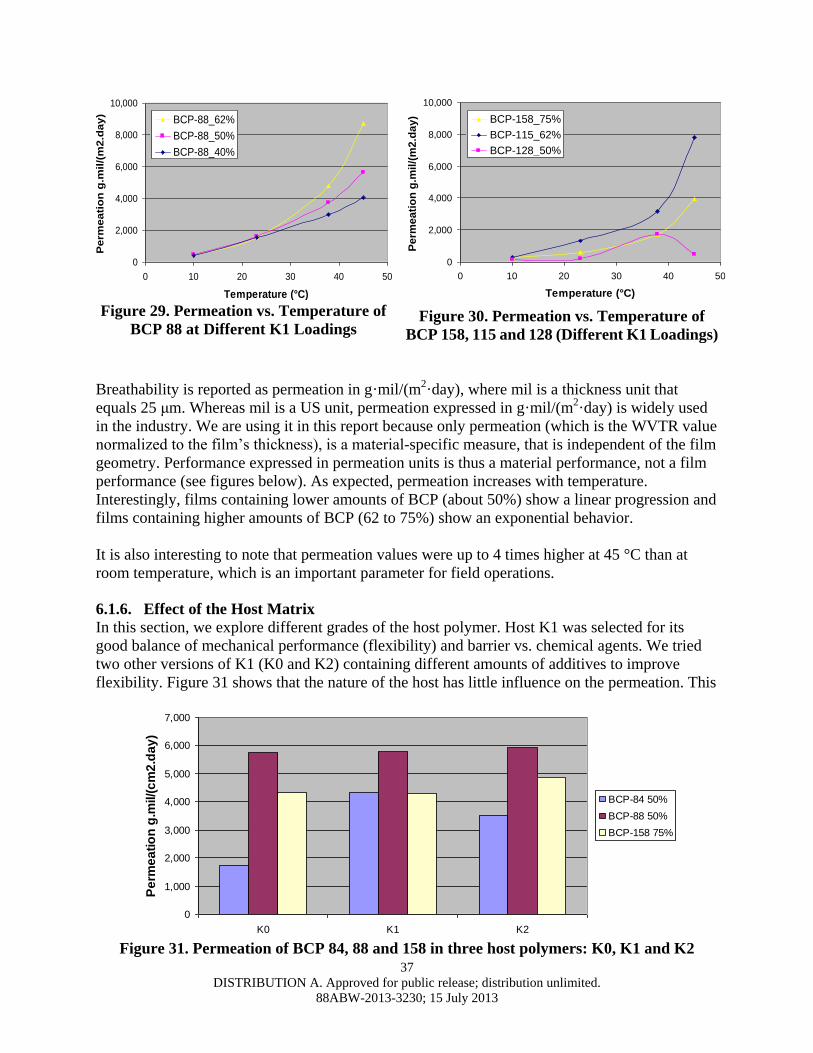
37
DISTRIBUTION A. Approved for public release; distribution unlimited.
88ABW-2013-3230; 15 July 2013
0
2,000
4,000
6,000
8,000
10,000
0 10 20 30 40 50
Temperature (°C)
Perm
eati
on
g.m
il/(
m2.d
ay)
BCP-88_62%
BCP-88_50%
BCP-88_40%
0
2,000
4,000
6,000
8,000
10,000
0 10 20 30 40 50
Temperature (°C)
Perm
eati
on
g.m
il/(
m2.d
ay) BCP-158_75%
BCP-115_62%
BCP-128_50%
Figure 29. Permeation vs. Temperature of
BCP 88 at Different K1 Loadings Figure 30. Permeation vs. Temperature of
BCP 158, 115 and 128 (Different K1 Loadings)
Breathability is reported as permeation in g·mil/(m2·day), where mil is a thickness unit that
equals 25 μm. Whereas mil is a US unit, permeation expressed in g·mil/(m2·day) is widely used
in the industry. We are using it in this report because only permeation (which is the WVTR value
normalized to the film’s thickness), is a material-specific measure, that is independent of the film
geometry. Performance expressed in permeation units is thus a material performance, not a film
performance (see figures below). As expected, permeation increases with temperature.
Interestingly, films containing lower amounts of BCP (about 50%) show a linear progression and
films containing higher amounts of BCP (62 to 75%) show an exponential behavior.
It is also interesting to note that permeation values were up to 4 times higher at 45 °C than at
room temperature, which is an important parameter for field operations.
6.1.6. Effect of the Host Matrix
In this section, we explore different grades of the host polymer. Host K1 was selected for its
good balance of mechanical performance (flexibility) and barrier vs. chemical agents. We tried
two other versions of K1 (K0 and K2) containing different amounts of additives to improve
flexibility. Figure 31 shows that the nature of the host has little influence on the permeation. This
0
1,000
2,000
3,000
4,000
5,000
6,000
7,000
K0 K1 K2
Pe
rme
ati
on
g.m
il/(
cm
2.d
ay
)
BCP-84 50%
BCP-88 50%
BCP-158 75%
Figure 31. Permeation of BCP 84, 88 and 158 in three host polymers: K0, K1 and K2
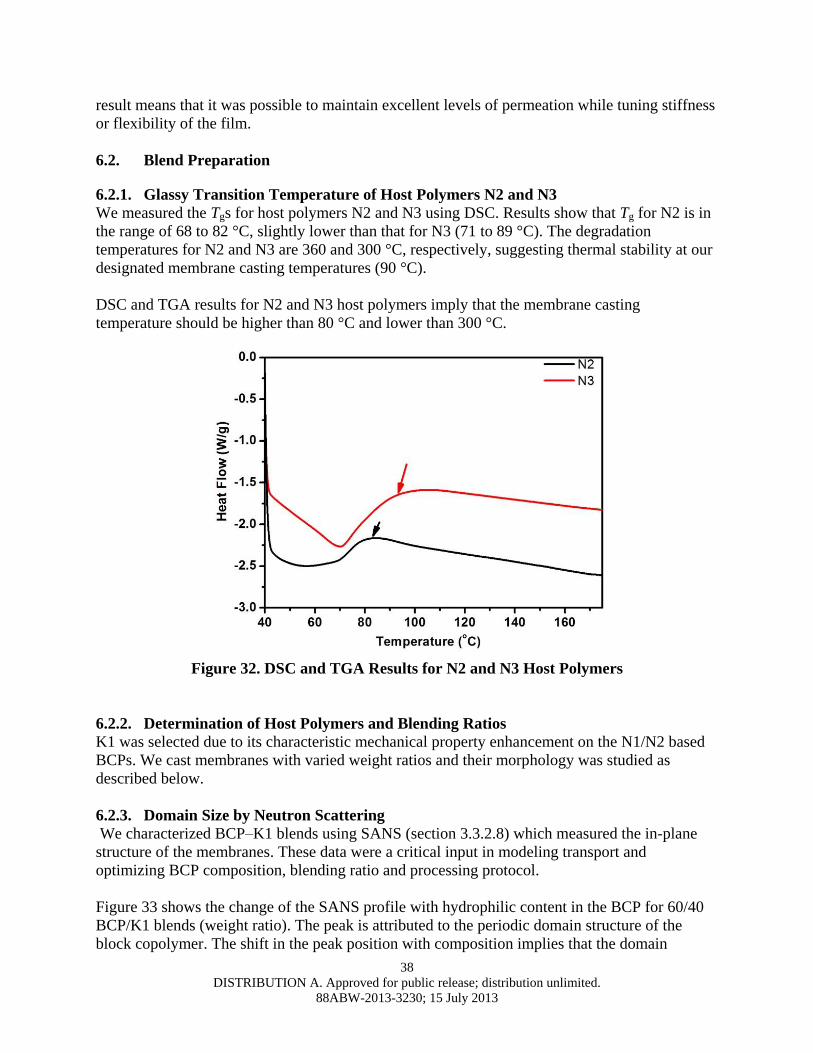
38
DISTRIBUTION A. Approved for public release; distribution unlimited.
88ABW-2013-3230; 15 July 2013
result means that it was possible to maintain excellent levels of permeation while tuning stiffness
or flexibility of the film.
6.2. Blend Preparation
6.2.1. Glassy Transition Temperature of Host Polymers N2 and N3
We measured the Tgs for host polymers N2 and N3 using DSC. Results show that Tg for N2 is in
the range of 68 to 82 °C, slightly lower than that for N3 (71 to 89 °C). The degradation
temperatures for N2 and N3 are 360 and 300 °C, respectively, suggesting thermal stability at our
designated membrane casting temperatures (90 °C).
DSC and TGA results for N2 and N3 host polymers imply that the membrane casting
temperature should be higher than 80 °C and lower than 300 °C.
Figure 32. DSC and TGA Results for N2 and N3 Host Polymers
6.2.2. Determination of Host Polymers and Blending Ratios
K1 was selected due to its characteristic mechanical property enhancement on the N1/N2 based
BCPs. We cast membranes with varied weight ratios and their morphology was studied as
described below.
6.2.3. Domain Size by Neutron Scattering
We characterized BCP–K1 blends using SANS (section 3.3.2.8) which measured the in-plane
structure of the membranes. These data were a critical input in modeling transport and
optimizing BCP composition, blending ratio and processing protocol.
Figure 33 shows the change of the SANS profile with hydrophilic content in the BCP for 60/40
BCP/K1 blends (weight ratio). The peak is attributed to the periodic domain structure of the
block copolymer. The shift in the peak position with composition implies that the domain
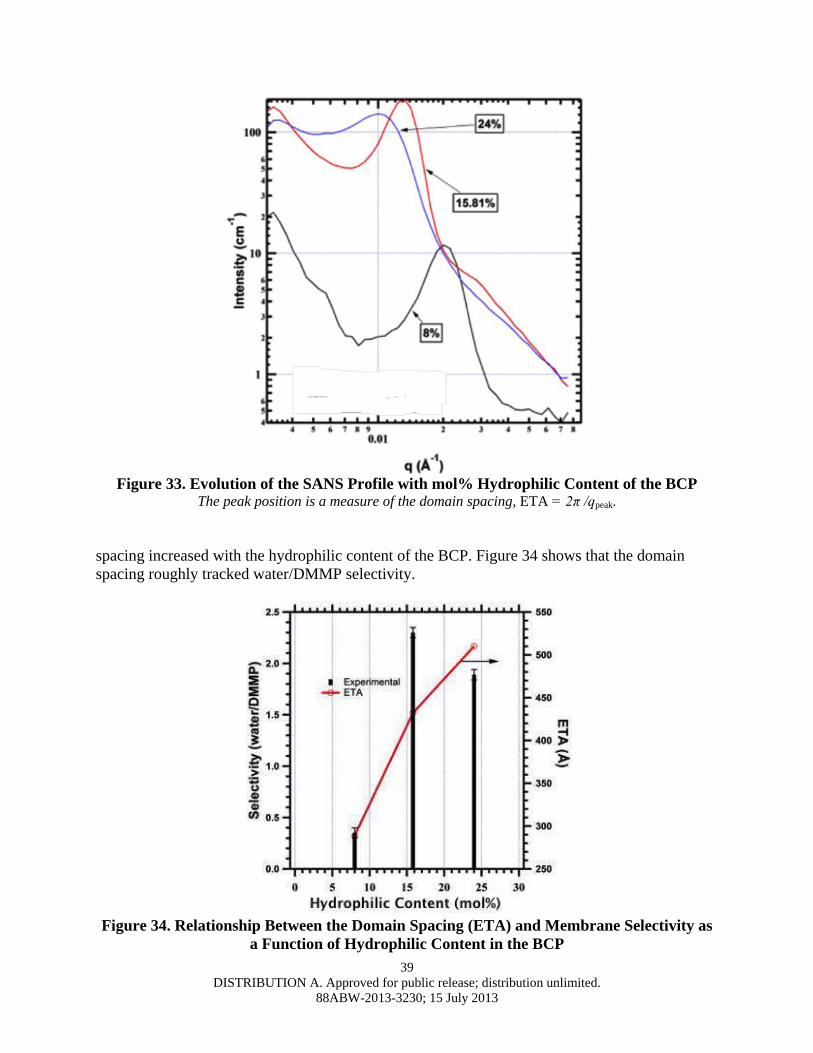
39
DISTRIBUTION A. Approved for public release; distribution unlimited.
88ABW-2013-3230; 15 July 2013
Figure 33. Evolution of the SANS Profile with mol% Hydrophilic Content of the BCP
The peak position is a measure of the domain spacing, ETA = 2π /qpeak.
spacing increased with the hydrophilic content of the BCP. Figure 34 shows that the domain
spacing roughly tracked water/DMMP selectivity.
Figure 34. Relationship Between the Domain Spacing (ETA) and Membrane Selectivity as
a Function of Hydrophilic Content in the BCP
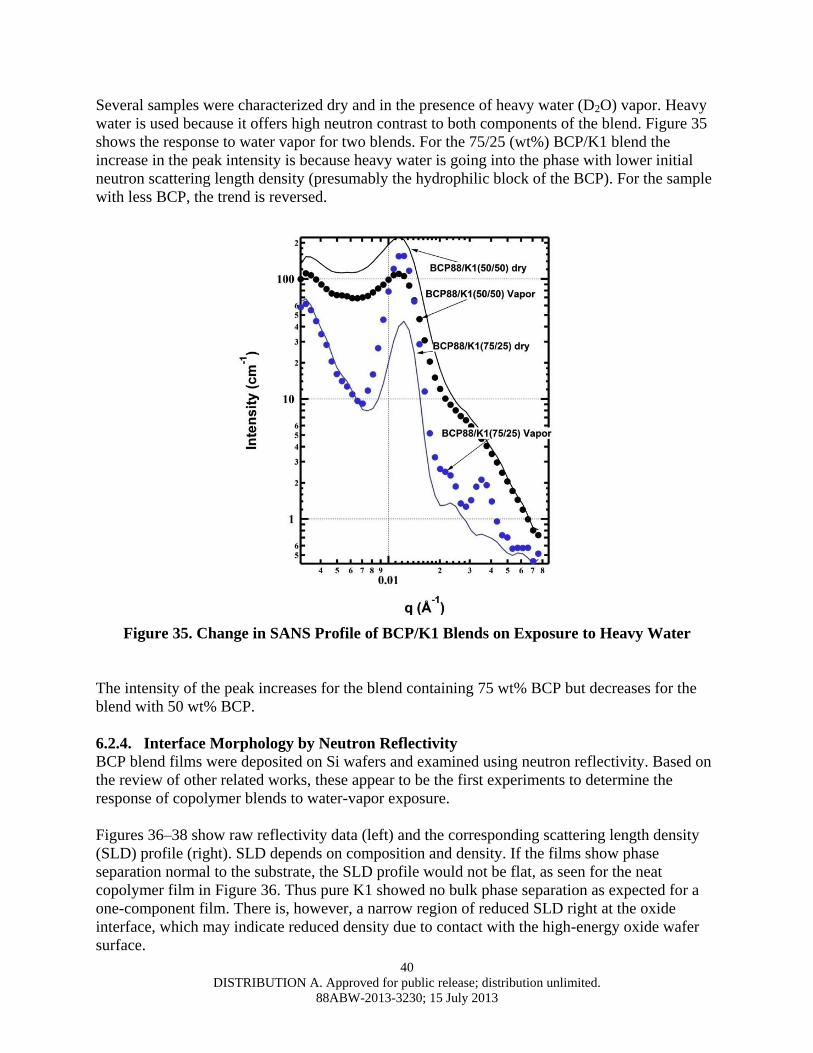
40
DISTRIBUTION A. Approved for public release; distribution unlimited.
88ABW-2013-3230; 15 July 2013
Several samples were characterized dry and in the presence of heavy water (D2O) vapor. Heavy
water is used because it offers high neutron contrast to both components of the blend. Figure 35
shows the response to water vapor for two blends. For the 75/25 (wt%) BCP/K1 blend the
increase in the peak intensity is because heavy water is going into the phase with lower initial
neutron scattering length density (presumably the hydrophilic block of the BCP). For the sample
with less BCP, the trend is reversed.
Figure 35. Change in SANS Profile of BCP/K1 Blends on Exposure to Heavy Water
The intensity of the peak increases for the blend containing 75 wt% BCP but decreases for the
blend with 50 wt% BCP.
6.2.4. Interface Morphology by Neutron Reflectivity
BCP blend films were deposited on Si wafers and examined using neutron reflectivity. Based on
the review of other related works, these appear to be the first experiments to determine the
response of copolymer blends to water-vapor exposure.
Figures 36–38 show raw reflectivity data (left) and the corresponding scattering length density
(SLD) profile (right). SLD depends on composition and density. If the films show phase
separation normal to the substrate, the SLD profile would not be flat, as seen for the neat
copolymer film in Figure 36. Thus pure K1 showed no bulk phase separation as expected for a
one-component film. There is, however, a narrow region of reduced SLD right at the oxide
interface, which may indicate reduced density due to contact with the high-energy oxide wafer
surface.
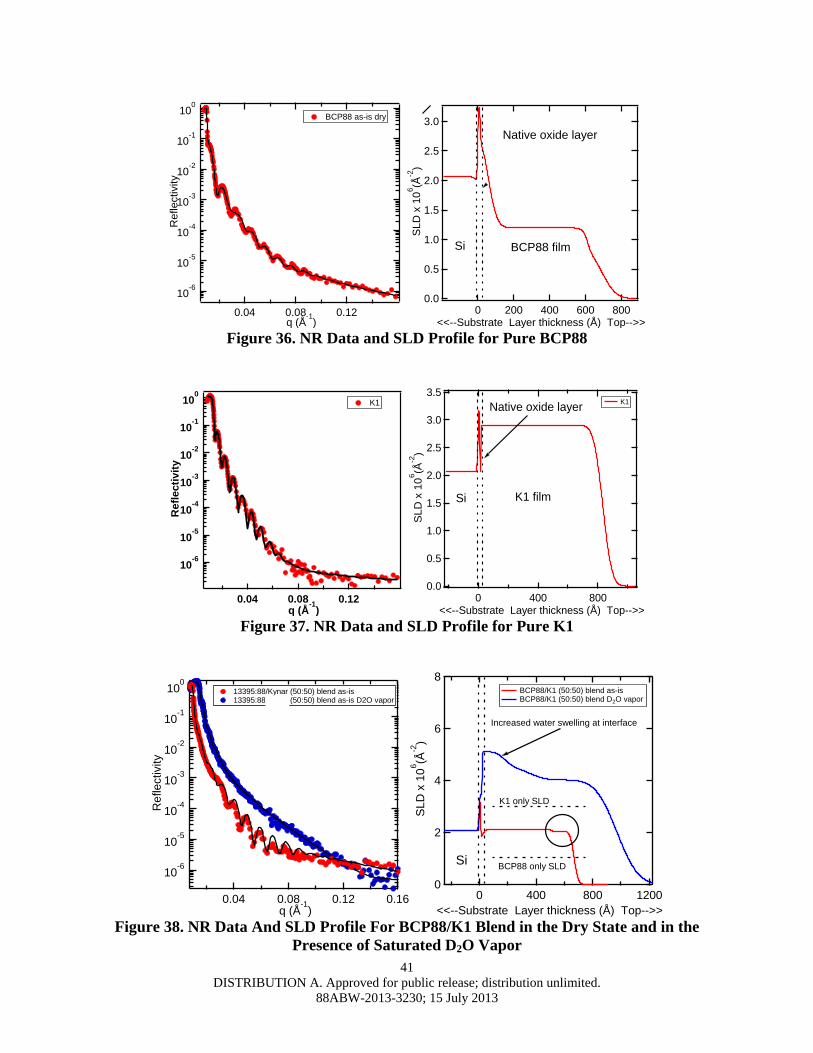
41
DISTRIBUTION A. Approved for public release; distribution unlimited.
88ABW-2013-3230; 15 July 2013
10-6
10-5
10-4
10-3
10-2
10-1
100
Re
flectivity
0.120.080.04 q (Å
-1)
BCP88 as-is dry3.0
2.5
2.0
1.5
1.0
0.5
0.0
SL
D x
10
6(Å
-2)
8006004002000 <<--Substrate Layer thickness (Å) Top-->>
BCP88 film
Native oxide layer
Si
Figure 36. NR Data and SLD Profile for Pure BCP88
10-6
10-5
10-4
10-3
10-2
10-1
100
Refl
ecti
vit
y
0.120.080.04 q (Å
-1)
K13.5
3.0
2.5
2.0
1.5
1.0
0.5
0.0
SLD
x 1
06(Å
-2)
8004000 <<--Substrate Layer thickness (Å) Top-->>
Native oxide layer
Si K1 film
K1
Figure 37. NR Data and SLD Profile for Pure K1
10-6
10-5
10-4
10-3
10-2
10-1
100
Refle
ctivity
0.160.120.080.04 q (Å
-1)
13395:88/Kynar (50:50) blend as-is 13395:88/Kynar (50:50) blend as-is D2O vapor
8
6
4
2
0
SL
D x
10
6(Å
-2)
12008004000
<<--Substrate Layer thickness (Å) Top-->>
Si
Increased water swelling at interface
K1 only SLD
BCP88 only SLD
BCP88/K1 (50:50) blend as-is BCP88/K1 (50:50) blend D2O vapor
Figure 38. NR Data And SLD Profile For BCP88/K1 Blend in the Dry State and in the
Presence of Saturated D2O Vapor
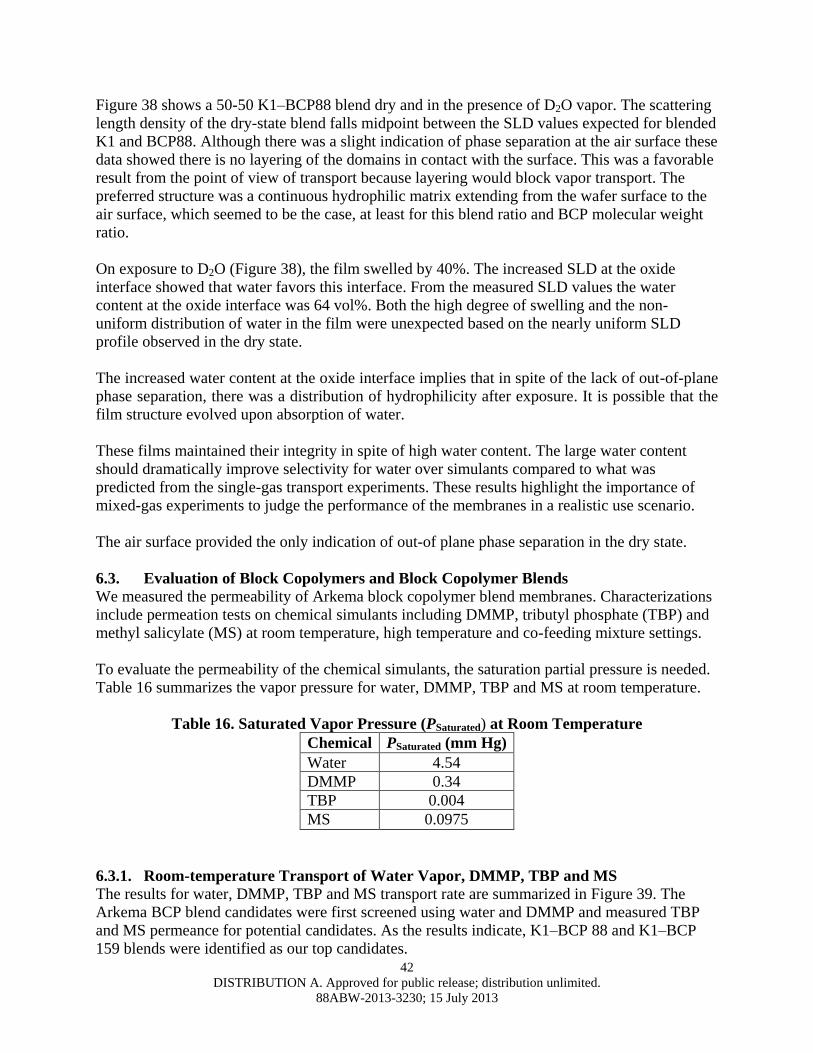
42
DISTRIBUTION A. Approved for public release; distribution unlimited.
88ABW-2013-3230; 15 July 2013
Figure 38 shows a 50-50 K1–BCP88 blend dry and in the presence of D2O vapor. The scattering
length density of the dry-state blend falls midpoint between the SLD values expected for blended
K1 and BCP88. Although there was a slight indication of phase separation at the air surface these
data showed there is no layering of the domains in contact with the surface. This was a favorable
result from the point of view of transport because layering would block vapor transport. The
preferred structure was a continuous hydrophilic matrix extending from the wafer surface to the
air surface, which seemed to be the case, at least for this blend ratio and BCP molecular weight
ratio.
On exposure to D2O (Figure 38), the film swelled by 40%. The increased SLD at the oxide
interface showed that water favors this interface. From the measured SLD values the water
content at the oxide interface was 64 vol%. Both the high degree of swelling and the non-
uniform distribution of water in the film were unexpected based on the nearly uniform SLD
profile observed in the dry state.
The increased water content at the oxide interface implies that in spite of the lack of out-of-plane
phase separation, there was a distribution of hydrophilicity after exposure. It is possible that the
film structure evolved upon absorption of water.
These films maintained their integrity in spite of high water content. The large water content
should dramatically improve selectivity for water over simulants compared to what was
predicted from the single-gas transport experiments. These results highlight the importance of
mixed-gas experiments to judge the performance of the membranes in a realistic use scenario.
The air surface provided the only indication of out-of plane phase separation in the dry state.
6.3. Evaluation of Block Copolymers and Block Copolymer Blends
We measured the permeability of Arkema block copolymer blend membranes. Characterizations
include permeation tests on chemical simulants including DMMP, tributyl phosphate (TBP) and
methyl salicylate (MS) at room temperature, high temperature and co-feeding mixture settings.
To evaluate the permeability of the chemical simulants, the saturation partial pressure is needed.
Table 16 summarizes the vapor pressure for water, DMMP, TBP and MS at room temperature.
Table 16. Saturated Vapor Pressure (PSaturated) at Room Temperature
Chemical PSaturated (mm Hg)
Water 4.54
DMMP 0.34
TBP 0.004
MS 0.0975
6.3.1. Room-temperature Transport of Water Vapor, DMMP, TBP and MS
The results for water, DMMP, TBP and MS transport rate are summarized in Figure 39. The
Arkema BCP blend candidates were first screened using water and DMMP and measured TBP
and MS permeance for potential candidates. As the results indicate, K1–BCP 88 and K1–BCP
159 blends were identified as our top candidates.
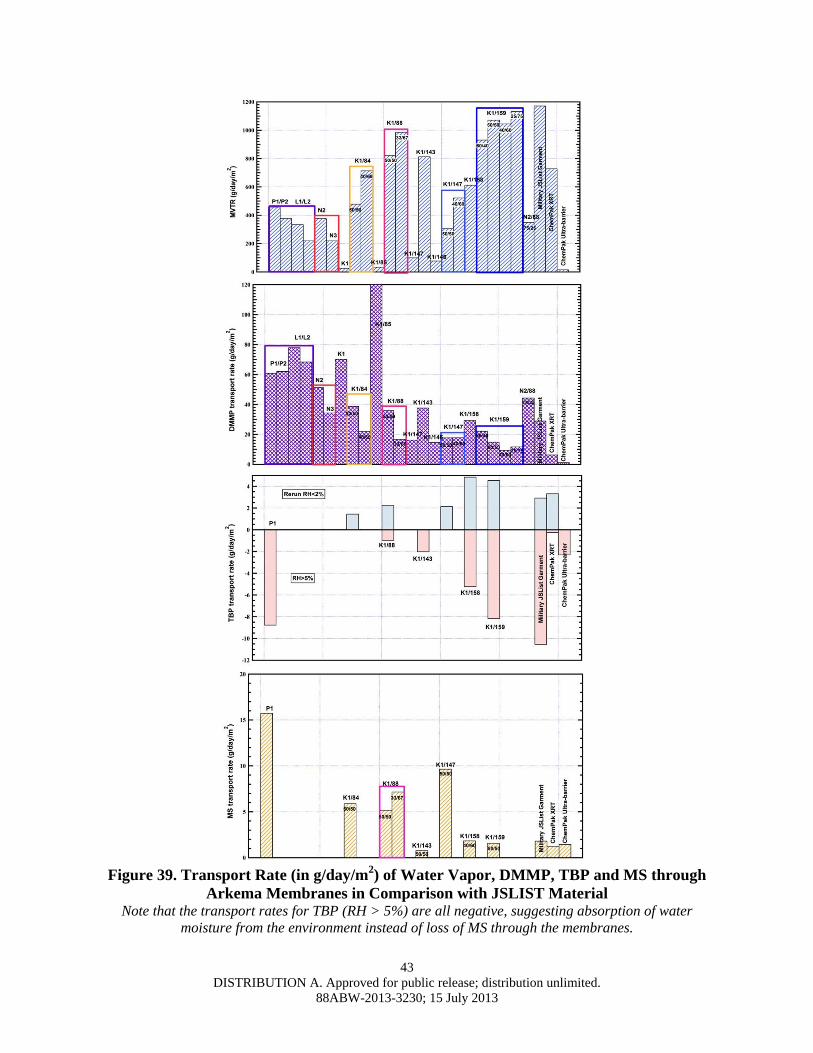
43
DISTRIBUTION A. Approved for public release; distribution unlimited.
88ABW-2013-3230; 15 July 2013
Figure 39. Transport Rate (in g/day/m
2) of Water Vapor, DMMP, TBP and MS through
Arkema Membranes in Comparison with JSLIST Material Note that the transport rates for TBP (RH > 5%) are all negative, suggesting absorption of water
moisture from the environment instead of loss of MS through the membranes.
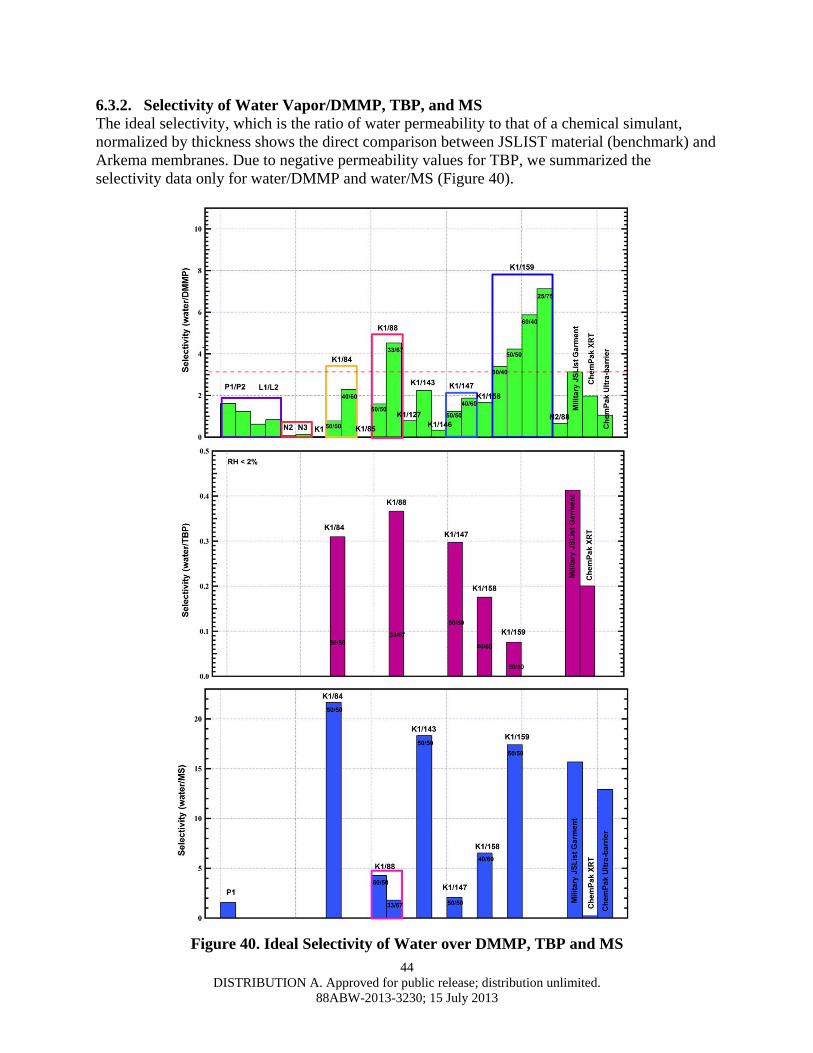
44
DISTRIBUTION A. Approved for public release; distribution unlimited.
88ABW-2013-3230; 15 July 2013
6.3.2. Selectivity of Water Vapor/DMMP, TBP, and MS
The ideal selectivity, which is the ratio of water permeability to that of a chemical simulant,
normalized by thickness shows the direct comparison between JSLIST material (benchmark) and
Arkema membranes. Due to negative permeability values for TBP, we summarized the
selectivity data only for water/DMMP and water/MS (Figure 40).
Figure 40. Ideal Selectivity of Water over DMMP, TBP and MS
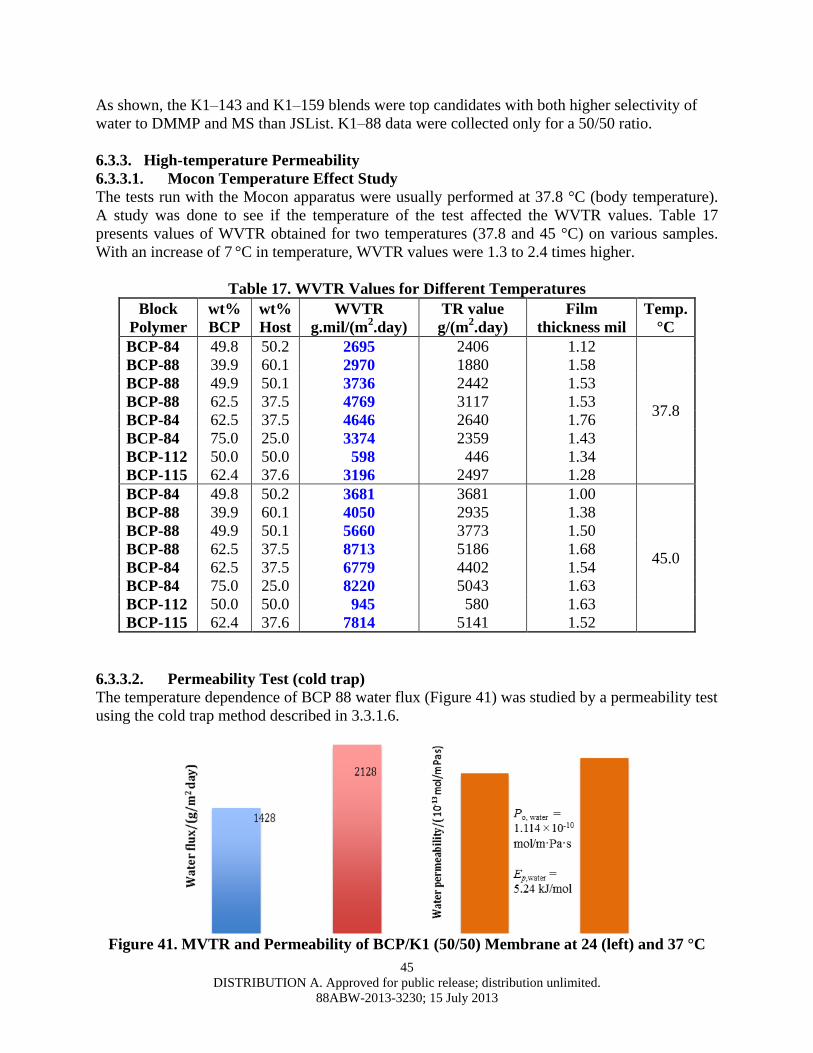
45
DISTRIBUTION A. Approved for public release; distribution unlimited.
88ABW-2013-3230; 15 July 2013
As shown, the K1–143 and K1–159 blends were top candidates with both higher selectivity of
water to DMMP and MS than JSList. K1–88 data were collected only for a 50/50 ratio.
6.3.3. High-temperature Permeability
6.3.3.1. Mocon Temperature Effect Study
The tests run with the Mocon apparatus were usually performed at 37.8 °C (body temperature).
A study was done to see if the temperature of the test affected the WVTR values. Table 17
presents values of WVTR obtained for two temperatures (37.8 and 45 °C) on various samples.
With an increase of 7 °C in temperature, WVTR values were 1.3 to 2.4 times higher.
Table 17. WVTR Values for Different Temperatures
Block
Polymer
wt%
BCP
wt%
Host
WVTR
g.mil/(m2.day)
TR value
g/(m2.day)
Film
thickness mil
Temp.
°C
BCP-84 49.8 50.2 2695 2406 1.12
37.8
BCP-88 39.9 60.1 2970 1880 1.58
BCP-88 49.9 50.1 3736 2442 1.53
BCP-88 62.5 37.5 4769 3117 1.53
BCP-84 62.5 37.5 4646 2640 1.76
BCP-84 75.0 25.0 3374 2359 1.43
BCP-112 50.0 50.0 598 446 1.34
BCP-115 62.4 37.6 3196 2497 1.28
BCP-84 49.8 50.2 3681 3681 1.00
45.0
BCP-88 39.9 60.1 4050 2935 1.38
BCP-88 49.9 50.1 5660 3773 1.50
BCP-88 62.5 37.5 8713 5186 1.68
BCP-84 62.5 37.5 6779 4402 1.54
BCP-84 75.0 25.0 8220 5043 1.63
BCP-112 50.0 50.0 945 580 1.63
BCP-115 62.4 37.6 7814 5141 1.52
6.3.3.2. Permeability Test (cold trap)
The temperature dependence of BCP 88 water flux (Figure 41) was studied by a permeability test
using the cold trap method described in 3.3.1.6.
Figure 41. MVTR and Permeability of BCP/K1 (50/50) Membrane at 24 (left) and 37 °C
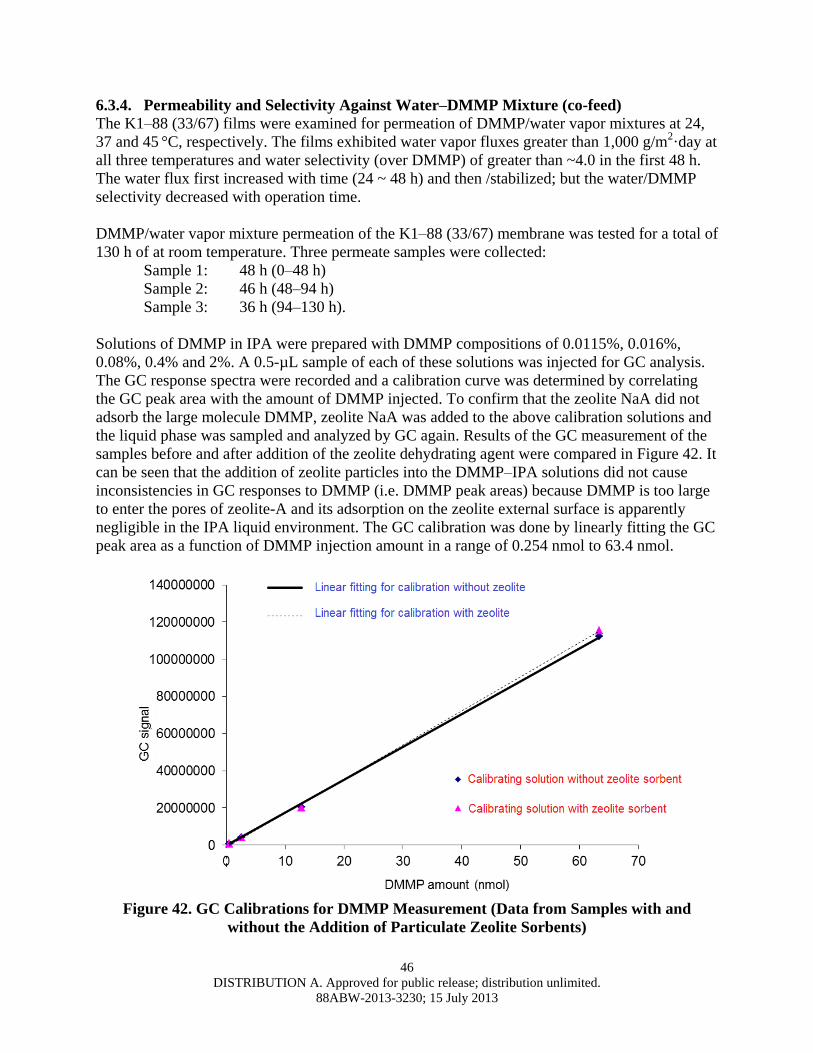
46
DISTRIBUTION A. Approved for public release; distribution unlimited.
88ABW-2013-3230; 15 July 2013
6.3.4. Permeability and Selectivity Against Water–DMMP Mixture (co-feed)
The K1–88 (33/67) films were examined for permeation of DMMP/water vapor mixtures at 24,
37 and 45 °C, respectively. The films exhibited water vapor fluxes greater than 1,000 g/m
2·day at
all three temperatures and water selectivity (over DMMP) of greater than ~4.0 in the first 48 h.
The water flux first increased with time (24 ~ 48 h) and then /stabilized; but the water/DMMP
selectivity decreased with operation time.
DMMP/water vapor mixture permeation of the K1–88 (33/67) membrane was tested for a total of
130 h of at room temperature. Three permeate samples were collected:
Sample 1: 48 h (0–48 h)
Sample 2: 46 h (48–94 h)
Sample 3: 36 h (94–130 h).
Solutions of DMMP in IPA were prepared with DMMP compositions of 0.0115%, 0.016%,
0.08%, 0.4% and 2%. A 0.5-µL sample of each of these solutions was injected for GC analysis.
The GC response spectra were recorded and a calibration curve was determined by correlating
the GC peak area with the amount of DMMP injected. To confirm that the zeolite NaA did not
adsorb the large molecule DMMP, zeolite NaA was added to the above calibration solutions and
the liquid phase was sampled and analyzed by GC again. Results of the GC measurement of the
samples before and after addition of the zeolite dehydrating agent were compared in Figure 42. It
can be seen that the addition of zeolite particles into the DMMP–IPA solutions did not cause
inconsistencies in GC responses to DMMP (i.e. DMMP peak areas) because DMMP is too large
to enter the pores of zeolite-A and its adsorption on the zeolite external surface is apparently
negligible in the IPA liquid environment. The GC calibration was done by linearly fitting the GC
peak area as a function of DMMP injection amount in a range of 0.254 nmol to 63.4 nmol.
Figure 42. GC Calibrations for DMMP Measurement (Data from Samples with and
without the Addition of Particulate Zeolite Sorbents)
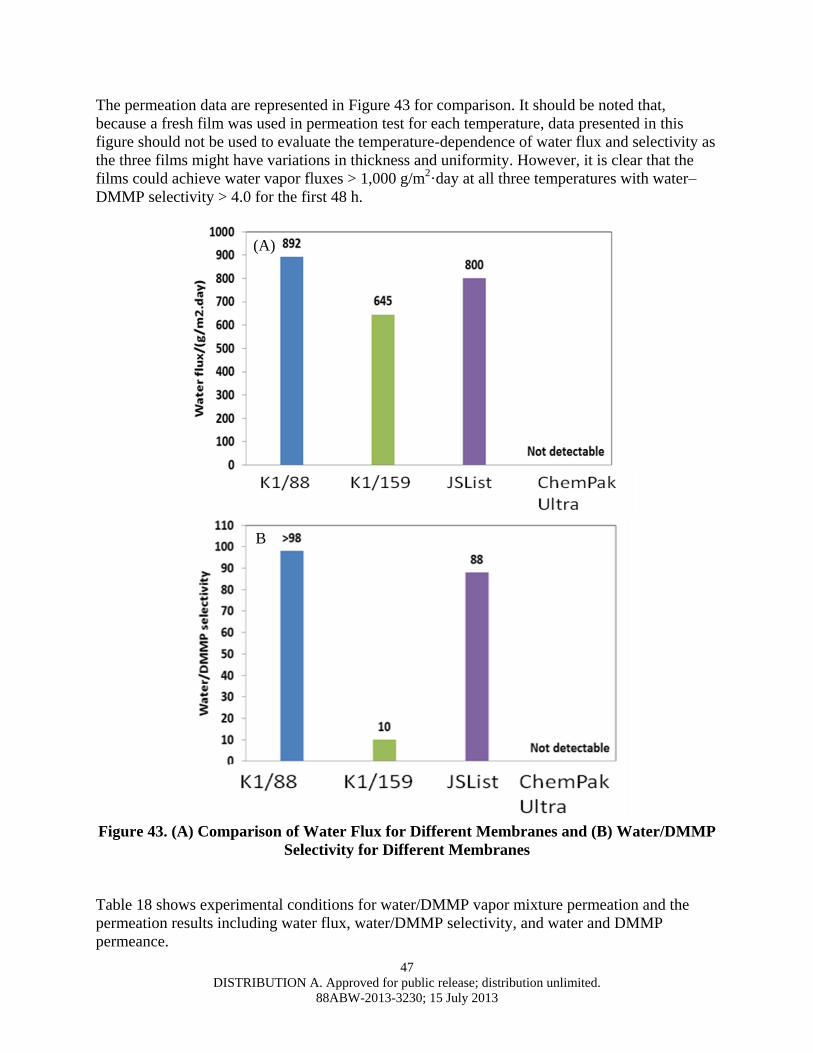
47
DISTRIBUTION A. Approved for public release; distribution unlimited.
88ABW-2013-3230; 15 July 2013
The permeation data are represented in Figure 43 for comparison. It should be noted that,
because a fresh film was used in permeation test for each temperature, data presented in this
figure should not be used to evaluate the temperature-dependence of water flux and selectivity as
the three films might have variations in thickness and uniformity. However, it is clear that the
films could achieve water vapor fluxes > 1,000 g/m2·day at all three temperatures with water–
DMMP selectivity > 4.0 for the first 48 h.
Figure 43. (A) Comparison of Water Flux for Different Membranes and (B) Water/DMMP
Selectivity for Different Membranes
Table 18 shows experimental conditions for water/DMMP vapor mixture permeation and the
permeation results including water flux, water/DMMP selectivity, and water and DMMP
permeance.
(A)
B
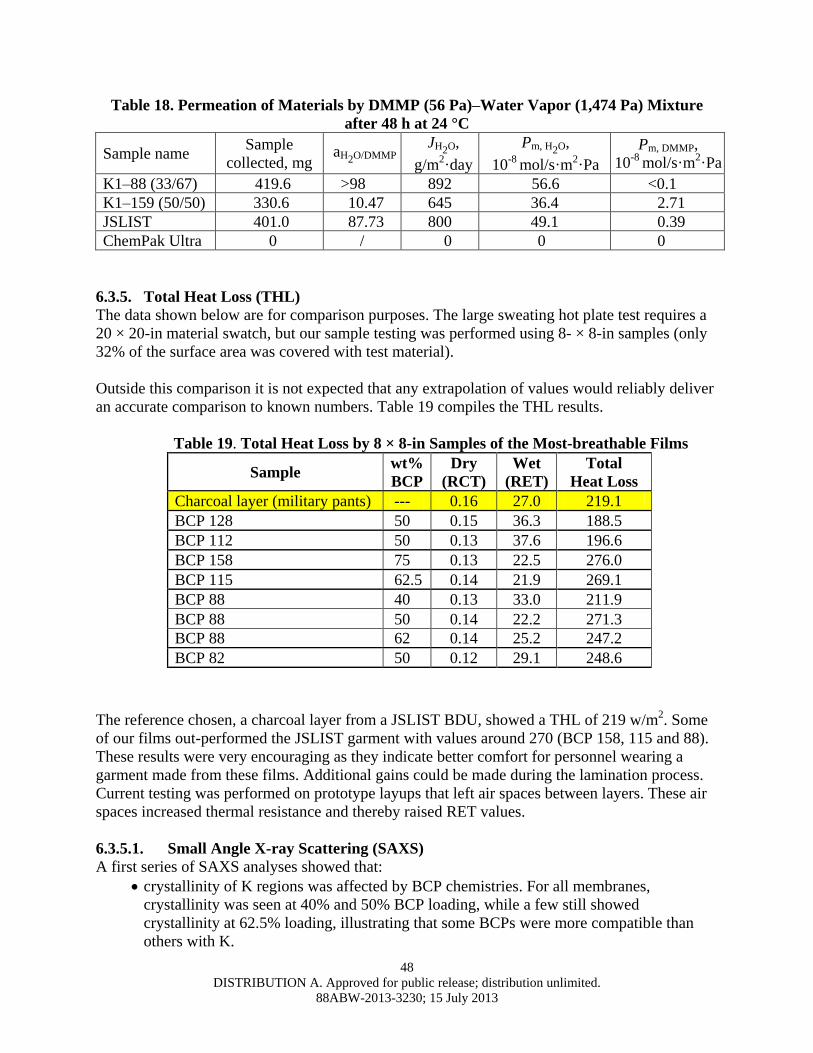
48
DISTRIBUTION A. Approved for public release; distribution unlimited.
88ABW-2013-3230; 15 July 2013
Table 18. Permeation of Materials by DMMP (56 Pa)–Water Vapor (1,474 Pa) Mixture
after 48 h at 24 °C
Sample name Sample
collected, mg aH2O/DMMP
JH2O,
g/m2·day
Pm, H2O,
10-8
mol/s·m2·Pa
Pm, DMMP,
10-8
mol/s·m2·Pa
K1–88 (33/67) 419.6 >98 892 56.6 <0.1
K1–159 (50/50) 330.6 10.47 645 36.4 2.71
JSLIST 401.0 87.73 800 49.1 0.39
ChemPak Ultra 0 / 0 0 0
6.3.5. Total Heat Loss (THL)
The data shown below are for comparison purposes. The large sweating hot plate test requires a
20 × 20-in material swatch, but our sample testing was performed using 8- × 8-in samples (only
32% of the surface area was covered with test material).
Outside this comparison it is not expected that any extrapolation of values would reliably deliver
an accurate comparison to known numbers. Table 19 compiles the THL results.
Table 19. Total Heat Loss by 8 × 8-in Samples of the Most-breathable Films
Sample wt%
BCP
Dry
(RCT)
Wet
(RET)
Total
Heat Loss
Charcoal layer (military pants) --- 0.16 27.0 219.1
BCP 128 50 0.15 36.3 188.5
BCP 112 50 0.13 37.6 196.6
BCP 158 75 0.13 22.5 276.0
BCP 115 62.5 0.14 21.9 269.1
BCP 88 40 0.13 33.0 211.9
BCP 88 50 0.14 22.2 271.3
BCP 88 62 0.14 25.2 247.2
BCP 82 50 0.12 29.1 248.6
The reference chosen, a charcoal layer from a JSLIST BDU, showed a THL of 219 w/m2. Some
of our films out-performed the JSLIST garment with values around 270 (BCP 158, 115 and 88).
These results were very encouraging as they indicate better comfort for personnel wearing a
garment made from these films. Additional gains could be made during the lamination process.
Current testing was performed on prototype layups that left air spaces between layers. These air
spaces increased thermal resistance and thereby raised RET values.
6.3.5.1. Small Angle X-ray Scattering (SAXS)
A first series of SAXS analyses showed that:
crystallinity of K regions was affected by BCP chemistries. For all membranes,
crystallinity was seen at 40% and 50% BCP loading, while a few still showed
crystallinity at 62.5% loading, illustrating that some BCPs were more compatible than
others with K.
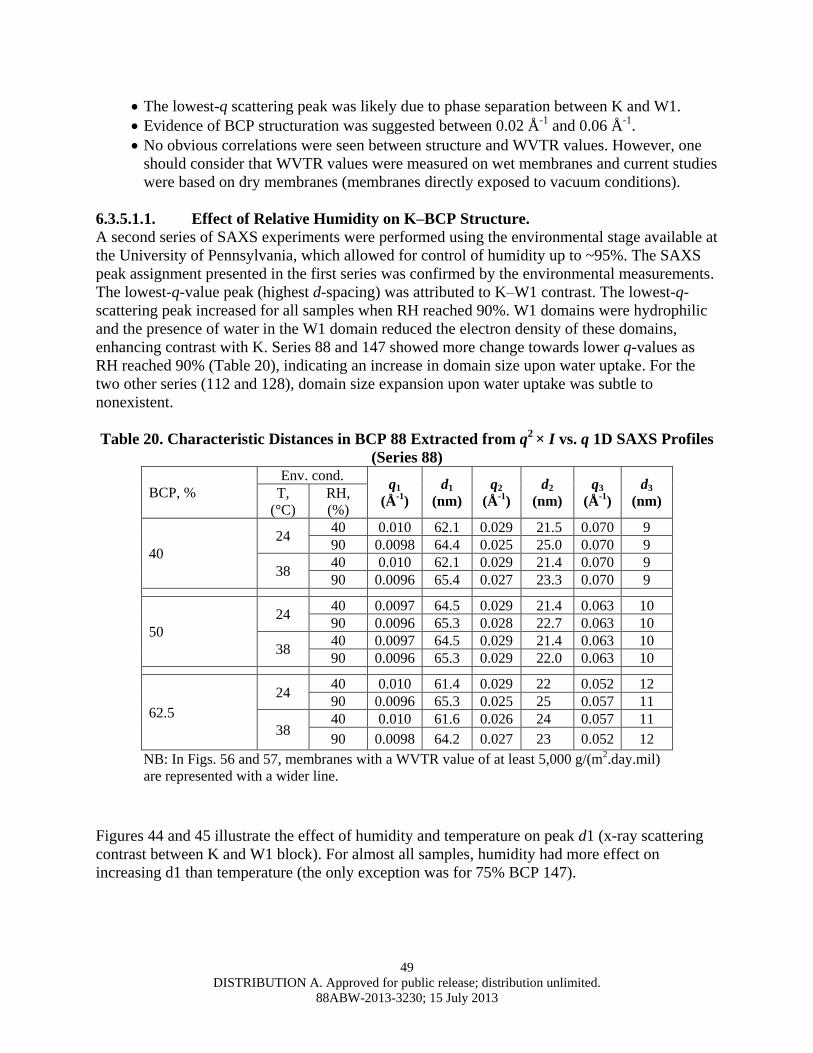
49
DISTRIBUTION A. Approved for public release; distribution unlimited.
88ABW-2013-3230; 15 July 2013
The lowest-q scattering peak was likely due to phase separation between K and W1.
Evidence of BCP structuration was suggested between 0.02 Å-1
and 0.06 Å-1
.
No obvious correlations were seen between structure and WVTR values. However, one
should consider that WVTR values were measured on wet membranes and current studies
were based on dry membranes (membranes directly exposed to vacuum conditions).
6.3.5.1.1. Effect of Relative Humidity on K–BCP Structure.
A second series of SAXS experiments were performed using the environmental stage available at
the University of Pennsylvania, which allowed for control of humidity up to ~95%. The SAXS
peak assignment presented in the first series was confirmed by the environmental measurements.
The lowest-q-value peak (highest d-spacing) was attributed to K–W1 contrast. The lowest-q-
scattering peak increased for all samples when RH reached 90%. W1 domains were hydrophilic
and the presence of water in the W1 domain reduced the electron density of these domains,
enhancing contrast with K. Series 88 and 147 showed more change towards lower q-values as
RH reached 90% (Table 20), indicating an increase in domain size upon water uptake. For the
two other series (112 and 128), domain size expansion upon water uptake was subtle to
nonexistent.
Table 20. Characteristic Distances in BCP 88 Extracted from q2 × I vs. q 1D SAXS Profiles
(Series 88)
BCP, %
Env. cond. q1
(Å-1
)
d1
(nm)
q2
(Å-1
)
d2
(nm)
q3
(Å-1
)
d3
(nm) T,
(°C)
RH,
(%)
40
24 40 0.010 62.1 0.029 21.5 0.070 9
90 0.0098 64.4 0.025 25.0 0.070 9
38 40 0.010 62.1 0.029 21.4 0.070 9
90 0.0096 65.4 0.027 23.3 0.070 9
50
24 40 0.0097 64.5 0.029 21.4 0.063 10
90 0.0096 65.3 0.028 22.7 0.063 10
38 40 0.0097 64.5 0.029 21.4 0.063 10
90 0.0096 65.3 0.029 22.0 0.063 10
62.5
24 40 0.010 61.4 0.029 22 0.052 12
90 0.0096 65.3 0.025 25 0.057 11
38 40 0.010 61.6 0.026 24 0.057 11
90 0.0098 64.2 0.027 23 0.052 12
NB: In Figs. 56 and 57, membranes with a WVTR value of at least 5,000 g/(m2.day.mil)
are represented with a wider line.
Figures 44 and 45 illustrate the effect of humidity and temperature on peak d1 (x-ray scattering
contrast between K and W1 block). For almost all samples, humidity had more effect on
increasing d1 than temperature (the only exception was for 75% BCP 147).
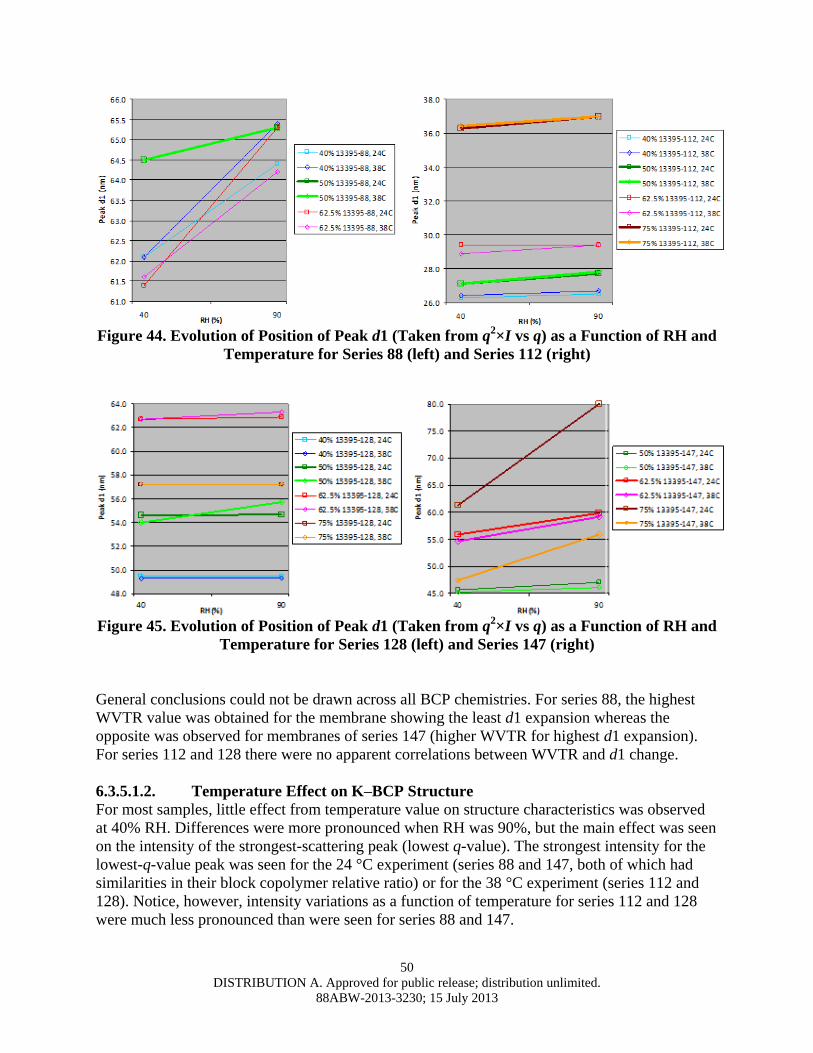
50
DISTRIBUTION A. Approved for public release; distribution unlimited.
88ABW-2013-3230; 15 July 2013
Figure 44. Evolution of Position of Peak d1 (Taken from q
2×I vs q) as a Function of RH and
Temperature for Series 88 (left) and Series 112 (right)
Figure 45. Evolution of Position of Peak d1 (Taken from q
2×I vs q) as a Function of RH and
Temperature for Series 128 (left) and Series 147 (right)
General conclusions could not be drawn across all BCP chemistries. For series 88, the highest
WVTR value was obtained for the membrane showing the least d1 expansion whereas the
opposite was observed for membranes of series 147 (higher WVTR for highest d1 expansion).
For series 112 and 128 there were no apparent correlations between WVTR and d1 change.
6.3.5.1.2. Temperature Effect on K–BCP Structure
For most samples, little effect from temperature value on structure characteristics was observed
at 40% RH. Differences were more pronounced when RH was 90%, but the main effect was seen
on the intensity of the strongest-scattering peak (lowest q-value). The strongest intensity for the
lowest-q-value peak was seen for the 24 °C experiment (series 88 and 147, both of which had
similarities in their block copolymer relative ratio) or for the 38 °C experiment (series 112 and
128). Notice, however, intensity variations as a function of temperature for series 112 and 128
were much less pronounced than were seen for series 88 and 147.
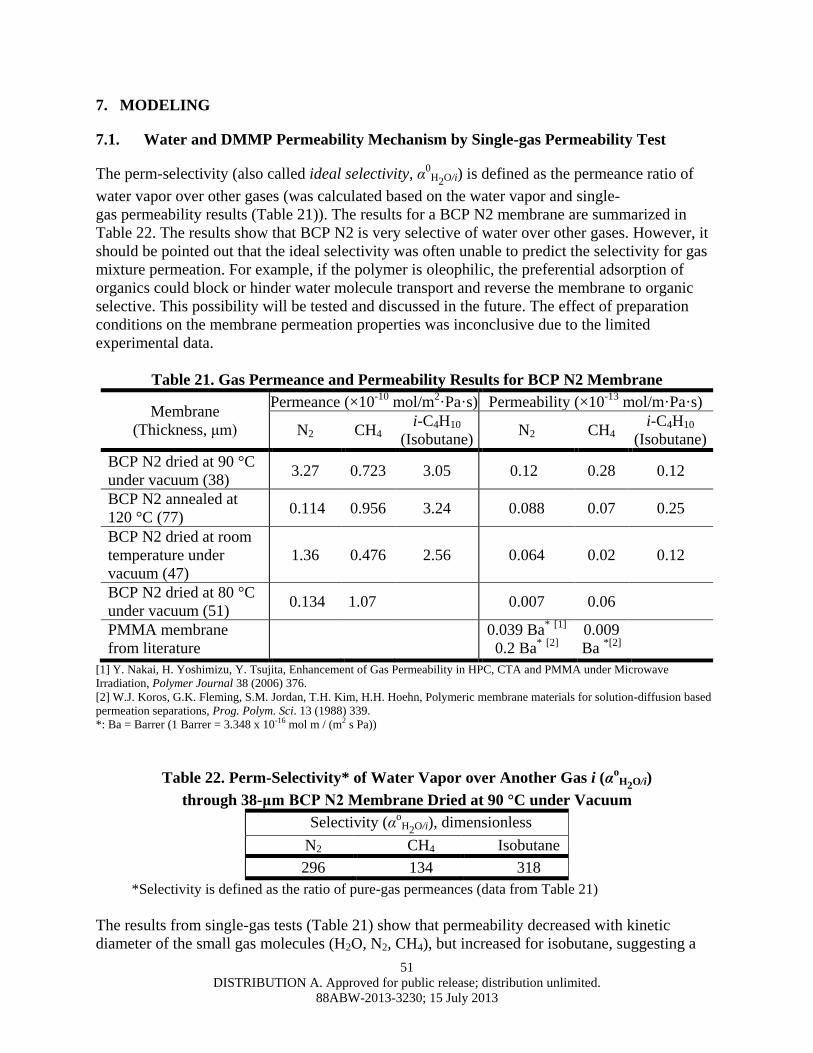
51
DISTRIBUTION A. Approved for public release; distribution unlimited.
88ABW-2013-3230; 15 July 2013
7. MODELING
7.1. Water and DMMP Permeability Mechanism by Single-gas Permeability Test
The perm-selectivity (also called ideal selectivity, α0
H2O/i) is defined as the permeance ratio of
water vapor over other gases (was calculated based on the water vapor and single-
gas permeability results (Table 21)). The results for a BCP N2 membrane are summarized in
Table 22. The results show that BCP N2 is very selective of water over other gases. However, it
should be pointed out that the ideal selectivity was often unable to predict the selectivity for gas
mixture permeation. For example, if the polymer is oleophilic, the preferential adsorption of
organics could block or hinder water molecule transport and reverse the membrane to organic
selective. This possibility will be tested and discussed in the future. The effect of preparation
conditions on the membrane permeation properties was inconclusive due to the limited
experimental data.
Table 21. Gas Permeance and Permeability Results for BCP N2 Membrane
Membrane
(Thickness, μm)
Permeance (×10-10
mol/m2·Pa·s) Permeability (×10
-13 mol/m·Pa·s)
N2 CH4 i-C4H10
(Isobutane) N2 CH4
i-C4H10
(Isobutane)
BCP N2 dried at 90 °C
under vacuum (38) 3.27 0.723 3.05 0.12 0.28 0.12
BCP N2 annealed at
120 °C (77) 0.114 0.956 3.24 0.088 0.07 0.25
BCP N2 dried at room
temperature under
vacuum (47)
1.36 0.476 2.56 0.064 0.02 0.12
BCP N2 dried at 80 °C
under vacuum (51) 0.134 1.07 0.007 0.06
PMMA membrane
from literature
0.039 Ba* [1]
0.2 Ba* [2]
0.009
Ba *[2]
[1] Y. Nakai, H. Yoshimizu, Y. Tsujita, Enhancement of Gas Permeability in HPC, CTA and PMMA under Microwave
Irradiation, Polymer Journal 38 (2006) 376.
[2] W.J. Koros, G.K. Fleming, S.M. Jordan, T.H. Kim, H.H. Hoehn, Polymeric membrane materials for solution-diffusion based
permeation separations, Prog. Polym. Sci. 13 (1988) 339.
*: Ba = Barrer (1 Barrer = 3.348 x 10⁻¹⁶ mol m / (m2 s Pa))
Table 22. Perm-Selectivity* of Water Vapor over Another Gas i (αo
H2O/i)
through 38-μm BCP N2 Membrane Dried at 90 °C under Vacuum
Selectivity (αo
H2O/i), dimensionless
N2 CH4 Isobutane
296 134 318
*Selectivity is defined as the ratio of pure-gas permeances (data from Table 21)
The results from single-gas tests (Table 21) show that permeability decreased with kinetic
diameter of the small gas molecules (H2O, N2, CH4), but increased for isobutane, suggesting a
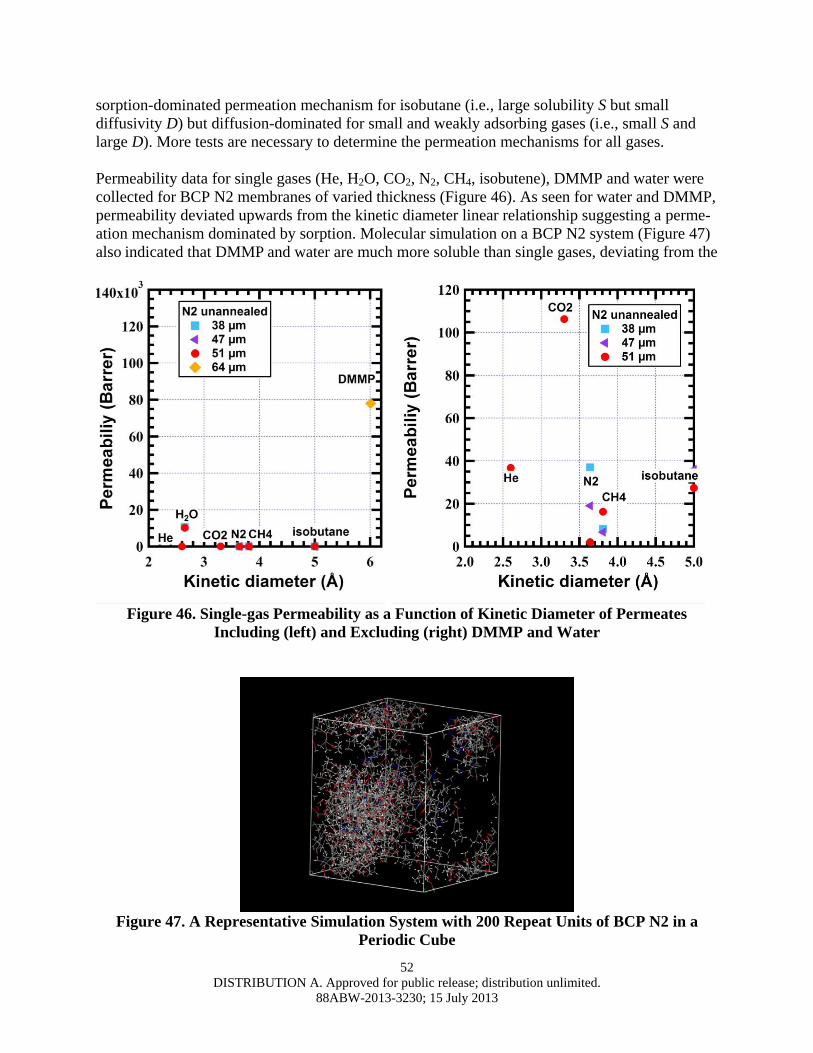
52
DISTRIBUTION A. Approved for public release; distribution unlimited.
88ABW-2013-3230; 15 July 2013
sorption-dominated permeation mechanism for isobutane (i.e., large solubility S but small
diffusivity D) but diffusion-dominated for small and weakly adsorbing gases (i.e., small S and
large D). More tests are necessary to determine the permeation mechanisms for all gases.
Permeability data for single gases (He, H2O, CO2, N2, CH4, isobutene), DMMP and water were
collected for BCP N2 membranes of varied thickness (Figure 46). As seen for water and DMMP,
permeability deviated upwards from the kinetic diameter linear relationship suggesting a perme-
ation mechanism dominated by sorption. Molecular simulation on a BCP N2 system (Figure 47)
also indicated that DMMP and water are much more soluble than single gases, deviating from the
Figure 46. Single-gas Permeability as a Function of Kinetic Diameter of Permeates
Including (left) and Excluding (right) DMMP and Water
Figure 47. A Representative Simulation System with 200 Repeat Units of BCP N2 in a
Periodic Cube
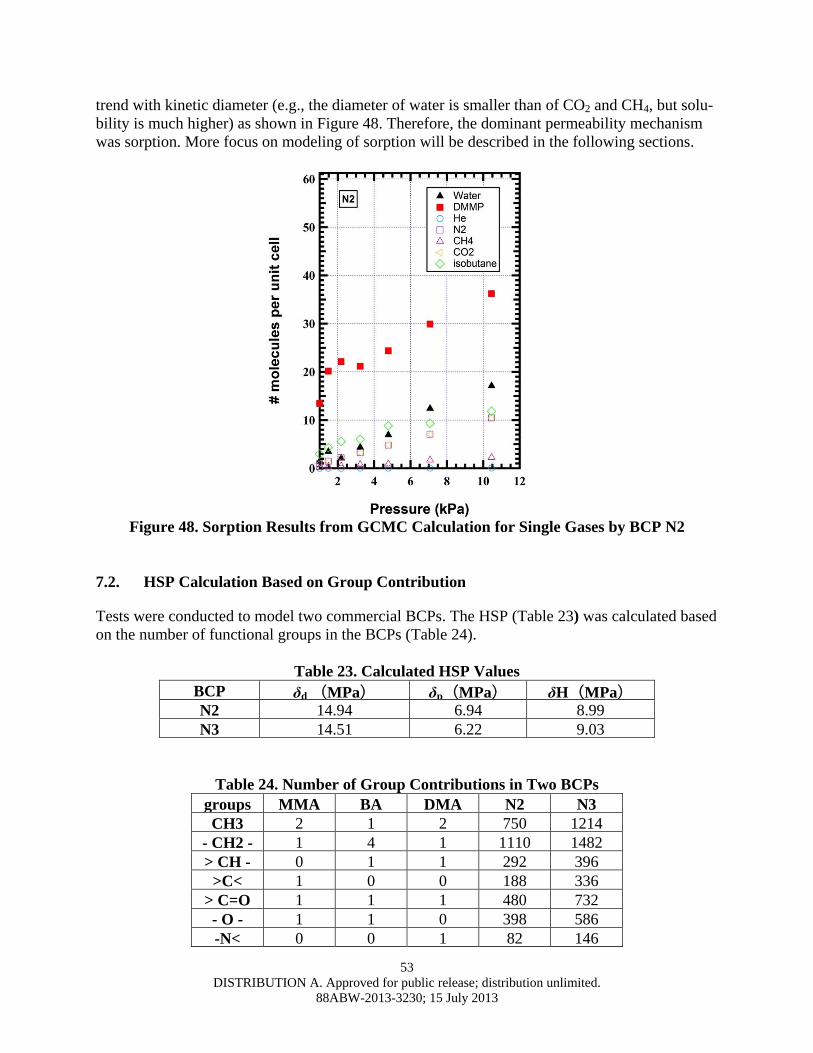
53
DISTRIBUTION A. Approved for public release; distribution unlimited.
88ABW-2013-3230; 15 July 2013
trend with kinetic diameter (e.g., the diameter of water is smaller than of CO2 and CH4, but solu-
bility is much higher) as shown in Figure 48. Therefore, the dominant permeability mechanism
was sorption. More focus on modeling of sorption will be described in the following sections.
Figure 48. Sorption Results from GCMC Calculation for Single Gases by BCP N2
7.2. HSP Calculation Based on Group Contribution
Tests were conducted to model two commercial BCPs. The HSP (Table 23) was calculated based
on the number of functional groups in the BCPs (Table 24).
Table 23. Calculated HSP Values
BCP δd (MPa) δp(MPa) δH(MPa)
N2 14.94 6.94 8.99
N3 14.51 6.22 9.03
Table 24. Number of Group Contributions in Two BCPs
groups MMA BA DMA N2 N3
CH3 2 1 2 750 1214
- CH2 - 1 4 1 1110 1482
> CH - 0 1 1 292 396
>C< 1 0 0 188 336
> C=O 1 1 1 480 732
- O - 1 1 0 398 586
-N< 0 0 1 82 146
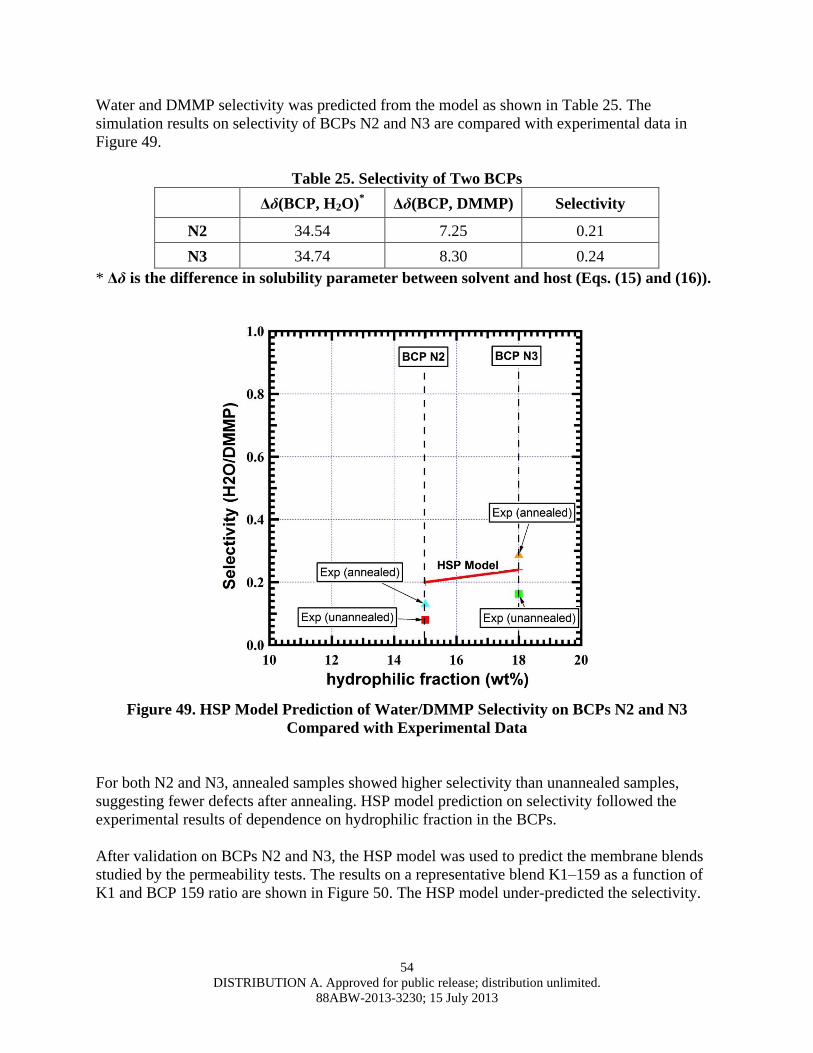
54
DISTRIBUTION A. Approved for public release; distribution unlimited.
88ABW-2013-3230; 15 July 2013
Water and DMMP selectivity was predicted from the model as shown in Table 25. The
simulation results on selectivity of BCPs N2 and N3 are compared with experimental data in
Figure 49.
Table 25. Selectivity of Two BCPs
Δδ(BCP, H2O)*
Δδ(BCP, DMMP) Selectivity
N2 34.54 7.25 0.21
N3 34.74 8.30 0.24
* Δδ is the difference in solubility parameter between solvent and host (Eqs. (15) and (16)).
Figure 49. HSP Model Prediction of Water/DMMP Selectivity on BCPs N2 and N3
Compared with Experimental Data
For both N2 and N3, annealed samples showed higher selectivity than unannealed samples,
suggesting fewer defects after annealing. HSP model prediction on selectivity followed the
experimental results of dependence on hydrophilic fraction in the BCPs.
After validation on BCPs N2 and N3, the HSP model was used to predict the membrane blends
studied by the permeability tests. The results on a representative blend K1–159 as a function of
K1 and BCP 159 ratio are shown in Figure 50. The HSP model under-predicted the selectivity.
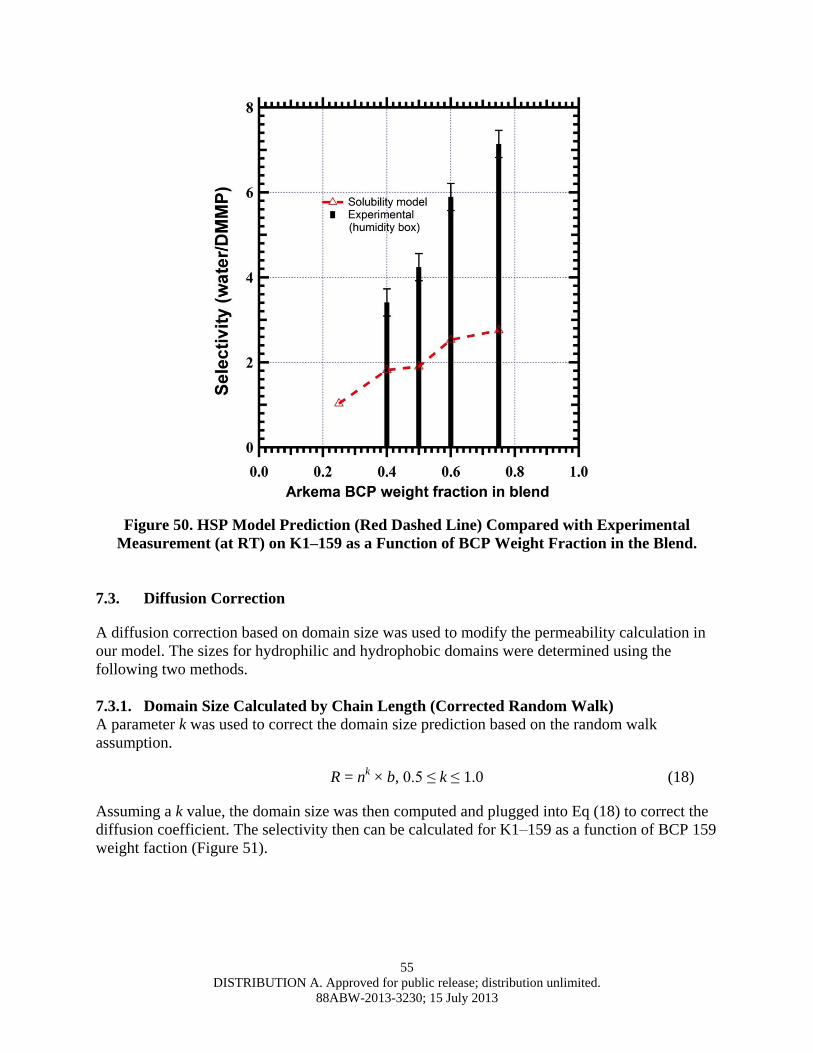
55
DISTRIBUTION A. Approved for public release; distribution unlimited.
88ABW-2013-3230; 15 July 2013
Figure 50. HSP Model Prediction (Red Dashed Line) Compared with Experimental
Measurement (at RT) on K1–159 as a Function of BCP Weight Fraction in the Blend.
7.3. Diffusion Correction
A diffusion correction based on domain size was used to modify the permeability calculation in
our model. The sizes for hydrophilic and hydrophobic domains were determined using the
following two methods.
7.3.1. Domain Size Calculated by Chain Length (Corrected Random Walk)
A parameter k was used to correct the domain size prediction based on the random walk
assumption.
R = nk × b, 0.5 ≤ k ≤ 1.0 (18)
Assuming a k value, the domain size was then computed and plugged into Eq (18) to correct the
diffusion coefficient. The selectivity then can be calculated for K1–159 as a function of BCP 159
weight faction (Figure 51).
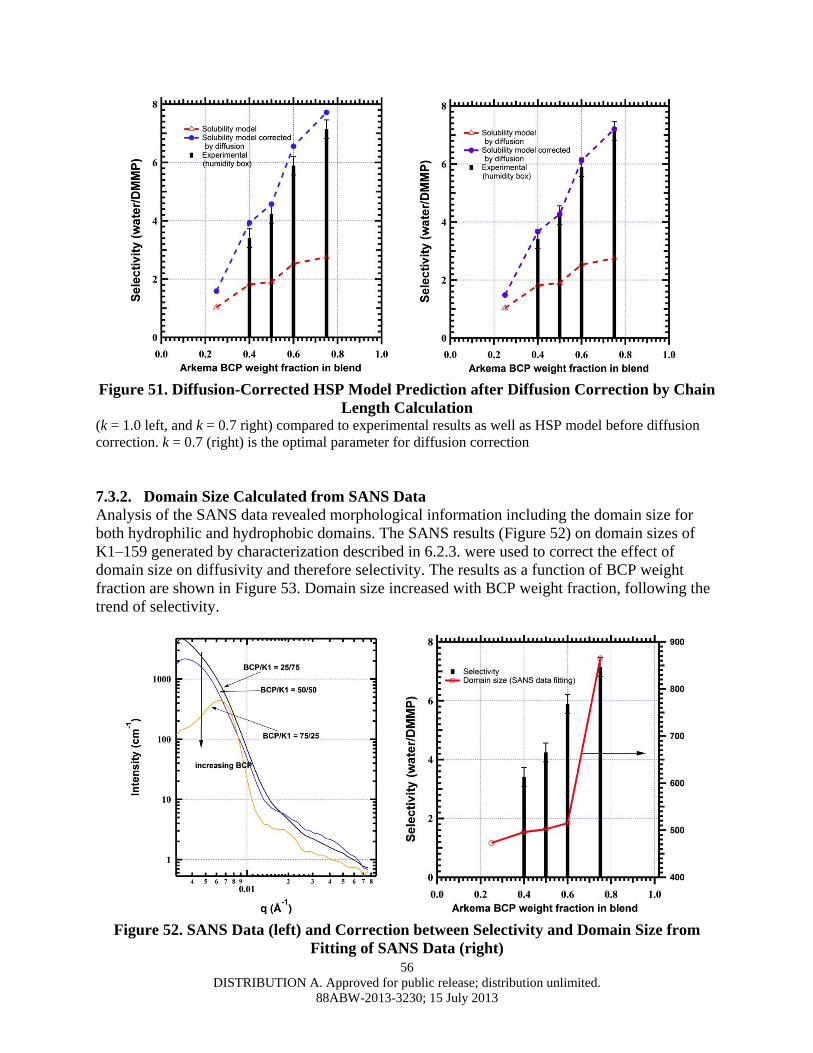
56
DISTRIBUTION A. Approved for public release; distribution unlimited.
88ABW-2013-3230; 15 July 2013
Figure 51. Diffusion-Corrected HSP Model Prediction after Diffusion Correction by Chain
Length Calculation (k = 1.0 left, and k = 0.7 right) compared to experimental results as well as HSP model before diffusion
correction. k = 0.7 (right) is the optimal parameter for diffusion correction
7.3.2. Domain Size Calculated from SANS Data
Analysis of the SANS data revealed morphological information including the domain size for
both hydrophilic and hydrophobic domains. The SANS results (Figure 52) on domain sizes of
K1–159 generated by characterization described in 6.2.3. were used to correct the effect of
domain size on diffusivity and therefore selectivity. The results as a function of BCP weight
fraction are shown in Figure 53. Domain size increased with BCP weight fraction, following the
trend of selectivity.
Figure 52. SANS Data (left) and Correction between Selectivity and Domain Size from
Fitting of SANS Data (right)
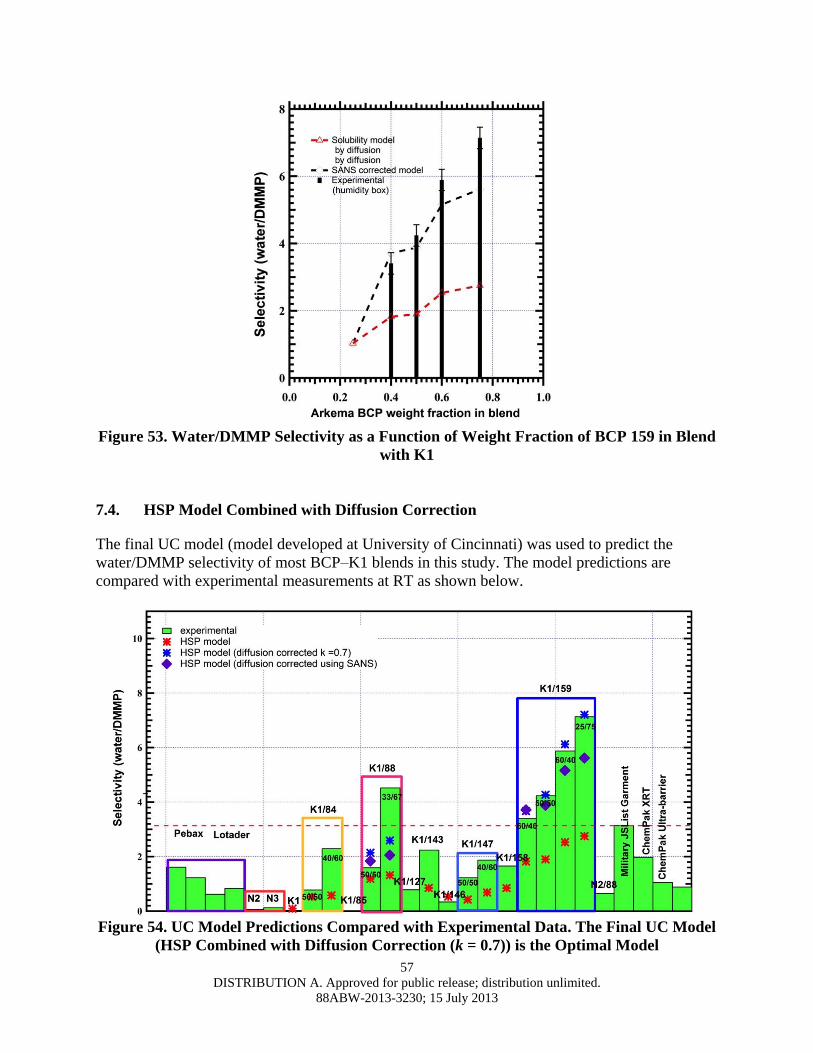
57
DISTRIBUTION A. Approved for public release; distribution unlimited.
88ABW-2013-3230; 15 July 2013
Figure 53. Water/DMMP Selectivity as a Function of Weight Fraction of BCP 159 in Blend
with K1
7.4. HSP Model Combined with Diffusion Correction
The final UC model (model developed at University of Cincinnati) was used to predict the
water/DMMP selectivity of most BCP–K1 blends in this study. The model predictions are
compared with experimental measurements at RT as shown below.
Figure 54. UC Model Predictions Compared with Experimental Data. The Final UC Model
(HSP Combined with Diffusion Correction (k = 0.7)) is the Optimal Model
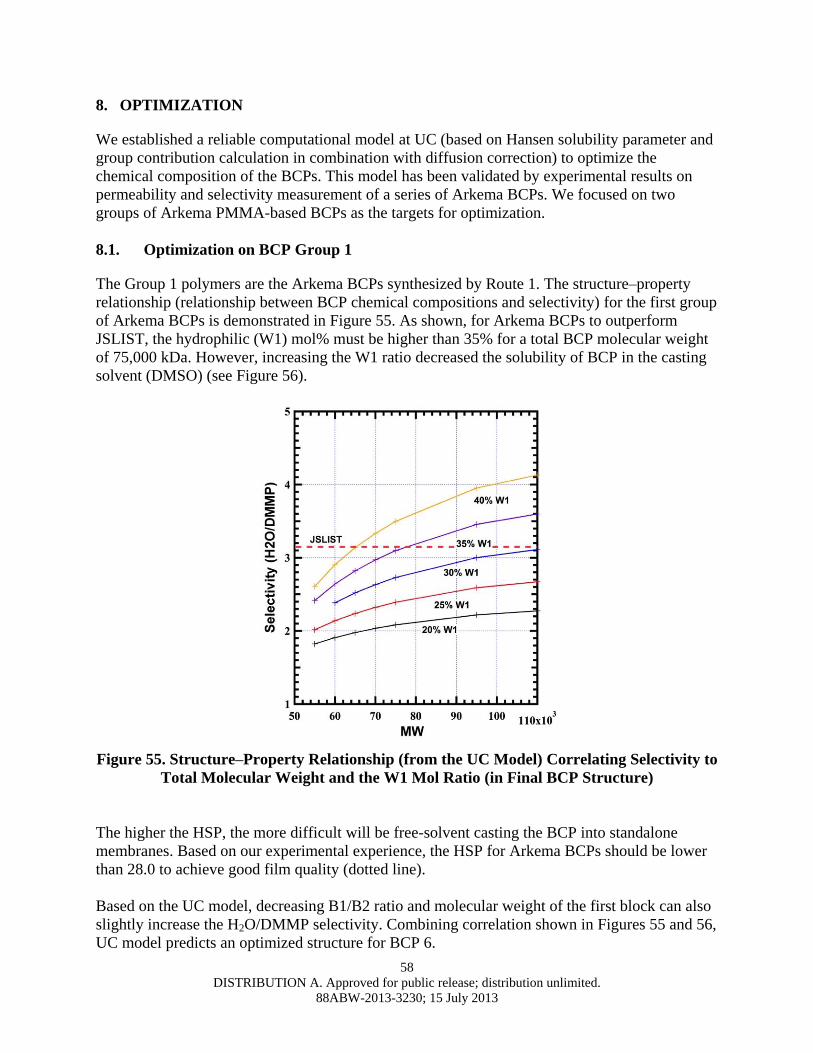
58
DISTRIBUTION A. Approved for public release; distribution unlimited.
88ABW-2013-3230; 15 July 2013
8. OPTIMIZATION
We established a reliable computational model at UC (based on Hansen solubility parameter and
group contribution calculation in combination with diffusion correction) to optimize the
chemical composition of the BCPs. This model has been validated by experimental results on
permeability and selectivity measurement of a series of Arkema BCPs. We focused on two
groups of Arkema PMMA-based BCPs as the targets for optimization.
8.1. Optimization on BCP Group 1
The Group 1 polymers are the Arkema BCPs synthesized by Route 1. The structure–property
relationship (relationship between BCP chemical compositions and selectivity) for the first group
of Arkema BCPs is demonstrated in Figure 55. As shown, for Arkema BCPs to outperform
JSLIST, the hydrophilic (W1) mol% must be higher than 35% for a total BCP molecular weight
of 75,000 kDa. However, increasing the W1 ratio decreased the solubility of BCP in the casting
solvent (DMSO) (see Figure 56).
Figure 55. Structure–Property Relationship (from the UC Model) Correlating Selectivity to
Total Molecular Weight and the W1 Mol Ratio (in Final BCP Structure)
The higher the HSP, the more difficult will be free-solvent casting the BCP into standalone
membranes. Based on our experimental experience, the HSP for Arkema BCPs should be lower
than 28.0 to achieve good film quality (dotted line).
Based on the UC model, decreasing B1/B2 ratio and molecular weight of the first block can also
slightly increase the H2O/DMMP selectivity. Combining correlation shown in Figures 55 and 56,
UC model predicts an optimized structure for BCP 6.
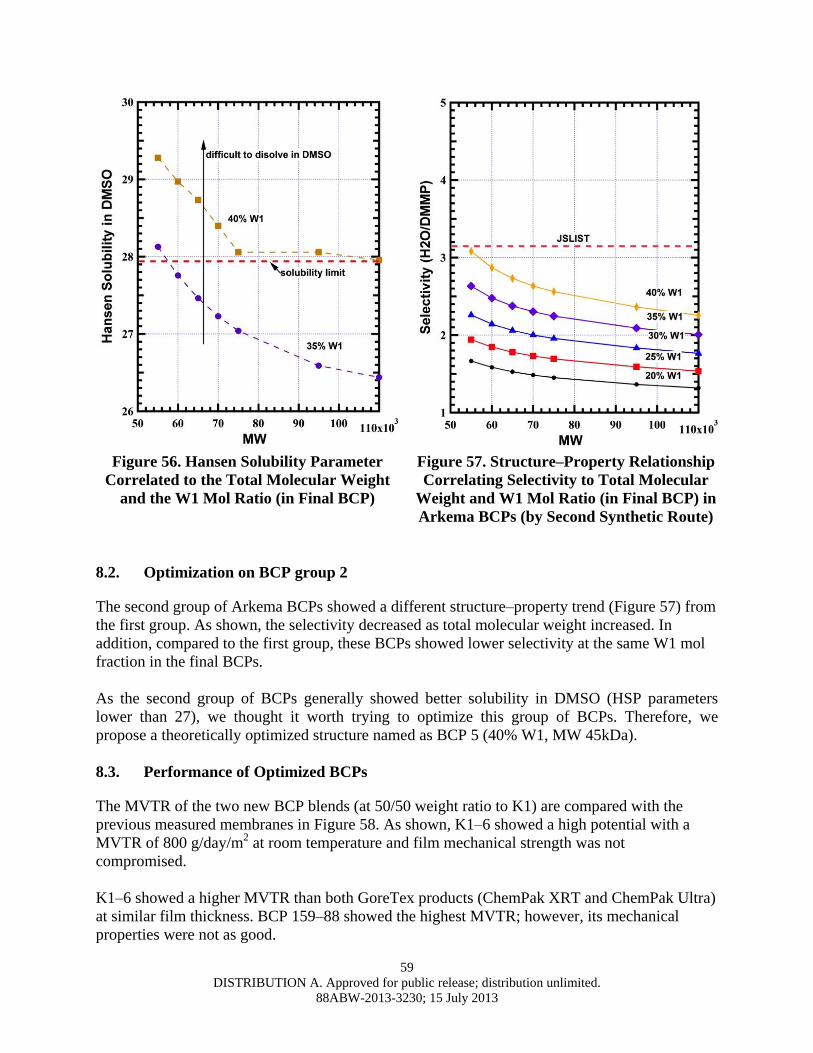
59
DISTRIBUTION A. Approved for public release; distribution unlimited.
88ABW-2013-3230; 15 July 2013
Figure 56. Hansen Solubility Parameter
Correlated to the Total Molecular Weight
and the W1 Mol Ratio (in Final BCP)
Figure 57. Structure–Property Relationship
Correlating Selectivity to Total Molecular
Weight and W1 Mol Ratio (in Final BCP) in
Arkema BCPs (by Second Synthetic Route)
8.2. Optimization on BCP group 2
The second group of Arkema BCPs showed a different structure–property trend (Figure 57) from
the first group. As shown, the selectivity decreased as total molecular weight increased. In
addition, compared to the first group, these BCPs showed lower selectivity at the same W1 mol
fraction in the final BCPs.
As the second group of BCPs generally showed better solubility in DMSO (HSP parameters
lower than 27), we thought it worth trying to optimize this group of BCPs. Therefore, we
propose a theoretically optimized structure named as BCP 5 (40% W1, MW 45kDa).
8.3. Performance of Optimized BCPs
The MVTR of the two new BCP blends (at 50/50 weight ratio to K1) are compared with the
previous measured membranes in Figure 58. As shown, K1–6 showed a high potential with a
MVTR of 800 g/day/m2 at room temperature and film mechanical strength was not
compromised.
K1–6 showed a higher MVTR than both GoreTex products (ChemPak XRT and ChemPak Ultra)
at similar film thickness. BCP 159–88 showed the highest MVTR; however, its mechanical
properties were not as good.
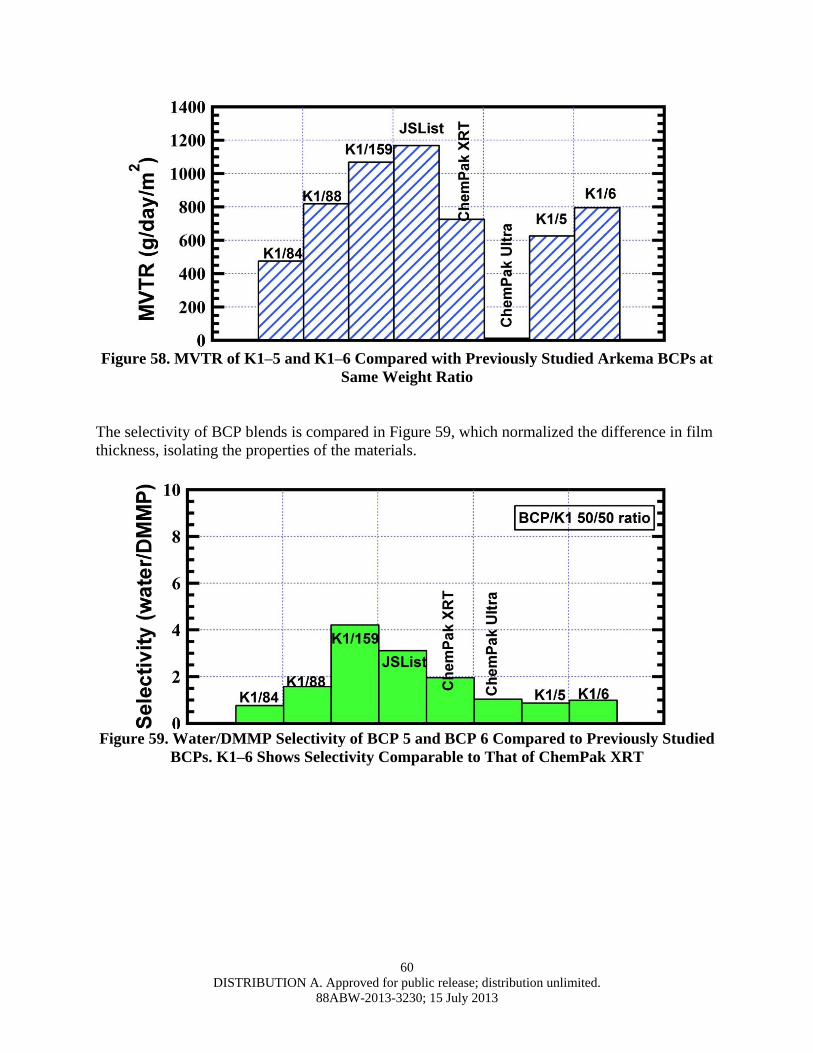
60
DISTRIBUTION A. Approved for public release; distribution unlimited.
88ABW-2013-3230; 15 July 2013
Figure 58. MVTR of K1–5 and K1–6 Compared with Previously Studied Arkema BCPs at
Same Weight Ratio
The selectivity of BCP blends is compared in Figure 59, which normalized the difference in film
thickness, isolating the properties of the materials.
Figure 59. Water/DMMP Selectivity of BCP 5 and BCP 6 Compared to Previously Studied
BCPs. K1–6 Shows Selectivity Comparable to That of ChemPak XRT
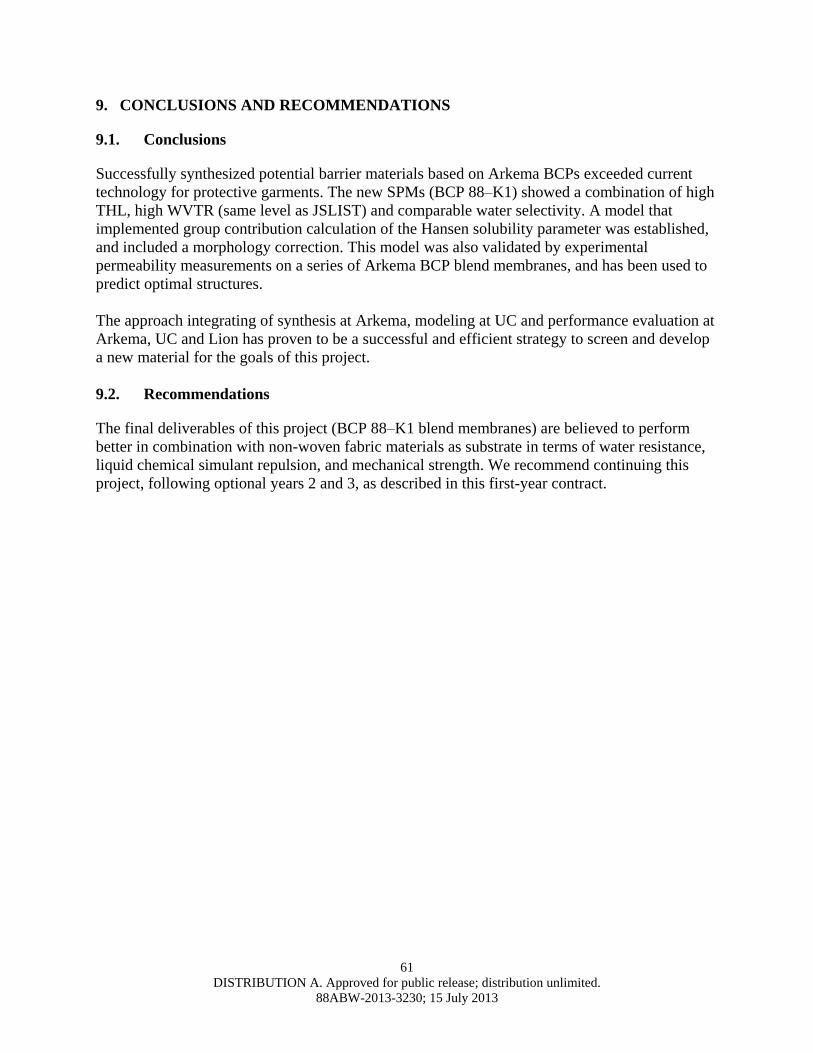
61
DISTRIBUTION A. Approved for public release; distribution unlimited.
88ABW-2013-3230; 15 July 2013
9. CONCLUSIONS AND RECOMMENDATIONS
9.1. Conclusions
Successfully synthesized potential barrier materials based on Arkema BCPs exceeded current
technology for protective garments. The new SPMs (BCP 88–K1) showed a combination of high
THL, high WVTR (same level as JSLIST) and comparable water selectivity. A model that
implemented group contribution calculation of the Hansen solubility parameter was established,
and included a morphology correction. This model was also validated by experimental
permeability measurements on a series of Arkema BCP blend membranes, and has been used to
predict optimal structures.
The approach integrating of synthesis at Arkema, modeling at UC and performance evaluation at
Arkema, UC and Lion has proven to be a successful and efficient strategy to screen and develop
a new material for the goals of this project.
9.2. Recommendations
The final deliverables of this project (BCP 88–K1 blend membranes) are believed to perform
better in combination with non-woven fabric materials as substrate in terms of water resistance,
liquid chemical simulant repulsion, and mechanical strength. We recommend continuing this
project, following optional years 2 and 3, as described in this first-year contract.
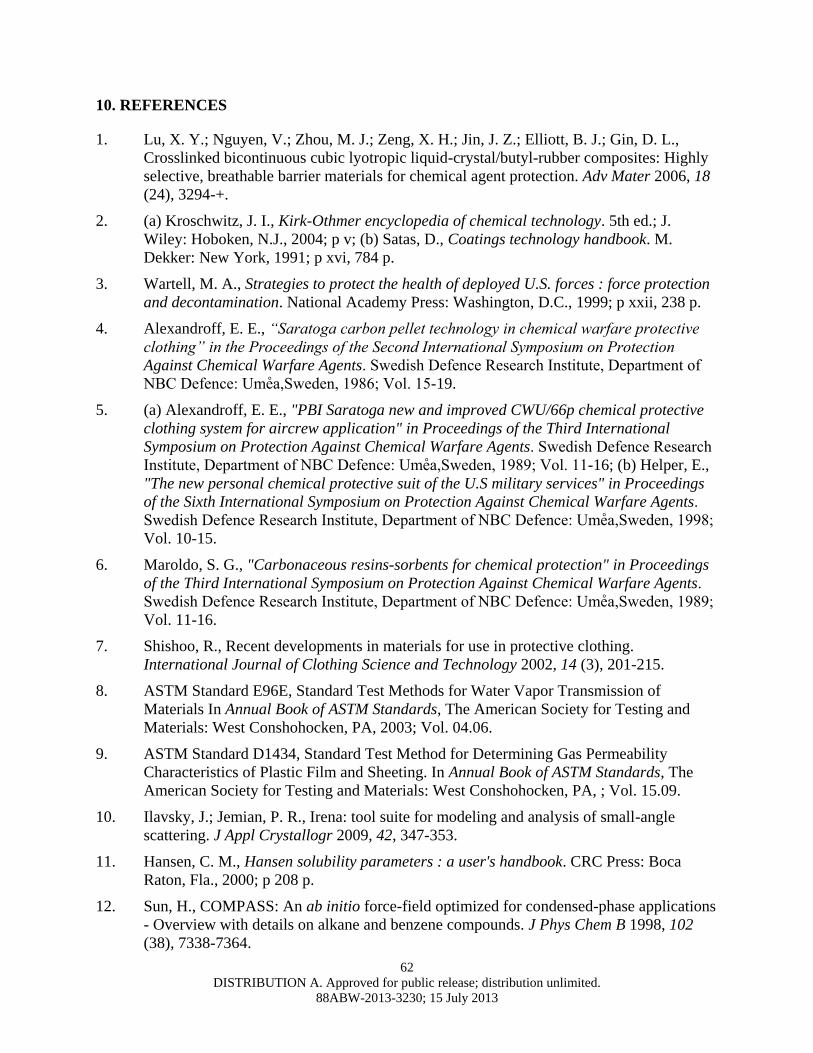
62
DISTRIBUTION A. Approved for public release; distribution unlimited.
88ABW-2013-3230; 15 July 2013
10. REFERENCES
1. Lu, X. Y.; Nguyen, V.; Zhou, M. J.; Zeng, X. H.; Jin, J. Z.; Elliott, B. J.; Gin, D. L.,
Crosslinked bicontinuous cubic lyotropic liquid-crystal/butyl-rubber composites: Highly
selective, breathable barrier materials for chemical agent protection. Adv Mater 2006, 18
(24), 3294-+.
2. (a) Kroschwitz, J. I., Kirk-Othmer encyclopedia of chemical technology. 5th ed.; J.
Wiley: Hoboken, N.J., 2004; p v; (b) Satas, D., Coatings technology handbook. M.
Dekker: New York, 1991; p xvi, 784 p.
3. Wartell, M. A., Strategies to protect the health of deployed U.S. forces : force protection
and decontamination. National Academy Press: Washington, D.C., 1999; p xxii, 238 p.
4. Alexandroff, E. E., “Saratoga carbon pellet technology in chemical warfare protective
clothing” in the Proceedings of the Second International Symposium on Protection
Against Chemical Warfare Agents. Swedish efence esearch nstitute, epartment of
BC efence Ume a,Sweden, 198 ol. 15-19.
5. (a) Alexandroff, E. E., "PBI Saratoga new and improved CWU/66p chemical protective
clothing system for aircrew application" in Proceedings of the Third International
Symposium on Protection Against Chemical Warfare Agents. Swedish efence esearch
nstitute, epartment of BC efence Ume a,Sweden, 1989 ol. 11-16; (b) Helper, E.,
"The new personal chemical protective suit of the U.S military services" in Proceedings
of the Sixth International Symposium on Protection Against Chemical Warfare Agents.
Swedish efence esearch nstitute, epartment of BC efence Ume a,Sweden, 1998
Vol. 10-15.
6. Maroldo, S. G., "Carbonaceous resins-sorbents for chemical protection" in Proceedings
of the Third International Symposium on Protection Against Chemical Warfare Agents.
Swedish efence esearch nstitute, epartment of BC efence Ume a,Sweden, 1989
Vol. 11-16.
7. Shishoo, R., Recent developments in materials for use in protective clothing.
International Journal of Clothing Science and Technology 2002, 14 (3), 201-215.
8. ASTM Standard E96E, Standard Test Methods for Water Vapor Transmission of
Materials In Annual Book of ASTM Standards, The American Society for Testing and
Materials: West Conshohocken, PA, 2003; Vol. 04.06.
9. ASTM Standard D1434, Standard Test Method for Determining Gas Permeability
Characteristics of Plastic Film and Sheeting. In Annual Book of ASTM Standards, The
American Society for Testing and Materials: West Conshohocken, PA, ; Vol. 15.09.
10. Ilavsky, J.; Jemian, P. R., Irena: tool suite for modeling and analysis of small-angle
scattering. J Appl Crystallogr 2009, 42, 347-353.
11. Hansen, C. M., Hansen solubility parameters : a user's handbook. CRC Press: Boca
Raton, Fla., 2000; p 208 p.
12. Sun, H., COMPASS: An ab initio force-field optimized for condensed-phase applications
- Overview with details on alkane and benzene compounds. J Phys Chem B 1998, 102
(38), 7338-7364.
63
DISTRIBUTION A. Approved for public release; distribution unlimited.
88ABW-2013-3230; 15 July 2013
LIST OF SYMBOLS, ABBREVIATIONS, AND ACRONYMS
ASTM 96E American Standard Test Methods for Water Vapor Transmission of
Materials
ASTM D1474 American Standard Test Methods for Determining Gas Permeability
Characteristics of Plastic Films and Sheeting.
Barrer permeability unit: 3.348 x 10⁻¹⁹
kmol m / (m2 s Pa)
BCP block copolymer
COMPASS Condensed-phase Optimized Molecular Potentials for Atomistic
Simulation Studies
CWA chemical warfare agent
DMMP dimethyl methylphosphonate
DMSO dimethyl sulfoxide
GCMC grand canonical Monte Carlo
GC gas chromatography
HPLC high-performance liquid chromatography
HSP Hansen solubility parameter
IPA isopropyl alcohol
ISO International Organization for Standardization
MS methyl salicylate
MVTR moisture vapor transport rate
NFPA National Fire Protection Association
NR neutron reflectivity
NPT ensemble using fixed values of number of atoms, pressure and temperature
RH relative humidity
SANS small-angle neutron scattering
SAXS small-angle X-ray scattering
SPM semipermeable membrane
TBP tributyl phosphate
THL total heat loss
WVTR water vapor transport rate (same as MVTR)
64
DISTRIBUTION A. Approved for public release; distribution unlimited.
88ABW-2013-3230; 15 July 2013
INDEX
Acetone Permeation, 7
Annealing, 6
BCP Synthesis, 3
Blend Membrane Preparation, 5
BlocBuilder, 3, 21, 23
Diffusion correction, 17, 56
free-radical polymerization, 3
Gas Chromatography, 13
Glass transition temperature, 14
global monomer conversion, 12
Hansen solubility parameter, 16, 59, 60, 62, 64
High-performance liquid chromatography (HPLC), 13
Humidity Chamber, 7
Mocon, 7, 30, 32, 34, 35, 46
Molecular dynamic, 16
Neutron reflectivity (NR), 14
NMR, 14, 20, 21, 24, 25, 30, 31
Permeation tests, 6
Route 1, 4, 20, 21, 30
Route 2, 4, 21, 22, 23, 24, 25, 26
Route 3, 4, 26, 28, 29
scattering length density, 15, 41, 43
Single gas permeability, 9, 53
Size exclusion chromatography, 13
Small angle neutron scattering, 14
Small Angle X-ray Scattering (SAXS), 15, 49
structural-property relationship, 16
Total Heal Loss, 11
Water/ DMMP mixture permeability, 10