Embed Size (px)
Citation preview
BUSINESS
CHEMICAL EARNINGS TUMBLE ONCE AGAIN Economic conditions conspire to torpedo fourth-quarter results; timing of recovery still uncertain WILLIAM J. STORCK, C&EN NORTHEAST NEWS BUREAU
IT S BEGINNING TO BE AN OLD REFRAIN.
The U.S. chemical industry is suffering from perhaps the worst confluence of events since the oil crisis of the 1970s. Then, it was high inflation and
interest rates, high raw material and energy costs, and slumping domestic demand that led to abysmal capacity utilization rates and declining prices.
This time around, take out the high inflation and interest rates. In their stead, substitute a strong dollar that has encouraged imports but dampened export markets to the point that the chemical trade balance was in the red a few months last year, as well as the economic aftermath of Sept. 11,2001, and the stage is set for bad profit news.
The result: Earnings in the fourth quarter for the 25 chemical companies regu
larly surveyed by C&EN declined 58% from the same period in the previous year. This is the worst drop of the current six-quarter earnings downturn, outpacing the year-to-year fall in the third quarter by five percentage points.
The last two quarters of 2001 increased the momentum of the downward slide in earnings for the entire 12 months—a 47% drop from 2000 to $4.72 billion for the same companies. Sales declined 7% to $115 billion, and the aggregate profit margin for the group fell to 4.1% from 7.2%.
The fourth-quarter economic situation for the chemical industry was as dismal as it had been all year. Prices for chemicals and allied products were, according to government data, down 2% compared with the same period in 2000. However, the important industrial chemicals segment,
which accounts for a huge portion of the 25 companies' results, saw prices decline a much greater 6%.
The same holds true for chemical production. Government data reveal that, while output for the entire chemical industry was off about 2% in the fourth quarter, production of industrial chemicals was down about 10%. Industrial chemical production has been rebounding slightly in recent months from midyear lows, however.
But as bad as the quarter was, some chemical company executives see a small bright spot. 'Ά11 in all, it was a reasonable quarter for Rohm and Haas," said Raj L. Gupta, the company's chairman and chief executive officer, in announcing results. "External markets continue to stabilize, and we are seeing solid demand for our newer products and technologies."This is despite a 30% earnings decline for the company in the quarter to $42.0 million.
OTHER COMPANIES are not so sanguine. A statement from Solutia, which lost $5.0 million in the quarter, said, "Recession-like demand and the effects of aggressive competitor actions in many of Solutia's global markets have more than offset the benefits of improving raw material and energy
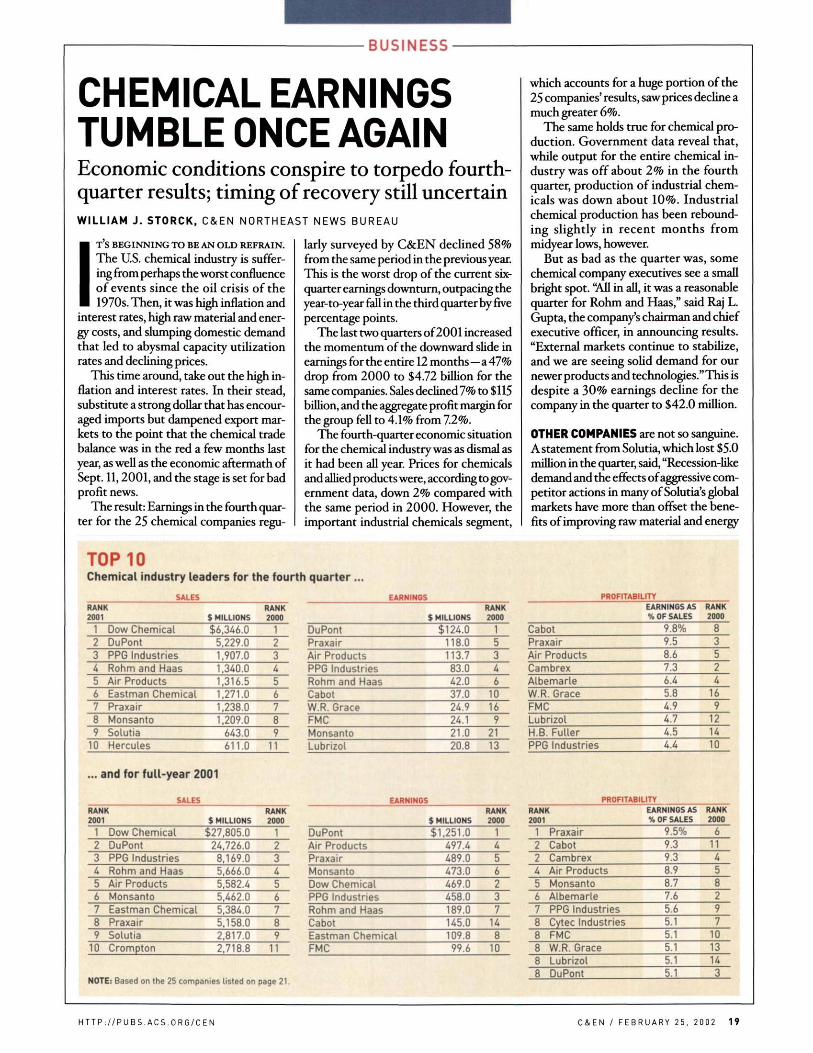
TOP 10 Chemical industry leaders for the fourth quarter ...
SALES RANK 2001
1 Dow Chemical 2 DuPont 3 PPG Industries 4 Rohm and Haas 5 Air Products 6 Eastman Chemical 7 Praxair 8 Monsanto 9 Solutia
10 Hercules
$ MILLIONS $6,346.0
5,229.0 1,907.0 1,340.0 1,316.5 1,271.0 1,238.0 1,209.0
643.0 611.0
... and for full-year 2001
SALES RANK 2001
1 Dow Chemical 2 DuPont 3 PPG Industries 4 Rohm and Haas 5 Air Products 6 Monsanto 7 Eastman Chemical 8 Praxair 9 Solutia
10 Crompton
$ MILLIONS $27,805.0
24,726.0 8,169.0 5,666.0 5,582.4 5,462.0 5,384.0 5,158.0 2,817.0 2,718.8
NOTE: Based on the 25 companies listed on
RANK 2000
1 2 3 4 5 6 7 8 9
11
RANK 2000
1 2 3 4 5 6 7 8 9
11
page 21.
DuPont Praxair Air Products PPG Industries Rohm and Haas Cabot W.R. Grace FMC Monsanto Lubrizol
DuPont Air Products Praxair Monsanto Dow Chemical PPG Industries Rohm and Haas Cabot
EARNINGS
$ MILLIONS $124.0
118.0 113.7 83.0 42.0 37.0 24.9 24.1 21.0 20.8
EARNINGS
$ MILLIONS $1,251.0
497.4 489.0 473.0 469.0 458.0 189.0 145.0
Eastman Chemical FMC 99.6
RANK 2000
1 5 3 4 6
10 16 9
21 13
RANK 2000
1 4 5 6 2 3 7
14 8
10
PROFITABILITY
Cabot Praxair Air Products Cambrex Albemarle W.R . Grace FMC Lubrizol H.B . Fuller PPG Industries
EARNINGS AS % OF SALES
9.8% 9.5 8.6 7.3 6.4 5.8 4.9 4.7 4.5 4.4
PROFITABILITY RANK 2001
1 2 2 4 5 6 7 8 8
00
CO
CO
Praxair Cabot Cambrex Air Products Monsanto Albemarle PPG Industries Cytec Industries FMC W.R. Grace Lubrizol DuPont
EARNINGS AS % OF SALES
9.5% 9.3 9.3 8.9 8.7 7.6 5.6 5.1 5.1 5.1 5.1 5.1
RANK 2000
8 3 5 2 4
16 9
12 14 10
RANK 2000
6 11 4 5 8 2 9 7
10 13 14 3
HTTP: / /PUBS.ACS.ORG/CEN C&EN / FEBRUARY 25, 2002 19
BUSINESS
G R O U N D R U L E S
Criteria For C&EN Earnings Analysis ^ ^ ^ &EN's quarterly
report on financial V ^ performance of the U.S. chemical industry contains data from 25 major U.S. basic chemical companies and from U oil and diversified companies, each with more than $200 million in annual chemical sales.
To be included in the table of basic chemical
producers, a company must have at least 50% of its sales in chemicals.
In referring to chemical sales, C&EN means sales of chemicals whose molecular composition has been changed during manufacture. Hence, these include traditional categories of basic petrochemicals and in
organics, organic intermediates and inorganic compounds, polymers such as plastics and fibers, and agricultural chemicals and specialty derivatives.
In listing earnings, the report gives after-tax income for continuing operations, excluding significant nonrecurring and extraordinary items.
costs and Solutia's $100 million cost reduction initiative."
Indeed, the overall chemical results reflect more Solutia than Rohm and Haas. For the quarter, the 25 chemical companies had total sales of $26.0 billion, down 11% from the final three months of 2000 . Earnings declined 58%, for a total of just $586 million. And the aggregate profit margin for the group was an abysmal 2.2%, less than half the already low 4.8% seen in the fourth quarter of the year before.
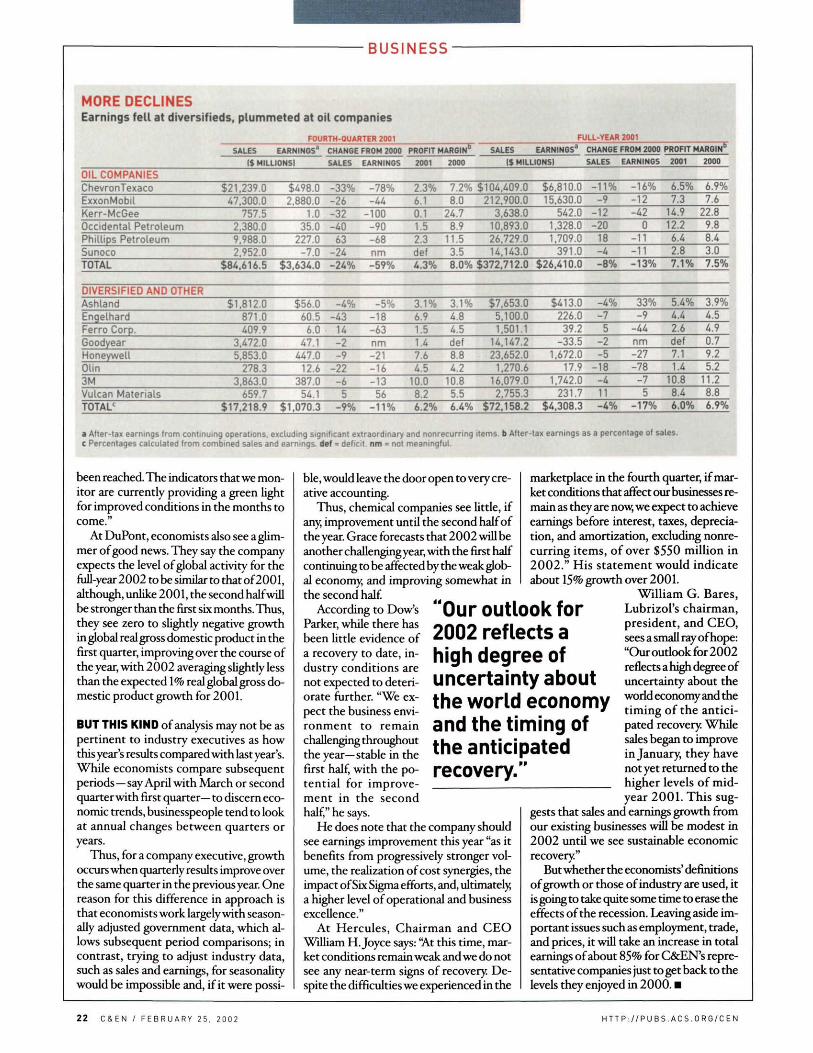
For six major oil and energy companies that produce chemicals, earnings for the quarter fell 59% to $3.63 billion on a sales decline of 24% to $84.6 billion, reducing profitability to 4.3% from 8.0%. For the full year, oil company earnings fell 13% to $26.4 billion as sales declined 8% to $373 billion. The aggregate profit margin for the six companies dropped to 7.1% from 7.5%.
Eight diversified companies did better, with only an 11% earnings decline to $1.07 billion as sales slid 9% to $ 17.2 billion. Profitability fell slightly to 6.2% from 6.4%.
The diversified producers' total earnings decline was moderated by modest declines at most of the firms. In addition, Goodyear came from a $16.5 million loss
in the fourth quarter of 2000 to a gain of $47.1 million at the end of last year, and Vulcan Materials' earnings rose 56% to $54.1 million. For all of 2001, earnings at these eight firms declined 17% to $4.31 billion as sales went down 4% to $72.2 billion. Profitability declined to 6.0% from 6.9%.
Of the 25 chemical companies, 18 had lower sales in the fourth quarter than they did in the same period in 2000. And 18 had lower earnings or showed losses for the period. Industry leader Dow Chemical had a loss of $12 million in the fourth quarter, compared with earnings of $171 million in the year-earlier quarter. And number two DuPont had a 75% earnings decline to $124 million. The combined $553 million year-to-year difference in quarterly earnings of these two industry giants represented 70% of the total dollar decline among the 25 companies.
At DuPont, after citing steps taken to meet "current and future challenges," Chairman and CEO Charles O. Holliday Jr. said, "Clearly more remains to be done for us to deliver competitively superior earnings performance —which we will do."
And in announcing DoVs results, Pres
ident and CEO Michael D. Parker said: "This has been one of the most challenging quarters that Dow has ever faced. The chemical industry has been, and is, facing the worst business environment in decades." He noted that 2001 began with a spike in feedstock and energy costs and was later marked by low margins and weak demand. "At the same time," he said, "Dow has had the added challenge of integrating Union Carbide and other strategic acquisitions."
IT WAS NOT all bad news in the fourth quarter, especially for some chemical companies that had shown poor results the year before. Monsanto's quarterly earnings, excluding unusual items, increased sevenfold to $21.0 million on 4% sales growth to $1.21 billion. The improvement came not from chemicals but from biotechnology Despite a decline in its agrochemical segment, Monsanto's seeds and genomics business unit went from a pretax loss of $134 million in the last three months of 2000 to a gain of $6 million in fourth-quarter 2001.
At WR. Grace, which is in bankruptcy to protect itself from asbestos liabilities and not because of financial performance, earnings more than doubled, rising 106% to $24.9 million, as sales improved 9% to $429 million. Demand was strong for catalysts and building materials, and the company benefited from acquisitions. Chairman, President, and CEO Paul J. Norris said, "Core results were better than last year's fourth quarter when we were battling a surprise downturn in the economy and high energy costs."
Cabot Corp. had a 37% increase in earnings to $37.0 million, but no thanks go to chemicals. Its tantalum business earned $34 million more in operating profits in the quarter than it did in the corresponding period of 2000, while its chemical business recorded a $14 million decline. The company said the weakness in the carbon black market has caused a decline in volumes for the past year.
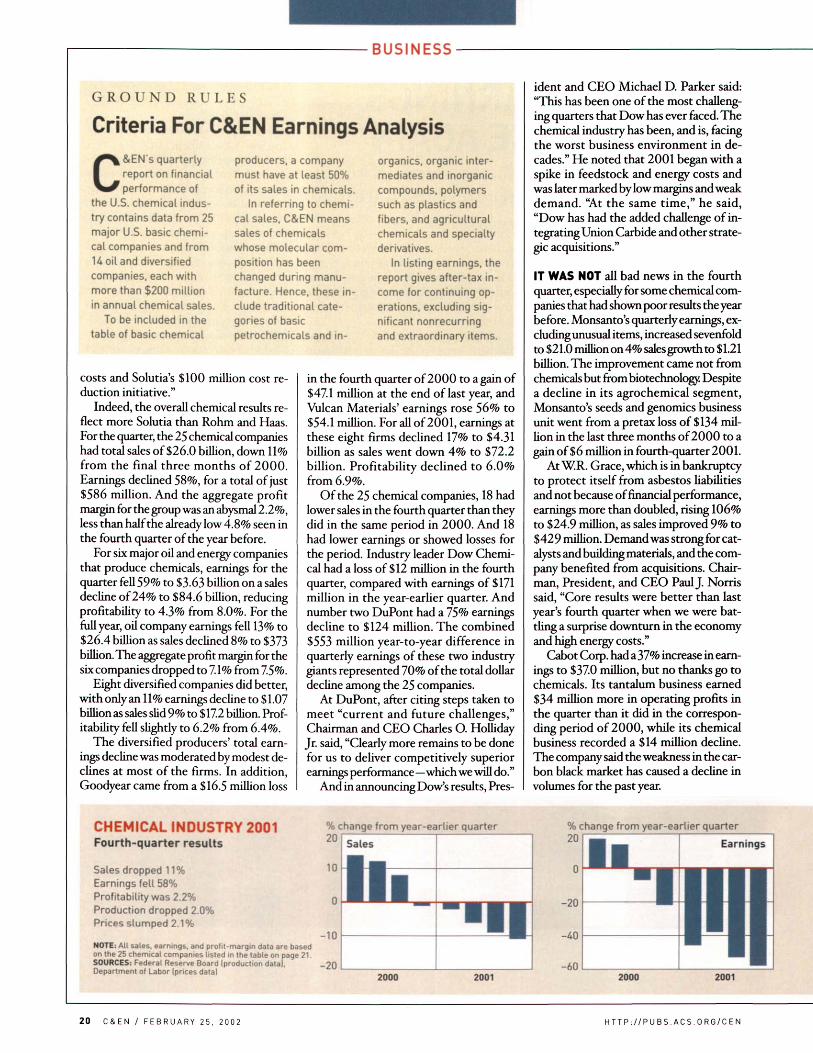
CHEMICAL INDUSTRY 2001 Fourth-quarter results
Sales dropped 11% Earnings fell 58% Profitability was 2.2% Production dropped 2.0% Prices slumped 2.1%
NOTE: All sales, earnings, and profit-margin data are based on the 25 chemical companies listed in the table on page 21. SOURCES: Federal Reserve Board (production data). Department of Labor (prices data)
% change from year-earlier quarter 20 I
10
-10
-20
Sales
""••J
% change from year-earlier quarter 20
-20
-40
-60
Earnings
UN • I
2000 2001 2000 2001
2 0 C & E N / F E B R U A R Y 2 5 . 2 0 0 2 H T T P : / / P U B S . A C S . O R G / C E N
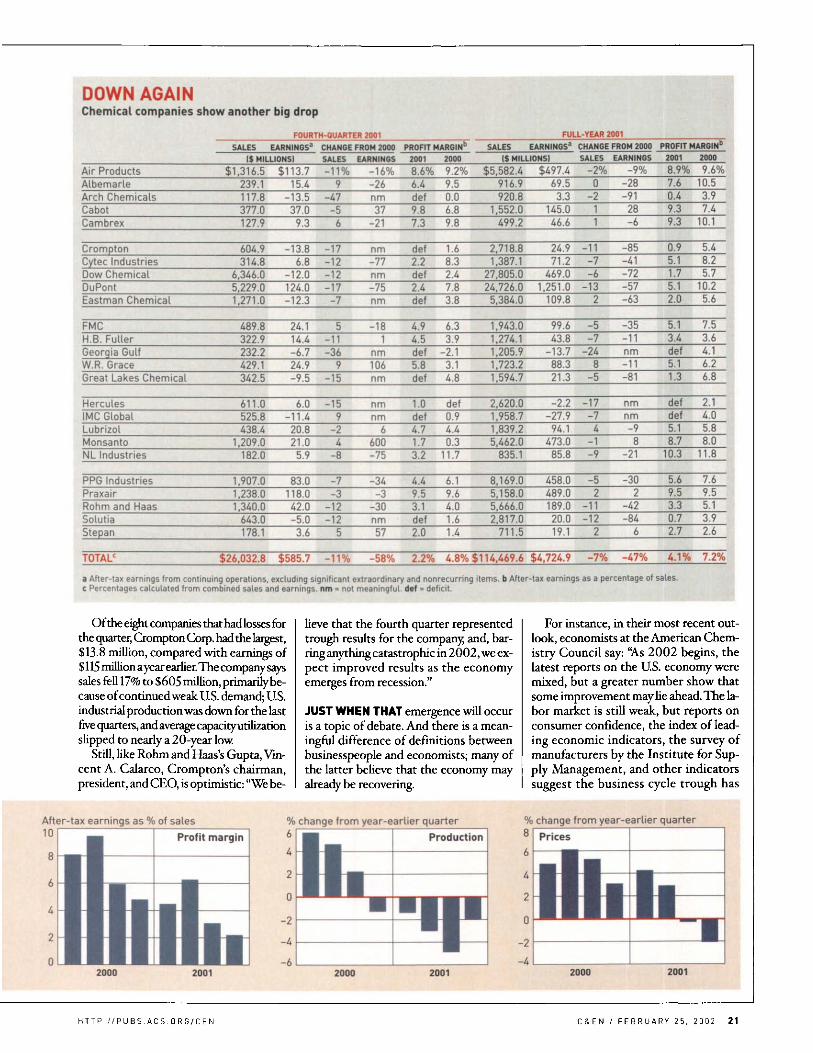
DOWN AGAIN Chemical companies show another big drop
FOURTH-QUARTER 2001 FULL-YEAR 2001
Air Products Albemarle Arch Chemicals Cabot Cambrex
SALES EARNINGS3
($ MILLIONS) $1,316.5
239.1 117.8 377.0 127.9
$113.7 15.4
-13.5 37.0 9.3
CHANGE FROM 2000 SALES EARNINGS -11%
9 -47 -5 6
-16% -26 nm 37
-21
PROFIT MARGINb
2001 2000 8.6% 6.4 def 9.8 7.3
9.2% 9.5 0.0 6.8 9.8
SALES EARNINGS3
($ MILLIONS) $5,582.4
916.9 920.8
1,552.0 499.2
$497.4 69.5 3.3
145.0 46.6
CHANGE FROM 2000 SALES EARNINGS
-2% 0
-2 1 1
-9% -28 -91 28 -6
PROFIT MARGIN" 2001 2000 8.9% 7.6 0.4 9.3 9.3
9.6% 10.5 3.9 7.4
10.1
Crompton Cytec Industries Dow Chemical DuPont Eastman Chemical
60Λ.9 3U.8
6.3Λ6.0 5,229.0 1,271.0
-13.8 6.8
-12.0 124.0 -12.3
-17 -12 -12 -17 -7
nm -77 nm -75 nm
def 2.2 def 2.4 def
1.6 8.3 2.4 7.8 3.8
2,718.8 1,387.1
27,805.0 24,726.0 5,384.0
24.9 71.2
469.0 1,251.0
109.8
-11 -7 -6
-13 2
-85 -41 -72 -57 -63
0.9 5.1 1.7 5.1 2.0
5.4 8.2 5.7
10.2 5.6
FMC H.B. Fuller Georgia Gulf W.R. Grace Great Lakes Chemical
489.8 322.9 232.2 429.1 342.5
24.1 14.4 -6.7 24.9 -9.5
5 -11 -36
9 -15
-18 1
nm 106 nm
4.9 4.5 def 5.8 def
6.3 3.9
-2.1 3.1 4.8
1,943.0 1,274.1 1,205.9 1,723.2 1,594.7
99.6 43.8
-13.7 88.3 21.3
-5 -7
-24 8
-5
-35 -11 nm -11 -81
5.1 3.4 def 5.1 1.3
7.5 3.6 4.1 6.2 6.8
Hercules IMC Global Lubrizol Monsanto NL Industries
611.0 525.8 438.4
1,209.0 182.0
6.0 -11.4 20.8 21.0 5.9
-15 9
-2 4
-8
nm nm
6 600 -75
1.0 def 4.7 1.7 3.2
def 0.9 4.4 0.3
11.7
2,620.0 1,958.7 1,839.2 5,462.0
835.1
-2.2 -27.9 94.1
473.0 85.8
-17 -7 4
-1 -9
nm nm -9 8
-21
def def 5.1 8.7
10.3
2.1 4.0 5.8 8.0
11.8
PPG Industries Praxair Rohm and Haas Solutia Stepan
1,907.0 1,238.0 1,340.0
643.0 178.1
83.0 118.0 42.0 -5.0 3.6
-7 -3
-12 -12
5
-34 -3
-30 nm 57
4.4 9.5 3.1 def 2.0
6.1 9.6 4.0 1.6 1.4
8,169.0 5,158.0 5,666.0 2,817.0
711.5
458.0 489.0 189.0 20.0 19.1
-5 2
-11 -12
2
-30 2
-42 -84
6
5.6 9.5 3.3 0.7 2.7
7.6 9.5 5.1 3.9 2.6
TOTALc $26,032.8 $585.7 -11% -58% 2.2% 4.8% $114,469.6 $4,724.9 -7% -47% 4.1% 7.2%
a After-tax earnings from continuing operations, excluding significant extraordinary and nonrecurring items, b After-tax earnings as a percentage of sales. c Percentages calculated from combined sales and earnings, nm = not meaningful, def = deficit.
Of the eight companies that had losses for the quarter, Crompton Corp. had the largest, $13.8 million, compared with earnings of $115 million ayear earlier. The company says sales fell 17% to $605 million, primarily because of continued weak U.S. demand; U.S. industrial production was down for the last five quarters, and average capacity utilization slipped to nearly a 20-year low.
Still, like Rohm and Haas's Gupta, Vincent A. Calarco, Crompton's chairman, president, and CEO, is optimistic: "We be
lieve that the fourth quarter represented trough results for the company, and, barring anything catastrophic in 2002, we expect improved results as the economy emerges from recession."
JUST WHEN THAT emergence will occur is a topic of debate. And there is a meaningful difference of definitions between businesspeople and economists; many of the latter believe that the economy may already be recovering.
For instance, in their most recent outlook, economists at the American Chemistry Council say: "As 2002 begins, the latest reports on the U.S. economy were mixed, but a greater number show that some improvement may lie ahead. The labor market is still weak, but reports on consumer confidence, the index of leading economic indicators, the survey of manufacturers by the Institute for Supply Management, and other indicators suggest the business cycle trough has
After-tax earnings as % of sales 10
> change f rom year-earl ier quarter
Profit margin
. . . .
% change f rom year-earl ier quarter 8
6
à
2
0
-2
Prices
- • • i n na MEEK "-ι
2000 2001 2000 2001 2000 2001
H T T P : / / P U B S . A C S . O R G / C E N C&EN / FEBRUARY 25, 2002 21
BUSINESS
MORE DECLINES Earnings fell at diversifieds, plummeted at oil companies
FOURTH-QUARTER 2001 FULL-YEAR 2001
SALES EARNINGS3 CHANGE FROM 2000 PROFIT MARGINb SALES EARNINGS3 CHANGE FROM 2000 PROFIT MARGIN^
1$ MILLIONS) SALES EARNINGS 2001 2000 IS MILLIONS) SALES EARNINGS 2001 2000
OIL COMPANIES ChevronTexaco $21,239.0 $498.0 -33% -78% 2.3% 7.2% $104,409.0 $6,810.0 -11% -16% 6.5% 6.9% ExxonMobil 47,300.0 2,880.0 -26 -44 6.1 8.0 212,900.0 15,630.0 -9 -12 7.3 7.6 Kerr-McGee 757.5 1.0 -32 -100 0.1 24.7 3,638.0 542.0 -12 -42 14.9 22.8 Occidental Petroleum 2,380.0 35.0 -40 -90 1.5 8.9 10,893.0 1,328.0 -20 0 12.2 9.8 Phillips Petroleum 9,988.0 227.0 63 -68 2.3 11.5 26,729.0 1,709.0 18 -11 6.4 8.4 Sunoco 2,952.0 -7.0 -24 nm def 3.5 14,143.0 391.0 -4 -11 2.8 3.0 TOTAL $84,616.5 $3,634.0 -24% -59% 4.3% 8.0% $372,712.0 $26,410.0 -8% -13% 7.1% 7.5%
DIVERSIFIED AND OTHER Ashland $1,812.0 $56.0 -4% -5% 3.1% 3.1% $7,653.0 $413.0 -4% 33% 5.4% 3.9% Engelhard 871.0 60.5 -43 -18 6.9 4.8 5,100.0 226.0 -7 -9 4.4 4.5 Ferro Corp. 409.9 6.0 14 -63 1.5 4.5 1,501.1 39.2 5 -44 2.6 4.9 Goodyear 3,472.0 47.1 -2 nm 1.4 def 14,147.2 -33.5 -2 nm def 0.7 Honeywell 5,853.0 447.0 -9 -21 7.6 8.8 23,652.0 1,672.0 -5 -27 7.1 9.2 Olin 278.3 12.6 -22 -16 4.5 4.2 1,270.6 17.9 -18 -78 1.4 5.2 3M 3,863.0 387.0 -6 -13 10.0 10.8 16,079.0 1,742.0 -4 -7 10.8 11.2 Vulcan Materials 659.7 54.1 5 56 8.2 5.5 2,755.3 231.7 11 5 8.4 8.8 TOTALc $17,218.9 $1,070.3 -9% -11% 6.2% 6.4% $72,158.2 $4,308.3 -4% -17% 6.0% 6.9%
ding significant extraordinary and nonrecurring items, b After-tax earnings as a percentage of sales. rnings. def = deficit, nm = not meaningful.
a After-tax earnings from continuing operations, exclu c Percentages calculated from combined sales and eai
been reached. The indicators that we monitor are currently providing a green light for improved conditions in the months to come."
At DuPont, economists also see a glimmer of good news. They say the company expects the level of global activity for the full-year 2002 to be similar to that of 2001, although, unlike 2001, the second half will be stronger than the first six months. Thus, they see zero to slightly negative growth in global real gross domestic product in the first quarter, improving over the course of the year, with 2002 averaging slightly less than the expected 1% real global gross domestic product growth for 2001.
BUT THIS KIND of analysis may not be as pertinent to industry executives as how this year's results compared with last year's. While economists compare subsequent periods—say April with March or second quarter with first quarter— to discern economic trends, businesspeople tend to look at annual changes between quarters or years.
Thus, for a company executive, growth occurs when quarterly results improve over the same quarter in the previous year. One reason for this difference in approach is that economists work largely with seasonally adjusted government data, which allows subsequent period comparisons; in contrast, trying to adjust industry data, such as sales and earnings, for seasonality would be impossible and, if it were possi
ble, would leave the door open to very creative accounting.
Thus, chemical companies see little, if any, improvement until the second half of the year. Grace forecasts that 2002 will be another challenging year, with the first half continuing to be affected by the weak global economy, and improving somewhat in the second half.
According to DoVs Parker, while there has been little evidence of a recovery to date, industry conditions are not expected to deteriorate further. "We expect the business environment to remain challenging throughout the year—stable in the first half, with the potential for improvement in the second half," he says.
He does note that the company should see earnings improvement this year "as it benefits from progressively stronger volume, the realization of cost synergies, the impact of Six Sigma efforts, and, ultimately, a higher level of operational and business excellence."
At Hercules, Chairman and CEO William H.Joyce says: 'At this time, market conditions remain weak and we do not see any near-term signs of recovery Despite the difficulties we experienced in the
marketplace in the fourth quarter, if market conditions that affect our businesses remain as they are now, we expect to achieve earnings before interest, taxes, depreciation, and amortization, excluding nonrecurring items, of over $550 million in 2002 ." His statement would indicate about 15% growth over 2001.
William G. Bares, Lubrizol's chairman, president, and CEO, sees a small ray of hope: "Our outlook for 2002 reflects a high degree of uncertainty about the world economy and the timing of the anticipated recovery While sales began to improve in January, they have not yet returned to the higher levels of midyear 2001 . This sug
gests that sales and earnings growth from our existing businesses will be modest in 2002 until we see sustainable economic recovery"
But whether the economists, definitions of growth or those of industry are used, it is going to take quite some time to erase the effects of the recession. Leaving aside important issues such as employment, trade, and prices, it will take an increase in total earnings of about 85% for C&EN's representative companies just to get back to the levels they enjoyed in 2000. •
Our outlook for 2002 reflects a high degree of uncertainty about the world economy and the timing of the anticipated recovery."
22 C&EN / FEBRUARY 25, 2002 H T T P : / / P U B S . A C S . O R G / C E N