Embed Size (px)
DESCRIPTION
Jeong-Eun Lee Kyung Hee University University of Texas at Austin. Chemical effects on ices: studies with a chemo-dynamical model. Contents:. Very Low Luminosity Objects ( VeLLOs , L
Citation preview
Chemical effects on ices:studies with a chemo-dynamical
model
Jeong-Eun LeeKyung Hee University
University of Texas at Austin
Contents:
Very Low Luminosity Objects (VeLLOs, L<0.1L) Episodic accretion & Chemistry (Lee 2007)
CO2 ice in Low Luminosity Objects (L<1L) Kim et al. (2012)
Lee et al. (2004) -chemo-dynamical model Dunham et al. (2010) -luminosity model of episodic accretion
Other ices Surface chemistry with the model of Lee (2007)
VeLLOs
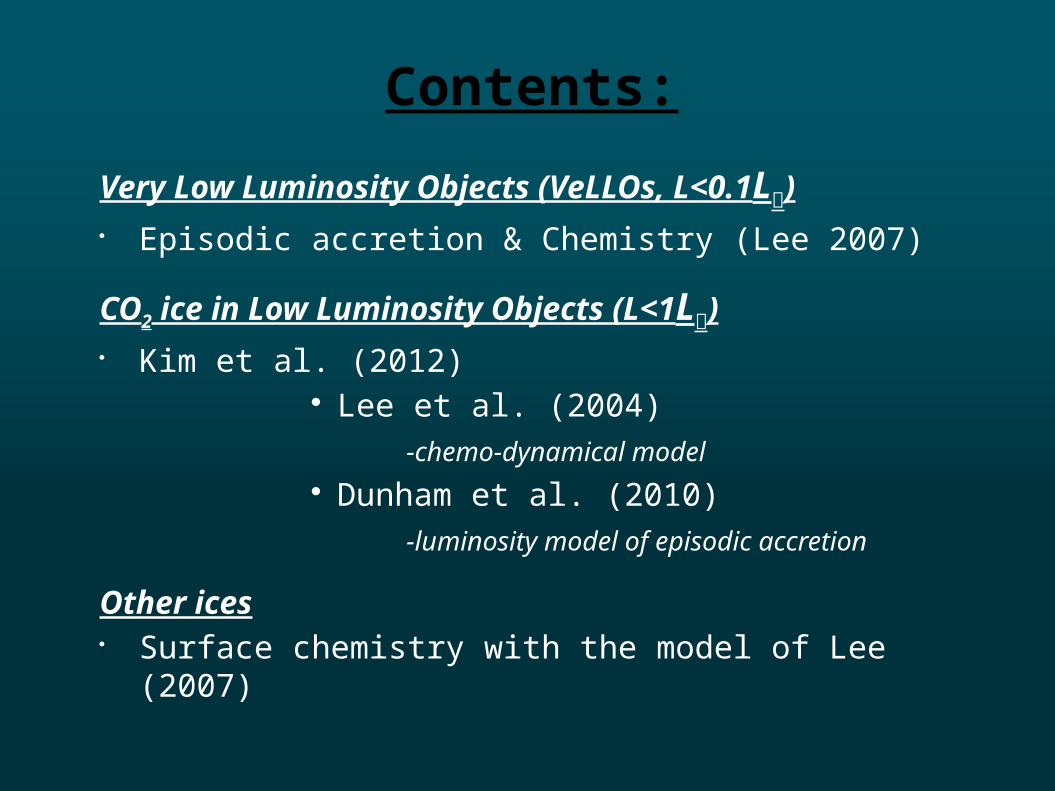
Protostars in the quiescent phase or Proto-brown dwarfs?
▸ If VeLLOs had a constant low accretion rate through their evolution, chemistry must be similar to that of starless cores• Depletion of CO, centrally peaked N2H+, high level of deuteration
▸ If VeLLOs are in their quiescent phase after accretion bursts, they will be different from either Class 0/I or starless cores in chemical distributions (Lee 2007, Visser & Bergin 2012)
▸ Therefore, chemistry can be used as a fingerprint of episodic accretion.
▸ A possible example of episodic accretion – IRAM 04191
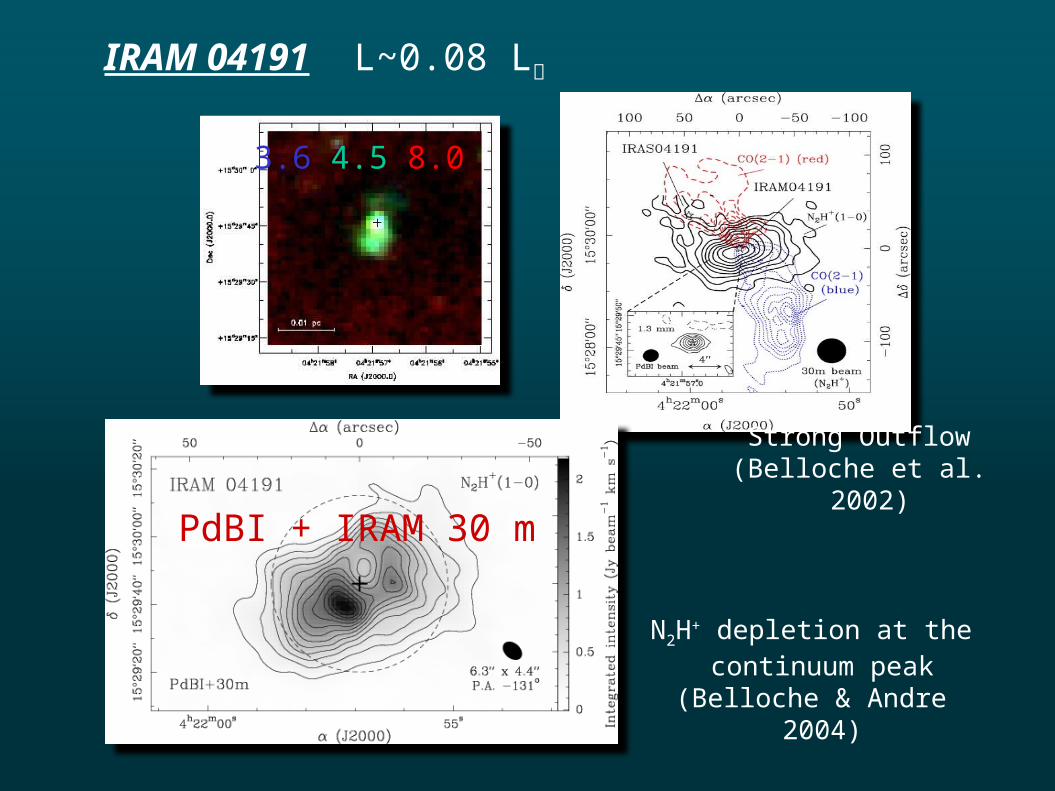
IRAM 04191 L~0.08 L
Strong Outflow(Belloche et al. 2002)
N2H+ depletion at the continuum peak
(Belloche & Andre 2004)
PdBI + IRAM 30 m
3.6 4.5 8.0
Chemo-Dynamical Model
Lee, et al (2004)
Evolution Model of Luminosity
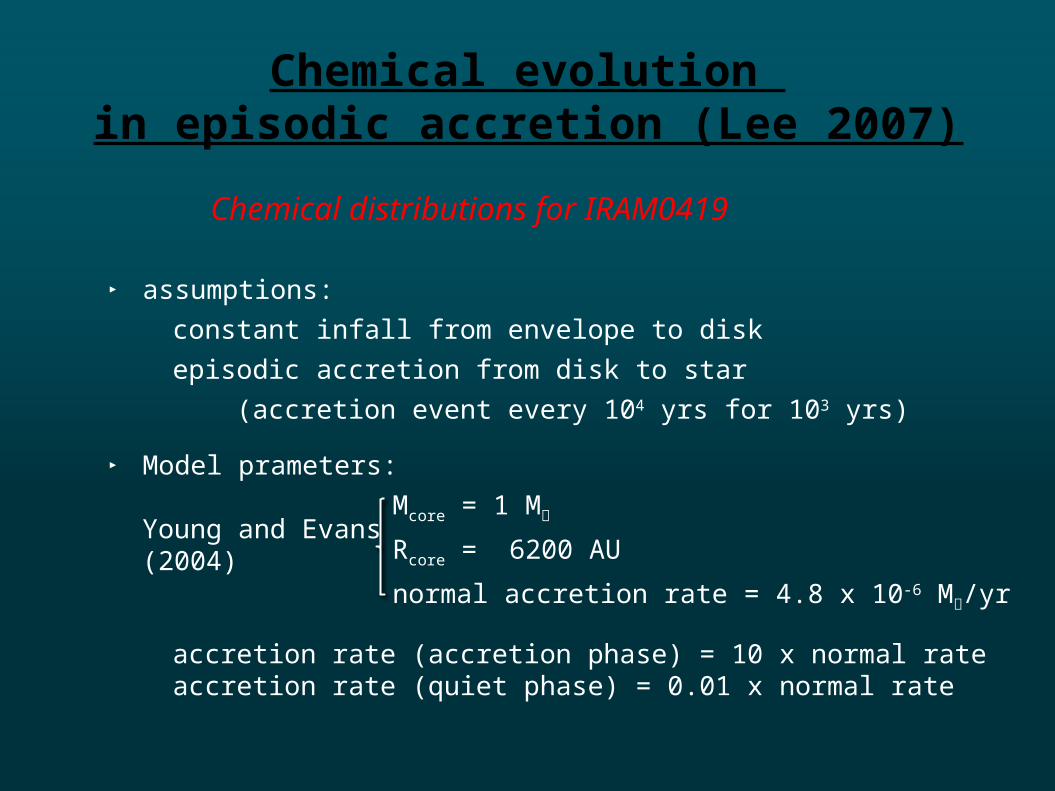
Chemical evolution in episodic accretion (Lee 2007)
Chemical distributions for IRAM0419
▸ assumptions:
constant infall from envelope to disk
episodic accretion from disk to star
(accretion event every 104 yrs for 103 yrs)
▸ Model prameters:
Mcore = 1 M
Rcore = 6200 AU
normal accretion rate = 4.8 x 10⁻⁶ M/yr
accretion rate (accretion phase) = 10 x normal rateaccretion rate (quiet phase) = 0.01 x normal rate
Young and Evans (2004)
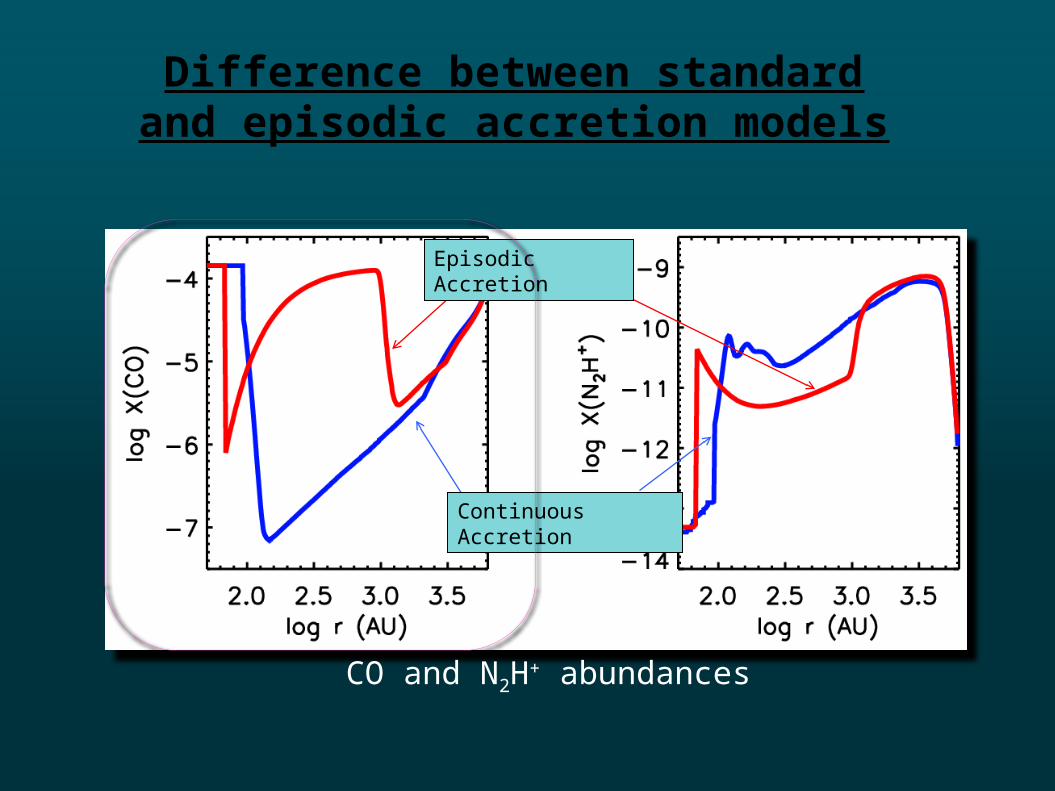
Difference between standard and episodic accretion models
Episodic Accretion
Continuous Accretion
CO and N2H+ abundances
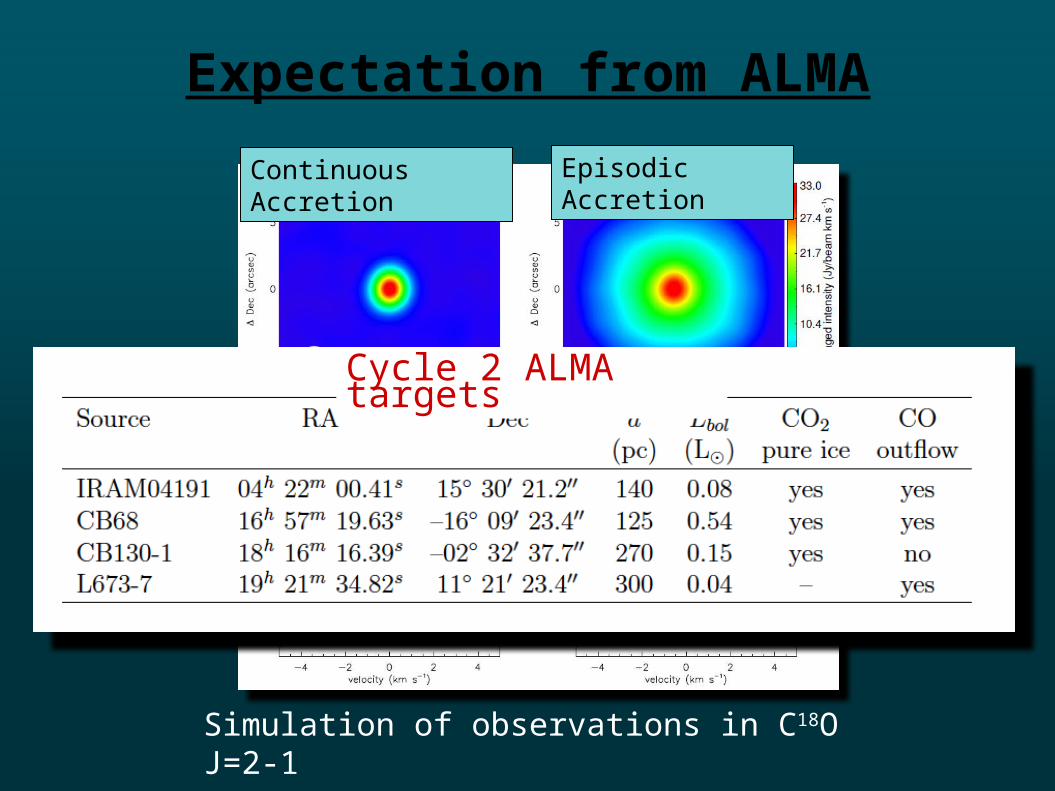
Expectation from ALMA
Simulation of observations in C18O J=2-1
Episodic Accretion
Continuous Accretion
Band6C34-1Θ=2”
Cycle 2 ALMA targets
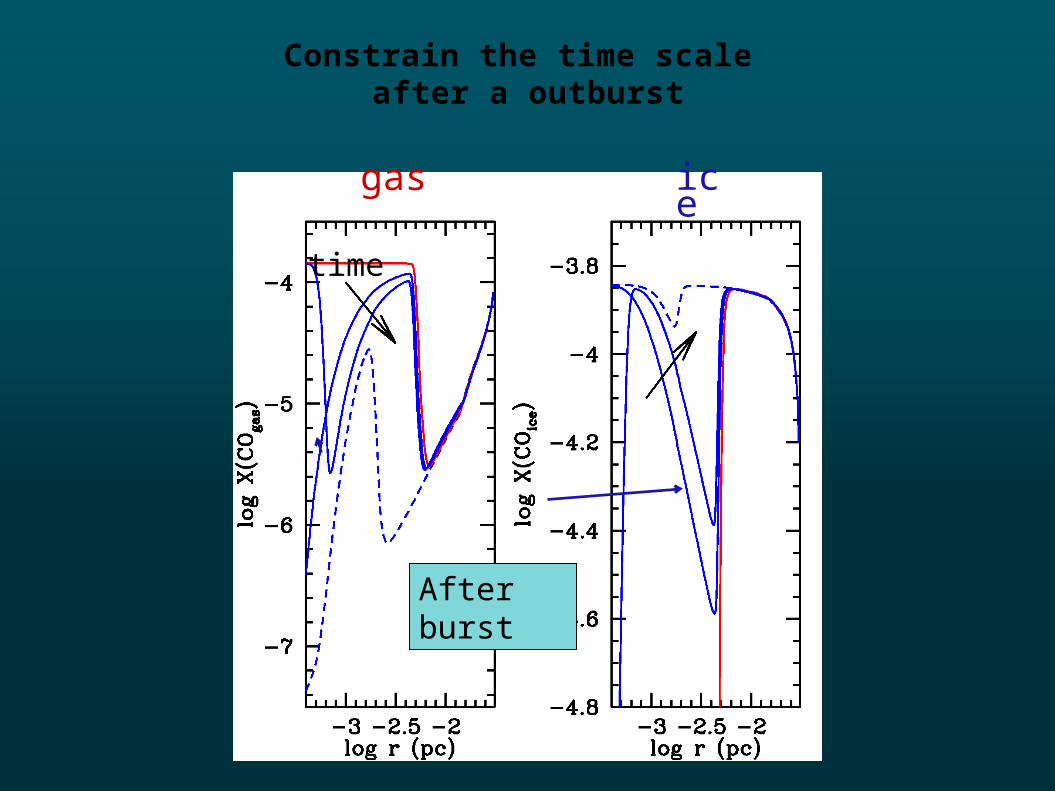
Constrain the time scale after a outburst
After burst
time
gas ice
Caveat; No consideration of surface chemistry
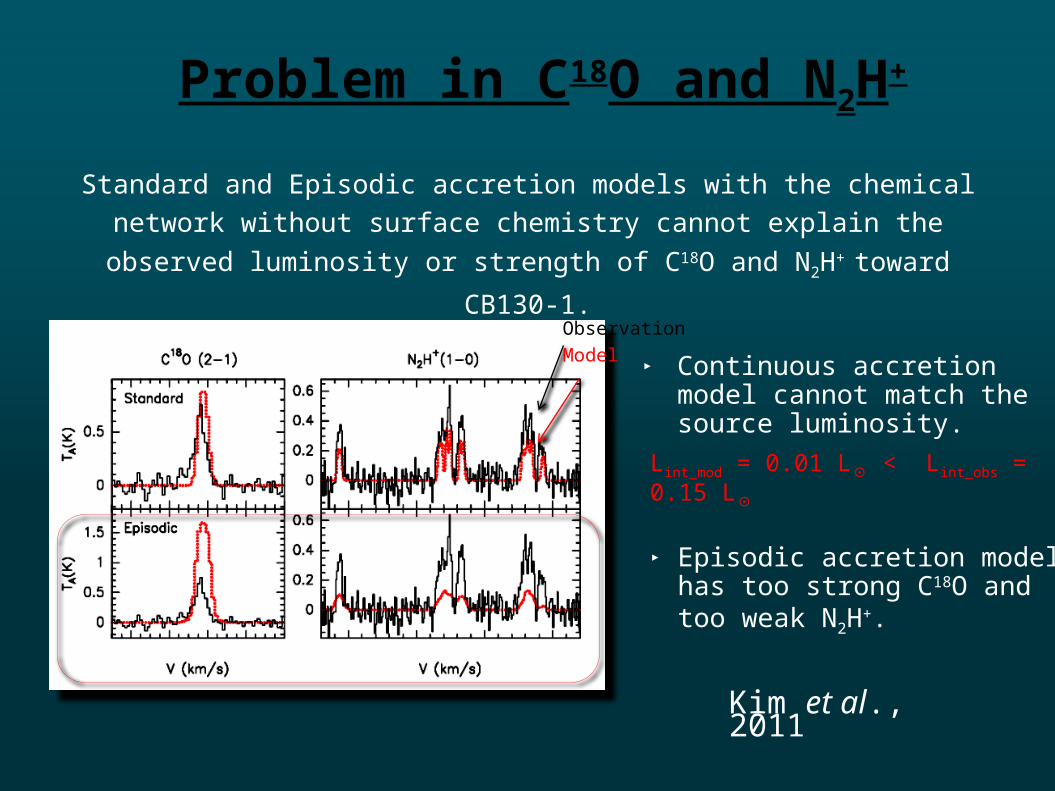
ObservationModel
Problem in C18O and N2H+
Standard and Episodic accretion models with the chemical network without surface chemistry cannot explain the observed luminosity or
strength of C18O and N2H+ toward CB130-1.
▸ Continuous accretion model cannot match the source luminosity.
▸ Episodic accretion model has too strong C18O and too weak N2H+.
Kim et al., 2011
Lint_mod = 0.01 L⊙ < Lint_obs = 0.15 L⊙
A possible solution; part of CO gas gets converted to CO2 ice when it is frozen on to grain
surfaces.
CO2 is a useful constraint for episodic accretion because of its distinct pure ice feature.
DUST
CO2
CO2
CO2
COCO
CO
DUST
CO2
CO2
CO2
COCO
CO
CO2
CO2
CO2
H2O
H2OH2O
H2O
DUST DUST
H2OH2O
H2O
H2O
CO2
CO2
CO2
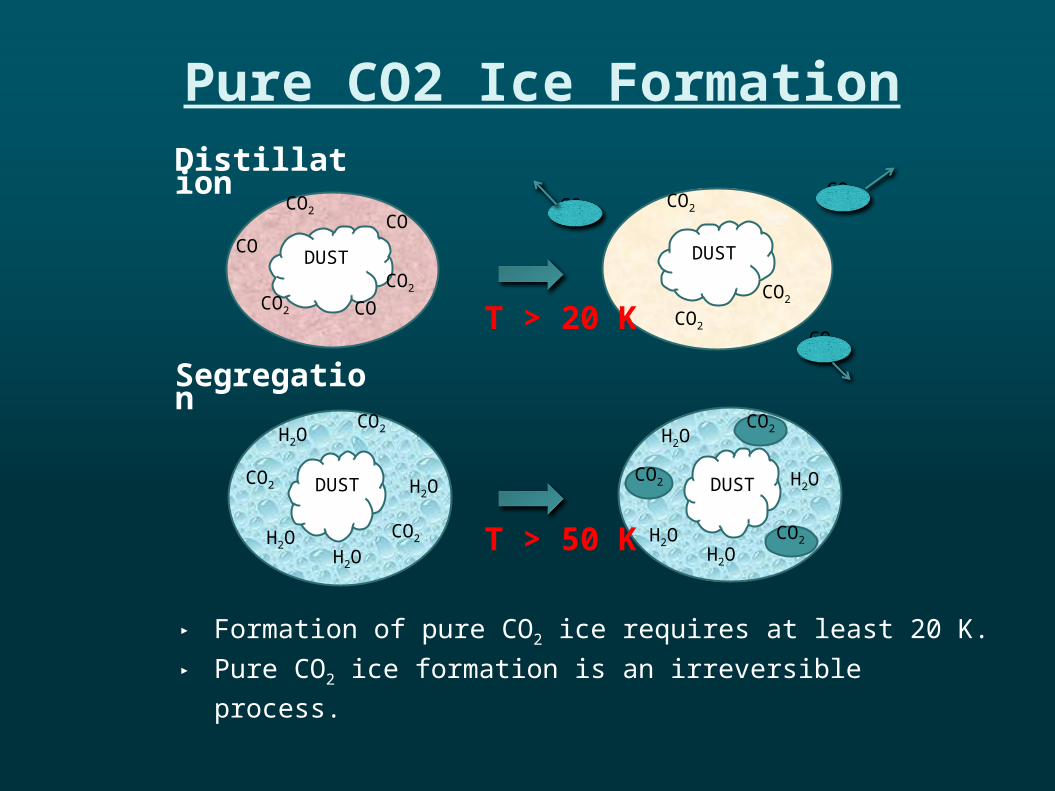
Distillation
Segregation
T > 20 K
T > 50 K
▸ Formation of pure CO2 ice requires at least 20 K.▸ Pure CO2 ice formation is an irreversible process.
Pure CO2 Ice Formation
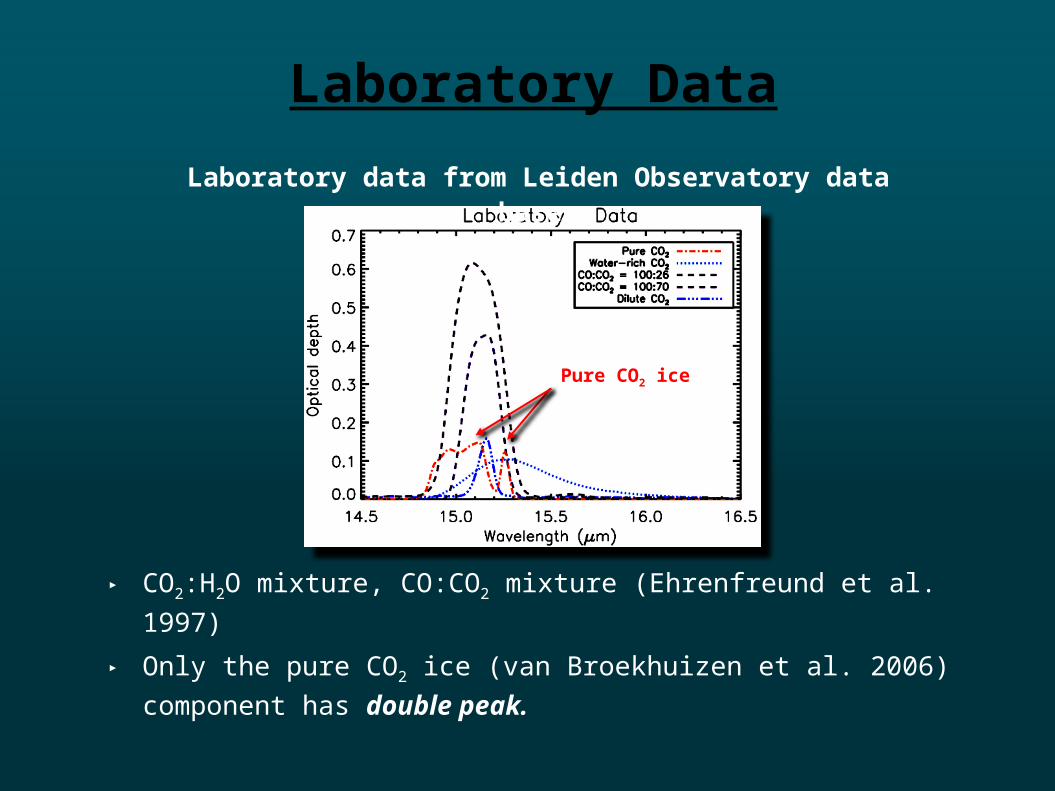
Laboratory Data
▸ CO2:H2O mixture, CO:CO2 mixture (Ehrenfreund et al. 1997)
▸ Only the pure CO2 ice (van Broekhuizen et al. 2006)
component has double peak.
Laboratory data from Leiden Observatory data base.
Pure CO2 ice
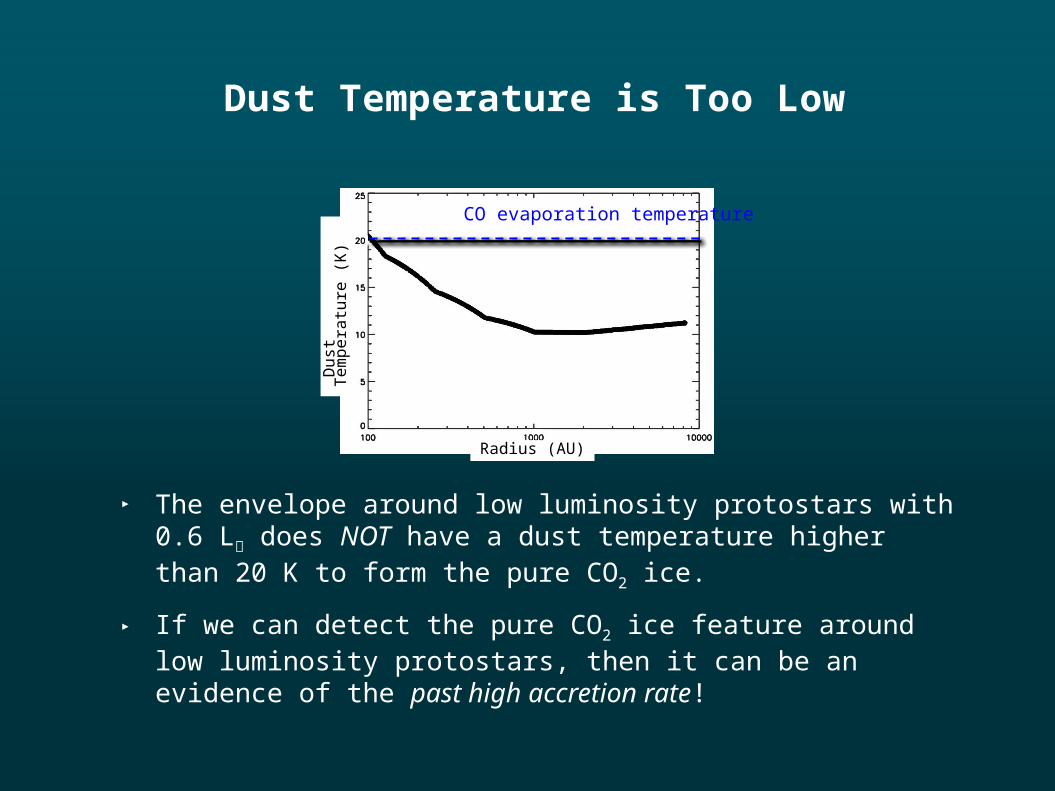
Dust Temperature is Too Low
▸ The envelope around low luminosity protostars with 0.6 L does NOT have a dust temperature higher than 20 K to form the pure CO2 ice.
▸ If we can detect the pure CO2 ice feature around low luminosity protostars, then it can be an evidence of the past high accretion rate!
Radius (AU)
Dust
Tem
pera
ture
(K
)
CO evaporation temperature
Observation
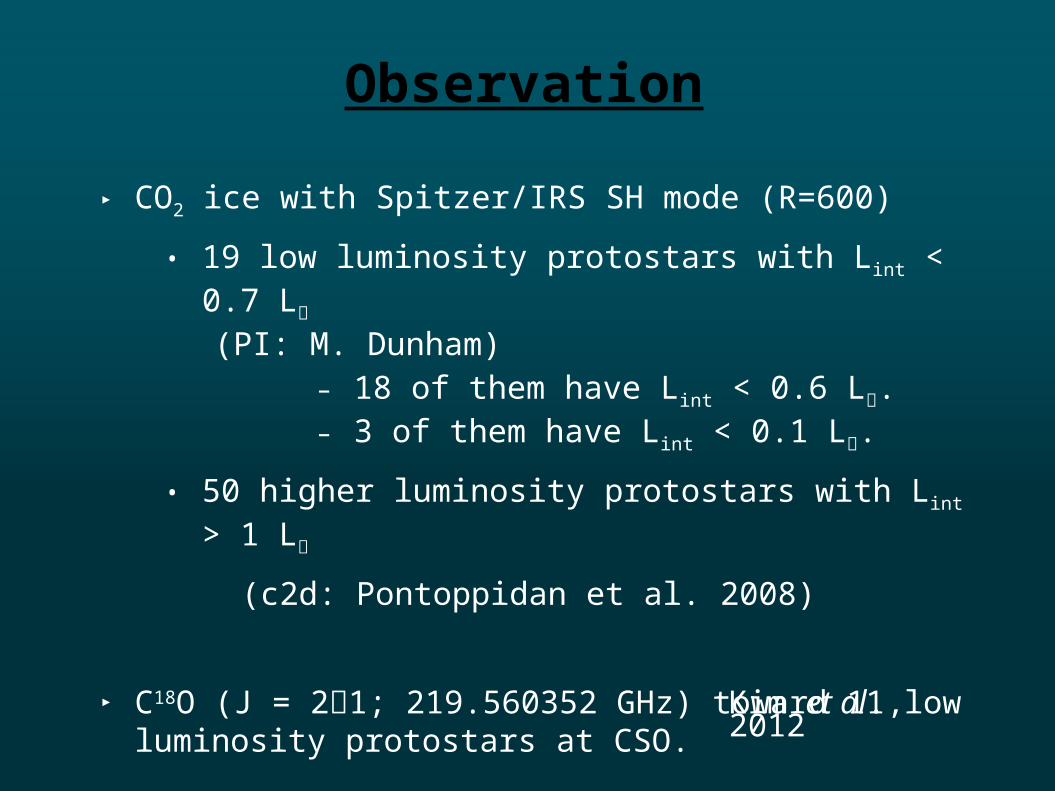
▸ CO2 ice with Spitzer/IRS SH mode (R=600)
• 19 low luminosity protostars with Lint < 0.7 L
(PI: M. Dunham)– 18 of them have Lint < 0.6 L.– 3 of them have Lint < 0.1 L.
• 50 higher luminosity protostars with Lint > 1 L
(c2d: Pontoppidan et al. 2008)
▸ C18O (J = 21; 219.560352 GHz) toward 11 low lu-minosity protostars at CSO.
Kim et al., 2012
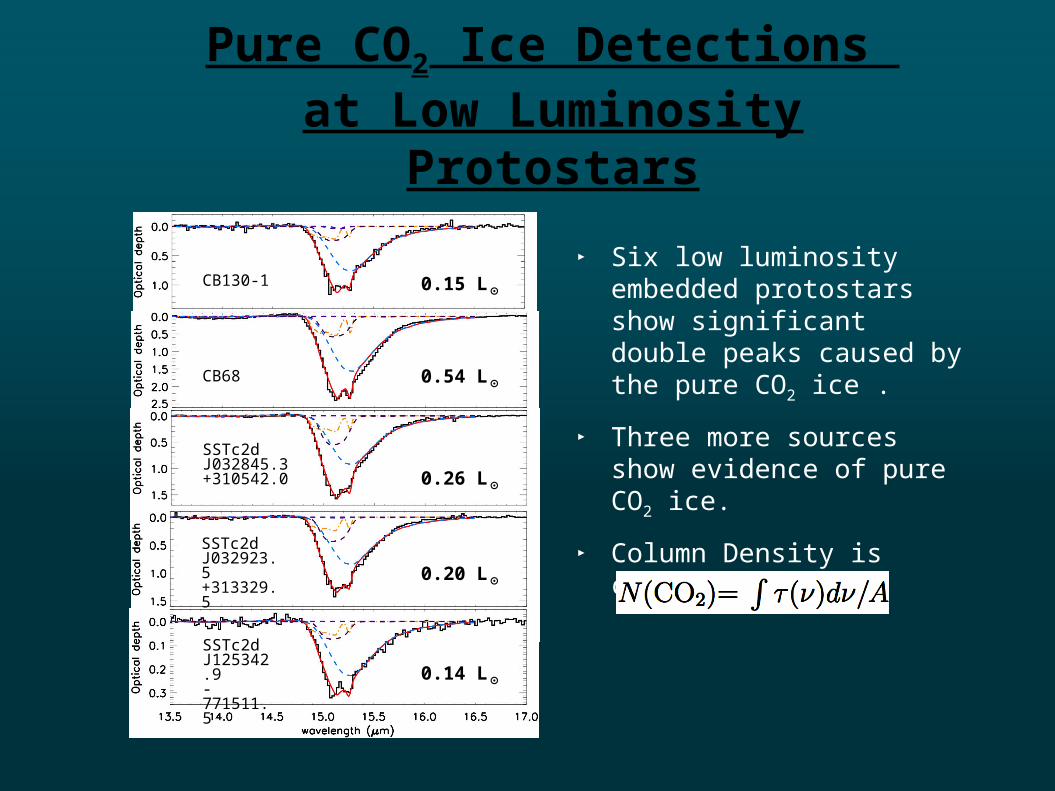
Pure CO2 Ice Detections at Low Luminosity Proto-
stars
▸ Six low luminosity embedded protostars show significant double peaks caused by the pure CO2 ice .
▸ Three more sources show evidence of pure CO2 ice.
▸ Column Density is calculated
CB68
SSTc2d J125342.9-771511.5
CB130-1
SSTc2d J032845.3+310542.0
SSTc2d J032923.5+313329.5
0.15 L⊙
0.54 L⊙
0.14 L⊙
0.26 L⊙
0.20 L⊙
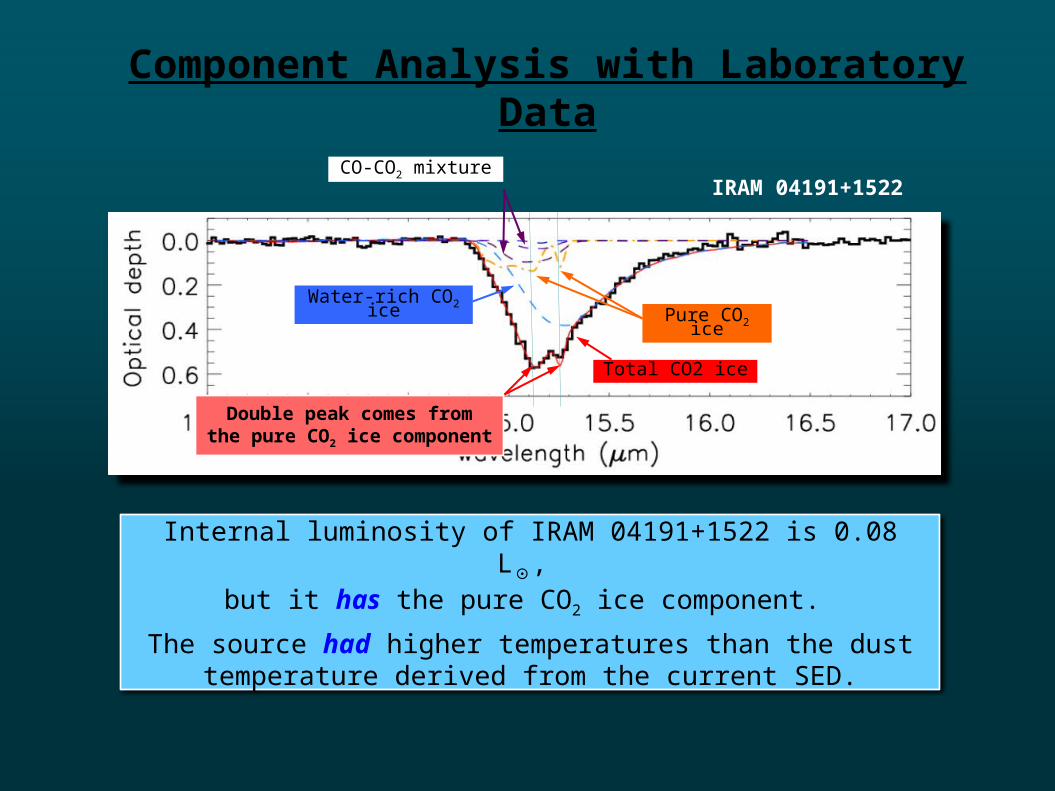
Component Analysis with Laboratory Data
Pure CO2 ice
Water-rich CO2 ice
CO-CO2 mixture
Internal luminosity of IRAM 04191+1522 is 0.08 L⊙, but it has the pure CO2 ice component.
The source had higher temperatures than the dust temperature derived from the current SED.
Double peak comes from the pure CO2 ice
component
Total CO2 ice
IRAM 04191+1522
Tests with Chemo-dynamical Mod-
els▸ Chemo-dynamical models
– Continuous accretion + chemical network without surface chemistry– Continuous accretion + CO to CO2 ice conversion
– Episodic accretion + chemical network without surface chemistry– Episodic accretion + CO to CO2 ice conversion
Kim et al., 2012
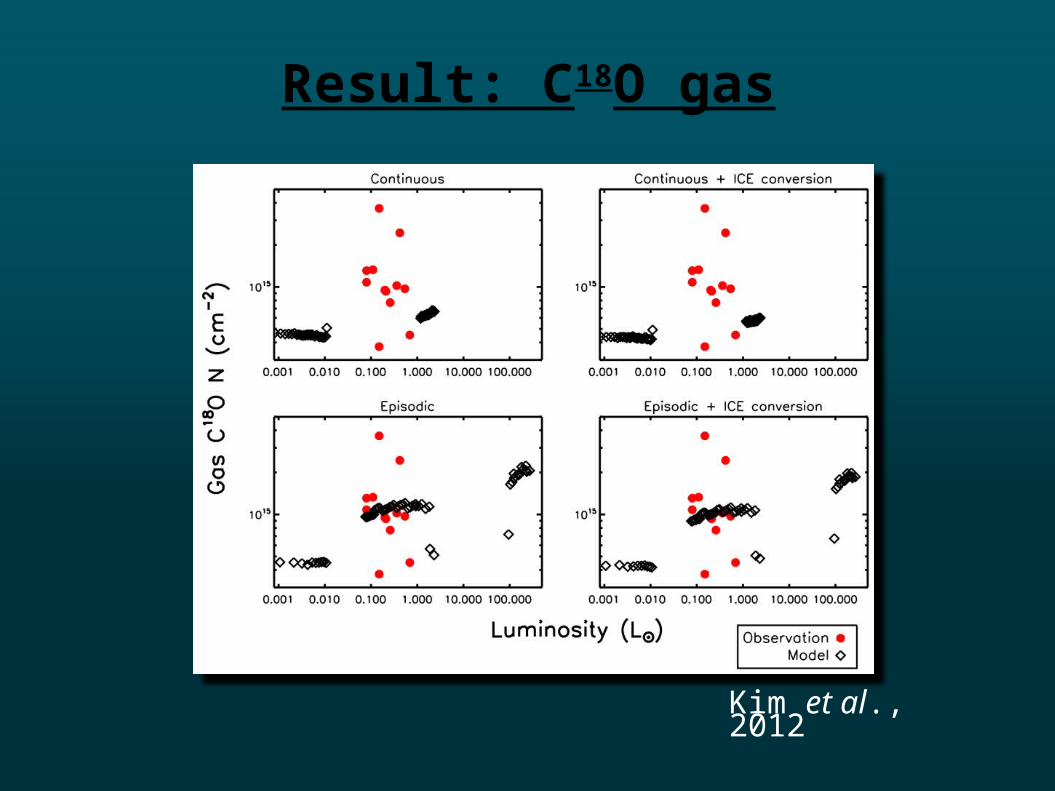
Result: C18O gas
Kim et al., 2012
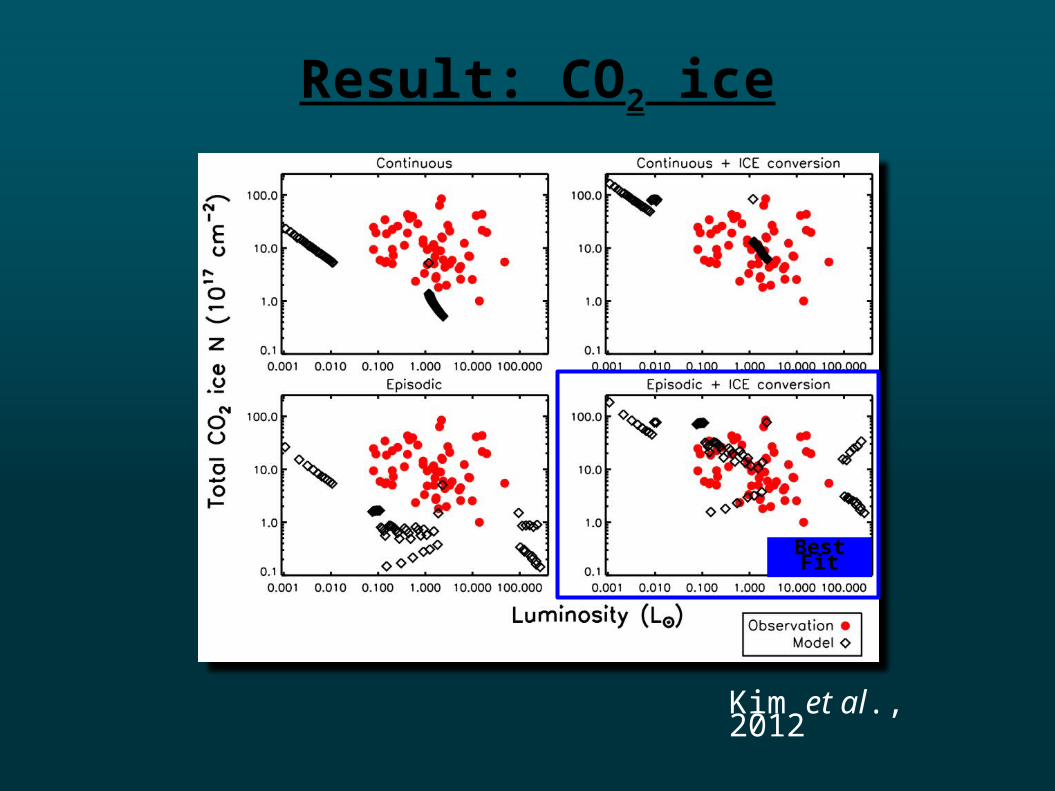
Result: CO2 ice
Kim et al., 2012
Best Fit
Caveat; No explicit surface chemistry
Inclusion of surface chemistry explicitly using rate equations
– Willacy et al. (2006), Garrod and Herbst (2006), Dodson-Robinson et al. (2009), Yu et al. (in prep.)
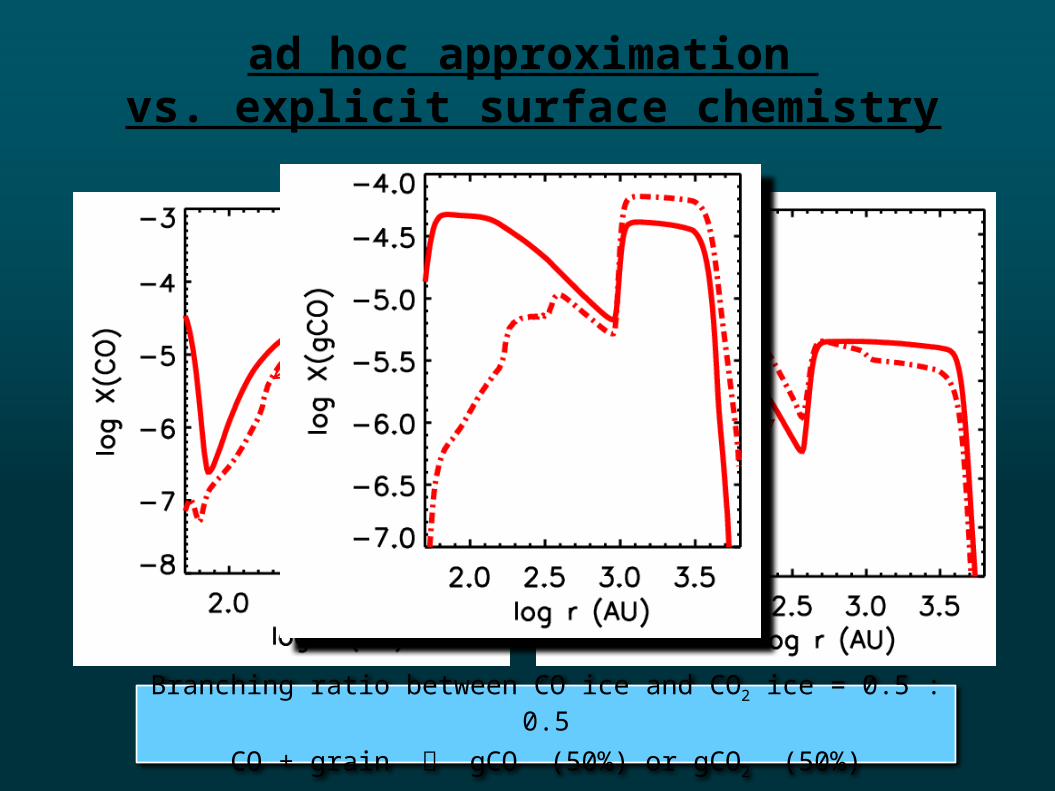
ad hoc approximation vs. explicit surface chemistry
ad hoc approximation
Explicit surface chemistry
Branching ratio between CO ice and CO2 ice = 0.5 : 0.5
CO + grain gCO (50%) or gCO2 (50%)
COCO2
H2O
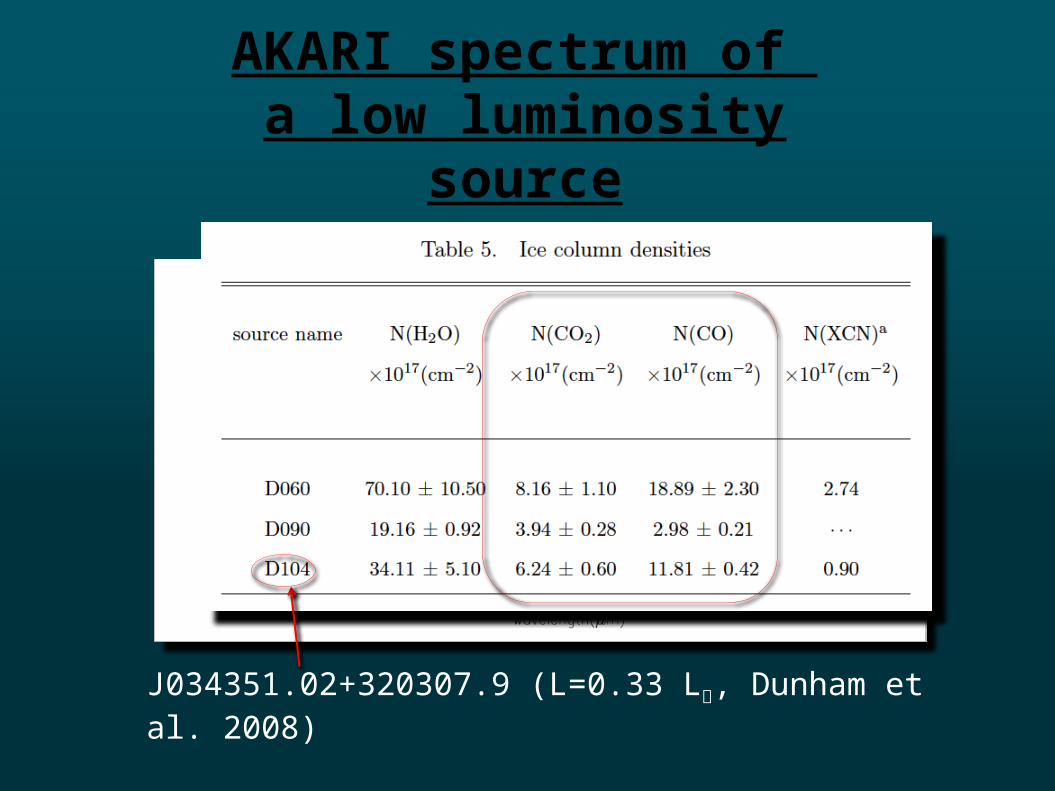
AKARI spectrum of a low luminosity source
J034351.02+320307.9 (L=0.33 L, Dunham et al. 2008)
COCO2
H2O
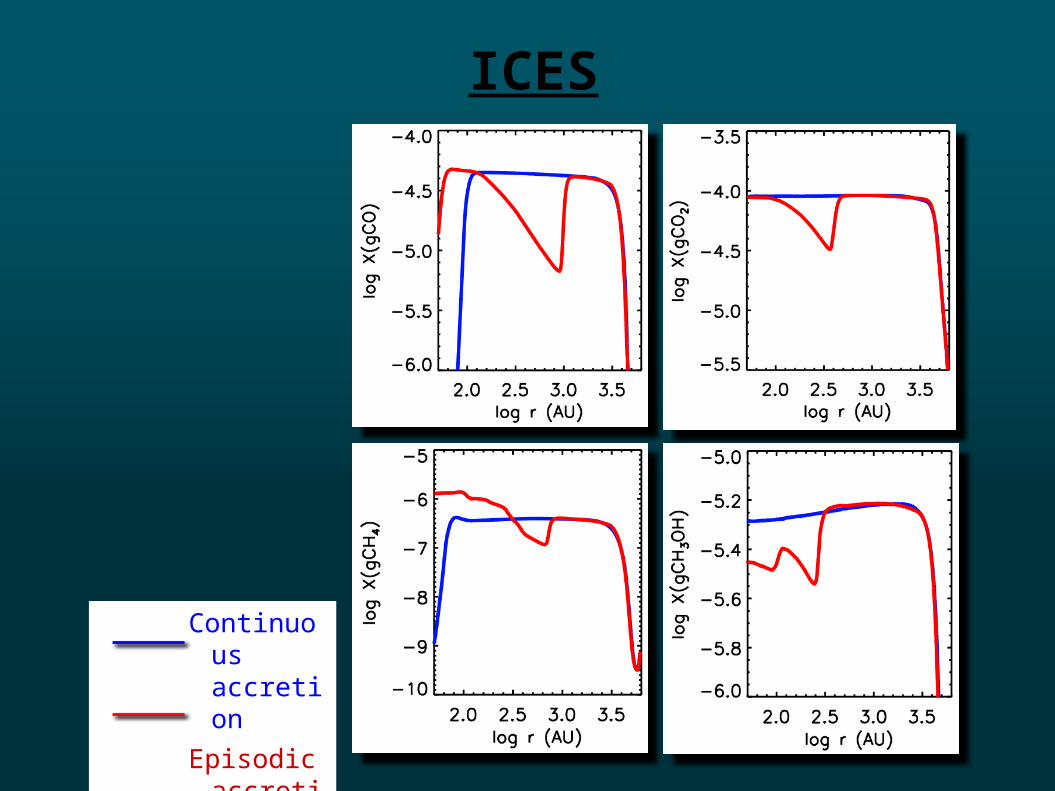
ICES
Continuous accretion
Episodic accretion
Further constraints forepisodic accretion
▸ ALMA observations for the distribution of gaseous molecules
▸ Other ices observed with Spitzer/IRS and AKARI
– e.g. Boogert et al. (2011)– e.g. Noble et al. (2013), Lee et al. (in prep.)
Summary
▸ Episodic Accretion Model can explain presence of pure CO2 ice in low luminosity
protostars low luminosity itself, strength of molecular
lines, and total CO2 ice column density with the ad hoc ice conversion of CO to CO2
▸ Surface chemistry must be included more explicitly.
▸ Chemo-Dynamical model for the episodic accretion model could be constrained better by existing IR ice spectra and future ALMA observations.

Thank you.
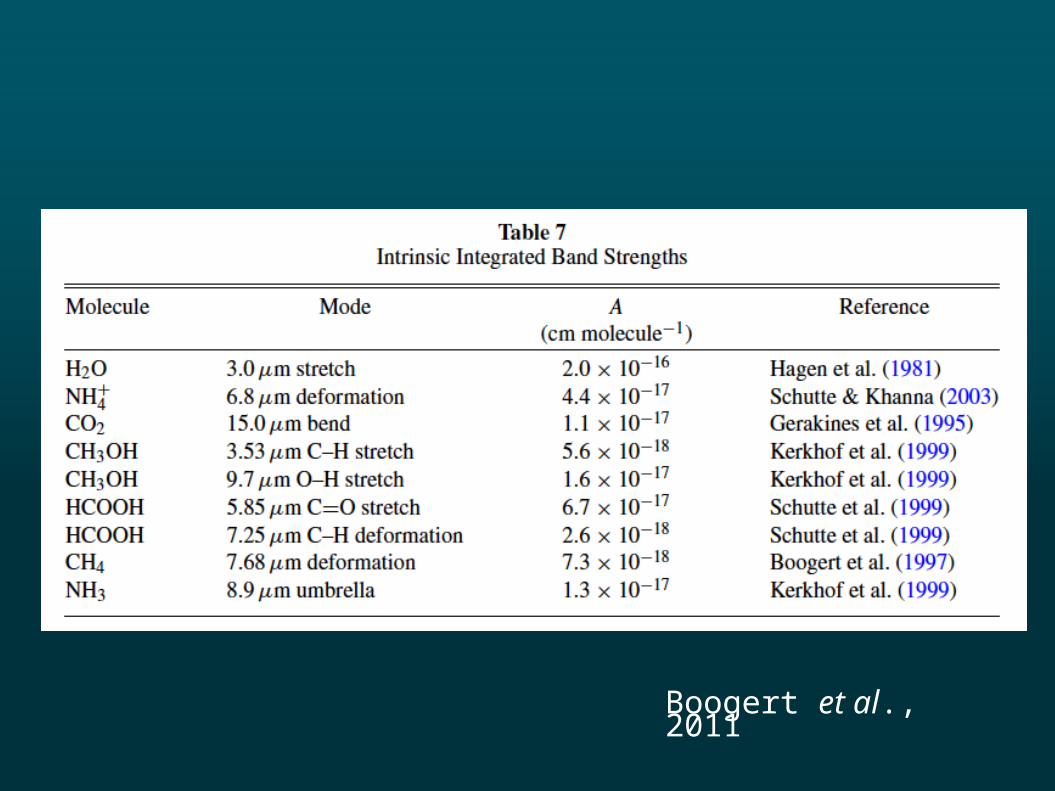
Boogert et al., 2011
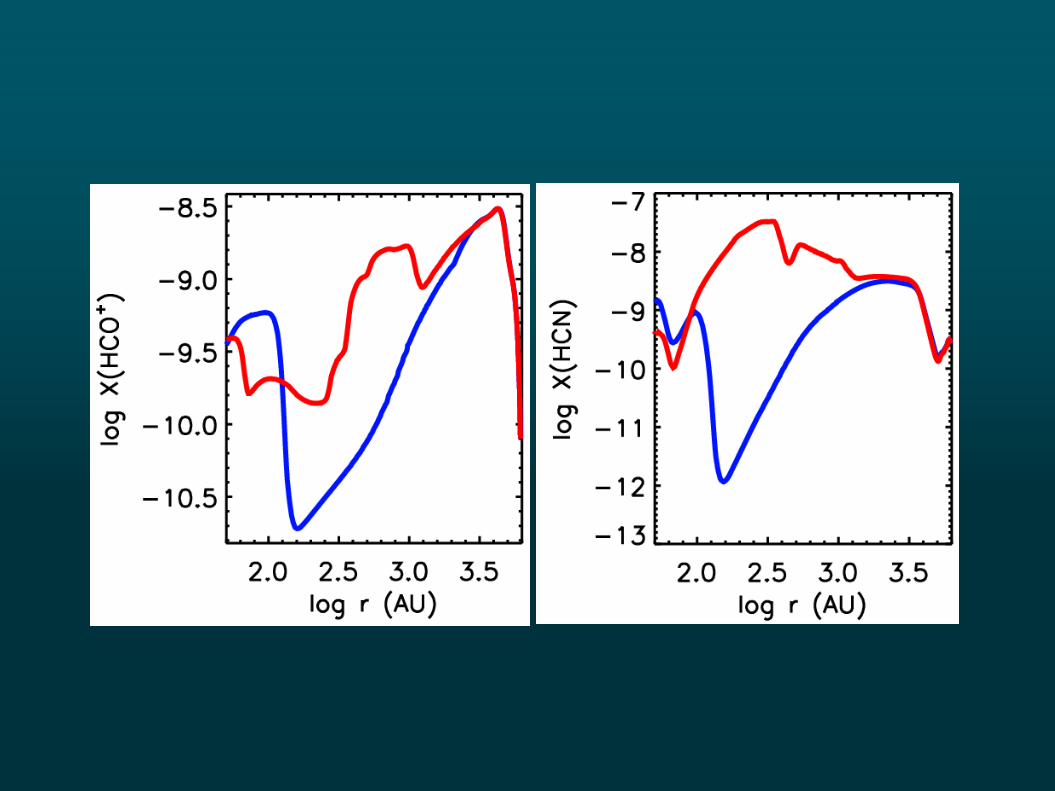
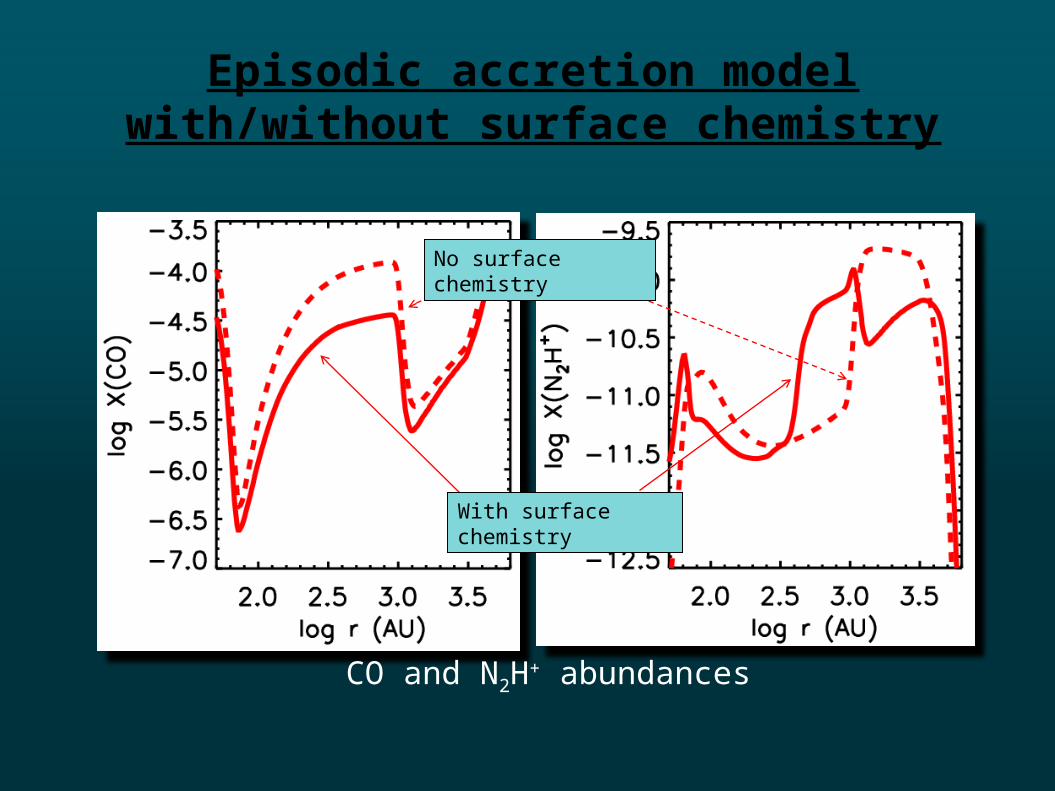
Episodic accretion modelwith/without surface chemistry
No surface chemistry
With surface chemistry
CO and N2H+ abundances
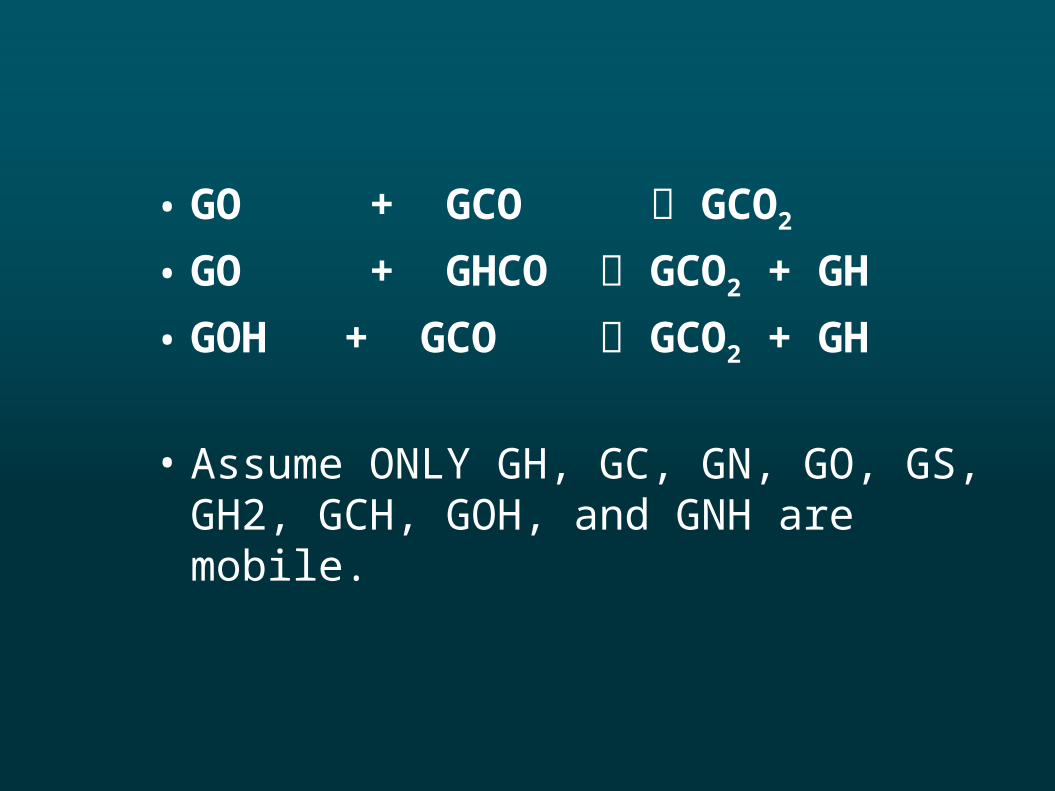
• GO + GCO GCO2
• GO + GHCO GCO2 + GH
• GOH + GCO GCO2 + GH
• Assume ONLY GH, GC, GN, GO, GS, GH2, GCH, GOH, and GNH are mobile.
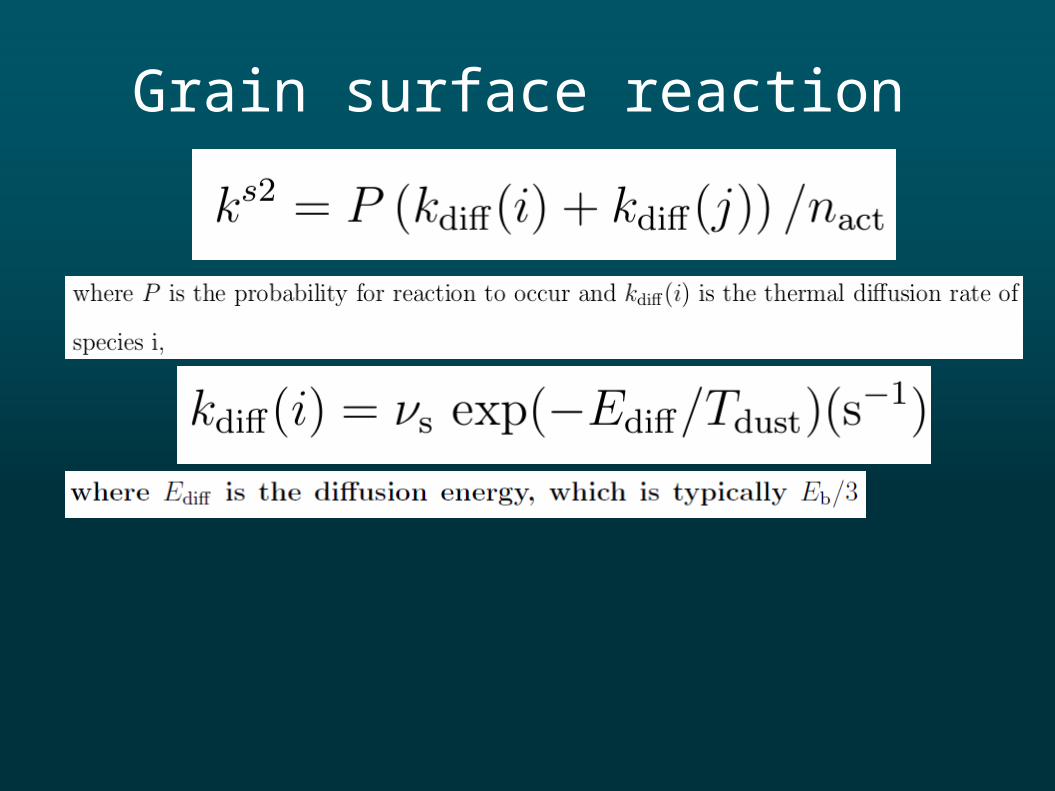
Grain surface reaction
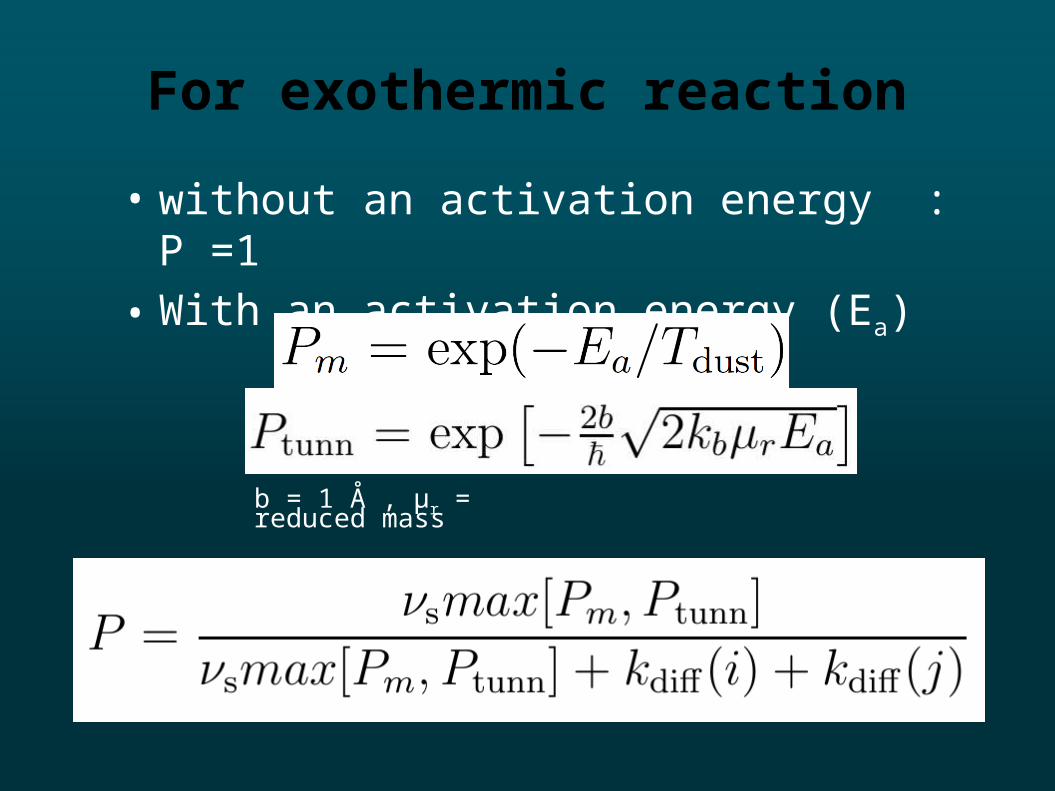
For exothermic reaction
• without an activation energy : P =1• With an activation energy (Ea)
b = 1 Å , μr = reduced mass