Embed Size (px)
Citation preview

NBER WORKING PAPER SERIES
CHILDHOOD HEALTH AND DIFFERENCES IN LATE-LIFE HEALTH OUTCOMESBETWEEN ENGLAND AND THE UNITED STATES
James BanksZoe Oldfield
James P. Smith
Working Paper 17096http://www.nber.org/papers/w17096
NATIONAL BUREAU OF ECONOMIC RESEARCH1050 Massachusetts Avenue
Cambridge, MA 02138May 2011
This paper was presented at the NBER Boulders Economics of Aging Conference in May 2011. Weare grateful for comments by participants at the conference and our discussant Amitabh Chandra. Theresearch was supported by grants from the NIA. Banks and Oldfield are grateful to the Economic andSocial Research Council for co-funding through the Centre for Microeconomic Analysis of PublicPolicy at the IFS. The views expressed herein are those of the authors and do not necessarily reflectthe views of the National Bureau of Economic Research.
NBER working papers are circulated for discussion and comment purposes. They have not been peer-reviewed or been subject to the review by the NBER Board of Directors that accompanies officialNBER publications.
© 2011 by James Banks, Zoe Oldfield, and James P. Smith. All rights reserved. Short sections of text,not to exceed two paragraphs, may be quoted without explicit permission provided that full credit,including © notice, is given to the source.
Childhood Health and Differences in Late-Life Health Outcomes Between England and theUnited StatesJames Banks, Zoe Oldfield, and James P. SmithNBER Working Paper No. 17096May 2011JEL No. I10
ABSTRACT
In this paper we examine the link between retrospectively reported measures of childhood health andthe prevalence of various major and minor diseases at older ages. Our analysis is based on comparableretrospective questionnaires placed in the Health and Retirement Study and the English LongitudinalStudy of Ageing – nationally representative surveys of the age 50 plus population in America andEngland respectively. We show that the origins of poorer adult health among older Americans comparedto the English trace right back into the childhood years – the American middle and old-age populationreport higher rates of specific childhood health conditions than their English counterparts. The transmissioninto poor health in mid life and older ages of these higher rates of childhood illnesses also appearsto be higher in America compared to England. Both factors contribute to higher rates of adult illnessin the United States compared to England although even in combination they do not explain the fullextent of the country difference in late-life health outcomes.
James BanksInstitute for Fiscal Studies7 RidgemountLondon, WC1 7AE [email protected]
Zoe OldfieldInstitute for Fiscal Studies7 RidgemountLondon, WC1 7AE [email protected]
James P. SmithLabor and Pop Studies ProgramThe RAND Corporation1776 Main StreetSanta Monica, CA [email protected]
2
Introduction
International comparisons of health have risen in importance as a method of gaining
insight into social and economic determinants of health status. Partly, this is due to the recent
discovery and documentation of large unexplained differences in morbidity health outcomes that
suggest that Americans are much sicker than their Western European counterparts (Banks,
Marmot, Oldfield, and Smith, 2006; Avendano et al, 2009). In a set of recent papers, we
compared disease prevalence among middle age adults 55-64 and at older ages in England and in
the US (Banks Marmot, Oldfield and Smith (2006, 2009); Banks, Muriel and Smith (2010);
Banks, Berkman, and Smith, 2011). Based on self-reported prevalence of seven important
illnesses (diabetes, heart attack, hypertension, heart disease, cancer, diseases of the lung, and
stroke), Americans were much less healthy than their English counterparts. These differences
were large at all points of the SES distribution.
Biological markers of disease showed similar health disparities between Americans and
the English, suggesting that these large health differences were not a result of differential
reporting of illness. We also found that these health differences existed with equal force among
both men and women (Banks, Marmot, Oldfield, and Smith. 2009). Since we purposely excluded
minorities (African-Americans and Latinos in American and non-Whites in England), these
differences were not solely due to health issues in the minority or immigrant population.
Moreover, these disparities in prevalence of chronic illness were also not the consequence of
differences between the two countries in conventional risk factors such as smoking, obesity, and
drinking – estimates of health disparities were essentially unchanged when we controlled for
different levels of these risk factors in America and in England. Models of diabetes prevalence
which controlled for both BMI and waist circumference displayed much reduced country
3
differences (Banks, Kumari, Smith and Zaninotto, 2011). However, the extent to which this can
be interpreted as an ‘explanation’ of cross-country diabetes differences is somewhat limited if
one views raised waist circumference for a given BMI as part of the fundamental etiology of
diabetes. We still have to be able to explain why- for given levels of obesity- Americans have
larger waists than the English. All in all, therefore, it remains the case that much of the US-
English difference in later life adult health remains unexplained.
In this paper, we investigate another hypothesis to help us understand underlying reasons
for the large American health disadvantage. This hypothesis is that differential prevalence and
differential impacts of early life conditions, and particularly childhood health, between England
and the US may have lead to differences in subsequent later-life health outcomes. Considerable
evidence has emerged that variation in health outcomes at middle and older ages may be traced
in part to health and other conditions during childhood (Barker, 1997, Case et al, 2002, Case et
al, 2005, Currie and Stabile, 2003, Smith, 2009, Smith and Smith, 2010). In this paper, we will
test whether such variation accounts for important parts of country differences in adult health.
This remainder of this paper is divided into four sections. The next section describes the
data that we will use in this analysis while the section that follows compares prevalence of
childhood illnesses for birth cohorts in the two countries. Section 4 summarizes the main results
obtained from analytical models relating these childhood illnesses to measures of adult health.
The purpose of this analysis is to assess how much of the large differences in illness at middle
and older ages in America compared to England can be explained by any differences that
prevailed when these people were children and adolescents. The final section of the paper
highlights our main conclusions.
4
2. Childhood Health Data in the HRS and ELSA
This research uses data from two surveys — the English Longitudinal Survey of Aging
(ELSA) and the US Health and Retirement Survey (HRS). Both surveys collect longitudinal data
on health, disability, economic circumstances, work, and well-being, from a representative
sample of the English and American populations aged 50 and older. Both ELSA and HRS are
widely viewed as strong in the measurement of socioeconomic variables (education,
employment, income, wealth) and health (self-reported subjective general health status,
prevalence and incidence of physical and mental disease during the post age 50 adult years
(hypertension, heart disease, diabetes, stroke, chronic lung diseases, asthma, arthritis and cancer,
and emotional and mental illness including depression), disability and functioning status, and
several salient health behaviors (smoking, alcohol consumption, and physical activity). HRS and
ELSA have both been widely used in stand alone studies as well as comparative studies of adult
health.
One limitation of ELSA and HRS, along with the various other new international aging
data sets, is that data collection only begins at age 50 (and even later for those cohorts who were
older at the time of the initial baseline interview). Fortunately, this limitation was recognized,
and many of these data sets subsequently fielded questionnaires or questionnaire modules that
aimed to fill in, through retrospective recall, the more salient episodes in respondents’ pre-
baseline life histories. Childhood events including childhood health were an important part of
these life history interviews.
Both HRS and ELSA included very similar retrospectively reported childhood health
histories. ELSA fielded their childhood health history between its wave 3 and wave 4 core
interviews between February and August 2007. ELSA used a stand alone ‘life-history’ CAPI
5
personal interview covering a variety of childhood circumstances and events as well as the pre-
baseline adult years. All ELSA respondents were eligible, and there was an eighty percent
response rate (N= 7,855). For the purposes of our analysis, the data from the life history
questionnaire was combined with the data from the third wave the main interview which was
fielded between June 2006 and March 2007. The HRS childhood health history was initially
placed into an internet survey in 2007 for those respondents who had internet access and who
agreed to be interviewed in that mode (N=3,641). The remainder of HRS respondents
(N=12,337) received the same childhood health history as part of the 2008 core interview.1
In addition to a subjective question rating their childhood health before age 16 on the
standard five-point scale from excellent to poor, respondents in both surveys were asked about
the occurrence of a set of common childhood illnesses. If the condition did exist, they were asked
the age of first onset. The list of childhood illnesses that were asked was very similar in the two
surveys but not identical- some diseases were asked in one survey but not the other.2 Thus, we
confine our analysis in this paper only to childhood illnesses and conditions that were asked in
both surveys. Even within these set of childhood conditions, there are differences in wording or
inclusion that must be taken into account. The following childhood diseases have basically the
same wording in both surveys—asthma, diabetes, heart trouble, chronic ear problems, severe
headaches or migraines, and epilepsy or seizures. For the common childhood infectious diseases,
HRS respondents were asked about mumps, measles, and chicken pox separately while ELSA
1 See Smith, 2009a for details.
2 For example, the following childhood conditions and diseases were asked in ELSA but not in HRS- broken bones
and fractures; appendicitis; leukemia or lymphoma; cancer or malignant tumor. The following conditions were asked
in HRS but not in ELSA- difficulty seeing even with glasses or prescription lenses; a speech impairment; stomach
problems; high blood pressure; a blow to the head, head injury or trauma severe enough to cause loss of
consciousness or memory loss for a period of time.
6
respondents were asked a single question about all infectious disease with the question wording
mentioning these three diseases but also including polio and TB.
The biggest difference between the two surveys involves allergies and respiratory
problems. In HRS, respondents were asked about respiratory disorders which included
bronchitis, wheezing, hay fever, shortness of breath, and sinus infections and were separately
asked about any allergic conditions. ELSA respondents were asked about allergies including hay
fever and then separately about respiratory problems. Thus, hay fever shows up in a different
category in the two surveys. The other difference of possible significance concerns the category
of emotional and psychological problems which included two questions about depression and
other emotional problems in HRS and one question about emotional, nervous, or psychiatric
problems in ELSA.
In addition to any impact of these wording differences, the form in which the questions
were asked also differed between the two surveys. HRS respondents were asked separate
questions about each condition while ELSA respondents were shown a ‘show card’ which
contained a list of conditions and then asked to identify any that they may have had before age
16. The show card format could lead to lower reported prevalence if respondents that had
multiple conditions only identify a subset from show cards, whilst they would have answered in
the affirmative to each of the questions individually had they been asked.
3. Comparing Childhood Health in England and the USA
Our first descriptive analysis compares prevalences of childhood conditions that are more
or less comparably defined in England and the United States using these two surveys. In addition
to presenting overall prevalence in the two samples, we also stratified the data by four broadly
7
defined birth cohorts—those born pre 1930, those born between 1930 and 1939, those born
between 1940 and 1949, and those born in 1950 or after. Given the age selection of HRS and
ELSA respondents and the fact that both samples were refreshed with younger cohorts prior to
the retrospective data collection (in 2006 for ELSA and 2004 for HRS), the youngest cohort of
our sample contains only those born between 1950 and 1956.
Such age stratification may reveal the nature of any secular trends in the prevalence of
childhood diseases in the two countries. Given the reliance on recall for this data, however,
considerable caution in interpreting any age patterns is advisable. One problem involves
mortality selection if those with healthier childhoods live longer as they undoubtedly do. This is
a selection effect that should become stronger at older ages.
Since these prevalence measures are based on recall, a second problem is that memory
biases may be playing a role in these trends as well and these may also be stronger at older ages.
It is well established that memory typically declines with time from the event (Sudman and
Bradburn, 1974). Salient events may suffer less from this type of memory decay and memory of
childhood happenings appear to be superior than for other times of life. Smith (2009a) shows that
data from these recall histories on childhood health show similar age-cohort patterns to those
collected from contemporaneous sources for example.
The third and final problem is the difficulty in separating cohort or time trends in true
prevalence and incidence from improved detection or changing diagnostic thresholds. For most
childhood diseases, there is very likely improved diagnosis and detection of childhood diseases
over time, and for some diseases, including mental illness, there may be some effect of a
lowering of the threshold for diagnosis.
8
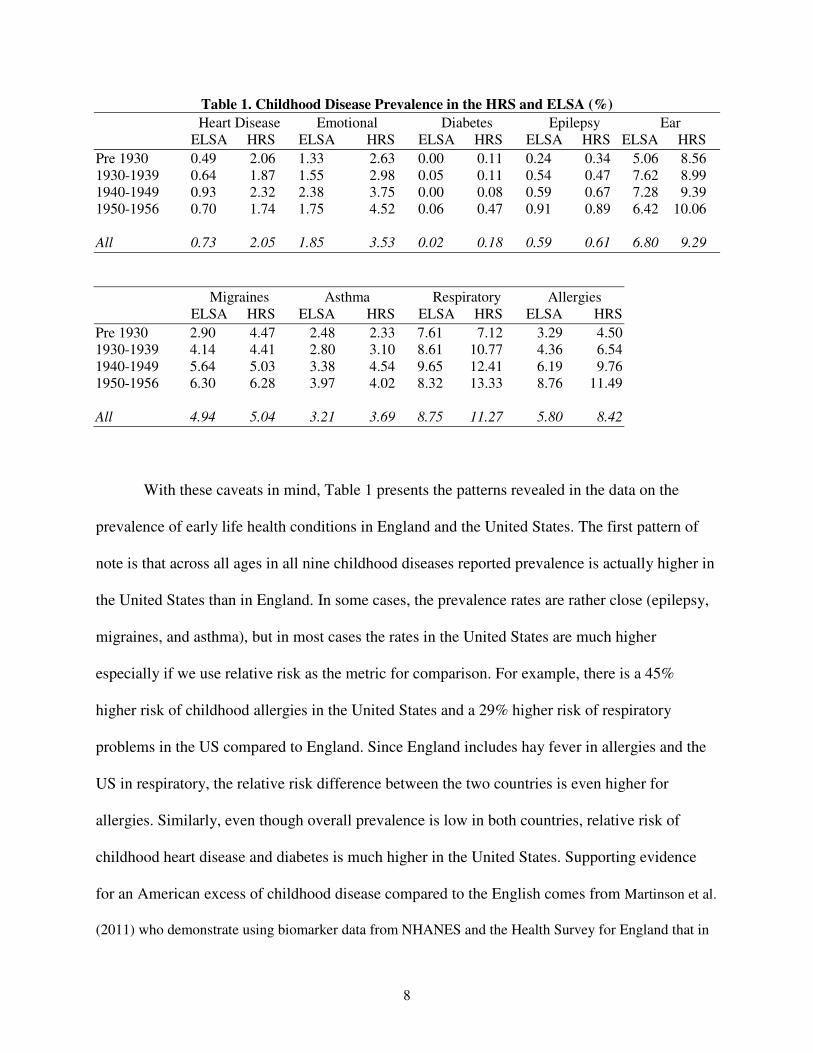
Table 1. Childhood Disease Prevalence in the HRS and ELSA (%)
Heart Disease Emotional Diabetes Epilepsy Ear
ELSA HRS ELSA HRS ELSA HRS ELSA HRS ELSA HRS
Pre 1930 0.49 2.06 1.33 2.63 0.00 0.11 0.24 0.34 5.06 8.56
1930-1939 0.64 1.87 1.55 2.98 0.05 0.11 0.54 0.47 7.62 8.99
1940-1949 0.93 2.32 2.38 3.75 0.00 0.08 0.59 0.67 7.28 9.39
1950-1956 0.70 1.74 1.75 4.52 0.06 0.47 0.91 0.89 6.42 10.06
All 0.73 2.05 1.85 3.53 0.02 0.18 0.59 0.61 6.80 9.29
Migraines Asthma Respiratory Allergies
ELSA HRS ELSA HRS ELSA HRS ELSA HRS
Pre 1930 2.90 4.47 2.48 2.33 7.61 7.12 3.29 4.50
1930-1939 4.14 4.41 2.80 3.10 8.61 10.77 4.36 6.54
1940-1949 5.64 5.03 3.38 4.54 9.65 12.41 6.19 9.76
1950-1956 6.30 6.28 3.97 4.02 8.32 13.33 8.76 11.49
All 4.94 5.04 3.21 3.69 8.75 11.27 5.80 8.42
With these caveats in mind, Table 1 presents the patterns revealed in the data on the
prevalence of early life health conditions in England and the United States. The first pattern of
note is that across all ages in all nine childhood diseases reported prevalence is actually higher in
the United States than in England. In some cases, the prevalence rates are rather close (epilepsy,
migraines, and asthma), but in most cases the rates in the United States are much higher
especially if we use relative risk as the metric for comparison. For example, there is a 45%
higher risk of childhood allergies in the United States and a 29% higher risk of respiratory
problems in the US compared to England. Since England includes hay fever in allergies and the
US in respiratory, the relative risk difference between the two countries is even higher for
allergies. Similarly, even though overall prevalence is low in both countries, relative risk of
childhood heart disease and diabetes is much higher in the United States. Supporting evidence
for an American excess of childhood disease compared to the English comes from Martinson et al.
(2011) who demonstrate using biomarker data from NHANES and the Health Survey for England that in
9
more contempory times there is also an American excess of childhood disease. It is important to note that
their comparisons do not rely on recall.
The second salient pattern in these data is country differences in across cohort trends.
While for most childhood diseases in both countries secular trends indicate growing prevalence
over time, these secular trends appear to be much sharper in the United States than in England.
For example, take respiratory diseases as the first example—childhood prevalence is almost
twice as high in the youngest birth cohorts compared to the oldest birth cohorts in Table 1. The
comparable figure for England is 9% higher.
We have discussed three potential difficulties in interpreting the cross-cohort trends in
Table 1, namely mortality selection, imperfect recall and secular trends in diagnosis. In principal,
each of these effects could also be operating differentially in England and the US, and hence
affecting our cross-country comparisons as well. Of the three, the one that is most amenable to
investigation is mortality selection, and particularly the concern that cohort trends in mortality
selection may be rather different in the two countries.
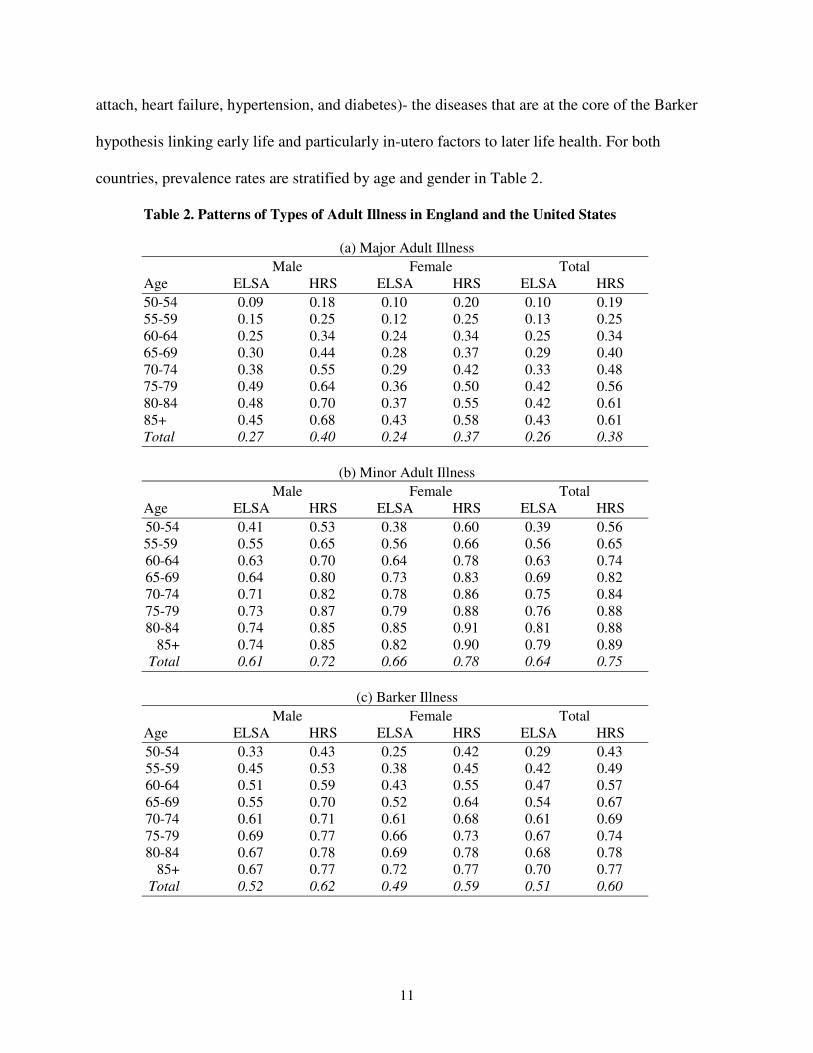
What would be most worrying would be higher rates of mortality prior to older ages in
England. This might lead one to suppose that those who had the specific childhood conditions
identified in this table would be more likely to have died in England than in the US, hence
leading us to measure lower prevalence in England when we interview survivors of these cohorts
many years later. In previous research, we have already documented lower mortality rates in
England between ages 50 and 65 (Banks, Smith and Muriel, 2010) so to further our evidence on
this issue we analyzed the Human Mortality Base data3 on survival to various ages for the two
countries for all cohorts born between 1934 and 1958 (data on earlier cohorts are not available
for the US). The analysis (presented in Figure A1 in the Appendix) demonstrates that English
3 http://www.mortality.org/
10
cohorts were in fact more likely to survive to age 50 than their US counterparts. If childhood
disease is predictive of mortality prior to age 50, we may if anything be understating the true
prevalence differences between the two countries at the time these cohorts were young.
Interestingly, cohort trends in these survival probabilities are somewhat different across
countries. For cohorts born from 1948 onwards the differences between countries in the
likelihood of living to age 50 becomes rather more substantial than for the earlier cohorts. Once
again this cohort-specific country divergence may be worrying for our analysis. But further
investigation of this feature indicates that it is due to a sharp increase in the probability of living
to age 1 in England after the Second World War4 for these later cohorts so that their survival
rates were comparable to similar cohorts in the US whilst their predecessors had rather lower
survival probabilities. When we look at cohort trends in survival to age 50 conditional on
survival to age 1, the pattern of cohort trends in the two countries is much more comparable
with, in fact, an even greater advantage in favor of the English. Given that much of the diagnosis
and onset of our childhood conditions will occur after age 1 it is this last evidence that we think
is most relevant for our purposes here.
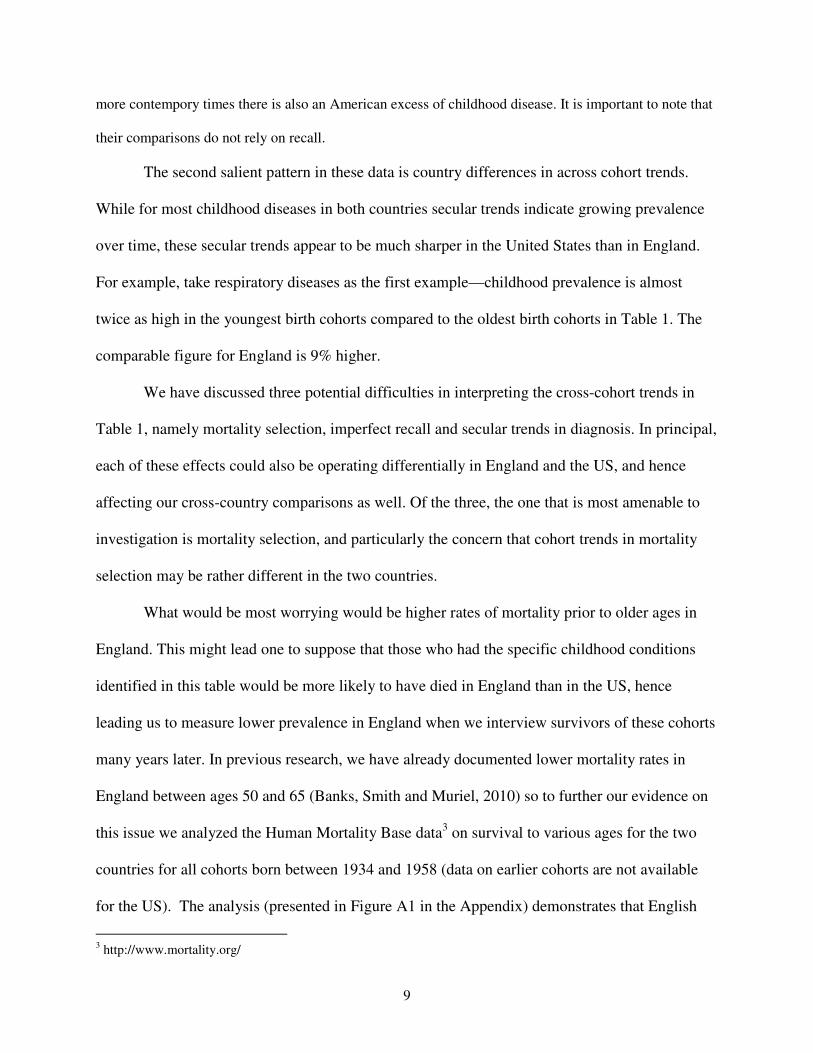
Turning back to the ELSA and HRS childhood data that form the core of our analysis,
Table 2 compares later-life health outcomes in England and the United States, with the outcomes
measured at or near to the time the retrospective data were collected (i.e. 2007 in England and
2007/8 in the US). We divide health outcomes into three groups—illnesses that we label major,
those labeled minor, and those labeled ‘Barker’. Major illness includes cancer, lung disease,
stroke, angina, heart attack, and heart failure. Minor illness includes hypertension, diabetes, and
arthritis. ‘Barker’ illnesses include those related to heart disease and diabetes (angina, heart
4 One hypothesis is that this improvement in infant mortality in England in this period was due to better nutrition
(Deaton 1976).
11
attach, heart failure, hypertension, and diabetes)- the diseases that are at the core of the Barker
hypothesis linking early life and particularly in-utero factors to later life health. For both
countries, prevalence rates are stratified by age and gender in Table 2.
Table 2. Patterns of Types of Adult Illness in England and the United States
(a) Major Adult Illness
Male Female Total
Age ELSA HRS ELSA HRS ELSA HRS
50-54 0.09 0.18 0.10 0.20 0.10 0.19
55-59 0.15 0.25 0.12 0.25 0.13 0.25
60-64 0.25 0.34 0.24 0.34 0.25 0.34
65-69 0.30 0.44 0.28 0.37 0.29 0.40
70-74 0.38 0.55 0.29 0.42 0.33 0.48
75-79 0.49 0.64 0.36 0.50 0.42 0.56
80-84 0.48 0.70 0.37 0.55 0.42 0.61
85+ 0.45 0.68 0.43 0.58 0.43 0.61
Total 0.27 0.40 0.24 0.37 0.26 0.38
(b) Minor Adult Illness
Male Female Total
Age ELSA HRS ELSA HRS ELSA HRS
50-54 0.41 0.53 0.38 0.60 0.39 0.56
55-59 0.55 0.65 0.56 0.66 0.56 0.65
60-64 0.63 0.70 0.64 0.78 0.63 0.74
65-69 0.64 0.80 0.73 0.83 0.69 0.82
70-74 0.71 0.82 0.78 0.86 0.75 0.84
75-79 0.73 0.87 0.79 0.88 0.76 0.88
80-84 0.74 0.85 0.85 0.91 0.81 0.88
85+ 0.74 0.85 0.82 0.90 0.79 0.89
Total 0.61 0.72 0.66 0.78 0.64 0.75
(c) Barker Illness
Male Female Total
Age ELSA HRS ELSA HRS ELSA HRS
50-54 0.33 0.43 0.25 0.42 0.29 0.43
55-59 0.45 0.53 0.38 0.45 0.42 0.49
60-64 0.51 0.59 0.43 0.55 0.47 0.57
65-69 0.55 0.70 0.52 0.64 0.54 0.67
70-74 0.61 0.71 0.61 0.68 0.61 0.69
75-79 0.69 0.77 0.66 0.73 0.67 0.74
80-84 0.67 0.78 0.69 0.78 0.68 0.78
85+ 0.67 0.77 0.72 0.77 0.70 0.77
Total 0.52 0.62 0.49 0.59 0.51 0.60
12
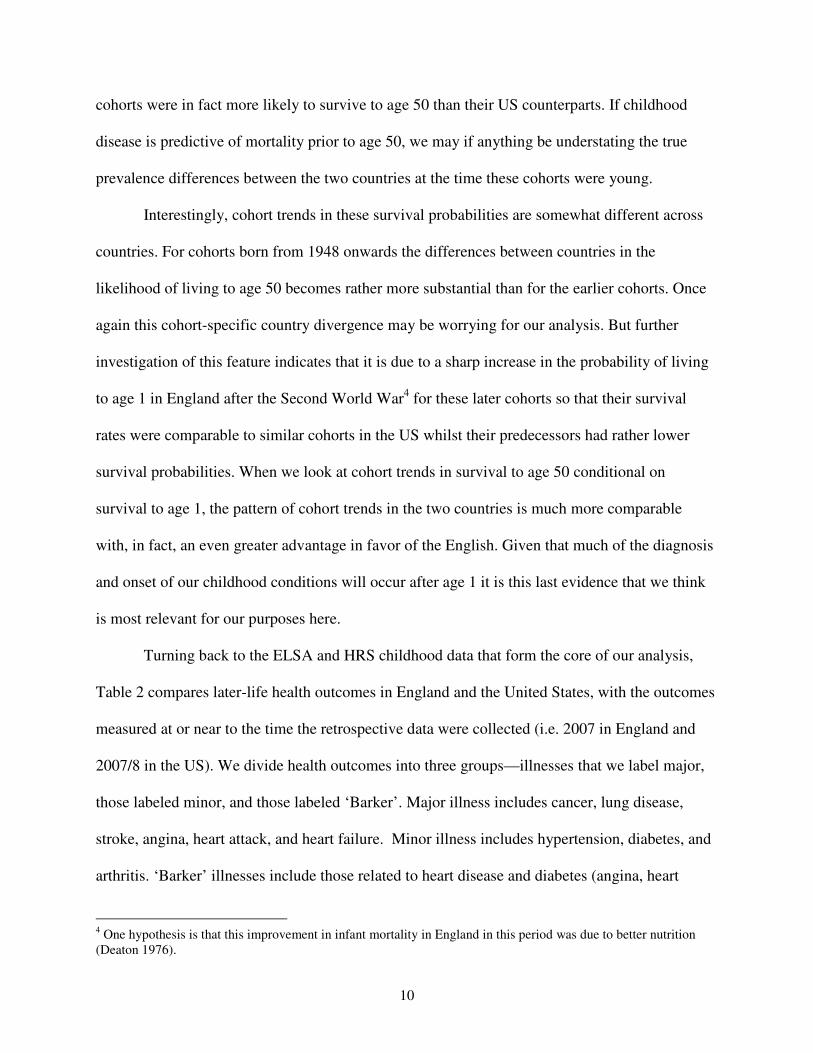
There are several salient patterns revealed in Table 2. Not surprisingly for all three
disease categories, disease prevalence rises rapidly with age in both countries, with ages in the
fifties and sixties witnessing the most rapid rate of increase. Most importantly, across all three
categories of illness used in this Table, Americans have much higher rates of disease than the
English do. This pattern of excess illness in America compared to England when defined using
these aggregated disease groupings appears to be true for men and women and accords with the
various findings on the more specific conditions and diseases that we have documented in our
other research (Banks et al, 2006, Banks et al, 2010).
4. Analytical Models Comparing Effects of Childhood Health on Adult Health in England
and the USA
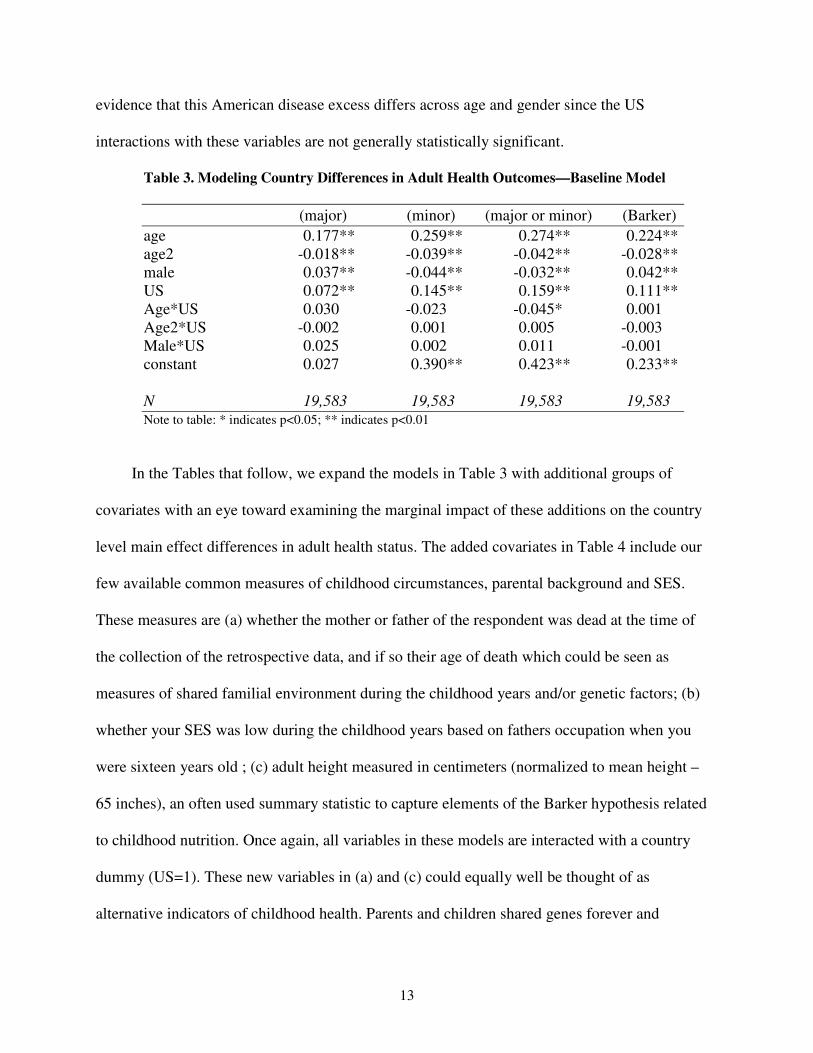
Table 3 presents our baseline OLS models that attempt to isolate the salient country level
differences in adult disease prevalence. These models contain only a quadratic in age
(normalized so that age 50 is zero and defined for expositional convenience as (age-50)/10)), a
gender dummy (male = 1), a country dummy (US =1) and interactions of the US indicator
variable with the age quadratic and gender. Not surprisingly given the patterns revealed in Table
2, we find that all three disease groups increase with age at a decreasing rate5, there is a small but
statistically significant male disease excess for major and Barker disease categories and a small
(but again statistically significant) female excess for minor diseases in England. In terms of our
main interest in country differences, we find a statistically significant common excess of disease
in the United States. On average, and for the base case individuals (50 year old females), disease
excess in the US over England is 7.2 percentage points, for major diseases, 14.5 percentage
points for minor diseases, and 11.1 percentage points for Barker diseases. There is no strong
5 As always, these age patterns could partially reflect cohort effects as well.
13
evidence that this American disease excess differs across age and gender since the US
interactions with these variables are not generally statistically significant.
Table 3. Modeling Country Differences in Adult Health Outcomes—Baseline Model
(major) (minor) (major or minor) (Barker)
age 0.177** 0.259** 0.274** 0.224**
age2 -0.018** -0.039** -0.042** -0.028**
male 0.037** -0.044** -0.032** 0.042**
US 0.072** 0.145** 0.159** 0.111**
Age*US 0.030 -0.023 -0.045* 0.001
Age2*US -0.002 0.001 0.005 -0.003
Male*US 0.025 0.002 0.011 -0.001
constant 0.027 0.390** 0.423** 0.233**
N 19,583 19,583 19,583 19,583
Note to table: * indicates p<0.05; ** indicates p<0.01
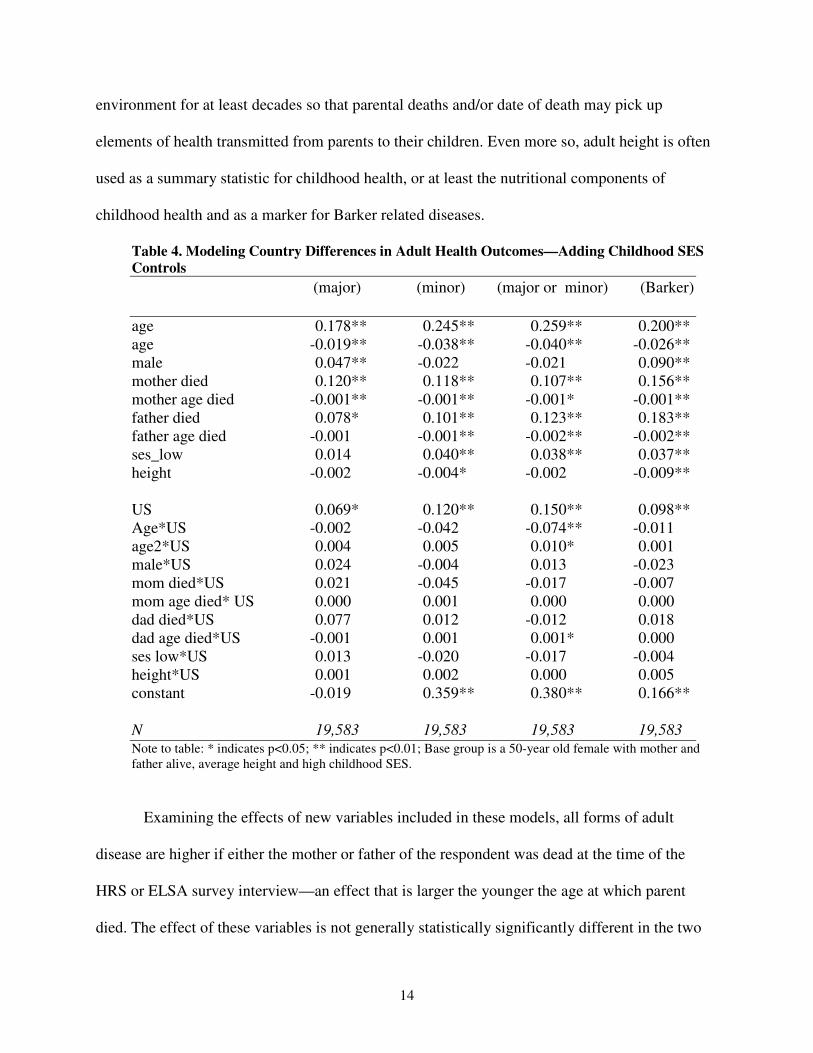
In the Tables that follow, we expand the models in Table 3 with additional groups of
covariates with an eye toward examining the marginal impact of these additions on the country
level main effect differences in adult health status. The added covariates in Table 4 include our
few available common measures of childhood circumstances, parental background and SES.
These measures are (a) whether the mother or father of the respondent was dead at the time of
the collection of the retrospective data, and if so their age of death which could be seen as
measures of shared familial environment during the childhood years and/or genetic factors; (b)
whether your SES was low during the childhood years based on fathers occupation when you
were sixteen years old ; (c) adult height measured in centimeters (normalized to mean height –
65 inches), an often used summary statistic to capture elements of the Barker hypothesis related
to childhood nutrition. Once again, all variables in these models are interacted with a country
dummy (US=1). These new variables in (a) and (c) could equally well be thought of as
alternative indicators of childhood health. Parents and children shared genes forever and
14
environment for at least decades so that parental deaths and/or date of death may pick up
elements of health transmitted from parents to their children. Even more so, adult height is often
used as a summary statistic for childhood health, or at least the nutritional components of
childhood health and as a marker for Barker related diseases.
Table 4. Modeling Country Differences in Adult Health Outcomes—Adding Childhood SES
Controls
(major) (minor) (major or minor) (Barker)
age 0.178** 0.245** 0.259** 0.200**
age -0.019** -0.038** -0.040** -0.026**
male 0.047** -0.022 -0.021 0.090**
mother died 0.120** 0.118** 0.107** 0.156**
mother age died -0.001** -0.001** -0.001* -0.001**
father died 0.078* 0.101** 0.123** 0.183**
father age died -0.001 -0.001** -0.002** -0.002**
ses_low 0.014 0.040** 0.038** 0.037**
height -0.002 -0.004* -0.002 -0.009**
US 0.069* 0.120** 0.150** 0.098**
Age*US -0.002 -0.042 -0.074** -0.011
age2*US 0.004 0.005 0.010* 0.001
male*US 0.024 -0.004 0.013 -0.023
mom died*US 0.021 -0.045 -0.017 -0.007
mom age died* US 0.000 0.001 0.000 0.000
dad died*US 0.077 0.012 -0.012 0.018
dad age died*US -0.001 0.001 0.001* 0.000
ses low*US 0.013 -0.020 -0.017 -0.004
height*US 0.001 0.002 0.000 0.005
constant -0.019 0.359** 0.380** 0.166**
N 19,583 19,583 19,583 19,583 Note to table: * indicates p<0.05; ** indicates p<0.01; Base group is a 50-year old female with mother and
father alive, average height and high childhood SES.
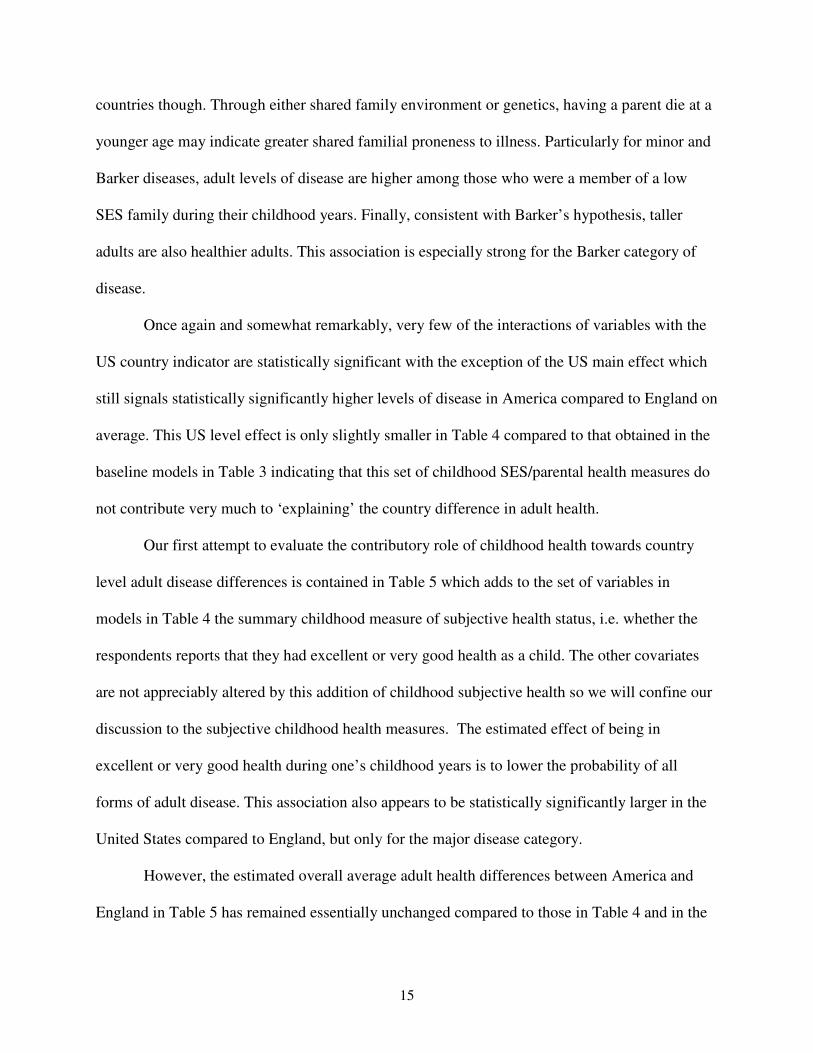
Examining the effects of new variables included in these models, all forms of adult
disease are higher if either the mother or father of the respondent was dead at the time of the
HRS or ELSA survey interview—an effect that is larger the younger the age at which parent
died. The effect of these variables is not generally statistically significantly different in the two
15
countries though. Through either shared family environment or genetics, having a parent die at a
younger age may indicate greater shared familial proneness to illness. Particularly for minor and
Barker diseases, adult levels of disease are higher among those who were a member of a low
SES family during their childhood years. Finally, consistent with Barker’s hypothesis, taller
adults are also healthier adults. This association is especially strong for the Barker category of
disease.
Once again and somewhat remarkably, very few of the interactions of variables with the
US country indicator are statistically significant with the exception of the US main effect which
still signals statistically significantly higher levels of disease in America compared to England on
average. This US level effect is only slightly smaller in Table 4 compared to that obtained in the
baseline models in Table 3 indicating that this set of childhood SES/parental health measures do
not contribute very much to ‘explaining’ the country difference in adult health.
Our first attempt to evaluate the contributory role of childhood health towards country
level adult disease differences is contained in Table 5 which adds to the set of variables in
models in Table 4 the summary childhood measure of subjective health status, i.e. whether the
respondents reports that they had excellent or very good health as a child. The other covariates
are not appreciably altered by this addition of childhood subjective health so we will confine our
discussion to the subjective childhood health measures. The estimated effect of being in
excellent or very good health during one’s childhood years is to lower the probability of all
forms of adult disease. This association also appears to be statistically significantly larger in the
United States compared to England, but only for the major disease category.
However, the estimated overall average adult health differences between America and
England in Table 5 has remained essentially unchanged compared to those in Table 4 and in the
16
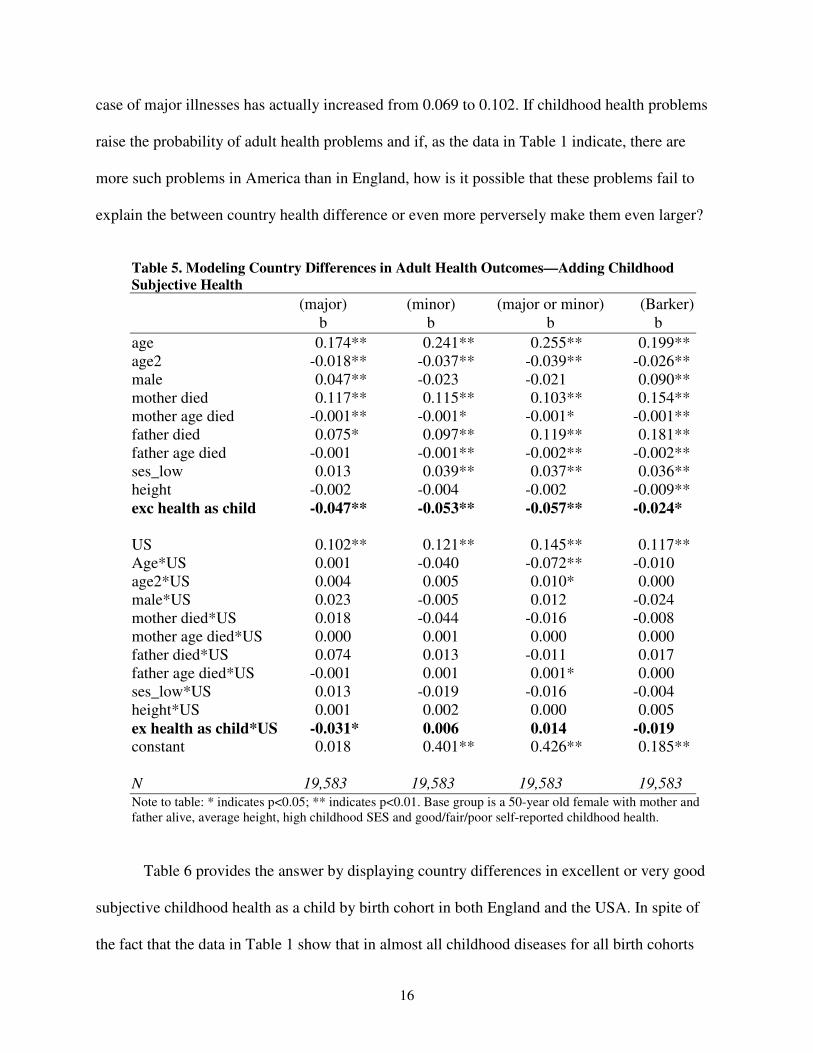
case of major illnesses has actually increased from 0.069 to 0.102. If childhood health problems
raise the probability of adult health problems and if, as the data in Table 1 indicate, there are
more such problems in America than in England, how is it possible that these problems fail to
explain the between country health difference or even more perversely make them even larger?
Table 5. Modeling Country Differences in Adult Health Outcomes—Adding Childhood
Subjective Health
(major) (minor) (major or minor) (Barker)
b b b b
age 0.174** 0.241** 0.255** 0.199**
age2 -0.018** -0.037** -0.039** -0.026**
male 0.047** -0.023 -0.021 0.090**
mother died 0.117** 0.115** 0.103** 0.154**
mother age died -0.001** -0.001* -0.001* -0.001**
father died 0.075* 0.097** 0.119** 0.181**
father age died -0.001 -0.001** -0.002** -0.002**
ses_low 0.013 0.039** 0.037** 0.036**
height -0.002 -0.004 -0.002 -0.009**
exc health as child -0.047** -0.053** -0.057** -0.024*
US 0.102** 0.121** 0.145** 0.117**
Age*US 0.001 -0.040 -0.072** -0.010
age2*US 0.004 0.005 0.010* 0.000
male*US 0.023 -0.005 0.012 -0.024
mother died*US 0.018 -0.044 -0.016 -0.008
mother age died*US 0.000 0.001 0.000 0.000
father died*US 0.074 0.013 -0.011 0.017
father age died*US -0.001 0.001 0.001* 0.000
ses_low*US 0.013 -0.019 -0.016 -0.004
height*US 0.001 0.002 0.000 0.005
ex health as child*US -0.031* 0.006 0.014 -0.019
constant 0.018 0.401** 0.426** 0.185**
N 19,583 19,583 19,583 19,583 Note to table: * indicates p<0.05; ** indicates p<0.01. Base group is a 50-year old female with mother and
father alive, average height, high childhood SES and good/fair/poor self-reported childhood health.
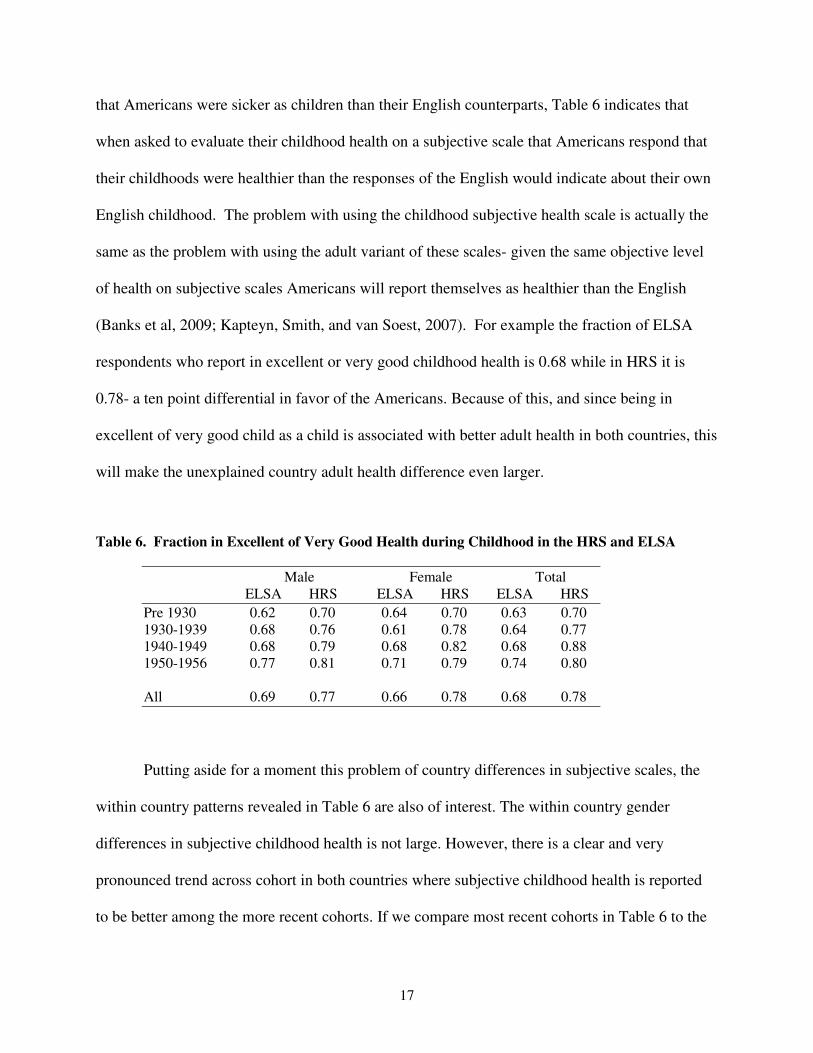
Table 6 provides the answer by displaying country differences in excellent or very good
subjective childhood health as a child by birth cohort in both England and the USA. In spite of
the fact that the data in Table 1 show that in almost all childhood diseases for all birth cohorts
17
that Americans were sicker as children than their English counterparts, Table 6 indicates that
when asked to evaluate their childhood health on a subjective scale that Americans respond that
their childhoods were healthier than the responses of the English would indicate about their own
English childhood. The problem with using the childhood subjective health scale is actually the
same as the problem with using the adult variant of these scales- given the same objective level
of health on subjective scales Americans will report themselves as healthier than the English
(Banks et al, 2009; Kapteyn, Smith, and van Soest, 2007). For example the fraction of ELSA
respondents who report in excellent or very good childhood health is 0.68 while in HRS it is
0.78- a ten point differential in favor of the Americans. Because of this, and since being in
excellent of very good child as a child is associated with better adult health in both countries, this
will make the unexplained country adult health difference even larger.
Table 6. Fraction in Excellent of Very Good Health during Childhood in the HRS and ELSA
Male Female Total
ELSA HRS ELSA HRS ELSA HRS
Pre 1930 0.62 0.70 0.64 0.70 0.63 0.70
1930-1939 0.68 0.76 0.61 0.78 0.64 0.77
1940-1949 0.68 0.79 0.68 0.82 0.68 0.88
1950-1956 0.77 0.81 0.71 0.79 0.74 0.80
All 0.69 0.77 0.66 0.78 0.68 0.78
Putting aside for a moment this problem of country differences in subjective scales, the
within country patterns revealed in Table 6 are also of interest. The within country gender
differences in subjective childhood health is not large. However, there is a clear and very
pronounced trend across cohort in both countries where subjective childhood health is reported
to be better among the more recent cohorts. If we compare most recent cohorts in Table 6 to the
18
oldest cohorts, the increase in the fraction in excellent or very good health as a child is about ten
percentage points in both England and America. Whilst it is possible that childhood health
improved across these cohorts (contrary to the evidence on chronic diseases presented in Table 1
above, and subject to the various caveats and especially to the role of improved diagnosis we
identified in the discussion of that table) the magnitude of this increase seems rather implausible,
particularly in the presence of health survivor effects which would tend to work across cohorts in
the opposite direction. This points to another major puzzle in the reconciliation of secular trends
in subjective and objective childhood health measures.
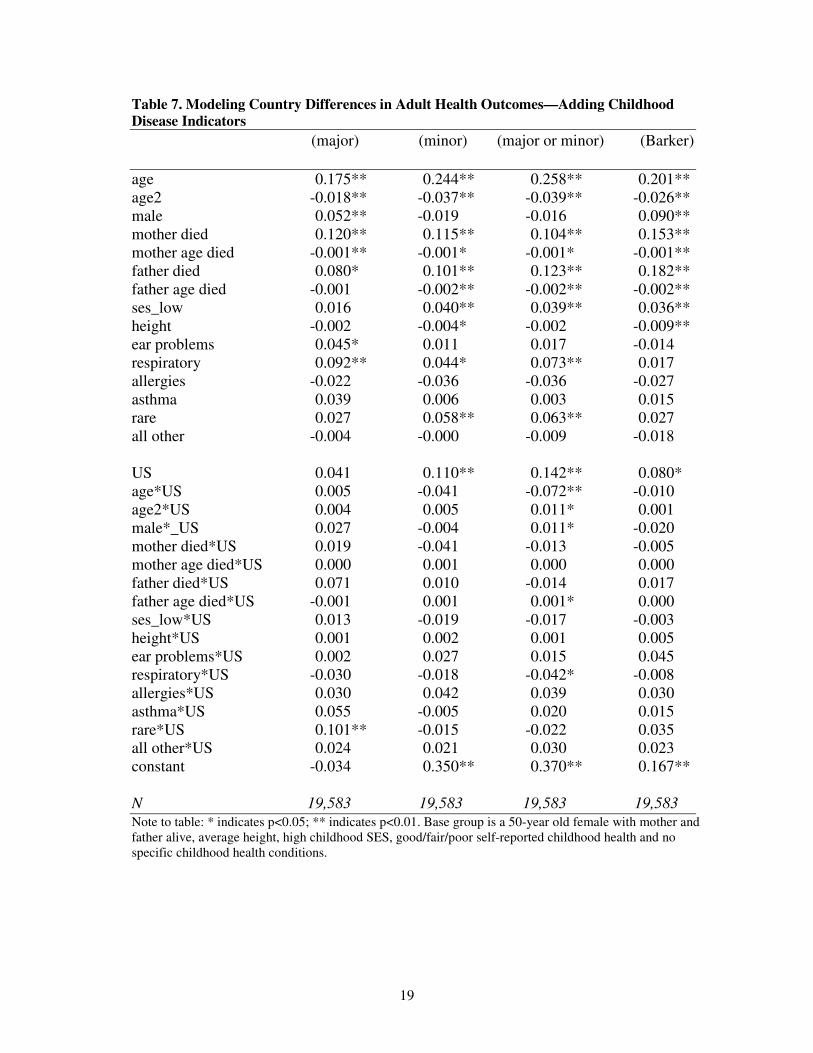
Table 7 extends our modeling of adult health in Table 6 by adding the set of childhood
disease indicators to the model as well as interactions of this set of childhood diseases with the
US country indicator variable. Since the prevalence rates of some of these childhood diseases are
low, we aggregated them into six groups. The six groups are ear problems, respiratory, allergies,
asthma, rare diseases (childhood diabetes, epilepsy, emotional), and all others. Main effects and
interactions with the US country indicator are included in the model. Because of the across
country scale comparability issue mentioned above, the model estimated in Table 7 does not
include the subjective childhood health variable.
Once again, coefficients of other variables in the model are not significantly affected by
adding childhood disease indicators. The diseases that appear to have most consistently
statistically significant main effects are ear problems, respiratory diseases, and rare diseases.
Especially for major illness, transmission into poorer adult health appears to be stronger in the
US for rare diseases and for asthma.
19
Table 7. Modeling Country Differences in Adult Health Outcomes—Adding Childhood
Disease Indicators
(major) (minor) (major or minor) (Barker)
age 0.175** 0.244** 0.258** 0.201**
age2 -0.018** -0.037** -0.039** -0.026**
male 0.052** -0.019 -0.016 0.090**
mother died 0.120** 0.115** 0.104** 0.153**
mother age died -0.001** -0.001* -0.001* -0.001**
father died 0.080* 0.101** 0.123** 0.182**
father age died -0.001 -0.002** -0.002** -0.002**
ses_low 0.016 0.040** 0.039** 0.036**
height -0.002 -0.004* -0.002 -0.009**
ear problems 0.045* 0.011 0.017 -0.014
respiratory 0.092** 0.044* 0.073** 0.017
allergies -0.022 -0.036 -0.036 -0.027
asthma 0.039 0.006 0.003 0.015
rare 0.027 0.058** 0.063** 0.027
all other -0.004 -0.000 -0.009 -0.018
US 0.041 0.110** 0.142** 0.080*
age*US 0.005 -0.041 -0.072** -0.010
age2*US 0.004 0.005 0.011* 0.001
male*_US 0.027 -0.004 0.011* -0.020
mother died*US 0.019 -0.041 -0.013 -0.005
mother age died*US 0.000 0.001 0.000 0.000
father died*US 0.071 0.010 -0.014 0.017
father age died*US -0.001 0.001 0.001* 0.000
ses_low*US 0.013 -0.019 -0.017 -0.003
height*US 0.001 0.002 0.001 0.005
ear problems*US 0.002 0.027 0.015 0.045
respiratory*US -0.030 -0.018 -0.042* -0.008
allergies*US 0.030 0.042 0.039 0.030
asthma*US 0.055 -0.005 0.020 0.015
rare*US 0.101** -0.015 -0.022 0.035
all other*US 0.024 0.021 0.030 0.023
constant -0.034 0.350** 0.370** 0.167**
N 19,583 19,583 19,583 19,583
Note to table: * indicates p<0.05; ** indicates p<0.01. Base group is a 50-year old female with mother and
father alive, average height, high childhood SES, good/fair/poor self-reported childhood health and no
specific childhood health conditions.
20
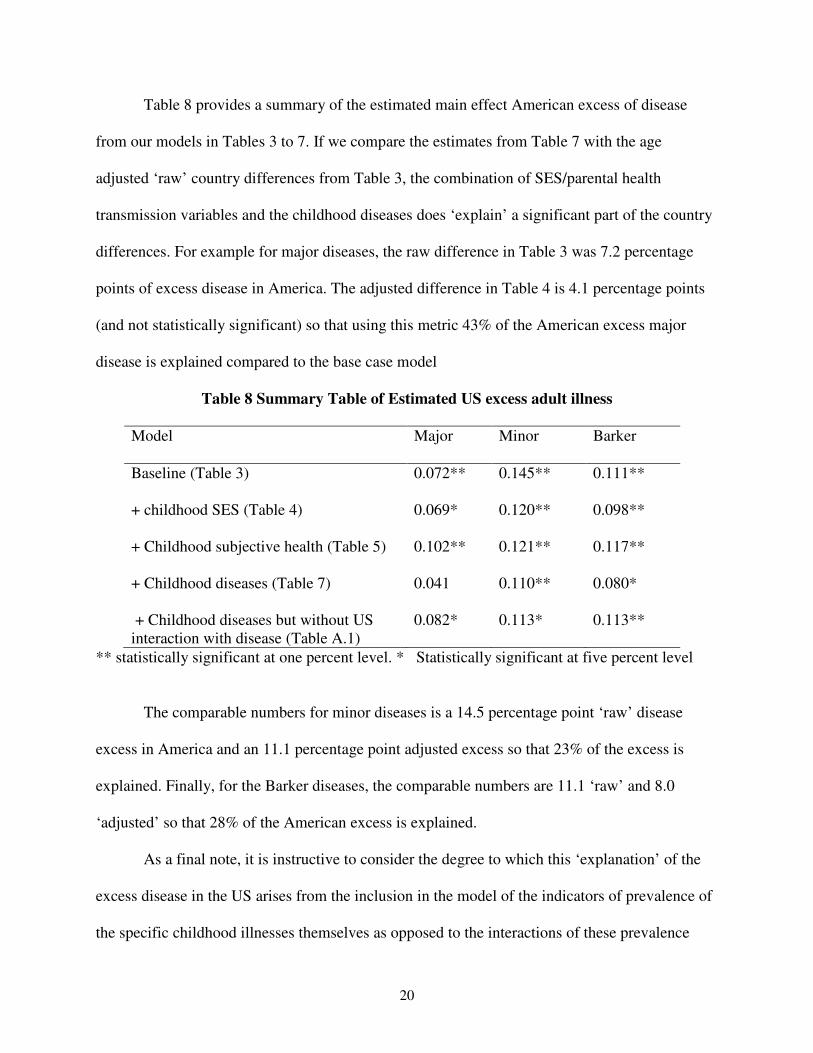
Table 8 provides a summary of the estimated main effect American excess of disease
from our models in Tables 3 to 7. If we compare the estimates from Table 7 with the age
adjusted ‘raw’ country differences from Table 3, the combination of SES/parental health
transmission variables and the childhood diseases does ‘explain’ a significant part of the country
differences. For example for major diseases, the raw difference in Table 3 was 7.2 percentage
points of excess disease in America. The adjusted difference in Table 4 is 4.1 percentage points
(and not statistically significant) so that using this metric 43% of the American excess major
disease is explained compared to the base case model
Table 8 Summary Table of Estimated US excess adult illness
Model Major Minor Barker
Baseline (Table 3) 0.072** 0.145** 0.111**
+ childhood SES (Table 4) 0.069* 0.120** 0.098**
+ Childhood subjective health (Table 5) 0.102** 0.121** 0.117**
+ Childhood diseases (Table 7) 0.041 0.110** 0.080*
+ Childhood diseases but without US
interaction with disease (Table A.1)
0.082* 0.113* 0.113**
** statistically significant at one percent level. * Statistically significant at five percent level
The comparable numbers for minor diseases is a 14.5 percentage point ‘raw’ disease
excess in America and an 11.1 percentage point adjusted excess so that 23% of the excess is
explained. Finally, for the Barker diseases, the comparable numbers are 11.1 ‘raw’ and 8.0
‘adjusted’ so that 28% of the American excess is explained.
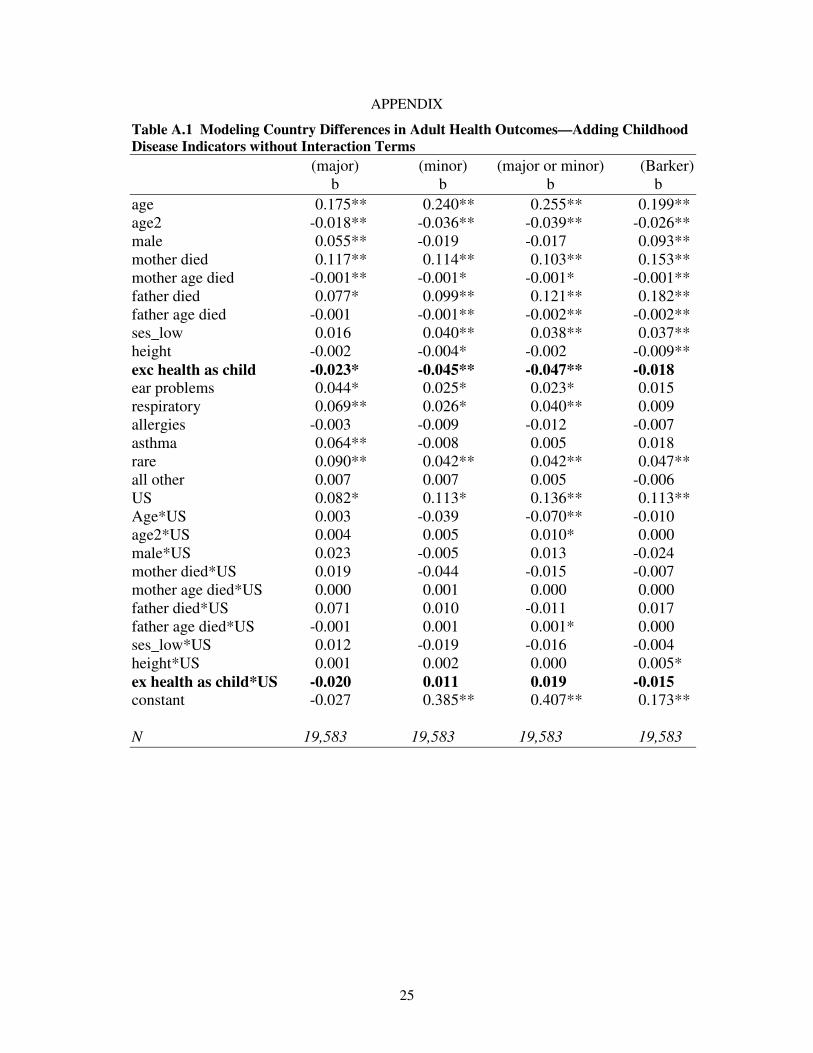
As a final note, it is instructive to consider the degree to which this ‘explanation’ of the
excess disease in the US arises from the inclusion in the model of the indicators of prevalence of
the specific childhood illnesses themselves as opposed to the interactions of these prevalence
21
indicators with the US country dummy. To investigate this we ran a similar model to that
presented in Table 7 but with the childhood health country interaction terms excluded (full
estimates presented in Table A1 in the Appendix and estimates of the US intercept term
presented in the final row of Table 8). On comparison of these results with those discussed
above, it is apparent that the main contribution to the reduction in both the size and statistical
significance of the US country effect arises from the inclusion of the interaction terms – whilst
there is some role for the greater prevalence of childhood conditions in the US, it is the
differential impacts of these childhood conditions on later-life health outcomes in the US that has
the main effect on changing the coefficient on the US dummy variable. Whilst these interaction
terms are, of course, just another form of 'country effect', this does suggest that investigation of
the mechanisms by which early-life health is transmitted to late-life disease outcomes in the two
countries would be a promising avenue for future research.
6. Conclusions
Differences in prevalence of childhood diseases between England and the United States
and a higher rate of transmission into poorer adult health in the United States do appear to
contribute to higher rates of adult illness in the United States compared to England. Our results
in this paper show that, based on comparable retrospective questionnaires placed in HRS and
ELSA- nationally representative surveys of the age 50 plus population in America and England
respectively, the origins of poorer adult health among older Americans compared to the English
traces back right into the childhood years. The transmission rates of these higher rates of
childhood illnesses into poor health in mid life and older ages also appears to be higher in
America compared to England.
22
Of course, every partial answer raises yet another question. In this case, conditions in
America appear to make people of all ages sicker than the English. This conclusion highlights a
caution that age specific answers to the question of why Americans are sicker may not serve as a
useful guide to uncovering the more fundamental causes of this important question. Our research
shows that the primary sources of the American excess in disease are not unique to mid
adulthood or old age but are more common throughout the age distribution of the two
populations. Finally, it is worth noting that we are dealing in this research with the onset of
disease rather than the treatment of disease so that the medical system and availability of health
insurance are not likely to be the primary actors in this puzzle. This is particularly true given our
use of a non-Hispanic white sample so 95% of our American sample have access to health
insurance.
23
References
Avendano, M., M. Glymour, J. Banks, and J.Mackenbach. (2009). Health disadvantage in US adults Aged
50-74: Are poor Europeans healthier than Americans? American Journal of Public Health
99:540-48.
Banks J., M. Marmot, Z. Oldfield, and J.P. Smith. (2006). Disease and disadvantage in the United States
and in England. JAMA 295(17):2037-45.
Banks, J., M. Marmot, Z. Oldfield, and J.P. Smith. (2009). SES and health on both sides of the Atlantic.
Pp. 359-406 in Developments in the Economics of Aging, edited by D. Wise. Chicago, IL:
University of Chicago.
Banks, J., A. Muriel, and J.P. Smith. (2010). Disease prevalence, disease incidence, and mortality in the
United States and in England. Demography 47 (Supplement):S211-31.
Banks, J., M. Kurmari, J.P. Smith, and P. Zaninotto. (2011). What explains the American disadvantage in
health compared to the English? The case of Diabetes. Forthcoming in Journal of Epidemiology
and Community Health.
Banks, J., L. Berkman, and J.P. Smith (2011). Do cross country variations in social integration and social
interactions explain differences in life expectancy in industrialized countries? In E. Crimmins, S.
Preston, and B. Cohen (eds.), International Differences in Mortality in Older Ages: Dimensions
and Sources. Washington DC: National Academy Press, pp. 210-267.
Barker, D.J.P. (1997). Maternal nutrition, fetal nutrition and diseases in Later Life. Nutrition 13(9):807-
13.
Case, A., D. Lubotsky, and C. Paxson. (2002). Economic status and health in childhood: The origins of
the gradient. American Economic Review 92(5):1308-34.
Case, A., A. Fertig, and C. Paxson. (2005). The lasting impact of childhood health and circumstance.
Journal of Health Economics 24(2):365-89.
Currie, J., and M. Stabile. (2003). Socioeconomic status and child health—Why is the relationship
stronger for older xhildren? American Economic Review 93(5):1813-23.
Deaton, Angus S. (1976). The structure of demand in Europe 1920-1970. in Carlo M Cippola, The
Fontana Economic History of Europe, Vol 5
Human Mortality Database. University of California, Berkeley (USA), and Max Planck Institute for
Demographic Research (Germany). Available at www.mortality.org
Kapteyn, A., van Soest, A. and Smith, JP “Vignettes and Self-Reported Work Disability in the US and
the Netherlands,” American Economic Review 97(1):461-473, March 2007.
24
Martinson, M. L., Teitler, J.L, and Reichman, N.E. Health Across the Life Span in the United States and
England. American Journal of Epidemiology Advance Access published March 9, 2011
Smith, J.P., and G. Smith (2010). Long-term economic costs of psychological problems during
childhood. Social Science and Medicine 71(1):110-15.
Smith, J.P. (2009a). Reconstructing childhood health histories. Demography, 46(2), 387-403.
Smith, J.P. (2009b). The impact of childhood health on adult labor market outcomes. The Review of
Economics and Statistics 91(3):478-89.
25
APPENDIX
Table A.1 Modeling Country Differences in Adult Health Outcomes—Adding Childhood
Disease Indicators without Interaction Terms
(major) (minor) (major or minor) (Barker)
b b b b
age 0.175** 0.240** 0.255** 0.199**
age2 -0.018** -0.036** -0.039** -0.026**
male 0.055** -0.019 -0.017 0.093**
mother died 0.117** 0.114** 0.103** 0.153**
mother age died -0.001** -0.001* -0.001* -0.001**
father died 0.077* 0.099** 0.121** 0.182**
father age died -0.001 -0.001** -0.002** -0.002**
ses_low 0.016 0.040** 0.038** 0.037**
height -0.002 -0.004* -0.002 -0.009**
exc health as child -0.023* -0.045** -0.047** -0.018
ear problems 0.044* 0.025* 0.023* 0.015
respiratory 0.069** 0.026* 0.040** 0.009
allergies -0.003 -0.009 -0.012 -0.007
asthma 0.064** -0.008 0.005 0.018
rare 0.090** 0.042** 0.042** 0.047**
all other 0.007 0.007 0.005 -0.006
US 0.082* 0.113* 0.136** 0.113**
Age*US 0.003 -0.039 -0.070** -0.010
age2*US 0.004 0.005 0.010* 0.000
male*US 0.023 -0.005 0.013 -0.024
mother died*US 0.019 -0.044 -0.015 -0.007
mother age died*US 0.000 0.001 0.000 0.000
father died*US 0.071 0.010 -0.011 0.017
father age died*US -0.001 0.001 0.001* 0.000
ses_low*US 0.012 -0.019 -0.016 -0.004
height*US 0.001 0.002 0.000 0.005*
ex health as child*US -0.020 0.011 0.019 -0.015
constant -0.027 0.385** 0.407** 0.173**
N 19,583 19,583 19,583 19,583
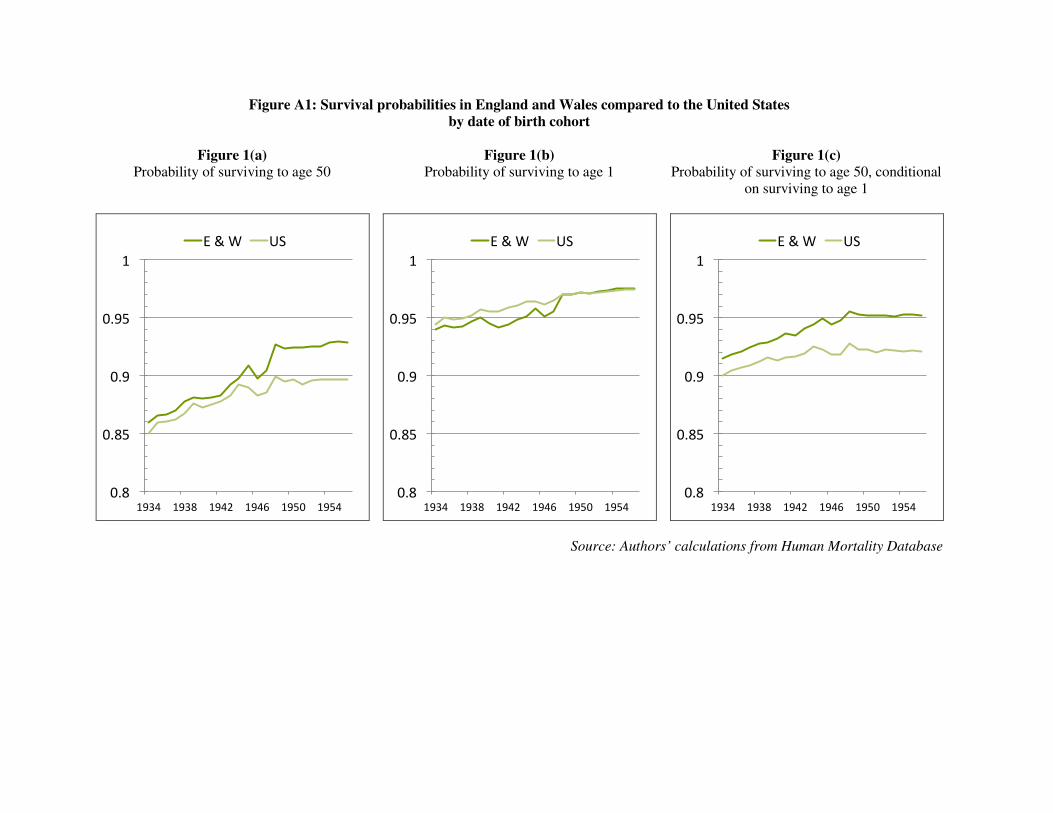
Figure A1: Survival probabilities in England and Wales compared to the United States
by date of birth cohort
Figure 1(a)
Probability of surviving to age 50
0.8
0.85
0.9
0.95
1
1934 1938 1942 1946 1950 1954
E & W US
Figure 1(b)
Probability of surviving to age 1
0.8
0.85
0.9
0.95
1
1934 1938 1942 1946 1950 1954
E & W US
Figure 1(c)
Probability of surviving to age 50, conditional
on surviving to age 1
0.8
0.85
0.9
0.95
1
1934 1938 1942 1946 1950 1954
E & W US
Source: Authors’ calculations from Human Mortality Database