Embed Size (px)
Citation preview
ChinaChina: Macro-Economic Policy and Performance
During Transition
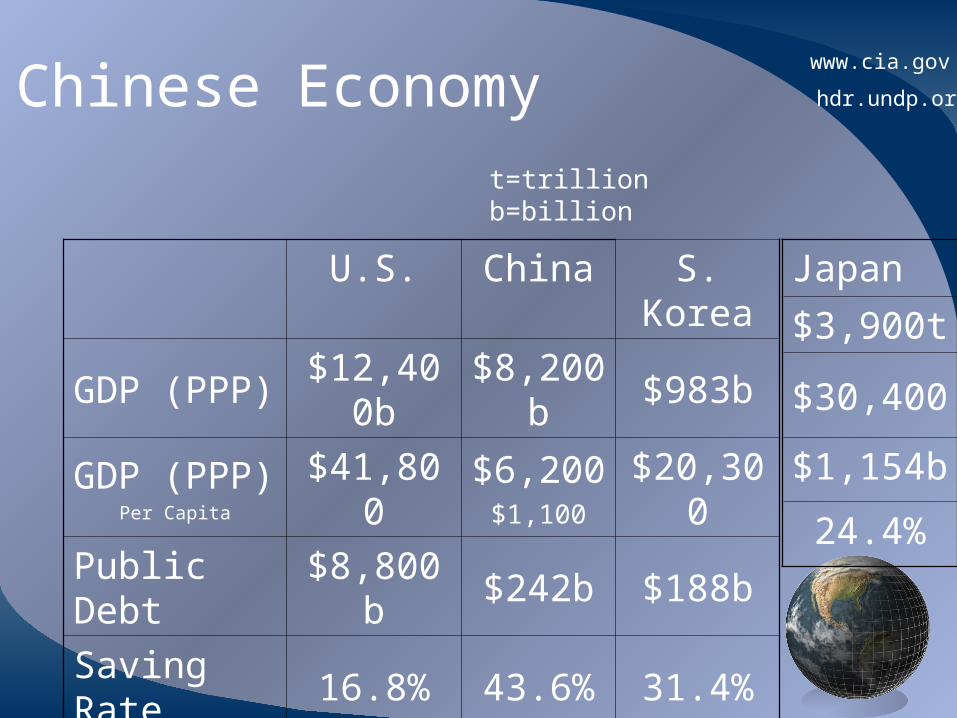
Chinese Economywww.cia.gov
U.S. China S. Korea
GDP (PPP) $12,400b $8,200b $983b
GDP (PPP)Per Capita
$41,800 $6,200$1,100
$20,300
Public Debt $8,800b $242b $188b
Saving Rate 16.8% 43.6% 31.4%
t=trillionb=billion
Japan
$3,900t
$30,400
$1,154b
24.4%
hdr.undp.org
Special Economic Zones
• Zones that offer various incentives (such as tax incentives for foreign investors, and greater independence for international trade)
• These incentives target export markets and production and pricing in these zones are market oriented.
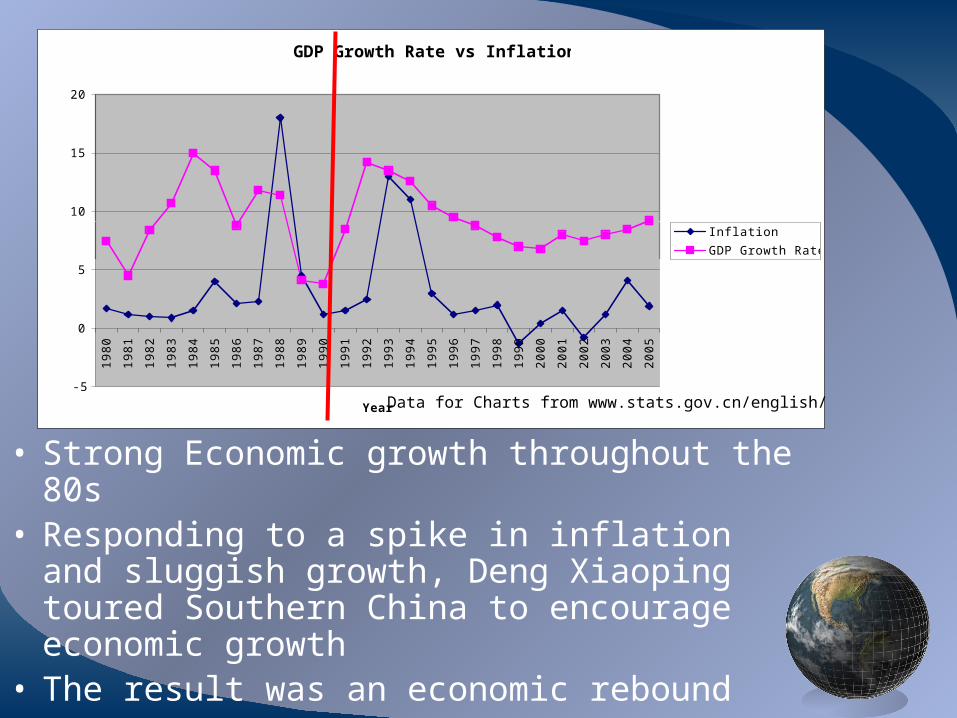
GDP Growth Rate vs Inflation
-5
0
5
10
15
201
98
0
19
81
19
82
19
83
19
84
19
85
19
86
19
87
19
88
19
89
19
90
19
91
19
92
19
93
19
94
19
95
19
96
19
97
19
98
19
99
20
00
20
01
20
02
20
03
20
04
20
05
Year
% G
row
th
Inflation
GDP Growth Rate
• Strong Economic growth throughout the 80s• Responding to a spike in inflation and
sluggish growth, Deng Xiaoping toured Southern China to encourage economic growth
• The result was an economic rebound
Data for Charts from www.stats.gov.cn/english/
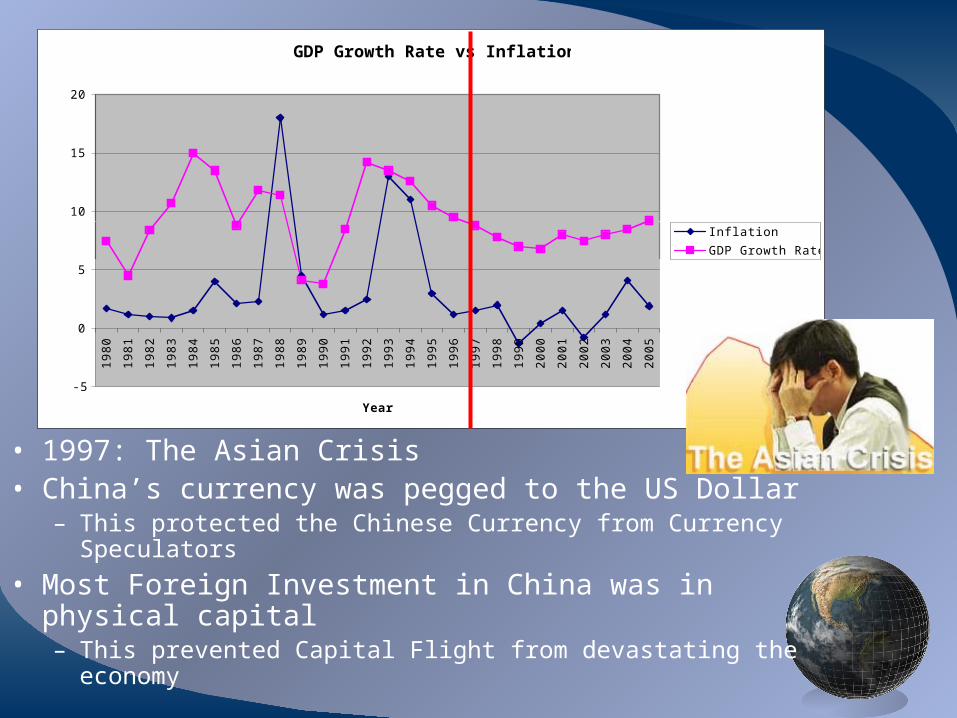
GDP Growth Rate vs Inflation
-5
0
5
10
15
201
98
0
19
81
19
82
19
83
19
84
19
85
19
86
19
87
19
88
19
89
19
90
19
91
19
92
19
93
19
94
19
95
19
96
19
97
19
98
19
99
20
00
20
01
20
02
20
03
20
04
20
05
Year
% G
row
th
Inflation
GDP Growth Rate
• 1997: The Asian Crisis• China’s currency was pegged to the US Dollar
– This protected the Chinese Currency from Currency Speculators
• Most Foreign Investment in China was in physical capital– This prevented Capital Flight from devastating the economy
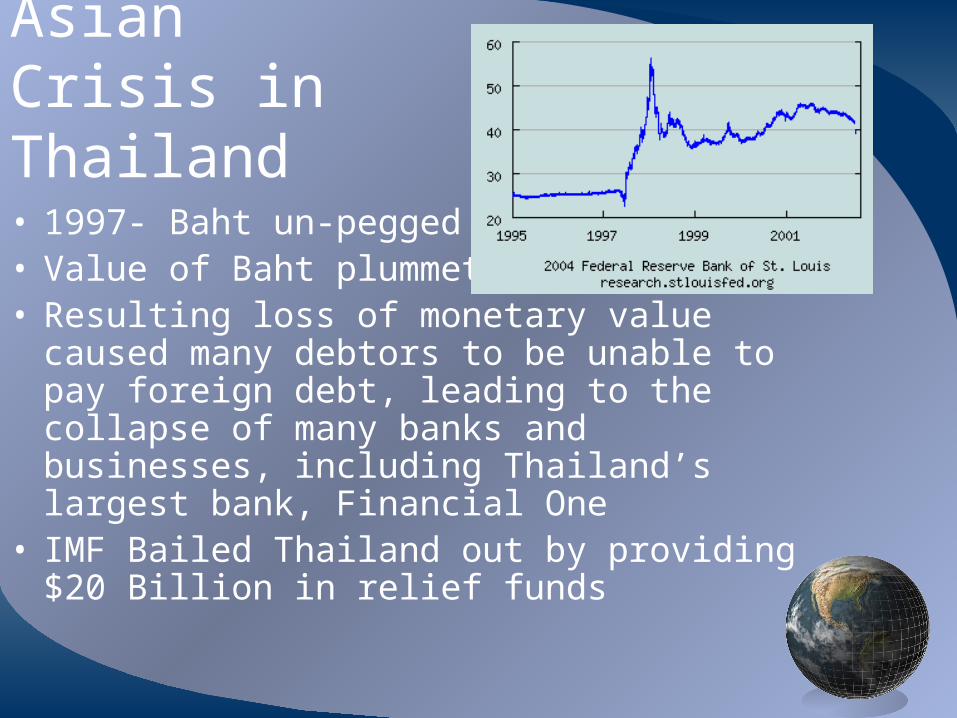
Asian Crisis in Thailand
• 1997- Baht un-pegged• Value of Baht plummets• Resulting loss of monetary value caused
many debtors to be unable to pay foreign debt, leading to the collapse of many banks and businesses, including Thailand’s largest bank, Financial One
• IMF Bailed Thailand out by providing $20 Billion in relief funds
• China’s Exports dropped
as a result of the worsening Global Economy• Deflation of prices experienced for the first time• Government employed an Expansionary Fiscal Policy• China’s currency, the RMB, was pegged at a
constant 8.3 RMB to the American Dollar. As the prices of other Asian Countries’ currency fell, Chinese Exports became relatively more expensive, however China managed to endure this and maintain the constant value.
Asian Crisis in China
Macro-economic Equation• Y = C + I + G + NX
• NFI + I = (Y - C - T) + (T - G)• (Y - C - T), or the Private Savings Rate last measured at
12.5% can be attributed to a strong desire to invest at the household level.
• High Private Savings have led to high rates of Domestic Investment in small business.
• Many entrepreneurs must save their own starting capital instead of relying on bank, thus the high levels of Private Savings.
• The Private Savings not used to invest in small business can be sent overseas to invest in foreign markets and capital.

Macro-economic Equation• Y = C + I + G + NX
• NFI + I = (Y - C - T) + (T - G)• Public Savings last year were -$32.2 Billion,
or a debt of about 1.7% of GDP (vice 12.5% Private Savings)
• Total Savings is highly positive, allowing for both high Domestic and Foreign Investments.
• Growth of small business is high, but still relatively small compared to the Savings Rate
Engle Curve vs Trade Balance
-20
-10
0
10
20
30
40
50
60
70
1980
1985
1989
1990
1991
1992
1993
1994
1995
1996
1997
1998
1999
2000
2001
2002
2003
Year
Hundre
ds o
f B
illions (
% f
or
Engle
) EngleCoefficientRural
EngleCoefficientUrban
TradeBalance(Hundredsof Billions
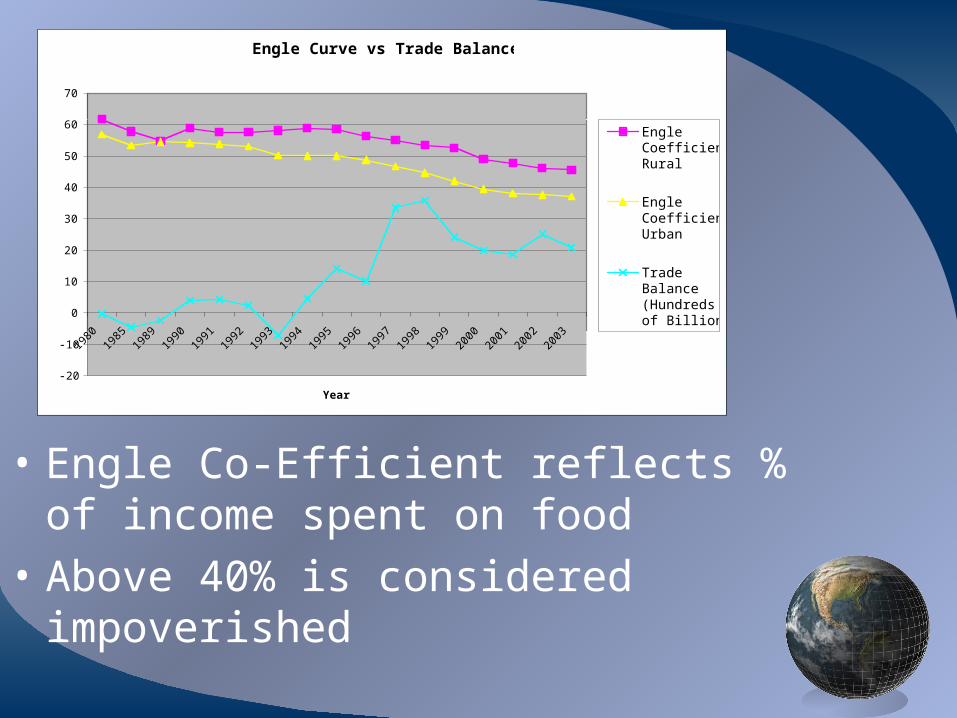
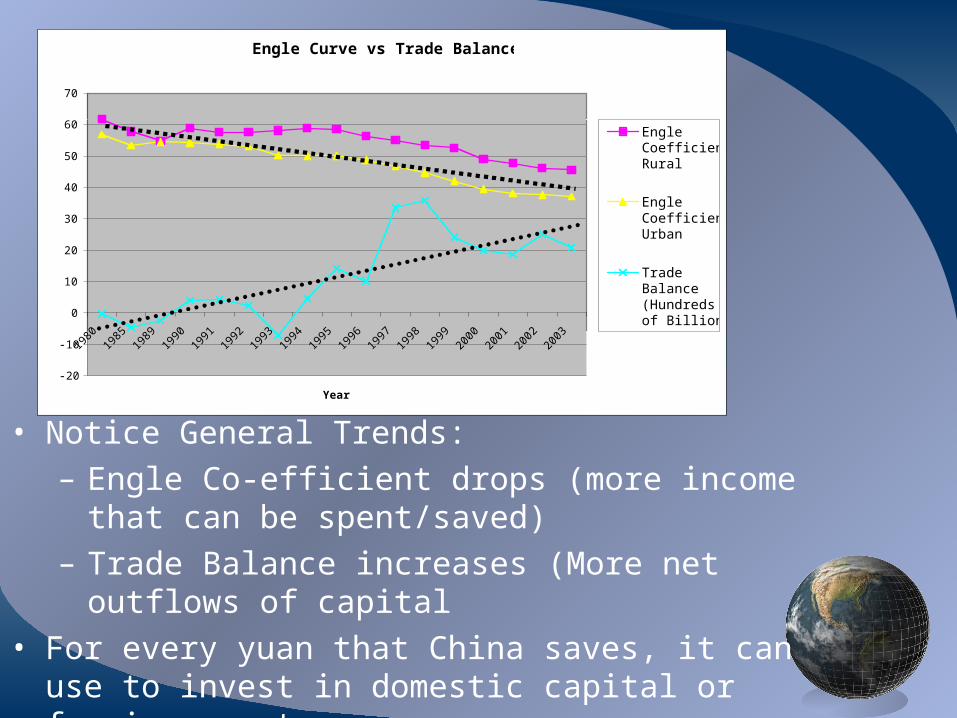
• Engle Co-Efficient reflects % of income spent on food
• Above 40% is considered impoverished
Engle Curve vs Trade Balance
-20
-10
0
10
20
30
40
50
60
70
1980
1985
1989
1990
1991
1992
1993
1994
1995
1996
1997
1998
1999
2000
2001
2002
2003
Year
Hundre
ds o
f B
illions (
% f
or
Engle
) EngleCoefficientRural
EngleCoefficientUrban
TradeBalance(Hundredsof Billions
• Notice General Trends:– Engle Co-efficient drops (more income that can be
spent/saved)– Trade Balance increases (More net outflows of
capital• For every yuan that China saves, it can use to invest
in domestic capital or foreign assets
One idea for further research
• How can the Chinese Economy continue its explosive growth while making a more favorable trade balance, both for the Chinese people and all of China’s trading partners.– Perhaps the recent un-pegging of the
Chinese Yuan will help to alleviate this problem?
Questions?
Ma YuanWalking on a Mountain Path
kaladarshan.arts.ohio-state.eduSouthern Song dynasty