Embed Size (px)
Citation preview
China Steel Corporation and Subsidiaries Consolidated Financial Statements for the Years Ended December 31, 2017 and 2016 and Independent Auditors’ Report
- 2 -
materials and finished goods in steel industry and inventory valuation involved critical accounting estimates,
inventory valuation is deemed to be a key audit matter. Refer to Notes 4, 5 and 13 to the consolidated financial
statements for the related accounting policies and disclosures of inventory valuation.
We focused on inventory valuation and the key audit procedures we performed included:
1. We evaluated the appropriateness of the approach applied to inventory valuation.
2. We verified the completeness of inventory included in inventory valuation.
3. We tested the net realizable value of inventory items on a sample basis, and evaluated the underlying
assumptions and supporting documents, re-performed and calculated the appropriateness of net realizable
value and the value written - off.
Valuation of Available-For-Sale Financial Assets - Formosa Ha Tinh (Cayman) Limited
As of December 31, 2017, through its subsidiary, China Steel Asia Pacific Holdings Pte Ltd., the Corporation
invested in Formosa Ha Tinh (Cayman) Limited the amount of NT$31,471,200 thousand, representing 5% of
the Corporation and its subsidiaries’ total assets. Such investment is unlisted investment. The Corporation
hired an appraiser who composed the valuation report used as the basis for determining the fair value of the
investment. The appraiser adopted income approach, and used as basis the income data of Formosa Ha Tinh
Steel Corporation, a wholly-owned subsidiary of Formosa Ha Tinh (Cayman) Limited. The valuation model
involved various assumptions and unobservable inputs, including the future profitability, the estimation of
future cash flows, revenue growth rate, and rate of return to Formosa Ha Tinh Steel Corporation. As a result,
the fair value of the investment in Formosa Ha Tinh (Cayman) Limited is deemed to be a key audit matter.
Refer to Note 4 to the consolidated financial statements for the related accounting policies on valuation of
financial assets.
The key audit procedures we performed included:
1. We assessed the professional qualifications, competence, objectivity and independence of the appraiser hired
by the management.
2. We discussed with the management the scope of work performed by the independent appraiser, reviewed the
contract terms and conditions signed by the Corporation and the appraiser, and we identified no concerns over
the appraiser’s objectivity or any restriction imposed on the scope of the work.
3. We confirmed the valuation method the independent appraiser adopted is complied with IFRSs.
4. We reviewed the reasonableness of financial forecasts the independent appraiser adopted.
We also consulted our internal experts in the assessment of the appropriateness of the appraisal and in verifying
the key assumptions and the reasonableness of key inputs, including weighted average cost of capital and
discount rate.
Other Matter
Certain investments accounted for using the equity method, in the consolidated financial statements as of
December 31, 2016 and for the year then ended were based on financial statements audited by other independent
auditors. Such investments accounted for using the equity method amounted to NT$34,874,658 thousand,
representing 5% of the Corporation and its subsidiaries’ total assets, as of December 31, 2016, and the share of
comprehensive income amounted to loss NT$875,298 thousand and NT$969,122 thousand, representing 5% of
the Corporation and its subsidiaries’ total comprehensive income, for the years ended December 31, 2017 and
2016.
We have also audited the standalone financial statements of China Steel Corporation as of and for the years
ended December 31, 2017 and 2016 on which we have issued an unmodified opinion.
- 3 -
Responsibilities of Management and Those Charged with Governance for the Consolidated Financial
Statements
Management is responsible for the preparation and fair presentation of the consolidated financial statements in
accordance with the Regulations Governing the Preparation of Financial Reports by Securities Issuers, and for
such internal control as management determines is necessary to enable the preparation of consolidated financial
statements that are free from material misstatement, whether due to fraud or error.
In preparing the consolidated financial statements, management is responsible for assessing the Corporation and
its subsidiaries’ ability to continue as a going concern, disclosing, as applicable, matters related to going
concern and using the going concern basis of accounting unless management either intends to liquidate the
Corporation and its subsidiaries or to cease operations, or has no realistic alternative but to do so.
Those charged with governance, including the audit committee, are responsible for overseeing the Corporation
and its subsidiaries’ financial reporting process.
Auditors’ Responsibilities for the Audit of the Consolidated Financial Statements
Our objectives are to obtain reasonable assurance about whether the consolidated financial statements as a
whole are free from material misstatement, whether due to fraud or error, and to issue an auditors’ report that
includes our opinion. Reasonable assurance is a high level of assurance, but is not a guarantee that an audit
conducted in accordance with the auditing standards generally accepted in the Republic of China will always
detect a material misstatement when it exists. Misstatements can arise from fraud or error and are considered
material if, individually or in the aggregate, they could reasonably be expected to influence the economic
decisions of users taken on the basis of these consolidated financial statements.
As part of an audit in accordance with the auditing standards generally accepted in the Republic of China, we
exercise professional judgment and maintain professional skepticism throughout the audit. We also:
1. Identify and assess the risks of material misstatement of the consolidated financial statements, whether due to
fraud or error, design and perform audit procedures responsive to those risks, and obtain audit evidence that is
sufficient and appropriate to provide a basis for our opinion. The risk of not detecting a material
misstatement resulting from fraud is higher than for one resulting from error, as fraud may involve collusion,
forgery, intentional omissions, misrepresentations, or the override of internal control.
2 Obtain an understanding of internal control relevant to the audit in order to design audit procedures that are
appropriate in the circumstances, but not for the purpose of expressing an opinion on the effectiveness of the
Corporation and its subsidiaries’ internal control.
3. Evaluate the appropriateness of accounting policies used and the reasonableness of accounting estimates and
related disclosures made by management.
4. Conclude on the appropriateness of management’s use of the going concern basis of accounting and, based on
the audit evidence obtained, whether a material uncertainty exists related to events or conditions that may cast
significant doubt on the Corporation and its subsidiaries’ ability to continue as a going concern. If we
conclude that a material uncertainty exists, we are required to draw attention in our auditors’ report to the
related disclosures in the consolidated financial statements or, if such disclosures are inadequate, to modify
our opinion. Our conclusions are based on the audit evidence obtained up to the date of our auditors’ report.
However, future events or conditions may cause the Corporation and its subsidiaries to cease to continue as a
going concern.
5. Evaluate the overall presentation, structure and content of the consolidated financial statements, including the
disclosures, and whether the consolidated financial statements represent the underlying transactions and
events in a manner that achieves fair presentation.
- 4 -
6. Obtain sufficient and appropriate audit evidence regarding the financial information of entities or business
activities within the Corporation and its subsidiaries to express an opinion on the consolidated financial
statements. We are responsible for the direction, supervision, and performance of the Corporation and its
subsidiaries audit. We remain solely responsible for our audit opinion.
We communicate with those charged with governance regarding, among other matters, the planned scope and
timing of the audit and significant audit findings, including any significant deficiencies in internal control that
we identify during our audit.
We also provide those charged with governance with a statement that we have complied with relevant ethical
requirements regarding independence, and to communicate with them all relationships and other matters that
may reasonably be thought to bear on our independence, and where applicable, related safeguards.
From the matters communicated with those charged with governance, we determine those matters that were of
most significance in the audit of the consolidated financial statements for the year ended December 31, 2017
and are therefore the key audit matters. We describe these matters in our auditors’ report unless law or
regulation precludes public disclosure about the matter or when, in extremely rare circumstances, we determine
that a matter should not be communicated in our report because the adverse consequences of doing so would
reasonably be expected to outweigh the public interest benefits of such communication.
The engagement partners on the audit resulting in this independent auditors’ report are Lee-Yuan Kuo and
Cheng-Hung Kuo.
Deloitte & Touche
Taipei, Taiwan
Republic of China
March 28, 2018
Notice to Readers
The accompanying consolidated financial statements are intended only to present the consolidated financial
position, financial performance and cash flows in accordance with accounting principles and practices
generally accepted in the Republic of China and not those of any other jurisdictions. The standards,
procedures and practices to audit such consolidated financial statements are those generally applied in the
Republic of China.
For the convenience of readers, the independent auditors’ report and the accompanying consolidated financial
statements have been translated into English from the original Chinese version prepared and used in the
Republic of China. If there is any conflict between the English version and the original Chinese version or any
difference in the interpretation of the two versions, the Chinese-language independent auditors’ report and
consolidated financial statements shall prevail. As stated in Note 4 to the consolidated financial statements,
the additional footnote disclosures that are not required under generally accepted accounting principles were
not translated into English.
- 5 -
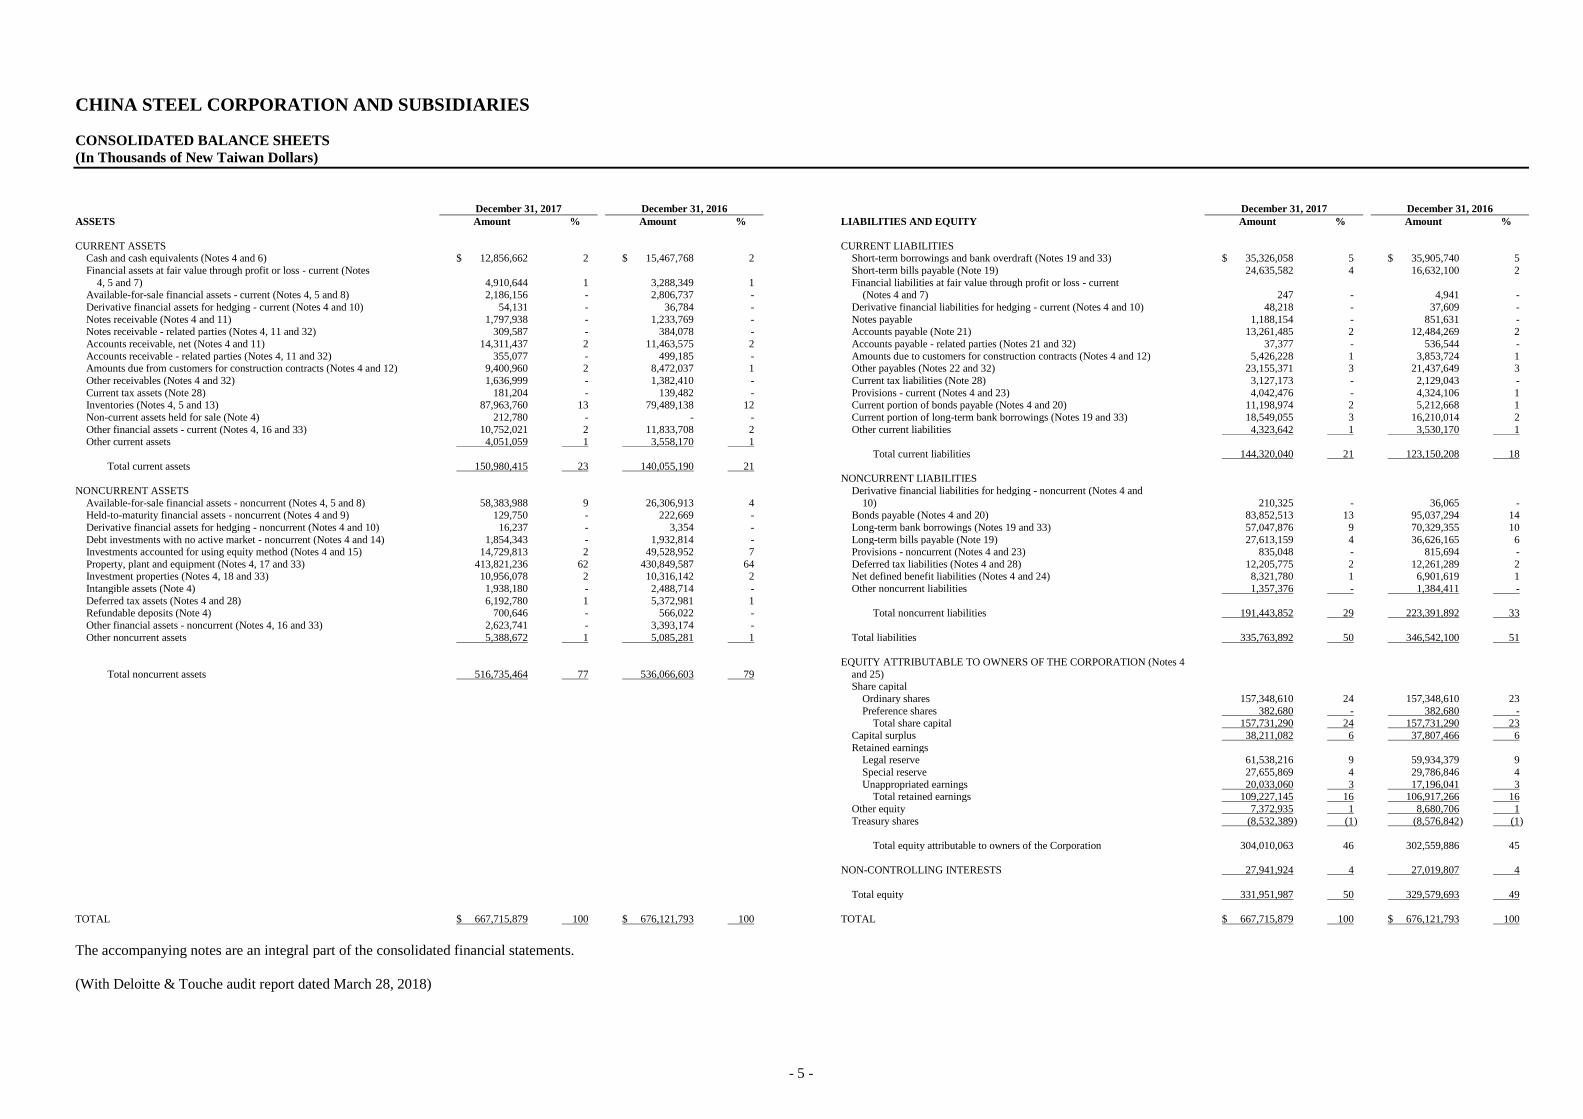
CHINA STEEL CORPORATION AND SUBSIDIARIES
CONSOLIDATED BALANCE SHEETS
(In Thousands of New Taiwan Dollars)
December 31, 2017 December 31, 2016 December 31, 2017 December 31, 2016
ASSETS Amount % Amount % LIABILITIES AND EQUITY Amount % Amount %
CURRENT ASSETS CURRENT LIABILITIES Cash and cash equivalents (Notes 4 and 6) $ 12,856,662 2 $ 15,467,768 2 Short-term borrowings and bank overdraft (Notes 19 and 33) $ 35,326,058 5 $ 35,905,740 5
Financial assets at fair value through profit or loss - current (Notes Short-term bills payable (Note 19) 24,635,582 4 16,632,100 2
4, 5 and 7) 4,910,644 1 3,288,349 1 Financial liabilities at fair value through profit or loss - current Available-for-sale financial assets - current (Notes 4, 5 and 8) 2,186,156 - 2,806,737 - (Notes 4 and 7) 247 - 4,941 -
Derivative financial assets for hedging - current (Notes 4 and 10) 54,131 - 36,784 - Derivative financial liabilities for hedging - current (Notes 4 and 10) 48,218 - 37,609 -
Notes receivable (Notes 4 and 11) 1,797,938 - 1,233,769 - Notes payable 1,188,154 - 851,631 - Notes receivable - related parties (Notes 4, 11 and 32) 309,587 - 384,078 - Accounts payable (Note 21) 13,261,485 2 12,484,269 2
Accounts receivable, net (Notes 4 and 11) 14,311,437 2 11,463,575 2 Accounts payable - related parties (Notes 21 and 32) 37,377 - 536,544 -
Accounts receivable - related parties (Notes 4, 11 and 32) 355,077 - 499,185 - Amounts due to customers for construction contracts (Notes 4 and 12) 5,426,228 1 3,853,724 1 Amounts due from customers for construction contracts (Notes 4 and 12) 9,400,960 2 8,472,037 1 Other payables (Notes 22 and 32) 23,155,371 3 21,437,649 3
Other receivables (Notes 4 and 32) 1,636,999 - 1,382,410 - Current tax liabilities (Note 28) 3,127,173 - 2,129,043 -
Current tax assets (Note 28) 181,204 - 139,482 - Provisions - current (Notes 4 and 23) 4,042,476 - 4,324,106 1 Inventories (Notes 4, 5 and 13) 87,963,760 13 79,489,138 12 Current portion of bonds payable (Notes 4 and 20) 11,198,974 2 5,212,668 1
Non-current assets held for sale (Note 4) 212,780 - - - Current portion of long-term bank borrowings (Notes 19 and 33) 18,549,055 3 16,210,014 2
Other financial assets - current (Notes 4, 16 and 33) 10,752,021 2 11,833,708 2 Other current liabilities 4,323,642 1 3,530,170 1 Other current assets 4,051,059 1 3,558,170 1
Total current liabilities 144,320,040 21 123,150,208 18
Total current assets 150,980,415 23 140,055,190 21 NONCURRENT LIABILITIES
NONCURRENT ASSETS Derivative financial liabilities for hedging - noncurrent (Notes 4 and
Available-for-sale financial assets - noncurrent (Notes 4, 5 and 8) 58,383,988 9 26,306,913 4 10) 210,325 - 36,065 -
Held-to-maturity financial assets - noncurrent (Notes 4 and 9) 129,750 - 222,669 - Bonds payable (Notes 4 and 20) 83,852,513 13 95,037,294 14
Derivative financial assets for hedging - noncurrent (Notes 4 and 10) 16,237 - 3,354 - Long-term bank borrowings (Notes 19 and 33) 57,047,876 9 70,329,355 10
Debt investments with no active market - noncurrent (Notes 4 and 14) 1,854,343 - 1,932,814 - Long-term bills payable (Note 19) 27,613,159 4 36,626,165 6 Investments accounted for using equity method (Notes 4 and 15) 14,729,813 2 49,528,952 7 Provisions - noncurrent (Notes 4 and 23) 835,048 - 815,694 -
Property, plant and equipment (Notes 4, 17 and 33) 413,821,236 62 430,849,587 64 Deferred tax liabilities (Notes 4 and 28) 12,205,775 2 12,261,289 2 Investment properties (Notes 4, 18 and 33) 10,956,078 2 10,316,142 2 Net defined benefit liabilities (Notes 4 and 24) 8,321,780 1 6,901,619 1
Intangible assets (Note 4) 1,938,180 - 2,488,714 - Other noncurrent liabilities 1,357,376 - 1,384,411 -
Deferred tax assets (Notes 4 and 28) 6,192,780 1 5,372,981 1 Refundable deposits (Note 4) 700,646 - 566,022 - Total noncurrent liabilities 191,443,852 29 223,391,892 33
Other financial assets - noncurrent (Notes 4, 16 and 33) 2,623,741 - 3,393,174 -
Other noncurrent assets 5,388,672 1 5,085,281 1 Total liabilities 335,763,892 50 346,542,100 51
Total noncurrent assets 516,735,464 77 536,066,603 79
EQUITY ATTRIBUTABLE TO OWNERS OF THE CORPORATION (Notes 4
and 25) Share capital
Ordinary shares 157,348,610 24 157,348,610 23
Preference shares 382,680 - 382,680 -
Total share capital 157,731,290 24 157,731,290 23
Capital surplus 38,211,082 6 37,807,466 6
Retained earnings Legal reserve 61,538,216 9 59,934,379 9
Special reserve 27,655,869 4 29,786,846 4
Unappropriated earnings 20,033,060 3 17,196,041 3 Total retained earnings 109,227,145 16 106,917,266 16
Other equity 7,372,935 1 8,680,706 1
Treasury shares (8,532,389 ) (1 ) (8,576,842 ) (1 )
Total equity attributable to owners of the Corporation 304,010,063 46 302,559,886 45
NON-CONTROLLING INTERESTS 27,941,924 4 27,019,807 4
Total equity 331,951,987 50 329,579,693 49
TOTAL $ 667,715,879 100 $ 676,121,793 100 TOTAL $ 667,715,879 100 $ 676,121,793 100
The accompanying notes are an integral part of the consolidated financial statements.
(With Deloitte & Touche audit report dated March 28, 2018)
- 6 -
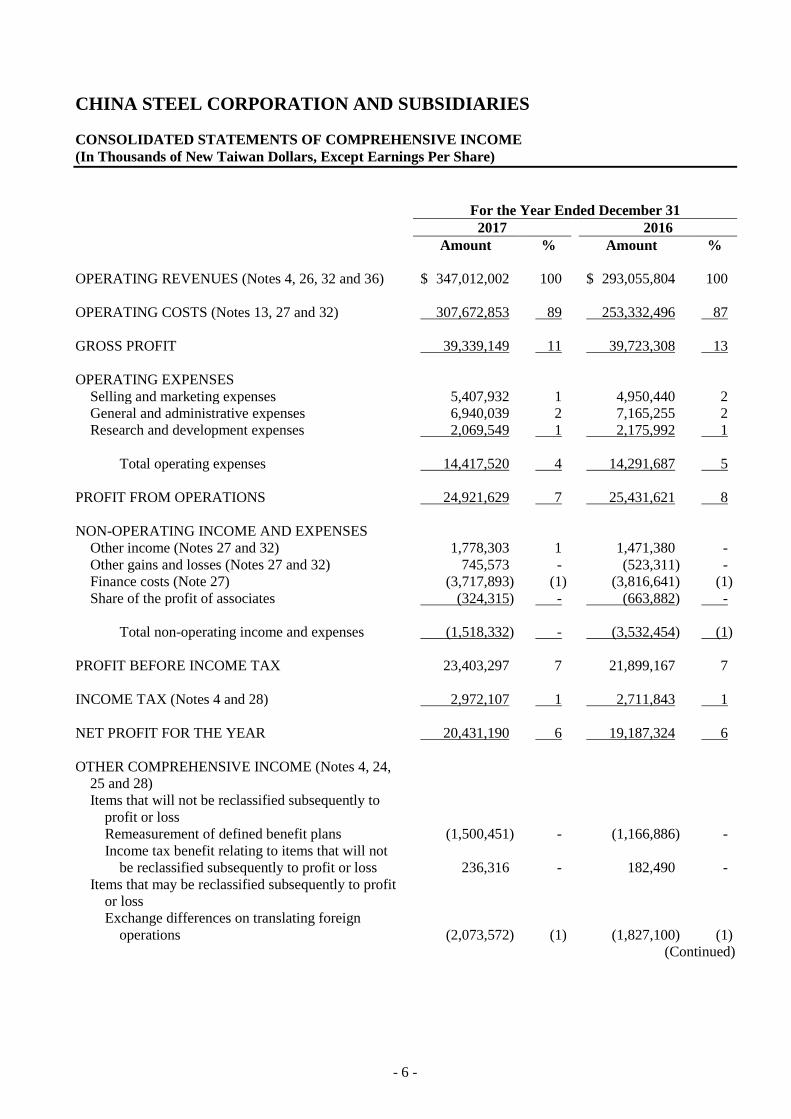
CHINA STEEL CORPORATION AND SUBSIDIARIES
CONSOLIDATED STATEMENTS OF COMPREHENSIVE INCOME
(In Thousands of New Taiwan Dollars, Except Earnings Per Share)
For the Year Ended December 31
2017 2016
Amount % Amount %
OPERATING REVENUES (Notes 4, 26, 32 and 36) $ 347,012,002 100 $ 293,055,804 100
OPERATING COSTS (Notes 13, 27 and 32) 307,672,853 89 253,332,496 87
GROSS PROFIT 39,339,149 11 39,723,308 13
OPERATING EXPENSES
Selling and marketing expenses 5,407,932 1 4,950,440 2
General and administrative expenses 6,940,039 2 7,165,255 2
Research and development expenses 2,069,549 1 2,175,992 1
Total operating expenses 14,417,520 4 14,291,687 5
PROFIT FROM OPERATIONS 24,921,629 7 25,431,621 8
NON-OPERATING INCOME AND EXPENSES
Other income (Notes 27 and 32) 1,778,303 1 1,471,380 -
Other gains and losses (Notes 27 and 32) 745,573 - (523,311) -
Finance costs (Note 27) (3,717,893) (1) (3,816,641) (1)
Share of the profit of associates (324,315) - (663,882) -
Total non-operating income and expenses (1,518,332) - (3,532,454) (1)
PROFIT BEFORE INCOME TAX 23,403,297 7 21,899,167 7
INCOME TAX (Notes 4 and 28) 2,972,107 1 2,711,843 1
NET PROFIT FOR THE YEAR 20,431,190 6 19,187,324 6
OTHER COMPREHENSIVE INCOME (Notes 4, 24,
25 and 28)
Items that will not be reclassified subsequently to
profit or loss
Remeasurement of defined benefit plans (1,500,451) - (1,166,886) -
Income tax benefit relating to items that will not
be reclassified subsequently to profit or loss 236,316 - 182,490 -
Items that may be reclassified subsequently to profit
or loss
Exchange differences on translating foreign
operations (2,073,572) (1) (1,827,100) (1)
(Continued)
- 7 -
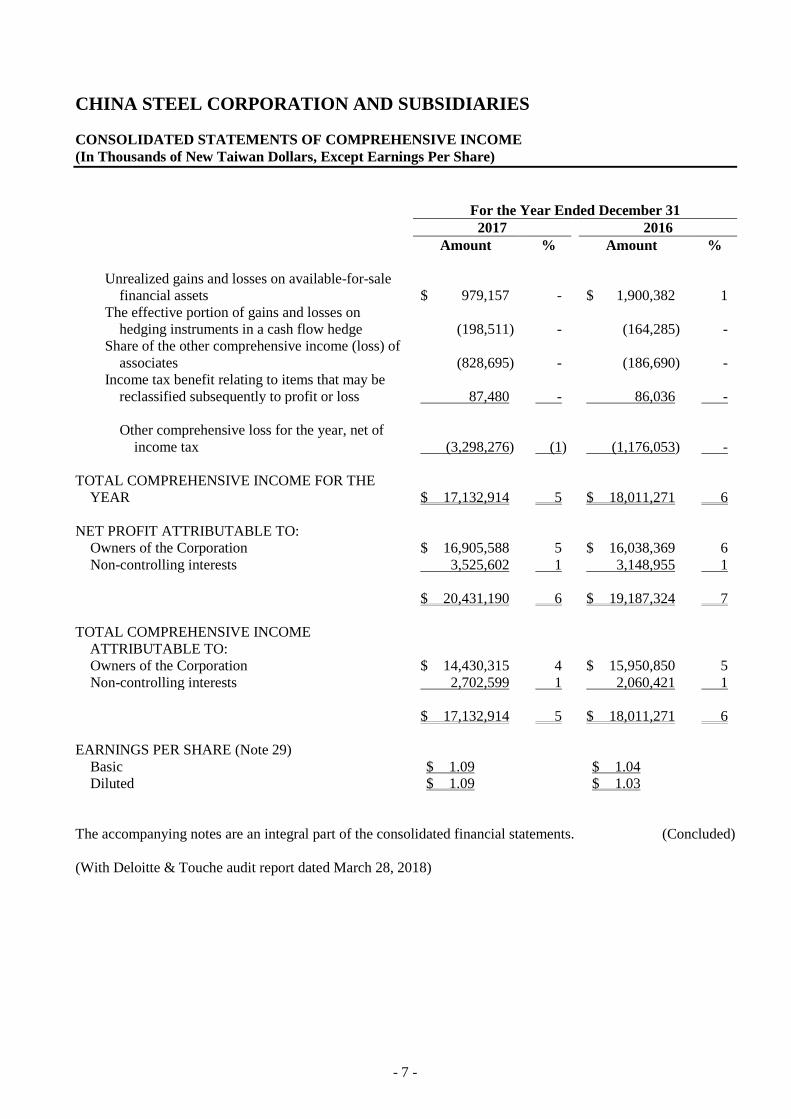
CHINA STEEL CORPORATION AND SUBSIDIARIES
CONSOLIDATED STATEMENTS OF COMPREHENSIVE INCOME
(In Thousands of New Taiwan Dollars, Except Earnings Per Share)
For the Year Ended December 31
2017 2016
Amount % Amount %
Unrealized gains and losses on available-for-sale
financial assets $ 979,157 - $ 1,900,382 1
The effective portion of gains and losses on
hedging instruments in a cash flow hedge (198,511) - (164,285) -
Share of the other comprehensive income (loss) of
associates (828,695) - (186,690) -
Income tax benefit relating to items that may be
reclassified subsequently to profit or loss 87,480 - 86,036 -
Other comprehensive loss for the year, net of
income tax (3,298,276) (1) (1,176,053) -
TOTAL COMPREHENSIVE INCOME FOR THE
YEAR $ 17,132,914 5 $ 18,011,271 6
NET PROFIT ATTRIBUTABLE TO:
Owners of the Corporation $ 16,905,588 5 $ 16,038,369 6
Non-controlling interests 3,525,602 1 3,148,955 1
$ 20,431,190 6 $ 19,187,324 7
TOTAL COMPREHENSIVE INCOME
ATTRIBUTABLE TO:
Owners of the Corporation $ 14,430,315 4 $ 15,950,850 5
Non-controlling interests 2,702,599 1 2,060,421 1
$ 17,132,914 5 $ 18,011,271 6
EARNINGS PER SHARE (Note 29)
Basic $ 1.09 $ 1.04
Diluted $ 1.09 $ 1.03
The accompanying notes are an integral part of the consolidated financial statements. (Concluded)
(With Deloitte & Touche audit report dated March 28, 2018)
- 8 -
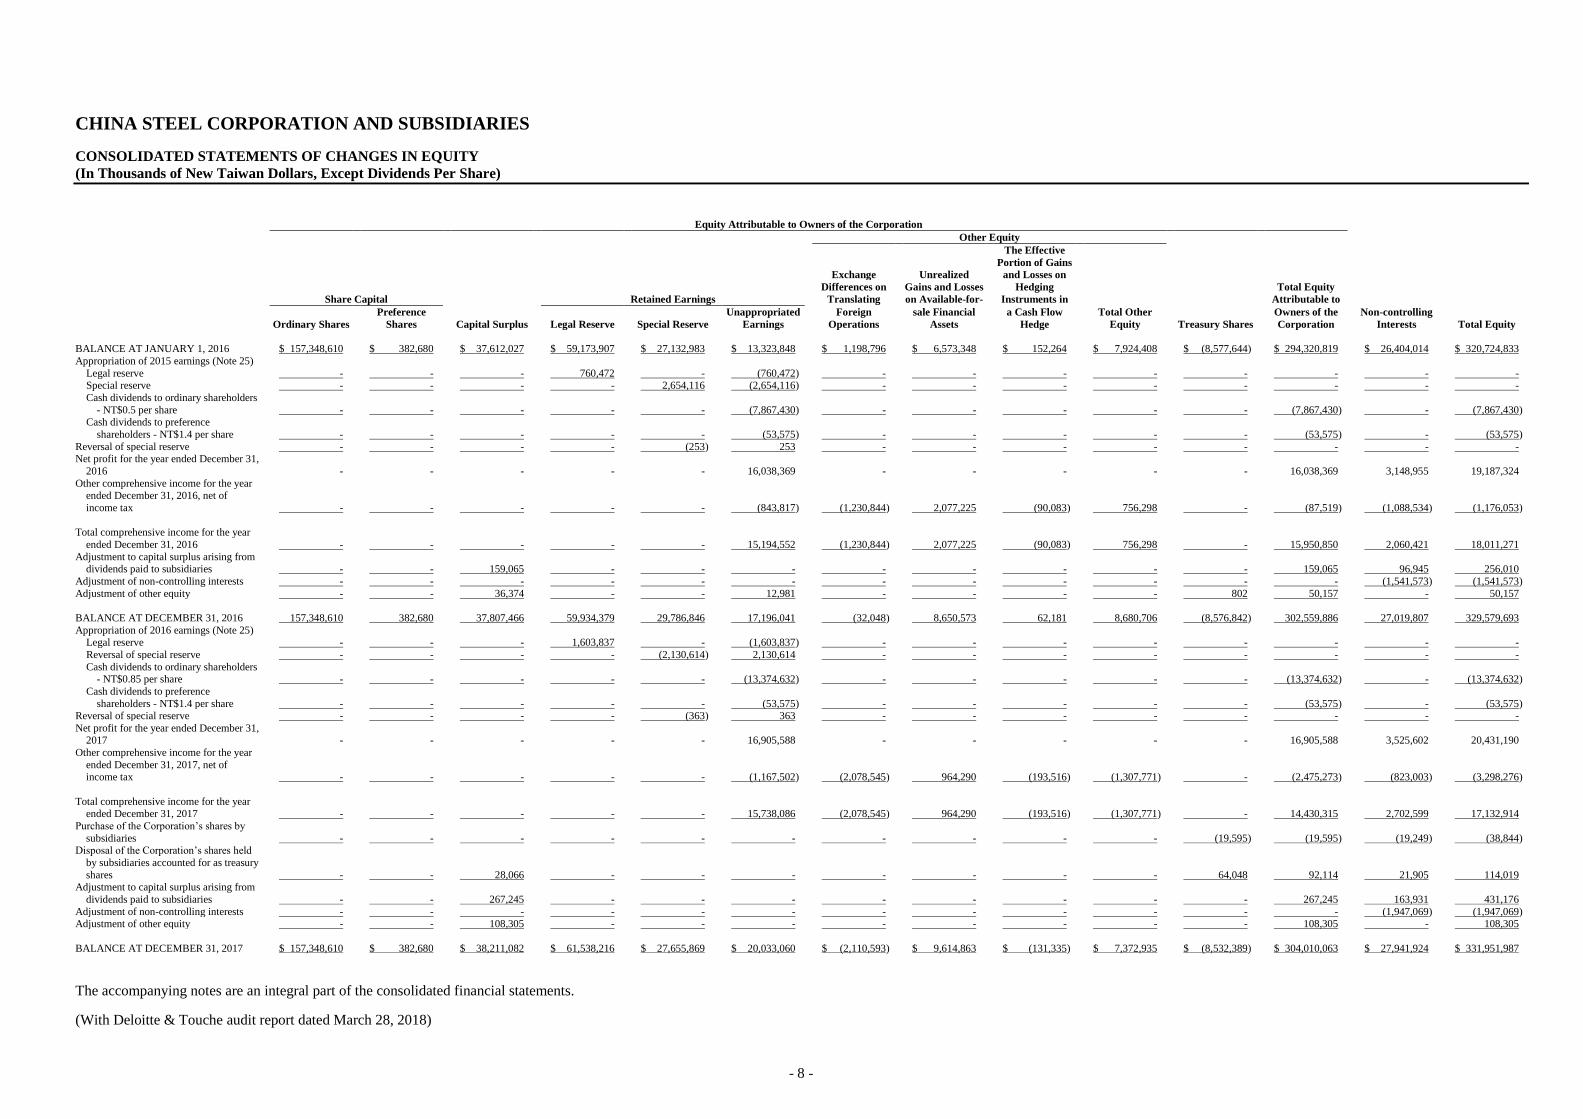
CHINA STEEL CORPORATION AND SUBSIDIARIES
CONSOLIDATED STATEMENTS OF CHANGES IN EQUITY
(In Thousands of New Taiwan Dollars, Except Dividends Per Share)
Equity Attributable to Owners of the Corporation
Other Equity
The Effective
Portion of Gains Exchange Unrealized and Losses on
Differences on Gains and Losses Hedging Total Equity
Share Capital Retained Earnings Translating on Available-for- Instruments in Attributable to
Preference Unappropriated Foreign sale Financial a Cash Flow Total Other Owners of the Non-controlling
Ordinary Shares Shares Capital Surplus Legal Reserve Special Reserve Earnings Operations Assets Hedge Equity Treasury Shares Corporation Interests Total Equity
BALANCE AT JANUARY 1, 2016 $ 157,348,610 $ 382,680 $ 37,612,027 $ 59,173,907 $ 27,132,983 $ 13,323,848 $ 1,198,796 $ 6,573,348 $ 152,264 $ 7,924,408 $ (8,577,644 ) $ 294,320,819 $ 26,404,014 $ 320,724,833
Appropriation of 2015 earnings (Note 25)
Legal reserve - - - 760,472 - (760,472 ) - - - - - - - - Special reserve - - - - 2,654,116 (2,654,116 ) - - - - - - - -
Cash dividends to ordinary shareholders
- NT$0.5 per share - - - - - (7,867,430 ) - - - - - (7,867,430 ) - (7,867,430 ) Cash dividends to preference
shareholders - NT$1.4 per share - - - - - (53,575 ) - - - - - (53,575 ) - (53,575 )
Reversal of special reserve - - - - (253 ) 253 - - - - - - - - Net profit for the year ended December 31,
2016 - - - - - 16,038,369 - - - - - 16,038,369 3,148,955 19,187,324
Other comprehensive income for the year ended December 31, 2016, net of
income tax - - - - - (843,817 ) (1,230,844 ) 2,077,225 (90,083 ) 756,298 - (87,519 ) (1,088,534 ) (1,176,053 )
Total comprehensive income for the year
ended December 31, 2016 - - - - - 15,194,552 (1,230,844 ) 2,077,225 (90,083 ) 756,298 - 15,950,850 2,060,421 18,011,271
Adjustment to capital surplus arising from dividends paid to subsidiaries - - 159,065 - - - - - - - - 159,065 96,945 256,010
Adjustment of non-controlling interests - - - - - - - - - - - - (1,541,573 ) (1,541,573 )
Adjustment of other equity - - 36,374 - - 12,981 - - - - 802 50,157 - 50,157
BALANCE AT DECEMBER 31, 2016 157,348,610 382,680 37,807,466 59,934,379 29,786,846 17,196,041 (32,048 ) 8,650,573 62,181 8,680,706 (8,576,842 ) 302,559,886 27,019,807 329,579,693
Appropriation of 2016 earnings (Note 25) Legal reserve - - - 1,603,837 - (1,603,837 ) - - - - - - - -
Reversal of special reserve - - - - (2,130,614 ) 2,130,614 - - - - - - - -
Cash dividends to ordinary shareholders - NT$0.85 per share - - - - - (13,374,632 ) - - - - - (13,374,632 ) - (13,374,632 )
Cash dividends to preference
shareholders - NT$1.4 per share - - - - - (53,575 ) - - - - - (53,575 ) - (53,575 ) Reversal of special reserve - - - - (363 ) 363 - - - - - - - -
Net profit for the year ended December 31, 2017 - - - - - 16,905,588 - - - - - 16,905,588 3,525,602 20,431,190
Other comprehensive income for the year
ended December 31, 2017, net of income tax - - - - - (1,167,502 ) (2,078,545 ) 964,290 (193,516 ) (1,307,771 ) - (2,475,273 ) (823,003 ) (3,298,276 )
Total comprehensive income for the year ended December 31, 2017 - - - - - 15,738,086 (2,078,545 ) 964,290 (193,516 ) (1,307,771 ) - 14,430,315 2,702,599 17,132,914
Purchase of the Corporation’s shares by
subsidiaries - - - - - - - - - - (19,595 ) (19,595 ) (19,249 ) (38,844 ) Disposal of the Corporation’s shares held
by subsidiaries accounted for as treasury
shares - - 28,066 - - - - - - - 64,048 92,114 21,905 114,019 Adjustment to capital surplus arising from
dividends paid to subsidiaries - - 267,245 - - - - - - - - 267,245 163,931 431,176
Adjustment of non-controlling interests - - - - - - - - - - - - (1,947,069 ) (1,947,069 ) Adjustment of other equity - - 108,305 - - - - - - - - 108,305 - 108,305
BALANCE AT DECEMBER 31, 2017 $ 157,348,610 $ 382,680 $ 38,211,082 $ 61,538,216 $ 27,655,869 $ 20,033,060 $ (2,110,593 ) $ 9,614,863 $ (131,335 ) $ 7,372,935 $ (8,532,389 ) $ 304,010,063 $ 27,941,924 $ 331,951,987
The accompanying notes are an integral part of the consolidated financial statements. (With Deloitte & Touche audit report dated March 28, 2018)
- 9 -
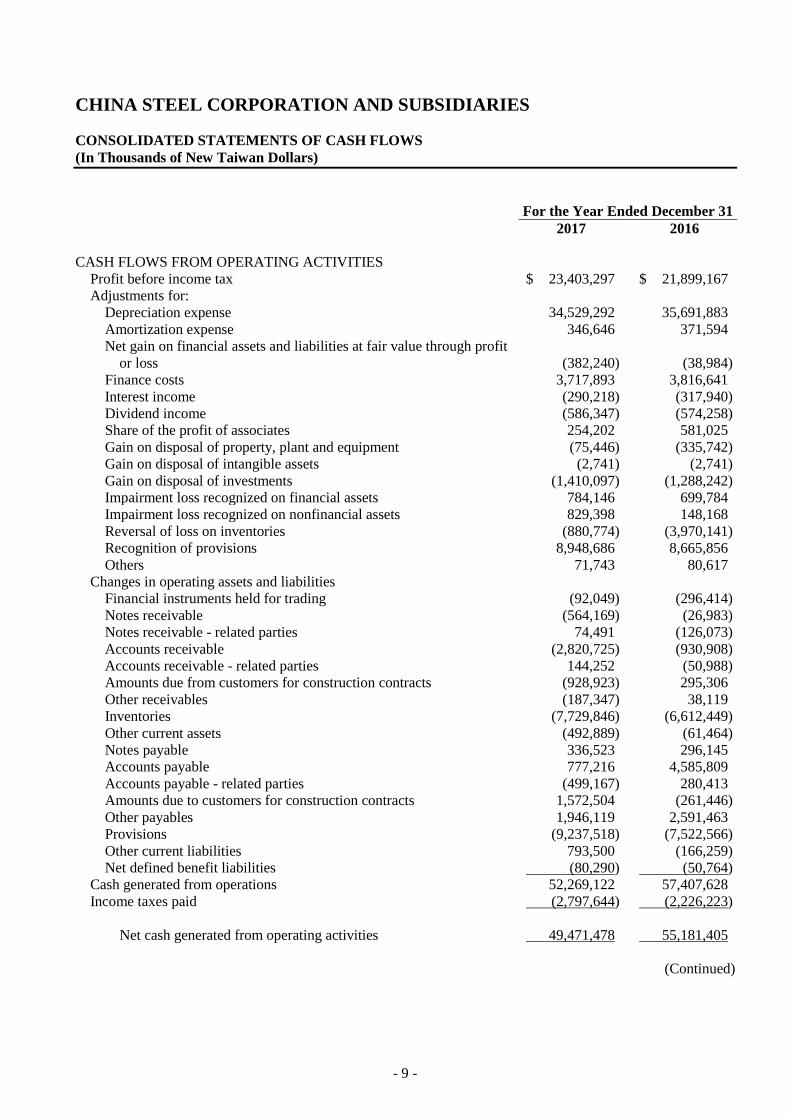
CHINA STEEL CORPORATION AND SUBSIDIARIES
CONSOLIDATED STATEMENTS OF CASH FLOWS
(In Thousands of New Taiwan Dollars)
For the Year Ended December 31
2017 2016
CASH FLOWS FROM OPERATING ACTIVITIES
Profit before income tax $ 23,403,297 $ 21,899,167
Adjustments for:
Depreciation expense 34,529,292 35,691,883
Amortization expense 346,646 371,594
Net gain on financial assets and liabilities at fair value through profit
or loss
(382,240) (38,984)
Finance costs 3,717,893 3,816,641
Interest income (290,218) (317,940)
Dividend income (586,347) (574,258)
Share of the profit of associates 254,202 581,025
Gain on disposal of property, plant and equipment (75,446) (335,742)
Gain on disposal of intangible assets (2,741) (2,741)
Gain on disposal of investments (1,410,097) (1,288,242)
Impairment loss recognized on financial assets 784,146 699,784
Impairment loss recognized on nonfinancial assets 829,398 148,168
Reversal of loss on inventories (880,774) (3,970,141)
Recognition of provisions 8,948,686 8,665,856
Others 71,743 80,617
Changes in operating assets and liabilities
Financial instruments held for trading (92,049) (296,414)
Notes receivable (564,169) (26,983)
Notes receivable - related parties 74,491 (126,073)
Accounts receivable (2,820,725) (930,908)
Accounts receivable - related parties 144,252 (50,988)
Amounts due from customers for construction contracts (928,923) 295,306
Other receivables (187,347) 38,119
Inventories (7,729,846) (6,612,449)
Other current assets (492,889) (61,464)
Notes payable 336,523 296,145
Accounts payable 777,216 4,585,809
Accounts payable - related parties (499,167) 280,413
Amounts due to customers for construction contracts 1,572,504 (261,446)
Other payables 1,946,119 2,591,463
Provisions (9,237,518) (7,522,566)
Other current liabilities 793,500 (166,259)
Net defined benefit liabilities (80,290) (50,764)
Cash generated from operations 52,269,122 57,407,628
Income taxes paid (2,797,644) (2,226,223)
Net cash generated from operating activities 49,471,478 55,181,405
(Continued)
- 10 -
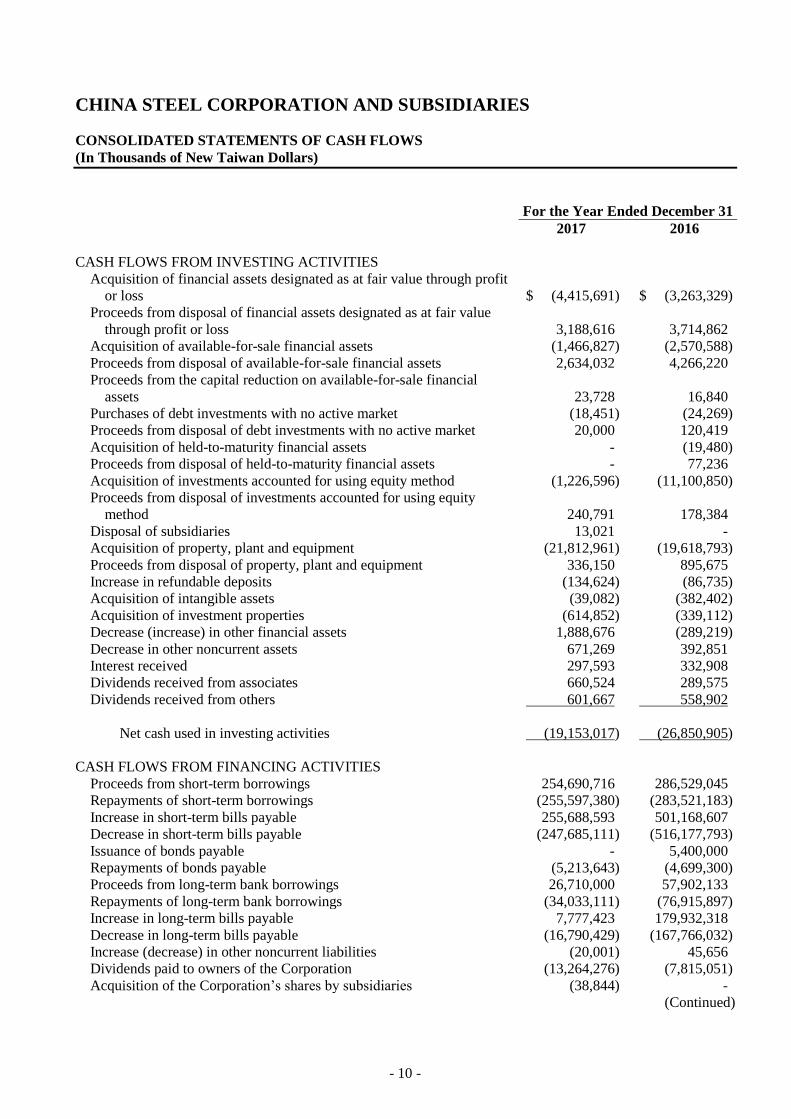
CHINA STEEL CORPORATION AND SUBSIDIARIES
CONSOLIDATED STATEMENTS OF CASH FLOWS
(In Thousands of New Taiwan Dollars)
For the Year Ended December 31
2017 2016
CASH FLOWS FROM INVESTING ACTIVITIES
Acquisition of financial assets designated as at fair value through profit
or loss
$ (4,415,691) $ (3,263,329)
Proceeds from disposal of financial assets designated as at fair value
through profit or loss
3,188,616 3,714,862
Acquisition of available-for-sale financial assets (1,466,827) (2,570,588)
Proceeds from disposal of available-for-sale financial assets 2,634,032 4,266,220
Proceeds from the capital reduction on available-for-sale financial
assets
23,728 16,840
Purchases of debt investments with no active market (18,451) (24,269)
Proceeds from disposal of debt investments with no active market 20,000 120,419
Acquisition of held-to-maturity financial assets - (19,480)
Proceeds from disposal of held-to-maturity financial assets - 77,236
Acquisition of investments accounted for using equity method (1,226,596) (11,100,850)
Proceeds from disposal of investments accounted for using equity
method
240,791 178,384
Disposal of subsidiaries 13,021 -
Acquisition of property, plant and equipment (21,812,961) (19,618,793)
Proceeds from disposal of property, plant and equipment 336,150 895,675
Increase in refundable deposits (134,624) (86,735)
Acquisition of intangible assets (39,082) (382,402)
Acquisition of investment properties (614,852) (339,112)
Decrease (increase) in other financial assets 1,888,676 (289,219)
Decrease in other noncurrent assets 671,269 392,851
Interest received 297,593 332,908
Dividends received from associates 660,524 289,575
Dividends received from others 601,667 558,902
Net cash used in investing activities (19,153,017) (26,850,905)
CASH FLOWS FROM FINANCING ACTIVITIES
Proceeds from short-term borrowings 254,690,716 286,529,045
Repayments of short-term borrowings (255,597,380) (283,521,183)
Increase in short-term bills payable 255,688,593 501,168,607
Decrease in short-term bills payable (247,685,111) (516,177,793)
Issuance of bonds payable - 5,400,000
Repayments of bonds payable (5,213,643) (4,699,300)
Proceeds from long-term bank borrowings 26,710,000 57,902,133
Repayments of long-term bank borrowings (34,033,111) (76,915,897)
Increase in long-term bills payable 7,777,423 179,932,318
Decrease in long-term bills payable (16,790,429) (167,766,032)
Increase (decrease) in other noncurrent liabilities (20,001) 45,656
Dividends paid to owners of the Corporation (13,264,276) (7,815,051)
Acquisition of the Corporation’s shares by subsidiaries (38,844) -
(Continued)
- 11 -
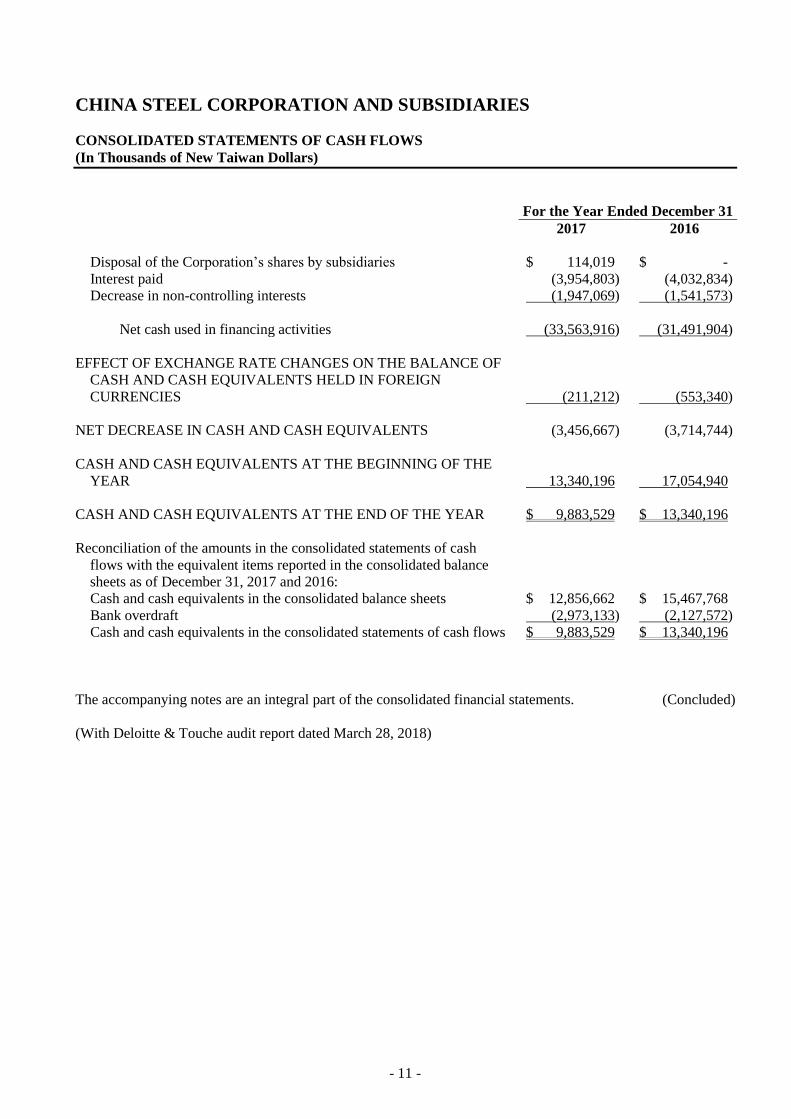
CHINA STEEL CORPORATION AND SUBSIDIARIES
CONSOLIDATED STATEMENTS OF CASH FLOWS
(In Thousands of New Taiwan Dollars)
For the Year Ended December 31
2017 2016
Disposal of the Corporation’s shares by subsidiaries $ 114,019 $ -
Interest paid (3,954,803) (4,032,834)
Decrease in non-controlling interests (1,947,069) (1,541,573)
Net cash used in financing activities (33,563,916) (31,491,904)
EFFECT OF EXCHANGE RATE CHANGES ON THE BALANCE OF
CASH AND CASH EQUIVALENTS HELD IN FOREIGN
CURRENCIES
(211,212) (553,340)
NET DECREASE IN CASH AND CASH EQUIVALENTS (3,456,667) (3,714,744)
CASH AND CASH EQUIVALENTS AT THE BEGINNING OF THE
YEAR
13,340,196 17,054,940
CASH AND CASH EQUIVALENTS AT THE END OF THE YEAR $ 9,883,529 $ 13,340,196
Reconciliation of the amounts in the consolidated statements of cash
flows with the equivalent items reported in the consolidated balance
sheets as of December 31, 2017 and 2016:
Cash and cash equivalents in the consolidated balance sheets $ 12,856,662 $ 15,467,768
Bank overdraft (2,973,133) (2,127,572)
Cash and cash equivalents in the consolidated statements of cash flows $ 9,883,529 $ 13,340,196
The accompanying notes are an integral part of the consolidated financial statements. (Concluded)
(With Deloitte & Touche audit report dated March 28, 2018)
- 12 -
CHINA STEEL CORPORATION AND SUBSIDIARIES
NOTES TO CONSOLIDATED FINANCIAL STATEMENTS
FOR THE YEARS ENDED DECEMBER 31, 2017 AND 2016
(In Thousands of New Taiwan Dollars, Unless Stated Otherwise)
1. GENERAL INFORMATION
China Steel Corporation (the Corporation) was incorporated on December 3, 1971. It manufactures and
sells steel products and engages in mechanical, communications, and electrical engineering.
The shares of the Corporation and its subsidiaries, including China Steel Structure Co., Ltd., China Steel
Chemical Corporation, CHC Resources Corporation, China Ecotek Corporation and Chung Hung Steel
Corporation Ltd., have been listed on the Taiwan Stock Exchange. The shares of the subsidiary Thintech
Materials Technology Co., Ltd. have been traded on the Taipei Exchange. The subsidiary Dragon Steel
Corporation has issued shares to the public.
As of December 31, 2017, the Ministry of Economic Affairs (MOEA), Republic of China owned 20.05 %
of the Corporation’s issued ordinary shares.
The consolidated financial statements are presented in the Corporation’s functional currency, New Taiwan
dollars.
2. APPROVAL OF FINANCIAL STATEMENTS
The consolidated financial statements were approved by the Corporation’s board of directors and authorized
for issue on March 28, 2018.
3. APPLICATION OF NEW AND AMENDED STANDARDS AND INTERPRETATIONS
a. Initial application of the amendments to the Regulations Governing the Preparation of Financial Reports
by Securities Issuers and the International Financial Reporting Standards (IFRS), International
Accounting Standards (IAS), Interpretations of IFRS (IFRIC), and Interpretations of IAS (SIC)
(collectively, the IFRSs) endorsed and issued into effect by the Financial Supervisory Commission
(FSC)
Except for the following, the initial application of the amendments to the Regulations Governing the
Preparation of Financial Reports by Securities Issuers and the IFRSs endorsed and issued into effect by
the FSC did not have any material impact on the Corporation and its subsidiaries’ accounting policies:
1) Amendments to IAS 36 “Recoverable Amount Disclosures for Non-financial Assets”
The amendments clarify that the recoverable amount of an asset or a cash-generating unit is
disclosed only when an impairment loss on the asset has been recognized or reversed during the
period. Furthermore, if the recoverable amount of an item of property, plant and equipment for
which impairment loss has been recognized or reversed is the fair value less costs of disposal, the
Corporation and its subsidiaries are required to disclose the fair value hierarchy. If the fair value
measurements are categorized within Level 2 or Level 3, the valuation technique and key
assumptions used to measure the fair value are disclosed. The discount rate used is disclosed if
such fair value less costs of disposal is measured by using the present value technique. The
amendments should be applied retrospectively starting from January 1, 2017.
- 13 -
2) Amendments to the Regulations Governing the Preparation of Financial Reports by Securities
Issuers
The amendments include additions of several accounting items and requirements for disclosures of
impairment of non-financial assets as a consequence of the IFRSs endorsed and issued into effect by
the FSC. In addition, as a result of the post implementation review of IFRSs in Taiwan, the
amendments also include an emphasis on certain recognition and measurement considerations and
add requirements for disclosures of related party transactions and goodwill.
The amendments stipulate that other companies or institutions of which the chairman of the board
of directors or president serves as the chairman of the board of directors or the president of the
Corporation and its subsidiaries, or is the spouse or second immediate family of the chairman of the
board of directors or president of the Corporation and its subsidiaries, are deemed to have a
substantive related party relationship, unless it can be demonstrated that no control, joint control, or
significant influence exists. Furthermore, the amendments require the disclosure of the names of
the related parties and the relationships with whom the Corporation and its subsidiaries have
significant transactions. If the transaction amount or balance with a specific related party is 10%
or more of the Corporation and its subsidiaries’ respective total transaction amount or balance, such
transactions should be separately disclosed by the name of each related party.
The amendments also require additional disclosure if there is a significant difference between the
actual operation conditions after a business combination and the expected benefits at the acquisition
date.
When the amendments are applied retrospectively from January 1, 2017, the disclosures of related
party transactions are enhanced. Refer to Note 32 for the related disclosures.
The initial application of above amendments to the Regulations Governing the Preparation of Financial
Reports by Securities Issuers and the IFRSs endorsed and issued into effect by the FSC did not have
material impact.
b. The Regulations Governing the Preparation of Financial Reports by Securities Issuers and the IFRSs
endorsed by the FSC for application starting from 2018
New IFRSs
Effective Date
Announced by IASB (Note 1)
Annual Improvements to IFRSs 2014-2016 Cycle Note 2
Amendments to IFRS 2 “Classification and Measurement of
Share-based Payment Transactions”
January 1, 2018
IFRS 9 “Financial Instruments” January 1, 2018
Amendments to IFRS 9 and IFRS 7 “Mandatory Effective Date of
IFRS 9 and Transition Disclosures”
January 1, 2018
IFRS 15 “Revenue from Contracts with Customers” January 1, 2018
Amendments to IFRS 15 “Clarifications to IFRS 15 Revenue from
Contracts with Customers”
January 1, 2018
Amendment to IAS 7 “Disclosure Initiative” January 1, 2017
Amendments to IAS 12 “Recognition of Deferred Tax Assets for
Unrealized Losses”
January 1, 2017
Amendments to IAS 40 “Transfers of Investment Property” January 1, 2018
IFRIC 22 “Foreign Currency Transactions and Advance
Consideration”
January 1, 2018
Note 1: Unless stated otherwise, the above New IFRSs are effective for annual periods beginning on
or after their respective effective dates.
- 14 -
Note 2: The amendment to IFRS 12 is retrospectively applied for annual periods beginning on or after
January 1, 2017; the amendments to IAS 28 are retrospectively applied for annual periods
beginning on or after January 1, 2018.
1) IFRS 9 “Financial Instruments” and related amendments
Classification, measurement and impairment of financial assets
With regard to financial assets, all recognized financial assets that are within the scope of IAS 39
“Financial Instruments: Recognition and Measurement” are subsequently measured at amortized
cost or fair value. Under IFRS 9, the requirement for the classification of financial assets is stated
below.
For the Corporation and its subsidiaries’ debt instruments that have contractual cash flows that are
solely payments of principal and interest on the principal amount outstanding, their classification
and measurement are as follows:
a) If they are held within a business model whose objective is to collect contractual cash flows, the
financial assets are measured at amortized cost and are assessed for impairment continuously
with any impairment loss recognized in profit or loss. Interest revenue is recognized in profit
or loss by using the effective interest method;
b) If they are held within a business model whose objective is achieved by both collecting
contractual cash flows and selling financial assets, the financial assets are measured at fair value
through other comprehensive income (FVTOCI) and are assessed for impairment. Interest
revenue is recognized in profit or loss by using the effective interest method, and other gains or
losses shall be recognized in other comprehensive income, except for impairment gains or losses
and foreign exchange gains and losses. When the debt instruments are derecognized or
reclassified, the cumulative gain or loss previously recognized in other comprehensive income
is reclassified from equity to profit or loss.
Except for the above, all other financial assets are measured at fair value through profit or loss.
However, the Corporation and its subsidiaries may make an irrevocable election to present
subsequent changes in the fair value of an equity investment (that is not held for trading) in other
comprehensive income, with only dividend income generally recognized in profit or loss. No
subsequent impairment assessment is required, and the cumulative gain or loss previously
recognized in other comprehensive income cannot be reclassified from equity to profit or loss.
The Corporation and its subsidiaries analyzed the facts and circumstances of its financial assets that
exist at December 31, 2017 and performed the assessment of the impact of IFRS 9 on the
classification and measurement of financial assets. Under IFRS 9:
a) Listed shares, emerging market shares, and unlisted shares classified as available-for-sale will
be designated as at fair value through other comprehensive income and the fair value gains or
losses accumulated in other equity will be transferred directly to retained earnings instead of
being reclassified to profit or loss on disposal; in some subsidiaries, available-for-sale will be
designated as at fair value through profit or loss.
b) Debt investments classified as debt investments with no active market and measured at
amortized cost will be classified as at fair value through profit or loss under IFRS 9, because on
initial recognition, the contractual cash flows are not solely payments of principal and interest
on the principal outstanding. In some subsidiaries, debt investments classified as debt
investments with no active market and measured at amortized cost will be classified as
measured at amortized cost under IFRS 9 because on initial recognition, the contractual cash
flows that are solely payments of principal and interest on the principal outstanding and these
investments are held within a business model whose objective is to collect contractual cash
- 15 -
flows.
c) Mutual funds classified as available-for-sale held by some subsidiaries will be classified as at
fair value through profit or loss because the contractual cash flows are not solely payments of
principal and interest on the principal outstanding and they are not equity instruments; part of
the subsidiaries investment in debt investments classified as held-to-maturity financial assets
will be classified as at fair value through other comprehensive income under IFRS 9, because on
initial recognition, the contractual cash flows that are solely payments of principal and interest
on the principal outstanding and these investments are held within a business model whose
objective is achieved both by collecting contractual cash flows and selling financial assets.
IFRS 9 requires impairment loss on financial assets to be recognized by using the “Expected Credit
Losses Model”. The loss allowance is required for financial assets measured at amortized cost,
debt investments measured at FVTOCI, lease receivables, contract assets arising from IFRS 15
“Revenue from Contracts with Customers”, certain written loan commitments and financial
guarantee contracts. A loss allowance for 12-month expected credit losses is required for a
financial asset if its credit risk has not increased significantly since initial recognition. A loss
allowance for full-lifetime expected credit losses is required for a financial asset if its credit risk has
increased significantly since initial recognition and is not low. However, a loss allowance for
full-lifetime expected credit losses is required for trade receivables that do not constitute a financing
transaction.
For originated credit-impaired financial assets, the Corporation and its subsidiaries take into account
the expected credit losses on initial recognition in calculating the credit-adjusted effective interest
rate. Subsequently, any changes in expected losses are recognized as a loss allowance with a
corresponding gain or loss recognized in profit or loss.
The Corporation and its subsidiaries have performed a preliminary assessment that the Corporation
and its subsidiaries will apply the simplified approach to recognize lifetime expected credit losses
for trade receivables, contract assets and lease receivables. In relation to the debt instrument
investment and the financial guarantee contracts, the Corporation and its subsidiaries will assess
whether there has been a significant increase in credit risk to determine whether to recognize
12-month or full-lifetime expected credit losses. In general, the Corporation and its subsidiaries
anticipate that the application of the expected credit losses model of IFRS 9 will result in an earlier
recognition of credit losses for financial assets.
The Corporation and its subsidiaries elect not to restate prior reporting periods when applying the
recognition, measurement and impairment of financial assets under IFRS 9 with the cumulative
effect of the initial application recognized at the date of initial application.
Hedge accounting
The main changes in hedge accounting amended the application requirements for hedge accounting
to better reflect an entity’s risk management activities. Compared with IAS 39, the main changes
include: (1) enhancing types of transactions eligible for hedge accounting, specifically broadening
the risks eligible for hedge accounting of non-financial items; (2) changing the way the hedging cost
of derivative instruments are accounted for to reduce profit or loss volatility; and (3) replacing
retrospective effectiveness assessment with the principle of economic relationship between the
hedging instrument and the hedged item. The assessment of the Corporation and its subsidiaries’
current hedging relationships indicates that they will qualify as continuing hedging relationships
upon application of IFRS 9.
2) IFRS 15 “Revenue from Contracts with Customers” and related amendments
IFRS 15 establishes principles for recognizing revenue that apply to all contracts with customers,
and will supersede IAS 18 “Revenue”, IAS 11 “Construction Contracts” and a number of
- 16 -
revenue-related interpretations.
When applying IFRS 15, the Corporation and its subsidiaries recognizes revenue by applying the
following steps:
Identify the contract with the customer;
Identify the performance obligations in the contract;
Determine the transaction price;
Allocate the transaction price to the performance obligations in the contract; and
Recognize revenue when the Group satisfies a performance obligation.
In identifying performance obligations, IFRS 15 and related amendment require that a good or
service is distinct if it is capable of being distinct (for example, the Corporation and its subsidiaries
and its subsidiaries regularly sell it separately) and the promise to transfer it is distinct within the
context of the contract (i.e. the nature of the promise in the contract is to transfer each of those
goods or services individually rather than to transfer combined items).
If the customer has retained a portion of payment to the Corporation and its subsidiaries in
accordance with the terms of the contract in order to protect the customer from the contractor’s
possible failure to adequately complete its obligations under the contract, such payment
arrangement does not include a significant financing component and is recognized as a contract
asset before the contractual obligation is completed under IFRS 15. Currently, any retention
receivable under a construction contract is recognized as a receivable and is discounted to reflect the
time value of money in accordance with IAS 39.
For the manufacturing of customer-specific goods, if the customer controls the goods when they are
created or enhanced, and the customer would compensate the Corporation and its subsidiaries to
recover the costs incurred plus a reasonable profit margin whenever the contract is terminated by
the customer, revenue will be recognized over time under IFRS 15. Currently, the Corporation
and its subsidiaries recognize revenue when goods are delivered.
Under IFRS 15, the net effect of revenue recognized and consideration received and receivable is
recognized as a contract asset or a contract liability. Currently, the net effect of the progress
billings, cost incurred and recognized profit (loss) of a construction contract is recognized as
amounts due from (to) customers for construction contracts under IAS 11.
If a contract with a customer becomes onerous, the Corporation and its subsidiaries will recognize
provisions for onerous contracts. Currently, the expected loss on construction contracts is
recognized and adjusted to amounts due from (to) customers for construction contracts under IAS
11.
The Corporation and its subsidiaries elect to retrospectively apply IFRS 15 to contracts that are not
complete on January 1, 2018 and recognize the cumulative effect of the change in retained earnings
on January 1, 2018. In addition, the Corporation and its subsidiaries will disclose the difference
between the amount that results from applying IFRS 15 and the amount that results from applying
current standards for 2018.
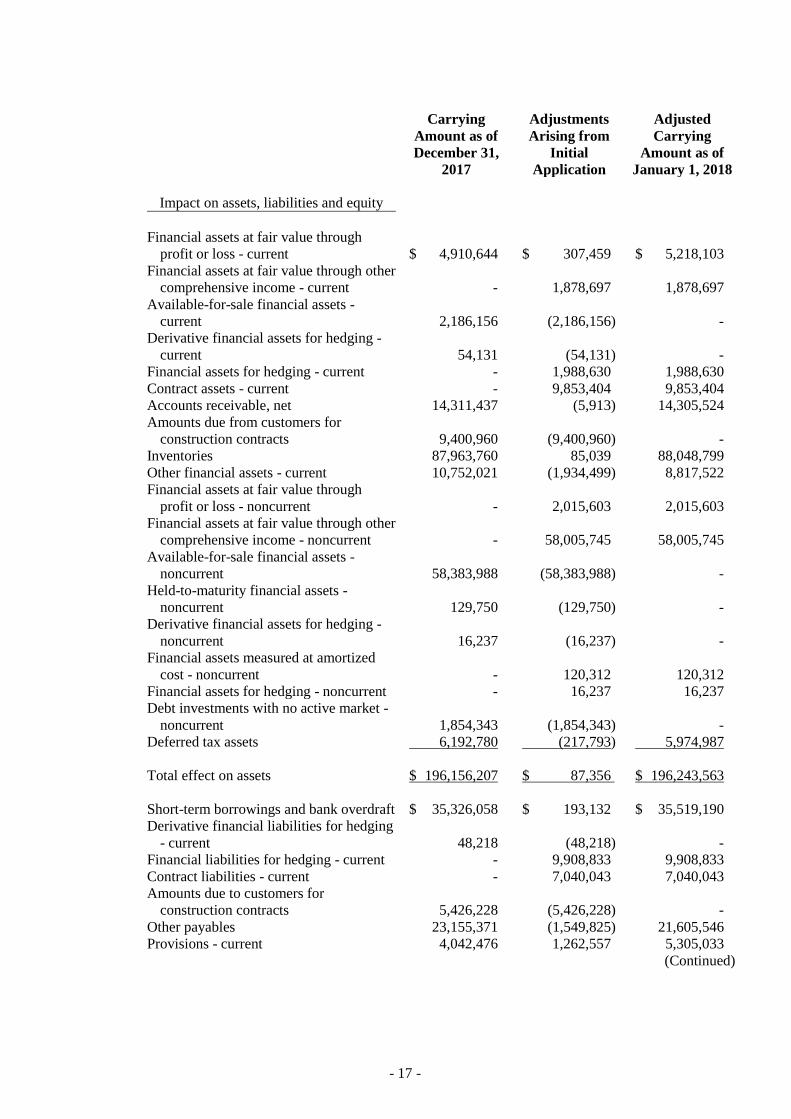
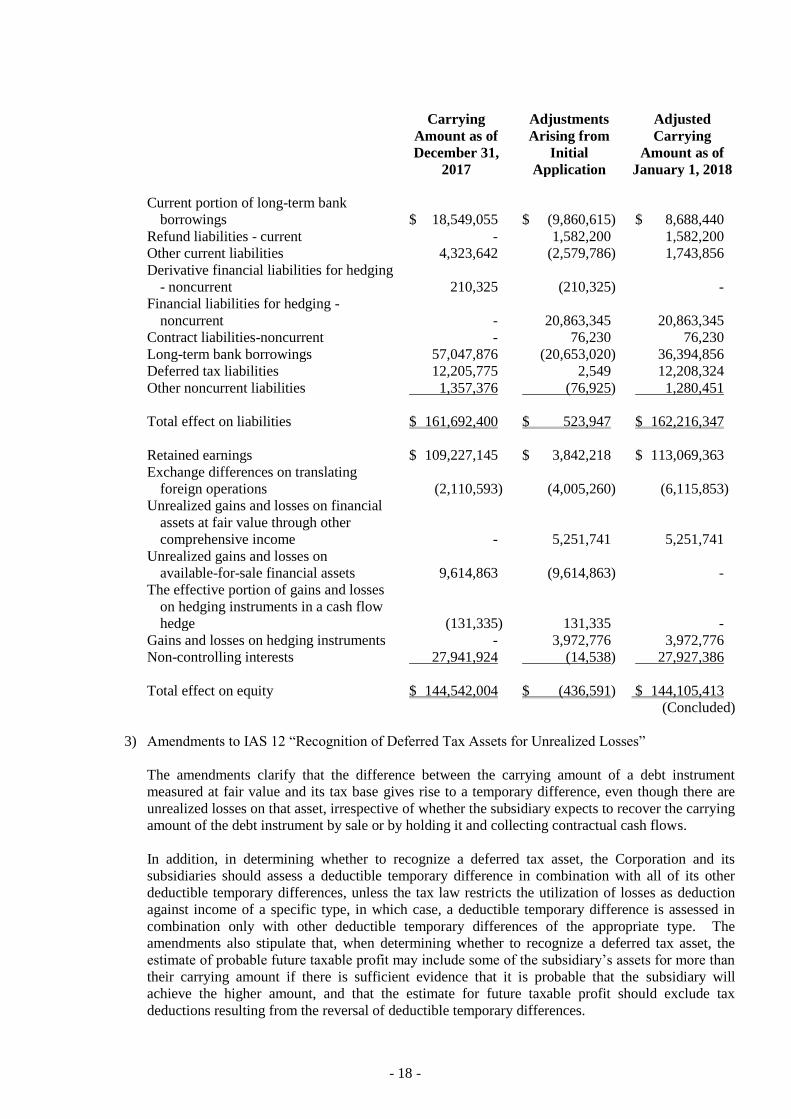
The anticipated impact on assets, liabilities and equity when retrospectively applying IFRS 9 and
IFRS 15 on January 1, 2018 is detailed below:
- 17 -
Carrying
Amount as of
December 31,
2017
Adjustments
Arising from
Initial
Application
Adjusted
Carrying
Amount as of
January 1, 2018
Impact on assets, liabilities and equity
Financial assets at fair value through
profit or loss - current
$ 4,910,644 $ 307,459 $ 5,218,103
Financial assets at fair value through other
comprehensive income - current
- 1,878,697 1,878,697
Available-for-sale financial assets -
current
2,186,156 (2,186,156) -
Derivative financial assets for hedging -
current
54,131 (54,131) -
Financial assets for hedging - current - 1,988,630 1,988,630
Contract assets - current - 9,853,404 9,853,404
Accounts receivable, net 14,311,437 (5,913) 14,305,524
Amounts due from customers for
construction contracts
9,400,960 (9,400,960) -
Inventories 87,963,760 85,039 88,048,799
Other financial assets - current 10,752,021 (1,934,499) 8,817,522
Financial assets at fair value through
profit or loss - noncurrent
- 2,015,603 2,015,603
Financial assets at fair value through other
comprehensive income - noncurrent
- 58,005,745 58,005,745
Available-for-sale financial assets -
noncurrent
58,383,988 (58,383,988) -
Held-to-maturity financial assets -
noncurrent
129,750 (129,750) -
Derivative financial assets for hedging -
noncurrent
16,237 (16,237) -
Financial assets measured at amortized
cost - noncurrent
- 120,312 120,312
Financial assets for hedging - noncurrent - 16,237 16,237
Debt investments with no active market -
noncurrent
1,854,343 (1,854,343) -
Deferred tax assets 6,192,780 (217,793) 5,974,987
Total effect on assets $ 196,156,207 $ 87,356 $ 196,243,563
Short-term borrowings and bank overdraft $ 35,326,058 $ 193,132 $ 35,519,190
Derivative financial liabilities for hedging
- current
48,218 (48,218) -
Financial liabilities for hedging - current - 9,908,833 9,908,833
Contract liabilities - current - 7,040,043 7,040,043
Amounts due to customers for
construction contracts
5,426,228 (5,426,228) -
Other payables 23,155,371 (1,549,825) 21,605,546
Provisions - current 4,042,476 1,262,557 5,305,033
(Continued)
- 18 -
Carrying
Amount as of
December 31,
2017
Adjustments
Arising from
Initial
Application
Adjusted
Carrying
Amount as of
January 1, 2018
Current portion of long-term bank
borrowings
$ 18,549,055 $ (9,860,615) $ 8,688,440
Refund liabilities - current - 1,582,200 1,582,200
Other current liabilities 4,323,642 (2,579,786) 1,743,856
Derivative financial liabilities for hedging
- noncurrent
210,325 (210,325) -
Financial liabilities for hedging -
noncurrent
- 20,863,345 20,863,345
Contract liabilities-noncurrent - 76,230 76,230
Long-term bank borrowings 57,047,876 (20,653,020) 36,394,856
Deferred tax liabilities 12,205,775 2,549 12,208,324
Other noncurrent liabilities 1,357,376 (76,925) 1,280,451
Total effect on liabilities $ 161,692,400 $ 523,947 $ 162,216,347
Retained earnings $ 109,227,145 $ 3,842,218 $ 113,069,363
Exchange differences on translating
foreign operations
(2,110,593) (4,005,260) (6,115,853)
Unrealized gains and losses on financial
assets at fair value through other
comprehensive income
- 5,251,741 5,251,741
Unrealized gains and losses on
available-for-sale financial assets
9,614,863 (9,614,863) -
The effective portion of gains and losses
on hedging instruments in a cash flow
hedge
(131,335) 131,335 -
Gains and losses on hedging instruments - 3,972,776 3,972,776
Non-controlling interests 27,941,924 (14,538) 27,927,386
Total effect on equity $ 144,542,004 $ (436,591) $ 144,105,413
(Concluded)
3) Amendments to IAS 12 “Recognition of Deferred Tax Assets for Unrealized Losses”
The amendments clarify that the difference between the carrying amount of a debt instrument
measured at fair value and its tax base gives rise to a temporary difference, even though there are
unrealized losses on that asset, irrespective of whether the subsidiary expects to recover the carrying
amount of the debt instrument by sale or by holding it and collecting contractual cash flows.
In addition, in determining whether to recognize a deferred tax asset, the Corporation and its
subsidiaries should assess a deductible temporary difference in combination with all of its other
deductible temporary differences, unless the tax law restricts the utilization of losses as deduction
against income of a specific type, in which case, a deductible temporary difference is assessed in
combination only with other deductible temporary differences of the appropriate type. The
amendments also stipulate that, when determining whether to recognize a deferred tax asset, the
estimate of probable future taxable profit may include some of the subsidiary’s assets for more than
their carrying amount if there is sufficient evidence that it is probable that the subsidiary will
achieve the higher amount, and that the estimate for future taxable profit should exclude tax
deductions resulting from the reversal of deductible temporary differences.
- 19 -
In assessing a deferred tax asset, the subsidiary currently assumes it will recover the asset at its
carrying amount when estimating probable future taxable profit. The amendments will be applied
retrospectively in 2018.
4) Amendments to IAS 40 “Transfers of Investment Property”
The amendments clarify that the subsidiary should transfer to, or from, investment property when,
and only when, a property meets, or ceases to meet, the definition of investment property and there
is evidence of a change in use. In isolation, a change in management’s intentions for the use of a
property does not provide evidence of a change in use. The amendments also clarify that evidence
of a change in use is not limited to those illustrated in IAS 40.
The subsidiary will reclassify property as necessary according to the amendments to reflect the
conditions that exist at January 1, 2018. In addition, the subsidiary will disclose the reclassified
amounts in 2018 and the reclassified amounts of January 1, 2018 should be included in the
reconciliation of the carrying amount of investment property.
Except for the above impacts, as of the date the consolidated financial statements were issued by the
board of directors, the Corporation and its subsidiaries assessed that there would be no material impact
of the initial application of other standards and the amendments to interpretations on their financial
position and results of operations.
c. New IFRSs in issue but not yet endorsed and issued into effect by the FSC
New IFRSs
Effective Date
Announced by IASB (Note 1)
Annual Improvements to IFRSs 2015-2017 Cycle January 1, 2019
Amendments to IFRS 9 “Prepayment Features with Negative
Compensation”
January 1, 2019 (Note 2)
Amendments to IFRS 10 and IAS 28 “Sale or Contribution of Assets
between an Investor and its Associate or Joint Venture”
To be determined by IASB
IFRS 16 “Leases” January 1, 2019 (Note 3)
IFRS 17 “Insurance Contracts” January 1, 2021
Amendments to IAS 19 “Plan Amendment, Curtailment or
Settlement”
January 1, 2019 (Note 4)
Amendments to IAS 28 “Long-term Interests in Associates and Joint
Ventures”
January 1, 2019
IFRIC 23 “Uncertainty Over Income Tax Treatments” January 1, 2019
Note 1: Unless stated otherwise, the above New IFRSs are effective for annual periods beginning on
or after their respective effective dates.
Note 2: The FSC permits the election for early adoption of the amendments starting from 2018.
Note 3: On December 19, 2017, the FSC announced that IFRS 16 will take effect starting from
January 1, 2019.
Note 4: The Corporation shall apply these amendments to plan amendments, curtailments or
settlements occurring on or after January 1, 2019.
1) Amendments to IFRS 10 and IAS 28 “Sale or Contribution of Assets between an Investor and its
Associate or Joint Venture”
The amendments stipulate that, when the Corporation and its subsidiaries sell or contribute assets
that constitute a business (as defined in IFRS 3) to an associate or joint venture, the gain or loss
- 20 -
resulting from the transaction is recognized in full. Also, when the Corporation and its
subsidiaries lose control of a subsidiary that contains a business but retain significant influence or
joint control, the gain or loss resulting from the transaction is recognized in full.
Conversely, when the Corporation and its subsidiaries sell or contribute assets that do not constitute
a business as defined in IFRS 3 to an associate or joint venture, the gain or loss resulting from the
transaction is recognized only to the extent of the unrelated investors’ interest in the associate or
joint venture, i.e. the entity’s share of the gain or loss is eliminated. Also, when the Corporation
and its subsidiaries lose control of a subsidiary that does not contain a business but retain significant
influence or joint control over an associate or a joint venture, the gain or loss resulting from the
transaction is recognized only to the extent of the unrelated investors’ interest in the associate or
joint venture, i.e. the entity’s share of the gain or loss is eliminated.
2) IFRS 16 “Leases”
IFRS 16 sets out the accounting standards for leases that will supersede IAS 17 and a number of
related interpretations.
Under IFRS 16, if the Corporation and its subsidiaries are lessee, they shall recognize right-of-use
assets and lease liabilities for all leases on the consolidated balance sheets except for low-value and
short-term leases. The Corporation and its subsidiaries may elect to apply the accounting method
similar to the accounting for operating leases under IAS 17 to low-value and short-term leases. On
the consolidated statements of comprehensive income, the Corporation and its subsidiaries should
present the depreciation expense charged on right-of-use assets separately from the interest expense
accrued on lease liabilities; interest is computed by using the effective interest method. On the
consolidated statements of cash flows, cash payments for the principal portion and interest portion
of lease liabilities are classified within financing activities.
The application of IFRS 16 is not expected to have a material impact on the consolidated financial
statements.
When IFRS 16 becomes effective, the Corporation and its subsidiaries may elect to apply this
standard either retrospectively to each prior reporting period presented or retrospectively with the
cumulative effect of the initial application of this standard recognized at the date of initial
application.
The Corporation and its subsidiaries are still assessing the effect of the initial application of the
standard as lessee.
3) IFRIC 23 “Uncertainty Over Income Tax Treatments”
IFRIC 23 clarifies that when there is uncertainty over income tax treatments, the Corporation and its
subsidiaries should assume that the taxation authority will have full knowledge of all related
information when making related examinations. If the Corporation and its subsidiaries conclude
that it is probable that the taxation authority will accept an uncertain tax treatment, the Corporation
and its subsidiaries should determine the taxable profit, tax bases, unused tax losses, unused tax
credits or tax rates consistently with the tax treatments used or planned to be used in its income tax
filings. If it is not probable that the taxation authority will accept an uncertain tax treatment, the
Corporation and its subsidiaries should make estimates using either the most likely amount or the
expected value of the tax treatment, depending on which method the entity expects to better predict
the resolution of the uncertainty. The Corporation and its subsidiaries have to reassess its
judgments and estimates if facts and circumstances change.
On initial application, the Corporation and its subsidiaries shall apply IFRIC 23 either
retrospectively to each prior reporting period presented, if this is possible without the use of
hindsight, or retrospectively with the cumulative effect of the initial application of IFRIC 23
- 21 -
recognized at the date of initial application.
As of the date the standalone financial statements were issued by the board of directors, the
Corporation and its subsidiaries are in the process of assessing the impact of the impending initial
application of the aforementioned and other standards and the amendments to interpretations on
their financial position and results of operations. Disclosures will be provided after a detailed
review of the impact has been completed.
4. SUMMARY OF SIGNIFICANT ACCOUNTING POLICY
For readers’ convenience, the accompanying consolidated financial statements have been translated into
English from the original Chinese version prepared and used in the ROC. If inconsistencies arise between
the English version and the Chinese version or if differences arise in the interpretations between the two
versions, the Chinese version of the consolidated financial statements shall prevail. However, the
accompanying consolidated financial statements do not include English translation of the additional
footnote disclosures that are not required under generally accepted accounting principles but are required by
the Securities and Futures Bureau for their oversight purposes.
a. Statement of compliance
The consolidated financial statements have been prepared in accordance with the Regulations
Governing the Preparation of Financial Reports by Securities Issuers and IFRSs as endorsed and issued
into effect by the FSC.
b. Basis of preparation
The consolidated financial statements have been prepared on the historical cost basis except for
financial instruments that are measured at fair value and net defined liabilities which are measured at
the present value of the defined benefit obligation less the fair value of plan assets.
The fair value measurements are grouped into Levels 1 to 3 based on the degree to which the fair value
measurement inputs are observable and the significance of the inputs to the fair value measurement in
its entirety, which are described as follows:
1) Level 1 inputs are quoted prices (unadjusted) in active markets for identical assets or liabilities;
2) Level 2 inputs are inputs other than quoted prices included within Level 1 that are observable for
the asset or liability, either directly (i.e. as prices) or indirectly (i.e. derived from prices); and
3) Level 3 inputs are unobservable inputs for the asset or liability.
c. Classification of current and noncurrent assets and liabilities
Current assets include:
1) Assets held primarily for the purpose of trading;
2) Assets expected to be realized within twelve months after the reporting period; and
3) Cash and cash equivalents unless the asset is restricted from being used for an exchange or used to
settle a liability for more than twelve months after the reporting period.
Current liabilities include:
1) Liabilities held primarily for the purpose of trading;
- 22 -
2) Liabilities expected to be settled within twelve months after the reporting period even if an
agreement to refinance, or to reschedule payments, on a long-term basis is completed after the
reporting period and before the consolidated financial statements are authorized for issue; and
3) Liabilities without an unconditional right to defer settlement for at least twelve months after the
reporting period. Terms of a liability that could, at the option of the counterparty, result in its
settlement by the issue of equity instruments do not affect its classification.
Assets and liabilities that are not classified as abovementioned are classified as noncurrent.
For the Corporation and its subsidiaries’ construction-related business, which has an operating cycle of
over one year, the length of the operating cycle is the basis for classifying the Corporation and its
subsidiaries’ construction assets and liabilities as current or noncurrent.
d. Basis of consolidation
The consolidated financial statements incorporate the financial statements of the Corporation and the
entities controlled by the Corporation (i.e. its subsidiaries).
Income and expenses of subsidiaries acquired during the period are included in the consolidated
statement of profit or loss and other comprehensive income from the effective date of acquisition.
When necessary, adjustments are made to the financial statements of subsidiaries to bring their
accounting policies into line with those used by the Corporation. All intra-Corporation and its
subsidiaries transactions, balances, income and expenses are eliminated in full upon consolidation.
Total comprehensive income of subsidiaries is attributed to the owners of the Corporation and to the
non-controlling interests even if this results in the non-controlling interests having a deficit balance.
Changes in the Corporation’s ownership interests in subsidiaries that do not result in the Corporation
losing control over the subsidiaries are accounted for as equity transactions. The carrying amounts of
the Corporation’s interests and the non-controlling interests are adjusted to reflect the changes in their
relative interests in the subsidiaries. Any difference between the amount by which the non-controlling
interests are adjusted and the fair value of the consideration paid or received is recognized directly in
equity and attributed to the owners of the Corporation.
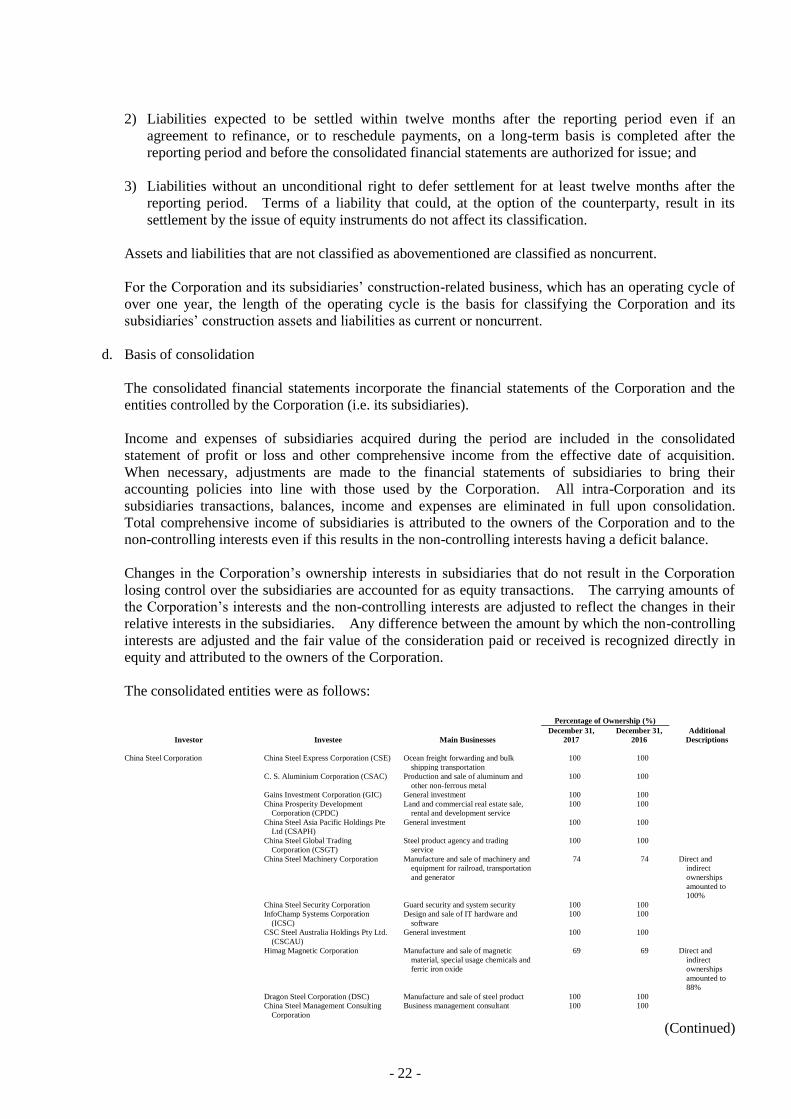
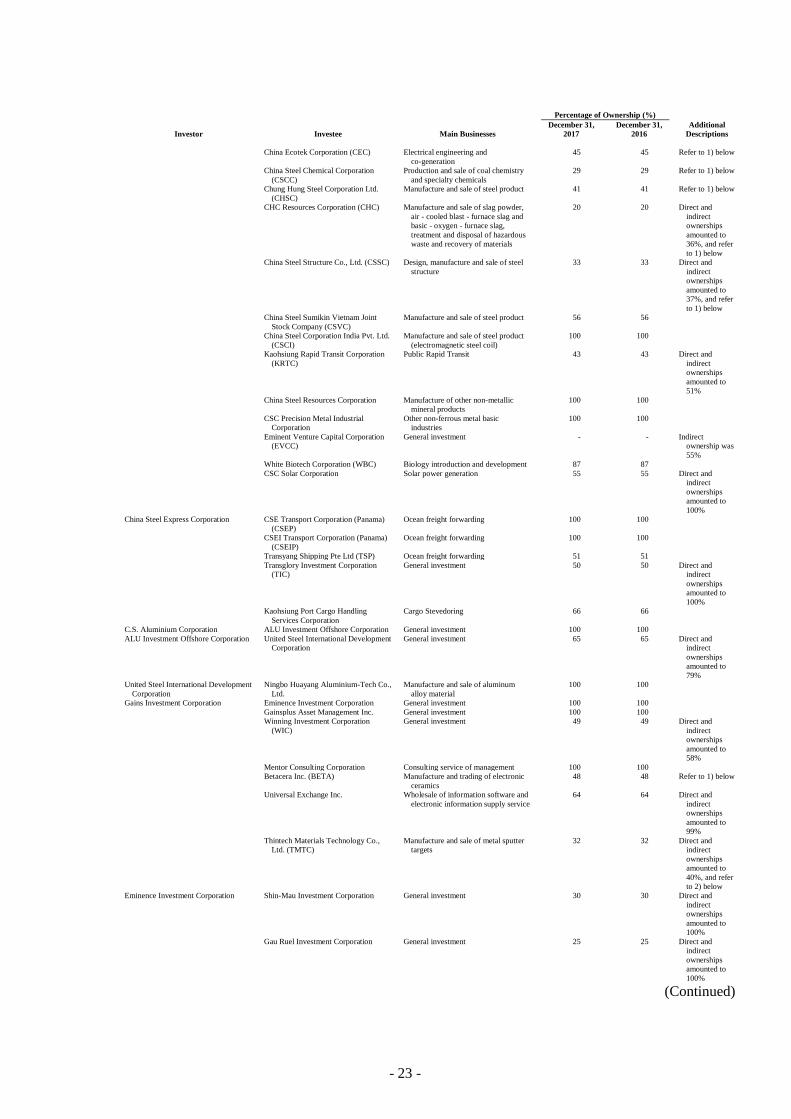
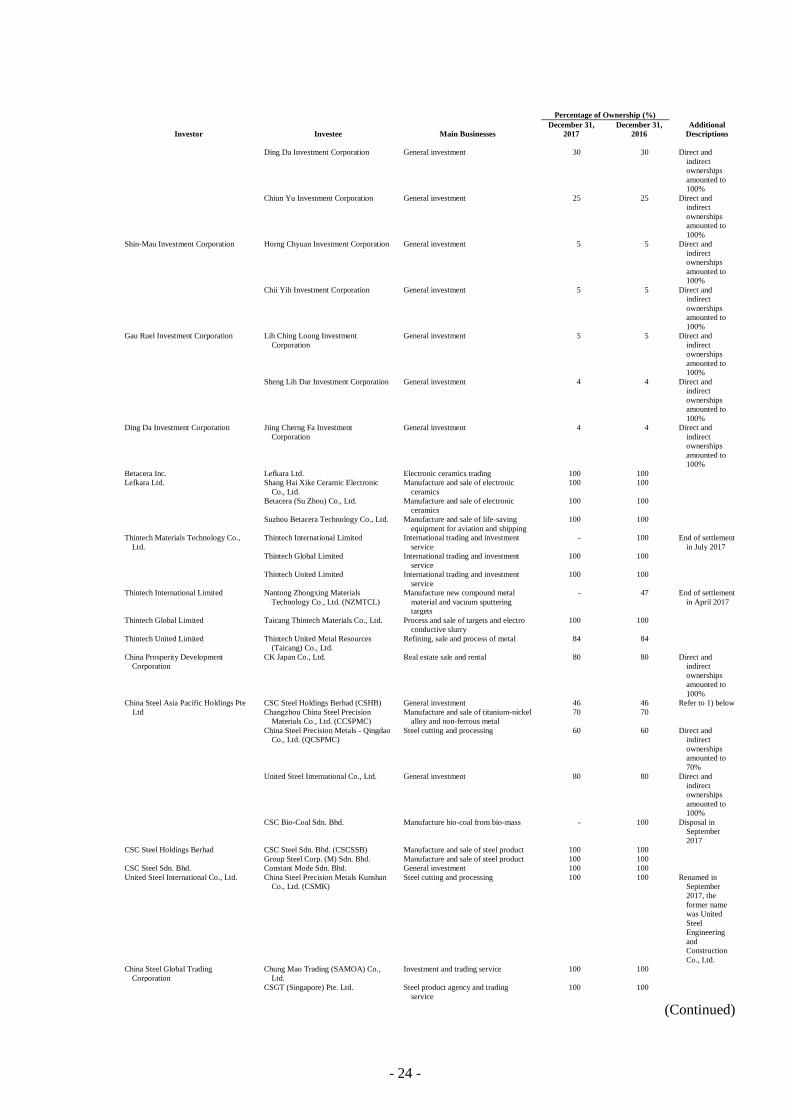
The consolidated entities were as follows:
Percentage of Ownership (%)
Investor Investee Main Businesses
December 31,
2017
December 31,
2016
Additional
Descriptions
China Steel Corporation China Steel Express Corporation (CSE) Ocean freight forwarding and bulk
shipping transportation
100 100
C. S. Aluminium Corporation (CSAC) Production and sale of aluminum and
other non-ferrous metal
100 100
Gains Investment Corporation (GIC) General investment 100 100
China Prosperity Development
Corporation (CPDC)
Land and commercial real estate sale,
rental and development service
100 100
China Steel Asia Pacific Holdings Pte
Ltd (CSAPH)
General investment 100 100
China Steel Global Trading
Corporation (CSGT)
Steel product agency and trading
service
100 100
China Steel Machinery Corporation Manufacture and sale of machinery and
equipment for railroad, transportation
and generator
74 74 Direct and
indirect
ownerships
amounted to
100%
China Steel Security Corporation Guard security and system security 100 100
InfoChamp Systems Corporation
(ICSC)
Design and sale of IT hardware and
software
100 100
CSC Steel Australia Holdings Pty Ltd.
(CSCAU)
General investment 100 100
Himag Magnetic Corporation Manufacture and sale of magnetic
material, special usage chemicals and
ferric iron oxide
69 69 Direct and
indirect
ownerships
amounted to
88%
Dragon Steel Corporation (DSC) Manufacture and sale of steel product 100 100
China Steel Management Consulting
Corporation
Business management consultant 100 100
(Continued)
- 23 -
Percentage of Ownership (%)
Investor Investee Main Businesses
December 31,
2017
December 31,
2016
Additional
Descriptions
China Ecotek Corporation (CEC) Electrical engineering and
co-generation
45 45 Refer to 1) below
China Steel Chemical Corporation
(CSCC)
Production and sale of coal chemistry
and specialty chemicals
29 29 Refer to 1) below
Chung Hung Steel Corporation Ltd.
(CHSC)
Manufacture and sale of steel product 41 41 Refer to 1) below
CHC Resources Corporation (CHC) Manufacture and sale of slag powder,
air - cooled blast - furnace slag and
basic - oxygen - furnace slag,
treatment and disposal of hazardous
waste and recovery of materials
20 20 Direct and
indirect
ownerships
amounted to
36%, and refer
to 1) below
China Steel Structure Co., Ltd. (CSSC) Design, manufacture and sale of steel
structure
33 33 Direct and
indirect
ownerships
amounted to
37%, and refer
to 1) below
China Steel Sumikin Vietnam Joint
Stock Company (CSVC)
Manufacture and sale of steel product 56 56
China Steel Corporation India Pvt. Ltd.
(CSCI)
Manufacture and sale of steel product
(electromagnetic steel coil)
100 100
Kaohsiung Rapid Transit Corporation
(KRTC)
Public Rapid Transit 43 43 Direct and
indirect
ownerships
amounted to
51%
China Steel Resources Corporation Manufacture of other non-metallic
mineral products
100 100
CSC Precision Metal Industrial
Corporation
Other non-ferrous metal basic
industries
100 100
Eminent Venture Capital Corporation
(EVCC)
General investment - - Indirect
ownership was
55%
White Biotech Corporation (WBC) Biology introduction and development 87 87
CSC Solar Corporation Solar power generation 55 55 Direct and
indirect
ownerships
amounted to
100%
China Steel Express Corporation CSE Transport Corporation (Panama)
(CSEP)
Ocean freight forwarding 100 100
CSEI Transport Corporation (Panama)
(CSEIP)
Ocean freight forwarding 100 100
Transyang Shipping Pte Ltd (TSP) Ocean freight forwarding 51 51
Transglory Investment Corporation
(TIC)
General investment 50 50 Direct and
indirect
ownerships
amounted to
100%
Kaohsiung Port Cargo Handling
Services Corporation
Cargo Stevedoring 66 66
C.S. Aluminium Corporation ALU Investment Offshore Corporation General investment 100 100
ALU Investment Offshore Corporation United Steel International Development
Corporation
General investment 65 65 Direct and
indirect
ownerships
amounted to
79%
United Steel International Development
Corporation
Ningbo Huayang Aluminium-Tech Co.,
Ltd.
Manufacture and sale of aluminum
alloy material
100 100
Gains Investment Corporation Eminence Investment Corporation General investment 100 100
Gainsplus Asset Management Inc. General investment 100 100
Winning Investment Corporation
(WIC)
General investment 49 49 Direct and
indirect
ownerships
amounted to
58%
Mentor Consulting Corporation Consulting service of management 100 100
Betacera Inc. (BETA) Manufacture and trading of electronic
ceramics
48 48 Refer to 1) below
Universal Exchange Inc. Wholesale of information software and
electronic information supply service
64 64 Direct and
indirect
ownerships
amounted to
99%
Thintech Materials Technology Co.,
Ltd. (TMTC)
Manufacture and sale of metal sputter
targets
32 32 Direct and
indirect
ownerships
amounted to
40%, and refer
to 2) below
Eminence Investment Corporation Shin-Mau Investment Corporation General investment 30 30 Direct and
indirect
ownerships
amounted to
100%
Gau Ruel Investment Corporation General investment 25 25 Direct and
indirect
ownerships
amounted to
100%
(Continued)
- 24 -
Percentage of Ownership (%)
Investor Investee Main Businesses
December 31,
2017
December 31,
2016
Additional
Descriptions
Ding Da Investment Corporation General investment 30 30 Direct and
indirect
ownerships
amounted to
100%
Chiun Yu Investment Corporation General investment 25 25 Direct and
indirect
ownerships
amounted to
100%
Shin-Mau Investment Corporation Horng Chyuan Investment Corporation General investment 5 5 Direct and
indirect
ownerships
amounted to
100%
Chii Yih Investment Corporation General investment 5 5 Direct and
indirect
ownerships
amounted to
100%
Gau Ruel Investment Corporation Lih Ching Loong Investment
Corporation
General investment 5 5 Direct and
indirect
ownerships
amounted to
100%
Sheng Lih Dar Investment Corporation General investment 4 4 Direct and
indirect
ownerships
amounted to
100%
Ding Da Investment Corporation Jiing Cherng Fa Investment
Corporation
General investment 4 4 Direct and
indirect
ownerships
amounted to
100%
Betacera Inc. Lefkara Ltd. Electronic ceramics trading 100 100
Lefkara Ltd. Shang Hai Xike Ceramic Electronic
Co., Ltd.
Manufacture and sale of electronic
ceramics
100 100
Betacera (Su Zhou) Co., Ltd. Manufacture and sale of electronic
ceramics
100 100
Suzhou Betacera Technology Co., Ltd. Manufacture and sale of life-saving
equipment for aviation and shipping
100 100
Thintech Materials Technology Co.,
Ltd.
Thintech International Limited International trading and investment
service
- 100 End of settlement
in July 2017
Thintech Global Limited International trading and investment
service
100 100
Thintech United Limited International trading and investment
service
100 100
Thintech International Limited Nantong Zhongxing Materials
Technology Co., Ltd. (NZMTCL)
Manufacture new compound metal
material and vacuum sputtering
targets
- 47 End of settlement
in April 2017
Thintech Global Limited Taicang Thintech Materials Co., Ltd. Process and sale of targets and electro
conductive slurry
100 100
Thintech United Limited Thintech United Metal Resources
(Taicang) Co., Ltd.
Refining, sale and process of metal 84 84
China Prosperity Development
Corporation
CK Japan Co., Ltd. Real estate sale and rental 80 80 Direct and
indirect
ownerships
amounted to
100%
China Steel Asia Pacific Holdings Pte CSC Steel Holdings Berhad (CSHB) General investment 46 46 Refer to 1) below
Ltd Changzhou China Steel Precision
Materials Co., Ltd. (CCSPMC)
Manufacture and sale of titanium-nickel
alloy and non-ferrous metal
70 70
China Steel Precision Metals - Qingdao
Co., Ltd. (QCSPMC)
Steel cutting and processing 60 60 Direct and
indirect
ownerships
amounted to
70%
United Steel International Co., Ltd. General investment 80 80 Direct and
indirect
ownerships
amounted to
100%
CSC Bio-Coal Sdn. Bhd. Manufacture bio-coal from bio-mass - 100 Disposal in
September
2017
CSC Steel Holdings Berhad CSC Steel Sdn. Bhd. (CSCSSB) Manufacture and sale of steel product 100 100
Group Steel Corp. (M) Sdn. Bhd. Manufacture and sale of steel product 100 100
CSC Steel Sdn. Bhd. Constant Mode Sdn. Bhd. General investment 100 100
United Steel International Co., Ltd. China Steel Precision Metals Kunshan
Co., Ltd. (CSMK)
Steel cutting and processing 100 100 Renamed in
September
2017, the
former name
was United
Steel
Engineering
and
Construction
Co., Ltd.
China Steel Global Trading
Corporation
Chung Mao Trading (SAMOA) Co.,
Ltd.
Investment and trading service 100 100
CSGT (Singapore) Pte. Ltd. Steel product agency and trading
service
100 100
(Continued)
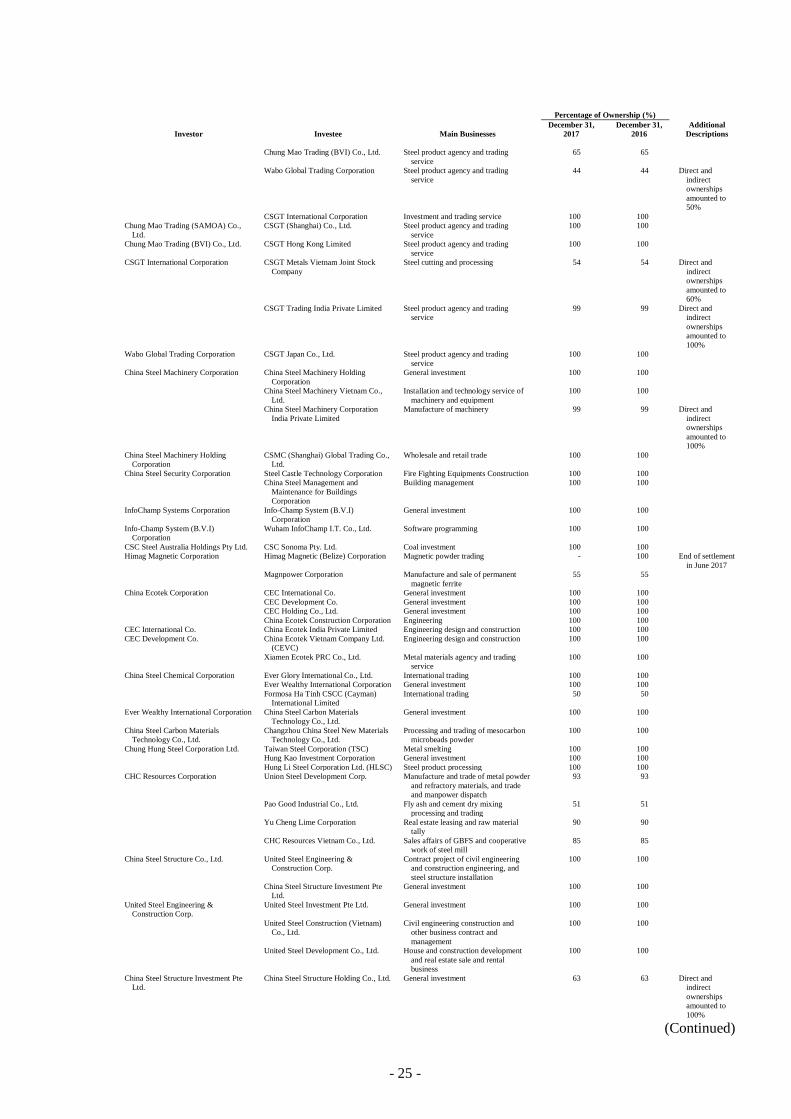
- 25 -
Percentage of Ownership (%)
Investor Investee Main Businesses
December 31,
2017
December 31,
2016
Additional
Descriptions
Chung Mao Trading (BVI) Co., Ltd. Steel product agency and trading
service
65 65
Wabo Global Trading Corporation Steel product agency and trading
service
44 44 Direct and
indirect
ownerships
amounted to
50%
CSGT International Corporation Investment and trading service 100 100
Chung Mao Trading (SAMOA) Co.,
Ltd.
CSGT (Shanghai) Co., Ltd. Steel product agency and trading
service
100 100
Chung Mao Trading (BVI) Co., Ltd. CSGT Hong Kong Limited Steel product agency and trading
service
100 100
CSGT International Corporation CSGT Metals Vietnam Joint Stock
Company
Steel cutting and processing 54 54 Direct and
indirect
ownerships
amounted to
60%
CSGT Trading India Private Limited Steel product agency and trading
service
99 99 Direct and
indirect
ownerships
amounted to
100%
Wabo Global Trading Corporation CSGT Japan Co., Ltd. Steel product agency and trading
service
100 100
China Steel Machinery Corporation China Steel Machinery Holding
Corporation
General investment 100 100
China Steel Machinery Vietnam Co.,
Ltd.
Installation and technology service of
machinery and equipment
100 100
China Steel Machinery Corporation
India Private Limited
Manufacture of machinery 99 99 Direct and
indirect
ownerships
amounted to
100%
China Steel Machinery Holding
Corporation
CSMC (Shanghai) Global Trading Co.,
Ltd.
Wholesale and retail trade 100 100
China Steel Security Corporation Steel Castle Technology Corporation Fire Fighting Equipments Construction 100 100
China Steel Management and
Maintenance for Buildings
Corporation
Building management 100 100
InfoChamp Systems Corporation Info-Champ System (B.V.I)
Corporation
General investment 100 100
Info-Champ System (B.V.I)
Corporation
Wuham InfoChamp I.T. Co., Ltd. Software programming 100 100
CSC Steel Australia Holdings Pty Ltd. CSC Sonoma Pty. Ltd. Coal investment 100 100
Himag Magnetic Corporation Himag Magnetic (Belize) Corporation Magnetic powder trading - 100 End of settlement
in June 2017
Magnpower Corporation Manufacture and sale of permanent
magnetic ferrite
55 55
China Ecotek Corporation CEC International Co. General investment 100 100
CEC Development Co. General investment 100 100
CEC Holding Co., Ltd. General investment 100 100
China Ecotek Construction Corporation Engineering 100 100
CEC International Co. China Ecotek India Private Limited Engineering design and construction 100 100
CEC Development Co. China Ecotek Vietnam Company Ltd.
(CEVC)
Engineering design and construction 100 100
Xiamen Ecotek PRC Co., Ltd. Metal materials agency and trading
service
100 100
China Steel Chemical Corporation Ever Glory International Co., Ltd. International trading 100 100
Ever Wealthy International Corporation General investment 100 100
Formosa Ha Tinh CSCC (Cayman)
International Limited
International trading
50 50
Ever Wealthy International Corporation China Steel Carbon Materials
Technology Co., Ltd.
General investment 100 100
China Steel Carbon Materials
Technology Co., Ltd.
Changzhou China Steel New Materials
Technology Co., Ltd.
Processing and trading of mesocarbon
microbeads powder
100 100
Chung Hung Steel Corporation Ltd. Taiwan Steel Corporation (TSC) Metal smelting 100 100
Hung Kao Investment Corporation General investment 100 100
Hung Li Steel Corporation Ltd. (HLSC) Steel product processing 100 100
CHC Resources Corporation Union Steel Development Corp. Manufacture and trade of metal powder
and refractory materials, and trade
and manpower dispatch
93 93
Pao Good Industrial Co., Ltd. Fly ash and cement dry mixing
processing and trading
51 51
Yu Cheng Lime Corporation Real estate leasing and raw material
tally
90 90
CHC Resources Vietnam Co., Ltd. Sales affairs of GBFS and cooperative
work of steel mill
85 85
China Steel Structure Co., Ltd. United Steel Engineering &
Construction Corp.
Contract project of civil engineering
and construction engineering, and
steel structure installation
100 100
China Steel Structure Investment Pte
Ltd.
General investment 100 100
United Steel Engineering &
Construction Corp.
United Steel Investment Pte Ltd. General investment 100 100
United Steel Construction (Vietnam)
Co., Ltd.
Civil engineering construction and
other business contract and
management
100 100
United Steel Development Co., Ltd. House and construction development
and real estate sale and rental
business
100 100
China Steel Structure Investment Pte
Ltd.
China Steel Structure Holding Co., Ltd. General investment 63 63 Direct and
indirect
ownerships
amounted to
100%
(Continued)
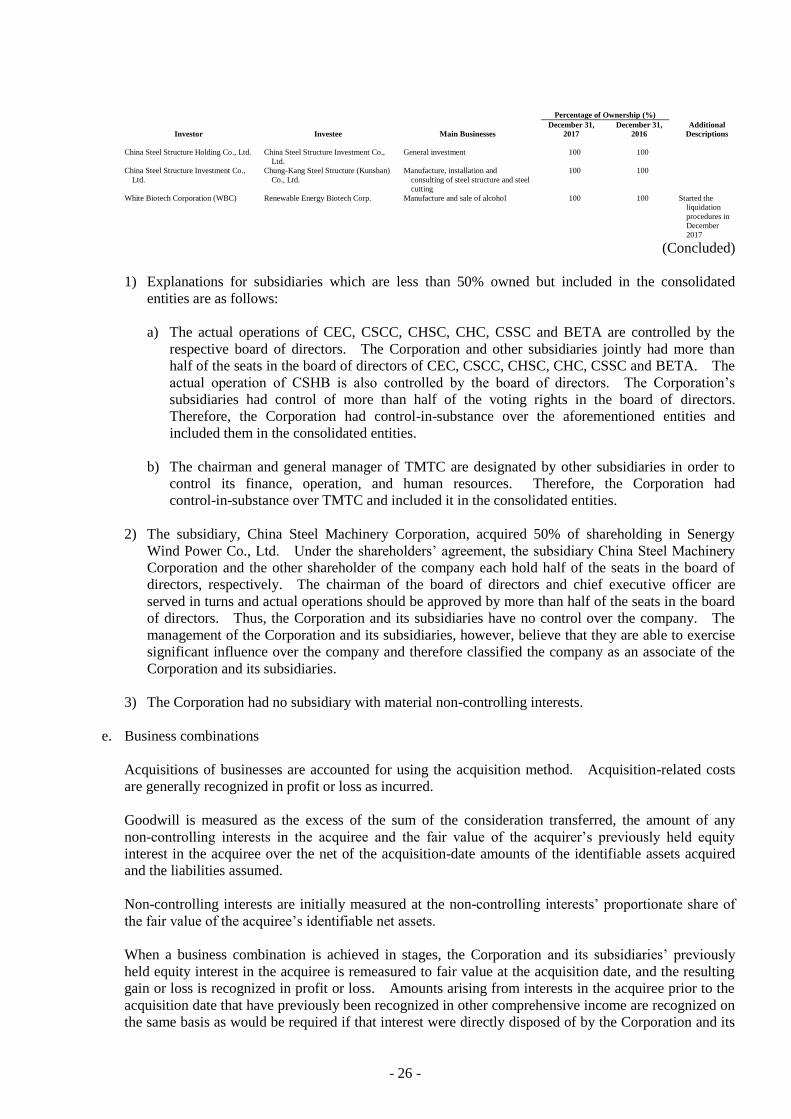
- 26 -
Percentage of Ownership (%)
Investor Investee Main Businesses
December 31,
2017
December 31,
2016
Additional
Descriptions
China Steel Structure Holding Co., Ltd. China Steel Structure Investment Co.,
Ltd.
General investment 100 100
China Steel Structure Investment Co.,
Ltd.
Chung-Kang Steel Structure (Kunshan)
Co., Ltd.
Manufacture, installation and
consulting of steel structure and steel
cutting
100 100
White Biotech Corporation (WBC) Renewable Energy Biotech Corp. Manufacture and sale of alcohol 100 100 Started the
liquidation
procedures in
December
2017
(Concluded)
1) Explanations for subsidiaries which are less than 50% owned but included in the consolidated
entities are as follows:
a) The actual operations of CEC, CSCC, CHSC, CHC, CSSC and BETA are controlled by the
respective board of directors. The Corporation and other subsidiaries jointly had more than
half of the seats in the board of directors of CEC, CSCC, CHSC, CHC, CSSC and BETA. The
actual operation of CSHB is also controlled by the board of directors. The Corporation’s
subsidiaries had control of more than half of the voting rights in the board of directors.
Therefore, the Corporation had control-in-substance over the aforementioned entities and
included them in the consolidated entities.
b) The chairman and general manager of TMTC are designated by other subsidiaries in order to
control its finance, operation, and human resources. Therefore, the Corporation had
control-in-substance over TMTC and included it in the consolidated entities.
2) The subsidiary, China Steel Machinery Corporation, acquired 50% of shareholding in Senergy
Wind Power Co., Ltd. Under the shareholders’ agreement, the subsidiary China Steel Machinery
Corporation and the other shareholder of the company each hold half of the seats in the board of
directors, respectively. The chairman of the board of directors and chief executive officer are
served in turns and actual operations should be approved by more than half of the seats in the board
of directors. Thus, the Corporation and its subsidiaries have no control over the company. The
management of the Corporation and its subsidiaries, however, believe that they are able to exercise
significant influence over the company and therefore classified the company as an associate of the
Corporation and its subsidiaries.
3) The Corporation had no subsidiary with material non-controlling interests.
e. Business combinations
Acquisitions of businesses are accounted for using the acquisition method. Acquisition-related costs
are generally recognized in profit or loss as incurred.
Goodwill is measured as the excess of the sum of the consideration transferred, the amount of any
non-controlling interests in the acquiree and the fair value of the acquirer’s previously held equity
interest in the acquiree over the net of the acquisition-date amounts of the identifiable assets acquired
and the liabilities assumed.
Non-controlling interests are initially measured at the non-controlling interests’ proportionate share of
the fair value of the acquiree’s identifiable net assets.
When a business combination is achieved in stages, the Corporation and its subsidiaries’ previously
held equity interest in the acquiree is remeasured to fair value at the acquisition date, and the resulting
gain or loss is recognized in profit or loss. Amounts arising from interests in the acquiree prior to the
acquisition date that have previously been recognized in other comprehensive income are recognized on
the same basis as would be required if that interest were directly disposed of by the Corporation and its
- 27 -
subsidiaries.
f. Foreign currencies
In preparing the financial statements of each individual consolidated entity, transactions in currencies
other than the entity’s functional currency (foreign currencies) are recognized at the rates of exchange
prevailing at the dates of the transactions.
At the end of each reporting period, monetary items denominated in foreign currencies are retranslated
at the rates prevailing at that date. Exchange differences on monetary items arising from settlement or
translation are recognized in profit or loss in the year in which they arise except for exchange
differences on transactions entered into in order to hedge certain foreign currency risks.
Non-monetary items measured at fair value that are denominated in foreign currencies are retranslated
at the rates prevailing at the date when the fair value was determined. Exchange differences arising on
the retranslation of non-monetary items are included in profit or loss for the year except for exchange
differences arising from the retranslation of non-monetary items in respect of which gains and losses are
recognized directly in other comprehensive income, in which case, the exchange differences are also
recognized directly in other comprehensive income.
Non-monetary items that are measured at historical cost in a foreign currency are not retranslated.
For the purpose of presenting consolidated financial statements, the functional currencies of the
Corporation’s entities (including subsidiaries and associates in other countries that use currency
different from the currency of the Corporation) are translated into the presentation currency - New
Taiwan dollars as follows: Assets and liabilities are translated at the exchange rates prevailing at the
end of the reporting period; income and expense items are translated at the average exchange rates for
the period. The resulting currency translation differences are recognized in other comprehensive
income (attributed to the owners of the Corporation and non-controlling interests as appropriate).
On the disposal of a foreign operation (i.e. a disposal of the Corporation and its subsidiaries’ entire
interest in a foreign operation, or a disposal involving loss of control over a subsidiary that includes a
foreign operation, or a partial disposal of an associate that includes a foreign operation of which the
retained interest becomes a financial asset), all of the exchange differences accumulated in equity in
respect of that operation attributable to the owners of the Corporation are reclassified to profit or loss.
In relation to a partial disposal of a subsidiary that does not result in the Corporation losing control over
the subsidiary, the proportionate share of accumulated exchange differences is re-attributed to
non-controlling interests of the subsidiary and is not recognized in profit or loss. For all other partial
disposals, the proportionate share of the accumulated exchange differences recognized in other
comprehensive income is reclassified to profit or loss.
g. Inventories
Inventories manufactured or traded by the Corporation and its subsidiaries consist of raw materials,
supplies, finished goods, work-in-process, etc. Inventories are stated at the lower of cost or net
realizable value. Inventory write-downs are made by item, except where it may be appropriate to
group similar or related items. Net realizable value is the estimated selling price of inventories less all
estimated costs of completion and costs necessary to make the sale. Inventories are recorded at
moving average cost or weighted-average cost.
Besides the goods manufactured or traded by the Corporation and its subsidiaries, inventories also
include buildings and lands under construction and prepayment for land.
- 28 -
The cost of buildings construction is calculated by each different construction project. The
expenditure on land before acquiring land ownership is recorded as prepayment for land. The
construction and other costs after acquiring land ownership are recognized as construction in progress,
which will be transferred to property held for sale after the completion, and transferred to operating
costs based on the ratio of area sold to total area when the lands and buildings are sold and the criteria
of revenue recognition were met.
Before the transfer of land ownership and the completion of construction, interest arising from land
purchase and cost of construction in progress (including costs of lands and constructions) is capitalized
and recorded as acquisition cost of land and construction cost.
h. Investment in associates
An associate is an entity over which the Corporation and its subsidiaries have significant influence and
that is neither a subsidiary nor an interest in a joint venture.
The Corporation and its subsidiaries use the equity method to account for their investments in
associates. Under the equity method, an investment in an associate is initially recognized at cost and
adjusted thereafter to recognize the Corporation and its subsidiaries’ share of the profit or loss and other
comprehensive income of the associate. The Corporation and its subsidiaries also recognize the
changes in the share of equity of associates.
Any excess of the cost of acquisition over the Corporation and its subsidiaries' share of the net fair
value of the identifiable assets and liabilities of an associate recognized at the date of acquisition is
recognized as goodwill, which is included within the carrying amount of the investment and is not
amortized. Any excess of the Corporation and its subsidiaries’ share of the net fair value of the
identifiable assets and liabilities over the cost of acquisition, after reassessment, is recognized
immediately in profit or loss.
When the Corporation and its subsidiaries subscribe for additional new shares of the associate at a
percentage different from its existing ownership percentage, the resulting carrying amount of the
investment differs from the amount of the Corporation and its subsidiaries’ proportionate interest in the
associate. The Corporation and its subsidiaries record such a difference as an adjustment to
investments with the corresponding amount charged or credited to capital surplus - changes in the
Corporation and its subsidiaries’ share of equity of associates. If the Corporation and its subsidiaries’
ownership interest is reduced due to non-subscription of the new shares of associate, the proportionate
amount of the gains or losses previously recognized in other comprehensive income in relation to that
associate is reclassified to profit or loss on the same basis as would be required if the investee had
directly disposed of the related assets or liabilities. When the adjustment should be a deduction to
capital surplus, but the capital surplus recognized from investments accounted for using equity method
is insufficient, the shortage is deducted from retained earnings.
When the Corporation and its subsidiaries’ share of losses of an associate equal or exceed their interest
in that associate (which includes any carrying amount of the investment accounted for using the equity
method and long-term interests that, in substance, form part of the Corporation and its subsidiaries’ net
investment in the associate), the Corporation and its subsidiaries discontinue recognizing their share of
further losses. Additional losses and liabilities are recognized only to the extent that the Corporation
and its subsidiaries have incurred legal obligations, or constructive obligations, or made payments on
behalf of that associate.
When impairment loss is evaluated, the entire carrying amount of the investment (including goodwill) is
tested for impairment as a single asset by comparing its recoverable amount with its carrying amount.
Any impairment loss recognized is deducted from investment and the carrying amount of investment is
net of impairment loss. Any reversal of that impairment loss is recognized to the extent that the
recoverable amount of the investment has subsequently increased.
- 29 -
The Corporation and its subsidiaries discontinue the use of the equity method from the date on which
their investment cease to be associates. Any retained investment is measured at fair value at that date
and the fair value is regarded as its fair value on initial recognition as a financial asset. The difference
between the previous carrying amount of the associate attributable to the retained interest and its fair
value is included in the determination of the gain or loss on disposal of the associate. The Corporation
and its subsidiaries account for all amounts previously recognized in other comprehensive income in
relation to that associate on the same basis as would be required if that associate had directly disposed
of the related assets or liabilities.
When the Corporation and its subsidiaries transact with their associates, profits and losses on these
transactions are recognized in the consolidated financial statements only to the extent of interests in the
associate that are not related to the Corporation and its subsidiaries.
i. Joint operations
A joint operation is a joint arrangement whereby the Corporation and its subsidiaries and other parties
that have joint control of the arrangement have rights to the assets, and obligations for the liabilities,
relating to the arrangement.
Any acquisition of an interest in a joint operation in which the activity of the joint operation constitutes
a business should be treated as a business combination, except when the parties sharing joint control are
under the common control of the same ultimate controlling party or parties both before and after the
acquisition and that control is not transitory.
The Corporation and its subsidiaries recognize the following items in relation to their interests in a joint
operation:
1) The assets, including their share of any assets held jointly;
2) The liabilities, including their share of any liabilities incurred jointly;
3) The revenue from the sale of their share of the output arising from the joint operation;
4) The share of the revenue from the sale of the output of the joint operation; and
5) The expenses, including their share of any expenses incurred jointly.
The Corporation and its subsidiaries account for the assets, liabilities, revenues and expenses relating to
their interests in a joint operation in accordance with the IFRSs applicable to the particular assets,
liabilities, revenues and expenses.
When the Corporation and its subsidiaries sell or contribute assets to their joint operation, they
recognize gains and losses resulting from such a transaction only to the extent of the other parties’
interests in the joint operation. When the Corporation and its subsidiaries purchase assets from its
joint operation, they do not recognize their share of the gain or loss until they resell those assets to a
third party.
j. Property, plant, and equipment
Property, plant and equipment are stated at cost, less accumulated depreciation and accumulated
impairment loss.
Properties in the course of construction for production, supply or administrative purposes are carried at
cost. Cost includes professional fees and borrowing costs eligible for capitalization. Such properties
are classified to the appropriate categories of property, plant and equipment when completed and ready
for intended use and depreciated accordingly.
- 30 -
Except that depreciation of the rollers (spare parts) is calculated based on their level of wear and
depreciation of the machineries in the recycling plant of the subsidiary CHC is calculated by the
working-hour method, other depreciation (including assets held under finance leases) is recognized so
as to write off the cost of assets less their residual values over their estimated useful lives, using the
straight-line method. If the lease term is shorter than the useful lives, assets are depreciated over the
lease term. The estimated useful lives, residual values and depreciation method are reviewed at the
end of each reporting period, with the effect of any changes in estimate accounted for on a prospective
basis.
On derecognition of an item of property, plant and equipment, the difference between the sales proceeds
and the carrying amount of the asset is recognized in profit or loss.
k. Investment properties
Investment properties are properties held to earn rentals and/or for capital appreciation (including
property under construction for such purposes), also include land held for a currently undetermined
future use.
Investment properties are measured initially at cost, including transaction costs. Subsequent to initial
recognition, investment properties are measured at cost less accumulated depreciation and accumulated
impairment loss. Depreciation is recognized using the straight-line method.
Investment properties under construction of which the fair value is not reliably measurable are stated at
cost less accumulated depreciation and accumulated impairment loss until either such time as the fair
value becomes reliably measureable or construction is completed (whichever comes earlier).
Investment properties in the course of construction are stated at cost less accumulated impairment loss.
Cost includes professional fees and borrowing costs eligible for capitalization. Depreciation of these
assets commences when the assets are ready for their intended use.
On derecognition of an investment property, the difference between the net disposal proceeds and the
carrying amount of the asset is included in profit or loss.
l. Goodwill
Goodwill arising from the acquisition of a business is carried at cost as established at the date of
acquisition of the business less accumulated impairment loss.
For the purposes of impairment testing, goodwill is allocated to each of the Corporation and its
subsidiaries’ cash-generating units or Corporation and its subsidiaries of cash-generating units (referred
to as cash-generating units) that is expected to benefit from the synergies of the combination.
A cash-generating unit to which goodwill has been allocated is tested for impairment annually, or more
frequently when there is an indication that the unit may be impaired, by comparing its carrying amount,
including the attributed goodwill, with its recoverable amount. However, if the goodwill allocated to a
cash-generating unit was acquired in a business combination during the current annual period, that unit
shall be tested for impairment before the end of the current annual period. If the recoverable amount
of the cash-generating unit is less than its carrying amount, the impairment loss is allocated first to
reduce the carrying amount of any goodwill allocated to the unit and then to the other assets of the unit
pro rata based on the carrying amount of each asset in the unit. Any impairment loss is recognized
directly in profit or loss. An impairment loss recognized for goodwill is not reversed in subsequent
periods.
- 31 -
m. Intangible assets
1) Intangible assets acquired separately
Intangible assets with finite useful lives that are acquired separately are initially measured at cost
and subsequently measured at cost less accumulated amortization and accumulated impairment loss.
Amortization is recognized on a straight-line basis. The estimated useful life, residual value, and
amortization method are reviewed at the end of each reporting period, with the effect of any
changes in estimate accounted for on a prospective basis. Intangible assets with indefinite useful
lives that are acquired separately are measured at cost less accumulated impairment loss.
2) Intangible assets acquired in a business combination
Intangible assets acquired in a business combination and recognized separately from goodwill are
initially recognized at their fair value at the acquisition date (which is regarded as their cost).
Subsequent to initial recognition, they are measured on the same basis as intangible assets that are
acquired separately.
3) Derecognition of intangible assets
On derecognition of an intangible asset, the difference between the net disposal proceeds and the
carrying amount of the asset is recognized in profit or loss.
n. Impairment of tangible and intangible assets
At the end of each reporting period, the Corporation and its subsidiaries review the carrying amounts of
their tangible and intangible assets to determine whether there is any indication that those assets have
suffered an impairment loss. If any such indication exists, the recoverable amount of the asset is
estimated in order to determine the extent of the impairment loss. When it is not possible to estimate
the recoverable amount of an individual asset, the Corporation and its subsidiaries estimate the
recoverable amount of the cash-generating unit to which the asset belongs. Corporate assets are
allocated to the individual cash-generating units on a reasonable and consistent basis of allocation;
otherwise they are allocated to the smallest group of cash-generating units for which a reasonable and
consistent allocation basis can be identified.
Recoverable amount is the higher of fair value less costs to sell and value in use. If the recoverable
amount of an asset or cash-generating unit is estimated to be less than its carrying amount, the carrying
amount of the asset or cash-generating unit is reduced to its recoverable amount. The impairment loss
is recognized in profit or loss.
When an impairment loss subsequently is reversed, the carrying amount of the asset or cash-generating
unit is increased to the revised estimate of its recoverable amount, but only to the extent of the carrying
amount that would have been determined for the asset or cash-generating unit (net of amortization and
depreciation) had no impairment loss been recognized in prior years. A reversal of an impairment loss
is recognized immediately in profit or loss.
o. Non-current assets held for sale
Non-current assets (or disposal groups) are classified as held for sale if their carrying amounts will be
recovered principally through a sale transaction rather than through continuing use. This condition is
regarded as met only when the sale is highly probable and the non-current asset (or disposal group) is
available for immediate sale in its present condition. To meet the criteria for the sale being highly
probable, the appropriate level of management must be committed to the sale, which should be expected
to qualify for recognition as a completed sale within 1 year from the date of classification.
- 32 -
When a sale plan would result in a loss of control of a subsidiary, all of the assets and liabilities of that
subsidiary are classified as held for sale, regardless of whether the Corporation and its subsidiaries will
retain a non-controlling interest in that subsidiary after the sale.
p. Financial instruments
Financial assets and financial liabilities are recognized when the Corporation and its subsidiaries
become a party to the contractual provisions of the instruments.
Financial assets and financial liabilities are initially measured at fair value. Transaction costs that are
directly attributable to the acquisition or issue of financial assets and financial liabilities (other than
financial assets and financial liabilities at fair value through profit or loss) are added to or deducted
from the fair value of the financial assets or financial liabilities, as appropriate, on initial recognition.
Transaction costs directly attributable to the acquisition of financial assets or financial liabilities at fair
value through profit or loss are recognized immediately in profit or loss.
1) Financial assets
All regular way purchases or sales of financial assets are recognized and derecognized on a trade
date basis.
a) Measurement category
Financial assets held by the Corporation and its subsidiaries include financial assets at fair value
through profit or loss, held-to-maturity investments, available-for-sale financial assets and loans
and receivables.
i Financial assets at fair value through profit or loss
Financial assets are classified as at fair value through profit or loss when the financial asset
is either held for trading or it is designated as at fair value through profit or loss.
A financial asset may be designated as at fair value through profit or loss upon initial
recognition if:
i) Such designation eliminates or significantly reduces a measurement or recognition
inconsistency that would otherwise arise; or
ii) The financial asset forms part of a group of financial assets or financial liabilities or
both, which is managed and its performance is evaluated on a fair value basis, in
accordance with the Corporation and its subsidiaries’ documented risk management or
investment strategy, and information about the group is provided internally on that basis;
or
iii) The contract contains one or more embedded derivatives so that the entire hybrid
(combined) contract can be designated as at fair value through profit or loss.
Financial assets at fair value through profit or loss are stated at fair value, with any gains or
losses arising on remeasurement recognized in profit or loss. The net gain or loss
recognized in profit or loss incorporates any dividend or interest earned on the financial
asset. Fair value is determined in the manner described in Note 31.
- 33 -
ii Held-to-maturity investments
Structure notes and guarantee debt certificates, which are above specific credit ratings and
the Corporation and its subsidiaries have positive intent and ability to hold to maturity, are
classified as held-to-maturity investments.
Subsequent to initial recognition, held-to-maturity investments are measured at amortized
cost using the effective interest method less any impairment.
iii Available-for-sale financial assets
Available-for-sale financial assets are non-derivatives that are either designated as
available-for-sale or are not classified as loans and receivables, held-to-maturity investments
or financial assets at fair value through profit or loss.
Available-for-sale financial assets are measured at fair value. Changes in the carrying
amount of available-for-sale monetary financial assets relating to changes in foreign
currency exchange rates, interest income calculated using the effective interest method and
dividends on available-for-sale equity investments are recognized in profit or loss. Other
changes in the carrying amount of available-for-sale financial assets are recognized in other
comprehensive income and reclassified in profit or loss when the investment is disposed of
or is determined to be impaired.
Dividends on available-for-sale equity investments are recognized when the Corporation
and its subsidiaries’ right to receive the dividends is established.
iv Loans and receivables
Loans and receivables (including cash and cash equivalents, notes and accounts receivable,
net, other receivables, debt investments with no active market, refundable deposits and other
financial assets) are measured at amortized cost using the effective interest method, less any
impairment. Interest income is recognized by applying the effective interest rate, except
for short-term receivables when the effect of discounting is immaterial.
Cash equivalent includes time deposits, commercial papers and bonds with repurchase
agreements with original maturity within three months from the date of acquisition, high
liquidity, readily convertible to a known amount of cash and subject to an insignificant risk
of changes in value. These cash equivalents are held for the purpose of meeting short-term
cash commitments.
b) Impairment of financial assets
Financial assets, other than those at fair value through profit or loss, are assessed for indicators
of impairment at the end of each reporting period. Financial assets are considered to be
impaired when there is objective evidence that, as a result of one or more events that occurred
after the initial recognition of the financial asset, the estimated future cash flows of the
investment have been affected.
Financial assets carried at amortized cost, such as accounts receivable, are assessed for
impairment on a collective basis even if there is no objective evidence of impairment
individually. Objective evidence of impairment for a portfolio of receivables could include the
Corporation and its subsidiaries’ past experience of collecting payments, an increase in the
number of delayed payments in the portfolio past the average credit period, as well as
observable changes in national or local economic conditions that correlate with default on
receivables. The amount of the impairment loss recognized is the difference between the
asset’s carrying amount and the present value of estimated future cash flows, discounted at the
- 34 -
financial asset’s original effective interest rate.
If, in the subsequent period, the amount of the impairment loss decreases and the decrease can
be related objectively to an event occurring after the impairment was recognized, the previously
recognized impairment loss shall be reversed either directly or by adjusting an allowance
account. The reversal shall not result in a carrying amount of the financial asset that exceeds
what the amortized cost would have been had the impairment not been recognized at the date
the impairment is reversed. The amount of the reversal shall be recognized in profit or loss.
For available-for-sale equity investments, a significant or prolonged decline in the fair value of
the securities below its cost is considered to be objective evidence of impairment. For all other
financial assets, objective evidence of impairment could include significant financial difficulty
of the issuer or counterparty, breach of contract, such as a default or delinquency in interest or
principal payments, the disappearance of an active market for that financial asset because of
financial difficulties, or it becoming probable that the borrower will enter bankruptcy or
financial re-organization.
When an available-for-sale financial asset is considered to be impaired, cumulative gains or
losses previously recognized in other comprehensive income are reclassified to profit or loss in
the period. In respect of available-for-sale equity securities, impairment loss previously
recognized in profit or loss is not reversed through profit or loss. Any increase in fair value
subsequent to an impairment loss is recognized in other comprehensive income. In respect of
available-for-sale debt securities, the impairment loss is subsequently reversed through profit or
loss if an increase in the fair value of the investment can be objectively related to an event
occurring after the recognition of the impairment loss.
The carrying amount of the financial asset is reduced by the impairment loss directly for all
financial assets with the exception of accounts receivable, where the carrying amount is reduced
through the use of an allowance account.
c) Derecognition of financial assets
The Corporation and its subsidiaries derecognize a financial asset only when the contractual
rights to the cash flows from the asset expire, or when it transfers the financial asset and
substantially all the risks and rewards of ownership of the asset to another party.
On derecognition of a financial asset in its entirety, the difference between the asset’s carrying
amount and the sum of the consideration received and receivable and the cumulative gain or
loss that had been recognized in other comprehensive income is recognized in profit or loss.
2) Equity instruments
Debt and equity instruments issued by the Corporation and its subsidiaries are classified as either
financial liabilities or as equity in accordance with the substance of the contractual arrangements
and the definitions of a financial liability and an equity instrument.
Equity instruments issued by the Corporation and its subsidiaries are recognized at the proceeds
received, net of direct issue costs.
3) Financial liabilities
a) Subsequent measurement
Except the following situation, all the financial liabilities are measured at amortized cost using
the effective interest method:
- 35 -
Financial liabilities at fair value through profit or loss
Financial liabilities are classified as at fair value through profit or loss when the financial
liability is either held for trading or it is designated as at fair value through profit or loss.
Financial liabilities held for trading are stated at fair value, with any gain or loss arising on
remeasurement recognized in profit or loss. The net gain or loss recognized in profit or loss
incorporates any interest or dividend paid on the financial liability.
A financial liability may be designated as at fair value through profit or loss upon initial
recognition when doing so results in more relevant information and if:
i Such designation eliminates or significantly reduces a measurement or recognition
inconsistency that would otherwise arise; or
ii The financial liability forms part of a group of financial assets or financial liabilities or both,
which is managed and its performance is evaluated on a fair value basis, in accordance with
the Corporation and its subsidiaries’ documented risk management or investment strategy,
and information about the group is provided internally on that basis.
iii The contract contains one or more embedded derivatives so that the entire combined
contract (asset or liability) can be designated as at fair value through profit or loss.
For a financial liability designated as at fair value through profit or loss, the amount of changes
in fair value attributable to changes in the credit risk of the liability is presented in other
comprehensive income, and it will not be subsequently reclassified to profit or loss. The
remaining amount of changes in the fair value of that liability which incorporates any interest or
dividend paid on the financial liability is presented in profit or loss. The gain or loss
accumulated in other comprehensive income will be transferred to retained earnings when the
financial liabilities are derecognized. If this accounting treatment related to credit risk would
create or enlarge an accounting mismatch, all changes in fair value of the liability are presented
in profit or loss. Fair value is determined in the manner described in Note 31.
b) Derecognition of financial liabilities
The difference between the carrying amount of the financial liability derecognized and the
consideration paid, including any non-cash assets transferred or liabilities assumed, is
recognized in profit or loss.
4) Convertible bonds
The component parts of compound instruments (convertible bonds) issued by the Corporation and
its subsidiaries are classified separately as financial liabilities and equity in accordance with the
substance of the contractual arrangements and the definitions of a financial liability and an equity
instrument.
On initial recognition, the fair value of the liability component is estimated using the prevailing
market interest rate for similar non-convertible instruments. This amount is recorded as a liability
on an amortized cost basis using the effective interest method until extinguished upon conversion or
at the instrument's maturity date.
The conversion option classified as equity is determined by deducting the amount of the liability
component from the fair value of the compound instrument as a whole. This is recognized and
included in equity, net of income tax effects, and is not subsequently remeasured. In addition, the
conversion option classified as equity will remain in equity until the conversion option is exercised,
in which case, the balance recognized in equity will be transferred to capital surplus - share
- 36 -
premium. When the conversion option remains unexercised at the maturity date of the convertible
bonds, the balance recognized in equity will be transferred to capital surplus - share premium.
Transaction costs that relate to the issue of the convertible bonds are allocated to the liability
components (included in the carrying amount of liabilities) and equity components (included in
equity) in proportion to the allocation of the gross proceeds.
5) Derivative financial instruments
The Corporation and its subsidiaries enter into a variety of derivative financial instruments to
manage their exposure to foreign exchange rate and interest rate risks, including foreign exchange
forward contracts and interest rate swap contracts.
Derivatives are initially recognized at fair value at the date the derivative contracts are entered into
and are subsequently remeasured to their fair value at each balance sheet date. The resulting gain
or loss is recognized in profit or loss immediately unless the derivative is designated and effective
as a hedging instrument, in which event the timing of the recognition in profit or loss depends on
the nature of the hedge relationship. When the fair value of derivative financial instruments is
positive, the derivative is recognized as a financial asset; when the fair value of derivative financial
instruments is negative, the derivative is recognized as a financial liability.
q. Hedge accounting
The Corporation and its subsidiaries designate certain hedging instruments, which include derivatives
and non-derivatives in respect of foreign currency risk, as either fair value hedges, cash flow hedges, or
hedges of net investments in foreign operations. Hedges of foreign exchange risk on firm
commitments are accounted for as cash flow hedges.
1) Fair value hedges
Changes in the fair value of derivatives that are designated and qualified as fair value hedges are
recognized in profit or loss immediately, together with any changes in the fair value of the hedged
asset or liability that are attributable to the hedged risk. The change in the fair value of the
hedging instrument and the change in the hedged item attributable to the hedged risk are recognized
in profit or loss in the line item relating to the hedged item.
Hedge accounting is discontinued prospectively when the Corporation and its subsidiaries revoke
the designated hedging relationship, when the hedging instrument expires or is sold, terminated, or
exercised (the replacement or rollover of a hedging instrument into another hedging instrument is
not an expiration or termination if it formed part of the Corporation and its subsidiaries’
documented hedging strategy from inception), or when the hedging instrument no longer meets the
criteria for hedge accounting. The fair value adjustment to the carrying amount of the hedged
instrument arising from the hedged risk for which the effective interest method is used is amortized
to profit or loss from the date hedge accounting is discontinued. The adjustment which is based on
a recalculated effective interest rate at the date amortization begins is amortized fully by maturity of
the financial instrument.
2) Cash flow hedges
The effective portion of changes in the fair value of derivatives that are designated and qualified as
cash flow hedges is recognized in other comprehensive income. The gain or loss relating to the
ineffective portion is recognized immediately in profit or loss.
The associated gains or losses that were recognized in other comprehensive income are reclassified
from equity to profit or loss as a reclassification adjustment in the line item relating to the hedged
item in the same period when the hedged item affects profit or loss. If a hedge of a forecast
- 37 -
transaction subsequently results in the recognition of a non-financial asset or a non-financial
liability, the associated gains and losses that were recognized in other comprehensive income are
removed from equity and are included in the initial cost of the non-financial asset or non-financial
liability.
Hedge accounting is discontinued prospectively when the Corporation and its subsidiaries revoke
the designated hedging relationship, or when the hedging instrument expires or is sold, terminated,
or exercised (the replacement or rollover of a hedging instrument into another hedging instrument is
not an expiration or termination if it formed part of the Corporation and its subsidiaries’
documented hedging strategy from inception), or when the hedging instrument no longer meets the
criteria for hedge accounting. The cumulative gain or loss on the hedging instrument that has been
previously recognized in other comprehensive income from the period when the hedge was
effective remains separately in equity until the forecast transaction occurs. When a forecast
transaction is no longer expected to occur, the gain or loss accumulated in equity is recognized
immediately in profit or loss.
3) Hedges of net investments in foreign operations
Hedges of net investments in foreign operations are accounted for similar to cash flow hedges.
Any gain or loss on the hedging instrument relating to the effective portion of the hedge is
recognized in other comprehensive income and accumulated under the heading of foreign currency
translation reserve. The gain or loss relating to the ineffective portion is recognized immediately
in profit or loss.
Gains and losses on the hedging instrument relating to the effective portion of the hedge
accumulated in the foreign currency translation reserve are reclassified to profit or loss on the
disposal or partial disposal of the foreign operation.
r. Provisions
Provisions are measured at the best estimate of the consideration required to settle the present obligation
at the end of the reporting period, taking into account the risks and uncertainties surrounding the
obligation. Provisions are measured using the cash flows estimated to settle the present obligation.
s. Treasury shares
Shares of the Corporation held by subsidiaries are reclassified to treasury shares from investments
accounted for using equity method at the acquisition cost.
t. Revenue recognition
Revenue is measured at the fair value of the consideration received or receivable. Revenue is reduced
for estimated customer returns, rebates and other similar allowances. Allowance for sales returns and
liability for returns are recognized at the time of sale based on the seller’s reliable estimate of future
returns and based on past experience and other relevant factors.
1) Sale of goods
Revenues from the sale of goods are recognized when the significant risks and rewards of
ownership of the goods are transferred to the customers as follows: domestic sales - when
products are moved out of the Corporation and its subsidiaries’ premises for delivery to customers;
exports - when products are loaded onto vessels. Revenues are recognized because the earning
process is accomplished and revenue is realized or realizable.
Revenues are measured at the fair value, which is the discounted present value of the price (net of
commercial discounts and quantity discounts) agreed to by the Corporation and its subsidiaries with
- 38 -
customers. But if the related receivable is due within one year, the difference between its present
value and undiscounted amount is immaterial, and sales transactions are frequent, the fair value of
receivables is equivalent to the nominal amount of cash to be received.
2) Rendering of services
Service revenue is recognized according to the contract and the percentage of completion of the
services. If a service contract is estimated to bear a loss prior to completion, the Corporation and
its subsidiaries recognize the full amount of the loss immediately.
Freight revenues are recognized according to the proportion of voyage days used to contracted
voyage of each ship. Revenues from construction contracts are recognized in accordance with the
accounting standards for construction contracts which are described below in “Construction
Contracts”. Please refer to Note 4 u. for related disclosures.
u. Construction contracts
When the outcome of a construction contract can be estimated reliably, revenues and costs are
recognized by reference to the stage of completion of the contract activity at the end of the reporting
period, measured based on the proportion of contract costs incurred for work performed to date relative
to the estimated total contract costs, except where this would not be representative of the stage of
completion. Variations in contract work, claims and incentive payments are included to the extent that
the amount can be measured reliably and its receipt is considered probable.
When the outcome of a construction contract cannot be estimated reliably, contract revenue is
recognized to the extent of contract costs incurred that are estimated as recoverable. Contract costs are
recognized as expenses in the period in which they are incurred.
When it is probable that total contract costs will exceed total contract revenue, the expected loss is
recognized as an expense immediately.
When a contract covers a number of assets, the construction of each asset is treated as a separate
contract when separate proposals have been submitted for each asset, each asset has been separately
negotiated, contractors and customers can accept or reject any part of the contract related to each asset
and the costs and revenues of each asset can be separately identified. A group of contracts performed
concurrently or in a continuous sequence is treated as a single construction contract when the contracts
were negotiated as a single package and they are so closely inter-related that they constitute a single
project with an overall profit margin.
When contract costs incurred to date plus recognized profits less recognized losses exceed progress
billings, the surplus is shown as amounts due from customers for contract work. For contracts where
progress billings exceed contract costs incurred to date plus recognized profits less recognized losses,
the surplus is shown as amounts due to customers for contract work.
v. Leasing
Leases are classified as finance leases whenever the terms of the lease transfer substantially all the risks
and rewards of ownership to the lessee. All other leases are classified as operating leases.
1) The Corporation and its subsidiaries as lessor
Rental income from operating leases is recognized on a straight-line basis over the term of the
relevant lease. Contingent rents are recognized as income in the year in which they are incurred.
- 39 -
2) The Corporation and its subsidiaries as lessee
Assets held under finance leases are initially recognized as assets of the Corporation and its
subsidiaries at their fair value at the inception of the lease or, if lower, at the present value of the
minimum lease payments. The corresponding liability to the lessor is included in the consolidated
balance sheets as a finance lease obligation.
Finance expenses implicit in lease payments for each period are recognized immediately in profit or
loss, unless they are directly attributable to qualifying assets, in which case they are capitalized.
Operating lease payments are recognized as an expense on a straight-line basis over the lease term.
Contingent rents are recognized as income in the year in which they are incurred.
w. Borrowing costs
Borrowing costs directly attributable to the acquisition, construction or production of qualifying assets
are added to the cost of those assets, until such time as the assets are substantially ready for their
intended use or sale.
Investment income earned on the temporary investment of specific borrowings pending their
expenditure on qualifying assets is deducted from the borrowing costs eligible for capitalization.
All borrowing costs other than those stated above are recognized in profit or loss in the period in which
they are incurred.
x. Government grants
Government grants are not recognized until there is reasonable assurance that the subsidiaries will
comply with the conditions attaching to them and that the grants will be received.
y. Employee benefits
1) Short-term employee benefits
Liabilities recognized in respect of short-term employee benefits are measured at the undiscounted
amount of the benefits expected to be paid in exchange for the related service.
2) Retirement benefits
Payments to defined contribution retirement benefit plans are recognized as an expense when
employees have rendered service entitling them to the contributions.
Defined benefit costs (including service cost, net interest and remeasurement) under the defined
benefit retirement benefit plans are determined using the projected unit credit method. Service
cost (including current service cost, past service cost, as well as gains and losses on settlements) and
net interest on the net defined benefit liability are recognized as employee benefits expense in the
period they occur. Remeasurement, comprising actuarial gains and losses, the effect of the
changes to the asset ceiling and the return on plan assets (excluding interest), is recognized in other
comprehensive income in the period in which they occur. Remeasurement recognized in other
comprehensive income is reflected immediately in retained earnings and will not be reclassified to
profit or loss.
Net defined benefit liability (asset) represents the actual deficit (surplus) in the Corporation and its
subsidiaries’ defined benefit plan. Any surplus resulting from this calculation is limited to the
present value of any refunds from the plans or reductions in future contributions to the plans.
- 40 -
3) Other long-term employee benefits
Other long-term employee benefits are accounted for in the same way as the accounting required for
defined benefit plan except that remeasurement is recognized in profit or loss.
4) Termination benefits
A liability for a termination benefit is recognized at the earlier of when the Corporation and its
subsidiaries can no longer withdraw the offer of the termination benefit and when the Corporation
and its subsidiaries recognize any related restructuring costs.
z. Taxation
Income tax expense represents the sum of the tax currently payable and deferred tax.
1) Current tax
Current tax is the amount of tax at statutory rate calculated on the taxable profit at the end of each
reporting period. According to the Income Tax Law, an additional tax at 10% of unappropriated
earnings is provided for as income tax in the year the shareholders approve to retain the earnings.
Adjustments of prior years’ tax liabilities are added to or deducted from the current year’s tax
provision.
2) Deferred tax
Deferred tax is recognized on temporary differences between the carrying amounts of assets and
liabilities and the corresponding tax bases used in the computation of taxable profit. Deferred tax
liabilities are generally recognized for all taxable temporary differences. Deferred tax assets are
generally recognized for all deductible temporary differences, unused loss carry forward and unused
tax credits for purchases of machinery and equipment, and research and development expenditures
to the extent that it is probable that taxable profits will be available against which those deductible
temporary differences can be utilized. Such deferred tax assets and liabilities are not recognized if
the temporary difference arises from the initial recognition (other than in a business combination) of
other assets and liabilities in a transaction that affects neither the taxable profit nor the accounting
profit.
Deferred tax liabilities are recognized for taxable temporary differences associated with investments
in subsidiaries and associates, except where the Corporation and its subsidiaries are able to control
the reversal of the temporary difference and it is probable that the temporary difference will not
reverse in the foreseeable future. Deferred tax assets arising from deductible temporary
differences associated with such investments and interests are only recognized to the extent that it is
probable that there will be sufficient taxable profits against which to utilize the benefits of the
temporary differences and they are expected to reverse in the foreseeable future.
The carrying amount of deferred tax assets is reviewed at each balance sheet date and reduced to the
extent that it is no longer probable that sufficient taxable profits will be available to allow all or part
of the asset to be recovered. A previously unrecognized deferred tax asset is also reviewed at each
balance sheet date and recognized to the extent that it has become probable that future taxable profit
will allow the deferred tax asset to be recovered.
Deferred tax liabilities and assets are measured at the tax rates that are expected to apply in the
period in which the liability is settled or the asset realized, based on tax rates and tax laws that have
been enacted or substantively enacted by the balance sheet date. The measurement of deferred tax
liabilities and assets reflects the tax consequences that would follow from the manner in which the
Corporation and its subsidiaries expect, at the end of the reporting period, to recover or settle the
- 41 -
carrying amount of its assets and liabilities.
3) Current and deferred tax for the year
Current and deferred tax are recognized in profit or loss, except when they relate to items that are
recognized in other comprehensive income or directly in equity, in which case, the current and
deferred tax are also recognized in other comprehensive income or directly in equity respectively.
Where current tax or deferred tax arises from the initial accounting for a business combination, the
tax effect is included in the accounting for the business combination.
5. CRITICAL ACCOUNTING JUDGMENTS AND KEY SOURCES OF ESTIMATION
UNCERTAINTY
In the application of the Corporation and its subsidiaries’ accounting policies, management is required to
make judgments, estimates and assumptions that are not readily apparent from other sources. The
estimates and associated assumptions are based on historical experience and other factors that are
considered relevant. Actual results may differ from these estimates.
The estimates and underlying assumptions are reviewed on an ongoing basis. The effect of a change in an
accounting estimate shall be recognized prospectively by including it in profit or loss in the period of the
change, if the change affects that period only, or in the period of the change and future periods, if the
change affects both.
a. Valuation of inventory
Inventories are stated at the lower of cost or net realizable value, and the Corporation and its
subsidiaries use judgment and estimate to determine the net realizable value of inventory at the end of
the reporting period. Since the net realizable value of inventory is mainly determined on the basis of
future selling price, it might be adjusted significantly.
b. Fair value of private-placement shares of listed companies, emerging market shares, unlisted equity
securities and impairment loss
As described in Note 31, the Corporation and its subsidiaries applied valuation techniques commonly
used by market practitioners to evaluate fair value of the financial instruments that do not have listed
market price in an active market. The measurement for the fair value of private-placement shares of
listed companies, emerging market shares and unlisted equity securities includes assumptions not based
on observable market prices or interest rates; therefore, the fair value may change significantly.
The Corporation and its subsidiaries immediately recognize impairment loss on its available-for-sale
financial assets when there is any indication that the investment may be impaired and the carrying
amount may not be recoverable. The Corporation and its subsidiaries’ management evaluates the
impairment based on the estimated future cash flow expected to be generated by the investment and
takes into consideration the market conditions and industry development.
6. CASH AND CASH EQUIVALENTS
December 31
2017 2016
Cash on hand $ 46,814 $ 47,111
Checking accounts and demand deposits 8,364,630 7,267,847
(Continued)
- 42 -
December 31
2017 2016
Cash equivalents (investments with original maturities less than three
months)
Time deposits $ 2,259,696 $ 3,503,330
Commercial papers with repurchase agreements 1,808,222 3,914,480
Bonds with repurchase agreements 377,300 735,000
$ 12,856,662 $ 15,467,768
(Concluded)
7. FINANCIAL INSTRUMENTS AT FAIR VALUE THROUGH PROFIT OR LOSS
December 31
2017 2016
Financial assets at FVTPL - current
Financial assets designated as at FVTPL
Mutual funds $ 2,655,982 $ 1,359,532
Listed shares 46,868 36,488
Future contracts (a) - 899
2,702,850 1,396,919
Financial assets held for trading
Listed shares 1,138,209 607,426
Mutual funds 622,426 732,951
Convertible bonds 229,671 319,100
Emerging market shares 215,464 231,953
Foreign exchange forward contracts (b) 2,024 -
2,207,794 1,891,430
$ 4,910,644 $ 3,288,349
Financial liabilities at FVTPL - current
Financial liabilities designated as at FVTPL
Call and put options (Note 20) $ - $ 405
Financial liabilities held for trading
Future contracts (a) 247 -
Foreign exchange forward contracts (b) - 4,536
247 4,536
$ 247 $ 4,941
a. The subsidiary Thintech United Metal Resources (Taicang) Co., Ltd. entered into precious metals
futures contracts to manage fair value exposures arising from price fluctuation on precious metals.
However, some of those contracts did not accounted for by using hedge accounting. As of the balance
sheet date, the outstanding precious metals futures contracts were as follows:
- 43 -
Maturity Date Weight (Kilograms) Amount (In thousands)
December 31, 2017
510
June 15, 2018
$ 8,798
( RMB 1,927 thousand)
December 31, 2016
June 15, 2017 1,275
25,046
( RMB 5,425 thousand)
b. The subsidiaries entered into foreign exchange forward contracts to manage exposures due to exchange
rate fluctuations of foreign currency denominated assets and liabilities. However, some of those
contracts did not accounted for by using hedge accounting. The outstanding foreign exchange forward
contracts not under hedge accounting of the subsidiaries at the balance sheet date were as follows:
Currency Maturity Date
Contract Amount
(In Thousands)
December 31, 2017
Sell USD/NTD January 2018 USD6,805/NTD204,580
Sell HKD/NTD January 2018 HKD11,000/NTD42,410
December 31, 2016
Sell USD/NTD January 2017-March 2017 USD7,634/NTD241,717
Sell HKD/NTD February 2017 HKD7,500/NTD30,734
8. AVAILABLE-FOR-SALE FINANCIAL ASSETS
December 31
2017 2016
Current Domestic investments
Listed shares $ 1,993,089 $ 2,359,896 Mutual funds 143,539 397,759 Unlisted shares 49,528 49,082
$ 2,186,156 $ 2,806,737
Noncurrent
Domestic investments
Listed shares $ 9,050,659 $ 7,428,757 Emerging market shares and unlisted shares 2,482,383 2,754,165 Private-placement shares of listed companies 172,785 136,042
11,705,827 10,318,964 (Continued)
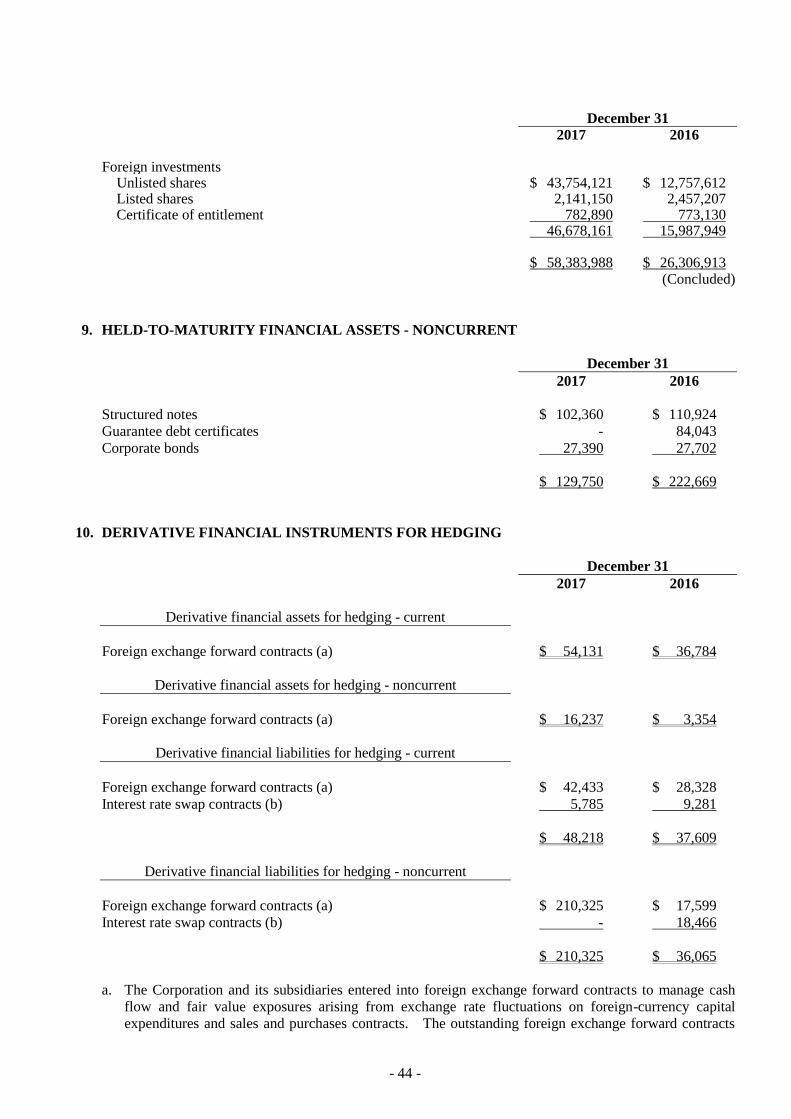
- 44 -
December 31
2017 2016 Foreign investments
Unlisted shares $ 43,754,121 $ 12,757,612 Listed shares 2,141,150 2,457,207 Certificate of entitlement 782,890 773,130
46,678,161 15,987,949 $ 58,383,988 $ 26,306,913
(Concluded)
9. HELD-TO-MATURITY FINANCIAL ASSETS - NONCURRENT
December 31
2017 2016
Structured notes $ 102,360 $ 110,924
Guarantee debt certificates - 84,043
Corporate bonds 27,390 27,702
$ 129,750 $ 222,669
10. DERIVATIVE FINANCIAL INSTRUMENTS FOR HEDGING
December 31
2017 2016
Derivative financial assets for hedging - current
Foreign exchange forward contracts (a) $ 54,131 $ 36,784
Derivative financial assets for hedging - noncurrent
Foreign exchange forward contracts (a) $ 16,237 $ 3,354
Derivative financial liabilities for hedging - current
Foreign exchange forward contracts (a) $ 42,433 $ 28,328
Interest rate swap contracts (b) 5,785 9,281
$ 48,218 $ 37,609
Derivative financial liabilities for hedging - noncurrent
Foreign exchange forward contracts (a) $ 210,325 $ 17,599
Interest rate swap contracts (b) - 18,466
$ 210,325 $ 36,065
a. The Corporation and its subsidiaries entered into foreign exchange forward contracts to manage cash
flow and fair value exposures arising from exchange rate fluctuations on foreign-currency capital
expenditures and sales and purchases contracts. The outstanding foreign exchange forward contracts
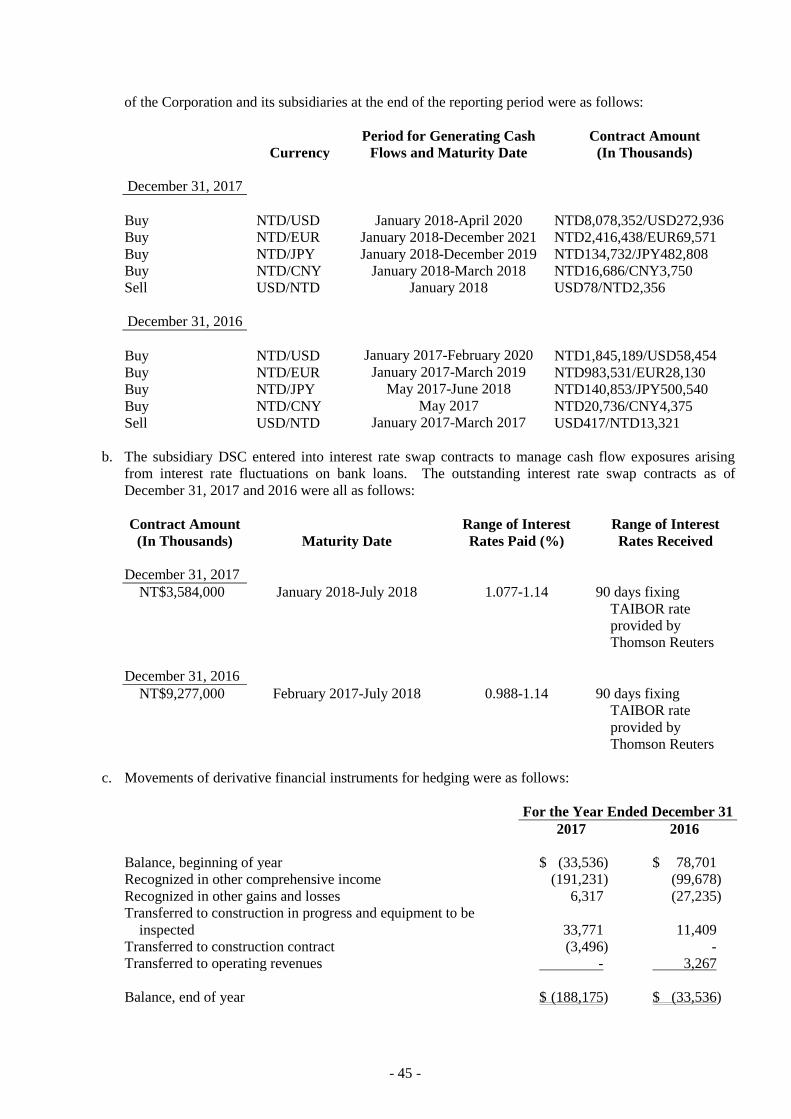
- 45 -
of the Corporation and its subsidiaries at the end of the reporting period were as follows:
Currency
Period for Generating Cash
Flows and Maturity Date
Contract Amount
(In Thousands)
December 31, 2017
Buy NTD/USD January 2018-April 2020 NTD8,078,352/USD272,936
Buy NTD/EUR January 2018-December 2021 NTD2,416,438/EUR69,571
Buy NTD/JPY January 2018-December 2019 NTD134,732/JPY482,808
Buy NTD/CNY January 2018-March 2018 NTD16,686/CNY3,750
Sell USD/NTD January 2018 USD78/NTD2,356
December 31, 2016
Buy NTD/USD January 2017-February 2020 NTD1,845,189/USD58,454
Buy NTD/EUR January 2017-March 2019 NTD983,531/EUR28,130
Buy NTD/JPY May 2017-June 2018 NTD140,853/JPY500,540
Buy NTD/CNY May 2017 NTD20,736/CNY4,375
Sell USD/NTD January 2017-March 2017 USD417/NTD13,321
b. The subsidiary DSC entered into interest rate swap contracts to manage cash flow exposures arising
from interest rate fluctuations on bank loans. The outstanding interest rate swap contracts as of
December 31, 2017 and 2016 were all as follows:
Contract Amount
(In Thousands) Maturity Date
Range of Interest
Rates Paid (%)
Range of Interest
Rates Received
December 31, 2017
NT$3,584,000 January 2018-July 2018 1.077-1.14 90 days fixing
TAIBOR rate
provided by
Thomson Reuters
December 31, 2016
NT$9,277,000 February 2017-July 2018 0.988-1.14 90 days fixing
TAIBOR rate
provided by
Thomson Reuters
c. Movements of derivative financial instruments for hedging were as follows:
For the Year Ended December 31
2017 2016
Balance, beginning of year $ (33,536) $ 78,701
Recognized in other comprehensive income (191,231) (99,678)
Recognized in other gains and losses 6,317 (27,235)
Transferred to construction in progress and equipment to be
inspected 33,771 11,409
Transferred to construction contract (3,496) -
Transferred to operating revenues - 3,267
Balance, end of year $ (188,175) $ (33,536)
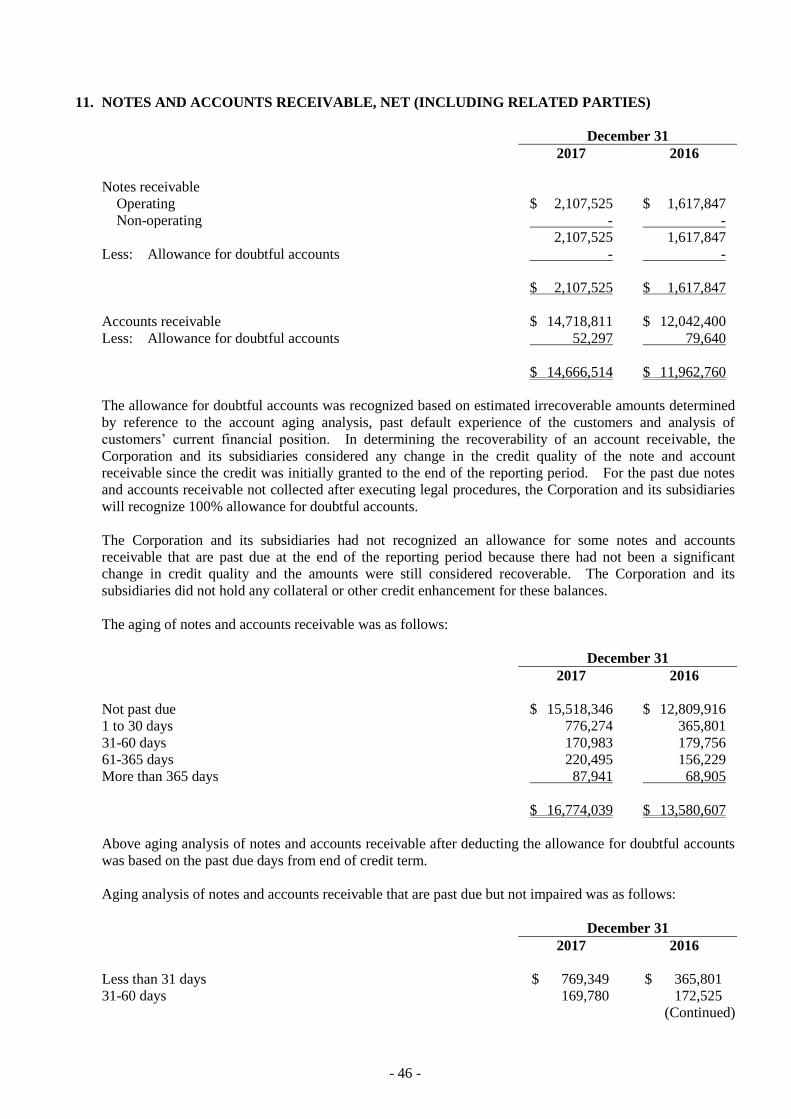
- 46 -
11. NOTES AND ACCOUNTS RECEIVABLE, NET (INCLUDING RELATED PARTIES)
December 31
2017 2016
Notes receivable
Operating $ 2,107,525 $ 1,617,847
Non-operating - -
2,107,525 1,617,847
Less: Allowance for doubtful accounts - -
$ 2,107,525 $ 1,617,847
Accounts receivable $ 14,718,811 $ 12,042,400
Less: Allowance for doubtful accounts 52,297 79,640
$ 14,666,514 $ 11,962,760
The allowance for doubtful accounts was recognized based on estimated irrecoverable amounts determined
by reference to the account aging analysis, past default experience of the customers and analysis of
customers’ current financial position. In determining the recoverability of an account receivable, the
Corporation and its subsidiaries considered any change in the credit quality of the note and account
receivable since the credit was initially granted to the end of the reporting period. For the past due notes
and accounts receivable not collected after executing legal procedures, the Corporation and its subsidiaries
will recognize 100% allowance for doubtful accounts.
The Corporation and its subsidiaries had not recognized an allowance for some notes and accounts
receivable that are past due at the end of the reporting period because there had not been a significant
change in credit quality and the amounts were still considered recoverable. The Corporation and its
subsidiaries did not hold any collateral or other credit enhancement for these balances.
The aging of notes and accounts receivable was as follows:
December 31
2017 2016
Not past due $ 15,518,346 $ 12,809,916
1 to 30 days 776,274 365,801
31-60 days 170,983 179,756
61-365 days 220,495 156,229
More than 365 days 87,941 68,905
$ 16,774,039 $ 13,580,607
Above aging analysis of notes and accounts receivable after deducting the allowance for doubtful accounts
was based on the past due days from end of credit term.
Aging analysis of notes and accounts receivable that are past due but not impaired was as follows:
December 31
2017 2016
Less than 31 days $ 769,349 $ 365,801
31-60 days 169,780 172,525
(Continued)
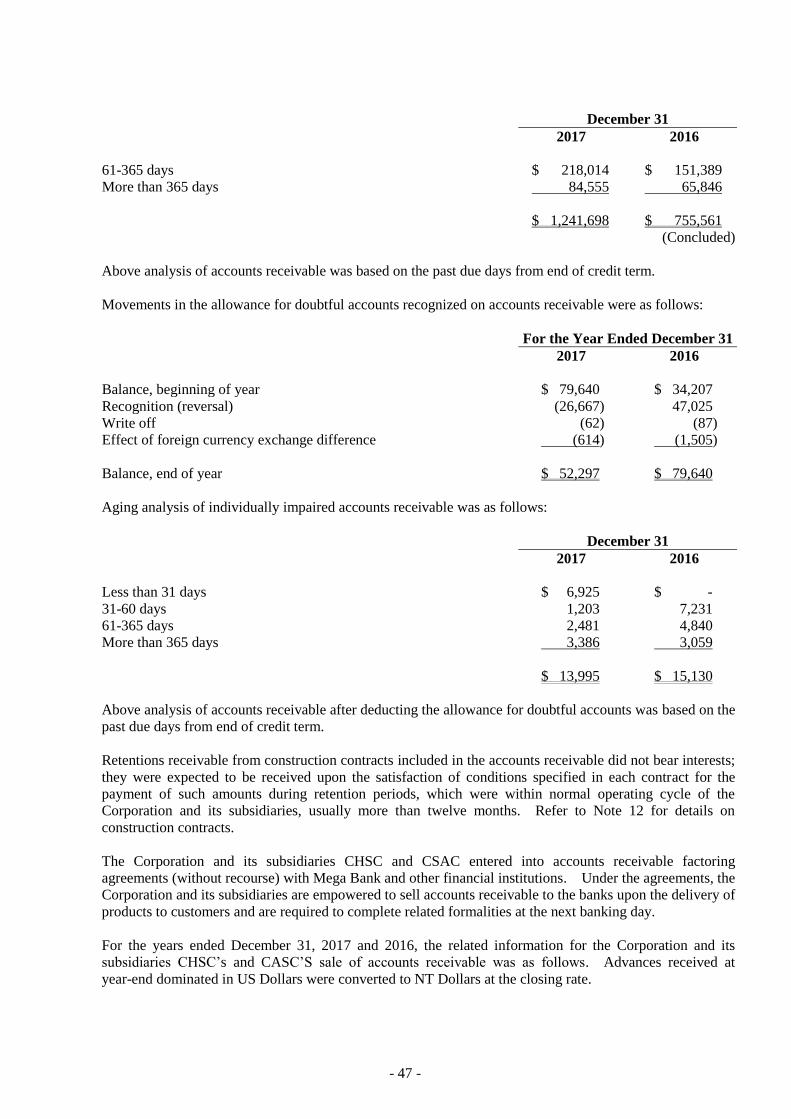
- 47 -
December 31
2017 2016
61-365 days $ 218,014 $ 151,389
More than 365 days 84,555 65,846
$ 1,241,698 $ 755,561
(Concluded)
Above analysis of accounts receivable was based on the past due days from end of credit term.
Movements in the allowance for doubtful accounts recognized on accounts receivable were as follows:
For the Year Ended December 31
2017 2016
Balance, beginning of year $ 79,640 $ 34,207
Recognition (reversal) (26,667) 47,025
Write off (62) (87)
Effect of foreign currency exchange difference (614) (1,505)
Balance, end of year $ 52,297 $ 79,640
Aging analysis of individually impaired accounts receivable was as follows:
December 31
2017 2016
Less than 31 days $ 6,925 $ -
31-60 days 1,203 7,231
61-365 days 2,481 4,840
More than 365 days 3,386 3,059
$ 13,995 $ 15,130
Above analysis of accounts receivable after deducting the allowance for doubtful accounts was based on the
past due days from end of credit term.
Retentions receivable from construction contracts included in the accounts receivable did not bear interests;
they were expected to be received upon the satisfaction of conditions specified in each contract for the
payment of such amounts during retention periods, which were within normal operating cycle of the
Corporation and its subsidiaries, usually more than twelve months. Refer to Note 12 for details on
construction contracts.
The Corporation and its subsidiaries CHSC and CSAC entered into accounts receivable factoring
agreements (without recourse) with Mega Bank and other financial institutions. Under the agreements, the
Corporation and its subsidiaries are empowered to sell accounts receivable to the banks upon the delivery of
products to customers and are required to complete related formalities at the next banking day.
For the years ended December 31, 2017 and 2016, the related information for the Corporation and its
subsidiaries CHSC’s and CASC’S sale of accounts receivable was as follows. Advances received at
year-end dominated in US Dollars were converted to NT Dollars at the closing rate.
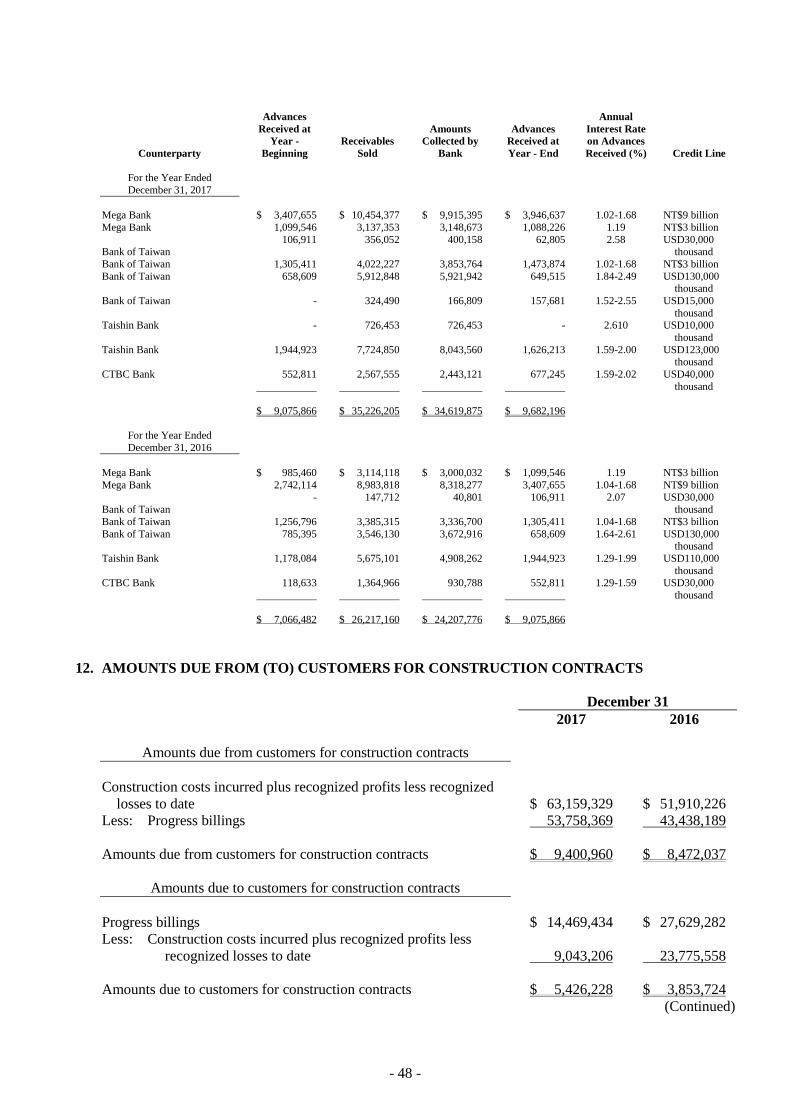
- 48 -
Counterparty
Advances
Received at
Year -
Beginning
Receivables
Sold
Amounts
Collected by
Bank
Advances
Received at
Year - End
Annual
Interest Rate
on Advances
Received (%) Credit Line
For the Year Ended
December 31, 2017
Mega Bank $ 3,407,655 $ 10,454,377 $ 9,915,395 $ 3,946,637 1.02-1.68 NT$9 billion
Mega Bank 1,099,546 3,137,353 3,148,673 1,088,226 1.19 NT$3 billion
Bank of Taiwan 106,911
356,052 400,158 62,805 2.58 USD30,000
thousand
Bank of Taiwan 1,305,411 4,022,227 3,853,764 1,473,874 1.02-1.68 NT$3 billion
Bank of Taiwan
658,609 5,912,848 5,921,942 649,515 1.84-2.49 USD130,000 thousand
Bank of Taiwan
- 324,490 166,809 157,681 1.52-2.55 USD15,000
thousand Taishin Bank
- 726,453 726,453 - 2.610 USD10,000
thousand
Taishin Bank
1,944,923 7,724,850 8,043,560 1,626,213 1.59-2.00 USD123,000 thousand
CTBC Bank
552,811
2,567,555
2,443,121
677,245
1.59-2.02 USD40,000
thousand
$ 9,075,866 $ 35,226,205 $ 34,619,875 $ 9,682,196
For the Year Ended
December 31, 2016
Mega Bank $ 985,460 $ 3,114,118 $ 3,000,032 $ 1,099,546 1.19 NT$3 billion
Mega Bank 2,742,114 8,983,818 8,318,277 3,407,655 1.04-1.68 NT$9 billion
Bank of Taiwan -
147,712 40,801 106,911 2.07 USD30,000
thousand
Bank of Taiwan 1,256,796 3,385,315 3,336,700 1,305,411 1.04-1.68 NT$3 billion
Bank of Taiwan
785,395 3,546,130 3,672,916 658,609 1.64-2.61 USD130,000 thousand
Taishin Bank
1,178,084 5,675,101 4,908,262 1,944,923 1.29-1.99 USD110,000
thousand CTBC Bank
118,633
1,364,966
930,788
552,811
1.29-1.59 USD30,000
thousand
$ 7,066,482 $ 26,217,160 $ 24,207,776 $ 9,075,866
12. AMOUNTS DUE FROM (TO) CUSTOMERS FOR CONSTRUCTION CONTRACTS
December 31
2017 2016
Amounts due from customers for construction contracts
Construction costs incurred plus recognized profits less recognized
losses to date $ 63,159,329 $ 51,910,226
Less: Progress billings 53,758,369 43,438,189
Amounts due from customers for construction contracts $ 9,400,960 $ 8,472,037
Amounts due to customers for construction contracts
Progress billings $ 14,469,434 $ 27,629,282
Less: Construction costs incurred plus recognized profits less
recognized losses to date 9,043,206 23,775,558
Amounts due to customers for construction contracts $ 5,426,228 $ 3,853,724
(Continued)
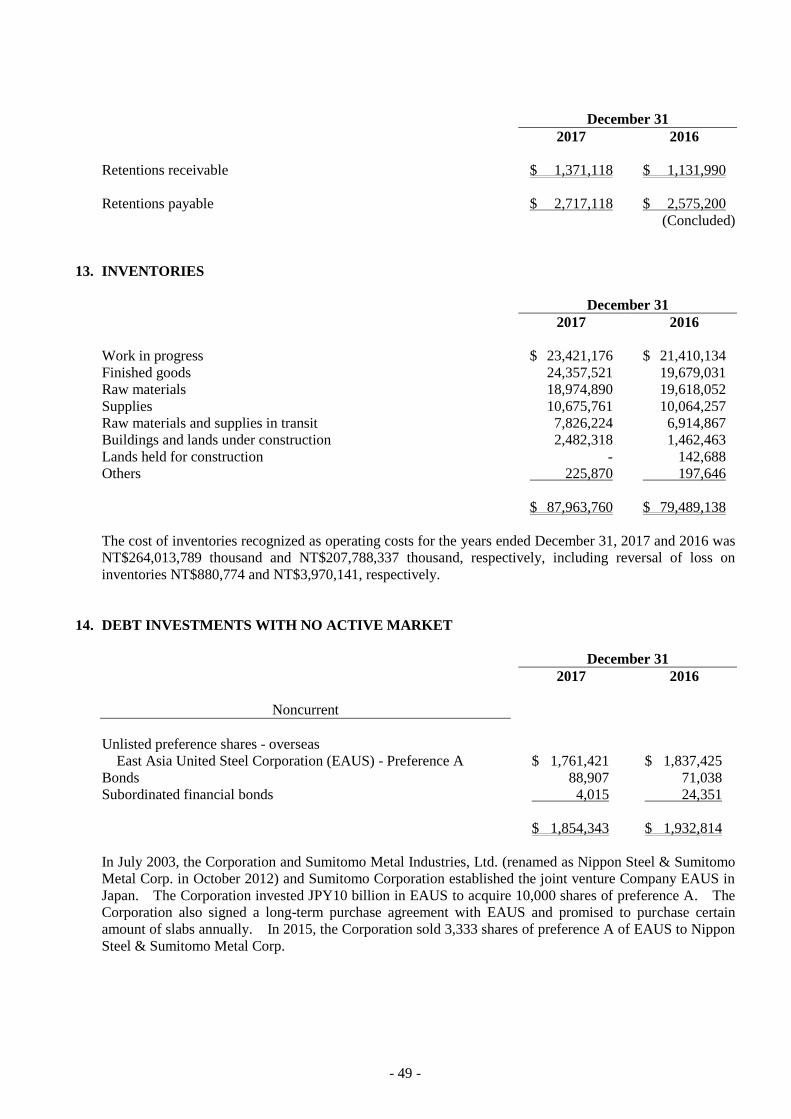
- 49 -
December 31
2017 2016
Retentions receivable $ 1,371,118 $ 1,131,990
Retentions payable $ 2,717,118 $ 2,575,200
(Concluded)
13. INVENTORIES
December 31
2017 2016
Work in progress $ 23,421,176 $ 21,410,134
Finished goods 24,357,521 19,679,031
Raw materials 18,974,890 19,618,052
Supplies 10,675,761 10,064,257
Raw materials and supplies in transit 7,826,224 6,914,867
Buildings and lands under construction 2,482,318 1,462,463
Lands held for construction - 142,688
Others 225,870 197,646
$ 87,963,760 $ 79,489,138
The cost of inventories recognized as operating costs for the years ended December 31, 2017 and 2016 was
NT$264,013,789 thousand and NT$207,788,337 thousand, respectively, including reversal of loss on
inventories NT$880,774 and NT$3,970,141, respectively.
14. DEBT INVESTMENTS WITH NO ACTIVE MARKET
December 31
2017 2016
Noncurrent
Unlisted preference shares - overseas
East Asia United Steel Corporation (EAUS) - Preference A $ 1,761,421 $ 1,837,425
Bonds 88,907 71,038
Subordinated financial bonds 4,015 24,351
$ 1,854,343 $ 1,932,814
In July 2003, the Corporation and Sumitomo Metal Industries, Ltd. (renamed as Nippon Steel & Sumitomo
Metal Corp. in October 2012) and Sumitomo Corporation established the joint venture Company EAUS in
Japan. The Corporation invested JPY10 billion in EAUS to acquire 10,000 shares of preference A. The
Corporation also signed a long-term purchase agreement with EAUS and promised to purchase certain
amount of slabs annually. In 2015, the Corporation sold 3,333 shares of preference A of EAUS to Nippon
Steel & Sumitomo Metal Corp.
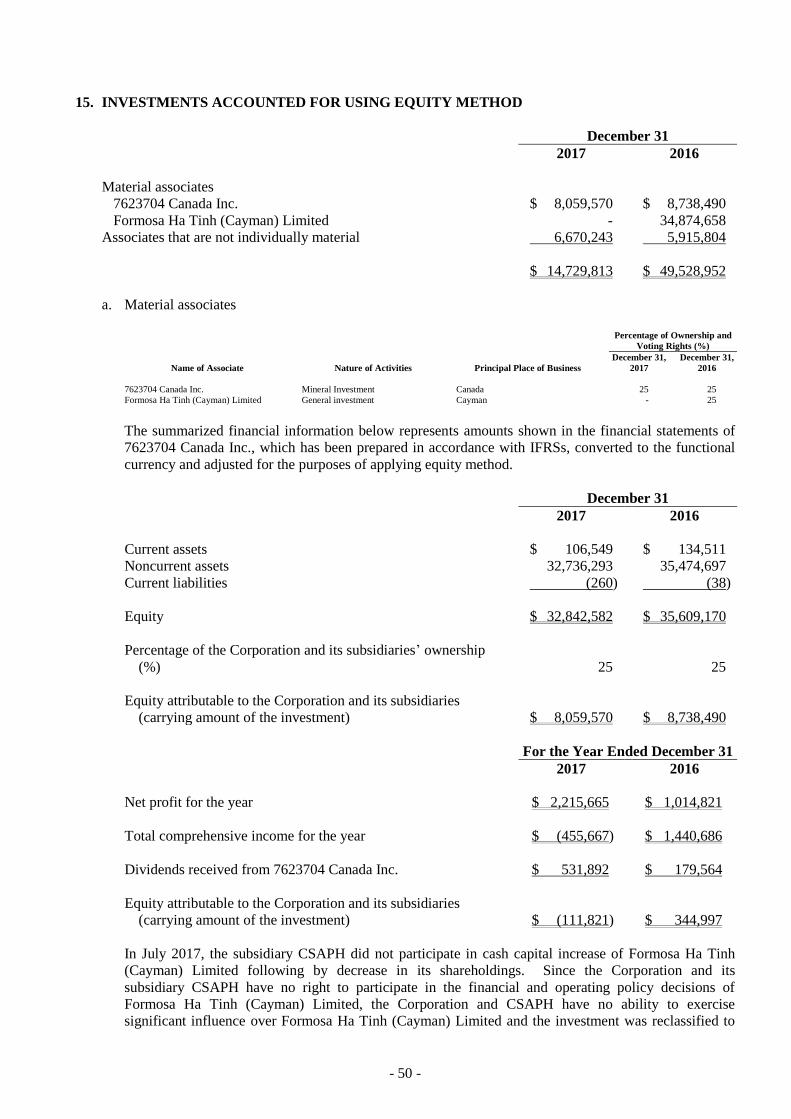
- 50 -
15. INVESTMENTS ACCOUNTED FOR USING EQUITY METHOD
December 31
2017 2016
Material associates
7623704 Canada Inc. $ 8,059,570 $ 8,738,490
Formosa Ha Tinh (Cayman) Limited - 34,874,658
Associates that are not individually material 6,670,243 5,915,804
$ 14,729,813 $ 49,528,952
a. Material associates
Percentage of Ownership and
Voting Rights (%)
Name of Associate Nature of Activities Principal Place of Business
December 31,
2017
December 31,
2016
7623704 Canada Inc. Mineral Investment Canada 25 25
Formosa Ha Tinh (Cayman) Limited General investment Cayman - 25
The summarized financial information below represents amounts shown in the financial statements of
7623704 Canada Inc., which has been prepared in accordance with IFRSs, converted to the functional
currency and adjusted for the purposes of applying equity method.
December 31
2017 2016
Current assets $ 106,549 $ 134,511
Noncurrent assets 32,736,293 35,474,697
Current liabilities (260) (38)
Equity $ 32,842,582 $ 35,609,170
Percentage of the Corporation and its subsidiaries’ ownership
(%)
25
25
Equity attributable to the Corporation and its subsidiaries
(carrying amount of the investment)
$ 8,059,570
$ 8,738,490
For the Year Ended December 31
2017 2016
Net profit for the year $ 2,215,665 $ 1,014,821
Total comprehensive income for the year $ (455,667) $ 1,440,686
Dividends received from 7623704 Canada Inc. $ 531,892 $ 179,564
Equity attributable to the Corporation and its subsidiaries
(carrying amount of the investment)
$ (111,821)
$ 344,997
In July 2017, the subsidiary CSAPH did not participate in cash capital increase of Formosa Ha Tinh
(Cayman) Limited following by decrease in its shareholdings. Since the Corporation and its
subsidiary CSAPH have no right to participate in the financial and operating policy decisions of
Formosa Ha Tinh (Cayman) Limited, the Corporation and CSAPH have no ability to exercise
significant influence over Formosa Ha Tinh (Cayman) Limited and the investment was reclassified to
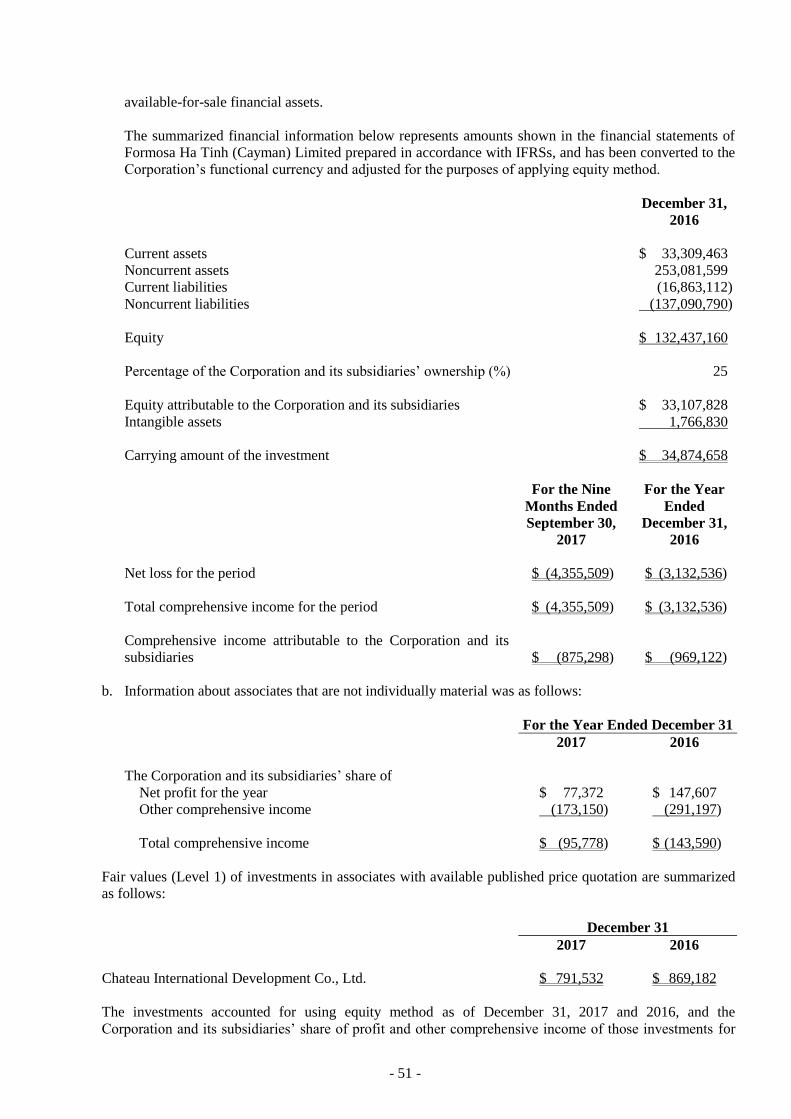
- 51 -
available-for-sale financial assets.
The summarized financial information below represents amounts shown in the financial statements of
Formosa Ha Tinh (Cayman) Limited prepared in accordance with IFRSs, and has been converted to the
Corporation’s functional currency and adjusted for the purposes of applying equity method.
December 31,
2016
Current assets $ 33,309,463
Noncurrent assets 253,081,599
Current liabilities (16,863,112)
Noncurrent liabilities (137,090,790)
Equity $ 132,437,160
Percentage of the Corporation and its subsidiaries’ ownership (%) 25
Equity attributable to the Corporation and its subsidiaries $ 33,107,828
Intangible assets 1,766,830
Carrying amount of the investment $ 34,874,658
For the Nine
Months Ended
September 30,
2017
For the Year
Ended
December 31,
2016
Net loss for the period $ (4,355,509) $ (3,132,536)
Total comprehensive income for the period $ (4,355,509) $ (3,132,536)
Comprehensive income attributable to the Corporation and its
subsidiaries
$ (875,298)
$ (969,122)
b. Information about associates that are not individually material was as follows:
For the Year Ended December 31
2017 2016
The Corporation and its subsidiaries’ share of
Net profit for the year $ 77,372 $ 147,607
Other comprehensive income (173,150) (291,197)
Total comprehensive income $ (95,778) $ (143,590)
Fair values (Level 1) of investments in associates with available published price quotation are summarized
as follows:
December 31
2017 2016
Chateau International Development Co., Ltd. $ 791,532 $ 869,182
The investments accounted for using equity method as of December 31, 2017 and 2016, and the
Corporation and its subsidiaries’ share of profit and other comprehensive income of those investments for
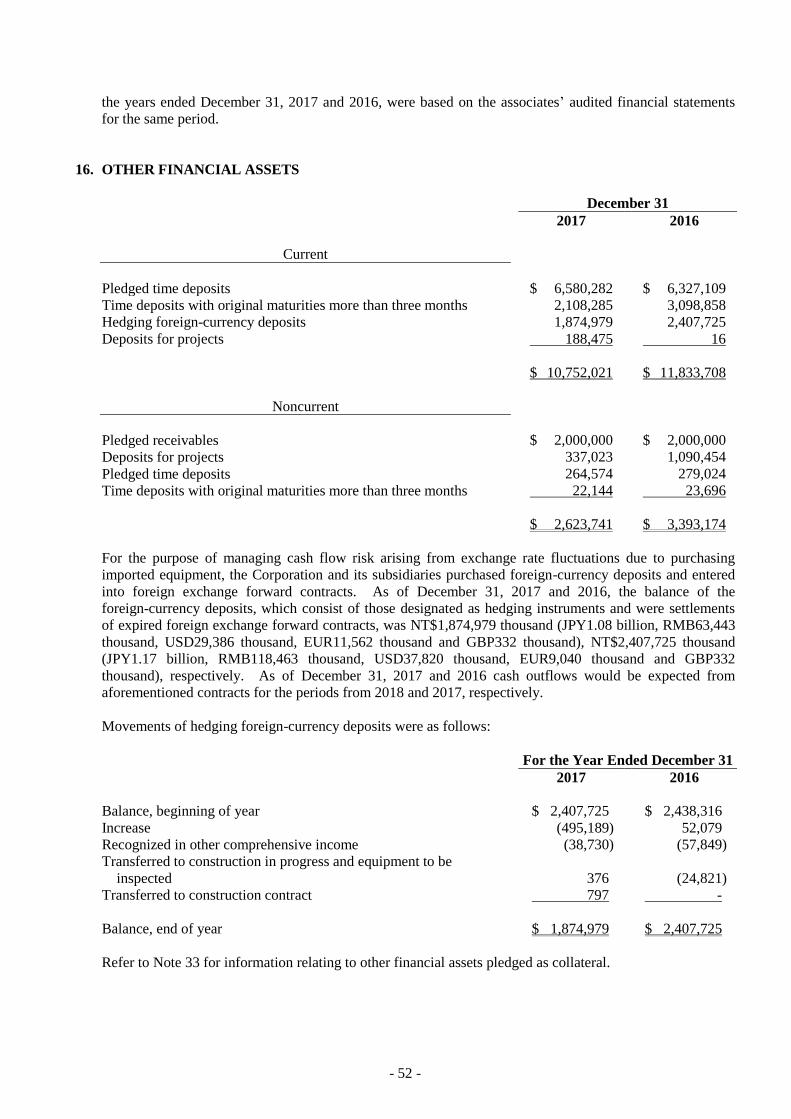
- 52 -
the years ended December 31, 2017 and 2016, were based on the associates’ audited financial statements
for the same period.
16. OTHER FINANCIAL ASSETS
December 31
2017 2016
Current
Pledged time deposits $ 6,580,282 $ 6,327,109
Time deposits with original maturities more than three months 2,108,285 3,098,858
Hedging foreign-currency deposits 1,874,979 2,407,725
Deposits for projects 188,475 16
$ 10,752,021 $ 11,833,708
Noncurrent
Pledged receivables $ 2,000,000 $ 2,000,000
Deposits for projects 337,023 1,090,454
Pledged time deposits 264,574 279,024
Time deposits with original maturities more than three months 22,144 23,696
$ 2,623,741 $ 3,393,174
For the purpose of managing cash flow risk arising from exchange rate fluctuations due to purchasing
imported equipment, the Corporation and its subsidiaries purchased foreign-currency deposits and entered
into foreign exchange forward contracts. As of December 31, 2017 and 2016, the balance of the
foreign-currency deposits, which consist of those designated as hedging instruments and were settlements
of expired foreign exchange forward contracts, was NT$1,874,979 thousand (JPY1.08 billion, RMB63,443
thousand, USD29,386 thousand, EUR11,562 thousand and GBP332 thousand), NT$2,407,725 thousand
(JPY1.17 billion, RMB118,463 thousand, USD37,820 thousand, EUR9,040 thousand and GBP332
thousand), respectively. As of December 31, 2017 and 2016 cash outflows would be expected from
aforementioned contracts for the periods from 2018 and 2017, respectively.
Movements of hedging foreign-currency deposits were as follows:
For the Year Ended December 31
2017 2016
Balance, beginning of year $ 2,407,725 $ 2,438,316
Increase (495,189) 52,079
Recognized in other comprehensive income (38,730) (57,849)
Transferred to construction in progress and equipment to be
inspected 376 (24,821)
Transferred to construction contract 797 -
Balance, end of year $ 1,874,979 $ 2,407,725
Refer to Note 33 for information relating to other financial assets pledged as collateral.
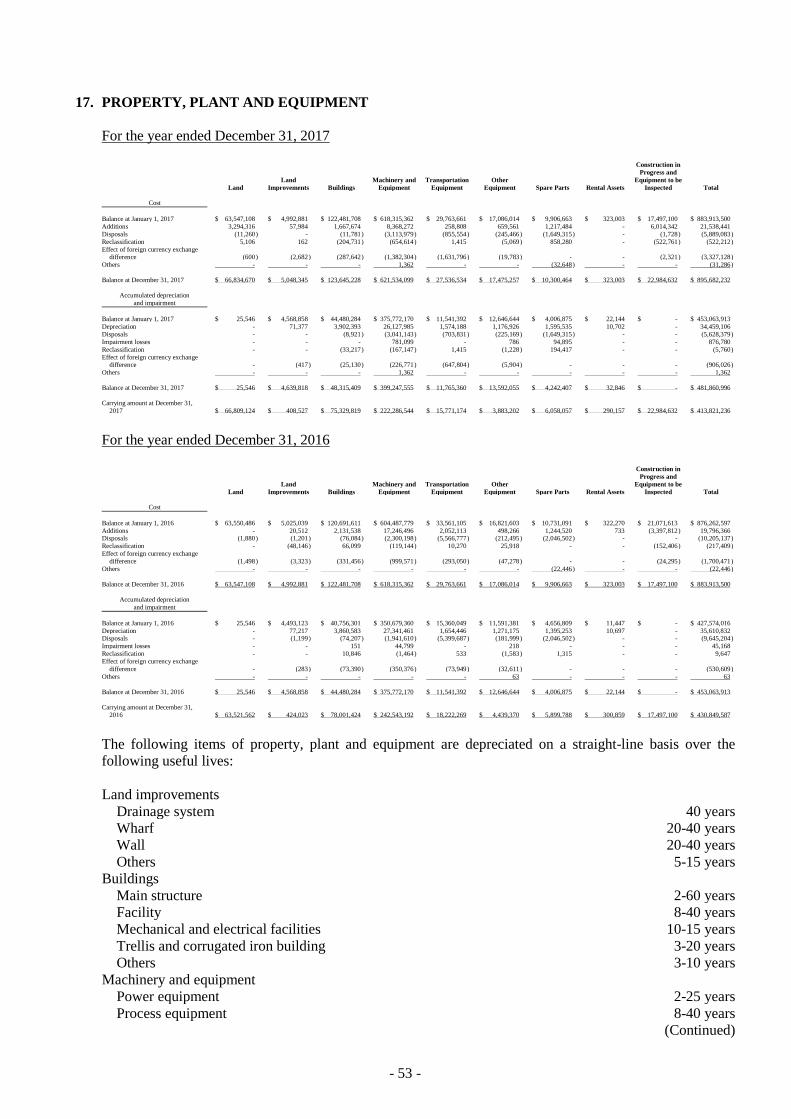
- 53 -
17. PROPERTY, PLANT AND EQUIPMENT
For the year ended December 31, 2017
Land
Land
Improvements Buildings
Machinery and
Equipment
Transportation
Equipment
Other
Equipment Spare Parts
Rental Assets
Construction in
Progress and
Equipment to be
Inspected Total
Cost
Balance at January 1, 2017 $ 63,547,108 $ 4,992,881 $ 122,481,708 $ 618,315,362 $ 29,763,661 $ 17,086,014 $ 9,906,663 $ 323,003 $ 17,497,100 $ 883,913,500
Additions 3,294,316 57,984 1,667,674 8,368,272 258,808 659,561 1,217,484 - 6,014,342 21,538,441
Disposals (11,260 ) - (11,781 ) (3,113,979 ) (855,554 ) (245,466 ) (1,649,315 ) - (1,728 ) (5,889,083 )
Reclassification 5,106 162 (204,731 ) (654,614 ) 1,415 (5,069 ) 858,280 - (522,761 ) (522,212 )
Effect of foreign currency exchange difference (600 )
(2,682 )
(287,642 )
(1,382,304 )
(1,631,796 )
(19,783 )
-
-
(2,321 )
(3,327,128 )
Others - - - 1,362 - - (32,648 ) - - (31,286 )
Balance at December 31, 2017 $ 66,834,670 $ 5,048,345 $ 123,645,228 $ 621,534,099 $ 27,536,534 $ 17,475,257 $ 10,300,464 $ 323,003 $ 22,984,632 $ 895,682,232
Accumulated depreciation
and impairment
Balance at January 1, 2017 $ 25,546 $ 4,568,858 $ 44,480,284 $ 375,772,170 $ 11,541,392 $ 12,646,644 $ 4,006,875 $ 22,144 $ - $ 453,063,913
Depreciation - 71,377 3,902,393 26,127,985 1,574,188 1,176,926 1,595,535 10,702 - 34,459,106
Disposals - - (8,921 ) (3,041,143 ) (703,831 ) (225,169 ) (1,649,315 ) - - (5,628,379 )
Impairment losses - - - 781,099 - 786 94,895 - - 876,780
Reclassification - - (33,217 ) (167,147 ) 1,415 (1,228 ) 194,417 - - (5,760 )
Effect of foreign currency exchange difference -
(417 )
(25,130 )
(226,771 )
(647,804 )
(5,904 )
-
-
-
(906,026 )
Others - - - 1,362 - - - - - 1,362
Balance at December 31, 2017 $ 25,546 $ 4,639,818 $ 48,315,409 $ 399,247,555 $ 11,765,360 $ 13,592,055 $ 4,242,407 $ 32,846 $ - $ 481,860,996
Carrying amount at December 31,
2017 $ 66,809,124
$ 408,527
$ 75,329,819
$ 222,286,544
$ 15,771,174
$ 3,883,202
$ 6,058,057
$ 290,157
$ 22,984,632
$ 413,821,236
For the year ended December 31, 2016
Land
Land
Improvements Buildings
Machinery and
Equipment
Transportation
Equipment
Other
Equipment Spare Parts
Rental Assets
Construction in
Progress and
Equipment to be
Inspected Total
Cost
Balance at January 1, 2016 $ 63,550,486 $ 5,025,039 $ 120,691,611 $ 604,487,779 $ 33,561,105 $ 16,821,603 $ 10,731,091 $ 322,270 $ 21,071,613 $ 876,262,597
Additions - 20,512 2,131,538 17,246,496 2,052,113 498,266 1,244,520 733 (3,397,812 ) 19,796,366 Disposals (1,880 ) (1,201 ) (76,084 ) (2,300,198 ) (5,566,777 ) (212,495 ) (2,046,502 ) - - (10,205,137 )
Reclassification - (48,146 ) 66,099 (119,144 ) 10,270 25,918 - - (152,406 ) (217,409 )
Effect of foreign currency exchange
difference (1,498 )
(3,323 )
(331,456 )
(999,571 )
(293,050 )
(47,278 )
-
-
(24,295 )
(1,700,471 )
Others - - - - - - (22,446 ) - - (22,446 )
Balance at December 31, 2016 $ 63,547,108 $ 4,992,881 $ 122,481,708 $ 618,315,362 $ 29,763,661 $ 17,086,014 $ 9,906,663 $ 323,003 $ 17,497,100 $ 883,913,500
Accumulated depreciation
and impairment
Balance at January 1, 2016 $ 25,546 $ 4,493,123 $ 40,756,301 $ 350,679,360 $ 15,360,049 $ 11,591,381 $ 4,656,809 $ 11,447 $ - $ 427,574,016
Depreciation - 77,217 3,860,583 27,341,461 1,654,446 1,271,175 1,395,253 10,697 - 35,610,832 Disposals - (1,199 ) (74,207 ) (1,941,610 ) (5,399,687 ) (181,999 ) (2,046,502 ) - - (9,645,204 )
Impairment losses - - 151 44,799 - 218 - - - 45,168
Reclassification - - 10,846 (1,464 ) 533 (1,583 ) 1,315 - - 9,647
Effect of foreign currency exchange
difference -
(283 )
(73,390 )
(350,376 )
(73,949 )
(32,611 )
-
-
-
(530,609 )
Others - - - - - 63 - - - 63
Balance at December 31, 2016 $ 25,546 $ 4,568,858 $ 44,480,284 $ 375,772,170 $ 11,541,392 $ 12,646,644 $ 4,006,875 $ 22,144 $ - $ 453,063,913
Carrying amount at December 31,
2016 $ 63,521,562
$ 424,023
$ 78,001,424
$ 242,543,192
$ 18,222,269
$ 4,439,370
$ 5,899,788
$ 300,859
$ 17,497,100
$ 430,849,587
The following items of property, plant and equipment are depreciated on a straight-line basis over the
following useful lives:
Land improvements
Drainage system 40 years
Wharf 20-40 years
Wall 20-40 years
Others 5-15 years
Buildings
Main structure 2-60 years
Facility 8-40 years
Mechanical and electrical facilities 10-15 years
Trellis and corrugated iron building 3-20 years
Others 3-10 years
Machinery and equipment
Power equipment 2-25 years
Process equipment 8-40 years
(Continued)
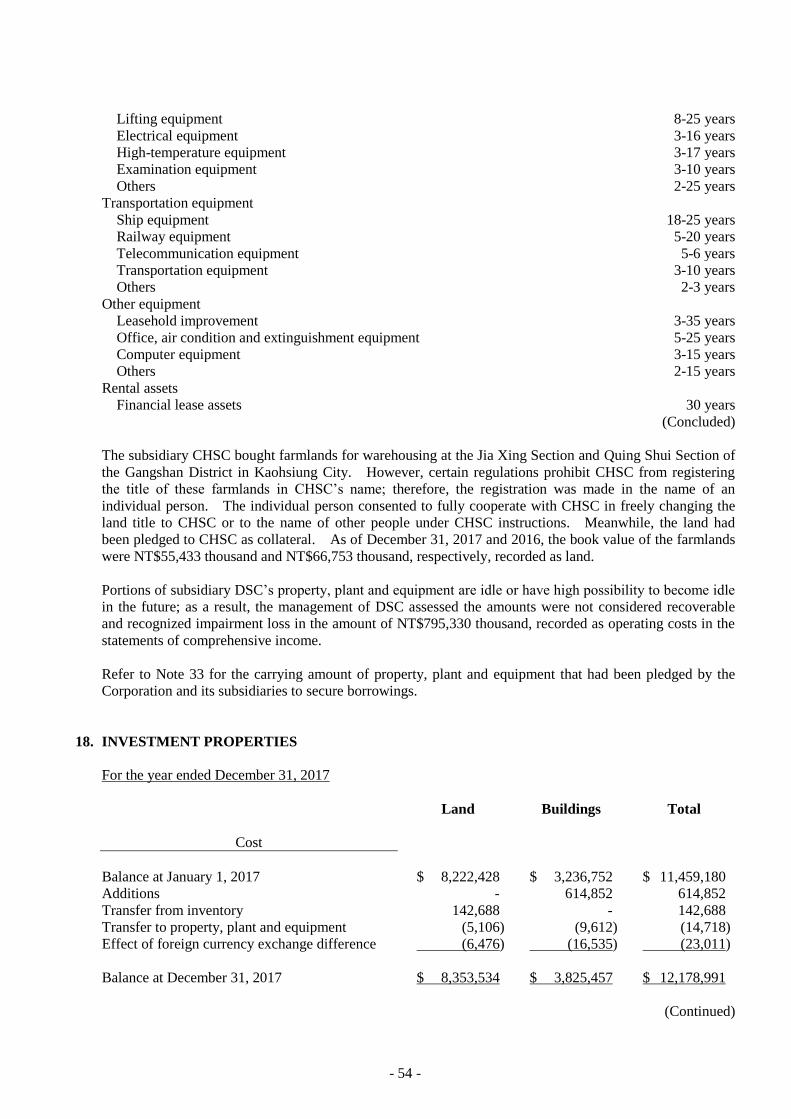
- 54 -
Lifting equipment 8-25 years
Electrical equipment 3-16 years
High-temperature equipment 3-17 years
Examination equipment 3-10 years
Others 2-25 years
Transportation equipment
Ship equipment 18-25 years
Railway equipment 5-20 years
Telecommunication equipment 5-6 years
Transportation equipment 3-10 years
Others 2-3 years
Other equipment
Leasehold improvement 3-35 years
Office, air condition and extinguishment equipment 5-25 years
Computer equipment 3-15 years
Others 2-15 years
Rental assets
Financial lease assets 30 years
(Concluded)
The subsidiary CHSC bought farmlands for warehousing at the Jia Xing Section and Quing Shui Section of
the Gangshan District in Kaohsiung City. However, certain regulations prohibit CHSC from registering
the title of these farmlands in CHSC’s name; therefore, the registration was made in the name of an
individual person. The individual person consented to fully cooperate with CHSC in freely changing the
land title to CHSC or to the name of other people under CHSC instructions. Meanwhile, the land had
been pledged to CHSC as collateral. As of December 31, 2017 and 2016, the book value of the farmlands
were NT$55,433 thousand and NT$66,753 thousand, respectively, recorded as land.
Portions of subsidiary DSC’s property, plant and equipment are idle or have high possibility to become idle
in the future; as a result, the management of DSC assessed the amounts were not considered recoverable
and recognized impairment loss in the amount of NT$795,330 thousand, recorded as operating costs in the
statements of comprehensive income.
Refer to Note 33 for the carrying amount of property, plant and equipment that had been pledged by the
Corporation and its subsidiaries to secure borrowings.
18. INVESTMENT PROPERTIES
For the year ended December 31, 2017
Land Buildings Total
Cost
Balance at January 1, 2017 $ 8,222,428 $ 3,236,752 $ 11,459,180
Additions - 614,852 614,852
Transfer from inventory 142,688 - 142,688
Transfer to property, plant and equipment (5,106) (9,612) (14,718)
Effect of foreign currency exchange difference (6,476) (16,535) (23,011)
Balance at December 31, 2017 $ 8,353,534 $ 3,825,457 $ 12,178,991
(Continued)
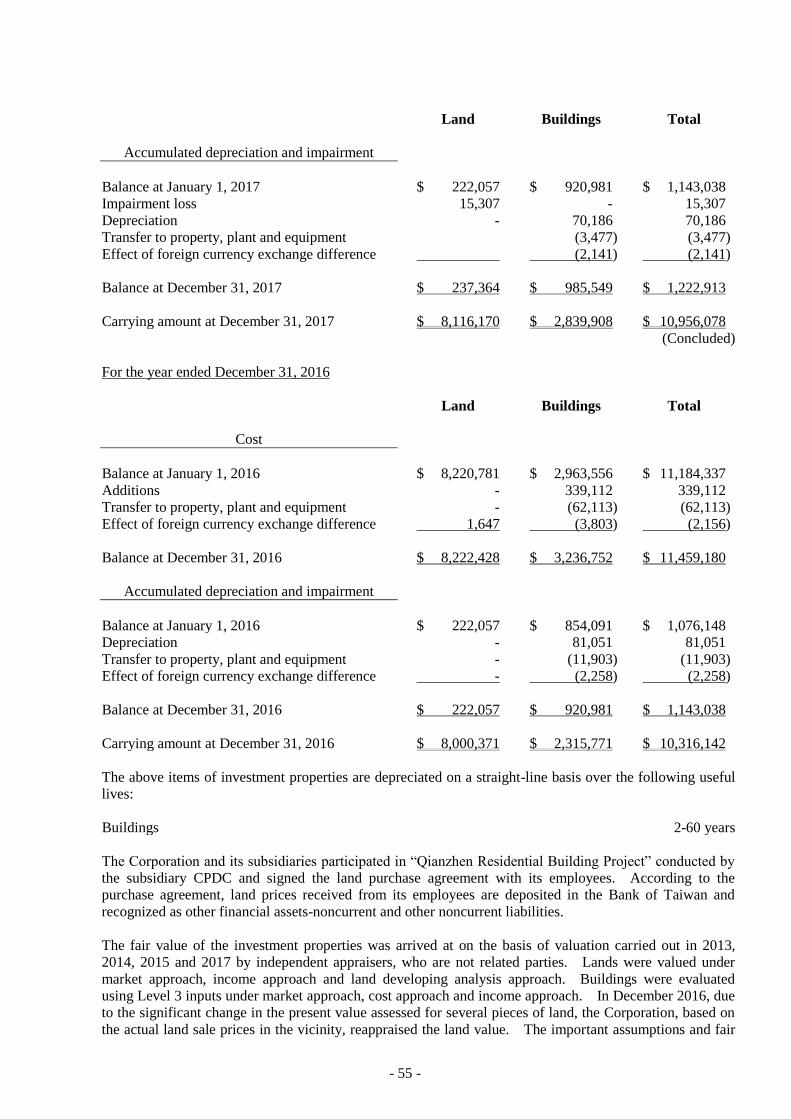
- 55 -
Land Buildings Total
Accumulated depreciation and impairment
Balance at January 1, 2017 $ 222,057 $ 920,981 $ 1,143,038
Impairment loss 15,307 - 15,307
Depreciation - 70,186 70,186
Transfer to property, plant and equipment (3,477) (3,477)
Effect of foreign currency exchange difference (2,141) (2,141)
Balance at December 31, 2017 $ 237,364 $ 985,549 $ 1,222,913
Carrying amount at December 31, 2017 $ 8,116,170 $ 2,839,908 $ 10,956,078
(Concluded)
For the year ended December 31, 2016
Land Buildings Total
Cost
Balance at January 1, 2016 $ 8,220,781 $ 2,963,556 $ 11,184,337
Additions - 339,112 339,112
Transfer to property, plant and equipment - (62,113) (62,113)
Effect of foreign currency exchange difference 1,647 (3,803) (2,156)
Balance at December 31, 2016 $ 8,222,428 $ 3,236,752 $ 11,459,180
Accumulated depreciation and impairment
Balance at January 1, 2016 $ 222,057 $ 854,091 $ 1,076,148
Depreciation - 81,051 81,051
Transfer to property, plant and equipment - (11,903) (11,903)
Effect of foreign currency exchange difference - (2,258) (2,258)
Balance at December 31, 2016 $ 222,057 $ 920,981 $ 1,143,038
Carrying amount at December 31, 2016 $ 8,000,371 $ 2,315,771 $ 10,316,142
The above items of investment properties are depreciated on a straight-line basis over the following useful
lives:
Buildings 2-60 years
The Corporation and its subsidiaries participated in “Qianzhen Residential Building Project” conducted by
the subsidiary CPDC and signed the land purchase agreement with its employees. According to the
purchase agreement, land prices received from its employees are deposited in the Bank of Taiwan and
recognized as other financial assets-noncurrent and other noncurrent liabilities.
The fair value of the investment properties was arrived at on the basis of valuation carried out in 2013,
2014, 2015 and 2017 by independent appraisers, who are not related parties. Lands were valued under
market approach, income approach and land developing analysis approach. Buildings were evaluated
using Level 3 inputs under market approach, cost approach and income approach. In December 2016, due
to the significant change in the present value assessed for several pieces of land, the Corporation, based on
the actual land sale prices in the vicinity, reappraised the land value. The important assumptions and fair
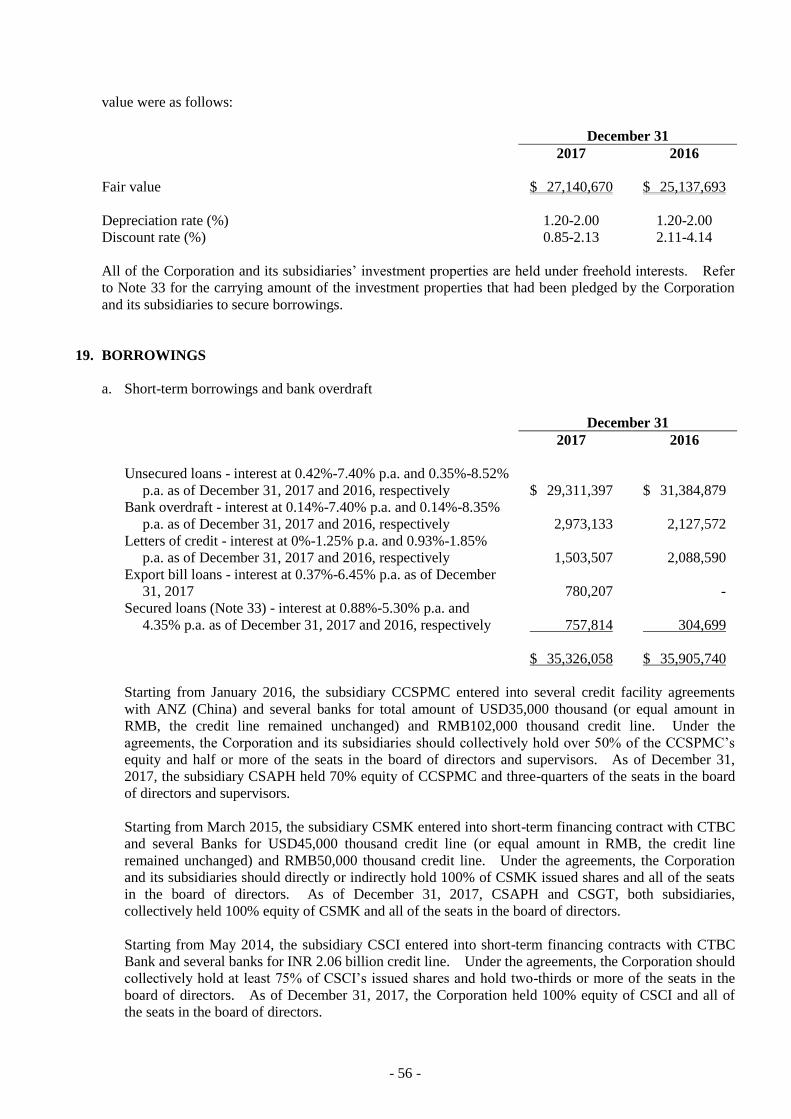
- 56 -
value were as follows:
December 31
2017 2016
Fair value $ 27,140,670 $ 25,137,693
Depreciation rate (%) 1.20-2.00 1.20-2.00
Discount rate (%) 0.85-2.13 2.11-4.14
All of the Corporation and its subsidiaries’ investment properties are held under freehold interests. Refer
to Note 33 for the carrying amount of the investment properties that had been pledged by the Corporation
and its subsidiaries to secure borrowings.
19. BORROWINGS
a. Short-term borrowings and bank overdraft
December 31
2017 2016
Unsecured loans - interest at 0.42%-7.40% p.a. and 0.35%-8.52%
p.a. as of December 31, 2017 and 2016, respectively
$ 29,311,397 $ 31,384,879
Bank overdraft - interest at 0.14%-7.40% p.a. and 0.14%-8.35%
p.a. as of December 31, 2017 and 2016, respectively
2,973,133 2,127,572
Letters of credit - interest at 0%-1.25% p.a. and 0.93%-1.85%
p.a. as of December 31, 2017 and 2016, respectively
1,503,507 2,088,590
Export bill loans - interest at 0.37%-6.45% p.a. as of December
31, 2017
780,207 -
Secured loans (Note 33) - interest at 0.88%-5.30% p.a. and
4.35% p.a. as of December 31, 2017 and 2016, respectively
757,814 304,699
$ 35,326,058 $ 35,905,740
Starting from January 2016, the subsidiary CCSPMC entered into several credit facility agreements
with ANZ (China) and several banks for total amount of USD35,000 thousand (or equal amount in
RMB, the credit line remained unchanged) and RMB102,000 thousand credit line. Under the
agreements, the Corporation and its subsidiaries should collectively hold over 50% of the CCSPMC’s
equity and half or more of the seats in the board of directors and supervisors. As of December 31,
2017, the subsidiary CSAPH held 70% equity of CCSPMC and three-quarters of the seats in the board
of directors and supervisors.
Starting from March 2015, the subsidiary CSMK entered into short-term financing contract with CTBC
and several Banks for USD45,000 thousand credit line (or equal amount in RMB, the credit line
remained unchanged) and RMB50,000 thousand credit line. Under the agreements, the Corporation
and its subsidiaries should directly or indirectly hold 100% of CSMK issued shares and all of the seats
in the board of directors. As of December 31, 2017, CSAPH and CSGT, both subsidiaries,
collectively held 100% equity of CSMK and all of the seats in the board of directors.
Starting from May 2014, the subsidiary CSCI entered into short-term financing contracts with CTBC
Bank and several banks for INR 2.06 billion credit line. Under the agreements, the Corporation should
collectively hold at least 75% of CSCI’s issued shares and hold two-thirds or more of the seats in the
board of directors. As of December 31, 2017, the Corporation held 100% equity of CSCI and all of
the seats in the board of directors.
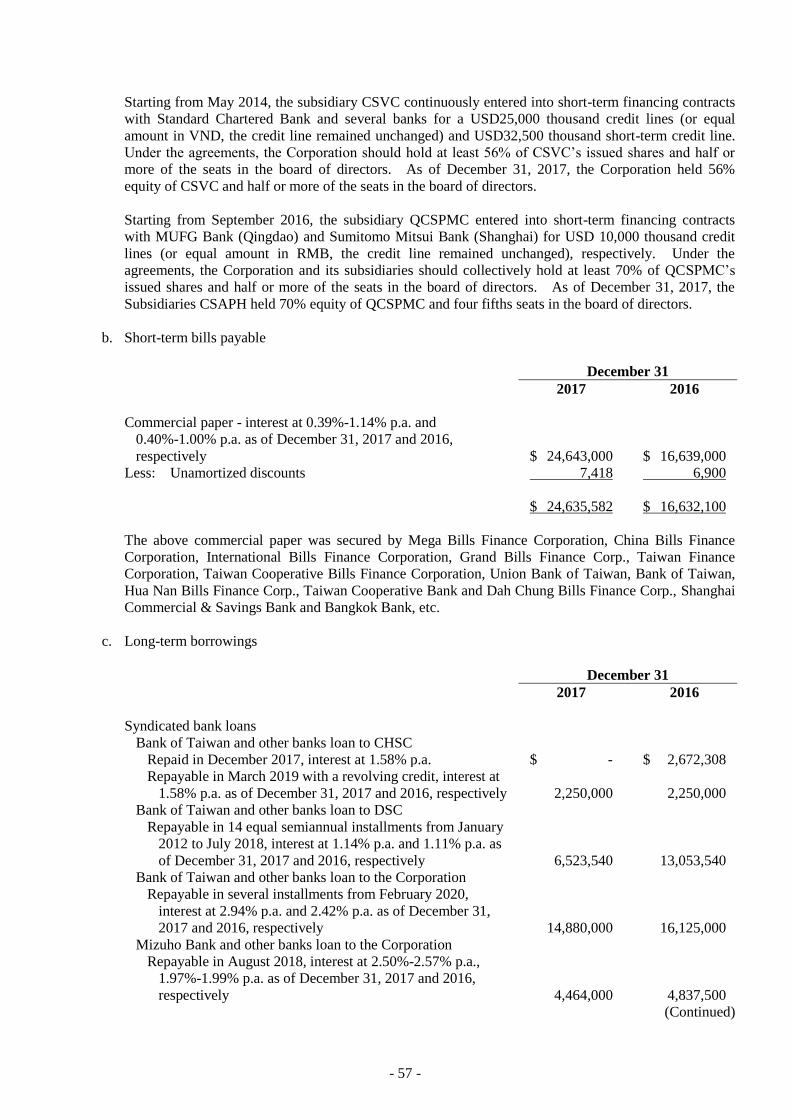
- 57 -
Starting from May 2014, the subsidiary CSVC continuously entered into short-term financing contracts
with Standard Chartered Bank and several banks for a USD25,000 thousand credit lines (or equal
amount in VND, the credit line remained unchanged) and USD32,500 thousand short-term credit line.
Under the agreements, the Corporation should hold at least 56% of CSVC’s issued shares and half or
more of the seats in the board of directors. As of December 31, 2017, the Corporation held 56%
equity of CSVC and half or more of the seats in the board of directors.
Starting from September 2016, the subsidiary QCSPMC entered into short-term financing contracts
with MUFG Bank (Qingdao) and Sumitomo Mitsui Bank (Shanghai) for USD 10,000 thousand credit
lines (or equal amount in RMB, the credit line remained unchanged), respectively. Under the
agreements, the Corporation and its subsidiaries should collectively hold at least 70% of QCSPMC’s
issued shares and half or more of the seats in the board of directors. As of December 31, 2017, the
Subsidiaries CSAPH held 70% equity of QCSPMC and four fifths seats in the board of directors.
b. Short-term bills payable
December 31
2017 2016
Commercial paper - interest at 0.39%-1.14% p.a. and
0.40%-1.00% p.a. as of December 31, 2017 and 2016,
respectively $ 24,643,000 $ 16,639,000
Less: Unamortized discounts 7,418 6,900
$ 24,635,582 $ 16,632,100
The above commercial paper was secured by Mega Bills Finance Corporation, China Bills Finance
Corporation, International Bills Finance Corporation, Grand Bills Finance Corp., Taiwan Finance
Corporation, Taiwan Cooperative Bills Finance Corporation, Union Bank of Taiwan, Bank of Taiwan,
Hua Nan Bills Finance Corp., Taiwan Cooperative Bank and Dah Chung Bills Finance Corp., Shanghai
Commercial & Savings Bank and Bangkok Bank, etc.
c. Long-term borrowings
December 31
2017 2016
Syndicated bank loans
Bank of Taiwan and other banks loan to CHSC
Repaid in December 2017, interest at 1.58% p.a. $ - $ 2,672,308
Repayable in March 2019 with a revolving credit, interest at
1.58% p.a. as of December 31, 2017 and 2016, respectively
2,250,000
2,250,000
Bank of Taiwan and other banks loan to DSC
Repayable in 14 equal semiannual installments from January
2012 to July 2018, interest at 1.14% p.a. and 1.11% p.a. as
of December 31, 2017 and 2016, respectively
6,523,540
13,053,540
Bank of Taiwan and other banks loan to the Corporation
Repayable in several installments from February 2020,
interest at 2.94% p.a. and 2.42% p.a. as of December 31,
2017 and 2016, respectively
14,880,000
16,125,000
Mizuho Bank and other banks loan to the Corporation
Repayable in August 2018, interest at 2.50%-2.57% p.a.,
1.97%-1.99% p.a. as of December 31, 2017 and 2016,
respectively
4,464,000
4,837,500
(Continued)
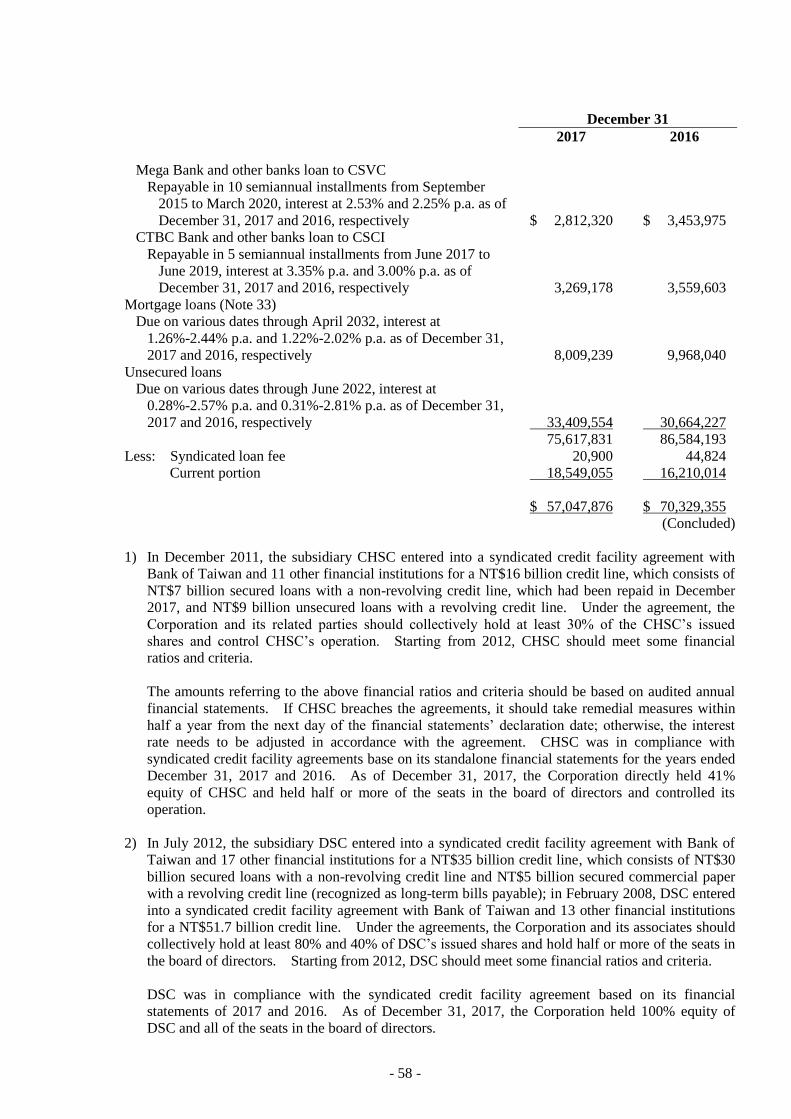
- 58 -
December 31
2017 2016
Mega Bank and other banks loan to CSVC
Repayable in 10 semiannual installments from September
2015 to March 2020, interest at 2.53% and 2.25% p.a. as of
December 31, 2017 and 2016, respectively
$ 2,812,320
$ 3,453,975
CTBC Bank and other banks loan to CSCI
Repayable in 5 semiannual installments from June 2017 to
June 2019, interest at 3.35% p.a. and 3.00% p.a. as of
December 31, 2017 and 2016, respectively
3,269,178
3,559,603
Mortgage loans (Note 33)
Due on various dates through April 2032, interest at
1.26%-2.44% p.a. and 1.22%-2.02% p.a. as of December 31,
2017 and 2016, respectively
8,009,239
9,968,040
Unsecured loans
Due on various dates through June 2022, interest at
0.28%-2.57% p.a. and 0.31%-2.81% p.a. as of December 31,
2017 and 2016, respectively
33,409,554
30,664,227
75,617,831 86,584,193
Less: Syndicated loan fee 20,900 44,824
Current portion 18,549,055 16,210,014
$ 57,047,876 $ 70,329,355
(Concluded)
1) In December 2011, the subsidiary CHSC entered into a syndicated credit facility agreement with
Bank of Taiwan and 11 other financial institutions for a NT$16 billion credit line, which consists of
NT$7 billion secured loans with a non-revolving credit line, which had been repaid in December
2017, and NT$9 billion unsecured loans with a revolving credit line. Under the agreement, the
Corporation and its related parties should collectively hold at least 30% of the CHSC’s issued
shares and control CHSC’s operation. Starting from 2012, CHSC should meet some financial
ratios and criteria.
The amounts referring to the above financial ratios and criteria should be based on audited annual
financial statements. If CHSC breaches the agreements, it should take remedial measures within
half a year from the next day of the financial statements’ declaration date; otherwise, the interest
rate needs to be adjusted in accordance with the agreement. CHSC was in compliance with
syndicated credit facility agreements base on its standalone financial statements for the years ended
December 31, 2017 and 2016. As of December 31, 2017, the Corporation directly held 41%
equity of CHSC and held half or more of the seats in the board of directors and controlled its
operation.
2) In July 2012, the subsidiary DSC entered into a syndicated credit facility agreement with Bank of
Taiwan and 17 other financial institutions for a NT$35 billion credit line, which consists of NT$30
billion secured loans with a non-revolving credit line and NT$5 billion secured commercial paper
with a revolving credit line (recognized as long-term bills payable); in February 2008, DSC entered
into a syndicated credit facility agreement with Bank of Taiwan and 13 other financial institutions
for a NT$51.7 billion credit line. Under the agreements, the Corporation and its associates should
collectively hold at least 80% and 40% of DSC’s issued shares and hold half or more of the seats in
the board of directors. Starting from 2012, DSC should meet some financial ratios and criteria.
DSC was in compliance with the syndicated credit facility agreement based on its financial
statements of 2017 and 2016. As of December 31, 2017, the Corporation held 100% equity of
DSC and all of the seats in the board of directors.
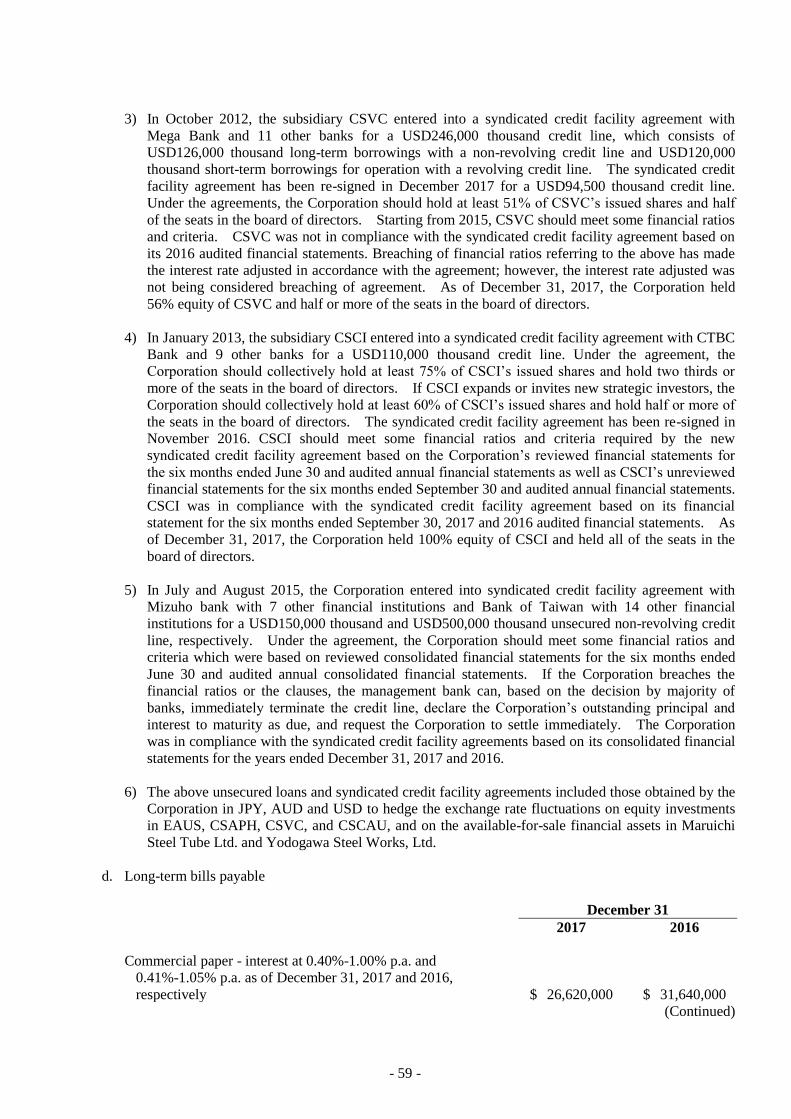
- 59 -
3) In October 2012, the subsidiary CSVC entered into a syndicated credit facility agreement with
Mega Bank and 11 other banks for a USD246,000 thousand credit line, which consists of
USD126,000 thousand long-term borrowings with a non-revolving credit line and USD120,000
thousand short-term borrowings for operation with a revolving credit line. The syndicated credit
facility agreement has been re-signed in December 2017 for a USD94,500 thousand credit line.
Under the agreements, the Corporation should hold at least 51% of CSVC’s issued shares and half
of the seats in the board of directors. Starting from 2015, CSVC should meet some financial ratios
and criteria. CSVC was not in compliance with the syndicated credit facility agreement based on
its 2016 audited financial statements. Breaching of financial ratios referring to the above has made
the interest rate adjusted in accordance with the agreement; however, the interest rate adjusted was
not being considered breaching of agreement. As of December 31, 2017, the Corporation held
56% equity of CSVC and half or more of the seats in the board of directors.
4) In January 2013, the subsidiary CSCI entered into a syndicated credit facility agreement with CTBC
Bank and 9 other banks for a USD110,000 thousand credit line. Under the agreement, the
Corporation should collectively hold at least 75% of CSCI’s issued shares and hold two thirds or
more of the seats in the board of directors. If CSCI expands or invites new strategic investors, the
Corporation should collectively hold at least 60% of CSCI’s issued shares and hold half or more of
the seats in the board of directors. The syndicated credit facility agreement has been re-signed in
November 2016. CSCI should meet some financial ratios and criteria required by the new
syndicated credit facility agreement based on the Corporation’s reviewed financial statements for
the six months ended June 30 and audited annual financial statements as well as CSCI’s unreviewed
financial statements for the six months ended September 30 and audited annual financial statements.
CSCI was in compliance with the syndicated credit facility agreement based on its financial
statement for the six months ended September 30, 2017 and 2016 audited financial statements. As
of December 31, 2017, the Corporation held 100% equity of CSCI and held all of the seats in the
board of directors.
5) In July and August 2015, the Corporation entered into syndicated credit facility agreement with
Mizuho bank with 7 other financial institutions and Bank of Taiwan with 14 other financial
institutions for a USD150,000 thousand and USD500,000 thousand unsecured non-revolving credit
line, respectively. Under the agreement, the Corporation should meet some financial ratios and
criteria which were based on reviewed consolidated financial statements for the six months ended
June 30 and audited annual consolidated financial statements. If the Corporation breaches the
financial ratios or the clauses, the management bank can, based on the decision by majority of
banks, immediately terminate the credit line, declare the Corporation’s outstanding principal and
interest to maturity as due, and request the Corporation to settle immediately. The Corporation
was in compliance with the syndicated credit facility agreements based on its consolidated financial
statements for the years ended December 31, 2017 and 2016.
6) The above unsecured loans and syndicated credit facility agreements included those obtained by the
Corporation in JPY, AUD and USD to hedge the exchange rate fluctuations on equity investments
in EAUS, CSAPH, CSVC, and CSCAU, and on the available-for-sale financial assets in Maruichi
Steel Tube Ltd. and Yodogawa Steel Works, Ltd.
d. Long-term bills payable
December 31
2017 2016
Commercial paper - interest at 0.40%-1.00% p.a. and
0.41%-1.05% p.a. as of December 31, 2017 and 2016,
respectively
$ 26,620,000
$ 31,640,000
(Continued)
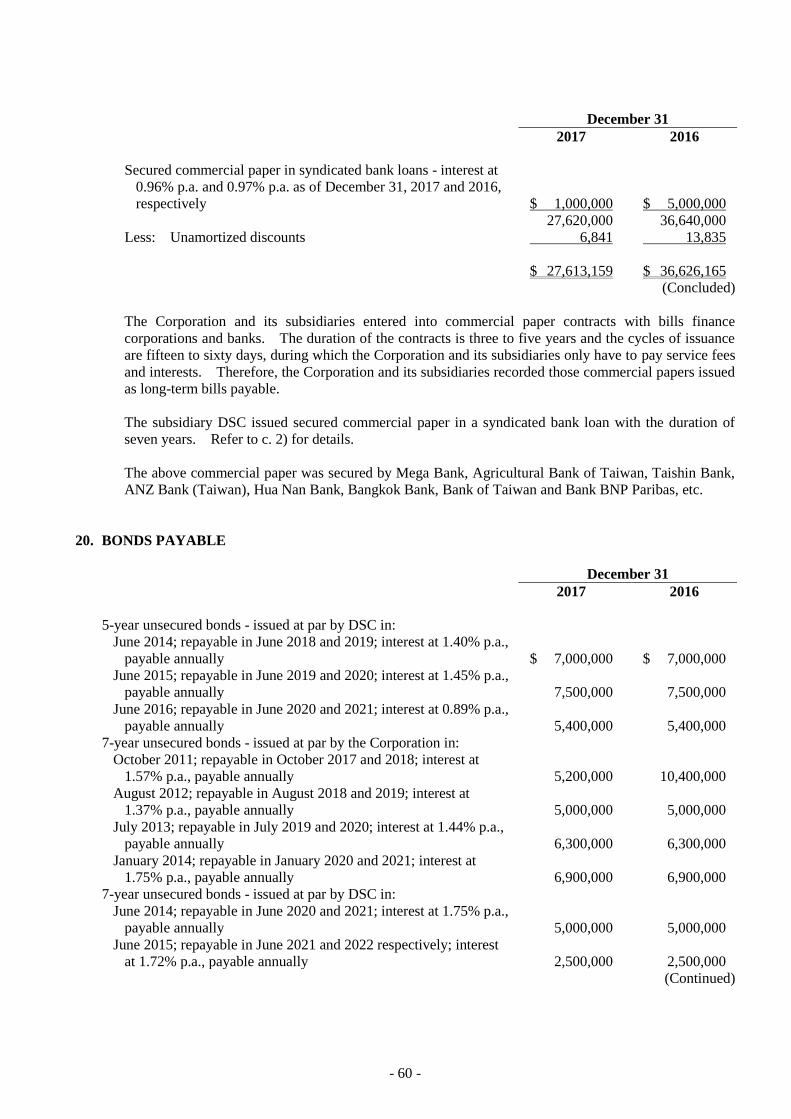
- 60 -
December 31
2017 2016
Secured commercial paper in syndicated bank loans - interest at
0.96% p.a. and 0.97% p.a. as of December 31, 2017 and 2016,
respectively
$ 1,000,000
$ 5,000,000
27,620,000 36,640,000
Less: Unamortized discounts 6,841 13,835
$ 27,613,159 $ 36,626,165
(Concluded)
The Corporation and its subsidiaries entered into commercial paper contracts with bills finance
corporations and banks. The duration of the contracts is three to five years and the cycles of issuance
are fifteen to sixty days, during which the Corporation and its subsidiaries only have to pay service fees
and interests. Therefore, the Corporation and its subsidiaries recorded those commercial papers issued
as long-term bills payable.
The subsidiary DSC issued secured commercial paper in a syndicated bank loan with the duration of
seven years. Refer to c. 2) for details.
The above commercial paper was secured by Mega Bank, Agricultural Bank of Taiwan, Taishin Bank,
ANZ Bank (Taiwan), Hua Nan Bank, Bangkok Bank, Bank of Taiwan and Bank BNP Paribas, etc.
20. BONDS PAYABLE
December 31
2017 2016
5-year unsecured bonds - issued at par by DSC in:
June 2014; repayable in June 2018 and 2019; interest at 1.40% p.a.,
payable annually $ 7,000,000 $ 7,000,000
June 2015; repayable in June 2019 and 2020; interest at 1.45% p.a.,
payable annually 7,500,000 7,500,000
June 2016; repayable in June 2020 and 2021; interest at 0.89% p.a.,
payable annually 5,400,000 5,400,000
7-year unsecured bonds - issued at par by the Corporation in:
October 2011; repayable in October 2017 and 2018; interest at
1.57% p.a., payable annually 5,200,000 10,400,000
August 2012; repayable in August 2018 and 2019; interest at
1.37% p.a., payable annually 5,000,000 5,000,000
July 2013; repayable in July 2019 and 2020; interest at 1.44% p.a.,
payable annually 6,300,000 6,300,000
January 2014; repayable in January 2020 and 2021; interest at
1.75% p.a., payable annually 6,900,000 6,900,000
7-year unsecured bonds - issued at par by DSC in:
June 2014; repayable in June 2020 and 2021; interest at 1.75% p.a.,
payable annually 5,000,000 5,000,000
June 2015; repayable in June 2021 and 2022 respectively; interest
at 1.72% p.a., payable annually 2,500,000 2,500,000
(Continued)
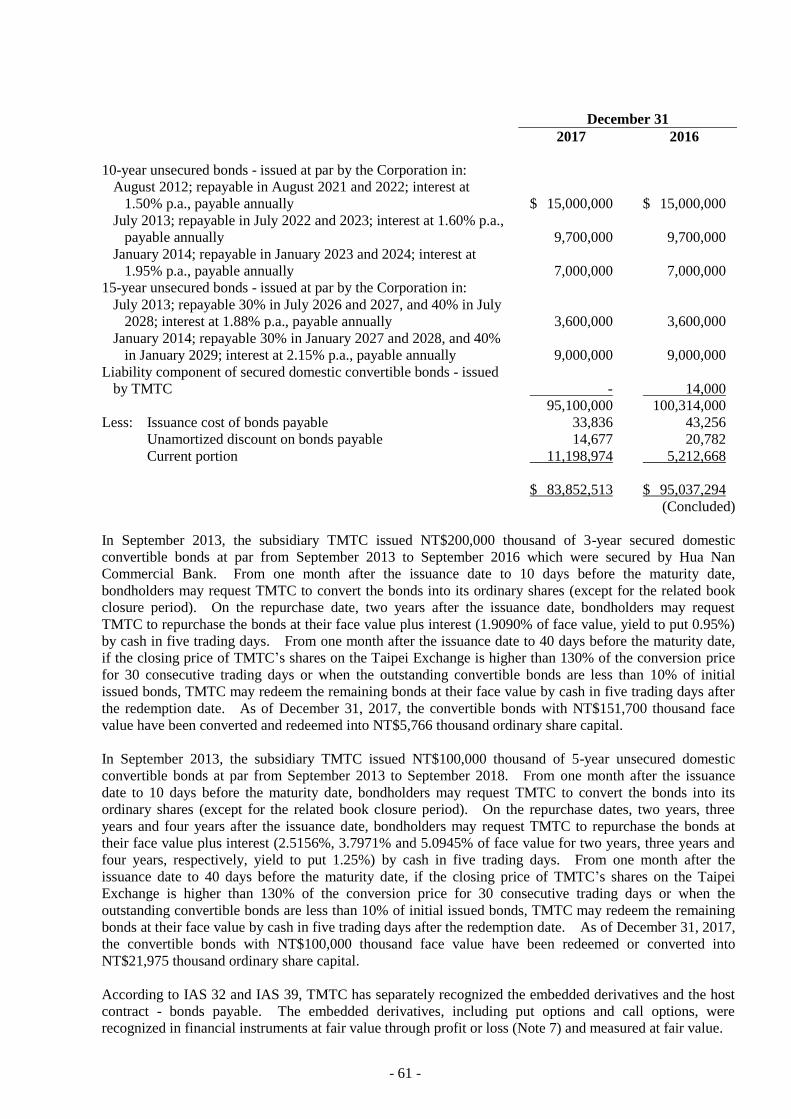
- 61 -
December 31
2017 2016
10-year unsecured bonds - issued at par by the Corporation in:
August 2012; repayable in August 2021 and 2022; interest at
1.50% p.a., payable annually $ 15,000,000 $ 15,000,000
July 2013; repayable in July 2022 and 2023; interest at 1.60% p.a.,
payable annually 9,700,000 9,700,000
January 2014; repayable in January 2023 and 2024; interest at
1.95% p.a., payable annually 7,000,000 7,000,000
15-year unsecured bonds - issued at par by the Corporation in:
July 2013; repayable 30% in July 2026 and 2027, and 40% in July
2028; interest at 1.88% p.a., payable annually 3,600,000 3,600,000
January 2014; repayable 30% in January 2027 and 2028, and 40%
in January 2029; interest at 2.15% p.a., payable annually 9,000,000 9,000,000
Liability component of secured domestic convertible bonds - issued
by TMTC - 14,000
95,100,000 100,314,000
Less: Issuance cost of bonds payable 33,836 43,256
Unamortized discount on bonds payable 14,677 20,782
Current portion 11,198,974 5,212,668
$ 83,852,513 $ 95,037,294
(Concluded)
In September 2013, the subsidiary TMTC issued NT$200,000 thousand of 3-year secured domestic
convertible bonds at par from September 2013 to September 2016 which were secured by Hua Nan
Commercial Bank. From one month after the issuance date to 10 days before the maturity date,
bondholders may request TMTC to convert the bonds into its ordinary shares (except for the related book
closure period). On the repurchase date, two years after the issuance date, bondholders may request
TMTC to repurchase the bonds at their face value plus interest (1.9090% of face value, yield to put 0.95%)
by cash in five trading days. From one month after the issuance date to 40 days before the maturity date,
if the closing price of TMTC’s shares on the Taipei Exchange is higher than 130% of the conversion price
for 30 consecutive trading days or when the outstanding convertible bonds are less than 10% of initial
issued bonds, TMTC may redeem the remaining bonds at their face value by cash in five trading days after
the redemption date. As of December 31, 2017, the convertible bonds with NT$151,700 thousand face
value have been converted and redeemed into NT$5,766 thousand ordinary share capital.
In September 2013, the subsidiary TMTC issued NT$100,000 thousand of 5-year unsecured domestic
convertible bonds at par from September 2013 to September 2018. From one month after the issuance
date to 10 days before the maturity date, bondholders may request TMTC to convert the bonds into its
ordinary shares (except for the related book closure period). On the repurchase dates, two years, three
years and four years after the issuance date, bondholders may request TMTC to repurchase the bonds at
their face value plus interest (2.5156%, 3.7971% and 5.0945% of face value for two years, three years and
four years, respectively, yield to put 1.25%) by cash in five trading days. From one month after the
issuance date to 40 days before the maturity date, if the closing price of TMTC’s shares on the Taipei
Exchange is higher than 130% of the conversion price for 30 consecutive trading days or when the
outstanding convertible bonds are less than 10% of initial issued bonds, TMTC may redeem the remaining
bonds at their face value by cash in five trading days after the redemption date. As of December 31, 2017,
the convertible bonds with NT$100,000 thousand face value have been redeemed or converted into
NT$21,975 thousand ordinary share capital.
According to IAS 32 and IAS 39, TMTC has separately recognized the embedded derivatives and the host
contract - bonds payable. The embedded derivatives, including put options and call options, were
recognized in financial instruments at fair value through profit or loss (Note 7) and measured at fair value.
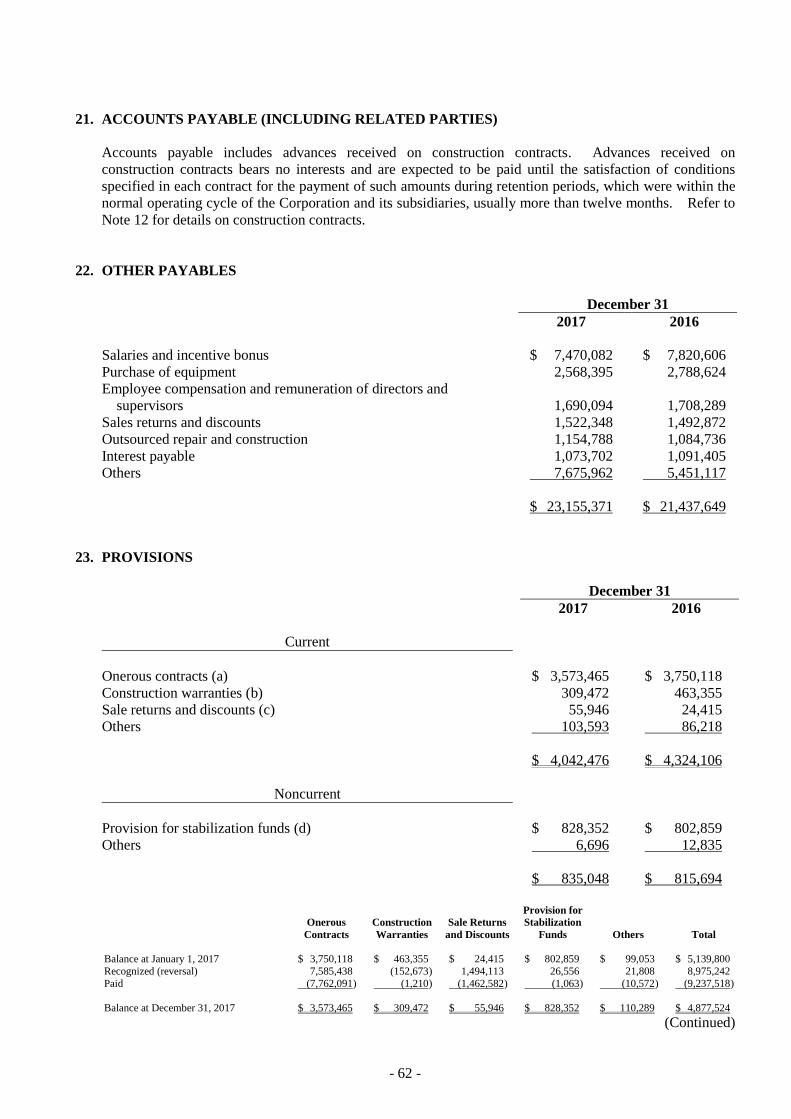
- 62 -
21. ACCOUNTS PAYABLE (INCLUDING RELATED PARTIES)
Accounts payable includes advances received on construction contracts. Advances received on
construction contracts bears no interests and are expected to be paid until the satisfaction of conditions
specified in each contract for the payment of such amounts during retention periods, which were within the
normal operating cycle of the Corporation and its subsidiaries, usually more than twelve months. Refer to
Note 12 for details on construction contracts.
22. OTHER PAYABLES
December 31
2017 2016
Salaries and incentive bonus $ 7,470,082 $ 7,820,606
Purchase of equipment 2,568,395 2,788,624
Employee compensation and remuneration of directors and
supervisors 1,690,094 1,708,289
Sales returns and discounts 1,522,348 1,492,872
Outsourced repair and construction 1,154,788 1,084,736
Interest payable 1,073,702 1,091,405
Others 7,675,962 5,451,117
$ 23,155,371 $ 21,437,649
23. PROVISIONS
December 31
2017 2016
Current
Onerous contracts (a) $ 3,573,465 $ 3,750,118
Construction warranties (b) 309,472 463,355
Sale returns and discounts (c) 55,946 24,415
Others 103,593 86,218
$ 4,042,476 $ 4,324,106
Noncurrent
Provision for stabilization funds (d) $ 828,352 $ 802,859
Others 6,696 12,835
$ 835,048 $ 815,694
Onerous
Contracts
Construction
Warranties
Sale Returns
and Discounts
Provision for
Stabilization
Funds
Others Total
Balance at January 1, 2017 $ 3,750,118 $ 463,355 $ 24,415 $ 802,859 $ 99,053 $ 5,139,800
Recognized (reversal) 7,585,438 (152,673 ) 1,494,113 26,556 21,808 8,975,242
Paid (7,762,091 ) (1,210 ) (1,462,582 ) (1,063 ) (10,572 ) (9,237,518 )
Balance at December 31, 2017 $ 3,573,465 $ 309,472 $ 55,946 $ 828,352 $ 110,289 $ 4,877,524
(Continued)
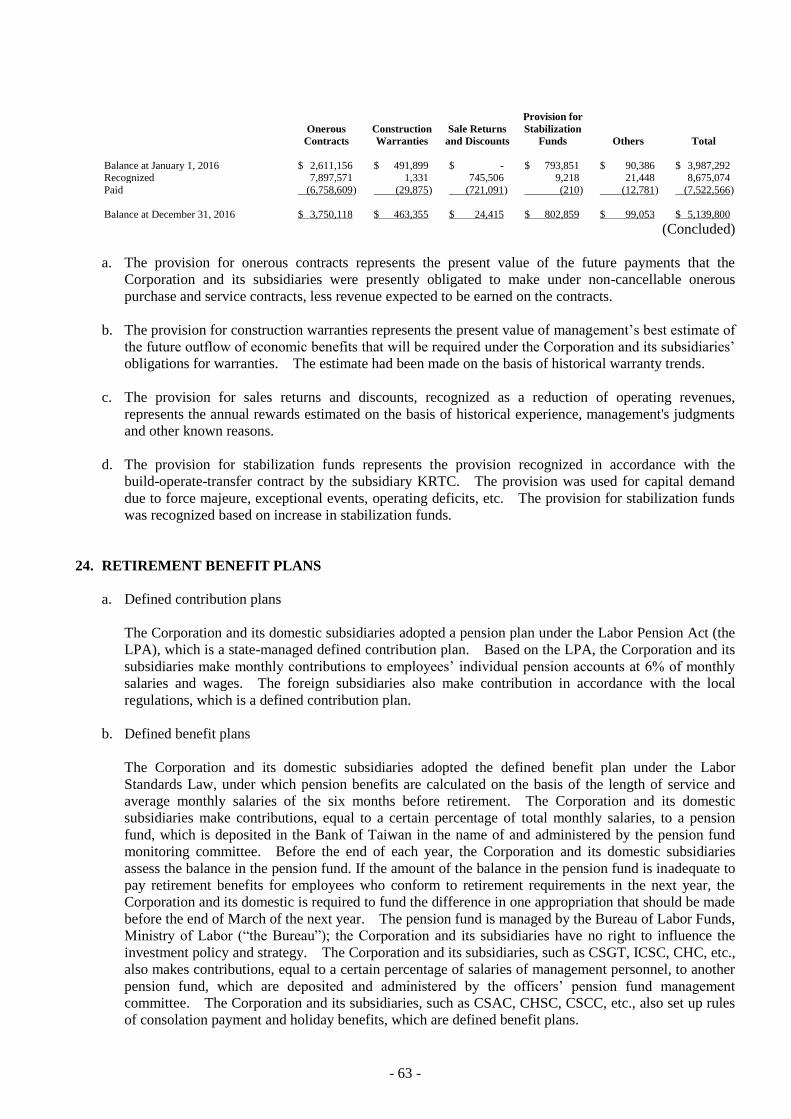
- 63 -
Onerous
Contracts
Construction
Warranties
Sale Returns
and Discounts
Provision for
Stabilization
Funds
Others Total
Balance at January 1, 2016 $ 2,611,156 $ 491,899 $ - $ 793,851 $ 90,386 $ 3,987,292 Recognized 7,897,571 1,331 745,506 9,218 21,448 8,675,074
Paid (6,758,609 ) (29,875 ) (721,091 ) (210 ) (12,781 ) (7,522,566 )
Balance at December 31, 2016 $ 3,750,118 $ 463,355 $ 24,415 $ 802,859 $ 99,053 $ 5,139,800
(Concluded)
a. The provision for onerous contracts represents the present value of the future payments that the
Corporation and its subsidiaries were presently obligated to make under non-cancellable onerous
purchase and service contracts, less revenue expected to be earned on the contracts.
b. The provision for construction warranties represents the present value of management’s best estimate of
the future outflow of economic benefits that will be required under the Corporation and its subsidiaries’
obligations for warranties. The estimate had been made on the basis of historical warranty trends.
c. The provision for sales returns and discounts, recognized as a reduction of operating revenues,
represents the annual rewards estimated on the basis of historical experience, management's judgments
and other known reasons.
d. The provision for stabilization funds represents the provision recognized in accordance with the
build-operate-transfer contract by the subsidiary KRTC. The provision was used for capital demand
due to force majeure, exceptional events, operating deficits, etc. The provision for stabilization funds
was recognized based on increase in stabilization funds.
24. RETIREMENT BENEFIT PLANS
a. Defined contribution plans
The Corporation and its domestic subsidiaries adopted a pension plan under the Labor Pension Act (the
LPA), which is a state-managed defined contribution plan. Based on the LPA, the Corporation and its
subsidiaries make monthly contributions to employees’ individual pension accounts at 6% of monthly
salaries and wages. The foreign subsidiaries also make contribution in accordance with the local
regulations, which is a defined contribution plan.
b. Defined benefit plans
The Corporation and its domestic subsidiaries adopted the defined benefit plan under the Labor
Standards Law, under which pension benefits are calculated on the basis of the length of service and
average monthly salaries of the six months before retirement. The Corporation and its domestic
subsidiaries make contributions, equal to a certain percentage of total monthly salaries, to a pension
fund, which is deposited in the Bank of Taiwan in the name of and administered by the pension fund
monitoring committee. Before the end of each year, the Corporation and its domestic subsidiaries
assess the balance in the pension fund. If the amount of the balance in the pension fund is inadequate to
pay retirement benefits for employees who conform to retirement requirements in the next year, the
Corporation and its domestic is required to fund the difference in one appropriation that should be made
before the end of March of the next year. The pension fund is managed by the Bureau of Labor Funds,
Ministry of Labor (“the Bureau”); the Corporation and its subsidiaries have no right to influence the
investment policy and strategy. The Corporation and its subsidiaries, such as CSGT, ICSC, CHC, etc.,
also makes contributions, equal to a certain percentage of salaries of management personnel, to another
pension fund, which are deposited and administered by the officers’ pension fund management
committee. The Corporation and its subsidiaries, such as CSAC, CHSC, CSCC, etc., also set up rules
of consolation payment and holiday benefits, which are defined benefit plans.
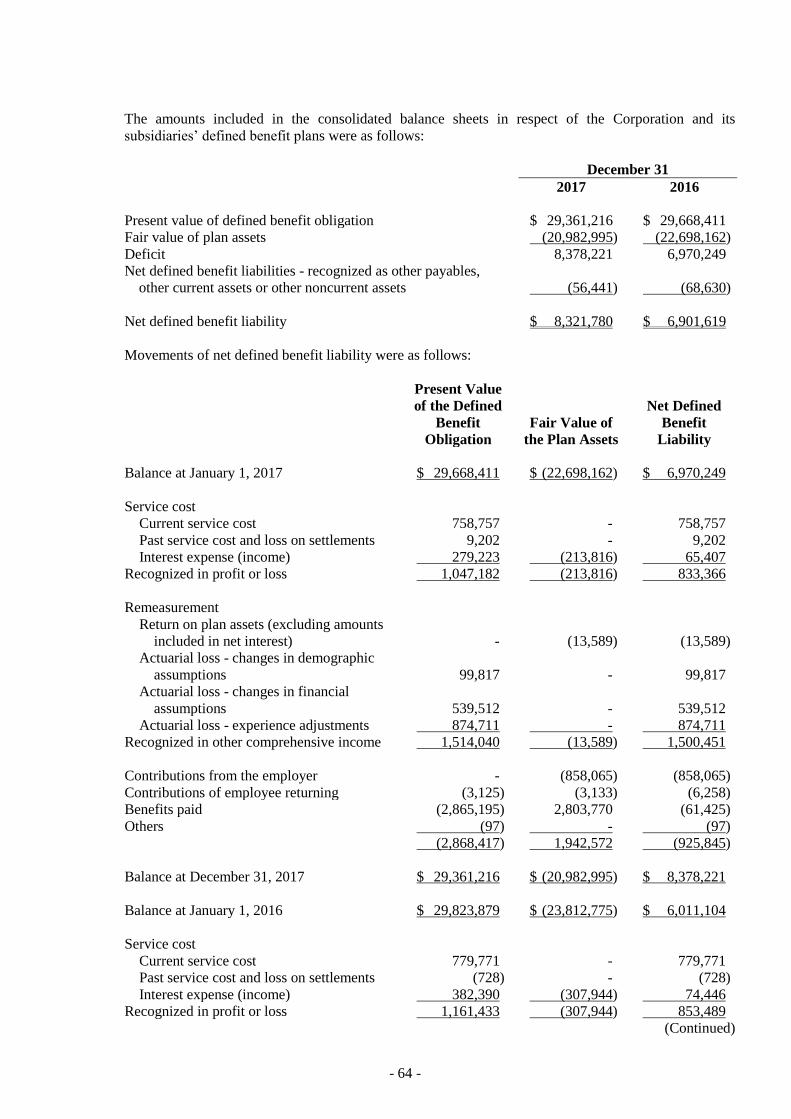
- 64 -
The amounts included in the consolidated balance sheets in respect of the Corporation and its
subsidiaries’ defined benefit plans were as follows:
December 31
2017 2016
Present value of defined benefit obligation $ 29,361,216 $ 29,668,411
Fair value of plan assets (20,982,995) (22,698,162)
Deficit 8,378,221 6,970,249
Net defined benefit liabilities - recognized as other payables,
other current assets or other noncurrent assets
(56,441) (68,630)
Net defined benefit liability $ 8,321,780 $ 6,901,619
Movements of net defined benefit liability were as follows:
Present Value
of the Defined
Benefit
Obligation
Fair Value of
the Plan Assets
Net Defined
Benefit
Liability
Balance at January 1, 2017 $ 29,668,411 $ (22,698,162) $ 6,970,249
Service cost
Current service cost 758,757 - 758,757
Past service cost and loss on settlements 9,202 - 9,202
Interest expense (income) 279,223 (213,816) 65,407
Recognized in profit or loss 1,047,182 (213,816) 833,366
Remeasurement
Return on plan assets (excluding amounts
included in net interest) - (13,589) (13,589)
Actuarial loss - changes in demographic
assumptions 99,817 - 99,817
Actuarial loss - changes in financial
assumptions 539,512 - 539,512
Actuarial loss - experience adjustments 874,711 - 874,711
Recognized in other comprehensive income 1,514,040 (13,589) 1,500,451
Contributions from the employer - (858,065) (858,065)
Contributions of employee returning (3,125) (3,133) (6,258)
Benefits paid (2,865,195) 2,803,770 (61,425)
Others (97) - (97)
(2,868,417) 1,942,572 (925,845)
Balance at December 31, 2017 $ 29,361,216 $ (20,982,995) $ 8,378,221
Balance at January 1, 2016 $ 29,823,879 $ (23,812,775) $ 6,011,104
Service cost
Current service cost 779,771 - 779,771
Past service cost and loss on settlements (728) - (728)
Interest expense (income) 382,390 (307,944) 74,446
Recognized in profit or loss 1,161,433 (307,944) 853,489
(Continued)
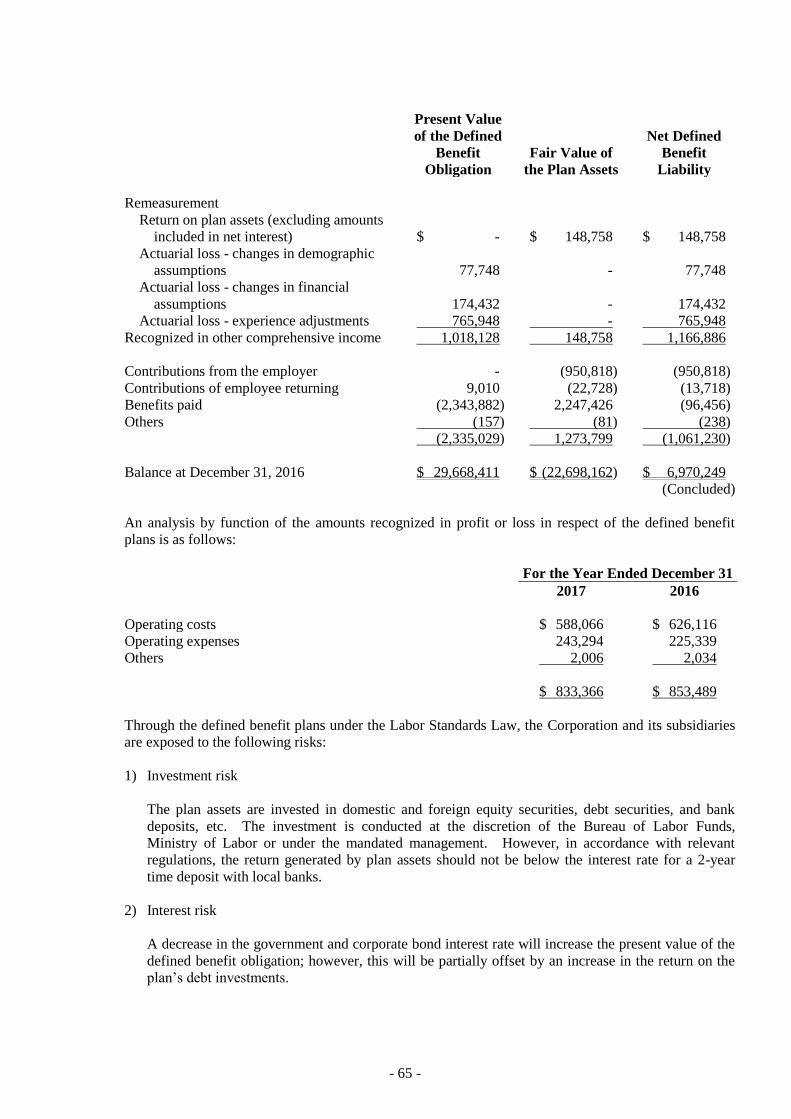
- 65 -
Present Value
of the Defined
Benefit
Obligation
Fair Value of
the Plan Assets
Net Defined
Benefit
Liability
Remeasurement
Return on plan assets (excluding amounts
included in net interest) $ - $ 148,758 $ 148,758
Actuarial loss - changes in demographic
assumptions 77,748 - 77,748
Actuarial loss - changes in financial
assumptions 174,432 - 174,432
Actuarial loss - experience adjustments 765,948 - 765,948
Recognized in other comprehensive income 1,018,128 148,758 1,166,886
Contributions from the employer - (950,818) (950,818)
Contributions of employee returning 9,010 (22,728) (13,718)
Benefits paid (2,343,882) 2,247,426 (96,456)
Others (157) (81) (238)
(2,335,029) 1,273,799 (1,061,230)
Balance at December 31, 2016 $ 29,668,411 $ (22,698,162) $ 6,970,249
(Concluded)
An analysis by function of the amounts recognized in profit or loss in respect of the defined benefit
plans is as follows:
For the Year Ended December 31
2017 2016
Operating costs $ 588,066 $ 626,116
Operating expenses 243,294 225,339
Others 2,006 2,034
$ 833,366 $ 853,489
Through the defined benefit plans under the Labor Standards Law, the Corporation and its subsidiaries
are exposed to the following risks:
1) Investment risk
The plan assets are invested in domestic and foreign equity securities, debt securities, and bank
deposits, etc. The investment is conducted at the discretion of the Bureau of Labor Funds,
Ministry of Labor or under the mandated management. However, in accordance with relevant
regulations, the return generated by plan assets should not be below the interest rate for a 2-year
time deposit with local banks.
2) Interest risk
A decrease in the government and corporate bond interest rate will increase the present value of the
defined benefit obligation; however, this will be partially offset by an increase in the return on the
plan’s debt investments.
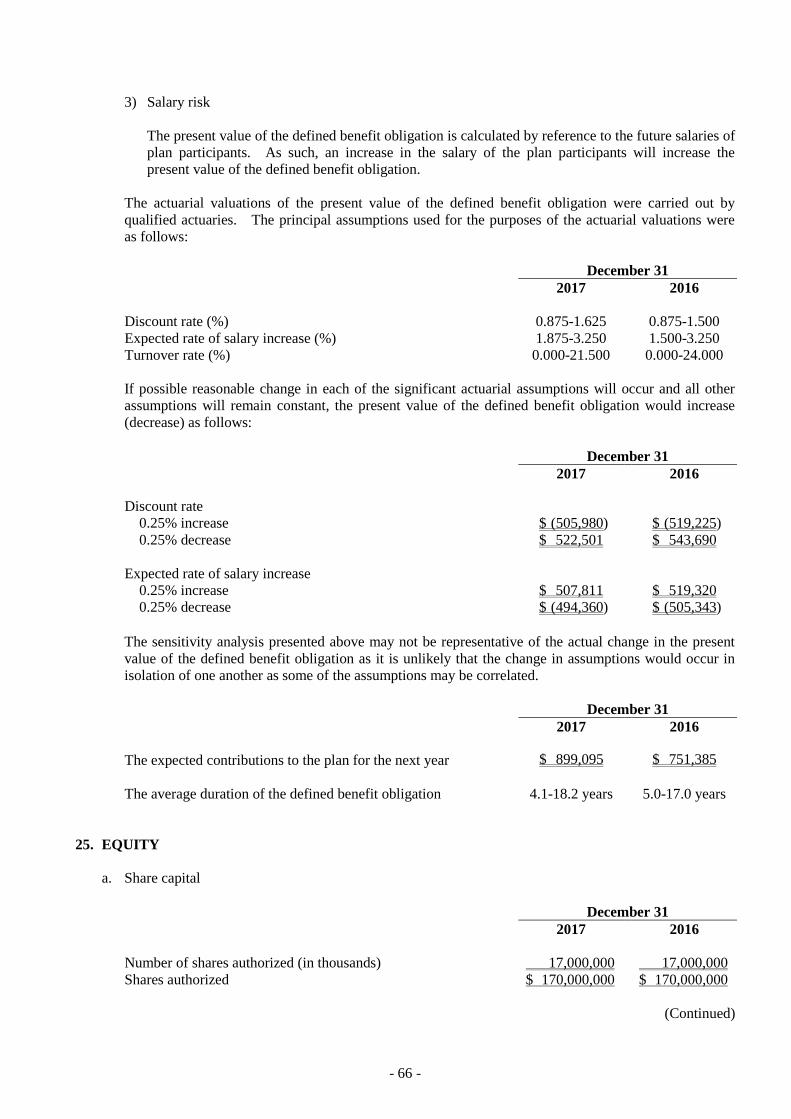
- 66 -
3) Salary risk
The present value of the defined benefit obligation is calculated by reference to the future salaries of
plan participants. As such, an increase in the salary of the plan participants will increase the
present value of the defined benefit obligation.
The actuarial valuations of the present value of the defined benefit obligation were carried out by
qualified actuaries. The principal assumptions used for the purposes of the actuarial valuations were
as follows:
December 31
2017 2016
Discount rate (%) 0.875-1.625 0.875-1.500
Expected rate of salary increase (%) 1.875-3.250 1.500-3.250
Turnover rate (%) 0.000-21.500 0.000-24.000
If possible reasonable change in each of the significant actuarial assumptions will occur and all other
assumptions will remain constant, the present value of the defined benefit obligation would increase
(decrease) as follows:
December 31
2017 2016
Discount rate
0.25% increase $ (505,980) $ (519,225)
0.25% decrease $ 522,501 $ 543,690
Expected rate of salary increase
0.25% increase $ 507,811 $ 519,320
0.25% decrease $ (494,360) $ (505,343)
The sensitivity analysis presented above may not be representative of the actual change in the present
value of the defined benefit obligation as it is unlikely that the change in assumptions would occur in
isolation of one another as some of the assumptions may be correlated.
December 31
2017 2016
The expected contributions to the plan for the next year $ 899,095 $ 751,385
The average duration of the defined benefit obligation 4.1-18.2 years 5.0-17.0 years
25. EQUITY
a. Share capital
December 31
2017 2016
Number of shares authorized (in thousands) 17,000,000 17,000,000
Shares authorized $ 170,000,000 $ 170,000,000
(Continued)
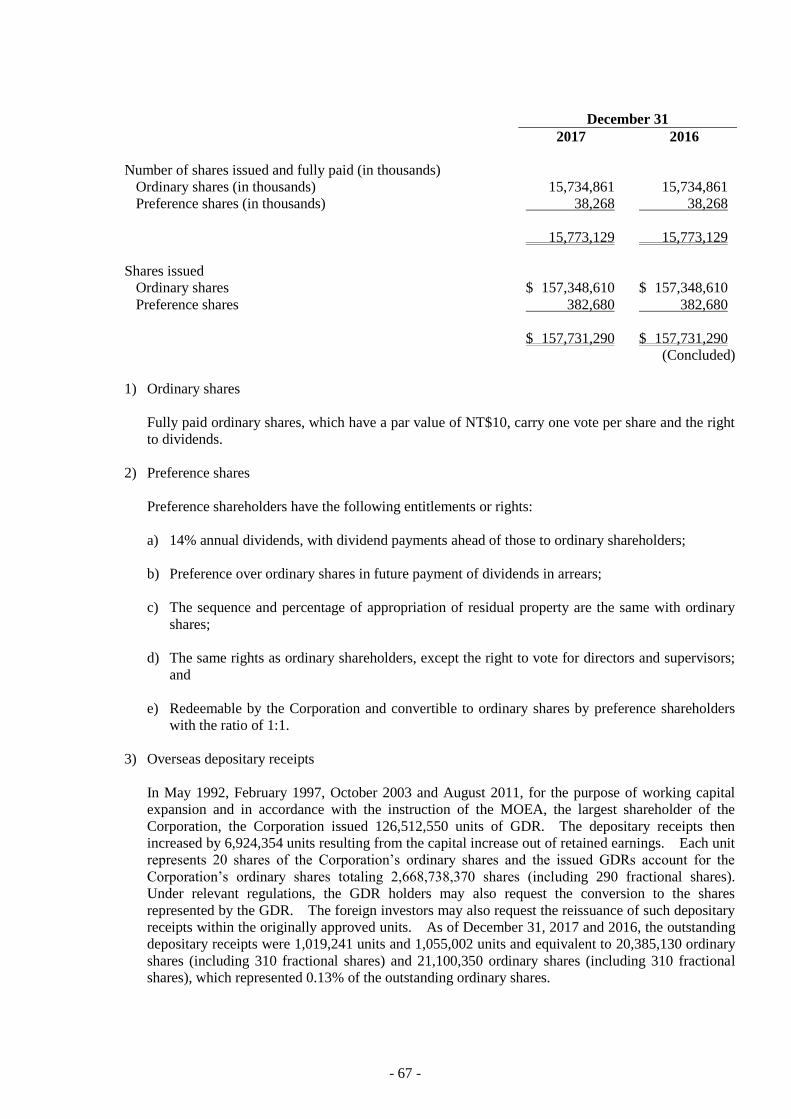
- 67 -
December 31
2017 2016
Number of shares issued and fully paid (in thousands)
Ordinary shares (in thousands) 15,734,861 15,734,861
Preference shares (in thousands) 38,268 38,268
15,773,129 15,773,129
Shares issued
Ordinary shares $ 157,348,610 $ 157,348,610
Preference shares 382,680 382,680
$ 157,731,290 $ 157,731,290
(Concluded)
1) Ordinary shares
Fully paid ordinary shares, which have a par value of NT$10, carry one vote per share and the right
to dividends.
2) Preference shares
Preference shareholders have the following entitlements or rights:
a) 14% annual dividends, with dividend payments ahead of those to ordinary shareholders;
b) Preference over ordinary shares in future payment of dividends in arrears;
c) The sequence and percentage of appropriation of residual property are the same with ordinary
shares;
d) The same rights as ordinary shareholders, except the right to vote for directors and supervisors;
and
e) Redeemable by the Corporation and convertible to ordinary shares by preference shareholders
with the ratio of 1:1.
3) Overseas depositary receipts
In May 1992, February 1997, October 2003 and August 2011, for the purpose of working capital
expansion and in accordance with the instruction of the MOEA, the largest shareholder of the
Corporation, the Corporation issued 126,512,550 units of GDR. The depositary receipts then
increased by 6,924,354 units resulting from the capital increase out of retained earnings. Each unit
represents 20 shares of the Corporation’s ordinary shares and the issued GDRs account for the
Corporation’s ordinary shares totaling 2,668,738,370 shares (including 290 fractional shares).
Under relevant regulations, the GDR holders may also request the conversion to the shares
represented by the GDR. The foreign investors may also request the reissuance of such depositary
receipts within the originally approved units. As of December 31, 2017 and 2016, the outstanding
depositary receipts were 1,019,241 units and 1,055,002 units and equivalent to 20,385,130 ordinary
shares (including 310 fractional shares) and 21,100,350 ordinary shares (including 310 fractional
shares), which represented 0.13% of the outstanding ordinary shares.
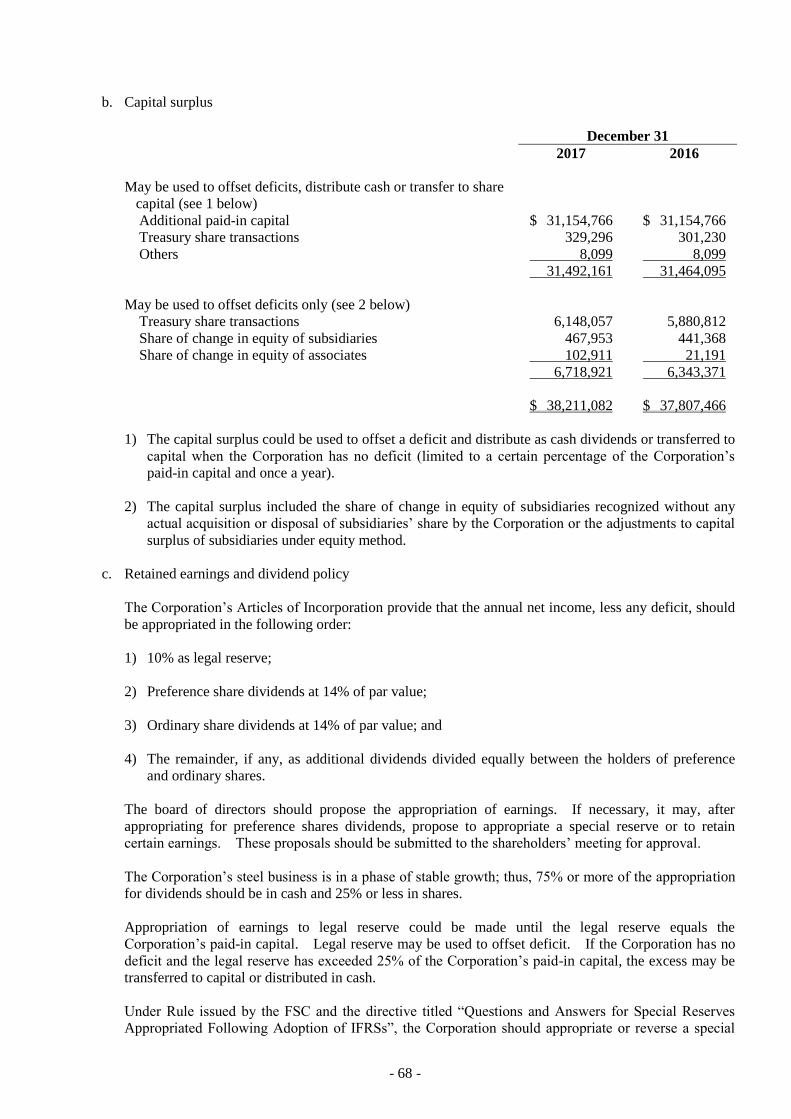
- 68 -
b. Capital surplus
December 31
2017 2016
May be used to offset deficits, distribute cash or transfer to share
capital (see 1 below)
Additional paid-in capital $ 31,154,766 $ 31,154,766
Treasury share transactions 329,296 301,230
Others 8,099 8,099
31,492,161 31,464,095
May be used to offset deficits only (see 2 below)
Treasury share transactions 6,148,057 5,880,812
Share of change in equity of subsidiaries 467,953 441,368
Share of change in equity of associates 102,911 21,191
6,718,921 6,343,371
$ 38,211,082 $ 37,807,466
1) The capital surplus could be used to offset a deficit and distribute as cash dividends or transferred to
capital when the Corporation has no deficit (limited to a certain percentage of the Corporation’s
paid-in capital and once a year).
2) The capital surplus included the share of change in equity of subsidiaries recognized without any
actual acquisition or disposal of subsidiaries’ share by the Corporation or the adjustments to capital
surplus of subsidiaries under equity method.
c. Retained earnings and dividend policy
The Corporation’s Articles of Incorporation provide that the annual net income, less any deficit, should
be appropriated in the following order:
1) 10% as legal reserve;
2) Preference share dividends at 14% of par value;
3) Ordinary share dividends at 14% of par value; and
4) The remainder, if any, as additional dividends divided equally between the holders of preference
and ordinary shares.
The board of directors should propose the appropriation of earnings. If necessary, it may, after
appropriating for preference shares dividends, propose to appropriate a special reserve or to retain
certain earnings. These proposals should be submitted to the shareholders’ meeting for approval.
The Corporation’s steel business is in a phase of stable growth; thus, 75% or more of the appropriation
for dividends should be in cash and 25% or less in shares.
Appropriation of earnings to legal reserve could be made until the legal reserve equals the
Corporation’s paid-in capital. Legal reserve may be used to offset deficit. If the Corporation has no
deficit and the legal reserve has exceeded 25% of the Corporation’s paid-in capital, the excess may be
transferred to capital or distributed in cash.
Under Rule issued by the FSC and the directive titled “Questions and Answers for Special Reserves
Appropriated Following Adoption of IFRSs”, the Corporation should appropriate or reverse a special
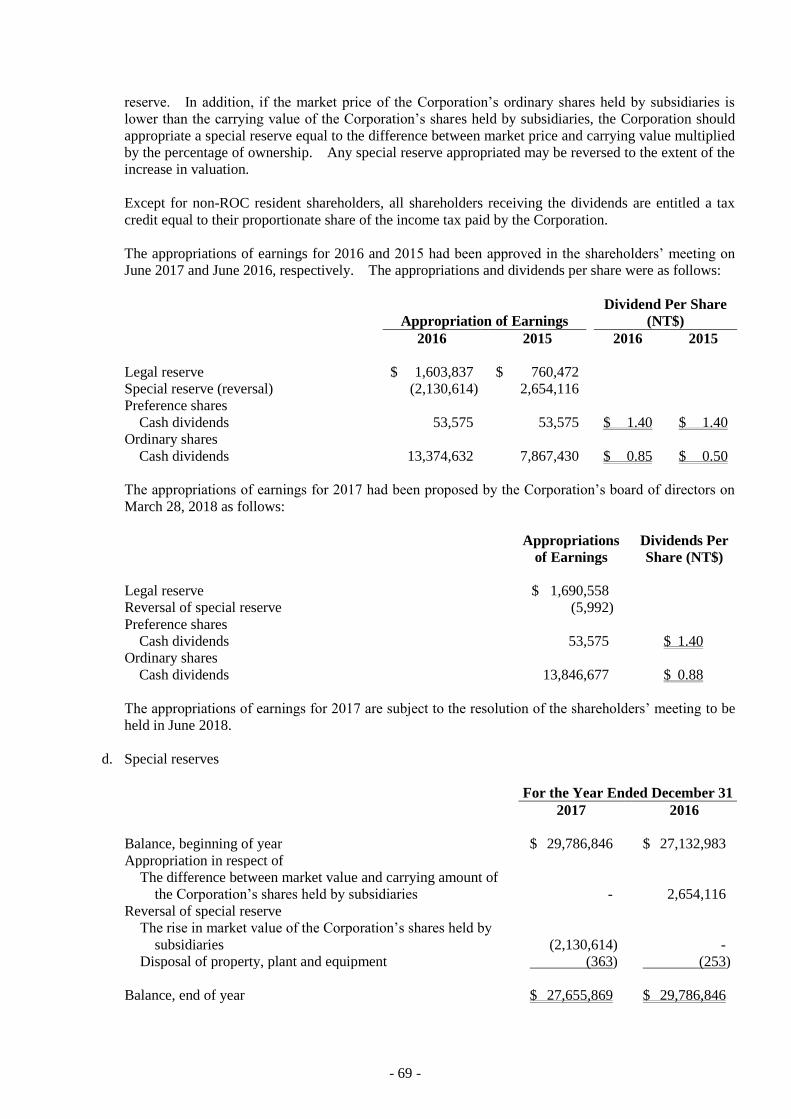
- 69 -
reserve. In addition, if the market price of the Corporation’s ordinary shares held by subsidiaries is
lower than the carrying value of the Corporation’s shares held by subsidiaries, the Corporation should
appropriate a special reserve equal to the difference between market price and carrying value multiplied
by the percentage of ownership. Any special reserve appropriated may be reversed to the extent of the
increase in valuation.
Except for non-ROC resident shareholders, all shareholders receiving the dividends are entitled a tax
credit equal to their proportionate share of the income tax paid by the Corporation.
The appropriations of earnings for 2016 and 2015 had been approved in the shareholders’ meeting on
June 2017 and June 2016, respectively. The appropriations and dividends per share were as follows:
Appropriation of Earnings
Dividend Per Share
(NT$)
2016 2015 2016 2015
Legal reserve $ 1,603,837 $ 760,472
Special reserve (reversal) (2,130,614) 2,654,116
Preference shares
Cash dividends 53,575 53,575 $ 1.40 $ 1.40
Ordinary shares
Cash dividends 13,374,632 7,867,430 $ 0.85 $ 0.50
The appropriations of earnings for 2017 had been proposed by the Corporation’s board of directors on
March 28, 2018 as follows:
Appropriations
of Earnings
Dividends Per
Share (NT$)
Legal reserve $ 1,690,558
Reversal of special reserve (5,992)
Preference shares
Cash dividends 53,575 $ 1.40
Ordinary shares
Cash dividends 13,846,677 $ 0.88
The appropriations of earnings for 2017 are subject to the resolution of the shareholders’ meeting to be
held in June 2018.
d. Special reserves
For the Year Ended December 31
2017 2016
Balance, beginning of year $ 29,786,846 $ 27,132,983
Appropriation in respect of
The difference between market value and carrying amount of
the Corporation’s shares held by subsidiaries - 2,654,116
Reversal of special reserve
The rise in market value of the Corporation’s shares held by
subsidiaries (2,130,614) -
Disposal of property, plant and equipment (363) (253)
Balance, end of year $ 27,655,869 $ 29,786,846
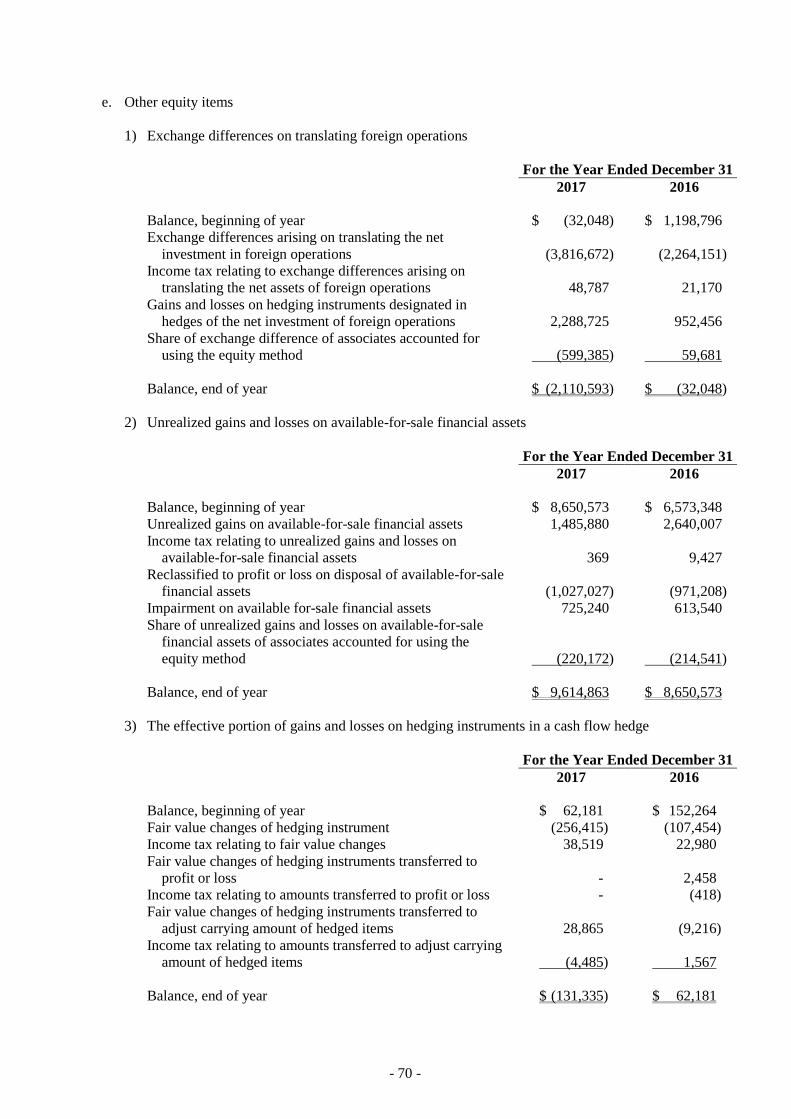
- 70 -
e. Other equity items
1) Exchange differences on translating foreign operations
For the Year Ended December 31
2017 2016
Balance, beginning of year $ (32,048) $ 1,198,796
Exchange differences arising on translating the net
investment in foreign operations (3,816,672) (2,264,151)
Income tax relating to exchange differences arising on
translating the net assets of foreign operations 48,787 21,170
Gains and losses on hedging instruments designated in
hedges of the net investment of foreign operations 2,288,725 952,456
Share of exchange difference of associates accounted for
using the equity method (599,385) 59,681
Balance, end of year $ (2,110,593) $ (32,048)
2) Unrealized gains and losses on available-for-sale financial assets
For the Year Ended December 31
2017 2016
Balance, beginning of year $ 8,650,573 $ 6,573,348
Unrealized gains on available-for-sale financial assets 1,485,880 2,640,007
Income tax relating to unrealized gains and losses on
available-for-sale financial assets
369 9,427
Reclassified to profit or loss on disposal of available-for-sale
financial assets
(1,027,027) (971,208)
Impairment on available for-sale financial assets 725,240 613,540
Share of unrealized gains and losses on available-for-sale
financial assets of associates accounted for using the
equity method
(220,172) (214,541)
Balance, end of year $ 9,614,863 $ 8,650,573
3) The effective portion of gains and losses on hedging instruments in a cash flow hedge
For the Year Ended December 31
2017 2016
Balance, beginning of year $ 62,181 $ 152,264
Fair value changes of hedging instrument (256,415) (107,454)
Income tax relating to fair value changes 38,519 22,980
Fair value changes of hedging instruments transferred to
profit or loss - 2,458
Income tax relating to amounts transferred to profit or loss - (418)
Fair value changes of hedging instruments transferred to
adjust carrying amount of hedged items 28,865 (9,216)
Income tax relating to amounts transferred to adjust carrying
amount of hedged items (4,485) 1,567
Balance, end of year $ (131,335) $ 62,181
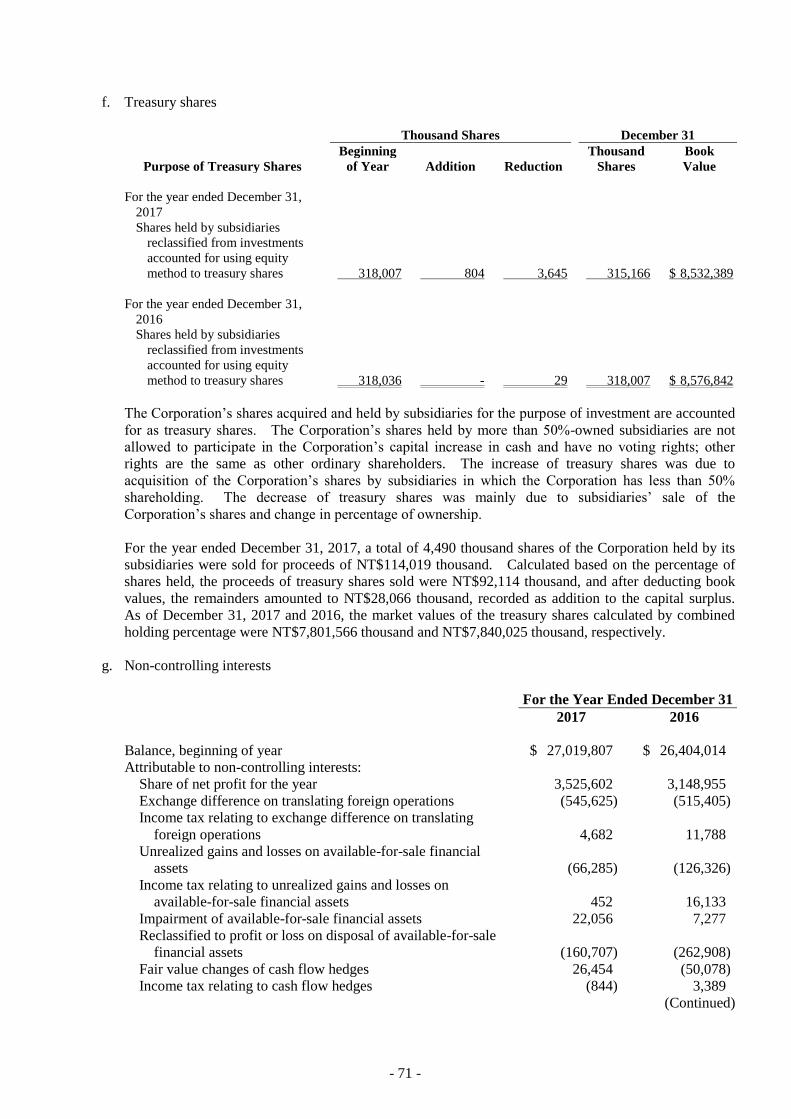
- 71 -
f. Treasury shares
Thousand Shares December 31
Beginning Thousand Book
Purpose of Treasury Shares of Year Addition Reduction Shares Value
For the year ended December 31,
2017
Shares held by subsidiaries
reclassified from investments
accounted for using equity
method to treasury shares 318,007 804 3,645 315,166 $ 8,532,389
For the year ended December 31,
2016
Shares held by subsidiaries
reclassified from investments
accounted for using equity
method to treasury shares 318,036 - 29 318,007 $ 8,576,842
The Corporation’s shares acquired and held by subsidiaries for the purpose of investment are accounted
for as treasury shares. The Corporation’s shares held by more than 50%-owned subsidiaries are not
allowed to participate in the Corporation’s capital increase in cash and have no voting rights; other
rights are the same as other ordinary shareholders. The increase of treasury shares was due to
acquisition of the Corporation’s shares by subsidiaries in which the Corporation has less than 50%
shareholding. The decrease of treasury shares was mainly due to subsidiaries’ sale of the
Corporation’s shares and change in percentage of ownership.
For the year ended December 31, 2017, a total of 4,490 thousand shares of the Corporation held by its
subsidiaries were sold for proceeds of NT$114,019 thousand. Calculated based on the percentage of
shares held, the proceeds of treasury shares sold were NT$92,114 thousand, and after deducting book
values, the remainders amounted to NT$28,066 thousand, recorded as addition to the capital surplus.
As of December 31, 2017 and 2016, the market values of the treasury shares calculated by combined
holding percentage were NT$7,801,566 thousand and NT$7,840,025 thousand, respectively.
g. Non-controlling interests
For the Year Ended December 31
2017 2016
Balance, beginning of year $ 27,019,807 $ 26,404,014
Attributable to non-controlling interests:
Share of net profit for the year 3,525,602 3,148,955
Exchange difference on translating foreign operations (545,625) (515,405)
Income tax relating to exchange difference on translating
foreign operations 4,682 11,788
Unrealized gains and losses on available-for-sale financial
assets (66,285) (126,326)
Income tax relating to unrealized gains and losses on
available-for-sale financial assets 452 16,133
Impairment of available-for-sale financial assets 22,056 7,277
Reclassified to profit or loss on disposal of available-for-sale
financial assets (160,707) (262,908)
Fair value changes of cash flow hedges 26,454 (50,078)
Income tax relating to cash flow hedges (844) 3,389
(Continued)
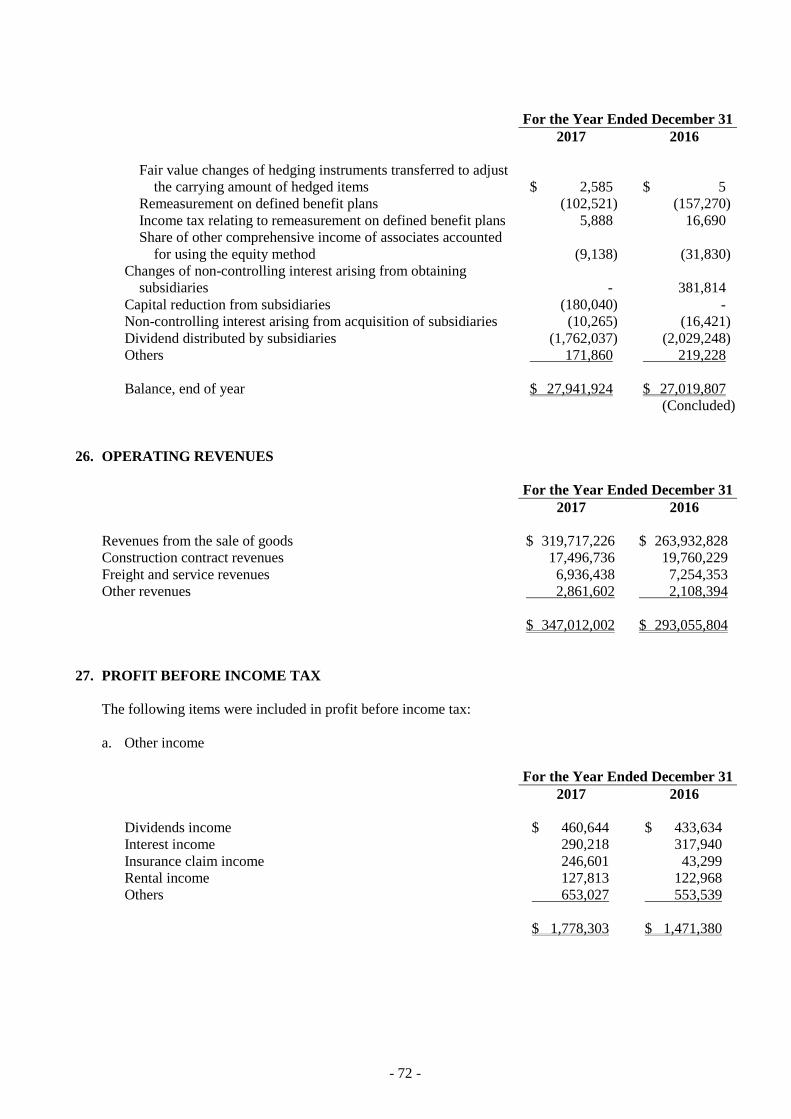
- 72 -
For the Year Ended December 31
2017 2016
Fair value changes of hedging instruments transferred to adjust
the carrying amount of hedged items $ 2,585 $ 5
Remeasurement on defined benefit plans (102,521) (157,270)
Income tax relating to remeasurement on defined benefit plans 5,888 16,690
Share of other comprehensive income of associates accounted
for using the equity method (9,138) (31,830)
Changes of non-controlling interest arising from obtaining
subsidiaries - 381,814
Capital reduction from subsidiaries (180,040) -
Non-controlling interest arising from acquisition of subsidiaries (10,265) (16,421)
Dividend distributed by subsidiaries (1,762,037) (2,029,248)
Others 171,860 219,228
Balance, end of year $ 27,941,924 $ 27,019,807
(Concluded)
26. OPERATING REVENUES
For the Year Ended December 31
2017 2016
Revenues from the sale of goods $ 319,717,226 $ 263,932,828
Construction contract revenues 17,496,736 19,760,229
Freight and service revenues 6,936,438 7,254,353
Other revenues 2,861,602 2,108,394
$ 347,012,002 $ 293,055,804
27. PROFIT BEFORE INCOME TAX
The following items were included in profit before income tax:
a. Other income
For the Year Ended December 31
2017 2016
Dividends income $ 460,644 $ 433,634
Interest income 290,218 317,940
Insurance claim income 246,601 43,299
Rental income 127,813 122,968
Others 653,027 553,539
$ 1,778,303 $ 1,471,380
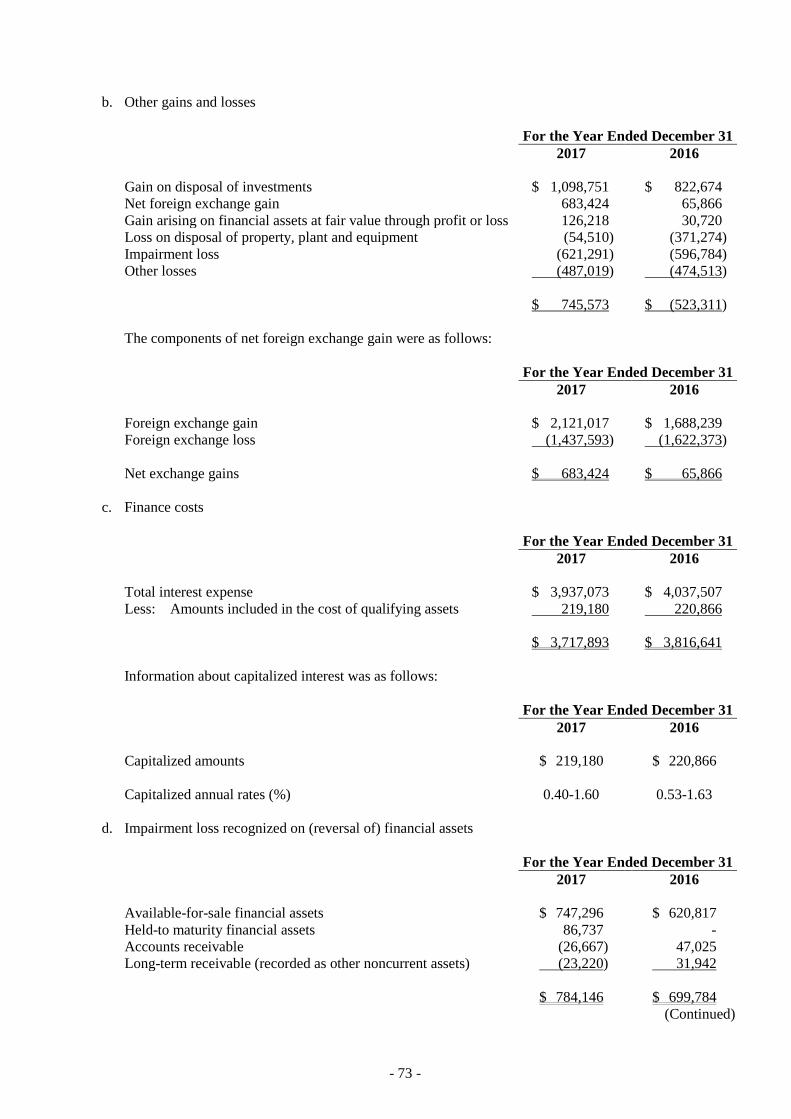
- 73 -
b. Other gains and losses
For the Year Ended December 31
2017 2016
Gain on disposal of investments $ 1,098,751 $ 822,674
Net foreign exchange gain 683,424 65,866
Gain arising on financial assets at fair value through profit or loss 126,218 30,720
Loss on disposal of property, plant and equipment (54,510) (371,274)
Impairment loss (621,291) (596,784)
Other losses (487,019) (474,513)
$ 745,573 $ (523,311)
The components of net foreign exchange gain were as follows:
For the Year Ended December 31
2017 2016
Foreign exchange gain $ 2,121,017 $ 1,688,239
Foreign exchange loss (1,437,593) (1,622,373)
Net exchange gains $ 683,424 $ 65,866
c. Finance costs
For the Year Ended December 31
2017 2016
Total interest expense $ 3,937,073 $ 4,037,507
Less: Amounts included in the cost of qualifying assets 219,180 220,866
$ 3,717,893 $ 3,816,641
Information about capitalized interest was as follows:
For the Year Ended December 31
2017 2016
Capitalized amounts $ 219,180 $ 220,866
Capitalized annual rates (%) 0.40-1.60 0.53-1.63
d. Impairment loss recognized on (reversal of) financial assets
For the Year Ended December 31
2017 2016
Available-for-sale financial assets $ 747,296 $ 620,817
Held-to maturity financial assets 86,737 -
Accounts receivable (26,667) 47,025
Long-term receivable (recorded as other noncurrent assets) (23,220) 31,942
$ 784,146 $ 699,784
(Continued)
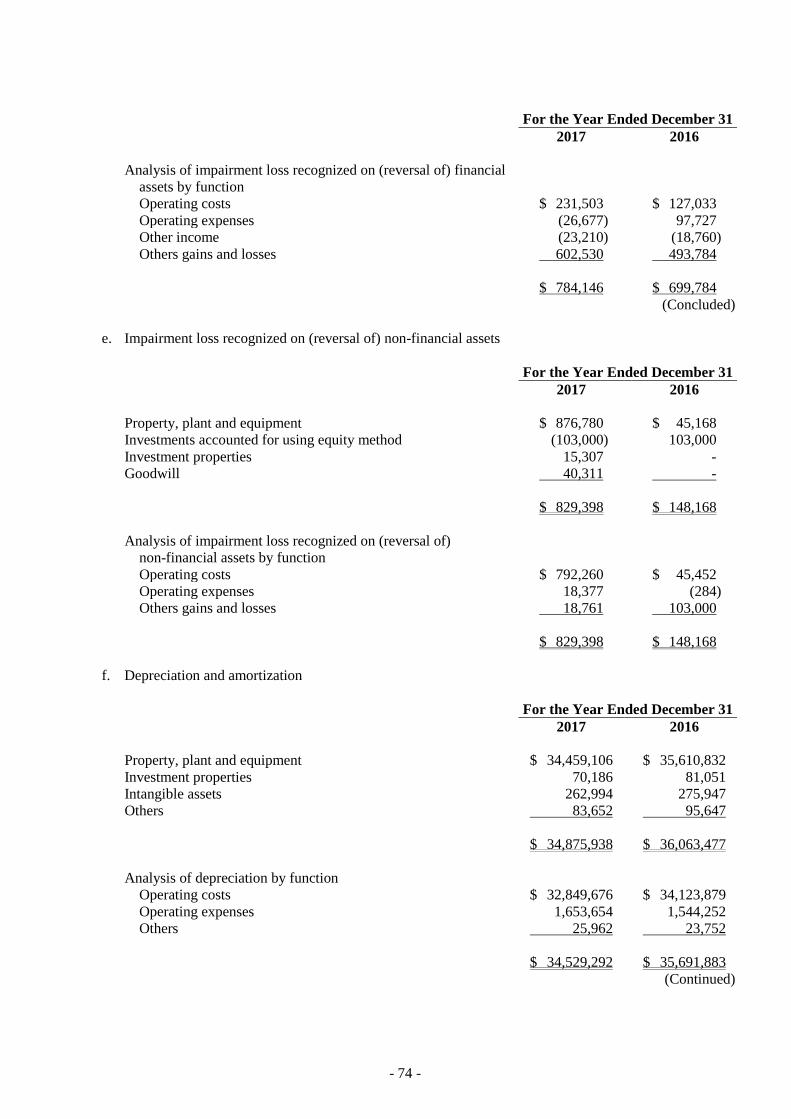
- 74 -
For the Year Ended December 31
2017 2016
Analysis of impairment loss recognized on (reversal of) financial
assets by function
Operating costs $ 231,503 $ 127,033
Operating expenses (26,677) 97,727
Other income (23,210) (18,760)
Others gains and losses 602,530 493,784
$ 784,146 $ 699,784
(Concluded)
e. Impairment loss recognized on (reversal of) non-financial assets
For the Year Ended December 31
2017 2016
Property, plant and equipment $ 876,780 $ 45,168
Investments accounted for using equity method (103,000) 103,000
Investment properties 15,307 -
Goodwill 40,311 -
$ 829,398 $ 148,168
Analysis of impairment loss recognized on (reversal of)
non-financial assets by function
Operating costs $ 792,260 $ 45,452
Operating expenses 18,377 (284)
Others gains and losses 18,761 103,000
$ 829,398 $ 148,168
f. Depreciation and amortization
For the Year Ended December 31
2017 2016
Property, plant and equipment $ 34,459,106 $ 35,610,832
Investment properties 70,186 81,051
Intangible assets 262,994 275,947
Others 83,652 95,647
$ 34,875,938 $ 36,063,477
Analysis of depreciation by function
Operating costs $ 32,849,676 $ 34,123,879
Operating expenses 1,653,654 1,544,252
Others 25,962 23,752
$ 34,529,292 $ 35,691,883
(Continued)
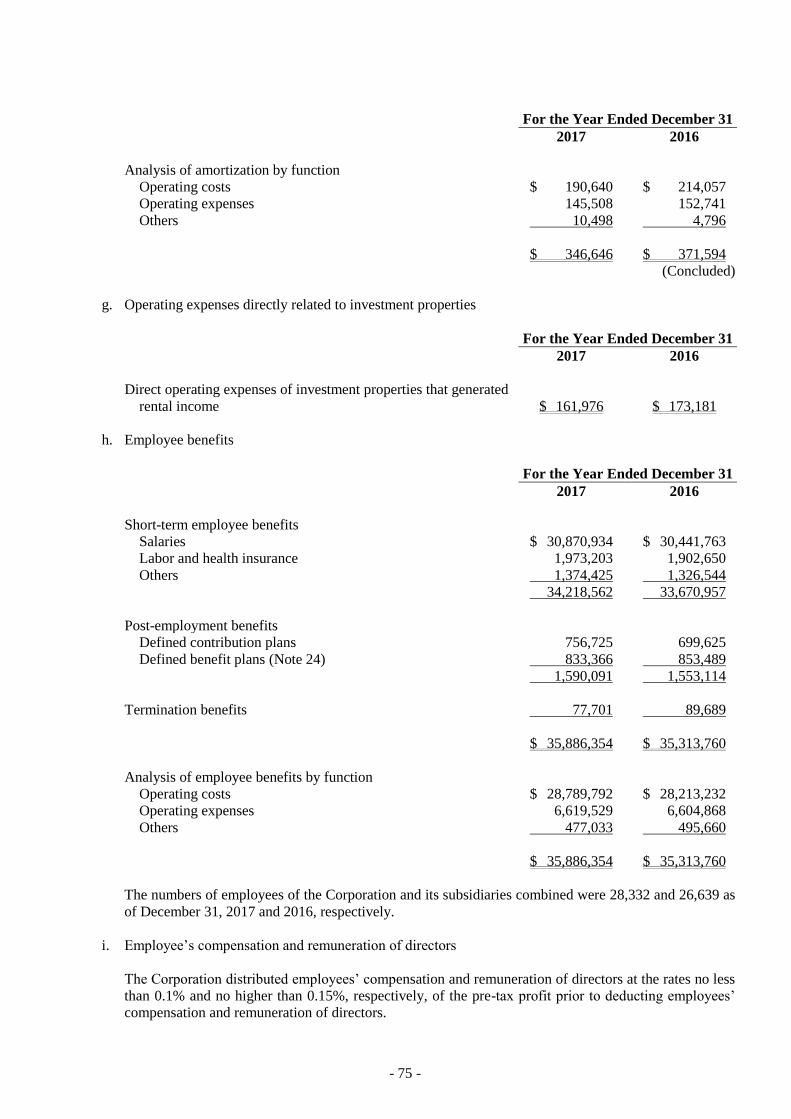
- 75 -
For the Year Ended December 31
2017 2016
Analysis of amortization by function
Operating costs $ 190,640 $ 214,057
Operating expenses 145,508 152,741
Others 10,498 4,796
$ 346,646 $ 371,594
(Concluded)
g. Operating expenses directly related to investment properties
For the Year Ended December 31
2017 2016
Direct operating expenses of investment properties that generated
rental income $ 161,976 $ 173,181
h. Employee benefits
For the Year Ended December 31
2017 2016
Short-term employee benefits
Salaries $ 30,870,934 $ 30,441,763
Labor and health insurance 1,973,203 1,902,650
Others 1,374,425 1,326,544
34,218,562 33,670,957
Post-employment benefits
Defined contribution plans 756,725 699,625
Defined benefit plans (Note 24) 833,366 853,489
1,590,091 1,553,114
Termination benefits 77,701 89,689
$ 35,886,354 $ 35,313,760
Analysis of employee benefits by function
Operating costs $ 28,789,792 $ 28,213,232
Operating expenses 6,619,529 6,604,868
Others 477,033 495,660
$ 35,886,354 $ 35,313,760
The numbers of employees of the Corporation and its subsidiaries combined were 28,332 and 26,639 as
of December 31, 2017 and 2016, respectively.
i. Employee’s compensation and remuneration of directors
The Corporation distributed employees’ compensation and remuneration of directors at the rates no less
than 0.1% and no higher than 0.15%, respectively, of the pre-tax profit prior to deducting employees’
compensation and remuneration of directors.
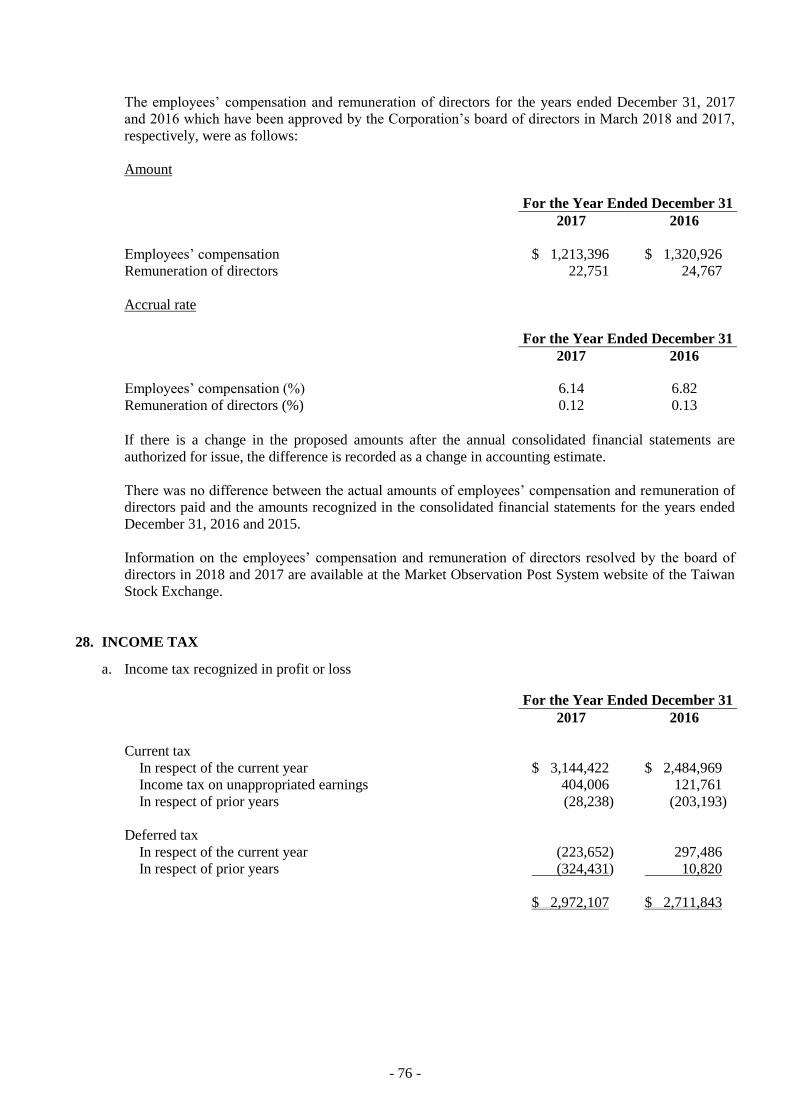
- 76 -
The employees’ compensation and remuneration of directors for the years ended December 31, 2017
and 2016 which have been approved by the Corporation’s board of directors in March 2018 and 2017,
respectively, were as follows:
Amount
For the Year Ended December 31
2017 2016
Employees’ compensation $ 1,213,396 $ 1,320,926
Remuneration of directors 22,751 24,767
Accrual rate
For the Year Ended December 31
2017 2016
Employees’ compensation (%) 6.14 6.82
Remuneration of directors (%) 0.12 0.13
If there is a change in the proposed amounts after the annual consolidated financial statements are
authorized for issue, the difference is recorded as a change in accounting estimate.
There was no difference between the actual amounts of employees’ compensation and remuneration of
directors paid and the amounts recognized in the consolidated financial statements for the years ended
December 31, 2016 and 2015.
Information on the employees’ compensation and remuneration of directors resolved by the board of
directors in 2018 and 2017 are available at the Market Observation Post System website of the Taiwan
Stock Exchange.
28. INCOME TAX
a. Income tax recognized in profit or loss
For the Year Ended December 31
2017 2016
Current tax
In respect of the current year $ 3,144,422 $ 2,484,969
Income tax on unappropriated earnings 404,006 121,761
In respect of prior years (28,238) (203,193)
Deferred tax
In respect of the current year (223,652) 297,486
In respect of prior years (324,431) 10,820
$ 2,972,107 $ 2,711,843
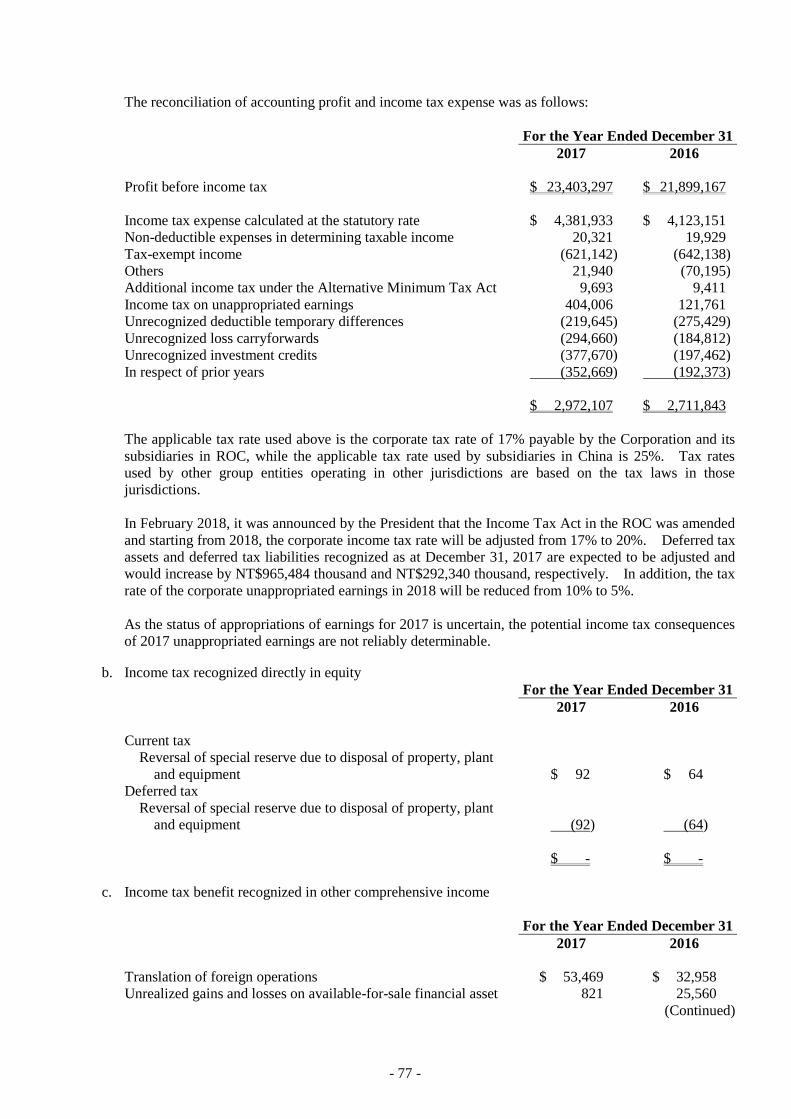
- 77 -
The reconciliation of accounting profit and income tax expense was as follows:
For the Year Ended December 31
2017 2016
Profit before income tax $ 23,403,297 $ 21,899,167
Income tax expense calculated at the statutory rate $ 4,381,933 $ 4,123,151
Non-deductible expenses in determining taxable income 20,321 19,929
Tax-exempt income (621,142) (642,138)
Others 21,940 (70,195)
Additional income tax under the Alternative Minimum Tax Act 9,693 9,411
Income tax on unappropriated earnings 404,006 121,761
Unrecognized deductible temporary differences (219,645) (275,429)
Unrecognized loss carryforwards (294,660) (184,812)
Unrecognized investment credits (377,670) (197,462)
In respect of prior years (352,669) (192,373)
$ 2,972,107 $ 2,711,843
The applicable tax rate used above is the corporate tax rate of 17% payable by the Corporation and its
subsidiaries in ROC, while the applicable tax rate used by subsidiaries in China is 25%. Tax rates
used by other group entities operating in other jurisdictions are based on the tax laws in those
jurisdictions.
In February 2018, it was announced by the President that the Income Tax Act in the ROC was amended
and starting from 2018, the corporate income tax rate will be adjusted from 17% to 20%. Deferred tax
assets and deferred tax liabilities recognized as at December 31, 2017 are expected to be adjusted and
would increase by NT$965,484 thousand and NT$292,340 thousand, respectively. In addition, the tax
rate of the corporate unappropriated earnings in 2018 will be reduced from 10% to 5%.
As the status of appropriations of earnings for 2017 is uncertain, the potential income tax consequences
of 2017 unappropriated earnings are not reliably determinable.
b. Income tax recognized directly in equity
For the Year Ended December 31
2017 2016
Current tax
Reversal of special reserve due to disposal of property, plant
and equipment $ 92 $ 64
Deferred tax
Reversal of special reserve due to disposal of property, plant
and equipment (92) (64)
$ - $ -
c. Income tax benefit recognized in other comprehensive income
For the Year Ended December 31
2017 2016
Translation of foreign operations $ 53,469 $ 32,958
Unrealized gains and losses on available-for-sale financial asset 821 25,560
(Continued)
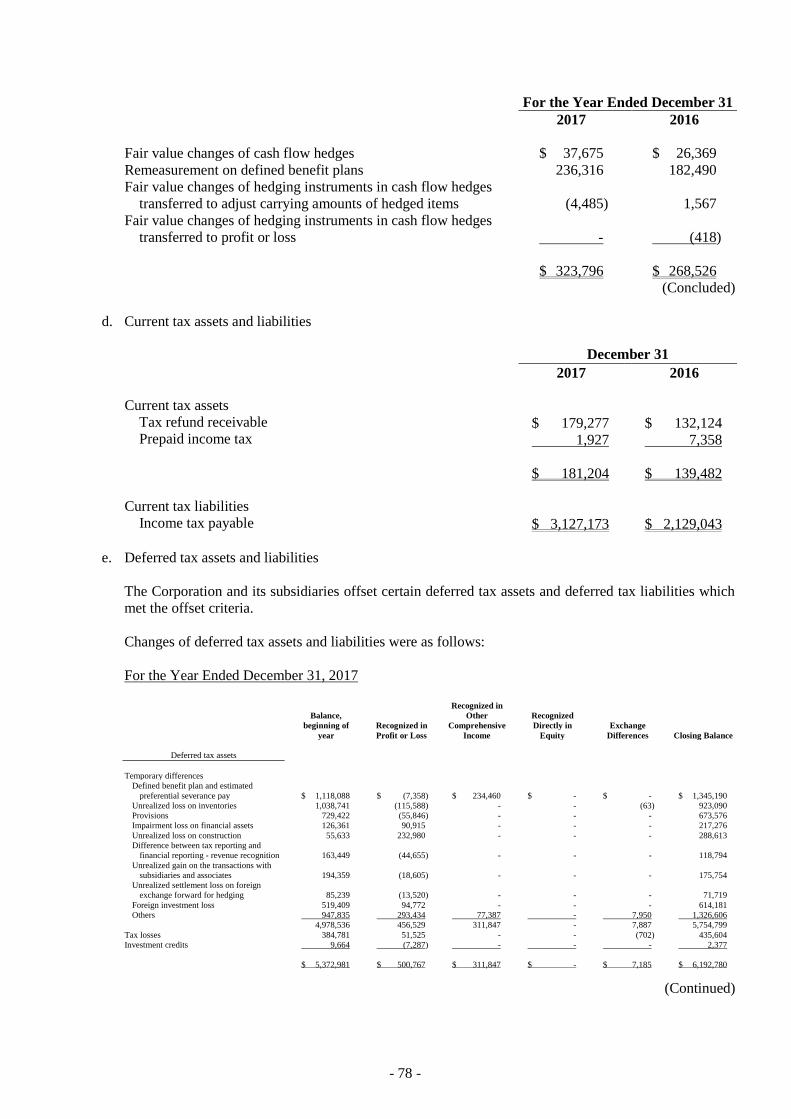
- 78 -
For the Year Ended December 31
2017 2016
Fair value changes of cash flow hedges $ 37,675 $ 26,369
Remeasurement on defined benefit plans 236,316 182,490
Fair value changes of hedging instruments in cash flow hedges
transferred to adjust carrying amounts of hedged items (4,485) 1,567
Fair value changes of hedging instruments in cash flow hedges
transferred to profit or loss - (418)
$ 323,796 $ 268,526
(Concluded)
d. Current tax assets and liabilities
December 31
2017 2016
Current tax assets
Tax refund receivable $ 179,277 $ 132,124 Prepaid income tax 1,927 7,358
$ 181,204 $ 139,482
Current tax liabilities
Income tax payable $ 3,127,173 $ 2,129,043
e. Deferred tax assets and liabilities
The Corporation and its subsidiaries offset certain deferred tax assets and deferred tax liabilities which
met the offset criteria.
Changes of deferred tax assets and liabilities were as follows:
For the Year Ended December 31, 2017
Balance,
beginning of
year
Recognized in
Profit or Loss
Recognized in
Other
Comprehensive
Income
Recognized
Directly in
Equity
Exchange
Differences
Closing Balance
Deferred tax assets
Temporary differences
Defined benefit plan and estimated
preferential severance pay $ 1,118,088 $ (7,358) $ 234,460
$ - - $ - - $ 1,345,190
Unrealized loss on inventories 1,038,741 (115,588) - - - (63) - 923,090
Provisions 729,422 (55,846) - - - - - 673,576
Impairment loss on financial assets 126,361 90,915 - - - - - 217,276
Unrealized loss on construction 55,633 232,980 - - - - - 288,613
Difference between tax reporting and
financial reporting - revenue recognition 163,449 (44,655) -
- - - - 118,794
Unrealized gain on the transactions with
subsidiaries and associates 194,359 (18,605) -
- - - - 175,754
Unrealized settlement loss on foreign
exchange forward for hedging 85,239 (13,520) -
- - - - 71,719
Foreign investment loss 519,409 94,772 - - - - - 614,181
Others 947,835 293,434 77,387 - - 7,950 - 1,326,606
4,978,536 456,529 311,847 - 7,887 5,754,799
Tax losses 384,781 51,525 - - (702) 435,604
Investment credits 9,664 (7,287) - - - 2,377
$ 5,372,981 $ 500,767 $ 311,847 $ - $ 7,185 $ 6,192,780
(Continued)
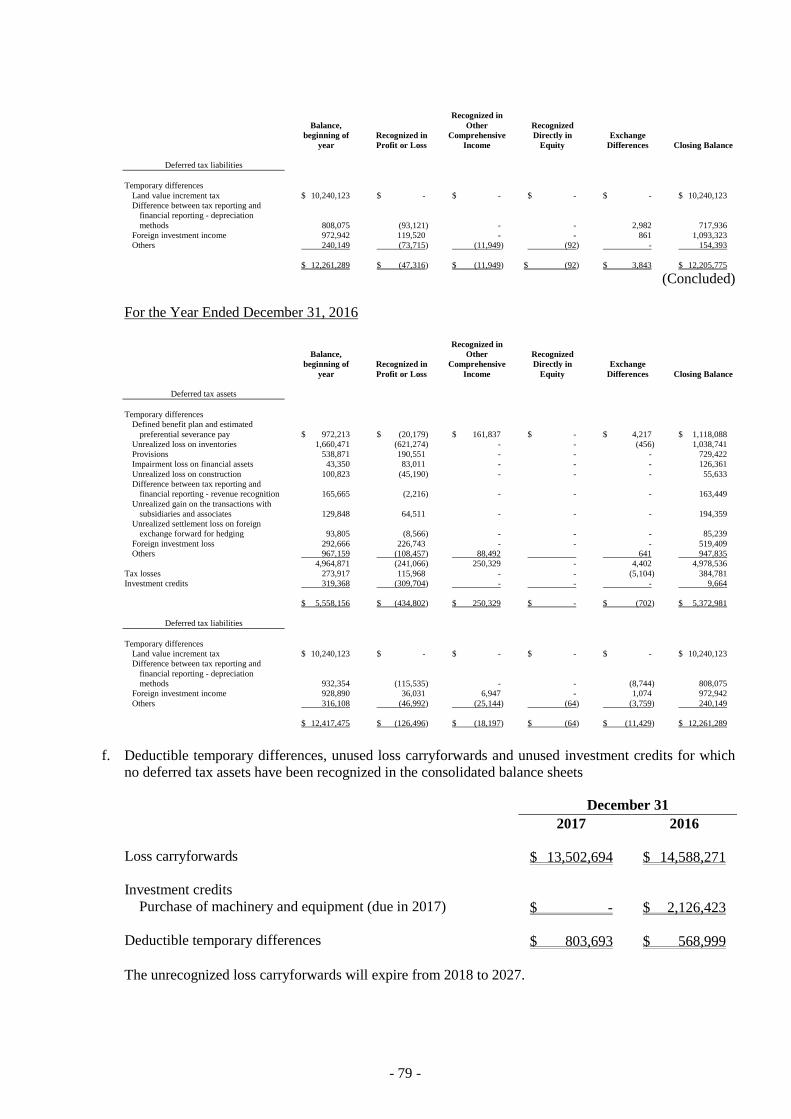
- 79 -
Balance,
beginning of
year
Recognized in
Profit or Loss
Recognized in
Other
Comprehensive
Income
Recognized
Directly in
Equity
Exchange
Differences
Closing Balance
Deferred tax liabilities
Temporary differences
Land value increment tax $ 10,240,123 $ - $ - $ - $ - $ 10,240,123
Difference between tax reporting and
financial reporting - depreciation
methods 808,075 (93,121) -
- 2,982 717,936
Foreign investment income 972,942 119,520 - - 861 1,093,323
Others 240,149 (73,715) (11,949) (92) - - 154,393
$ 12,261,289 $ (47,316) $ (11,949) $ (92) $ 3,843 $ 12,205,775
(Concluded)
For the Year Ended December 31, 2016
Balance,
beginning of
year
Recognized in
Profit or Loss
Recognized in
Other
Comprehensive
Income
Recognized
Directly in
Equity
Exchange
Differences Closing Balance
Deferred tax assets
Temporary differences
Defined benefit plan and estimated
preferential severance pay $ 972,213 $ (20,179) $ 161,837
$ - - $ 4,217
$ 1,118,088
Unrealized loss on inventories 1,660,471 (621,274) - - - (456) 1,038,741
Provisions 538,871 190,551 - - - - 729,422
Impairment loss on financial assets 43,350 83,011 - - - - 126,361
Unrealized loss on construction 100,823 (45,190) - - - - 55,633
Difference between tax reporting and
financial reporting - revenue recognition 165,665 (2,216) -
- - - 163,449
Unrealized gain on the transactions with
subsidiaries and associates 129,848 64,511 -
- - - 194,359
Unrealized settlement loss on foreign
exchange forward for hedging 93,805 (8,566) -
- - - 85,239
Foreign investment loss 292,666 226,743 - - - - 519,409
Others 967,159 (108,457) 88,492 - 641 947,835
4,964,871 (241,066) 250,329 - 4,402 4,978,536
Tax losses 273,917 115,968 - - (5,104) 384,781
Investment credits 319,368 (309,704) - - - 9,664
$ 5,558,156 $ (434,802) $ 250,329 $ - $ (702) $ 5,372,981
Deferred tax liabilities
Temporary differences
Land value increment tax $ 10,240,123 $ - $ - $ - $ - $ 10,240,123
Difference between tax reporting and
financial reporting - depreciation
methods 932,354 (115,535) -
- (8,744) 808,075
Foreign investment income 928,890 36,031 6,947 - 1,074 972,942
Others 316,108 (46,992) (25,144) (64) (3,759) 240,149
$ 12,417,475 $ (126,496) $ (18,197) $ (64) $ (11,429) $ 12,261,289
f. Deductible temporary differences, unused loss carryforwards and unused investment credits for which
no deferred tax assets have been recognized in the consolidated balance sheets
December 31
2017 2016
Loss carryforwards $ 13,502,694 $ 14,588,271
Investment credits
Purchase of machinery and equipment (due in 2017) $ - $ 2,126,423
Deductible temporary differences $ 803,693 $ 568,999
The unrecognized loss carryforwards will expire from 2018 to 2027.
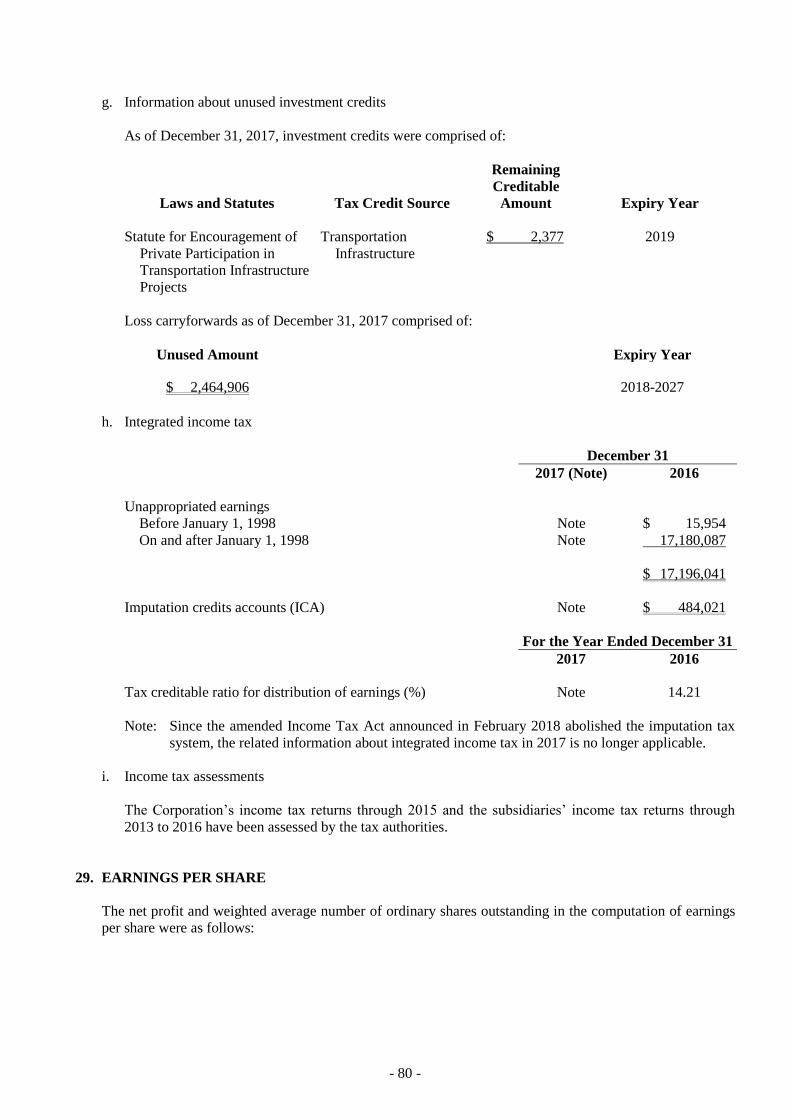
- 80 -
g. Information about unused investment credits
As of December 31, 2017, investment credits were comprised of:
Laws and Statutes Tax Credit Source
Remaining
Creditable
Amount Expiry Year
Statute for Encouragement of
Private Participation in
Transportation Infrastructure
Projects
Transportation
Infrastructure
$ 2,377 2019
Loss carryforwards as of December 31, 2017 comprised of:
Unused Amount Expiry Year
$ 2,464,906 2018-2027
h. Integrated income tax
December 31
2017 (Note) 2016
Unappropriated earnings
Before January 1, 1998 Note $ 15,954
On and after January 1, 1998 Note 17,180,087
$ 17,196,041
Imputation credits accounts (ICA) Note $ 484,021
For the Year Ended December 31
2017 2016
Tax creditable ratio for distribution of earnings (%) Note 14.21
Note: Since the amended Income Tax Act announced in February 2018 abolished the imputation tax
system, the related information about integrated income tax in 2017 is no longer applicable.
i. Income tax assessments
The Corporation’s income tax returns through 2015 and the subsidiaries’ income tax returns through
2013 to 2016 have been assessed by the tax authorities.
29. EARNINGS PER SHARE
The net profit and weighted average number of ordinary shares outstanding in the computation of earnings
per share were as follows:
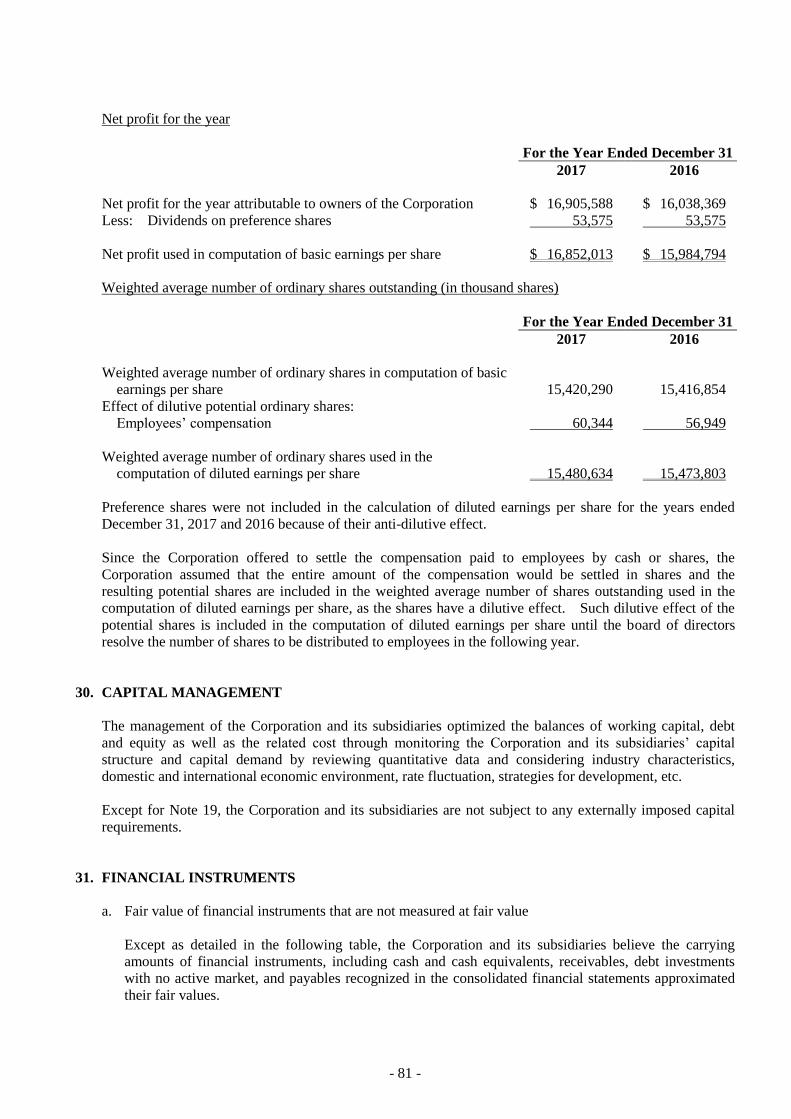
- 81 -
Net profit for the year
For the Year Ended December 31
2017 2016
Net profit for the year attributable to owners of the Corporation $ 16,905,588 $ 16,038,369
Less: Dividends on preference shares 53,575 53,575
Net profit used in computation of basic earnings per share $ 16,852,013 $ 15,984,794
Weighted average number of ordinary shares outstanding (in thousand shares)
For the Year Ended December 31
2017 2016
Weighted average number of ordinary shares in computation of basic
earnings per share
15,420,290 15,416,854
Effect of dilutive potential ordinary shares:
Employees’ compensation 60,344 56,949
Weighted average number of ordinary shares used in the
computation of diluted earnings per share
15,480,634 15,473,803
Preference shares were not included in the calculation of diluted earnings per share for the years ended
December 31, 2017 and 2016 because of their anti-dilutive effect.
Since the Corporation offered to settle the compensation paid to employees by cash or shares, the
Corporation assumed that the entire amount of the compensation would be settled in shares and the
resulting potential shares are included in the weighted average number of shares outstanding used in the
computation of diluted earnings per share, as the shares have a dilutive effect. Such dilutive effect of the
potential shares is included in the computation of diluted earnings per share until the board of directors
resolve the number of shares to be distributed to employees in the following year.
30. CAPITAL MANAGEMENT
The management of the Corporation and its subsidiaries optimized the balances of working capital, debt
and equity as well as the related cost through monitoring the Corporation and its subsidiaries’ capital
structure and capital demand by reviewing quantitative data and considering industry characteristics,
domestic and international economic environment, rate fluctuation, strategies for development, etc.
Except for Note 19, the Corporation and its subsidiaries are not subject to any externally imposed capital
requirements.
31. FINANCIAL INSTRUMENTS
a. Fair value of financial instruments that are not measured at fair value
Except as detailed in the following table, the Corporation and its subsidiaries believe the carrying
amounts of financial instruments, including cash and cash equivalents, receivables, debt investments
with no active market, and payables recognized in the consolidated financial statements approximated
their fair values.
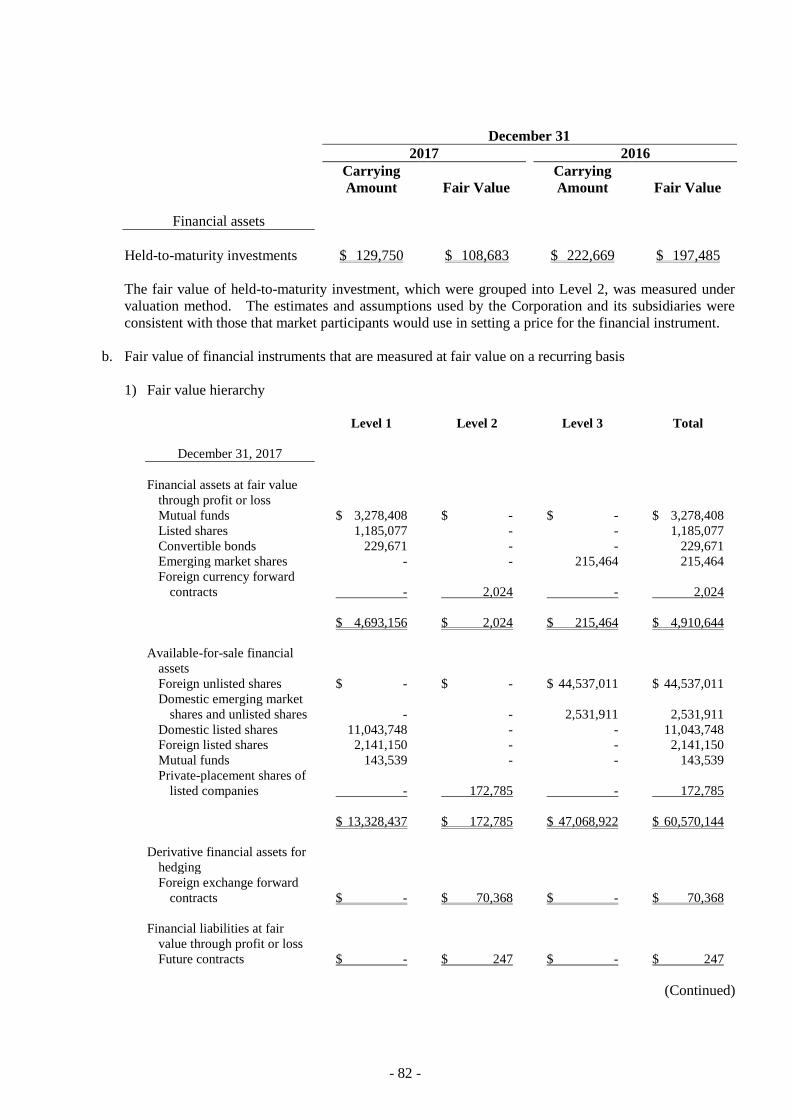
- 82 -
December 31
2017 2016
Carrying
Amount Fair Value
Carrying
Amount Fair Value
Financial assets
Held-to-maturity investments $ 129,750 $ 108,683 $ 222,669 $ 197,485
The fair value of held-to-maturity investment, which were grouped into Level 2, was measured under
valuation method. The estimates and assumptions used by the Corporation and its subsidiaries were
consistent with those that market participants would use in setting a price for the financial instrument.
b. Fair value of financial instruments that are measured at fair value on a recurring basis
1) Fair value hierarchy
Level 1 Level 2 Level 3 Total
December 31, 2017
Financial assets at fair value
through profit or loss
Mutual funds $ 3,278,408 $ - $ - $ 3,278,408
Listed shares 1,185,077 - - 1,185,077
Convertible bonds 229,671 - - 229,671
Emerging market shares - - 215,464 215,464
Foreign currency forward
contracts - 2,024 - 2,024
$ 4,693,156 $ 2,024 $ 215,464 $ 4,910,644
Available-for-sale financial
assets
Foreign unlisted shares $ - $ - $ 44,537,011 $ 44,537,011
Domestic emerging market
shares and unlisted shares - - 2,531,911 2,531,911
Domestic listed shares 11,043,748 - - 11,043,748
Foreign listed shares 2,141,150 - - 2,141,150
Mutual funds 143,539 - - 143,539
Private-placement shares of
listed companies - 172,785 - 172,785
$ 13,328,437 $ 172,785 $ 47,068,922 $ 60,570,144
Derivative financial assets for
hedging
Foreign exchange forward
contracts $ - $ 70,368 $ - $ 70,368
Financial liabilities at fair
value through profit or loss
Future contracts $ - $ 247 $ - $ 247
(Continued)
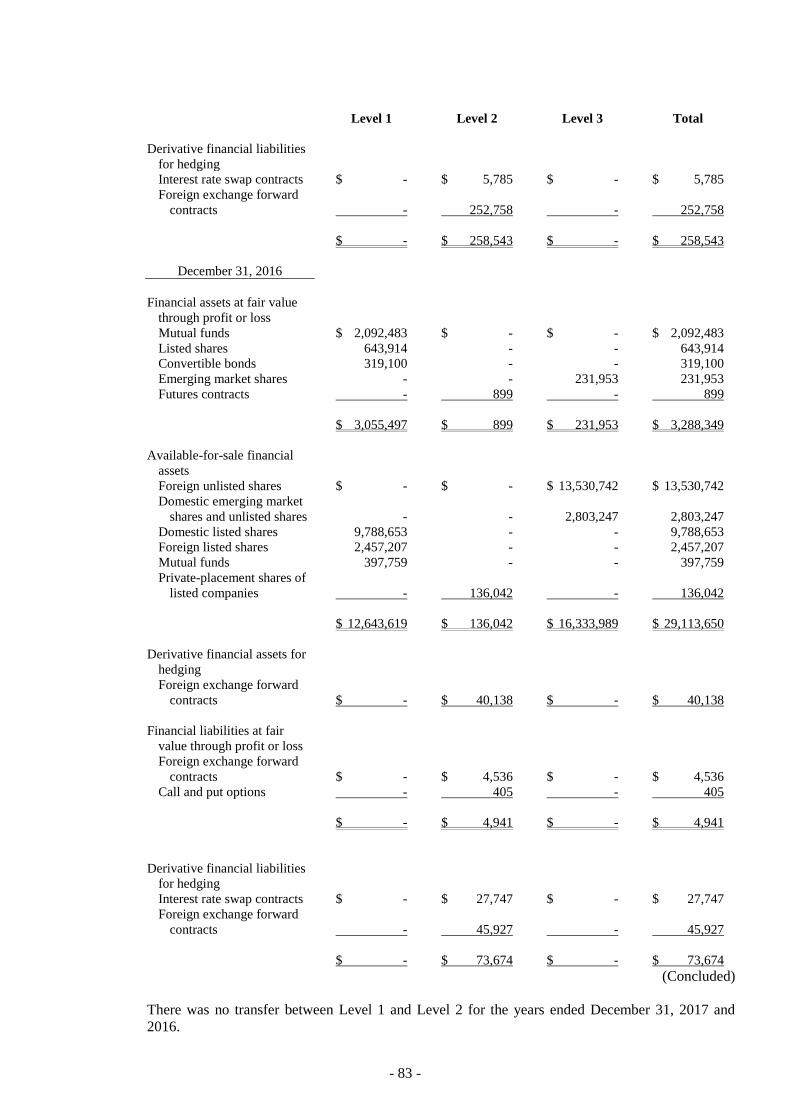
- 83 -
Level 1 Level 2 Level 3 Total
Derivative financial liabilities
for hedging
Interest rate swap contracts $ - $ 5,785 $ - $ 5,785
Foreign exchange forward
contracts - 252,758 - 252,758
$ - $ 258,543 $ - $ 258,543
December 31, 2016
Financial assets at fair value
through profit or loss
Mutual funds $ 2,092,483 $ - $ - $ 2,092,483
Listed shares 643,914 - - 643,914
Convertible bonds 319,100 - - 319,100
Emerging market shares - - 231,953 231,953
Futures contracts - 899 - 899
$ 3,055,497 $ 899 $ 231,953 $ 3,288,349
Available-for-sale financial
assets
Foreign unlisted shares $ - $ - $ 13,530,742 $ 13,530,742
Domestic emerging market
shares and unlisted shares - - 2,803,247 2,803,247
Domestic listed shares 9,788,653 - - 9,788,653
Foreign listed shares 2,457,207 - - 2,457,207
Mutual funds 397,759 - - 397,759
Private-placement shares of
listed companies - 136,042 - 136,042
$ 12,643,619 $ 136,042 $ 16,333,989 $ 29,113,650
Derivative financial assets for
hedging
Foreign exchange forward
contracts $ - $ 40,138 $ - $ 40,138
Financial liabilities at fair
value through profit or loss
Foreign exchange forward
contracts $ - $ 4,536 $ - $ 4,536
Call and put options - 405 - 405
$ - $ 4,941 $ - $ 4,941
Derivative financial liabilities
for hedging
Interest rate swap contracts $ - $ 27,747 $ - $ 27,747
Foreign exchange forward
contracts - 45,927 - 45,927
$ - $ 73,674 $ - $ 73,674
(Concluded)
There was no transfer between Level 1 and Level 2 for the years ended December 31, 2017 and
2016.
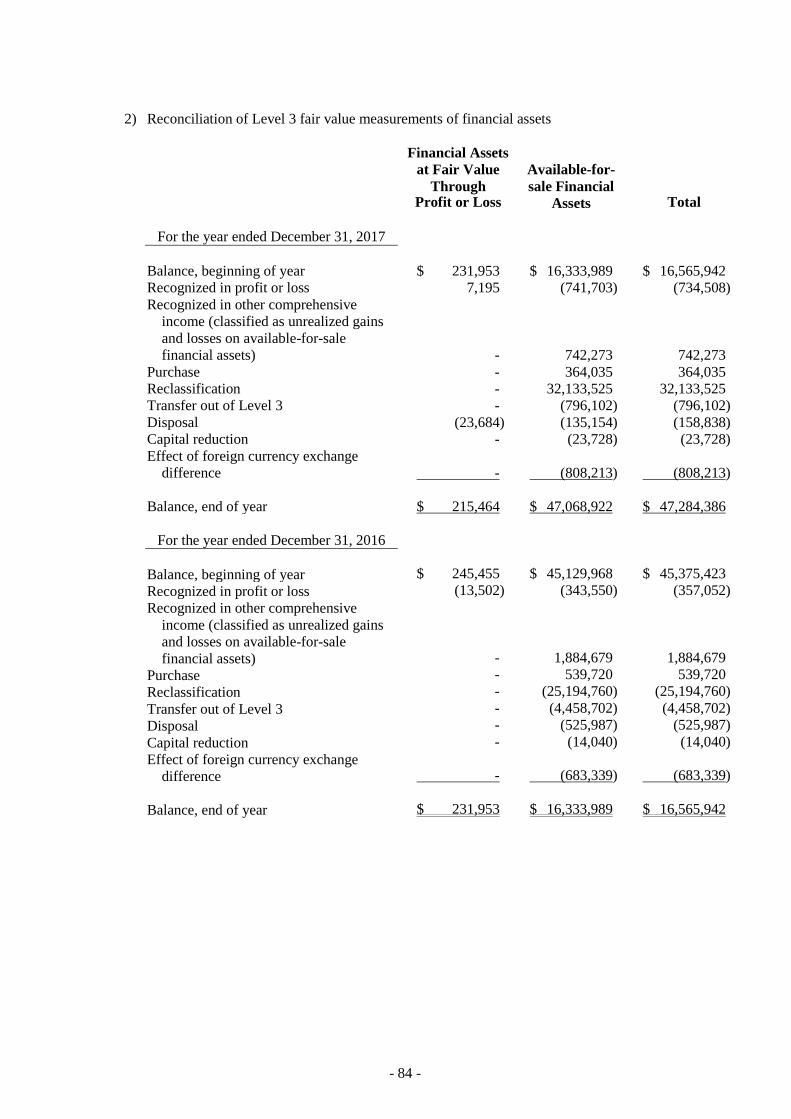
- 84 -
2) Reconciliation of Level 3 fair value measurements of financial assets
Financial Assets
at Fair Value
Through Profit or Loss
Available-for-
sale Financial
Assets Total
For the year ended December 31, 2017
Balance, beginning of year $ 231,953 $ 16,333,989 $ 16,565,942
Recognized in profit or loss 7,195 (741,703) (734,508)
Recognized in other comprehensive
income (classified as unrealized gains
and losses on available-for-sale
financial assets) - 742,273
742,273
Purchase - 364,035 364,035
Reclassification - 32,133,525 32,133,525
Transfer out of Level 3 - (796,102) (796,102)
Disposal (23,684) (135,154) (158,838)
Capital reduction - (23,728) (23,728)
Effect of foreign currency exchange
difference - (808,213)
(808,213)
Balance, end of year $ 215,464 $ 47,068,922 $ 47,284,386
For the year ended December 31, 2016
Balance, beginning of year $ 245,455 $ 45,129,968 $ 45,375,423
Recognized in profit or loss (13,502) (343,550) (357,052)
Recognized in other comprehensive
income (classified as unrealized gains
and losses on available-for-sale
financial assets) - 1,884,679
1,884,679
Purchase - 539,720 539,720
Reclassification - (25,194,760) (25,194,760)
Transfer out of Level 3 - (4,458,702) (4,458,702)
Disposal - (525,987) (525,987)
Capital reduction - (14,040) (14,040)
Effect of foreign currency exchange
difference - (683,339)
(683,339)
Balance, end of year $ 231,953 $ 16,333,989 $ 16,565,942
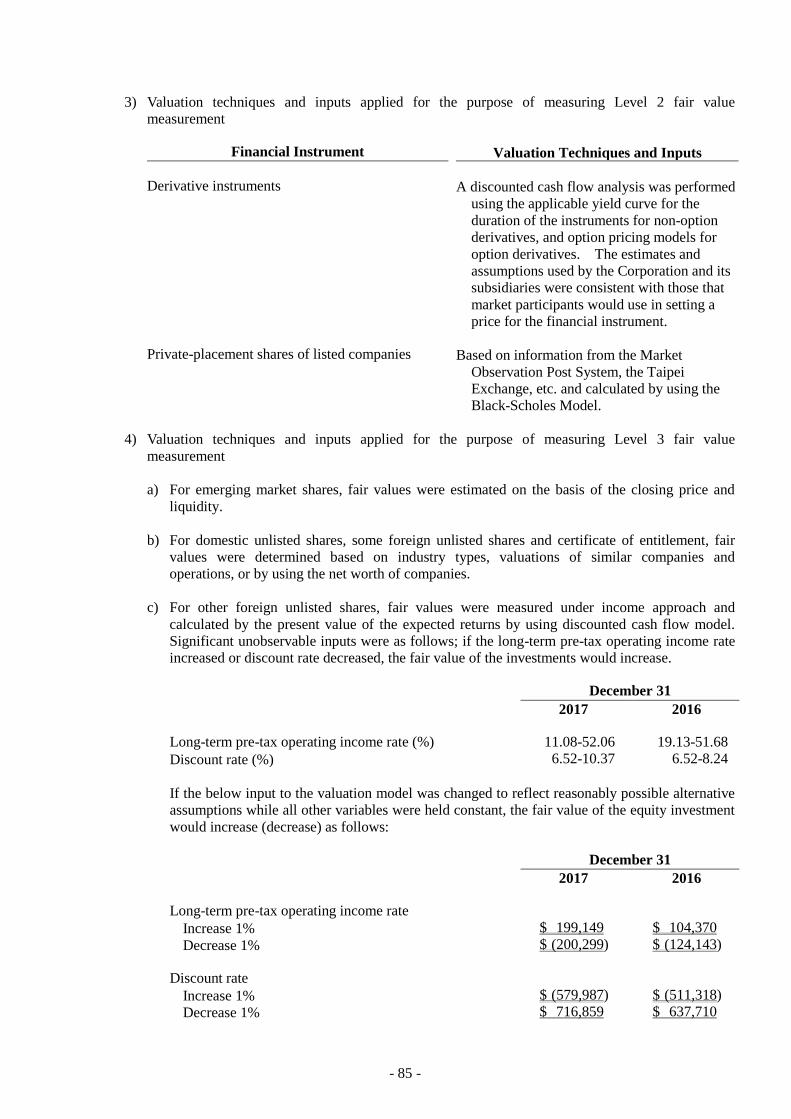
- 85 -
3) Valuation techniques and inputs applied for the purpose of measuring Level 2 fair value
measurement
Financial Instrument Valuation Techniques and Inputs
Derivative instruments A discounted cash flow analysis was performed
using the applicable yield curve for the
duration of the instruments for non-option
derivatives, and option pricing models for
option derivatives. The estimates and
assumptions used by the Corporation and its
subsidiaries were consistent with those that
market participants would use in setting a
price for the financial instrument. Private-placement shares of listed companies Based on information from the Market
Observation Post System, the Taipei
Exchange, etc. and calculated by using the
Black-Scholes Model.
4) Valuation techniques and inputs applied for the purpose of measuring Level 3 fair value
measurement
a) For emerging market shares, fair values were estimated on the basis of the closing price and
liquidity.
b) For domestic unlisted shares, some foreign unlisted shares and certificate of entitlement, fair
values were determined based on industry types, valuations of similar companies and
operations, or by using the net worth of companies.
c) For other foreign unlisted shares, fair values were measured under income approach and
calculated by the present value of the expected returns by using discounted cash flow model.
Significant unobservable inputs were as follows; if the long-term pre-tax operating income rate
increased or discount rate decreased, the fair value of the investments would increase.
December 31
2017 2016
Long-term pre-tax operating income rate (%) 11.08-52.06 19.13-51.68
Discount rate (%) 6.52-10.37 6.52-8.24
If the below input to the valuation model was changed to reflect reasonably possible alternative
assumptions while all other variables were held constant, the fair value of the equity investment
would increase (decrease) as follows:
December 31
2017 2016
Long-term pre-tax operating income rate
Increase 1% $ 199,149 $ 104,370
Decrease 1% $ (200,299) $ (124,143)
Discount rate
Increase 1% $ (579,987) $ (511,318)
Decrease 1% $ 716,859 $ 637,710
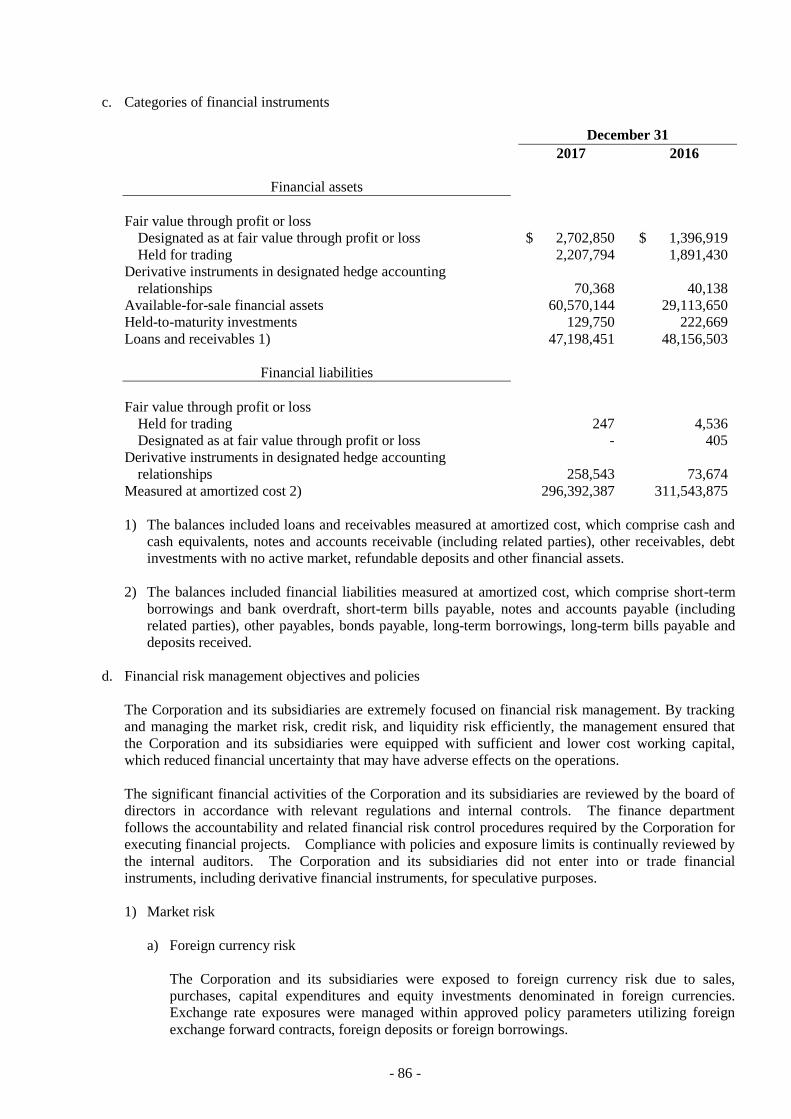
- 86 -
c. Categories of financial instruments
December 31
2017 2016
Financial assets
Fair value through profit or loss
Designated as at fair value through profit or loss $ 2,702,850 $ 1,396,919
Held for trading 2,207,794 1,891,430
Derivative instruments in designated hedge accounting
relationships 70,368 40,138
Available-for-sale financial assets 60,570,144 29,113,650
Held-to-maturity investments 129,750 222,669
Loans and receivables 1) 47,198,451 48,156,503
Financial liabilities
Fair value through profit or loss
Held for trading 247 4,536
Designated as at fair value through profit or loss - 405
Derivative instruments in designated hedge accounting
relationships 258,543 73,674
Measured at amortized cost 2) 296,392,387 311,543,875
1) The balances included loans and receivables measured at amortized cost, which comprise cash and
cash equivalents, notes and accounts receivable (including related parties), other receivables, debt
investments with no active market, refundable deposits and other financial assets.
2) The balances included financial liabilities measured at amortized cost, which comprise short-term
borrowings and bank overdraft, short-term bills payable, notes and accounts payable (including
related parties), other payables, bonds payable, long-term borrowings, long-term bills payable and
deposits received.
d. Financial risk management objectives and policies
The Corporation and its subsidiaries are extremely focused on financial risk management. By tracking
and managing the market risk, credit risk, and liquidity risk efficiently, the management ensured that
the Corporation and its subsidiaries were equipped with sufficient and lower cost working capital,
which reduced financial uncertainty that may have adverse effects on the operations.
The significant financial activities of the Corporation and its subsidiaries are reviewed by the board of
directors in accordance with relevant regulations and internal controls. The finance department
follows the accountability and related financial risk control procedures required by the Corporation for
executing financial projects. Compliance with policies and exposure limits is continually reviewed by
the internal auditors. The Corporation and its subsidiaries did not enter into or trade financial
instruments, including derivative financial instruments, for speculative purposes.
1) Market risk
a) Foreign currency risk
The Corporation and its subsidiaries were exposed to foreign currency risk due to sales,
purchases, capital expenditures and equity investments denominated in foreign currencies.
Exchange rate exposures were managed within approved policy parameters utilizing foreign
exchange forward contracts, foreign deposits or foreign borrowings.
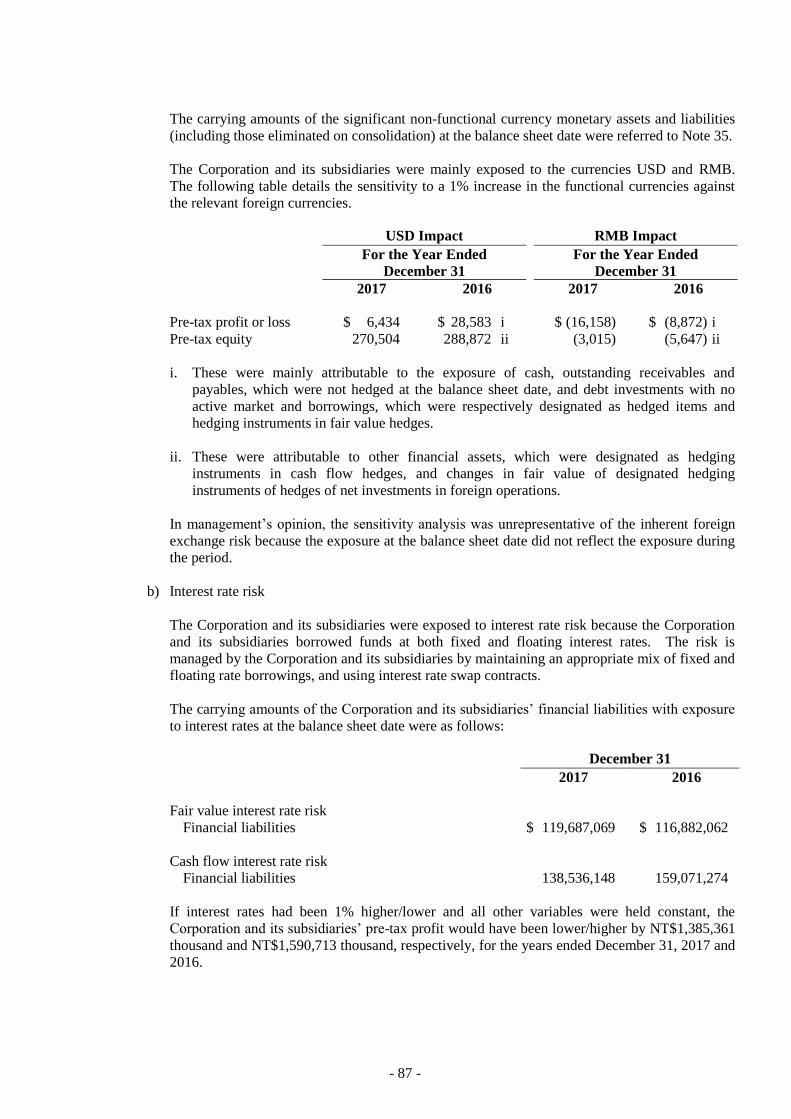
- 87 -
The carrying amounts of the significant non-functional currency monetary assets and liabilities
(including those eliminated on consolidation) at the balance sheet date were referred to Note 35.
The Corporation and its subsidiaries were mainly exposed to the currencies USD and RMB.
The following table details the sensitivity to a 1% increase in the functional currencies against
the relevant foreign currencies.
USD Impact RMB Impact
For the Year Ended
December 31
For the Year Ended
December 31
2017 2016 2017 2016
Pre-tax profit or loss $ 6,434 $ 28,583 i $ (16,158) $ (8,872) i
Pre-tax equity 270,504 288,872 ii (3,015) (5,647) ii
i. These were mainly attributable to the exposure of cash, outstanding receivables and
payables, which were not hedged at the balance sheet date, and debt investments with no
active market and borrowings, which were respectively designated as hedged items and
hedging instruments in fair value hedges.
ii. These were attributable to other financial assets, which were designated as hedging
instruments in cash flow hedges, and changes in fair value of designated hedging
instruments of hedges of net investments in foreign operations.
In management’s opinion, the sensitivity analysis was unrepresentative of the inherent foreign
exchange risk because the exposure at the balance sheet date did not reflect the exposure during
the period.
b) Interest rate risk
The Corporation and its subsidiaries were exposed to interest rate risk because the Corporation
and its subsidiaries borrowed funds at both fixed and floating interest rates. The risk is
managed by the Corporation and its subsidiaries by maintaining an appropriate mix of fixed and
floating rate borrowings, and using interest rate swap contracts.
The carrying amounts of the Corporation and its subsidiaries’ financial liabilities with exposure
to interest rates at the balance sheet date were as follows:
December 31
2017 2016
Fair value interest rate risk
Financial liabilities $ 119,687,069 $ 116,882,062
Cash flow interest rate risk
Financial liabilities 138,536,148 159,071,274
If interest rates had been 1% higher/lower and all other variables were held constant, the
Corporation and its subsidiaries’ pre-tax profit would have been lower/higher by NT$1,385,361
thousand and NT$1,590,713 thousand, respectively, for the years ended December 31, 2017 and
2016.
- 88 -
c) Other price risk
The Corporation and its subsidiaries were exposed to equity price risk through their investments
in mutual funds and listed shares.
If equity prices had been 1% higher/lower, the pre-tax profit for the years ended December 31,
2017 and 2016 would have been higher/lower by NT$44,635 thousand and NT$27,364
thousand, respectively, as a result of the fair value changes of financial assets at fair value
through profit or loss, and the other comprehensive income for the years ended December 31,
2017 and 2016 would have been higher/lower by NT$133,284 thousand and NT$126,436
thousand, respectively, as a result of the changes in fair value of available-for-sale financial
assets.
2) Credit risk
Credit risk refers to the risk that counterparty will default on its contractual obligations resulting in
financial loss to the Corporation and its subsidiaries. As at the balance sheet date, the Corporation
and its subsidiaries’ maximum exposure to credit risk is the carrying amount of the financial assets
on the consolidated balance sheets and the amount of contingent liabilities in relation to financial
guarantee issued by the Corporation and its subsidiaries.
The Corporation and its subsidiaries do not expect significant credit risk because the counterparties
are creditworthy financial institutions and companies.
Counterparties of accounts receivable consisted of a large number of different customers, spread
across diverse industries and geographical areas. Ongoing credit evaluation is performed on the
customers’ financial condition.
The Corporation and its subsidiaries did not have significant credit risk exposure to any single
counterparty or any group of counterparties having similar characteristics. The Corporation and its
subsidiaries define counterparties as having similar characteristics if they are related entities.
As of December 31, 2017 and 2016, the maximum credit risk of off-balance-sheet guarantees and
amount provided to investees of co-investment for procurement compliance was NT$23,504,137
thousand and NT$13,196,277 thousand.
3) Liquidity risk
The management of the Corporation and its subsidiaries continuously monitor the movement of
cash flows, net cash position, significant capital expenditures and the utilization of bank loan
commitments to control proportion of the long-term and short-term bank loans or issue bonds
payable, and ensures compliance with loan covenants.
The following table details the undiscounted cash flows of the Corporation and its subsidiaries’
remaining contractual maturity for its non-derivative financial liabilities from the earliest date on
which they can be required to pay. The tables included both interest and principal cash flows.
Specifically, bank loans with a repayment on demand clause were included in the earliest time span
regardless of the probability of the banks choosing to exercise their rights. The maturity dates for
other non-derivative financial liabilities were based on the agreed repayment dates.
The table below summarizes the maturity profile of the Corporation and its subsidiaries’ financial
liabilities based on contractual undiscounted payments:
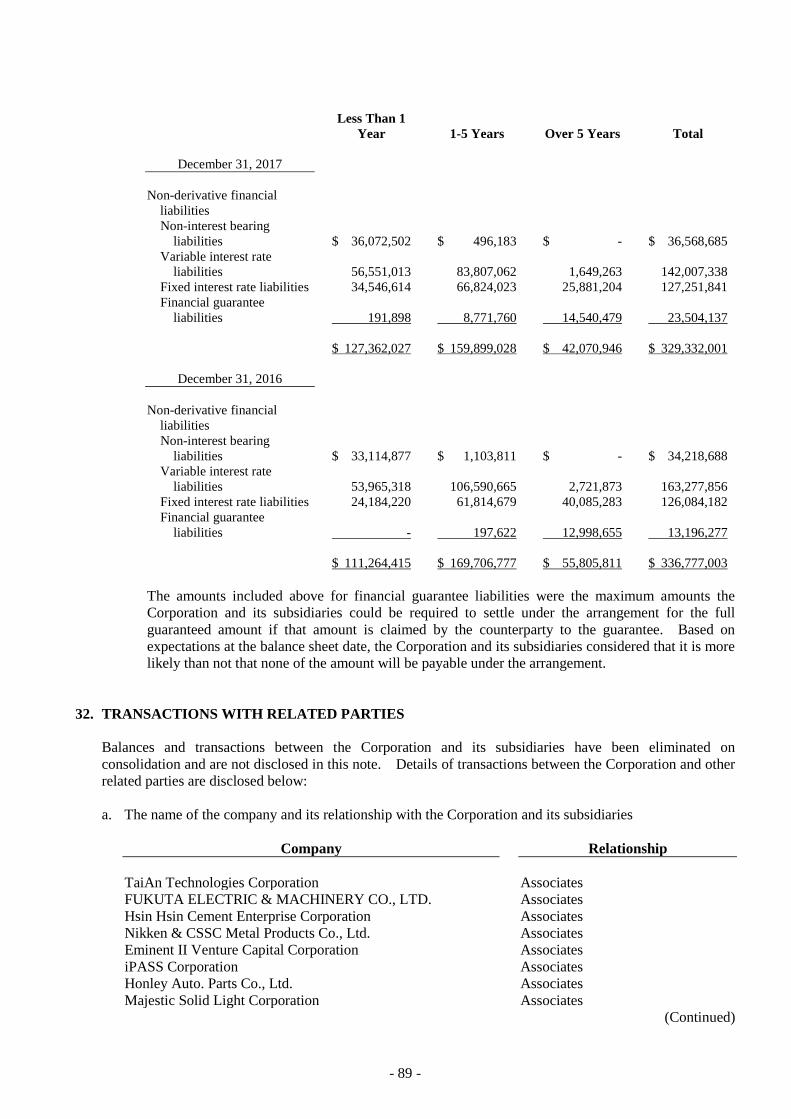
- 89 -
Less Than 1
Year 1-5 Years Over 5 Years Total
December 31, 2017
Non-derivative financial
liabilities
Non-interest bearing
liabilities $ 36,072,502 $ 496,183 $ - $ 36,568,685
Variable interest rate
liabilities 56,551,013 83,807,062 1,649,263 142,007,338
Fixed interest rate liabilities 34,546,614 66,824,023 25,881,204 127,251,841
Financial guarantee
liabilities 191,898 8,771,760 14,540,479 23,504,137
$ 127,362,027 $ 159,899,028 $ 42,070,946 $ 329,332,001
December 31, 2016
Non-derivative financial
liabilities
Non-interest bearing
liabilities $ 33,114,877 $ 1,103,811 $ - $ 34,218,688
Variable interest rate
liabilities 53,965,318 106,590,665 2,721,873 163,277,856
Fixed interest rate liabilities 24,184,220 61,814,679 40,085,283 126,084,182
Financial guarantee
liabilities - 197,622 12,998,655 13,196,277
$ 111,264,415 $ 169,706,777 $ 55,805,811 $ 336,777,003
The amounts included above for financial guarantee liabilities were the maximum amounts the
Corporation and its subsidiaries could be required to settle under the arrangement for the full
guaranteed amount if that amount is claimed by the counterparty to the guarantee. Based on
expectations at the balance sheet date, the Corporation and its subsidiaries considered that it is more
likely than not that none of the amount will be payable under the arrangement.
32. TRANSACTIONS WITH RELATED PARTIES
Balances and transactions between the Corporation and its subsidiaries have been eliminated on
consolidation and are not disclosed in this note. Details of transactions between the Corporation and other
related parties are disclosed below:
a. The name of the company and its relationship with the Corporation and its subsidiaries
Company Relationship
TaiAn Technologies Corporation Associates
FUKUTA ELECTRIC & MACHINERY CO., LTD. Associates
Hsin Hsin Cement Enterprise Corporation Associates
Nikken & CSSC Metal Products Co., Ltd. Associates
Eminent II Venture Capital Corporation Associates
iPASS Corporation Associates
Honley Auto. Parts Co., Ltd. Associates
Majestic Solid Light Corporation Associates
(Continued)
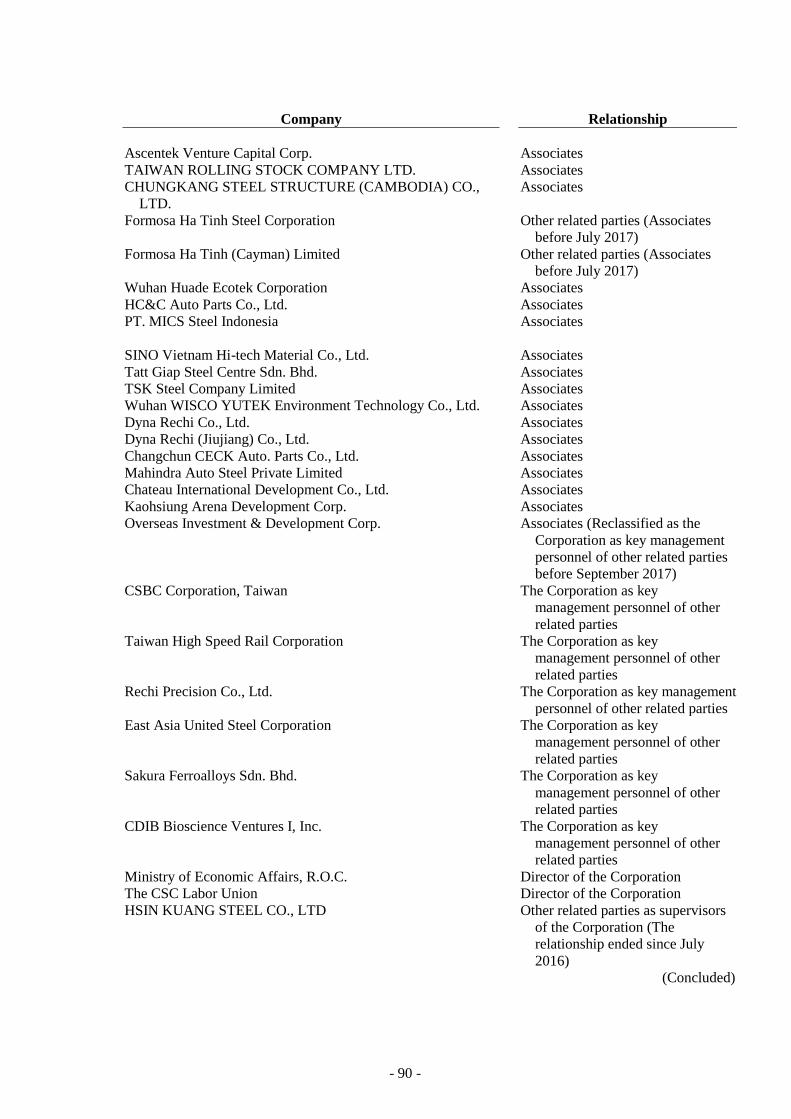
- 90 -
Company Relationship
Ascentek Venture Capital Corp. Associates
TAIWAN ROLLING STOCK COMPANY LTD. Associates
CHUNGKANG STEEL STRUCTURE (CAMBODIA) CO.,
LTD.
Associates
Formosa Ha Tinh Steel Corporation Other related parties (Associates
before July 2017)
Formosa Ha Tinh (Cayman) Limited Other related parties (Associates
before July 2017)
Wuhan Huade Ecotek Corporation Associates
HC&C Auto Parts Co., Ltd. Associates
PT. MICS Steel Indonesia Associates
SINO Vietnam Hi-tech Material Co., Ltd. Associates
Tatt Giap Steel Centre Sdn. Bhd. Associates
TSK Steel Company Limited Associates
Wuhan WISCO YUTEK Environment Technology Co., Ltd. Associates
Dyna Rechi Co., Ltd. Associates
Dyna Rechi (Jiujiang) Co., Ltd. Associates
Changchun CECK Auto. Parts Co., Ltd. Associates
Mahindra Auto Steel Private Limited Associates
Chateau International Development Co., Ltd. Associates
Kaohsiung Arena Development Corp. Associates
Overseas Investment & Development Corp. Associates (Reclassified as the
Corporation as key management
personnel of other related parties
before September 2017)
CSBC Corporation, Taiwan The Corporation as key
management personnel of other
related parties
Taiwan High Speed Rail Corporation The Corporation as key
management personnel of other
related parties
Rechi Precision Co., Ltd. The Corporation as key management
personnel of other related parties
East Asia United Steel Corporation The Corporation as key
management personnel of other
related parties
Sakura Ferroalloys Sdn. Bhd. The Corporation as key
management personnel of other
related parties
CDIB Bioscience Ventures I, Inc. The Corporation as key
management personnel of other
related parties
Ministry of Economic Affairs, R.O.C. Director of the Corporation
The CSC Labor Union Director of the Corporation
HSIN KUANG STEEL CO., LTD Other related parties as supervisors
of the Corporation (The
relationship ended since July
2016)
(Concluded)
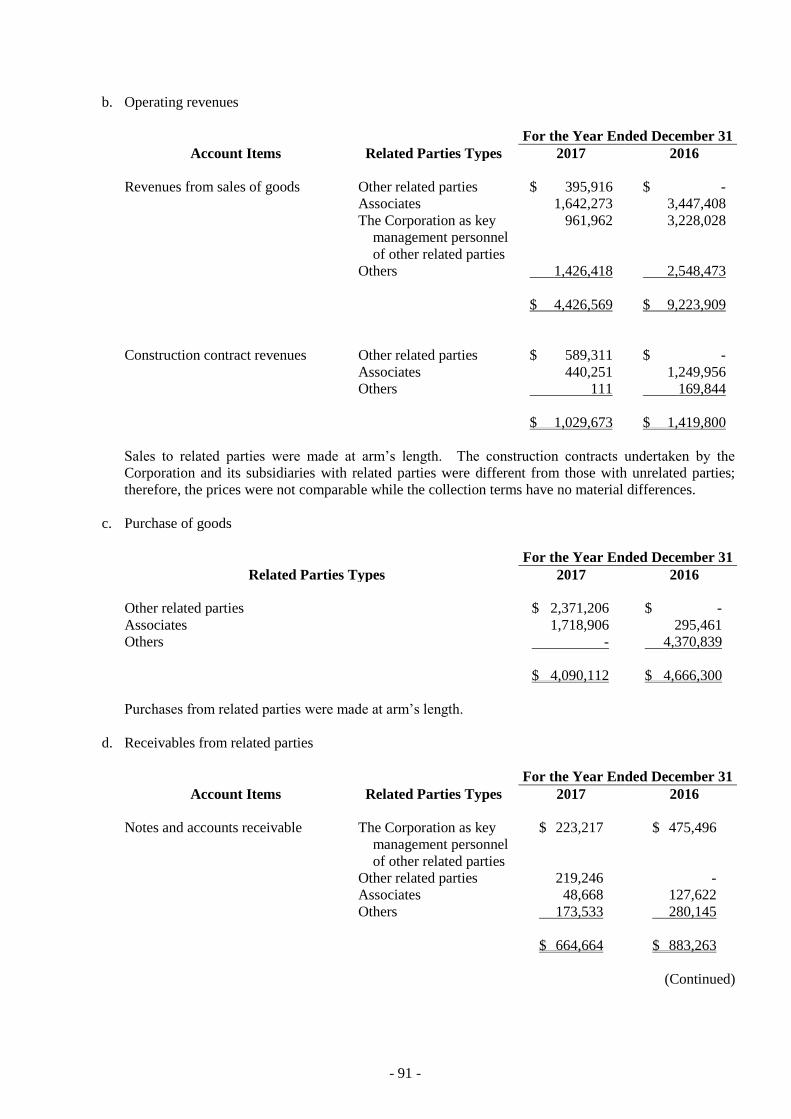
- 91 -
b. Operating revenues
For the Year Ended December 31
Account Items Related Parties Types 2017 2016
Revenues from sales of goods Other related parties $ 395,916 $ -
Associates 1,642,273 3,447,408
The Corporation as key
management personnel
of other related parties
961,962 3,228,028
Others 1,426,418 2,548,473
$ 4,426,569 $ 9,223,909
Construction contract revenues Other related parties $ 589,311 $ -
Associates 440,251 1,249,956
Others 111 169,844
$ 1,029,673 $ 1,419,800
Sales to related parties were made at arm’s length. The construction contracts undertaken by the
Corporation and its subsidiaries with related parties were different from those with unrelated parties;
therefore, the prices were not comparable while the collection terms have no material differences.
c. Purchase of goods
For the Year Ended December 31
Related Parties Types 2017 2016
Other related parties $ 2,371,206 $ -
Associates 1,718,906 295,461
Others - 4,370,839
$ 4,090,112 $ 4,666,300
Purchases from related parties were made at arm’s length.
d. Receivables from related parties
For the Year Ended December 31
Account Items Related Parties Types 2017 2016
Notes and accounts receivable
The Corporation as key
management personnel
of other related parties
$ 223,217 $ 475,496
Other related parties 219,246 -
Associates 48,668 127,622
Others 173,533 280,145
$ 664,664 $ 883,263
(Continued)
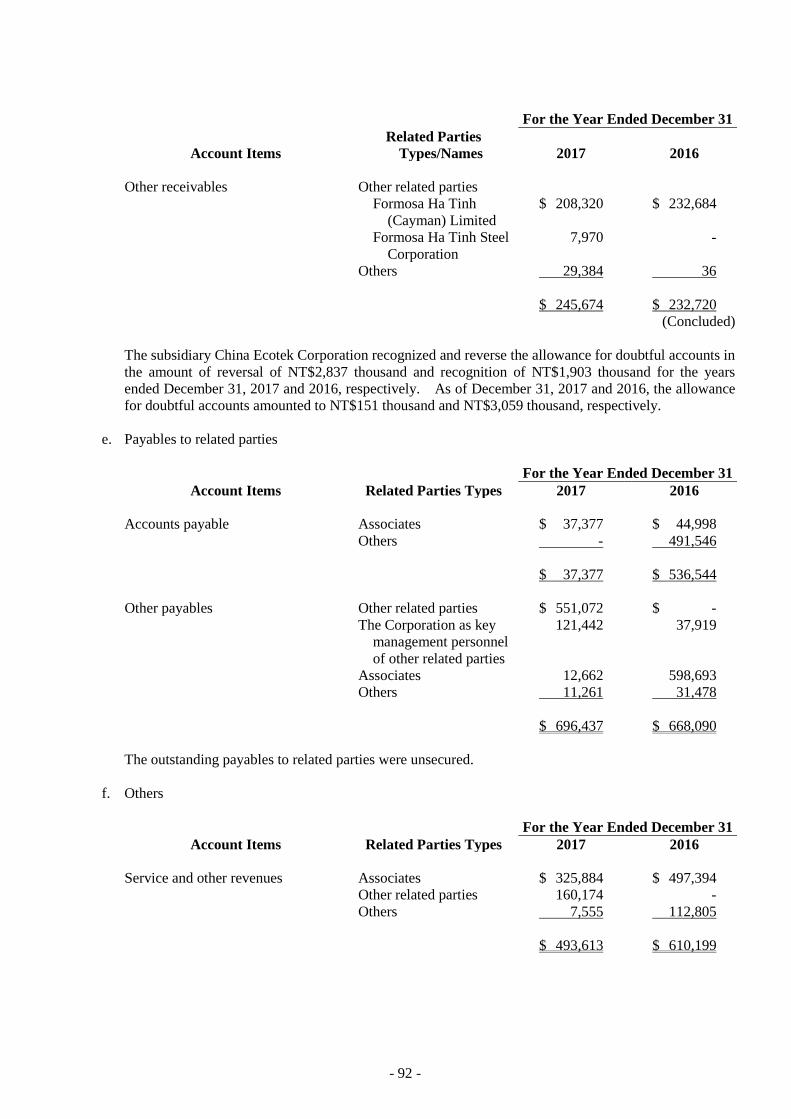
- 92 -
For the Year Ended December 31
Account Items
Related Parties
Types/Names 2017
2016
Other receivables Other related parties
Formosa Ha Tinh
(Cayman) Limited
$ 208,320
$ 232,684
Formosa Ha Tinh Steel
Corporation
7,970
-
Others 29,384 36
$ 245,674 $ 232,720
(Concluded)
The subsidiary China Ecotek Corporation recognized and reverse the allowance for doubtful accounts in
the amount of reversal of NT$2,837 thousand and recognition of NT$1,903 thousand for the years
ended December 31, 2017 and 2016, respectively. As of December 31, 2017 and 2016, the allowance
for doubtful accounts amounted to NT$151 thousand and NT$3,059 thousand, respectively.
e. Payables to related parties
For the Year Ended December 31
Account Items Related Parties Types 2017 2016
Accounts payable Associates $ 37,377 $ 44,998
Others - 491,546
$ 37,377 $ 536,544
Other payables Other related parties $ 551,072 $ -
The Corporation as key
management personnel
of other related parties
121,442
37,919
Associates 12,662 598,693
Others 11,261 31,478
$ 696,437 $ 668,090
The outstanding payables to related parties were unsecured.
f. Others
For the Year Ended December 31
Account Items Related Parties Types 2017 2016
Service and other revenues Associates $ 325,884 $ 497,394
Other related parties 160,174 -
Others 7,555 112,805
$ 493,613 $ 610,199
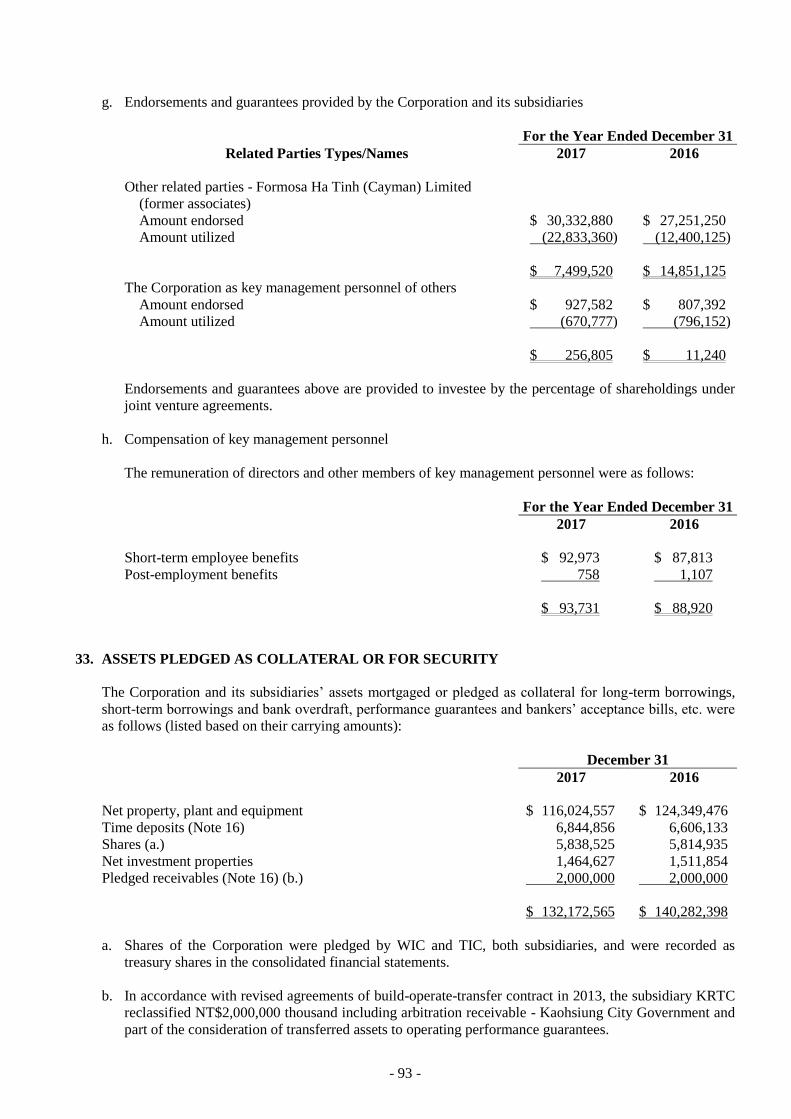
- 93 -
g. Endorsements and guarantees provided by the Corporation and its subsidiaries
For the Year Ended December 31
Related Parties Types/Names 2017 2016
Other related parties - Formosa Ha Tinh (Cayman) Limited
(former associates)
Amount endorsed $ 30,332,880 $ 27,251,250
Amount utilized (22,833,360) (12,400,125)
$ 7,499,520 $ 14,851,125
The Corporation as key management personnel of others
Amount endorsed $ 927,582 $ 807,392
Amount utilized (670,777) (796,152)
$ 256,805 $ 11,240
Endorsements and guarantees above are provided to investee by the percentage of shareholdings under
joint venture agreements.
h. Compensation of key management personnel
The remuneration of directors and other members of key management personnel were as follows:
For the Year Ended December 31
2017 2016
Short-term employee benefits $ 92,973 $ 87,813
Post-employment benefits 758 1,107
$ 93,731 $ 88,920
33. ASSETS PLEDGED AS COLLATERAL OR FOR SECURITY
The Corporation and its subsidiaries’ assets mortgaged or pledged as collateral for long-term borrowings,
short-term borrowings and bank overdraft, performance guarantees and bankers’ acceptance bills, etc. were
as follows (listed based on their carrying amounts):
December 31
2017 2016
Net property, plant and equipment $ 116,024,557 $ 124,349,476
Time deposits (Note 16) 6,844,856 6,606,133
Shares (a.) 5,838,525 5,814,935
Net investment properties 1,464,627 1,511,854
Pledged receivables (Note 16) (b.) 2,000,000 2,000,000
$ 132,172,565 $ 140,282,398
a. Shares of the Corporation were pledged by WIC and TIC, both subsidiaries, and were recorded as
treasury shares in the consolidated financial statements.
b. In accordance with revised agreements of build-operate-transfer contract in 2013, the subsidiary KRTC
reclassified NT$2,000,000 thousand including arbitration receivable - Kaohsiung City Government and
part of the consideration of transferred assets to operating performance guarantees.
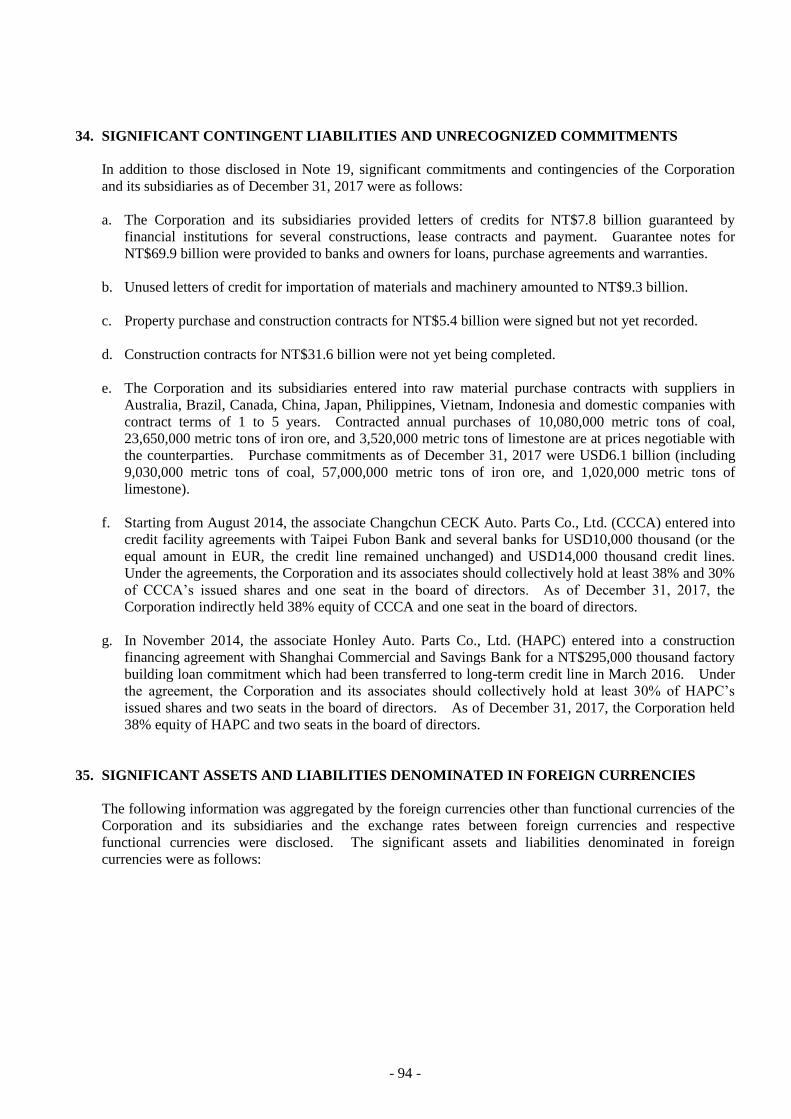
- 94 -
34. SIGNIFICANT CONTINGENT LIABILITIES AND UNRECOGNIZED COMMITMENTS
In addition to those disclosed in Note 19, significant commitments and contingencies of the Corporation
and its subsidiaries as of December 31, 2017 were as follows:
a. The Corporation and its subsidiaries provided letters of credits for NT$7.8 billion guaranteed by
financial institutions for several constructions, lease contracts and payment. Guarantee notes for
NT$69.9 billion were provided to banks and owners for loans, purchase agreements and warranties.
b. Unused letters of credit for importation of materials and machinery amounted to NT$9.3 billion.
c. Property purchase and construction contracts for NT$5.4 billion were signed but not yet recorded.
d. Construction contracts for NT$31.6 billion were not yet being completed.
e. The Corporation and its subsidiaries entered into raw material purchase contracts with suppliers in
Australia, Brazil, Canada, China, Japan, Philippines, Vietnam, Indonesia and domestic companies with
contract terms of 1 to 5 years. Contracted annual purchases of 10,080,000 metric tons of coal,
23,650,000 metric tons of iron ore, and 3,520,000 metric tons of limestone are at prices negotiable with
the counterparties. Purchase commitments as of December 31, 2017 were USD6.1 billion (including
9,030,000 metric tons of coal, 57,000,000 metric tons of iron ore, and 1,020,000 metric tons of
limestone).
f. Starting from August 2014, the associate Changchun CECK Auto. Parts Co., Ltd. (CCCA) entered into
credit facility agreements with Taipei Fubon Bank and several banks for USD10,000 thousand (or the
equal amount in EUR, the credit line remained unchanged) and USD14,000 thousand credit lines.
Under the agreements, the Corporation and its associates should collectively hold at least 38% and 30%
of CCCA’s issued shares and one seat in the board of directors. As of December 31, 2017, the
Corporation indirectly held 38% equity of CCCA and one seat in the board of directors.
g. In November 2014, the associate Honley Auto. Parts Co., Ltd. (HAPC) entered into a construction
financing agreement with Shanghai Commercial and Savings Bank for a NT$295,000 thousand factory
building loan commitment which had been transferred to long-term credit line in March 2016. Under
the agreement, the Corporation and its associates should collectively hold at least 30% of HAPC’s
issued shares and two seats in the board of directors. As of December 31, 2017, the Corporation held
38% equity of HAPC and two seats in the board of directors.
35. SIGNIFICANT ASSETS AND LIABILITIES DENOMINATED IN FOREIGN CURRENCIES
The following information was aggregated by the foreign currencies other than functional currencies of the
Corporation and its subsidiaries and the exchange rates between foreign currencies and respective
functional currencies were disclosed. The significant assets and liabilities denominated in foreign
currencies were as follows:
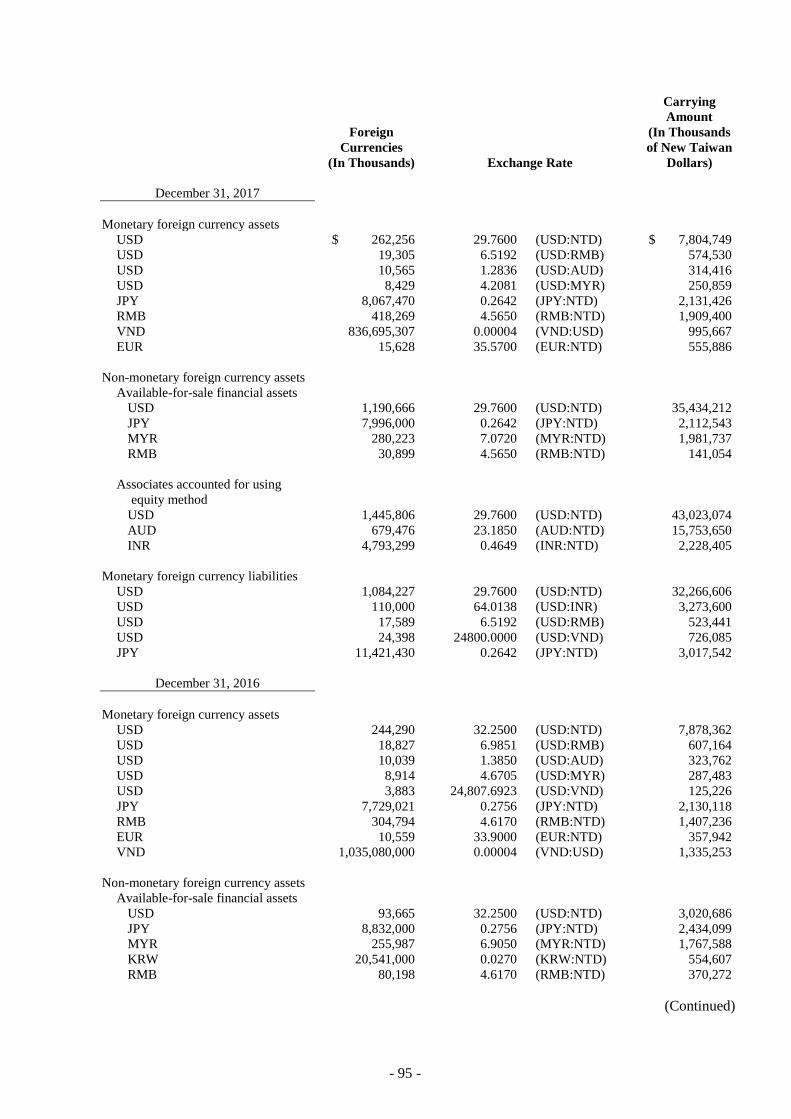
- 95 -
Foreign
Currencies
(In Thousands) Exchange Rate
Carrying
Amount
(In Thousands
of New Taiwan
Dollars)
December 31, 2017
Monetary foreign currency assets
USD $ 262,256 29.7600 (USD:NTD) $ 7,804,749
USD 19,305 6.5192 (USD:RMB) 574,530
USD 10,565 1.2836 (USD:AUD) 314,416
USD 8,429 4.2081 (USD:MYR) 250,859
JPY 8,067,470 0.2642 (JPY:NTD) 2,131,426
RMB 418,269 4.5650 (RMB:NTD) 1,909,400
VND 836,695,307 0.00004 (VND:USD) 995,667
EUR 15,628 35.5700 (EUR:NTD) 555,886
Non-monetary foreign currency assets
Available-for-sale financial assets
USD 1,190,666 29.7600 (USD:NTD) 35,434,212
JPY 7,996,000 0.2642 (JPY:NTD) 2,112,543
MYR 280,223 7.0720 (MYR:NTD) 1,981,737
RMB 30,899 4.5650 (RMB:NTD) 141,054
Associates accounted for using
equity method
USD 1,445,806 29.7600 (USD:NTD) 43,023,074
AUD 679,476 23.1850 (AUD:NTD) 15,753,650
INR 4,793,299 0.4649 (INR:NTD) 2,228,405
Monetary foreign currency liabilities
USD 1,084,227 29.7600 (USD:NTD) 32,266,606
USD 110,000 64.0138 (USD:INR) 3,273,600
USD 17,589 6.5192 (USD:RMB) 523,441
USD 24,398 24800.0000 (USD:VND) 726,085
JPY 11,421,430 0.2642 (JPY:NTD) 3,017,542
December 31, 2016
Monetary foreign currency assets
USD 244,290 32.2500 (USD:NTD) 7,878,362
USD 18,827 6.9851 (USD:RMB) 607,164
USD 10,039 1.3850 (USD:AUD) 323,762
USD 8,914 4.6705 (USD:MYR) 287,483
USD 3,883 24,807.6923 (USD:VND) 125,226
JPY 7,729,021 0.2756 (JPY:NTD) 2,130,118
RMB 304,794 4.6170 (RMB:NTD) 1,407,236
EUR 10,559 33.9000 (EUR:NTD) 357,942
VND 1,035,080,000 0.00004 (VND:USD) 1,335,253
Non-monetary foreign currency assets
Available-for-sale financial assets
USD 93,665 32.2500 (USD:NTD) 3,020,686
JPY 8,832,000 0.2756 (JPY:NTD) 2,434,099
MYR 255,987 6.9050 (MYR:NTD) 1,767,588
KRW 20,541,000 0.0270 (KRW:NTD) 554,607
RMB 80,198 4.6170 (RMB:NTD) 370,272
(Continued)
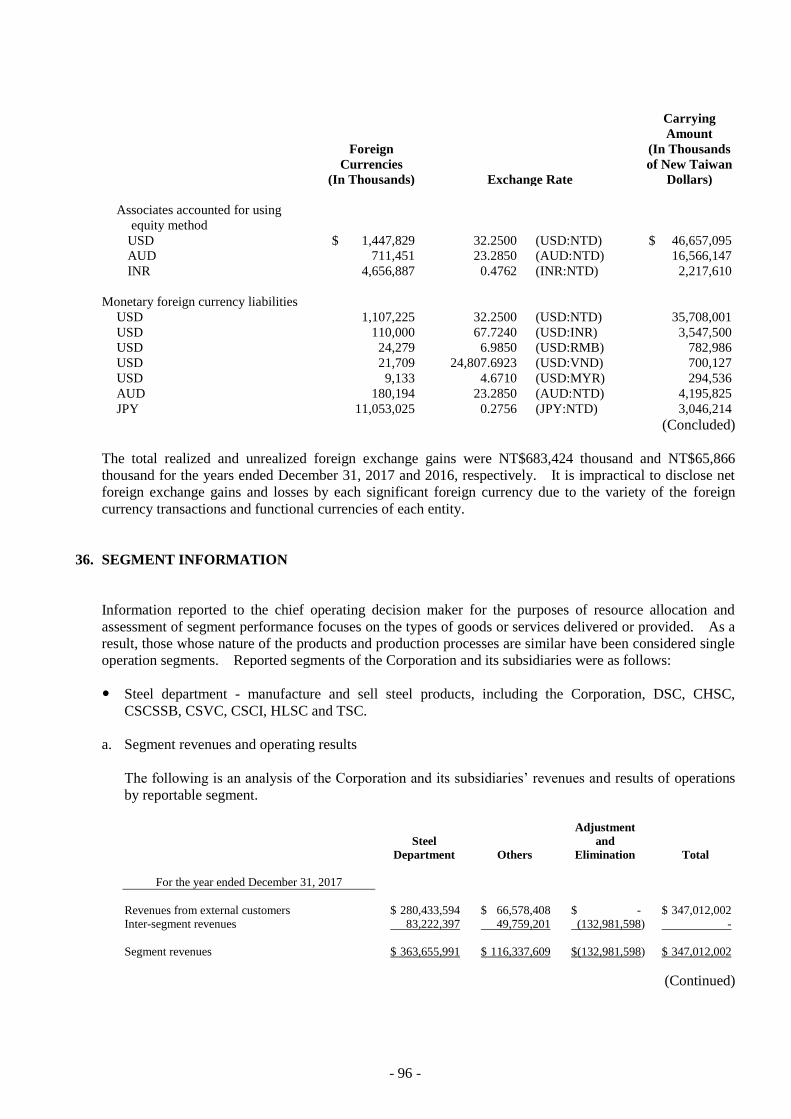
- 96 -
Foreign
Currencies
(In Thousands) Exchange Rate
Carrying
Amount
(In Thousands
of New Taiwan
Dollars)
Associates accounted for using
equity method
USD $ 1,447,829 32.2500 (USD:NTD) $ 46,657,095
AUD 711,451 23.2850 (AUD:NTD) 16,566,147
INR 4,656,887 0.4762 (INR:NTD) 2,217,610
Monetary foreign currency liabilities
USD 1,107,225 32.2500 (USD:NTD) 35,708,001
USD 110,000 67.7240 (USD:INR) 3,547,500
USD 24,279 6.9850 (USD:RMB) 782,986
USD 21,709 24,807.6923 (USD:VND) 700,127
USD 9,133 4.6710 (USD:MYR) 294,536
AUD 180,194 23.2850 (AUD:NTD) 4,195,825
JPY 11,053,025 0.2756 (JPY:NTD) 3,046,214
(Concluded)
The total realized and unrealized foreign exchange gains were NT$683,424 thousand and NT$65,866
thousand for the years ended December 31, 2017 and 2016, respectively. It is impractical to disclose net
foreign exchange gains and losses by each significant foreign currency due to the variety of the foreign
currency transactions and functional currencies of each entity.
36. SEGMENT INFORMATION
Information reported to the chief operating decision maker for the purposes of resource allocation and
assessment of segment performance focuses on the types of goods or services delivered or provided. As a
result, those whose nature of the products and production processes are similar have been considered single
operation segments. Reported segments of the Corporation and its subsidiaries were as follows:
Steel department - manufacture and sell steel products, including the Corporation, DSC, CHSC,
CSCSSB, CSVC, CSCI, HLSC and TSC.
a. Segment revenues and operating results
The following is an analysis of the Corporation and its subsidiaries’ revenues and results of operations
by reportable segment.
Steel
Department
Others
Adjustment
and
Elimination
Total
For the year ended December 31, 2017
Revenues from external customers $ 280,433,594 $ 66,578,408 $ - $ 347,012,002
Inter-segment revenues 83,222,397 49,759,201 (132,981,598) -
Segment revenues $ 363,655,991 $ 116,337,609 $(132,981,598) $ 347,012,002
(Continued)
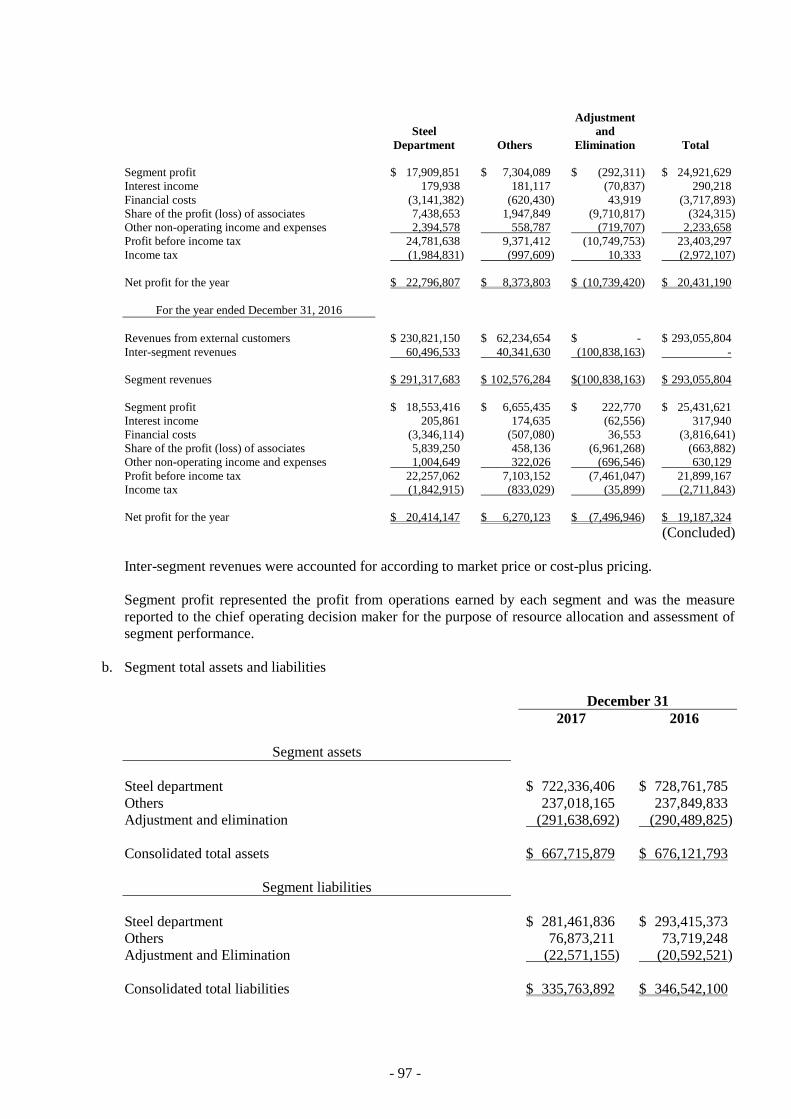
- 97 -
Steel
Department
Others
Adjustment
and
Elimination
Total
Segment profit $ 17,909,851 $ 7,304,089 $ (292,311) $ 24,921,629
Interest income 179,938 181,117 (70,837) 290,218
Financial costs (3,141,382) (620,430) 43,919 (3,717,893)
Share of the profit (loss) of associates 7,438,653 1,947,849 (9,710,817) (324,315)
Other non-operating income and expenses 2,394,578 558,787 (719,707) 2,233,658
Profit before income tax 24,781,638 9,371,412 (10,749,753) 23,403,297
Income tax (1,984,831) (997,609) 10,333 (2,972,107)
Net profit for the year $ 22,796,807 $ 8,373,803 $ (10,739,420) $ 20,431,190
For the year ended December 31, 2016
Revenues from external customers $ 230,821,150 $ 62,234,654 $ - $ 293,055,804
Inter-segment revenues 60,496,533 40,341,630 (100,838,163) -
Segment revenues $ 291,317,683 $ 102,576,284 $(100,838,163) $ 293,055,804
Segment profit $ 18,553,416 $ 6,655,435 $ 222,770 $ 25,431,621
Interest income 205,861 174,635 (62,556) 317,940
Financial costs (3,346,114) (507,080) 36,553 (3,816,641)
Share of the profit (loss) of associates 5,839,250 458,136 (6,961,268) (663,882)
Other non-operating income and expenses 1,004,649 322,026 (696,546) 630,129
Profit before income tax 22,257,062 7,103,152 (7,461,047) 21,899,167
Income tax (1,842,915) (833,029) (35,899) (2,711,843)
Net profit for the year $ 20,414,147 $ 6,270,123 $ (7,496,946) $ 19,187,324
(Concluded)
Inter-segment revenues were accounted for according to market price or cost-plus pricing.
Segment profit represented the profit from operations earned by each segment and was the measure
reported to the chief operating decision maker for the purpose of resource allocation and assessment of
segment performance.
b. Segment total assets and liabilities
December 31
2017 2016
Segment assets
Steel department $ 722,336,406 $ 728,761,785
Others 237,018,165 237,849,833
Adjustment and elimination (291,638,692) (290,489,825)
Consolidated total assets $ 667,715,879 $ 676,121,793
Segment liabilities
Steel department $ 281,461,836 $ 293,415,373
Others 76,873,211 73,719,248
Adjustment and Elimination (22,571,155) (20,592,521)
Consolidated total liabilities $ 335,763,892 $ 346,542,100
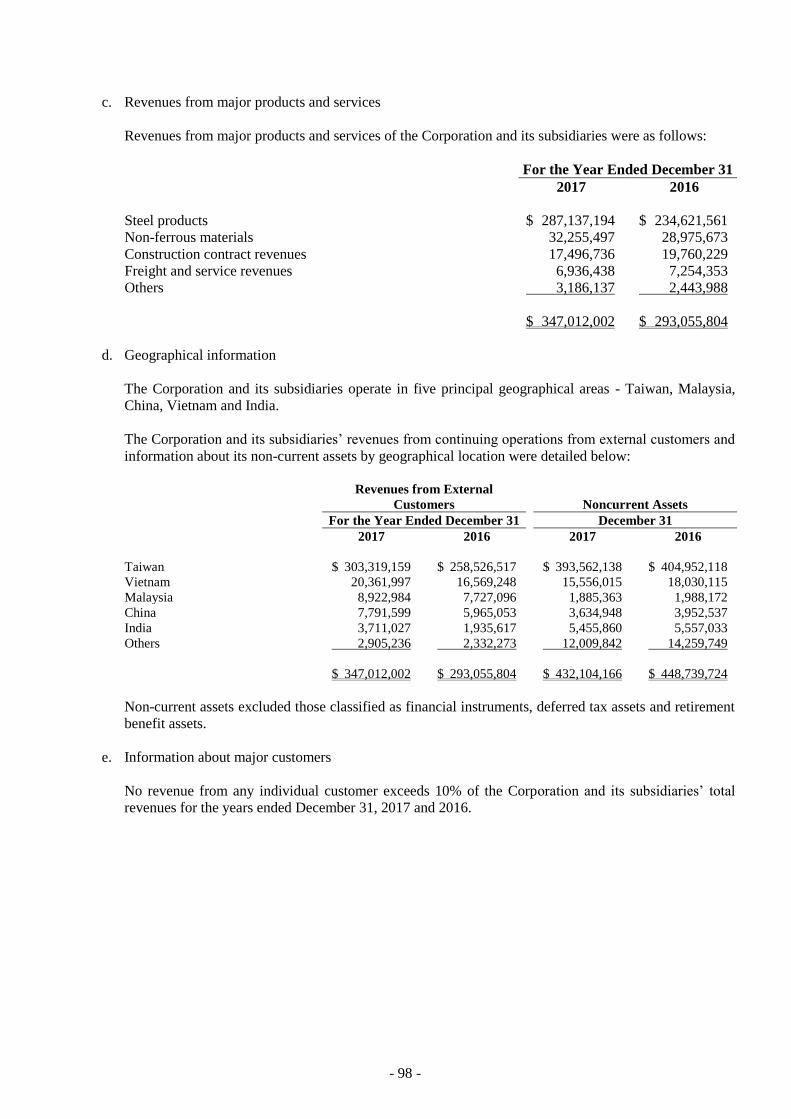
- 98 -
c. Revenues from major products and services
Revenues from major products and services of the Corporation and its subsidiaries were as follows:
For the Year Ended December 31
2017 2016
Steel products $ 287,137,194 $ 234,621,561
Non-ferrous materials 32,255,497 28,975,673
Construction contract revenues 17,496,736 19,760,229
Freight and service revenues 6,936,438 7,254,353
Others 3,186,137 2,443,988
$ 347,012,002 $ 293,055,804
d. Geographical information
The Corporation and its subsidiaries operate in five principal geographical areas - Taiwan, Malaysia,
China, Vietnam and India.
The Corporation and its subsidiaries’ revenues from continuing operations from external customers and
information about its non-current assets by geographical location were detailed below:
Revenues from External
Customers Noncurrent Assets
For the Year Ended December 31 December 31
2017 2016 2017 2016
Taiwan $ 303,319,159 $ 258,526,517 $ 393,562,138 $ 404,952,118
Vietnam 20,361,997 16,569,248 15,556,015 18,030,115
Malaysia 8,922,984 7,727,096 1,885,363 1,988,172
China 7,791,599 5,965,053 3,634,948 3,952,537
India 3,711,027 1,935,617 5,455,860 5,557,033
Others 2,905,236 2,332,273 12,009,842 14,259,749
$ 347,012,002 $ 293,055,804 $ 432,104,166 $ 448,739,724
Non-current assets excluded those classified as financial instruments, deferred tax assets and retirement
benefit assets.
e. Information about major customers
No revenue from any individual customer exceeds 10% of the Corporation and its subsidiaries’ total
revenues for the years ended December 31, 2017 and 2016.