Embed Size (px)
Citation preview
ed-AT / sa- CS /AH
H: BUY
Last Traded Price ( 27 Oct 2021):HK$24.80(HSI : 25,629)
Price Target 12-mth: HK$39.20 (58.1% upside) (Prev
HK$36.90)
A: BUY
Last Traded Price ( 27 Oct 2021):RMB33.53(CSI300 Index : 4,898) Price Target 12-mth: RMB54.00 (61.0% upside) (Prev RMB55.40) Analyst
Tsz-Wang TAM, CFA +852 36684195 [email protected]
Harry Zhuang [email protected]
What’s New • 3Q21 net profit increased 107.6% y-o-y, in line
• Gross margin further expanded for carriers’ network
business in 3Q21
• Expect rapid growth in consumer business with strong
sales of home terminals and handset products
• Maintain BUY on ZTE-H with a higher TP of HK$39.2,
attributable to higher margin assumption; maintain BUY
on ZTE-A with a new TP at Rmb54.0
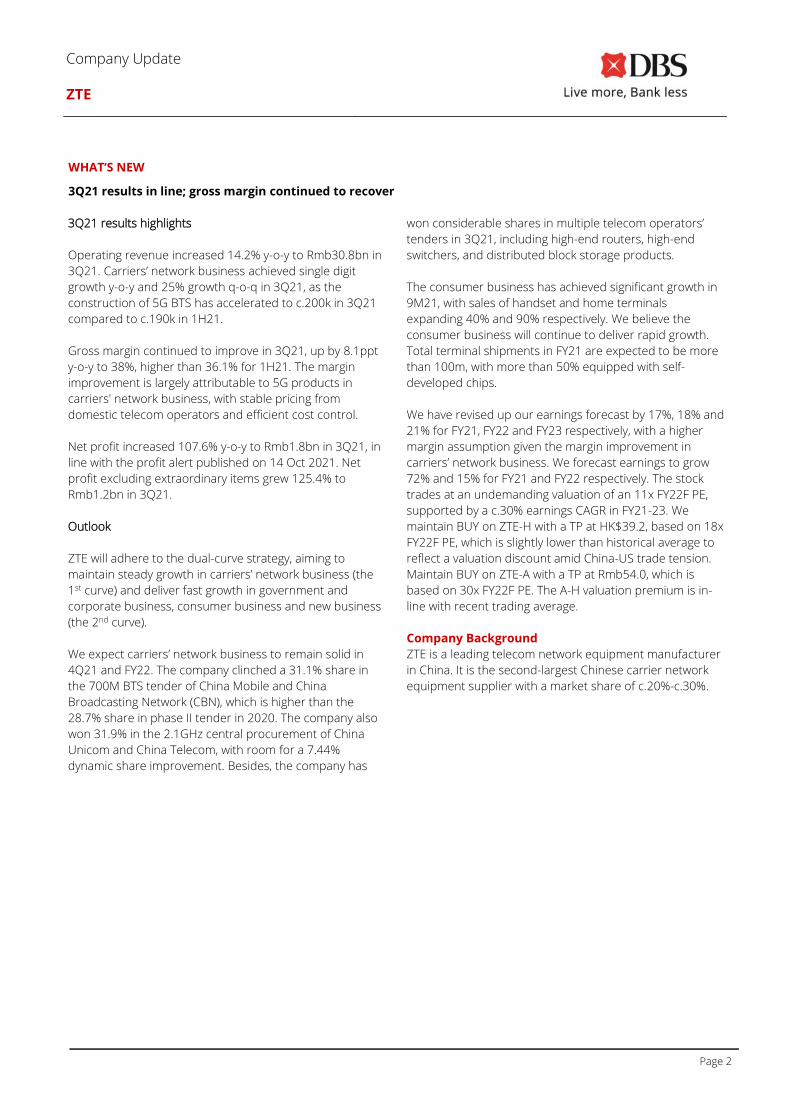
Price Relative
Forecasts and Valuation (H Shares)
FY Dec (RMBm) 2020A 2021F 2022F 2023F Turnover 101,451 117,425 133,526 148,914 EBITDA 9,490 15,804 17,269 19,075 Pre-tax Profit 5,048 9,730 11,194 12,588 Net Profit 4,260 7,317 8,418 9,466 Net Profit Gth (Pre-ex) (%) (17.3) 71.8 15.0 12.5 EPS (RMB) 0.92 1.58 1.82 2.04 EPS (HK$) 1.12 1.92 2.21 2.49 EPS Gth (%) (24.6) 71.8 15.0 12.5 Diluted EPS (HK$) 1.12 1.92 2.21 2.49 DPS (HK$) 0.24 0.42 0.48 0.54 BV Per Share (HK$) 11.37 13.05 14.84 16.85 PE (X) 22.2 12.9 11.2 10.0 P/Cash Flow (X) 9.2 7.6 8.3 7.2 P/Free CF (X) 37.3 20.6 27.5 18.8 EV/EBITDA (X) 10.6 6.2 5.6 5.0 Net Div Yield (%) 1.0 1.7 1.9 2.2 P/Book Value (X) 2.2 1.9 1.7 1.5 Net Debt/Equity (X) 0.1 0.0 CASH CASH ROAE(%) 11.8 15.7 15.9 15.7 Earnings Rev (%): 17 18 21 Consensus EPS (RMB) 1.56 1.77 2.05 Other Broker Recs: B:22 S:1 H:1
Source of all data on this page: Company, DBS Bank (Hong Kong) Limited (“DBS HK”), Thomson Reuters
Back on track Investment Thesis A key beneficiary of 5G network buildouts. We expect 5G base
transceiver stations (BTS) net adds to increase from 600k+ in
2020 to 640k+ in 2021. Expect margin improvement on expanding 5G production scale.
The 5G supply chain scale is small at the initial stage, resulting in
higher production costs. We expect margins to expand along
with technology maturity and an expanding supply chain scale. Pricing pressure from telecom carriers reflected after the 30%+
share price decline in 2020. The stock trades at an
undemanding valuation of an 11x FY22F PE, supported by a
c.30% earnings CAGR in FY21-23. Valuation:
We set our H-ZTE TP at HK$39.2, based 18x FY22F PE, which is slightly lower than historical average to reflect a valuation discount amid China-US trade tension. We set our ZTE-A TP at Rmb54.0, which is based on 30x FY22F PE. The A-H valuation premium is in-line with recent trading average. Where we Differ:
More optimistic on growth of domestic carriers’ network business. The market is concerned about the limited growth potential of domestic carriers’ network business given the stable capex forecast of Chinese telecom operators for next few years. We believe ZTE could maintain steady growth in domestic carriers’ network business by gaining market shares in the addressable market. Key Risks to Our View:
Lower capex budget by Chinese telecom operators, which are
ZTE’s major customers, will lead to slower growth. Co-building and co-sharing by telecom operators. Co-building
and co-sharing a 5G network by China Mobile (CM), China
Telecom (CT), and China Unicom (CU) in more areas will reduce
demand for telecom equipment.
At A Glance
Issued Capital - H shares (m shs) 756
- Non H shrs (m shs) 3,858
H shs as a % of Total 16
Total Mkt Cap (HK$m/US$m) 176,123 / 22,644
Major Shareholders (%)
Zhongxingxin Telecom Co Ltd. 25.9
Major H Shareholders (As % of H shares)
Capital World Investors 5.1
H Shares-Free Float (%) 94.9
3m Avg. Daily Val. (US$m) 28.69
GICS Industry: Information Technology / Technology Hardware &
Equipment
35
55
75
95
115
135
155
175
195
215
8.9
13.9
18.9
23.9
28.9
33.9
38.9
Oct-17 Oct-18 Oct-19 Oct-20 Oct-21
Relative IndexHK$
ZTE (LHS) Relative HSI (RHS)
43
63
83
103
123
143
163
183
203
10.9
20.9
30.9
40.9
50.9
60.9
Oct-17 Oct-18 Oct-19 Oct-20 Oct-21
Relative IndexRMB
ZTE-A (LHS) Relative CSI300 Index (RHS)
DBS Group Research . Equity
28 Oct 2021
China/Hong Kong Company Update
ZTE Bloomberg: 763 HK EQUITY | 000063 CH Equity | Reuters: 0763.HK | 000063.SZ
Refer to important disclosures at the end of this report.
Page 2
Company Update
ZTE
WHAT’S NEW
3Q21 results in line; gross margin continued to recover
3Q21 results highlights
Operating revenue increased 14.2% y-o-y to Rmb30.8bn in
3Q21. Carriers’ network business achieved single digit
growth y-o-y and 25% growth q-o-q in 3Q21, as the
construction of 5G BTS has accelerated to c.200k in 3Q21
compared to c.190k in 1H21.
Gross margin continued to improve in 3Q21, up by 8.1ppt
y-o-y to 38%, higher than 36.1% for 1H21. The margin
improvement is largely attributable to 5G products in
carriers' network business, with stable pricing from
domestic telecom operators and efficient cost control.
Net profit increased 107.6% y-o-y to Rmb1.8bn in 3Q21, in
line with the profit alert published on 14 Oct 2021. Net
profit excluding extraordinary items grew 125.4% to
Rmb1.2bn in 3Q21.
Outlook
ZTE will adhere to the dual-curve strategy, aiming to
maintain steady growth in carriers’ network business (the
1st curve) and deliver fast growth in government and
corporate business, consumer business and new business
(the 2nd curve).
We expect carriers’ network business to remain solid in
4Q21 and FY22. The company clinched a 31.1% share in
the 700M BTS tender of China Mobile and China
Broadcasting Network (CBN), which is higher than the
28.7% share in phase II tender in 2020. The company also
won 31.9% in the 2.1GHz central procurement of China
Unicom and China Telecom, with room for a 7.44%
dynamic share improvement. Besides, the company has
won considerable shares in multiple telecom operators’
tenders in 3Q21, including high-end routers, high-end
switchers, and distributed block storage products.
The consumer business has achieved significant growth in
9M21, with sales of handset and home terminals
expanding 40% and 90% respectively. We believe the
consumer business will continue to deliver rapid growth.
Total terminal shipments in FY21 are expected to be more
than 100m, with more than 50% equipped with self-
developed chips.
We have revised up our earnings forecast by 17%, 18% and
21% for FY21, FY22 and FY23 respectively, with a higher
margin assumption given the margin improvement in
carriers’ network business. We forecast earnings to grow
72% and 15% for FY21 and FY22 respectively. The stock
trades at an undemanding valuation of an 11x FY22F PE,
supported by a c.30% earnings CAGR in FY21-23. We
maintain BUY on ZTE-H with a TP at HK$39.2, based on 18x
FY22F PE, which is slightly lower than historical average to
reflect a valuation discount amid China-US trade tension.
Maintain BUY on ZTE-A with a TP at Rmb54.0, which is
based on 30x FY22F PE. The A-H valuation premium is in-
line with recent trading average.
Company Background
ZTE is a leading telecom network equipment manufacturer
in China. It is the second-largest Chinese carrier network
equipment supplier with a market share of c.20%-c.30%.
Page 3
Company Update
ZTE
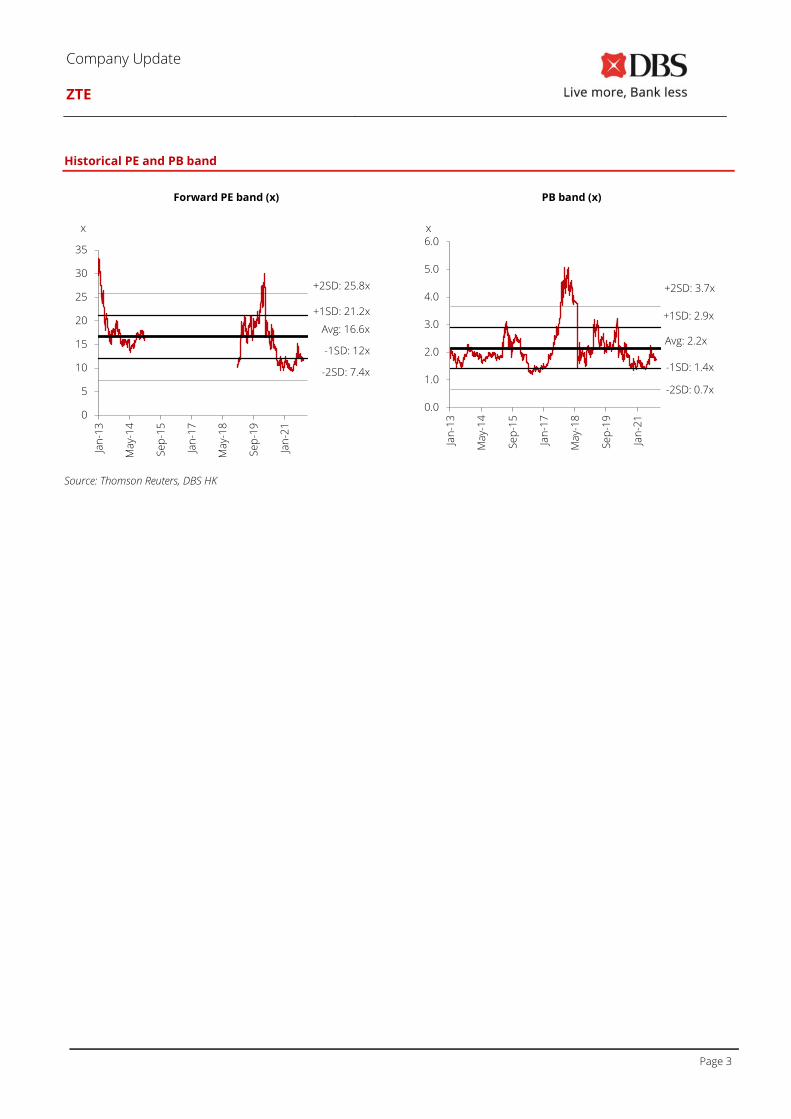
Historical PE and PB band
Forward PE band (x) PB band (x)
Source: Thomson Reuters, DBS HK
0
5
10
15
20
25
30
35
Jan
-13
Ma
y-1
4
Se
p-1
5
Jan
-17
Ma
y-1
8
Se
p-1
9
Jan
-21
x
Avg: 16.6x
+1SD: 21.2x
-1SD: 12x
+2SD: 25.8x
-2SD: 7.4x
0.0
1.0
2.0
3.0
4.0
5.0
6.0
Jan
-13
Ma
y-1
4
Se
p-1
5
Jan
-17
Ma
y-1
8
Se
p-1
9
Jan
-21
x
Avg: 2.2x
+1SD: 2.9x
-1SD: 1.4x
+2SD: 3.7x
-2SD: 0.7x
Page 4
Company Update
ZTE
Key Assumptions
FY Dec 2019A 2020A 2021F 2022F 2023F
Sales growth of carriers'
networks (%) 16.7 11.2 5.0 8.0 8.0
Gross Margin % 37.2 31.6 36.5 36.0 35.8
Sales growth of
consumer products (%) (21.9) 7.8 62.0 30.0 20.0
Source: Company, DBS HK
Segmental Breakdown (RMB m)
FY Dec 2019A 2020A 2021F 2022F 2023F
Revenues (RMB m)
Carriers' networks 66,584 74,018 77,719 83,937 90,652
Government and
corporate 9,155 11,272 13,527 15,556 17,422
Consumer 14,997 16,160 26,180 34,034 40,840
Total 90,737 101,451 117,425 133,526 148,914
Source: Company, DBS HK
Page 5
Company Update
ZTE
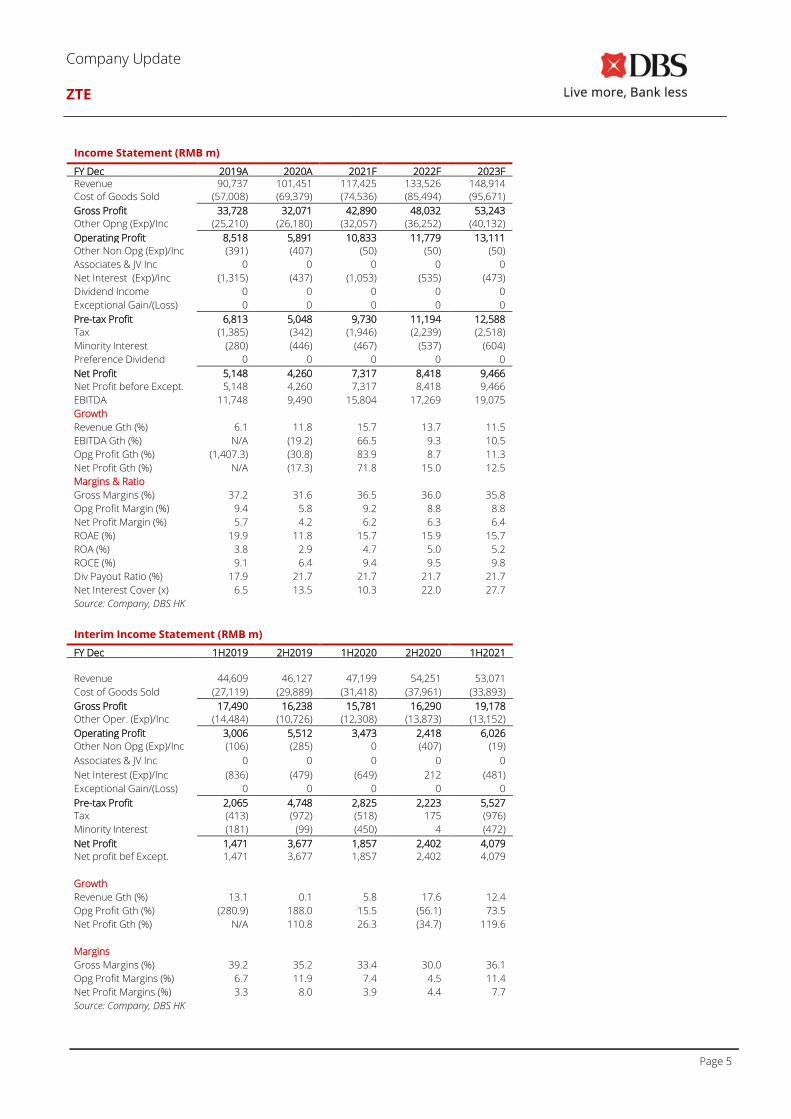
Income Statement (RMB m) FY Dec 2019A 2020A 2021F 2022F 2023F Revenue 90,737 101,451 117,425 133,526 148,914
Cost of Goods Sold (57,008) (69,379) (74,536) (85,494) (95,671)
Gross Profit 33,728 32,071 42,890 48,032 53,243
Other Opng (Exp)/Inc (25,210) (26,180) (32,057) (36,252) (40,132)
Operating Profit 8,518 5,891 10,833 11,779 13,111
Other Non Opg (Exp)/Inc (391) (407) (50) (50) (50)
Associates & JV Inc 0 0 0 0 0
Net Interest (Exp)/Inc (1,315) (437) (1,053) (535) (473)
Dividend Income 0 0 0 0 0
Exceptional Gain/(Loss) 0 0 0 0 0
Pre-tax Profit 6,813 5,048 9,730 11,194 12,588
Tax (1,385) (342) (1,946) (2,239) (2,518)
Minority Interest (280) (446) (467) (537) (604)
Preference Dividend 0 0 0 0 0
Net Profit 5,148 4,260 7,317 8,418 9,466
Net Profit before Except. 5,148 4,260 7,317 8,418 9,466
EBITDA 11,748 9,490 15,804 17,269 19,075
Growth
Revenue Gth (%) 6.1 11.8 15.7 13.7 11.5
EBITDA Gth (%) N/A (19.2) 66.5 9.3 10.5
Opg Profit Gth (%) (1,407.3) (30.8) 83.9 8.7 11.3
Net Profit Gth (%) N/A (17.3) 71.8 15.0 12.5
Margins & Ratio
Gross Margins (%) 37.2 31.6 36.5 36.0 35.8
Opg Profit Margin (%) 9.4 5.8 9.2 8.8 8.8
Net Profit Margin (%) 5.7 4.2 6.2 6.3 6.4
ROAE (%) 19.9 11.8 15.7 15.9 15.7
ROA (%) 3.8 2.9 4.7 5.0 5.2
ROCE (%) 9.1 6.4 9.4 9.5 9.8
Div Payout Ratio (%) 17.9 21.7 21.7 21.7 21.7
Net Interest Cover (x) 6.5 13.5 10.3 22.0 27.7
Source: Company, DBS HK
Interim Income Statement (RMB m)
FY Dec 1H2019 2H2019 1H2020 2H2020 1H2021
Revenue 44,609 46,127 47,199 54,251 53,071
Cost of Goods Sold (27,119) (29,889) (31,418) (37,961) (33,893)
Gross Profit 17,490 16,238 15,781 16,290 19,178
Other Oper. (Exp)/Inc (14,484) (10,726) (12,308) (13,873) (13,152)
Operating Profit 3,006 5,512 3,473 2,418 6,026
Other Non Opg (Exp)/Inc (106) (285) 0 (407) (19)
Associates & JV Inc 0 0 0 0 0
Net Interest (Exp)/Inc (836) (479) (649) 212 (481)
Exceptional Gain/(Loss) 0 0 0 0 0
Pre-tax Profit 2,065 4,748 2,825 2,223 5,527
Tax (413) (972) (518) 175 (976)
Minority Interest (181) (99) (450) 4 (472)
Net Profit 1,471 3,677 1,857 2,402 4,079
Net profit bef Except. 1,471 3,677 1,857 2,402 4,079
Growth
Revenue Gth (%) 13.1 0.1 5.8 17.6 12.4
Opg Profit Gth (%) (280.9) 188.0 15.5 (56.1) 73.5
Net Profit Gth (%) N/A 110.8 26.3 (34.7) 119.6
Margins
Gross Margins (%) 39.2 35.2 33.4 30.0 36.1
Opg Profit Margins (%) 6.7 11.9 7.4 4.5 11.4
Net Profit Margins (%) 3.3 8.0 3.9 4.4 7.7
Source: Company, DBS HK
Page 6
Company Update
ZTE
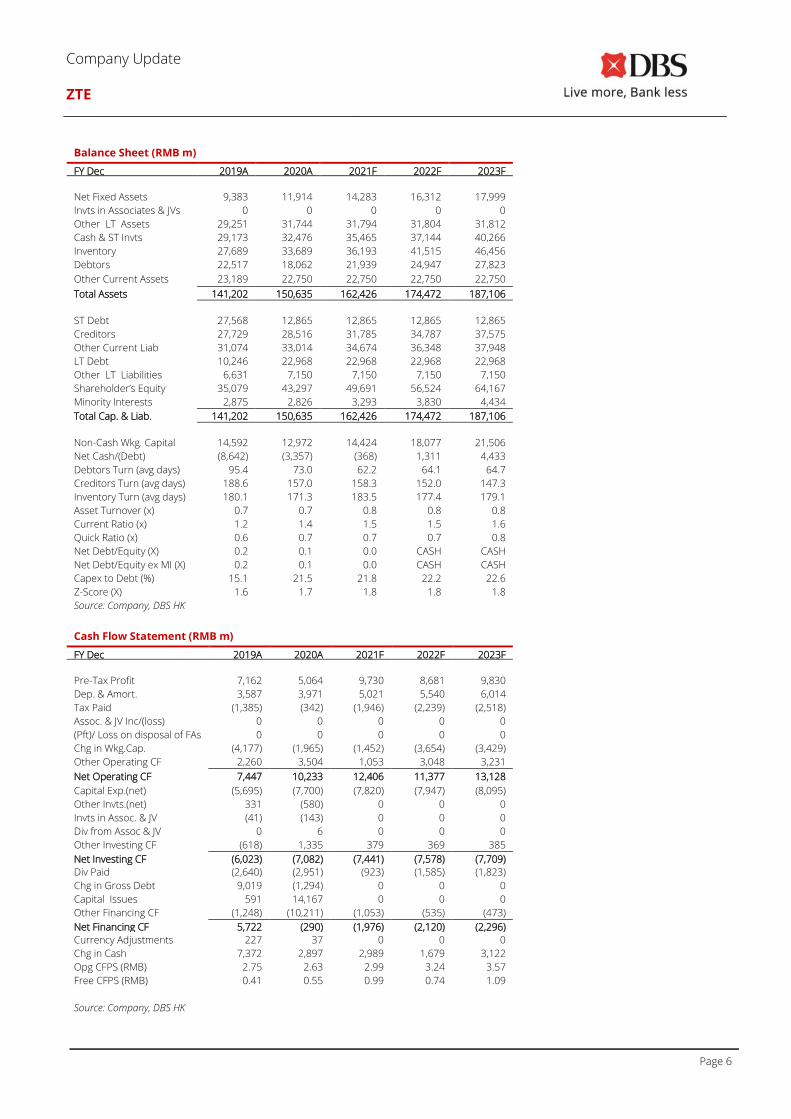
Balance Sheet (RMB m)
FY Dec 2019A 2020A 2021F 2022F 2023F
Net Fixed Assets 9,383 11,914 14,283 16,312 17,999
Invts in Associates & JVs 0 0 0 0 0
Other LT Assets 29,251 31,744 31,794 31,804 31,812
Cash & ST Invts 29,173 32,476 35,465 37,144 40,266
Inventory 27,689 33,689 36,193 41,515 46,456
Debtors 22,517 18,062 21,939 24,947 27,823
Other Current Assets 23,189 22,750 22,750 22,750 22,750
Total Assets 141,202 150,635 162,426 174,472 187,106
ST Debt
27,568 12,865 12,865 12,865 12,865
Creditors 27,729 28,516 31,785 34,787 37,575
Other Current Liab 31,074 33,014 34,674 36,348 37,948
LT Debt 10,246 22,968 22,968 22,968 22,968
Other LT Liabilities 6,631 7,150 7,150 7,150 7,150
Shareholder’s Equity 35,079 43,297 49,691 56,524 64,167
Minority Interests 2,875 2,826 3,293 3,830 4,434
Total Cap. & Liab. 141,202 150,635 162,426 174,472 187,106
Non-Cash Wkg. Capital 14,592 12,972 14,424 18,077 21,506
Net Cash/(Debt) (8,642) (3,357) (368) 1,311 4,433
Debtors Turn (avg days) 95.4 73.0 62.2 64.1 64.7
Creditors Turn (avg days) 188.6 157.0 158.3 152.0 147.3
Inventory Turn (avg days) 180.1 171.3 183.5 177.4 179.1
Asset Turnover (x) 0.7 0.7 0.8 0.8 0.8
Current Ratio (x) 1.2 1.4 1.5 1.5 1.6
Quick Ratio (x) 0.6 0.7 0.7 0.7 0.8
Net Debt/Equity (X) 0.2 0.1 0.0 CASH CASH
Net Debt/Equity ex MI (X) 0.2 0.1 0.0 CASH CASH
Capex to Debt (%) 15.1 21.5 21.8 22.2 22.6
Z-Score (X) 1.6 1.7 1.8 1.8 1.8
Source: Company, DBS HK
Cash Flow Statement (RMB m)
FY Dec 2019A 2020A 2021F 2022F 2023F
Pre-Tax Profit 7,162 5,064 9,730 8,681 9,830
Dep. & Amort. 3,587 3,971 5,021 5,540 6,014
Tax Paid (1,385) (342) (1,946) (2,239) (2,518)
Assoc. & JV Inc/(loss) 0 0 0 0 0
(Pft)/ Loss on disposal of FAs 0 0 0 0 0
Chg in Wkg.Cap. (4,177) (1,965) (1,452) (3,654) (3,429)
Other Operating CF 2,260 3,504 1,053 3,048 3,231
Net Operating CF 7,447 10,233 12,406 11,377 13,128
Capital Exp.(net) (5,695) (7,700) (7,820) (7,947) (8,095)
Other Invts.(net) 331 (580) 0 0 0
Invts in Assoc. & JV (41) (143) 0 0 0
Div from Assoc & JV 0 6 0 0 0
Other Investing CF (618) 1,335 379 369 385
Net Investing CF (6,023) (7,082) (7,441) (7,578) (7,709)
Div Paid (2,640) (2,951) (923) (1,585) (1,823)
Chg in Gross Debt 9,019 (1,294) 0 0 0
Capital Issues 591 14,167 0 0 0
Other Financing CF (1,248) (10,211) (1,053) (535) (473)
Net Financing CF 5,722 (290) (1,976) (2,120) (2,296)
Currency Adjustments 227 37 0 0 0
Chg in Cash 7,372 2,897 2,989 1,679 3,122
Opg CFPS (RMB) 2.75 2.63 2.99 3.24 3.57
Free CFPS (RMB) 0.41 0.55 0.99 0.74 1.09
Source: Company, DBS HK
Page 7
Company Update
ZTE
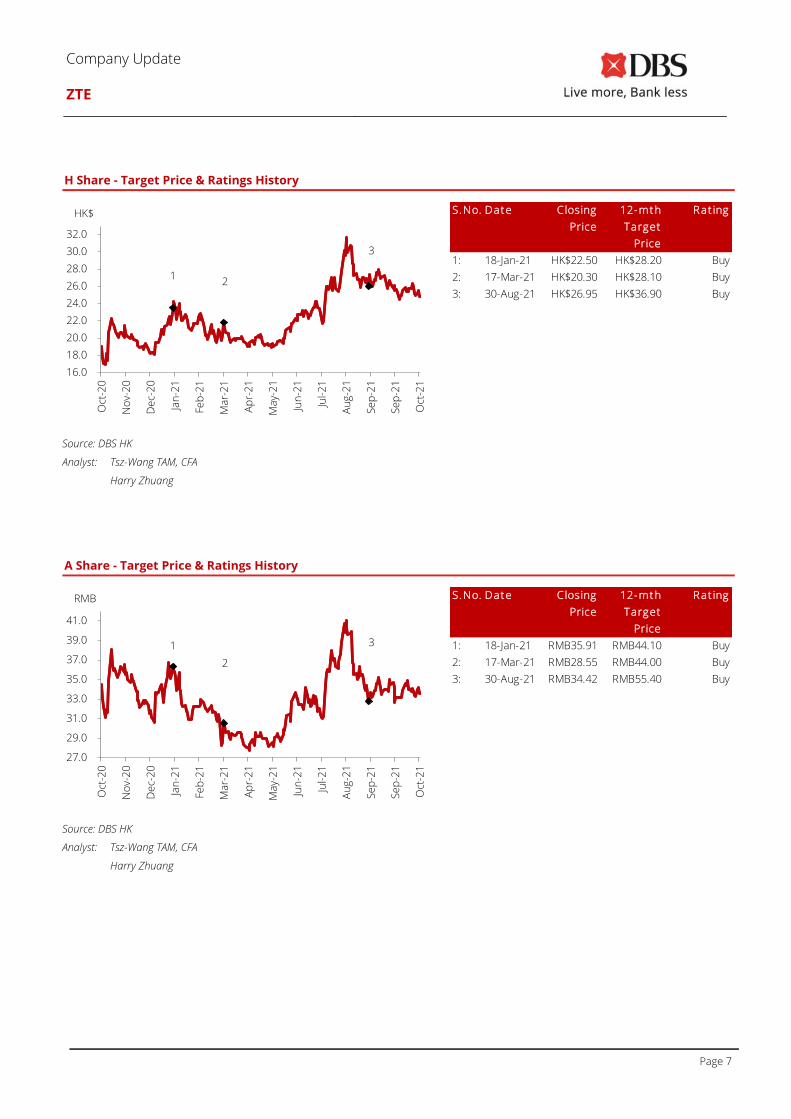
H Share - Target Price & Ratings History
Source: DBS HK
Analyst: Tsz-Wang TAM, CFA
Harry Zhuang
A Share - Target Price & Ratings History
Source: DBS HK
Analyst: Tsz-Wang TAM, CFA
Harry Zhuang
12
3
16.0
18.0
20.0
22.0
24.0
26.0
28.0
30.0
32.0
Oct
-20
No
v-2
0
De
c-2
0
Jan
-21
Feb
-21
Ma
r-2
1
Ap
r-2
1
Ma
y-2
1
Jun
-21
Jul-
21
Au
g-2
1
Se
p-2
1
Se
p-2
1
Oct
-21
HK$ S.No. Date Closing 12-mth Rat ing
Price Target
Price
1: 18-Jan-21 HK$22.50 HK$28.20 Buy
2: 17-Mar-21 HK$20.30 HK$28.10 Buy
3: 30-Aug-21 HK$26.95 HK$36.90 Buy
1
2
3
27.0
29.0
31.0
33.0
35.0
37.0
39.0
41.0
Oct
-20
No
v-2
0
De
c-2
0
Jan
-21
Feb
-21
Ma
r-2
1
Ap
r-2
1
Ma
y-2
1
Jun
-21
Jul-
21
Au
g-2
1
Se
p-2
1
Se
p-2
1
Oct
-21
RMB S.No. Date Closing 12-mth Rat ing
Price Target
Price
1: 18-Jan-21 RMB35.91 RMB44.10 Buy
2: 17-Mar-21 RMB28.55 RMB44.00 Buy
3: 30-Aug-21 RMB34.42 RMB55.40 Buy
Page 8
Company Update
ZTE
DBS HK recommendations are based on an Absolute Total Return* Rating system, defined as follows:
STRONG BUY (>20% total return over the next 3 months, with identifiable share price catalysts within this time frame)
BUY (>15% total return over the next 12 months for small caps, >10% for large caps)
HOLD (-10% to +15% total return over the next 12 months for small caps, -10% to +10% for large caps)
FULLY VALUED (negative total return, i.e., > -10% over the next 12 months)
SELL (negative total return of > -20% over the next 3 months, with identifiable share price catalysts within this time frame)
*Share price appreciation + dividends
Completed Date: 28 Oct 2021 16:34:41 (HKT)
Dissemination Date: 28 Oct 2021 17:38:04 (HKT) Sources for all charts and tables are DBS HK unless otherwise specified. GENERAL DISCLOSURE/DISCLAIMER This report is prepared by DBS Bank (Hong Kong) Limited (“DBS HK”). This report is solely intended for the clients of DBS Bank Ltd., DBS HK,
DBS Vickers (Hong Kong) Limited (“DBSV HK”), and DBS Vickers Securities (Singapore) Pte Ltd. (“DBSVS”), its respective connected and
associated corporations and affiliates only and no part of this document may be (i) copied, photocopied or duplicated in any form or by any
means or (ii) redistributed without the prior written consent of DBS HK. The research set out in this report is based on information obtained from sources believed to be reliable, but we (which collectively refers to
DBS Bank Ltd., DBS HK, DBSV HK, DBSVS, its respective connected and associated corporations, affiliates and their respective directors,
officers, employees and agents (collectively, the “DBS Group”) have not conducted due diligence on any of the companies, verified any
information or sources or taken into account any other factors which we may consider to be relevant or appropriate in preparing the
research. Accordingly, we do not make any representation or warranty as to the accuracy, completeness or correctness of the research set
out in this report. Opinions expressed are subject to change without notice. This research is prepared for general circulation. Any
recommendation contained in this document does not have regard to the specific investment objectives, financial situation and the
particular needs of any specific addressee. This document is for the information of addressees only and is not to be taken in substitution for
the exercise of judgement by addressees, who should obtain separate independent legal or financial advice. The DBS Group accepts no
liability whatsoever for any direct, indirect and/or consequential loss (including any claims for loss of profit) arising from any use of and/or
reliance upon this document and/or further communication given in relation to this document. This document is not to be construed as an
offer or a solicitation of an offer to buy or sell any securities. The DBS Group, along with its affiliates and/or persons associated with any of
them may from time to time have interests in the securities mentioned in this document. The DBS Group, may have positions in, and may
effect transactions in securities mentioned herein and may also perform or seek to perform broking, investment banking and other banking
services for these companies. Any valuations, opinions, estimates, forecasts, ratings or risk assessments herein constitutes a judgment as of the date of this report, and
there can be no assurance that future results or events will be consistent with any such valuations, opinions, estimates, forecasts, ratings or
risk assessments. The information in this document is subject to change without notice, its accuracy is not guaranteed, it may be incomplete
or condensed, it may not contain all material information concerning the company (or companies) referred to in this report and the DBS
Group is under no obligation to update the information in this report. This publication has not been reviewed or authorized by any regulatory authority in Singapore, Hong Kong or elsewhere. There is no
planned schedule or frequency for updating research publication relating to any issuer. The valuations, opinions, estimates, forecasts, ratings or risk assessments described in this report were based upon a number of estimates
and assumptions and are inherently subject to significant uncertainties and contingencies. It can be expected that one or more of the
estimates on which the valuations, opinions, estimates, forecasts, ratings or risk assessments were based will not materialize or will vary
significantly from actual results. Therefore, the inclusion of the valuations, opinions, estimates, forecasts, ratings or risk assessments
described herein IS NOT TO BE RELIED UPON as a representation and/or warranty by the DBS Group (and/or any persons associated with
the aforesaid entities), that:
(a) such valuations, opinions, estimates, forecasts, ratings or risk assessments or their underlying assumptions will be achieved, and
(b) there is any assurance that future results or events will be consistent with any such valuations, opinions, estimates, forecasts, ratings
or risk assessments stated therein. Please contact the primary analyst for valuation methodologies and assumptions associated with the covered companies or price targets.
Any assumptions made in this report that refers to commodities, are for the purposes of making forecasts for the company (or companies)
mentioned herein. They are not to be construed as recommendations to trade in the physical commodity or in the futures contract relating
to the commodity referred to in this report. DBS Vickers Securities (USA) Inc (“DBSVUSA”), a US-registered broker-dealer, does not have its own investment banking or research
department, has not participated in any public offering of securities as a manager or co-manager or in any other investment banking
transaction in the past twelve months and does not engage in market-making.
Page 9
Company Update
ZTE
ANALYST CERTIFICATION
The research analyst(s) primarily responsible for the content of this research report, in part or in whole, certifies that the views about the
companies and their securities expressed in this report accurately reflect his/her personal views. The analyst(s) also certifies that no part of
his/her compensation was, is, or will be, directly or indirectly, related to specific recommendations or views expressed in the report. The
research analyst (s) primarily responsible for the content of this research report, in part or in whole, certifies that he or his associate1 does
not serve as an officer of the issuer or the new listing applicant (which includes in the case of a real estate investment trust, an officer of the
management company of the real estate investment trust; and in the case of any other entity, an officer or its equivalent counterparty of the
entity who is responsible for the management of the issuer or the new listing applicant) and the research analyst(s) primarily responsible for
the content of this research report or his associate does not have financial interests2 in relation to an issuer or a new listing applicant that
the analyst reviews. DBS Group has procedures in place to eliminate, avoid and manage any potential conflicts of interests that may arise in
connection with the production of research reports. The research analyst(s) responsible for this report operates as part of a separate and
independent team to the investment banking function of the DBS Group and procedures are in place to ensure that confidential
information held by either the research or investment banking function is handled appropriately. There is no direct link of DBS Group's
compensation to any specific investment banking function of the DBS Group.
COMPANY-SPECIFIC / REGULATORY DISCLOSURES
1. DBS Bank Ltd, DBS HK, DBSVS or their subsidiaries and/or other affiliates have a proprietary position in ZTE Corp (763 HK)
recommended in this report as of 22 Oct 2021.
2. Neither DBS Bank Ltd nor DBS HK market makes in equity securities of the issuer(s) or company(ies) mentioned in this Research
Report.
3. On 3 June 2021, President J. Biden issued Executive Order 14032 (“the EO”), superseding Executive Order 13959 of 12 November
2020. The EO, which takes effect on 2 August 2021, prohibits US persons from investing in publicly traded securities or derivatives
thereof from firms listed as Chinese Military-Industrial Complex Companies (“CMICs”). The list of CMICs can be found on the US
Department of the Treasury’s website at https://home.treasury.gov/policy-issues/financial-sanctions/consolidated-sanctions-
list/ns-cmic-list.
4. Compensation for investment banking services:
DBSVUSA does not have its own investment banking or research department, nor has it participated in any public offering of
securities as a manager or co-manager or in any other investment banking transaction in the past twelve months. Any US persons
wishing to obtain further information, including any clarification on disclosures in this disclaimer, or to effect a transaction in any
security discussed in this document should contact DBSVUSA exclusively.
5. Disclosure of previous investment recommendation produced:
DBS Bank Ltd, DBSVS, DBS HK, their subsidiaries and/or other affiliates of DBSVUSA may have published other investment
recommendations in respect of the same securities / instruments recommended in this research report during the preceding 12
months. Please contact the primary analyst listed on page 1 of this report to view previous investment recommendations
published by DBS Bank Ltd, DBS HK, DBSVS, their subsidiaries and/or other affiliates of DBSVUSA in the preceding 12 months.
1 An associate is defined as (i) the spouse, or any minor child (natural or adopted) or minor step-child, of the analyst; (ii) the trustee of a trust
of which the analyst, his spouse, minor child (natural or adopted) or minor step-child, is a beneficiary or discretionary object; or (iii) another
person accustomed or obliged to act in accordance with the directions or instructions of the analyst.
2 Financial interest is defined as interests that are commonly known financial interest, such as investment in the securities in respect of an
issuer or a new listing applicant, or financial accommodation arrangement between the issuer or the new listing applicant and the firm or
analysis. This term does not include commercial lending conducted at arm's length, or investments in any collective investment scheme
other than an issuer or new listing applicant notwithstanding the fact that the scheme has investments in securities in respect of an issuer
or a new listing applicant.
Page 10
Company Update
ZTE
RESTRICTIONS ON DISTRIBUTION
General This report is not directed to, or intended for distribution to or use by, any person or entity who is a citizen or resident
of or located in any locality, state, country or other jurisdiction where such distribution, publication, availability or use
would be contrary to law or regulation.
Australia This report is being distributed in Australia by DBS Bank Ltd, DBSVS or DBSV HK. DBS Bank Ltd holds Australian
Financial Services Licence no. 475946.
DBS Bank Ltd, DBSVS and DBSV HK are exempted from the requirement to hold an Australian Financial Services
Licence under the Corporation Act 2001 (“CA”) in respect of financial services provided to the recipients. Both DBS
Bank Ltd and DBSVS are regulated by the Monetary Authority of Singapore under the laws of Singapore, and DBSV HK
is regulated by the Hong Kong Securities and Futures Commission under the laws of Hong Kong, which differ from
Australian laws.
Distribution of this report is intended only for “wholesale investors” within the meaning of the CA.
Hong Kong This report is being distributed in Hong Kong by DBS Bank Ltd, DBS Bank (Hong Kong) Limited and DBS Vickers (Hong
Kong) Limited, all of which are registered with or licensed by the Hong Kong Securities and Futures Commission to
carry out the regulated activity of advising on securities. DBS Bank Ltd., Hong Kong Branch is a limited liability
company incorporated in Singapore.
Indonesia This report is being distributed in Indonesia by PT DBS Vickers Sekuritas Indonesia.
Malaysia This report is distributed in Malaysia by AllianceDBS Research Sdn Bhd ("ADBSR"). Recipients of this report, received
from ADBSR are to contact the undersigned at 603-2604 3333 in respect of any matters arising from or in connection
with this report. In addition to the General Disclosure/Disclaimer found at the preceding page, recipients of this report
are advised that ADBSR (the preparer of this report), its holding company Alliance Investment Bank Berhad, their
respective connected and associated corporations, affiliates, their directors, officers, employees, agents and parties
related or associated with any of them may have positions in, and may effect transactions in the securities mentioned
herein and may also perform or seek to perform broking, investment banking/corporate advisory and other services
for the subject companies. They may also have received compensation and/or seek to obtain compensation for
broking, investment banking/corporate advisory and other services from the subject companies.
Wong Ming Tek, Executive Director, ADBSR
Singapore This report is distributed in Singapore by DBS Bank Ltd (Company Regn. No. 196800306E) or DBSVS (Company Regn
No. 198600294G), both of which are Exempt Financial Advisers as defined in the Financial Advisers Act and regulated
by the Monetary Authority of Singapore. DBS Bank Ltd and/or DBSVS, may distribute reports produced by its
respective foreign entities, affiliates or other foreign research houses pursuant to an arrangement under Regulation
32C of the Financial Advisers Regulations. Where the report is distributed in Singapore to a person who is not an
Accredited Investor, Expert Investor or an Institutional Investor, DBS Bank Ltd accepts legal responsibility for the
contents of the report to such persons only to the extent required by law. Singapore recipients should contact DBS
Bank Ltd at 6327 2288 for matters arising from, or in connection with the report.
Thailand This report is being distributed in Thailand by DBS Vickers Securities (Thailand) Co Ltd.
United
Kingdom
This report is produced by DBS HK which is regulated by the Hong Kong Monetary Authority This report is disseminated in the United Kingdom by DBS Vickers Securities (UK) Ltd (“DBSVUK”). DBSVUK is
authorised and regulated by the Financial Conduct Authority in the United Kingdom. In respect of the United Kingdom, this report is solely intended for the clients of DBSVUK, its respective connected and
associated corporations and affiliates only and no part of this document may be (i) copied, photocopied or duplicated
in any form or by any means or (ii) redistributed without the prior written consent of DBSVUK. This communication is
directed at persons having professional experience in matters relating to investments. Any investment activity
following from this communication will only be engaged in with such persons. Persons who do not have professional
experience in matters relating to investments should not rely on this communication.
Dubai
International
Financial
Centre
This research report is being distributed by DBS Bank Ltd., (DIFC Branch) having its office at units 608-610, 6th Floor,
Gate Precinct Building 5, PO Box 506538, DIFC, Dubai, United Arab Emirates. DBS Bank Ltd., (DIFC Branch) is regulated
by The Dubai Financial Services Authority. This research report is intended only for professional clients (as defined in
the DFSA rulebook) and no other person may act upon it.
Page 11
Company Update
ZTE
United Arab
Emirates
This report is provided by DBS Bank Ltd (Company Regn. No. 196800306E) which is an Exempt Financial Adviser as
defined in the Financial Advisers Act and regulated by the Monetary Authority of Singapore. This report is for
information purposes only and should not be relied upon or acted on by the recipient or considered as a solicitation
or inducement to buy or sell any financial product. It does not constitute a personal recommendation or take into
account the particular investment objectives, financial situation, or needs of individual clients. You should contact your
relationship manager or investment adviser if you need advice on the merits of buying, selling or holding a particular
investment. You should note that the information in this report may be out of date and it is not represented or
warranted to be accurate, timely or complete. This report or any portion thereof may not be reprinted, sold or
redistributed without our written consent.
United States This report was prepared by DBS HK. DBSVUSA did not participate in its preparation. The research analyst(s) named
on this report are not registered as research analysts with FINRA and are not associated persons of DBSVUSA. The
research analyst(s) are not subject to FINRA Rule 2241 restrictions on analyst compensation, communications with a
subject company, public appearances and trading securities held by a research analyst. This report is being distributed
in the United States by DBSVUSA, which accepts responsibility for its contents. This report may only be distributed to
Major U.S. Institutional Investors (as defined in SEC Rule 15a-6) and to such other institutional investors and qualified
persons as DBSVUSA may authorize. Any U.S. person receiving this report who wishes to effect transactions in any
securities referred to herein should contact DBSVUSA directly and not its affiliate.
Other
jurisdictions
In any other jurisdictions, except if otherwise restricted by laws or regulations, this report is intended only for qualified,
professional, institutional or sophisticated investors as defined in the laws and regulations of such jurisdictions.
DBS Bank (Hong Kong) Limited
13 th Floor One Island East, 18 Westlands Road, Quarry Bay, Hong Kong
Tel: (852) 3668-4181, Fax: (852) 2521-1812
Page 12
Company Update
ZTE
DBS Regional Research Offices
HONG KONG
DBS Bank (Hong Kong) Ltd
Contact: Carol Wu
13th Floor One Island East,
18 Westlands Road, Quarry Bay, Hong Kong
Tel: 852 3668 4181
Fax: 852 2521 1812
e-mail: [email protected]
MALAYSIA
AllianceDBS Research Sdn Bhd
Contact: Wong Ming Tek (128540 U)
19th Floor, Menara Multi-Purpose, Capital Square,
8 Jalan Munshi Abdullah 50100, Kuala Lumpur, Malaysia.
Tel.: 603 2604 3333
Fax: 603 2604 3921
e-mail: [email protected]
Co. Regn No. 198401015984 (128540-U)
SINGAPORE
DBS Bank Ltd
Contact: Janice Chua
12 Marina Boulevard,
Marina Bay Financial Centre Tower 3
Singapore 018982
Tel: 65 6878 8888
e-mail: [email protected]
Company Regn. No. 196800306E
INDONESIA
PT DBS Vickers Sekuritas (Indonesia)
Contact: Maynard Priajaya Arif
DBS Bank Tower
Ciputra World 1, 32/F
Jl. Prof. Dr. Satrio Kav. 3-5
Jakarta 12940, Indonesia
Tel: 62 21 3003 4900
Fax: 6221 3003 4943
e-mail: [email protected]
THAILAND
DBS Vickers Securities (Thailand) Co Ltd
Contact: Chanpen Sirithanarattanakul
989 Siam Piwat Tower Building,
9th, 14th-15th Floor
Rama 1 Road, Pathumwan,
Bangkok Thailand 10330
Tel. 66 2 857 7831
Fax: 66 2 658 1269
e-mail: [email protected]
Company Regn. No 0105539127012
Securities and Exchange Commission, Thailand