Embed Size (px)
Citation preview
China’s Foreign Trade: Perspectives From the Past 150 Years
Wolfgang Keller1
Princeton University, University of Colorado, and CEPR
Ben Li2
University of Colorado
Carol H. Shiue3
Princeton University, University of Colorado, and CEPR
November 2010
1 Department of Economics, Princeton University, Princeton, NJ 08544; [email protected] 2 Department of Economics, University of Colorado at Boulder, CO 80309; [email protected] 3 Department of Economics, Princeton University, Princeton, NJ 08544; [email protected]
1
Abstract This paper studies the trade of China in the past 150 years, starting from the first opening
of China after the Opium War. The main purpose of the paper is to identify what is (and
was) China’s ‘normal’ level of foreign trade, and how these levels changed under different
trade regimes, from 1840 to the present. We present new evidence on China’s foreign
trade during the treaty port era (1842‐1948), drawn from disaggregated trade data
collected by the Chinese Maritime Customs Service, that yields important findings for
current research. First, although the volume of foreign trade remained limited initially,
there was a notable expansion in the diversity of products, with many new goods being
imported into China. Second, the regional diffusion of foreign goods through China was
greatly facilitated by the expansions of the port system. Third, the importance of Hong
Kong as an intermediary in China’s trade has undergone long‐term fluctuations suggestive
of learning effects. China’s recent wave of liberalization has led by the early 1990s to a
trade level comparable to the high of the 1920s. While much of China’s recent growth in
world trade is in line with her income growth, there is no doubt that China’s trade
openness today, comparable by some measures to Denmark’s, is a stunning reversal
relative to the pre‐1978 and also the pre‐1840 period. The paper emphasizes the roles that
history and institutional change have played in this.
2
1. Introduction
In the year 2007, China’s imports accounted for 31% of its GDP, larger than for
similarly developed India (25%) and about twice the size of imports for either Japan (16%)
or the United States (17%). Recently, China has also become the world’s largest exporter.
Today, business delegations from all over the world come to China, often accompanied by
their political leaders, to ensure they are not left out in the China trade. The lure of China’s
big market is nothing new. The British Plenipotentiary Sir Henry Pottinger announced after
Britain’s victory over China in the First Opium War (1840‐42) that China’s potential for
trade was so vast “that all the mills of Lancashire could not make stocking stuff sufficient
for one of its provinces” (Chinese Maritime Customs [CMC] 1933, 39). In hindsight,
Pottinger was overly optimistic: it took some 150 years more until China would deliver on
its promise for world trade.
The trade history of China is important for how it has affected global production and
earnings in poor and rich countries alike. Many contemporary analysts view China’s recent
preeminence primarily as the result of the post‐1978 reforms, perhaps contradicting the
idea that sustained economic growth requires simultaneous political reform.4 Present day
discussions on Chinese development have moved to a focus on China’s currency
interventions that keep the Renminbi from appreciating or on China’s entry into the WTO in
the year 2001.5 We contend that understanding the fundamental forces behind China’s
increasingly dominant position in world trade require going further back than 1978.
Reaching to the 19th century and earlier, we are in a better position to identify what is (and
was) China’s ‘normal’ level of foreign trade, and how these levels changed under different
trade regimes, from 1840 to the present.
The legacy of the forced opening of China by Western powers, however, is
controversial. While some say it slowed down her growth, others hold that China would
have actually benefited from the increase in trade—had it not arrived through gunboats.
4 See Rawski (1999), Woo (1999), and Sachs and Woo (2000). The rule of the Communist Party in China (CPC) began in the year 1949, and starting with the year 1978 market‐oriented reforms were implemented. 5 See Krugman (2010) and Cline (2010) on China’s currency; contrarian views are Wei (2007) and Reisen (2010). On the trade effects of China’s entry into the WTO, see Lardy (2002) and Whalley (2006).
3
Yet another view is that foreign trade at the time was too trivial in size to matter for China.
In this paper, we take the first steps to addressing the impact of the opening of China on
trade and economic growth by adopting the long run view of China’s foreign trade. Our
approach is also much more quantitative in focus compared to previous research. Based on
information from the Chinese Maritime Customs (CMC) service, the organization set up and
run by the West to govern China’s foreign trade, our first contribution is to present new
evidence on China’s foreign trade during the treaty port era (1842‐1948).
China, it must be remembered, was a failing state in the 19th century, in the sense
that the ruling Qing government (1644‐1911) was by then increasingly unable to project
effective rule over every part of the empire. Laws which prohibited opium imports (in
place since 1729) were for the most part disregarded by smugglers and officials alike.
Although a customs apparatus was present, corruption also meant that the state did not or
could not collect significant amounts of revenues to fund public goods because local power
competed with officially stated goals. The CMC revolutionized the system of foreign trade
in China by introducing a consistent set of rules. In the process, the CMC collected detailed
information on trade not only for China as a whole but also for individual ports of trade
within China.
To the extent that uncertainty reduces economic activity, this transfer of a Western
institution may increase trade and welfare, and the evidence presented below supports
that notion. Our analysis of China’s foreign trade during the treaty port era yields a
number of findings important for current research in international trade. First, although
the volume of trade after liberalization was not large in the beginning, there was a very
notable expansion in the diversity of product categories and new goods that were imported
into China, a point that previous authors have overlooked. We find that the number of new
goods imported by China grew by about 6% per year between the 1860s and 1940s, which
is about 50 percent faster than what that figure was in the United States between 1970 and
2000. This shows that product variety gains are not limited to highly developed countries;
in fact, they may be more important for poorer countries.
Second, the expansion of ports did more than increase geographical diversity. It
also helped to increase the volume of goods imported. An important intermediary in this
4
process was Hong Kong, which functioned as an entrepôt. The importance of Hong Kong
also suggests high fixed learning costs to trade during this period. We show that larger
countries conducted less of their trade with China through Hong Kong than smaller
countries. In addition, subsequent to every change in the trade regime (e.g. right after the
opening of new CMC treaty ports), Hong Kong’s trade intermediation becomes less
important over time.
Furthermore, China’s recent position in world trade appears less exceptional in light
of its long‐run history. While other factors no doubt play a role, a large part of China’s
recent growth in trade is due to two factors. First, it is a reversion from the depressed
levels of the pre‐1978 period, and is due to lifting of trade restrictions imposed during that
period. As we show below, China’s share of world trade at the turn of the 21st century was
similar to that of the year 1925. Second, China’s current footprint in world trade is mainly
that of a very large country rapidly industrializing.
We are not the first to study the opening of China for trade in the 19th century. This
subject has been looked at by a number of authors (Morse 1926, Fairbank 1978). Work on
this period is inextricably linked to the fact that this trade came about through a quasi‐
colonial set‐up imposed by Western powers, reflecting China’s diminished position in the
world during this period. In certain earlier writings, the foreign intrusion is seen in an
overwhelmingly negative light, and by implication, the foreign trade it generated was
detrimental to Chinese interests. These authors refer not only to opium addiction, but also
more general effects of foreign trade in destroying domestic industry.6 A counterargument
is that the foreign trade was small and the extent of foreign penetration was very limited,
certainly insufficient to effectively counter the forces of China’s traditional culture and
society, as well as government, to lead to a higher rate of economic development.7 The
implication of the argument being that foreign trade would have carried benefits to China,
but did not because foreign influence was ultimately very minor. In either case, these
6 For example, Hou (1965) argues that foreign trade (and investment) ruined the domestic handicraft industries, disrupted agriculture, and foreign firms did not compete on a level playing field with Chinese firms (p. 1). According to this view, foreign imperialism in trade slowed down China’s economic development. 7 Dernberger (1975) provides a summary of these views.
5
authors rarely provide conclusive evidence on trade that supports these claims.8 By relying
on the detailed information on foreign trade in the CMC archives, our analysis extends the
largely descriptive accounts in Morse (1926) and Fairbank (1978).
Previous authors have examined the information collected by the Chinese Maritime
Customs service, although thus far most of this analysis has been undertaken by historians
who have written in detail about many institutional aspects of the CMC (van den Ven 2004,
Brunero 2004, Bickers 2008).9 In terms of economic analysis, Rawski (1970) has shown
that even though treaty ports were opened to foreign merchants, Western traders
continued to rely heavily on Chinese middlemen (so‐called compradors) to conduct their
business in China. More recently, Mitchener and Yan (2010) have studied the role of
foreign trade for China’s wages in the early 20th century, arguing that a surge in trade
around World War I caused a decline in the relative skilled wage in China.10 Our work
differs, first, in that we cover a longer time period, from pre‐1850 until today, which allows
us to place the CMC era into the broader context of economic development in China and
elsewhere. In addition, we contribute to a better understanding of the economics of trade
intermediation and the role of new goods for the welfare gains of international trade by
focusing also on the regional and commodity dimensions of China’s foreign trade.11
New goods are known to be important in driving overall trade growth (Hummels
and Klenow 2005). Our analysis of the range of goods that is traded, or the extensive
margin, is related to Feenstra (1994) and Broda and Weinstein (2006). The latter authors
show that a large fraction of welfare gains from trade for the United States in the late 20th
8 More generally, the quantitative information that studies on historic trade of China present tends to be limited (e.g., the classic study by Remer 1926) and from the summaries by Yang (1931) and Hsiao (1974). 9 Many of these works are related to a project at Bristol and Cambridge (http://www.bristol.ac.uk/history/customs/), which has also started to make information on trade during the CMC period available on the Internet. Moreover, CMC information has helped to better understand how trade shaped the history of economies such as Taiwan (Ho 1978, Mizoguchi and Umemura 1988), as well as China’s role in the greater Asian context during the early 20th century (Kose 1994, 2005). 10 While mostly relying on information on prices from Hsiao (1974), Brandt (1989) also employs CMC data on trade volumes in his analysis of the integration of Chinese regions with the South Asian rice market from 1870‐1936. 11 Antras and Costinot (2010), Blum, Claro, and Horstmann (2009), Ahn, Khandewal, and Wei (2010), as well as Feenstra and Hanson (2004) are recent analyses of intermediation in international trade.
6
century can be attributed to the availability of goods that could not be had before.12 Little
is known, however, about the trade effects of new goods during historical periods.13 To our
knowledge, there has been no analysis of new goods and the ensuing welfare effects for
China in this period.
A number of studies have recently analyzed other key aspects of China’s foreign
trade regime since 1978, highlighting factors that are driving it as well as its impact on
other economies (Amiti and Freund 2010, Brambilla, Khandewal, and Schott 2010, Hanson
and Robertson 2010, Wang and Wei 2010, Branstetter and Lardy 2008). Because the focus
in these studies is on a relatively short period, they place less emphasis than we do on
natural advantages and disadvantages across regions and the gradual rise and decline of
countries in the world.14 Exceptions to this are Maddison (2007) and Chow and Shen
(2005).15 Our work differs from theirs in that although the era we examine is far earlier in
time, we are actually able to provide an even more disaggregated picture of foreign trade of
China by exploiting the primary CMC sources.
The remainder of the paper is as follows. The next section sets the stage by
summarizing what is known facts about China’s early foreign trade as well as the events
that led to the opening in the 1840s. In the central section 3 of the paper, we first describe
the organization of foreign trade in China before presenting key findings on the arrival and
diffusion of new goods and trade intermediation in China during the treaty port era. A
synthesis of China’s foreign trade in the post‐1949 era is provided in section 4, which
emphasizes putting China’s very recent trade growth into historical perspective. A
summary as well as a discussion of China’s extraordinarily high level of trade openness
today are provided in the concluding section 5.
12 The arrival of a new good through trade reduces its price from infinity to something finite, and the welfare gains from this depend on whether close substitutes were already available or not. 13 Hersh and Voth (2009) estimate the combined gains from increases in tea, sugar, and tobacco consumption
in England at more than 10% between the years 1600 and 1850. They employ information on foreign trade to estimate new good consumption, which is used together with other data to back out preference parameters. 14 By showing that the relatively rich regions of China in the late 20th century were already relatively advanced in the early 18th century, Keller and Shiue (2007) argue that the effect of the post‐1978 reforms can be easily overestimated due to natural advantages such as access to water transport. 15 See also Lardy (1994) who discusses China’s contribution to world trade for most of the 20th century, p.2.
7
2. China’s Foreign Trade Before 1842
China has been engaging in foreign trade since ancient times. Overland trade in
luxury goods such as silk, slaves, and spices took place with the Mediterranean along the
famed Silk Road since around 1,000 BC. In the 4th and 5th century CE Chinese junks
appeared in Siam (Thailand), Ceylon, and India, and by the 8th century Canton (Guangzhou)
had established itself as the center of sea‐going trade with the Arab merchants from the
Persian Gulf. The majority of China’s early trade by the 11th century was with relatively
proximate countries, mostly in Asia.16 Trade routes with Japan and Korea, as well as the
Philippine Islands were established by the 12th century, and by the early 1400s a Ming
dynasty (1344‐1644) admiral commandeered expeditions from China going west to as far
as West Africa. Much of China’s substantial trade with Asian countries was initiated by
China, and conducted well into the 19th century with seagoing Chinese junks.
When trade costs along the Silk Road increased due to the disintegration of the
Mongol empire as well as the Ottoman conquest of Constantinople (year 1453) and
Alexandria (1517), this provided one more reason for European countries to explore the
sea route to the East: to trade in silk, pepper, ginger, and other goods. In the year 1517, the
Portuguese were the first to reach China, and in 1557 they were allowed to settle in Macao.
Other European countries with trade interests soon followed—the Spanish reached China
in 1575, the Dutch in 1604, and the British in 1637.17 The latter two nations established a
lasting interest, with the Dutch gaining a hold on Taiwan and British traders operating out
of Zhousan (in Zhejiang), Xiamen (in Fujian), and Guangzhou (in Guangdong).
The extent of international trade was not only affected by the state of technology
(ships, navigation, etc.), but also by the policies towards trade from the respective
governments. The East India Company, for example, held a monopoly for British trade with
16 Interregional trade flows over land and sea connected China with South and Southeast Asia, Central Asia and the Islamic world around the 11th century A.D. , according to Curtin (1984). See also Findlay and O’Rourke (2007). 17 Spain acquired the Philippines in 1565 and annexed Portugal in 1580, both of which spurred Spanish activity towards China.
8
China since the year 1600. Arguably this restricted British trade with China.18 For its part,
while China’s policy towards foreign trade seesawed back and forth between being more or
less open over the centuries, on average it was fairly restrictive, often allowing only limited
exchange between specific domestic and foreign traders in specific areas. Foreign trade –
when legal—occurred generally under a tributary system, under which foreigners received
the right to trade in China for limited periods of time.
China’s official policy to limit trade with the West has been at times expressed very
clearly.19 Yet foreign trade in China was confined to a single port as of the end of the 18th
century not because the government was blind to potential gains of trade, but because it
seemed the most expedient way to manage trade. The court considered the potential
benefits of foreign trade to be small relative to the difficulties of managing the discord
between foreigners and native populations in China. The overriding concern was that the
foreign traders, who were not always engaged in peaceful trading activities, would threaten
domestic stability by inciting unrest, disorder, and promoting piracy. Considering the fates
of many under‐defended populations and territories during of this period of European
empire building overseas, this was not a completely irrational decision. Trade restrictions
in China were thus employed to achieve domestic policy goals.20
Was there evidence for strong demand for foreign goods in China? James Matheson,
a partner in Jardine Matheson & Co., one of the top trading firms in Asia, remarked in 1819
after a public auction sale of Lancashire cotton piece goods that although it was well
attended by numerous dealers, the shirtings were impossible to sell because they appeared
to be inferior imitations of a local substitute. As late as the 1830s, Matheson traders
reported that the Chinese native nankeen cotton cloth was superior in quality and cost
compared to Manchester cotton goods.21
18 A deregulation act was passed in 1694, but no effective new competition emerged from it. 19 For example, in turning down a request to extend foreign trade privileges for the British beyond the city of Canton, the Qianlong emperor wrote in 1793 to the British King George III that “…strange and costly things do not interest me. … I [.] have no use for your country’s manufactures.” The full letter can be found at http://academic.brooklyn.cuny.edu/core9/phalsall/texts/qianlong.html 20 For example, in the 1660s the Qing prohibited merchant junks to go abroad and evacuated all populations living near the coast of Southern China to subdue a rebellion on Taiwan. 21 Greenberg (1951), page 2.
9
Absent a suitable commodity for export to China, silver (which was had to be mined
in the Americas) was used to purchase Chinese silk, porcelain, and tea. In an increasingly
mercantilist Europe, this gave cause for concern, and the Chinese demand for opium as a
recreational drug slowed this drain of specie. Opium was mostly exported from British
India and smuggled into China since the Chinese government outlawed the import of
opium. Although enforcement was weak and smuggling was rampant, the ban on the
opium trade also epitomized the sentiment of Western traders that China restricted the
entry of foreign goods.22 When in 1839, a newly appointed Chinese commissioner acted
relatively forcefully in destroying an illegal opium shipment into China, Britain resorted to
military action, beginning the First Opium War (1840‐42). The course of defeat was swift.
British military forces took Canton, moved up the coast and along the Yangtze River,
captured Shanghai, and eventually reached the Grand Canal, on which provisions were sent
to the capital, and thus in effect threatening Beijing itself.
The Treaty of Nanjing (1842), which China was forced to sign, stipulated that an
indemnity had to be paid as compensation; in addition, Hong Kong was ceded to Britain.
Moreover, foreign nationals had the right to residence and to own property in treaty ports,
and while living in China they also were subject to jurisdiction according to their own
nationality and not to Chinese laws. In foreign trade, the treaty abolished the traditional
tributary system, liberalized the highly regulated Co‐Hong trading system at Guangzhou,
and opened additional ports (initially only four) to foreign trade. Trade duties were limited
to 5% or less on all goods. Opium was not mentioned in the treaty, implying that its trade
was now legal in China. Soon after, the United States and France concluded similar treaties
with China, the Treaty of Wanghia and Treaty of Whampoa, respectively.
The Treaty of Nanjing ushered in the era of the Treaty Port System, which lasted
from 1842 until 1948. The next section briefly describes its main features before
examining quantitative aspects of China’s foreign trade during this period.
22 The abolition of the East India Company’s monopoly on trade with China in 1834 exacerbated the situation, because it led to more Western entry in the China trade.
10
3. Trade Under the Treaty Port System (1842‐1949)
a. The Emerging Institutions and Organization
While the Treaty of Nanjing did away with central elements of China’s foreign trade
system—in particular the notion that trade was part of the tributary system and that
Canton was the only port open to trade—initially, the Chinese Customs authority remained
in charge of processing foreign trade. However, with a relatively weak central government
whose authority was eroded after the Opium War even as it was preoccupied with
suppressing domestic uprisings (in particular the Taiping Rebellion, 1844‐60), foreign
trade revenue collection fell primarily in the hands of provincial and local authorities.
These local officials were ill‐equipped to handle the larger volume of trade coming in, and
foreign trade was not subject to a consistent set of rules. To the contrary, payment of trade
taxes was a matter of bargaining power, and rife with corruption.23
The creation of the Chinese Maritime Customs (CMC) Service emerged out of this
vacuum of power.24 The CMC was founded in 1854 by the foreign consuls in Shanghai to
collect maritime trade taxes that were going unpaid due to the inability of Chinese officials
to collect them during the Taiping Rebellion. Although the CMC was nominally under the
jurisdiction of the Chinese government’s Foreign Office (Zongli yamen), in practice it
operated under the management of foreign powers, and its upper level staff came from
abroad. Initially, staff was mostly British, although other Western countries later joined.
The top CMC position and director of its operations, was called the Inspector‐General (IG),
who worked side by side with his Chinese counterpart, called the Superintendent of
Customs, who oversaw the collection of trade taxes from the so‐called native trade, that is,
from Chinese‐owned junks.
Early on, opposition to the CMC came, first of all, from foreign consuls who feared
that the Inspectors were usurping some of their powers. Moreover, foreign merchants
23 Tax collection was poor even in major ports such as Shanghai. The British Consul of Shanghai estimated in one year that the loss of tariff revenue in Shanghai was at least 25%, and complained that “two or three sleepy menials at $5 or $6 a month” were the sole means existing for the collection of duty, with which he was bound by the Treaty of Nanjing to co‐operate; CMC (1933), 81. 24 The Service was called Imperial Maritime Customs Service until 1912.
11
initially were opposed to the CMC because now they had to deal with customs formalities
that before were left in their entirety to (Chinese) middlemen and clerks. Within only a
couple of years, however, foreign businessmen had come to prefer the consistent and
predictable customs treatment by the new CMC system, and over time the frictions
between consuls and CMC officials became less severe.25
The Chinese central government naturally resented the loss of sovereignty that
came with the Treaty of Nanjing, but the introduction of the CMC also substantially
increased the net tariff revenues it received.26 Local Chinese government officials probably
sustained a net decline in benefits as the CMC reduced their ability to withhold revenues
from the central government and strike deals. Moreover, smugglers, pirates, and
adventurers saw their prospects of gain diminished with the arrival of the CMC, especially
because over time the CMC extended its responsibilities to include anti‐smuggling
operations. Later, the CMC also expanded its involvement into postal administration,
coastal police, harbor and waterway management, and weather reporting.
From the point of view of Western powers, the establishment of the CMC not only
broadened their political influence in China but also ensured that China would have the
means to pay the indemnities imposed on it after the First and Second (1856‐60) Opium
Wars. The information derived from this system was so credible that China was even able
to put the tariff revenue down as collateral against which it could borrow from abroad.27
Another motive, arguably the most important, was that the West wanted to support the
expansion of commercial exchange between China and their own countries, and that meant
a more open and consistent Chinese system.
The CMC was responsible for the examination of cargo, prevention of smuggling, the
assessment of treaty tariffs on exports, imports, and coastal trade, with the ultimate goal of
calculating tax revenues that were due. The nominal tariff was fixed to yield a rate of
25 For example, in 1857 the British Consul reported that “the feeling of the foreign merchant is generally in favour of the foreign inspectorship system, for it places all on an equality”; CMC (1933), 81. 26 The long‐term CMC director Robert Hart estimated that while under the native system the costs of tariff collection were rather above than below 100%, under the CMC at Shanghai costs were only around 2% of the revenues. CMC (1933), 81. 27 While China collected without doubt higher tariff revenues due to the introduction of the CMC, it is not entirely clear whether net of paying for the war indemnities any of that additional revenue was left.
12
approximately five percent ad valorem, however, over time the effective rate was often
lower, around three percent, due to price increases. The CMC jurisdiction extended to
“foreign‐type” vessels, in particular steam ships, whether owned by foreigners or by
Chinese, and to junks chartered by foreigners. While junks owned by Chinese were hence
covered by the native Customs, on which there is almost no information, the success of
steam ships over sailboats in the second part of the 19th century meant that the CMC was
responsible not only for virtually all of direct trade with foreign countries but also the large
majority of coastal and river trade within China.
There were five Chinese ports open for foreign trade in 1842 per the Treaty of
Nanjing, eleven more were added after China was defeated in the Second Opium War
(1856‐60) through the Treaty of Tientsin, and more were added over time (mostly before
the turn of the century). The CMC did not establish customs stations in all of ports, but
rather, it focused on the ports that were important for foreign trade.28 The geographic
proliferation of CMC ports over time yields an interesting port margin of foreign trade that
will be analyzed below. Generally, the more important ports are opened relatively early,
which means that even in the 1860s the CMC covered 80%‐90% of all foreign trade. With
the opening of the CMC customs station in Kowloon in the year 1886, virtually all of China’s
foreign trade was covered.29
Information collected by CMC customs officials includes both the value and the
quantity of imports and exports at the commodity level for each port. This includes the
trade within China, for example the number of cotton shirtings that were first imported by
Shanghai and then re‐exported to other Chinese regions or to other countries. The CMC
also collected data on the tonnage of foreign ships, because this was needed to assess
tonnage dues.
28 For example, by the year 1915 there were 92 treaty ports but only 48 of these maintained a CMC customs station. In addition to ports opened by international treaties, there were ports opened by the Chinese government unilaterally but where foreigners could not reside, as well as “ports of call” where foreign steamers could dock. 29 Kowloon was important for trade with Hong Kong, being located opposite of Hong Kong Island.
13
The CMC data collection system underwent a number of changes, in part due to
changing international practice, and in part due to structural change of the economy.30
This is to be expected over a long period of close to one hundred years—1859 to 1948. The
quality of the data collected by the CMC is generally considered to be high. The data is
internally consistent and generally matches up well with the corresponding trade data for
the same flow from other countries. This may not be surprising given that the typical
foreign CMC employee was highly skilled, being a graduate from a renowned university
such as Cambridge, Harvard, Oxford, or Yale.
The next section provides a quantitative overview of China's foreign trade from mid‐
19th to mid‐20th century.
3.2 Trade Under the Treaty Port System: A Quantitative Picture
China’s Overall Foreign Trade
We begin by summarizing China’s overall foreign trade, which provides a useful
benchmark for the more disaggregated analysis below. All data comes from directly from
the annual CMC reports. Figure 1 shows the evolution of China’s aggregate foreign
commodity trade.31 Two things are apparent. One, for the period shown China was more
likely to have a trade deficit than a trade surplus in its commodity trade, the difference to
be covered by bullion or international debt. Two, the volume of China’s overall foreign
trade is relatively stable before the year 1885. Afterwards, the evolution of her trade is
rather well‐summarized by a linear trend. Except for the collapse in trade in the aftermath
of the Great Depression, there are no major deviations from a linear trend, and the average
growth rate of both imports and exports is about 5% per year. This is substantially lower
30 As an example of the former, in 1904 the CMC switched from reporting trade in market values to cost, insurance, and freight (cif) values for imports and free on board (fob) value for exports. Structural change triggered several changes in the goods classifications, both nationally as well as at the level of the individual port. 31 Reported are nominal values of Haekwan Taels, the currency adopted by CMC organization. No adjustments have been made for territorial changes, for example Manchuria, which became part of Japan in 1931. The reports present also international exchange rates to the world’s major currencies, as well as quantities. Shown in the graph are total imports; a fraction between 1% and 5% of these were re‐exported from China to other countries.
14
than in the most recent past; between the years 2000 and 2008, the growth rate of China’s
foreign trade was about 18% per year, as we discuss below. One also notes that the impact
of World War I on China’s trade growth was limited. With the European countries’ trade
strongly declining, this is consistent with the idea that China gained market share in world
trade during this period.32
Country Composition
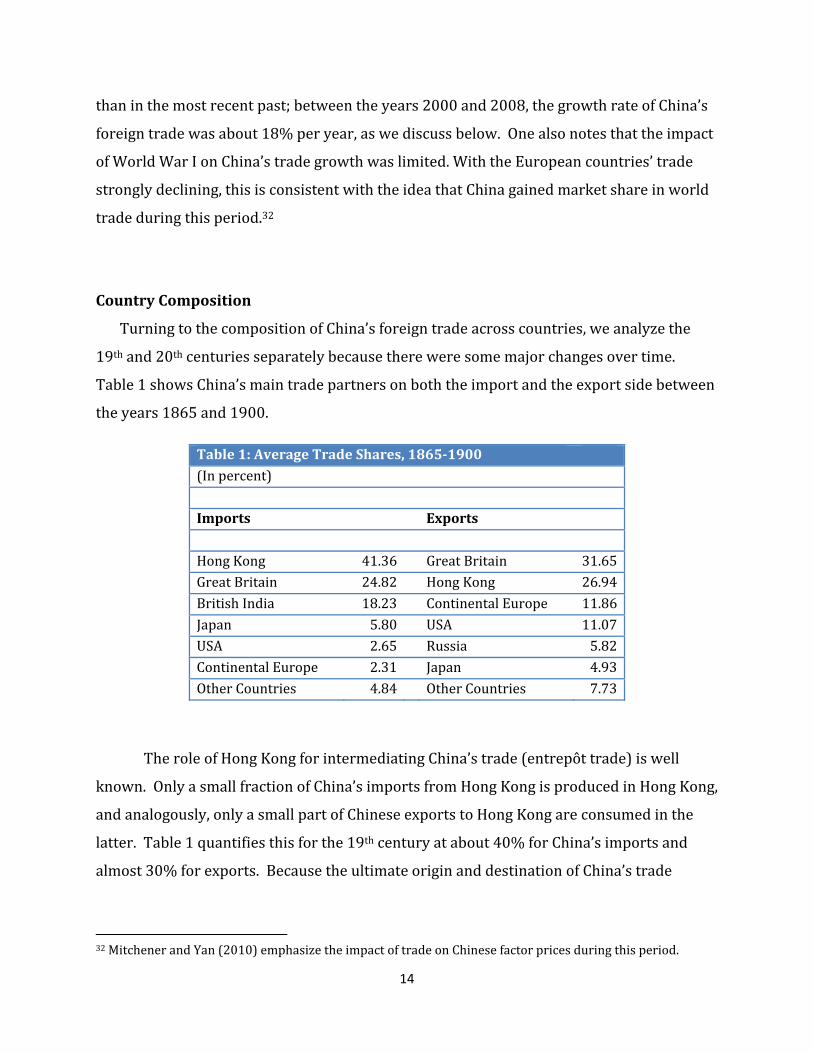
Turning to the composition of China’s foreign trade across countries, we analyze the
19th and 20th centuries separately because there were some major changes over time.
Table 1 shows China’s main trade partners on both the import and the export side between
the years 1865 and 1900.
Table 1: Average Trade Shares, 1865‐1900
(In percent)
Imports Exports
Hong Kong 41.36 Great Britain 31.65
Great Britain 24.82 Hong Kong 26.94
British India 18.23 Continental Europe 11.86
Japan 5.80 USA 11.07
USA 2.65 Russia 5.82
Continental Europe 2.31 Japan 4.93
Other Countries 4.84 Other Countries 7.73
The role of Hong Kong for intermediating China’s trade (entrepôt trade) is well
known. Only a small fraction of China’s imports from Hong Kong is produced in Hong Kong,
and analogously, only a small part of Chinese exports to Hong Kong are consumed in the
latter. Table 1 quantifies this for the 19th century at about 40% for China’s imports and
almost 30% for exports. Because the ultimate origin and destination of China’s trade
32 Mitchener and Yan (2010) emphasize the impact of trade on Chinese factor prices during this period.
15
through Hong Kong is not known for all years, the following analysis nets out the trade
through Hong Kong. We will return to China’s entrepôt trade below.
Figure 2(a) shows the composition of China’s imports between 1865 and 1900. The
largest sources of imports early on were Great Britain, together with British India, with
about 90% of the Chinese imports in 1870 (not through Hong Kong). The importance of
India declines over time, which is in part due to opium imports falling relative to other
imports. Among import sources outside the British Empire, there is primarily Japan, and
its share of China’s imports is rising to about 20% by 1900. This is still only about half of
China’s imports from Great Britain. For Western sources other than Great Britain, imports
from the United States by 1900 are almost twice as large as those from Continental
Europe.33
The export side of China’s trade is shown in Figure 2(b). The main story here is that
while China exported primarily to Great Britain at the beginning of the period around 75%
of the (non‐Hong Kong) trade, by 1900 the British share was only 10%. The flip side of this
is an increasing importance of exports to Continental Europe and more exports to Japan.34
In contrast to imports, India is not among the major Chinese export destinations, in part
due to the two countries having overlapping comparative advantage. Moreover, Russia
during this time accounts for a significant portion of China’s exports, while it is not
important for China’s imports.
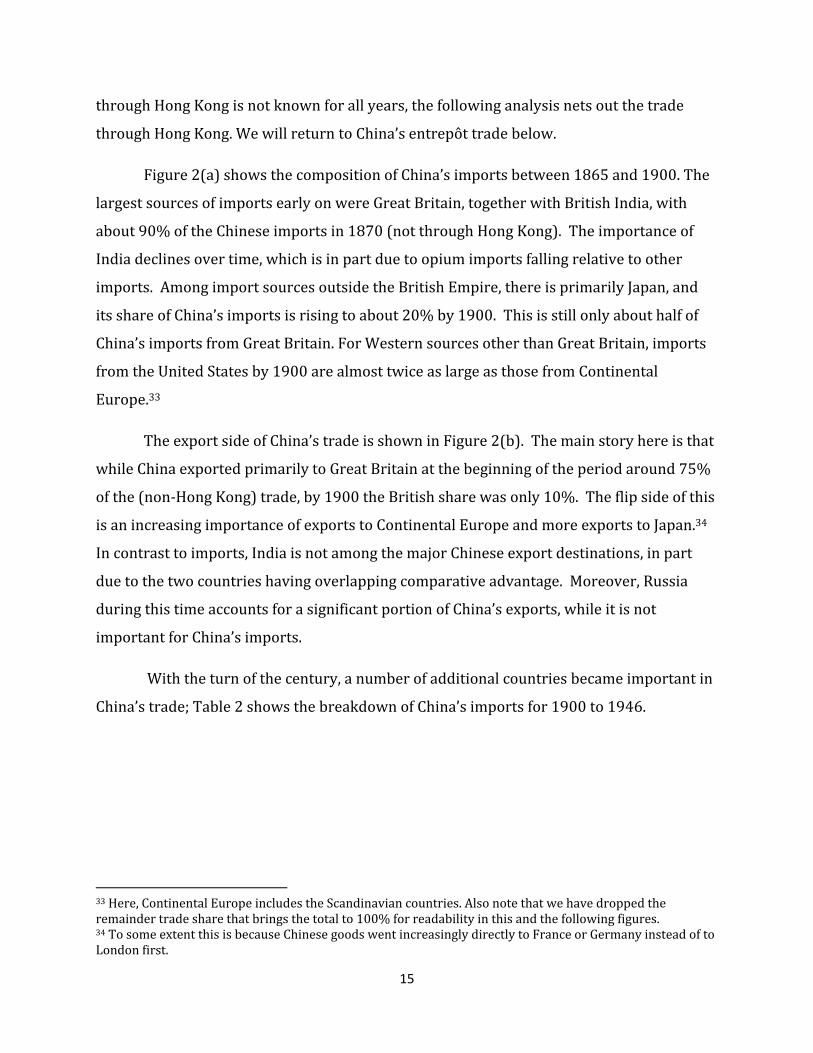
With the turn of the century, a number of additional countries became important in
China’s trade; Table 2 shows the breakdown of China’s imports for 1900 to 1946.
33 Here, Continental Europe includes the Scandinavian countries. Also note that we have dropped the remainder trade share that brings the total to 100% for readability in this and the following figures. 34 To some extent this is because Chinese goods went increasingly directly to France or Germany instead of to London first.
16
Table 2: Major Sources of Chinese Imports, 1900‐1946
(In percent)
Japan 24.51
USA 22.05
Great Britain 17.02
British India 9.65
Germany 4.19
Java (Dutch East Indies) 2.91
French Indo‐China 2.39
Russia (Soviet Union) 2.10
Belgium‐Luxemburg 1.85
Singapore 1.56
Australia 1.25
Other Countries 10.53
During the first half of the 20th century, near‐by Japan was the most important
source of Chinese imports, followed by the United States while Great Britain had fallen to
third place.35 Beyond the level of overall trade, the nature of goods imported from these
countries differed, with Great Britain and the USA exporting relatively more machinery and
other producer goods than Japan to China. Significant amounts of trade were also imported
from a range of other proximate sources such as Dutch East Indies, French Indo‐China,
Singapore and Australia. Among the Continental European countries, the relatively early
industrializers, Germany and Belgium were more important than Italy, for example.
Overall, while the relative importance of trade with the British Empire had diminished, the
evolution of China’s trade patterns was smoothly transitioning along the foundations laid
during the 19th century.
35 Table 2 shows the patterns of imports directly into China, netting out the trade through Hong Kong.
17
Examining Chinese import patterns for the early 20th century over time indicates
that Japan’s role changed significantly over this half century. Figure 3(a) shows that
Japan’s share rose from 20% to close to 40% of China’s imports between 1915 and 1925
before falling drastically—close to zero at the end of World War II.36 The impact of the war
is also reflected in the reduced share for Germany, which was also among the losing powers
of World War II. The United States, however, had become more important for China as a
source of imports over this period, even though the dramatic increase of the U.S. share of
Chinese imports (to more than 60%) is to some extent due to the fact that the United States
was the only major country whose economy had not been destroyed through World War II.
The changing importance of China’s export destinations is shown in Figure 3(b). The
United States accounts for more and more of China’s exports during this period, ending up
with more than half of China’s exports by the year 1946. Japan’s importance peaked during
this half century after World War I but rapidly fell thereafter. Great Britain’s share of
Chinese exports hovers around 10% throughout this period, and in this way it remains a
major destination for Chinese goods, in contrast to other European countries, such as
France. There is also a relatively high fraction of Chinese exports, about 25%, going to
countries other than those shown in Figure 3(b). This is as much a sign of China’s success
to penetrate new markets as of income growth in another set of countries.
36 To some extent the decline in Japan’s importance is the consequence of territorial changes; Japan’s occupation of Manchuria from 1931 on lowered in this sense China’s foreign trade with Japan.
18
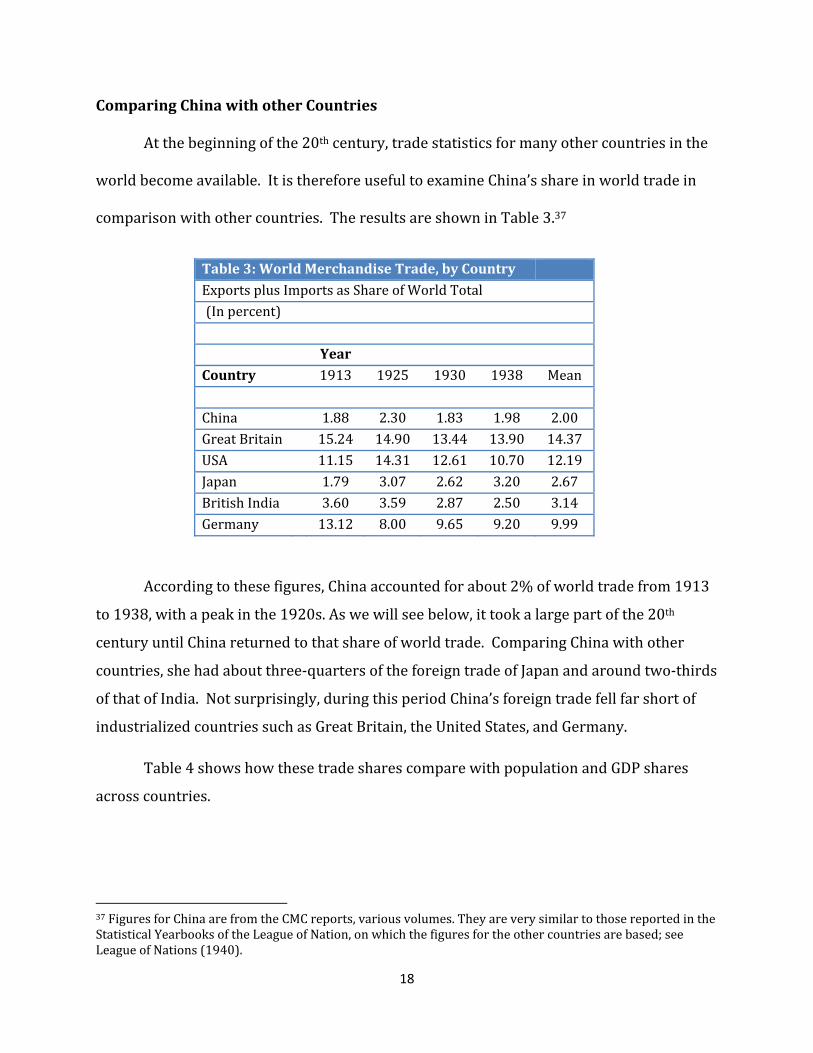
Comparing China with other Countries
At the beginning of the 20th century, trade statistics for many other countries in the
world become available. It is therefore useful to examine China’s share in world trade in
comparison with other countries. The results are shown in Table 3.37
Table 3: World Merchandise Trade, by Country
Exports plus Imports as Share of World Total
(In percent)
Year
Country 1913 1925 1930 1938 Mean
China 1.88 2.30 1.83 1.98 2.00
Great Britain 15.24 14.90 13.44 13.90 14.37
USA 11.15 14.31 12.61 10.70 12.19
Japan 1.79 3.07 2.62 3.20 2.67
British India 3.60 3.59 2.87 2.50 3.14
Germany 13.12 8.00 9.65 9.20 9.99
According to these figures, China accounted for about 2% of world trade from 1913
to 1938, with a peak in the 1920s. As we will see below, it took a large part of the 20th
century until China returned to that share of world trade. Comparing China with other
countries, she had about three‐quarters of the foreign trade of Japan and around two‐thirds
of that of India. Not surprisingly, during this period China’s foreign trade fell far short of
industrialized countries such as Great Britain, the United States, and Germany.
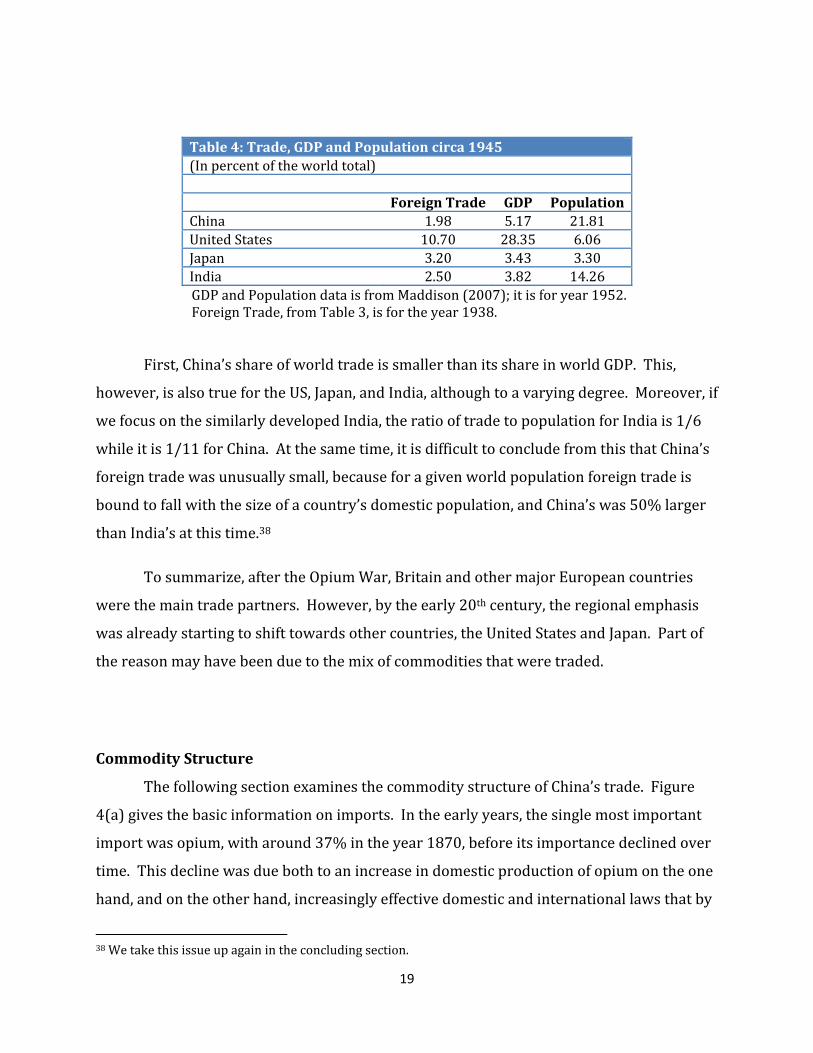
Table 4 shows how these trade shares compare with population and GDP shares
across countries.
37 Figures for China are from the CMC reports, various volumes. They are very similar to those reported in the Statistical Yearbooks of the League of Nation, on which the figures for the other countries are based; see League of Nations (1940).
19
Table 4: Trade, GDP and Population circa 1945
(In percent of the world total)
Foreign Trade GDP Population
China 1.98 5.17 21.81
United States 10.70 28.35 6.06
Japan 3.20 3.43 3.30
India 2.50 3.82 14.26
GDP and Population data is from Maddison (2007); it is for year 1952. Foreign Trade, from Table 3, is for the year 1938.
First, China’s share of world trade is smaller than its share in world GDP. This,
however, is also true for the US, Japan, and India, although to a varying degree. Moreover, if
we focus on the similarly developed India, the ratio of trade to population for India is 1/6
while it is 1/11 for China. At the same time, it is difficult to conclude from this that China’s
foreign trade was unusually small, because for a given world population foreign trade is
bound to fall with the size of a country’s domestic population, and China’s was 50% larger
than India’s at this time.38
To summarize, after the Opium War, Britain and other major European countries
were the main trade partners. However, by the early 20th century, the regional emphasis
was already starting to shift towards other countries, the United States and Japan. Part of
the reason may have been due to the mix of commodities that were traded.
Commodity Structure
The following section examines the commodity structure of China’s trade. Figure
4(a) gives the basic information on imports. In the early years, the single most important
import was opium, with around 37% in the year 1870, before its importance declined over
time. This decline was due both to an increase in domestic production of opium on the one
hand, and on the other hand, increasingly effective domestic and international laws that by
38 We take this issue up again in the concluding section.
20
1917 banned both domestic and imported opium use. Cotton manufactures accounted for
around 30% of all imports until 1920, while woolen manufactures imports, which never
caught on very much in China, started to disappear around the turn of the century.
China became a rice importer around 1890, and this product accounts on average
for 7% of China’s total imports. The share of imports of metals and minerals is quite stable
over time (around 6%), while machinery has been imported in substantial amounts only
starting around 1910. China’s imports became more diverse over time, and the share of
products not explicitly shown in Figure 4(a) is rising over time.
On the export side, the initially dominating categories are tea and silk products,
accounting for about 70% of China’s exports in the year 1870 (see Figure 4(b)). We also
see that the relative importance of tea declines faster than that of silk, although tea
experiences somewhat of a revival from a low level after the year 1920. Animal products
such as hides and skins, but also ores, minerals, and coal, as well as seeds and oils have
been moderately important for China’s exports throughout this period. Around the year
1910 China started to export textile products in substantial amounts, and by the year 1940
textile products account for about 10% of China’s exports.
Summing up our analysis of the commodity structure of China’s trade, she traded
mostly cotton goods and opium for tea and silk before importing a broader range of
producer as well as consumer goods by the early 20th century. In the next section we
examine the commodity structure of China’s foreign trade in more detail by accounting for
new goods that were imported or exported during the treaty port era.
Extensive Margin of Trade
We now show that China’s new goods margin grew substantially during the treaty
port era. The main publication of the CMC, the Returns to Trade, provides detailed
information on the exact type of goods that were traded, which enables us to investigate
how the extensive margin of trade changed from year to year. In the following, we define
21
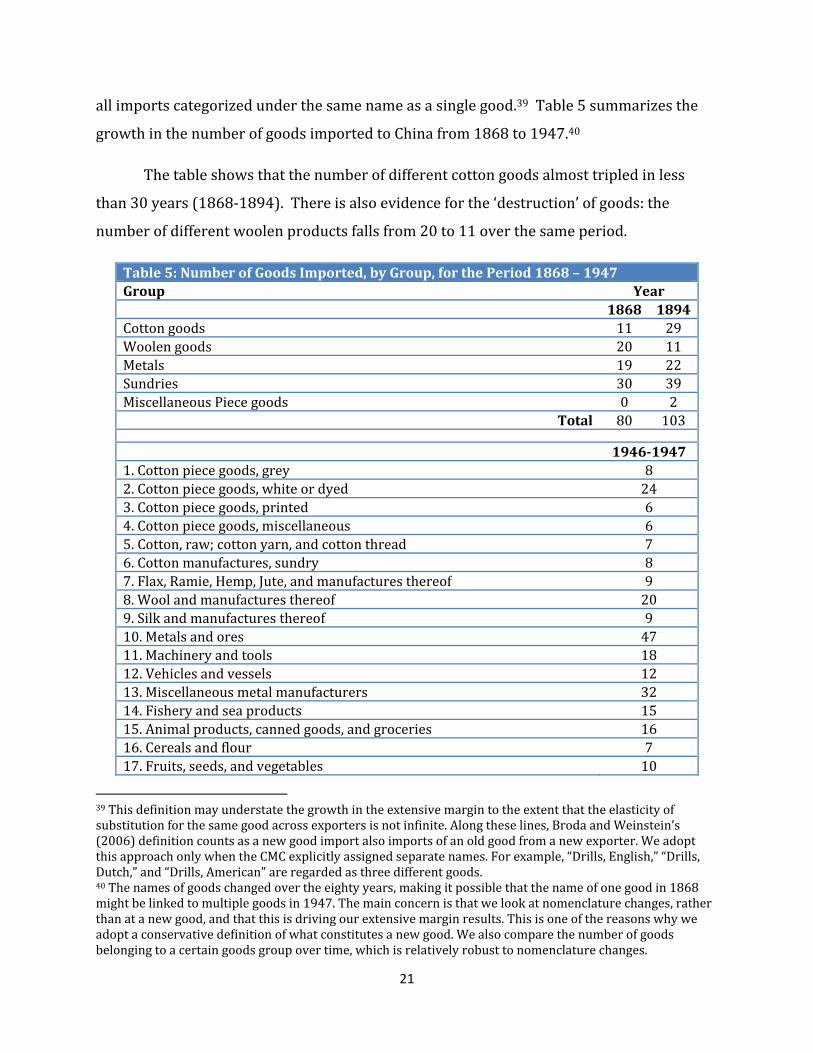
all imports categorized under the same name as a single good.39 Table 5 summarizes the
growth in the number of goods imported to China from 1868 to 1947.40
The table shows that the number of different cotton goods almost tripled in less
than 30 years (1868‐1894). There is also evidence for the ‘destruction’ of goods: the
number of different woolen products falls from 20 to 11 over the same period.
Table 5: Number of Goods Imported, by Group, for the Period 1868 – 1947
Group Year
1868 1894
Cotton goods 11 29
Woolen goods 20 11
Metals 19 22
Sundries 30 39
Miscellaneous Piece goods 0 2
Total 80 103
1946‐1947
1. Cotton piece goods, grey 8
2. Cotton piece goods, white or dyed 24
3. Cotton piece goods, printed 6
4. Cotton piece goods, miscellaneous 6
5. Cotton, raw; cotton yarn, and cotton thread 7
6. Cotton manufactures, sundry 8
7. Flax, Ramie, Hemp, Jute, and manufactures thereof 9
8. Wool and manufactures thereof 20
9. Silk and manufactures thereof 9
10. Metals and ores 47
11. Machinery and tools 18
12. Vehicles and vessels 12
13. Miscellaneous metal manufacturers 32
14. Fishery and sea products 15
15. Animal products, canned goods, and groceries 16
16. Cereals and flour 7
17. Fruits, seeds, and vegetables 10
39 This definition may understate the growth in the extensive margin to the extent that the elasticity of substitution for the same good across exporters is not infinite. Along these lines, Broda and Weinstein’s (2006) definition counts as a new good import also imports of an old good from a new exporter. We adopt this approach only when the CMC explicitly assigned separate names. For example, “Drills, English,” “Drills, Dutch,” and “Drills, American” are regarded as three different goods. 40 The names of goods changed over the eighty years, making it possible that the name of one good in 1868 might be linked to multiple goods in 1947. The main concern is that we look at nomenclature changes, rather than at a new good, and that this is driving our extensive margin results. This is one of the reasons why we adopt a conservative definition of what constitutes a new good. We also compare the number of goods belonging to a certain goods group over time, which is relatively robust to nomenclature changes.
22
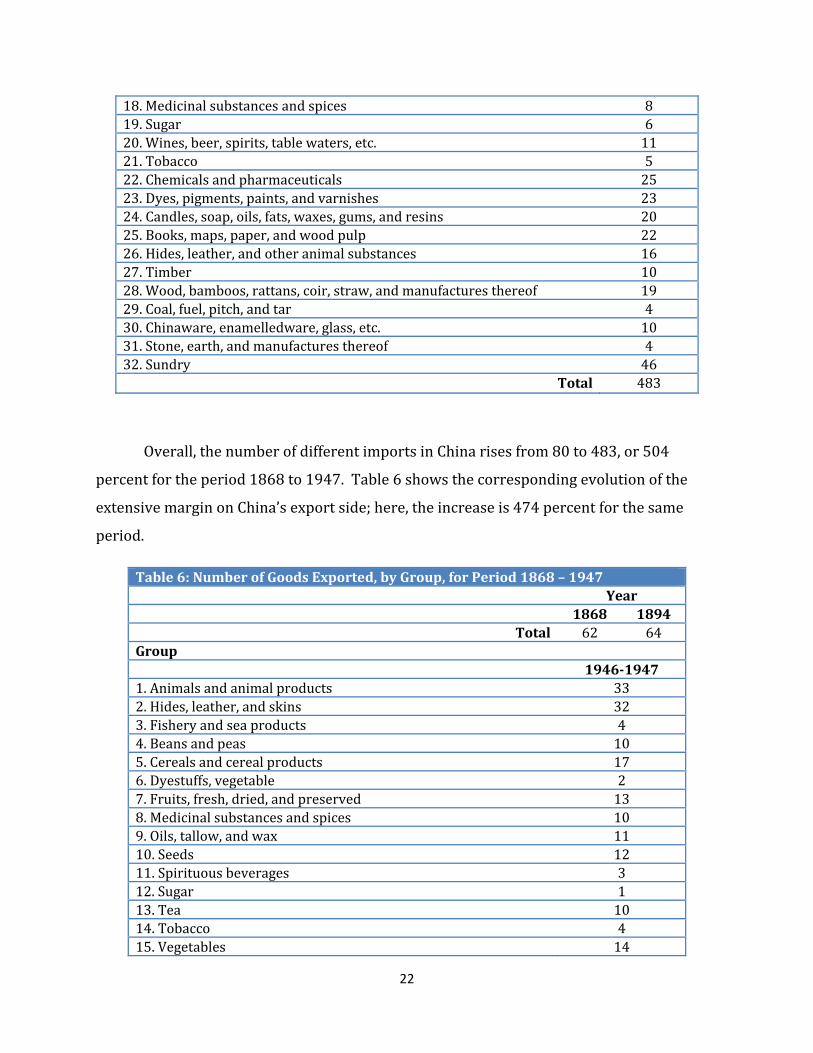
18. Medicinal substances and spices 8
19. Sugar 6
20. Wines, beer, spirits, table waters, etc. 11
21. Tobacco 5
22. Chemicals and pharmaceuticals 25
23. Dyes, pigments, paints, and varnishes 23
24. Candles, soap, oils, fats, waxes, gums, and resins 20
25. Books, maps, paper, and wood pulp 22
26. Hides, leather, and other animal substances 16
27. Timber 10
28. Wood, bamboos, rattans, coir, straw, and manufactures thereof 19
29. Coal, fuel, pitch, and tar 4
30. Chinaware, enamelledware, glass, etc. 10
31. Stone, earth, and manufactures thereof 4
32. Sundry 46
Total 483
Overall, the number of different imports in China rises from 80 to 483, or 504
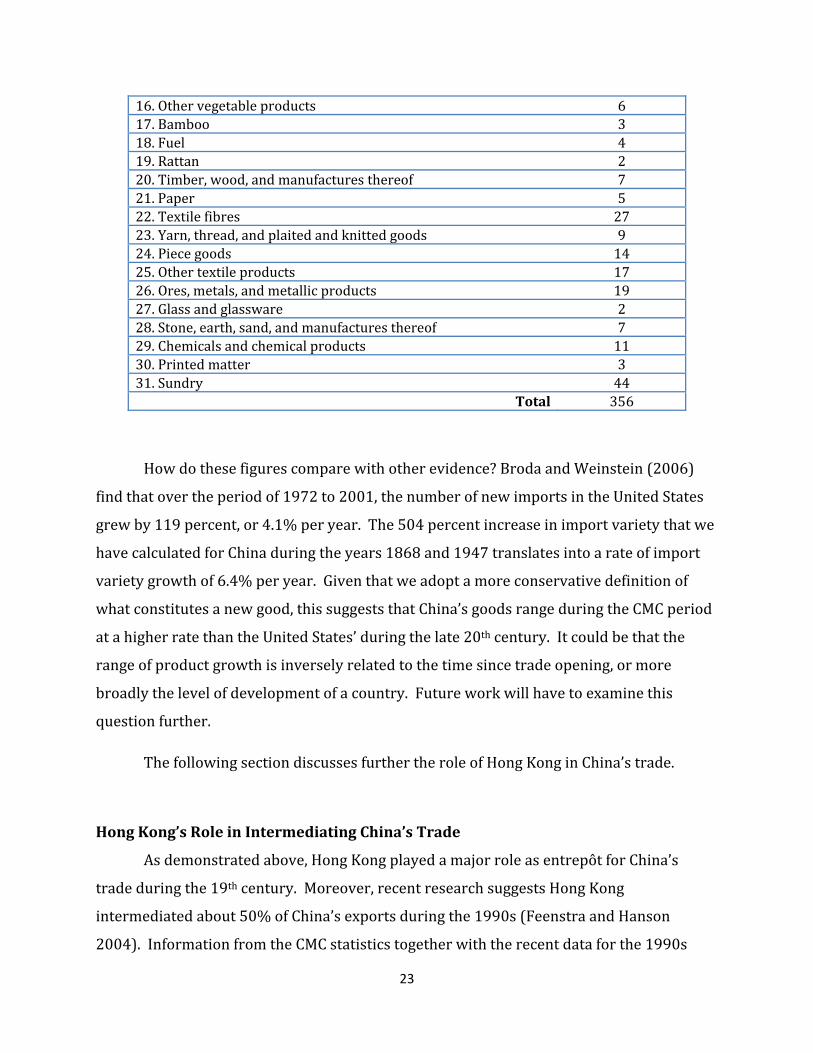
percent for the period 1868 to 1947. Table 6 shows the corresponding evolution of the
extensive margin on China’s export side; here, the increase is 474 percent for the same
period.
Table 6: Number of Goods Exported, by Group, for Period 1868 – 1947
Year
1868 1894
Total 62 64
Group
1946‐1947
1. Animals and animal products 33
2. Hides, leather, and skins 32
3. Fishery and sea products 4
4. Beans and peas 10
5. Cereals and cereal products 17
6. Dyestuffs, vegetable 2
7. Fruits, fresh, dried, and preserved 13
8. Medicinal substances and spices 10
9. Oils, tallow, and wax 11
10. Seeds 12
11. Spirituous beverages 3
12. Sugar 1
13. Tea 10
14. Tobacco 4
15. Vegetables 14
23
16. Other vegetable products 6
17. Bamboo 3
18. Fuel 4
19. Rattan 2
20. Timber, wood, and manufactures thereof 7
21. Paper 5
22. Textile fibres 27
23. Yarn, thread, and plaited and knitted goods 9
24. Piece goods 14
25. Other textile products 17
26. Ores, metals, and metallic products 19
27. Glass and glassware 2
28. Stone, earth, sand, and manufactures thereof 7
29. Chemicals and chemical products 11
30. Printed matter 3
31. Sundry 44
Total 356
How do these figures compare with other evidence? Broda and Weinstein (2006)
find that over the period of 1972 to 2001, the number of new imports in the United States
grew by 119 percent, or 4.1% per year. The 504 percent increase in import variety that we
have calculated for China during the years 1868 and 1947 translates into a rate of import
variety growth of 6.4% per year. Given that we adopt a more conservative definition of
what constitutes a new good, this suggests that China’s goods range during the CMC period
at a higher rate than the United States’ during the late 20th century. It could be that the
range of product growth is inversely related to the time since trade opening, or more
broadly the level of development of a country. Future work will have to examine this
question further.
The following section discusses further the role of Hong Kong in China’s trade.
Hong Kong’s Role in Intermediating China’s Trade
As demonstrated above, Hong Kong played a major role as entrepôt for China’s
trade during the 19th century. Moreover, recent research suggests Hong Kong
intermediated about 50% of China’s exports during the 1990s (Feenstra and Hanson
2004). Information from the CMC statistics together with the recent data for the 1990s
24
give us Hong Kong’s share in the China trade over an extended time period. These data
allow us to examine Hong Kong’s long‐run role as an entrepôt.41
Figure 5 presents the share of Hong Kong in China’s exports and imports between
the years 1865 and 1946. On average, Hong Kong accounted for about a quarter of China’s
trade both on the import and export side. While substantial, this is lower than during the
most recent past. At a minimum, this suggests that trade intermediation does not
necessarily decline over time, even as economies become more sophisticated or
communication systems improve.
Moreover, it is clear from the figure that the importance of Hong Kong was far from
constant over time. The broad pattern is one of rising shares of both imports and exports
during the last 35 years of the 19th century before both shares decline from then until the
mid‐1930s. After that, Hong Kong’s role in intermediating exports and imports follows
different trends: a growing importance for exports, with close to 30% by the end of World
War II, while Hong Kong’s share of China’s imports continues to fall to about 5% in the year
1946. With around 50% of China’s trade going through Hong Kong in the 1990s, this
implies huge swings for the role of Hong Kong as China’s trade intermediary.
What may explain these changes? One possible explanation may be that establishing
international trade links requires paying a fixed cost to acquire knowledge specific to a
market. In that case, trade intermediation can thrive because it may not be optimal for a
given European exporter, for example, to acquire this market‐specific knowledge
individually.42 Along these lines, the decline in trade intermediation for the years 1895 to
1935 could be due to the cumulative effects of learning about selling in China on the part of
41 Another interesting question, beyond the scope of this paper, is how a major trading firm such as Li and Fung today compares to the compradors, or middlemen, of the China trade in the 19th century. 42 Similarly, Feenstra and Hanson (2004) argue for the 1990s that Hong Kong traders may have an informational advantage in trade between China and the rest of the world, which allows them to identify Chinese producers who can meet foreign quality standards. Young (1999) presents evidence that transport costs do not account for all the increases in the price as they pass through entrepôts.
25
the exporters. This might have reduced their costs of selling directly as opposed to through
intermediaries.43
There are two pieces of evidence consistent with the idea that the extent of
intermediation is affected by fixed costs of trade. First, note that right after the opening of
the first five ports, Hong Kong’s share for imports and exports is quite comparable (17%
and 15%, respectively, in the year 1865). However, in the following years the import share
climbed much faster than the export share. From the point of view of a potential new
European exporter with limited knowledge of China, Hong Kong (which was a British
colony since 1842) was likely to be more accessible than one of the recently opened ports
in Qing China. In contrast, from the point of view of foreign traders, it is less crucial for
exports from China to Europe, Japan, or the U.S. to be channeled through Hong Kong before
being shipped to overseas destinations. Therefore it may be not surprising that Hong
Kong’s share of intermediation for exports is lower than for imports, and rising more
slowly.
Second, for a number of years the CMC recorded in detail the ultimate origin of
imports from Hong Kong, and respectively, the ultimate destination of exports from Hong
Kong. These data can be combined with the data on China’s direct foreign trade to examine
the determinants of Hong Kong’s role as an entrepôt. Figure 6(a) shows Hong Kong’s share
of all foreign imports to China and Hong Kong, across exporters in the early 1900s. There is
a clear negative relationship with the size of the trade: countries that export relatively little
to China and Hong Kong, such as Australia or the Philippines, tend to ship through Hong
Kong whereas big traders such as Great Britain or Japan export directly to ports in China.
This pattern is consistent with fixed costs of market access. On the export side, we find a
similar pattern although not quite as strong, see Figure 6(b).
The figures show that several of the countries with relatively small amounts of trade
are located near to South East Asia, and thus are closer to Hong Kong than to the center of
43 Consistent with the idea of market‐specific learning, the CMC noted that initially Western exporters were surprised to not be able to sell large quantities of knives and forks, or pianofortes in 19th century China (CMC 1933, 39).
26
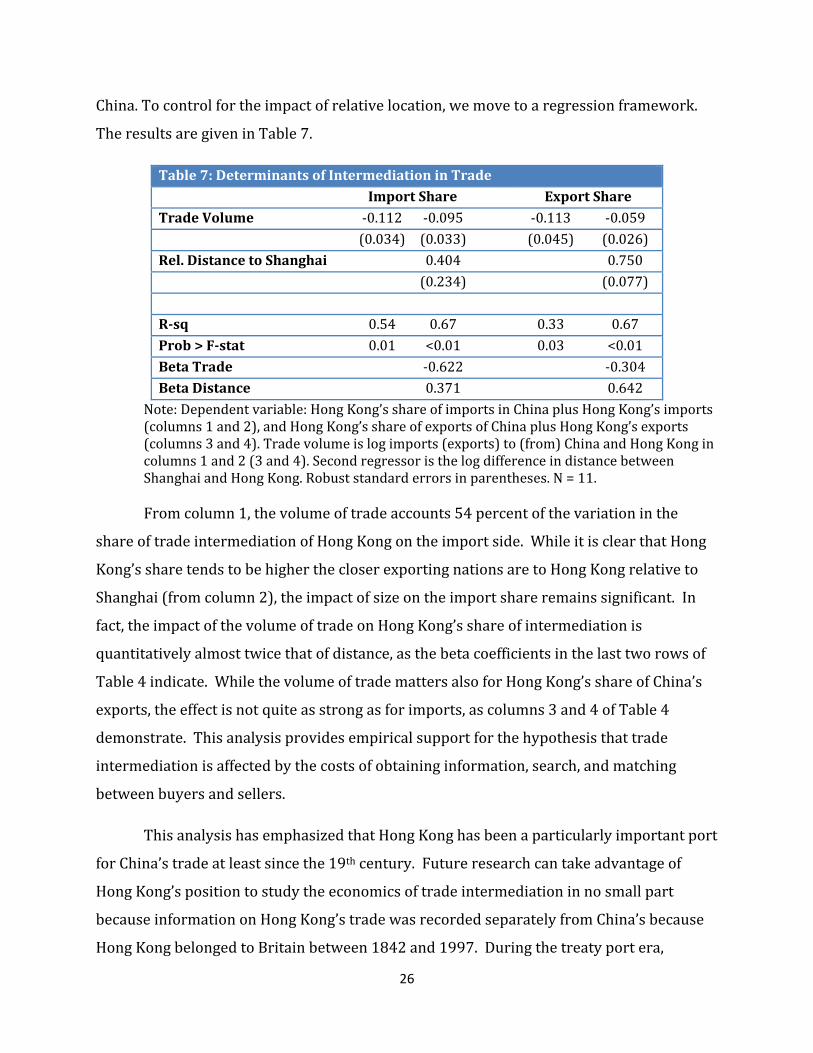
China. To control for the impact of relative location, we move to a regression framework.
The results are given in Table 7.
Table 7: Determinants of Intermediation in Trade
Import Share Export Share
Trade Volume ‐0.112 ‐0.095 ‐0.113 ‐0.059
(0.034) (0.033) (0.045) (0.026)
Rel. Distance to Shanghai 0.404 0.750
(0.234) (0.077)
R‐sq 0.54 0.67 0.33 0.67
Prob > F‐stat 0.01 <0.01 0.03 <0.01
Beta Trade ‐0.622 ‐0.304
Beta Distance 0.371 0.642
Note: Dependent variable: Hong Kong’s share of imports in China plus Hong Kong’s imports (columns 1 and 2), and Hong Kong’s share of exports of China plus Hong Kong’s exports (columns 3 and 4). Trade volume is log imports (exports) to (from) China and Hong Kong in columns 1 and 2 (3 and 4). Second regressor is the log difference in distance between Shanghai and Hong Kong. Robust standard errors in parentheses. N = 11.
From column 1, the volume of trade accounts 54 percent of the variation in the
share of trade intermediation of Hong Kong on the import side. While it is clear that Hong
Kong’s share tends to be higher the closer exporting nations are to Hong Kong relative to
Shanghai (from column 2), the impact of size on the import share remains significant. In
fact, the impact of the volume of trade on Hong Kong’s share of intermediation is
quantitatively almost twice that of distance, as the beta coefficients in the last two rows of
Table 4 indicate. While the volume of trade matters also for Hong Kong’s share of China’s
exports, the effect is not quite as strong as for imports, as columns 3 and 4 of Table 4
demonstrate. This analysis provides empirical support for the hypothesis that trade
intermediation is affected by the costs of obtaining information, search, and matching
between buyers and sellers.
This analysis has emphasized that Hong Kong has been a particularly important port
for China’s trade at least since the 19th century. Future research can take advantage of
Hong Kong’s position to study the economics of trade intermediation in no small part
because information on Hong Kong’s trade was recorded separately from China’s because
Hong Kong belonged to Britain between 1842 and 1997. During the treaty port era,
27
however, all of China’s trade was collected at the level of the port, or more precisely
customs station, and as we noted above these were increasingly located throughout China.
The following section highlights the port‐margin of trade that can be identified in the CMC
data.
Goods Margins and Port Margins in China’s Trade
Our analysis above has shown that the number of different goods in China’s trade
has grown rapidly during the treaty port era. This extensive margin is distinguished from
the intensive margin of trade, which are changes in the trade volume for a given set of
goods. Another dimension that can be examined in our case is changes in trade at different
ports, making it possible to observe how foreign goods diffuse throughout a country. This
is particularly useful when countries are relatively large or interregional transport is
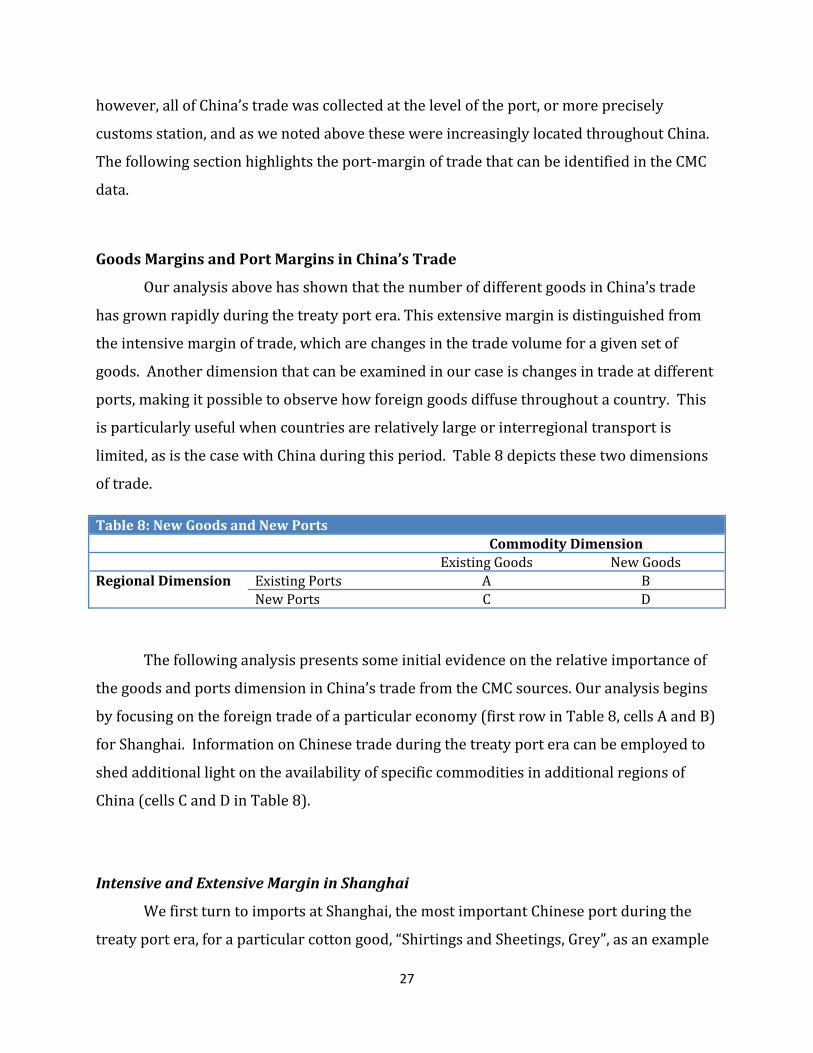
limited, as is the case with China during this period. Table 8 depicts these two dimensions
of trade.
Table 8: New Goods and New Ports
Commodity Dimension
Existing Goods New Goods
Regional Dimension Existing Ports A B
New Ports C D
The following analysis presents some initial evidence on the relative importance of
the goods and ports dimension in China’s trade from the CMC sources. Our analysis begins
by focusing on the foreign trade of a particular economy (first row in Table 8, cells A and B)
for Shanghai. Information on Chinese trade during the treaty port era can be employed to
shed additional light on the availability of specific commodities in additional regions of
China (cells C and D in Table 8).
Intensive and Extensive Margin in Shanghai
We first turn to imports at Shanghai, the most important Chinese port during the
treaty port era, for a particular cotton good, “Shirtings and Sheetings, Grey”, as an example
28
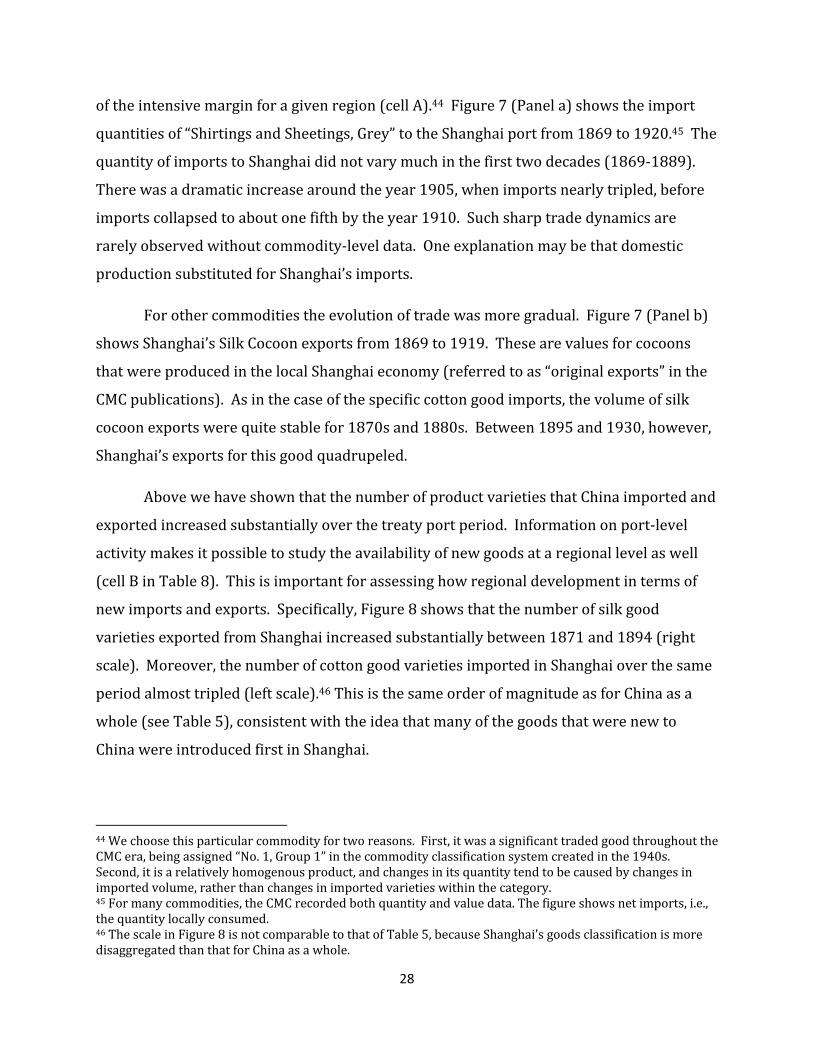
of the intensive margin for a given region (cell A).44 Figure 7 (Panel a) shows the import
quantities of “Shirtings and Sheetings, Grey” to the Shanghai port from 1869 to 1920.45 The
quantity of imports to Shanghai did not vary much in the first two decades (1869‐1889).
There was a dramatic increase around the year 1905, when imports nearly tripled, before
imports collapsed to about one fifth by the year 1910. Such sharp trade dynamics are
rarely observed without commodity‐level data. One explanation may be that domestic
production substituted for Shanghai’s imports.
For other commodities the evolution of trade was more gradual. Figure 7 (Panel b)
shows Shanghai’s Silk Cocoon exports from 1869 to 1919. These are values for cocoons
that were produced in the local Shanghai economy (referred to as “original exports” in the
CMC publications). As in the case of the specific cotton good imports, the volume of silk
cocoon exports were quite stable for 1870s and 1880s. Between 1895 and 1930, however,
Shanghai’s exports for this good quadrupeled.
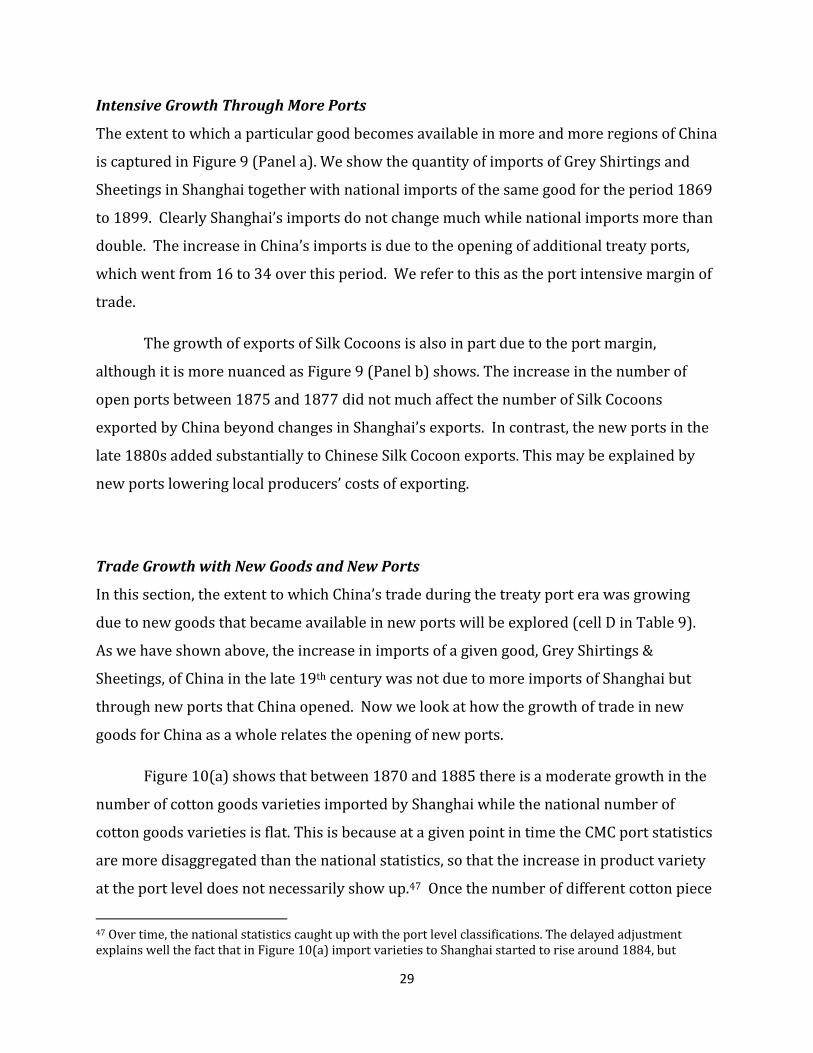
Above we have shown that the number of product varieties that China imported and
exported increased substantially over the treaty port period. Information on port‐level
activity makes it possible to study the availability of new goods at a regional level as well
(cell B in Table 8). This is important for assessing how regional development in terms of
new imports and exports. Specifically, Figure 8 shows that the number of silk good
varieties exported from Shanghai increased substantially between 1871 and 1894 (right
scale). Moreover, the number of cotton good varieties imported in Shanghai over the same
period almost tripled (left scale).46 This is the same order of magnitude as for China as a
whole (see Table 5), consistent with the idea that many of the goods that were new to
China were introduced first in Shanghai.
44 We choose this particular commodity for two reasons. First, it was a significant traded good throughout the CMC era, being assigned “No. 1, Group 1” in the commodity classification system created in the 1940s. Second, it is a relatively homogenous product, and changes in its quantity tend to be caused by changes in imported volume, rather than changes in imported varieties within the category. 45 For many commodities, the CMC recorded both quantity and value data. The figure shows net imports, i.e., the quantity locally consumed. 46 The scale in Figure 8 is not comparable to that of Table 5, because Shanghai’s goods classification is more disaggregated than that for China as a whole.
29
Intensive Growth Through More Ports
The extent to which a particular good becomes available in more and more regions of China
is captured in Figure 9 (Panel a). We show the quantity of imports of Grey Shirtings and
Sheetings in Shanghai together with national imports of the same good for the period 1869
to 1899. Clearly Shanghai’s imports do not change much while national imports more than
double. The increase in China’s imports is due to the opening of additional treaty ports,
which went from 16 to 34 over this period. We refer to this as the port intensive margin of
trade.
The growth of exports of Silk Cocoons is also in part due to the port margin,
although it is more nuanced as Figure 9 (Panel b) shows. The increase in the number of
open ports between 1875 and 1877 did not much affect the number of Silk Cocoons
exported by China beyond changes in Shanghai’s exports. In contrast, the new ports in the
late 1880s added substantially to Chinese Silk Cocoon exports. This may be explained by
new ports lowering local producers’ costs of exporting.
Trade Growth with New Goods and New Ports
In this section, the extent to which China’s trade during the treaty port era was growing
due to new goods that became available in new ports will be explored (cell D in Table 9).
As we have shown above, the increase in imports of a given good, Grey Shirtings &
Sheetings, of China in the late 19th century was not due to more imports of Shanghai but
through new ports that China opened. Now we look at how the growth of trade in new
goods for China as a whole relates the opening of new ports.
Figure 10(a) shows that between 1870 and 1885 there is a moderate growth in the
number of cotton goods varieties imported by Shanghai while the national number of
cotton goods varieties is flat. This is because at a given point in time the CMC port statistics
are more disaggregated than the national statistics, so that the increase in product variety
at the port level does not necessarily show up.47 Once the number of different cotton piece
47 Over time, the national statistics caught up with the port level classifications. The delayed adjustment explains well the fact that in Figure 10(a) import varieties to Shanghai started to rise around 1884, but
30
goods imported in Shanghai begins to increase more rapidly, national statistics also record
a variety increase (after the year 1885). It is reasonable to assume that the trade of
Shanghai brought about the greater variety of goods to China as a whole. More often than
not, Shanghai led in terms of importing new foreign goods and other areas of China
followed. This is supported by the fact that Shanghai’s import varieties declined in 1891
but overall Chinese import varieties did not decline accordingly—the imports of new
varieties by other ports, once started, will no longer be affected by whether Shanghai
continues to consume it. This trend—Shanghai leading the nation—is not apparent when
we look at exports of silk goods. See Figure 10 (Panel b): the sustained increase in the
number of national varieties between 1886 and 1889 comes at a time when the number of
varieties exported by Shanghai is not changing much.
Goods and Port Margins of Trade Growth: Summary
During the treaty port era we can analyze China’s foreign trade from the perspective
of a collection of regions (ports) which were sequentially forced to open for trade due to
Western pressure. Examining how trade diffused within a country at both extensive and
intensive margins helps to better understand how trade liberalization works in large
countries.
On the import side, the number of good varieties is determined by the foreign export
sources, so the opening of new ports leads to a higher volume of trade but hardly any more
varieties. Shanghai is the leader in bringing new goods to China, but it does not necessarily
generate sustained import growth at the intensive margin. New ports follow Shanghai in
importing new goods, which generates higher volume of trade of a given good. To sum up,
in terms of Table 8 cell C is more important than cell A, while cell B is more important than
cell D. On the export side, trade is determined by the local economy surrounding a given
port, so the opening of new ports generates both higher volume and more varieties.
Shanghai’s exports, for example, are determined by local production, and thus good from
national import varieties did not rise accordingly until 1886, exactly the moment when the number of ports rose significantly.
31
Shanghai cannot be exported beyond what is locally produced at either intensive or
extensive margin. In terms of Table 6, again cell C is again more important than cell A,
while here in contrast to imports cell B is less important than cell D.
After this overview of China’s trade both at the aggregate as well as port and
commodity level, we briefly summarize her trade during the period since 1949.
4. China’s Foreign Trade Since 1949
The overall economic system after 1949 was modeled after the Soviet Union, and
raised savings from the rural sector in order to benefit industrial production (Brandt and
Rawski 2008, Naughton 2007). Foreign trade was generally conducted by state enterprises
that had limited incentives t o operate efficiently because their position was not contested
by competition.48 The overall regime adopted by China was geared towards self‐sufficiency
and import substitution, which as such was not atypical for a relatively poor country during
this period. Nevertheless, China’s own trade regime together with the trade liberalizations
of the GATT49 member countries meant that China’s role in world trade shrank after 1949.
While before World War II China accounted for around 2% of the world’s imports plus
exports (see Table 3 above), estimates suggest that China’s share had fallen by the 1950s to
around 1.7% and by the 1970s to around 0.7% (Lardy 1994, p.2).
The quantitative information on China’s foreign trade during the period 1949‐79 is
very limited. This fact stands in stark contrast to the treaty port era, but it corresponds to
the small net gains that China was expecting to reap from participation in world trade.
Foreign trade data was collected, as in most other countries, in the process of
administering trade taxes through customs. However, this took place only intermittently.
48 The State Planning Commission controlled the amounts that could be imported and exported, and the great majority of commodities were traded through a limited number of firms owned and controlled by the Ministry of Foreign Trade. In addition, there were sharp geographic and production divisions in official regulations governing which firms could access foreign trade. An open trade regime was permitted for firms engaged in export processing, but domestic enterprises functioned under a restricted trade system. Also, private firms engaged in international trade in the transitional period until the mid‐1950s (Fukao, Kiyota, and Yue 2006). 49 GATT stands for General Agreement on Tariffs and Trade, founded in 1947 to manage the post‐World War II system of international trade.
32
For example, data collection was discontinued during the years of the Cultural Revolution
(1966 to 1978). Moreover, no customs data was published until the year 1984. Estimates
of China’s foreign trade, both at the aggregate and at the commodity level, have been made
by various analysts based on information from China’s trading partners, from statistical
sources compiled by the UN, the OECD, and other countries.50
These data suggest an average annual growth rate for the value of imports between
the years of 1952 to 1964 of 4%, while exports grew at 6%.51 Trade growth accelerated
subsequently, with annual real export growth of 12.9% per year for exports and 12.3% for
imports between 1970 and 1978.52 For the earlier post‐World War II period, Figure 11
(Panel a and b) show major commodities that China imported and exported, respectively.53
Over the years 1952‐64, produce as well as seeds & nuts became less important export
articles, and China switched from being a net exporter to importer of cereals. There is
evidence for vertical specialization in form of an increasing share of textile fiber imports at
the same time when the textile fabrics and clothing export shares are growing. There is also
substantial intra‐industry trade for some products, for example the non‐electrical
machinery sector.
Economic reforms that opened China to trade with the world began in the year
1978. The oil price shocks and the ensuing world recession together with still high
statutory tariff rates in China throughout the 1980s contributed to a slowdown of China’s
trade growth between 1981 and 1987, when imports grew at an annual rate of 10.4% and
exports with 5.2% on average.54 Compared to other countries in the world, however, these
rates were high. Figure 24 shows the fraction of China in the world’s total exports and
imports of goods and services from 1970 to 2007.55
50 A number of estimates, including those by the Japanese Institute of Development Economics and the U.S. Central Intelligence Service, are compared in Fukao, Kiyota, and Yue (2006). 51 Nominal values, from Fukao, Kiyota, and Yue (2006), Table A1, A2. 52 Nominal value of trade in $ US, from Fukao, Kiyota, and Yue (2006), Table 2 (CIA figures); conversion to real growth using US consumer price indices (CPI) from the US Bureau of Labor Statistics. 53 The listed commodities account for about 50% of China’s imports and 40% of China’s exports. 54 Fukao, Kiyota, and Yue (2006), Table 2; CIA estimates, combined with US CPI. 55 Source: World Development Indicators (WDI), The World Bank.
33
China’s share in world trade did not change much between 1970 and 1978, while
after 1978 China’s share increased substantially, consistent with a trade liberalizing impact
of the 1978 reforms. Other breakpoints in Figure 12 occur around 1990 and around 2000,
and in each case the rate at which China gains in terms of her world trade share increased,
with China’s rate of trade growth increasing overall during this period. Between 1978 and
1990, trade growth is 7.5%, between 1990 and 2000 it comes to 13.5%, and between 2000
and 2007 it is 16.2%.56 An important event that strengthened China’s foreign trade ties
further is its accession to the World Trade Organization in the year 2001.
Despite these impressive increases in trade, only in the year 1994 did China surpass
the share of world trade that it had accounted for in the mid‐1920s (2.3%, see Table 3).
This suggests that a China’s success in world trade over the last several decades may be
less exceptional, and more “back to normal” than it at times appears. It is thus far unclear
what the long‐run share of China in the world’s foreign trade will be. From Figure 12, we
can rule out that it is 2.3%, the value in 1925, because by 2007 China’s share has reached
almost 7%, with no sign of break in the trend. Indeed, in 2008 China’s share in world
merchandise trade accounted for close to 8%, ranking third in the world after the United
States and Germany, although intermediate goods trade plays a larger role for China than
for the other two countries.57
Economically speaking, the year 1925 is implausible because at the time China was
only starting to industrialize whereas large parts of Europe, North America, and Japan were
already much further on their own development path. The relatively long period of 70
years that it took until China’s world trade share reverted back to its 1925 value may also
be a sign of the severity of China’s hiatus in terms of foreign trade during the period from
1949 until 1978.
The following section presents some concluding discussion.
56 From WDI, exports and imports in constant $ 2000. 57 See Koopman, Wang, and Wei (2008), Feenstra and Wei (2010). The latter volume also covers in‐depth analyses of the causes and consequences of China’s very recent trade, which we will not repeat here. The chapters in Feenstra and Wei (2010) examine also China’s inward and outward FDI, macroeconomic dimensions, as well as policy aspects.
34
5. Concluding Discussion
China’s foreign trade over the last 150 years has evolved in some broad cycles.
There was first the restrictive stance of the Qing government which was lifted under
pressure from Western gunboats in the mid‐19th century. After the year 1949, the tide
moved against foreign trade again in form of restrictive policies due to the Cold War, before
general poor performance of the centrally‐planned economy led to another round of trade
opening as part of the post‐1978 reforms. Arguably, China was forced to open its economy
to foreign trade in both instances. And in both cases, foreign trade increased soon after
liberalization.
Employing rich information on China’s foreign trade during the treaty port era from
the Chinese Maritime Customs statistics yields a number of new results. First, there was a
strong expansion in the diversity of products, with many new goods being imported into
and exported from China. Second, information on port‐level trade enables us to document
the regional diffusion of foreign goods through China, which we show was related to the
expansion of the port system over time. Third, the importance of Hong Kong as an
intermediary in China’s trade has undergone long‐term fluctuations, and Hong Kong is also
disproportionately used by relatively small traders; these results support the existence of
learning in the presence of some fixed costs of trade.
China’s trade growth during the last three decades is to some extent the flip side of
the severe trade depression during 1949‐78. China eclipsed her 1920s high in world trade
by the early 1990s, but her trade growth continued. While China’s industrialization is part
of the explanation, it is important to understand how far this process has gone and what its
sources are. The following will approach this by considering China’s trade openness
through the lens of history.
Large countries tend to be less open to trade than smaller countries, not least
because many goods are available domestically. Figure 13 (a) shows the export‐to‐GDP
ratio, our measure of trade openness, versus the share of the world population for a cross‐
35
section of countries in the year 1913. There is a negative and strong relationship between
country size and openness (R‐squared of 0.74). It may not be surprising that China fits the
general pattern in Figure 13(a) because the 19th century opening of China was a form of
colonization in which Western powers imposed their institutions of trade, thereby
triggering institutional change in China that may have made it similar to the mostly
Western(‐influenced) countries shown in the figure.58
Repeating this analysis for the year 2006, almost three decades after China’s most
recent trade opening, a quite different picture emerges. Figure 13(b) shows that China’s
trade openness now is very high‐‐and given China’s size, this is a puzzle. One may think of
China’s substantial processing trade‐‐which raises exports but not GDP‐‐but China is highly
open even compared to other countries with a lot of processing trade, such as Mexico.59
China’s openness today is closer to Denmark’s than to Mexico’s, which is remarkable given
that there are roughly 250 Chinese for every 1 Dane in the world.
If China’s economy today is extraordinarily open to trade, this constitutes a major
reversal from the past. Relatively little is known on how China has transformed itself. In
future work we will employ port‐level information on the regional distribution of China’s
internal and external trade as it was shaped during the treaty port era to better understand
the process of integration into the world economy, and how it is related to their economic
growth. More generally, we believe that further research on the interaction of the
institutional legacy from colonization and China’s foreign trade will shed new light on a
number of important development issues.
58 See Nunn (2007) and Levchenko (2007) for recent work on the role of institutions for trade. 59 Koopman, Wang, and Wei (2008) and Feenstra and Wei (2010) examine China’s processing trade.
36
References
Ahn, JaeBin, Amit Khandelwal, and Shang‐Jin Wei (2010), “The Role of Intermediaries in Facilitating Trade”, NBER Working Paper # 15706. Amiti, Mary, and Caroline Freund (2010), “The Anatomy of China’s Export Growth”, in China’s Growing Role in World Trade, (eds.) R.C. Feenstra and S.‐J. Wei, Chicago: The University of Chicago Press. Antràs, Pol, and Arnaud Costinot (2010), “Intermediated Trade”, NBER Working Paper # 15750. Blum, Bernardo, Sebastian Claro, and Ignatius Horstmann (2009), “Intermediation and the Nature of Trade Costs: Theory and Evidence”, Working Paper. Branstetter, Lee and Nicholas Lardy (2008), “China’s Embrace of Globalization”, in China’s Great Economic Transformation, (eds.) L. Brandt and T. G. Rawski, New York: Cambridge University Press. Naughton, Barry (2007), The Chinese Economy: Transitions and Growth, MIT Press, 2007. Bickers, Robert (2008), “Revisiting the Chinese Maritime Customs Service, 1854‐1950,” The Journal of Imperial and Commonwealth History, Vol. 36, Issue 2: pp. 221‐226. Brambilla, Irene, Amit K. Khandewal, and Peter K. Schott (2010), “China’s Experience under the Multi‐Fiber Arrangement (MFA) and the Agreement on Textiles and Clothing (ATC)”, in China’s Growing Role in World Trade, (eds.) R.C. Feenstra and S.‐J. Wei, Chicago: The University of Chicago Press. Brandt, Loren (1989), Commercialization and Agricultural Development. Central and Easter China, 1870‐1937, Cambridge: Cambridge University Press. Brandt, Loren, and Thomas G. Rawski (2008), China’s Great Economic Transformation, Cambridge University Press: New York. Broda, Christian and Weinstein, David E. (2006), “Globalization and the Gains from Variety”, Quarterly Journal of Economics 121(2): 541‐585. Brunero, Donna (2004), Britain’s Imperial Cornerstone: The Chinese Maritime Customs Service, 1854‐1949. New York: Routledge Curzon. Chow, Gregory C. and Shen, Yan (2005), “Money, Price Level and Output in the Chinese Macro‐Economy,” Asia‐Pacific Journal of Accounting and Economics, Vol. 12, no. 2: 91‐111.
37
Cline, William R. (2010), “Renminbi Undervaluation, China’s Surplus, and the US Trade Deficit”, Policy Brief 10‐20, Peterson Institute for International Economics, Washington, D.C., August 2010. Chinese Maritime Customs (CMC; 2001), Chinese Old Customs Documents (Zhongguo jiu hai guan shi liao) (1859‐1948). Publisher: Beijing: Jinghua Chuban She, 2001. Chinese Maritime Customs (CMC; 1933), “Decennial Reports, 1922‐1931, Vol. 1 – Northern and Yangtze Ports”, Statistical Department of the Inspectorate General of Customs, Shanghai, 1933. Curtin, P.D. (1984), Cross‐Cultural Trade in World History. Cambridge University Press. Dernberger, Robert F. (1975), “The Role of the Foreigner in China’s Economic Development”, in China’s Modern Economy in Historical Perspective, edited by Dwight H. Perkins. Stanford: Stanford University Press. Greenberg, Michael (1951), British Trade and the Opening of China, 1800‐1842. Cambridge: Cambridge University Press. Fairbank, John (1978), “The Creation of the Treaty System” in The Cambridge History of China, Vol. 10 Late Ch’ing, 1800‐1911, Part I, edited by Denis Twitchett and John K. Fairbank. Feenstra, Robert C., and Gordon H. Hanson (2004), “Intermediaries in Entrepôt trade, Hong Kong re‐exports of Chinese goods”, Journal of Economics & Management Strategy, March, Vol. 13 Issue 1, p. 3‐35. Feenstra, Robert C. and Shang‐Jin Wei (2010), “Introduction to 'China's Growing Role in World Trade',” NBER Chapters, in: China's Growing Role in World Trade: 1‐31. Findlay, Ronald and Kevin O’Rourke. 2007. Power and Plenty: Trade, War, and the World Economy in the Second Millenium. Princeton: Princeton University Press. Fukao, Kyoji, Kozo Kiyota, and Ximing Yue (2006), “China’s Long‐Term International Trade Statistics: by Commodity, 1952‐1964 and 1981‐2000”, Journal of International Economic Studies (2006), No. 20, 75‐88. Hanson, Gordon H., and Raymond Robertson (2010), “China and the Manufacturing Exports of Other Developing Countries”, in China’s Growing Role in World Trade, (eds.) R.C. Feenstra and S.‐J. Wei, Chicago: The University of Chicago Press. Hersh, Jonathan, and Hans‐Joachim Voth (2009), “Sweet Diversity: Colonial Goods and the Rise of European Living Standards after 1492”, Working Paper, Wharton School.
38
Ho, Samuel P.S. (1978), Economic Development of Taiwan, 1860‐1970, Yale University Press: New Haven. Hou, Chi‐ming (1965), Foreign Investment and Economic Development in China 1840‐1937. Cambridge, MA: Harvard University Press. Hsiao, Liang‐lin (1974), China’s Foreign Trade Statistics, 1864‐1949. Cambridge, MA: East Asian Research Center Harvard University. Hummels, David and Klenow, Peter J. (2005), “The Variety and Quality of a Nation's Trade”, American Economic Review 95: 704‐723. Keller, Wolfgang, and Carol H. Shiue (2007), “Market Integration and Economic Development: A Long‐run Comparison”, Review of Development Economics 11(1): 107‐123. Koopman, Robert, Zhi Wang, and Shang‐Jin Wei (2008), “How Much of Chinese Exports is Really Made In China? Assessing Domestic Value‐Added When Processing Trade is Pervasive”, NBER Working Paper 14109. Kose, Hajime (2005),“Foreign Trade, Internal Trade, and Industrialization: A Statistical Analysis of Regional Commodity Trade Flows in China, 1914‐1931” in Japan, China, and the Growth of the International Asian Economy, 1850‐1949, edited by Kaoru Sugihara. New York: Oxford University Press. Kose, Hajime (1994), “Chinese Merchants and Chinese Inter‐port Trade” in Japanese Industrialization and the Asian Economy, edited by A. J. H. Latham, Heita Kawakatsu. New York: Routledge. Krugman, Paul M. (2010), “Taking On China”, New York Times, March 2010. Lardy, Nicholas R. (2002), Integrating China into the Global Economy, Brookings Institution, Washington, D.C. Lardy, Nicholas R. (1994), China in the World Economy, Washington D.C.: Institute for International Economics. League of Nations (1940), Statistical Yearbook of the League of Nations, various years. Levchenko, Andrei A. (2007), “Institutional Quality and International Trade.” Review of Economic Studies 74(3): 791‐819. Maddison, Angus (2007), Chinese Economic Performance in the Long Run, 2nd edition, Paris: OECD. Mizoguchi, Toshiyuki and Umemura, Mataji (1988), Basic Economic Statistics of Former Japanese Colonies, 1895–1938, Tokyo: Toyo Keizai Shinposha.
39
Mitchener, Kris and Se Yan (2010), “Globalization, Trade, and Wages: What does History tell us about China?”, NBER Working paper # 15679. Morse, Hosea Ballou (1926), The Chronicles of the East India Trading Company, 1635‐1834. Volumes 1‐5. Oxford: Clarendon Press. Nunn, Nathan (2007), “Relationship‐Specificity, Incomplete Contracts, and the Pattern of Trade.” Quarterly Journal of Economics 122(2): 569‐600. Rawski, Thomas G. (1999), “Reforming China's Economy: What Have We Learned?” The China Journal No. 41: 139‐156. Rawski, Thomas G. (1970), “Chinese Dominance of Treaty Port Commerce and its Implications, 1860‐1875,” Explorations in Economic History, 7(4), p. 451. Reisen, Helmut (2010), “Is China’s currency undervalued?”, VOXEU.org, http://www.voxeu.org/index.php?q=node/1191 Remer, Charles F. (1926), The foreign trade of China, Commercial Press: Shanghai. Sachs, Jeffrey D. and Woo, Wing Thye (2000), “Understanding China's Economic Performance,” Journal of Policy Reform 4, 1 (2000): 1‐50. Van de Ven, Hans (2004), “Globalizing Chinese History,” History Compass (2), pp. 1‐5.
Wang, Zhi, and Shang‐Jin Wei (2010), “What Accounts for the Rising Sophistication of China’s Exports”, in China’s Growing Role in World Trade, (eds.) R.C. Feenstra and S.‐J. Wei, Chicago: The University of Chicago Press. Wei, Shang‐jin (2007), “Don’t over‐sell the benefits of a change in the Chinese exchange‐rate policy”, VOXEU.org, http://www.voxeu.org/index.php?q=node/675 Whalley, John (2006), "China in the World Trading System." CESifo Economic Studies, Vol. 52(2): 215–245. Woo, Wing Thye (1999), “The Real Reasons for China's Growth,” The China Journal, No. 41: 115‐137
Yang, Tuan‐liu and Hou Hou‐pei (1931), Liushiwu nian zhongguo guoji maoyi tongji [Statistics of China’s foreign trade during the last sixty five years]. National Research Institute of Social Sciences, Academia Sinica. Young, Alwyn (1999), “Transport, Processing and Information: Value Added and the Circuitous Movement of Goods.” Working paper, University of Chicago.
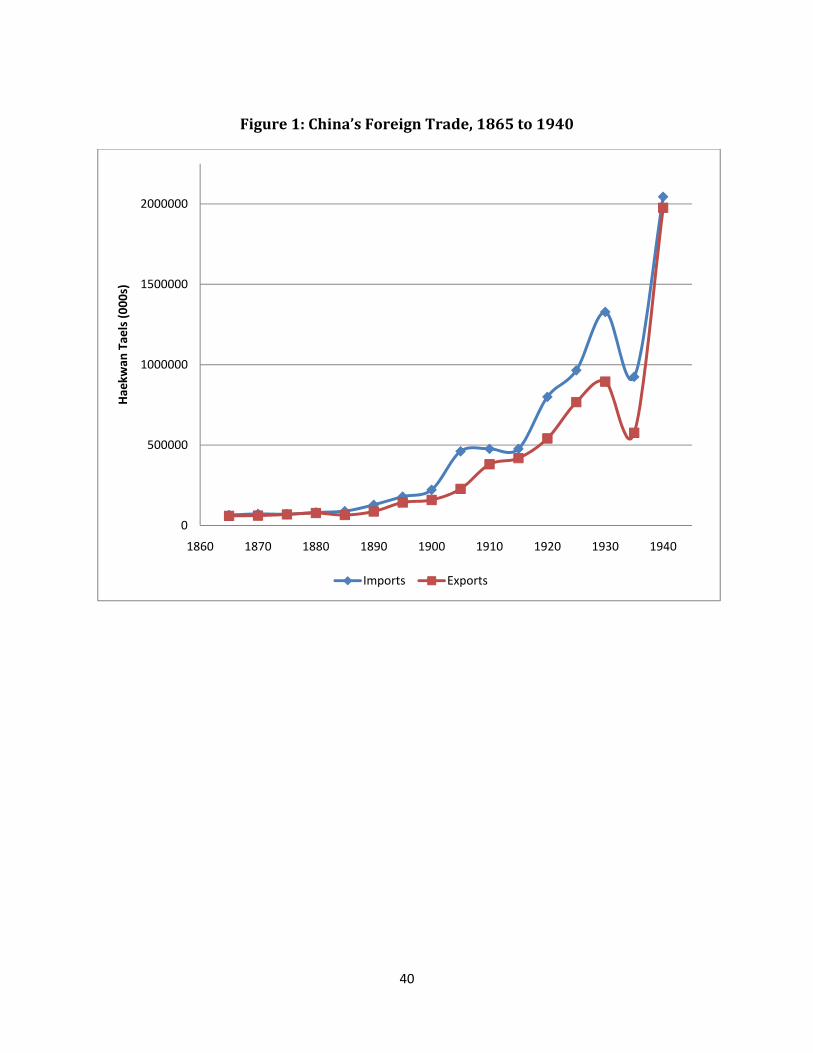
40
Figure 1: China’s Foreign Trade, 1865 to 1940
0
500000
1000000
1500000
2000000
1860 1870 1880 1890 1900 1910 1920 1930 1940
Haekw
an Taels (000s)
Imports Exports
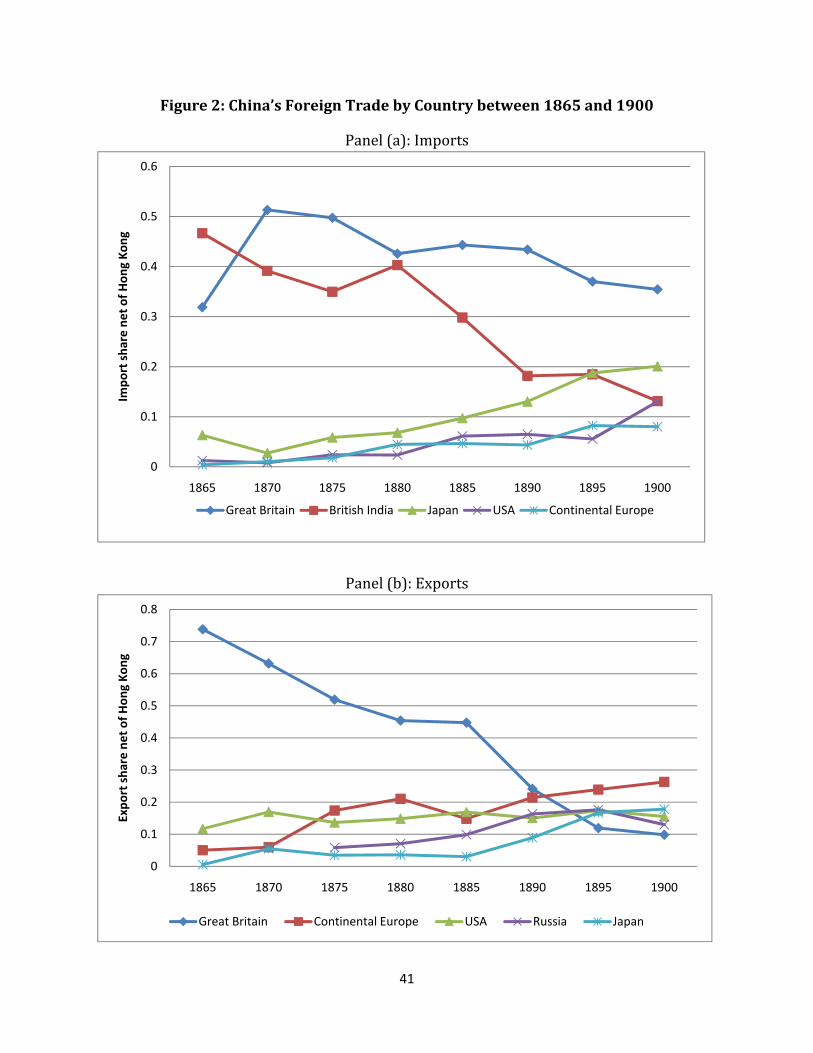
41
Figure 2: China’s Foreign Trade by Country between 1865 and 1900
Panel (a): Imports
Panel (b): Exports
0
0.1
0.2
0.3
0.4
0.5
0.6
1865 1870 1875 1880 1885 1890 1895 1900
Import share net of Hong Kong
Great Britain British India Japan USA Continental Europe
0
0.1
0.2
0.3
0.4
0.5
0.6
0.7
0.8
1865 1870 1875 1880 1885 1890 1895 1900
Export share net of Hong Kong
Great Britain Continental Europe USA Russia Japan
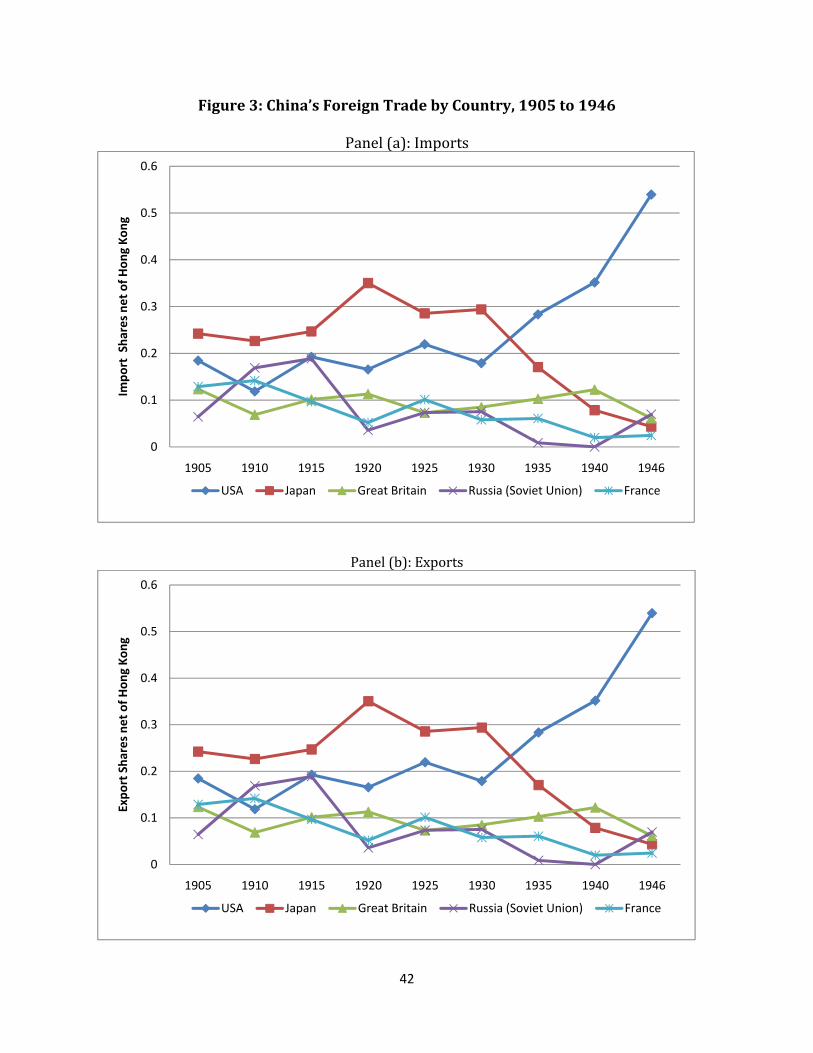
42
Figure 3: China’s Foreign Trade by Country, 1905 to 1946
Panel (a): Imports
Panel (b): Exports
0
0.1
0.2
0.3
0.4
0.5
0.6
1905 1910 1915 1920 1925 1930 1935 1940 1946
Import Shares net of Hong Kong
USA Japan Great Britain Russia (Soviet Union) France
0
0.1
0.2
0.3
0.4
0.5
0.6
1905 1910 1915 1920 1925 1930 1935 1940 1946
Export Shares net of Hong Kong
USA Japan Great Britain Russia (Soviet Union) France
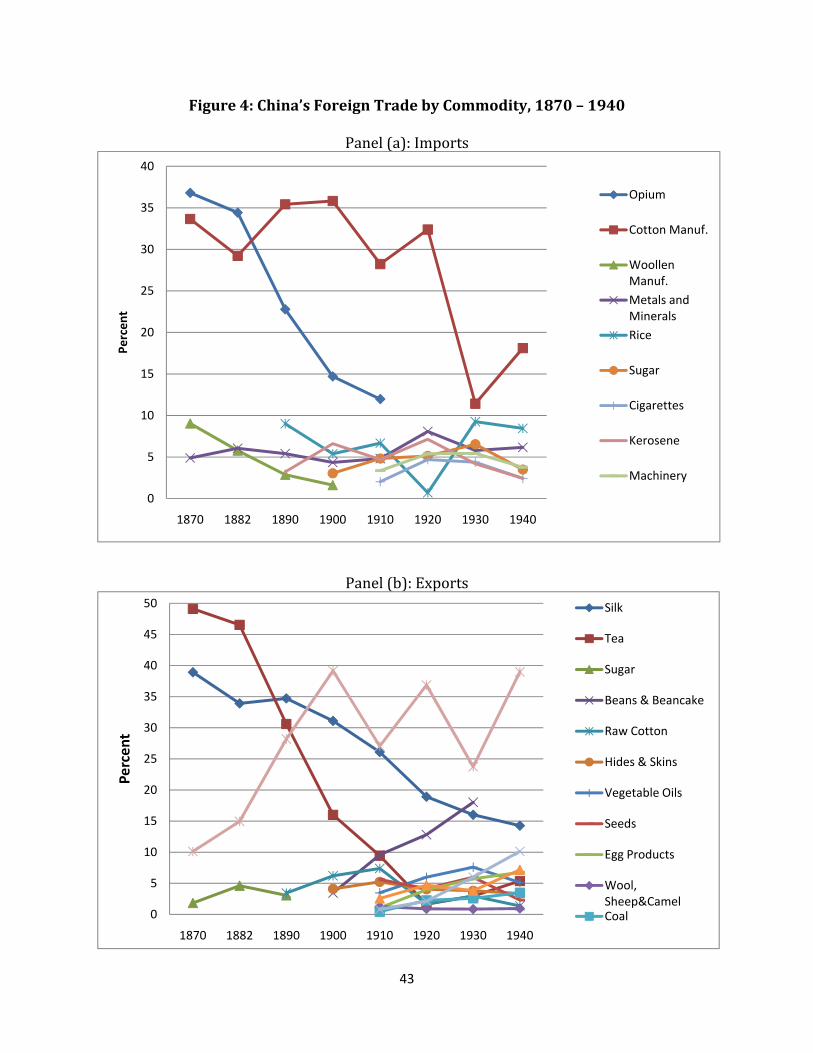
43
Figure 4: China’s Foreign Trade by Commodity, 1870 – 1940
Panel (a): Imports
Panel (b): Exports
0
5
10
15
20
25
30
35
40
1870 1882 1890 1900 1910 1920 1930 1940
Percent
Opium
Cotton Manuf.
Woollen Manuf.
Metals and Minerals
Rice
Sugar
Cigarettes
Kerosene
Machinery
0
5
10
15
20
25
30
35
40
45
50
1870 1882 1890 1900 1910 1920 1930 1940
Percent
Silk
Tea
Sugar
Beans & Beancake
Raw Cotton
Hides & Skins
Vegetable Oils
Seeds
Egg Products
Wool, Sheep&CamelCoal
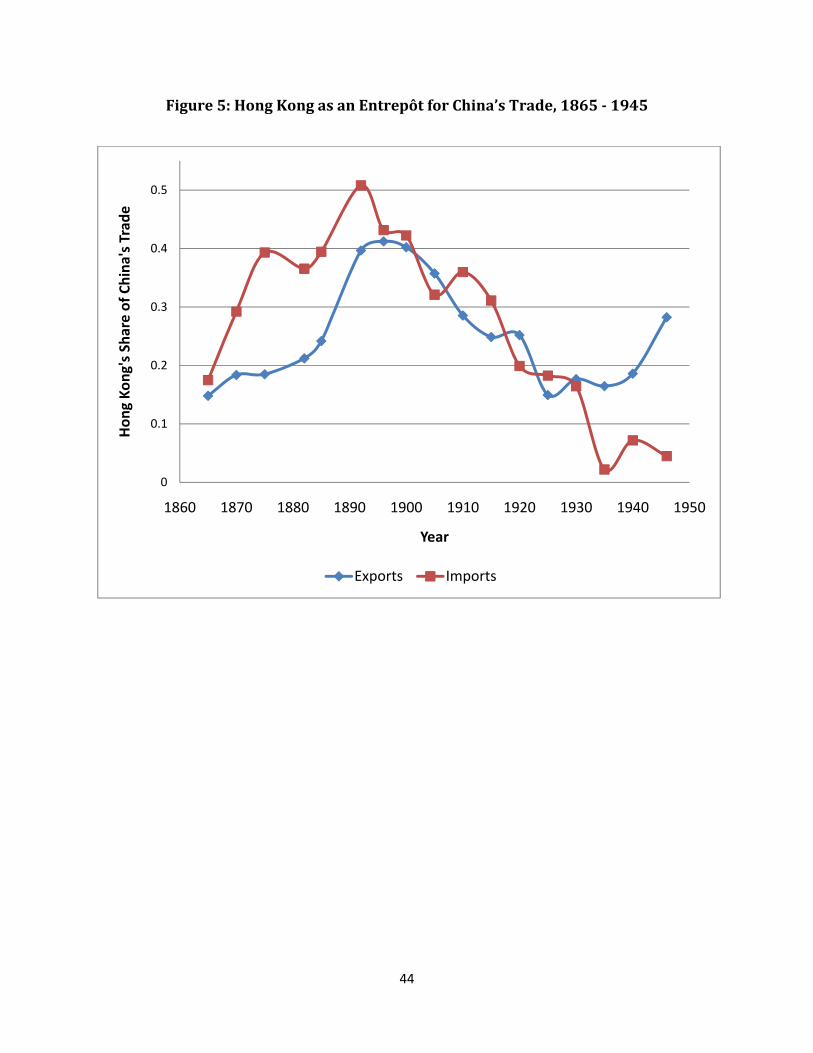
44
Figure 5: Hong Kong as an Entrepôt for China’s Trade, 1865 ‐ 1945
0
0.1
0.2
0.3
0.4
0.5
1860 1870 1880 1890 1900 1910 1920 1930 1940 1950
Hong Kong's Share of China's Trad
e
Year
Exports Imports
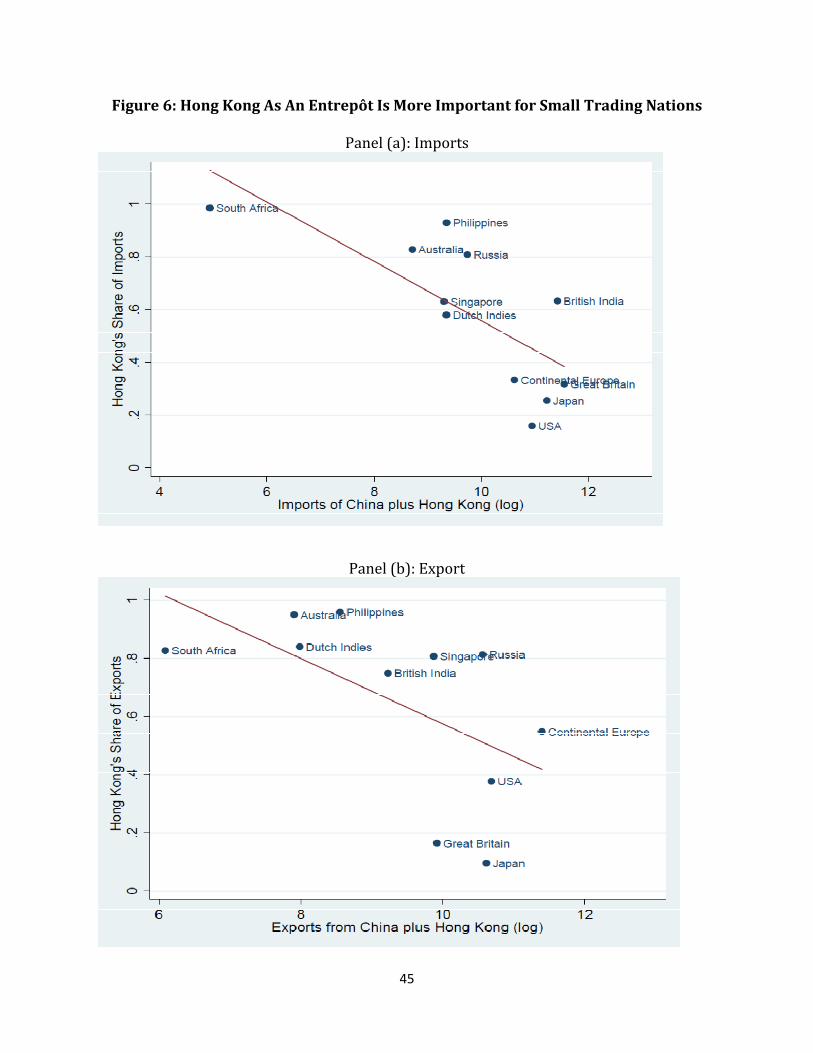
45
Figure 6: Hong Kong As An Entrepôt Is More Important for Small Trading Nations
Panel (a): Imports
Panel (b): Export
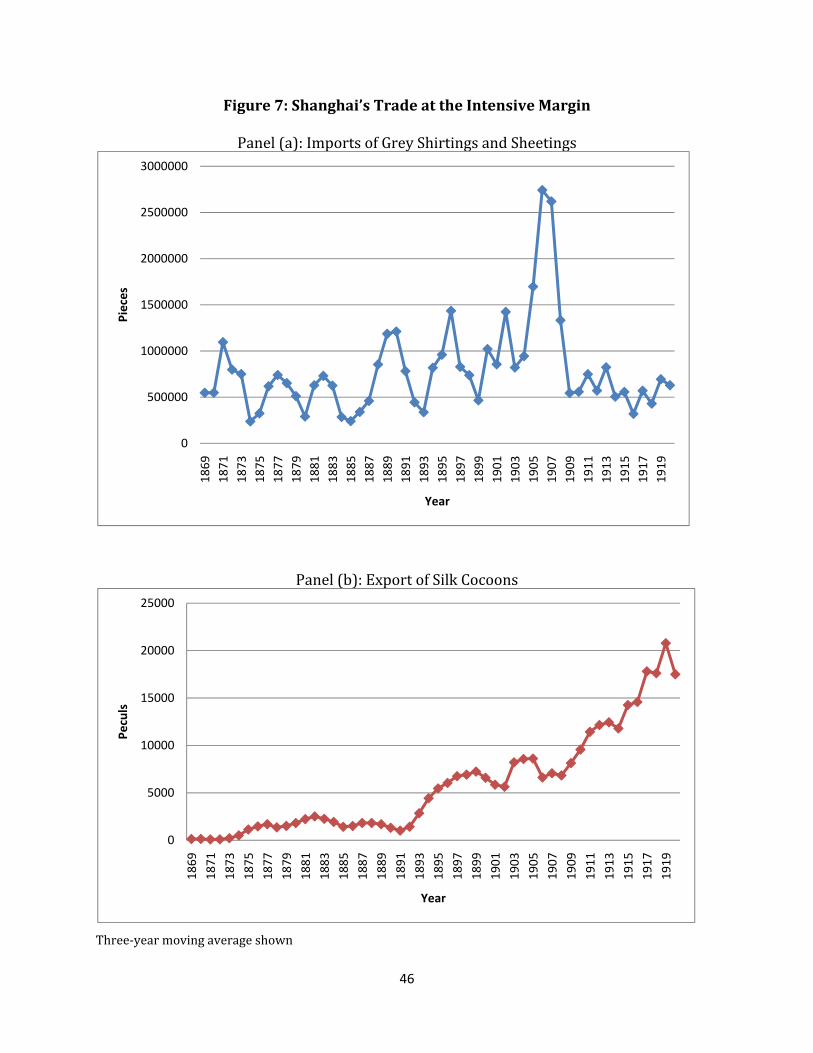
46
Figure 7: Shanghai’s Trade at the Intensive Margin
Panel (a): Imports of Grey Shirtings and Sheetings
Panel (b): Export of Silk Cocoons
Three‐year moving average shown
0
500000
1000000
1500000
2000000
2500000
3000000
1869
1871
1873
1875
1877
1879
1881
1883
1885
1887
1889
1891
1893
1895
1897
1899
1901
1903
1905
1907
1909
1911
1913
1915
1917
1919
Pieces
Year
0
5000
10000
15000
20000
25000
1869
1871
1873
1875
1877
1879
1881
1883
1885
1887
1889
1891
1893
1895
1897
1899
1901
1903
1905
1907
1909
1911
1913
1915
1917
1919
Peculs
Year
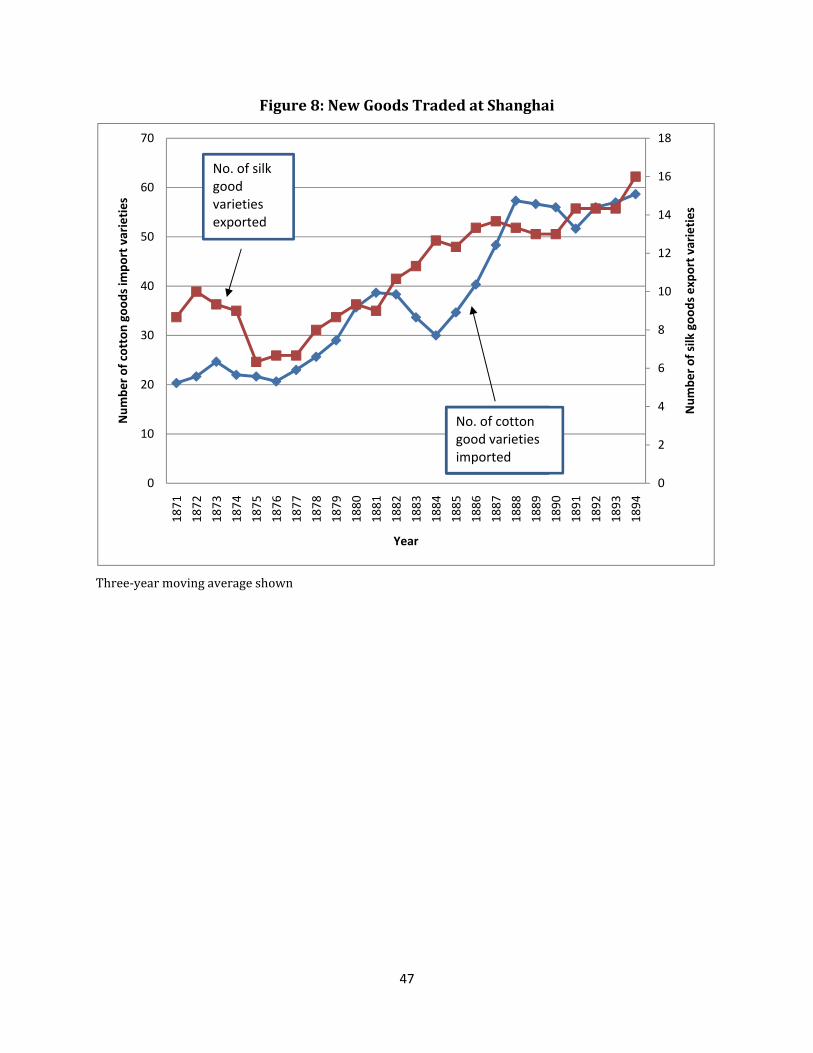
47
Figure 8: New Goods Traded at Shanghai
Three‐year moving average shown
0
2
4
6
8
10
12
14
16
18
0
10
20
30
40
50
60
70
1871
1872
1873
1874
1875
1876
1877
1878
1879
1880
1881
1882
1883
1884
1885
1886
1887
1888
1889
1890
1891
1892
1893
1894
Number of silk goods export varieties
Number of cotton goods im
port varieties
Year
No. of cotton good types imported
No. of cotton good types imported
No. of cotton good varieties imported
No. of silk good varieties exported
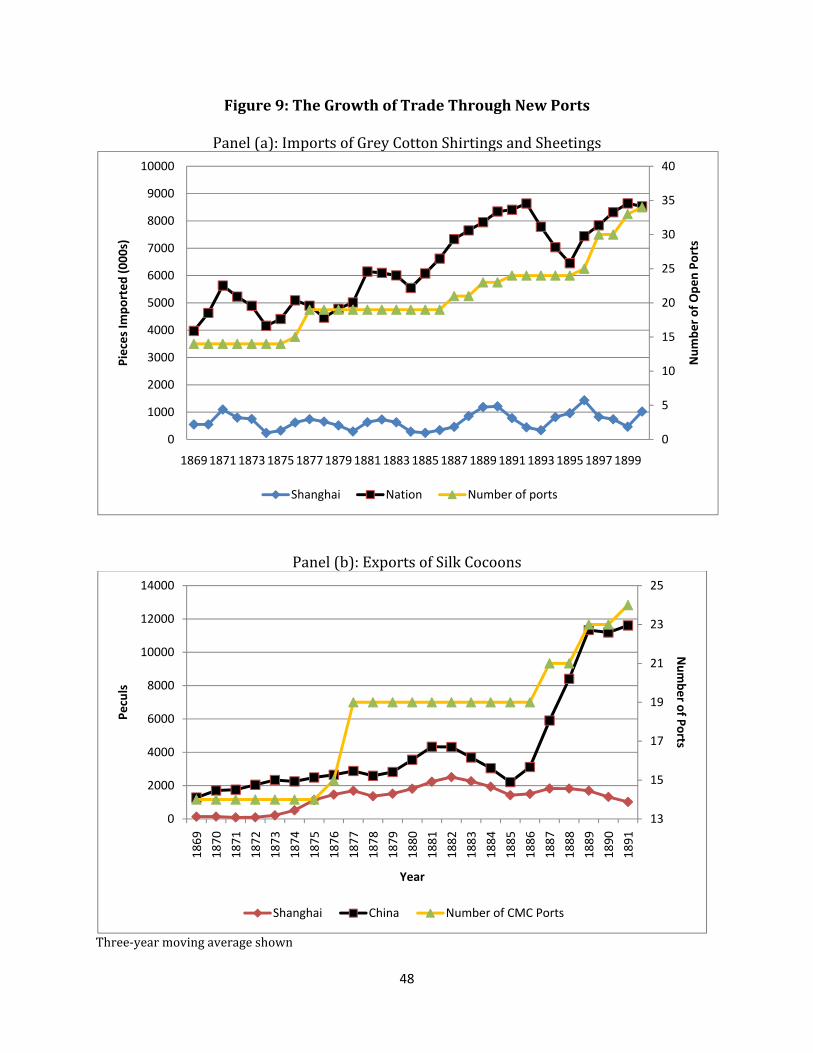
48
Figure 9: The Growth of Trade Through New Ports
Panel (a): Imports of Grey Cotton Shirtings and Sheetings
Panel (b): Exports of Silk Cocoons
Three‐year moving average shown
0
5
10
15
20
25
30
35
40
0
1000
2000
3000
4000
5000
6000
7000
8000
9000
10000
1869187118731875187718791881188318851887188918911893189518971899
Number of Open Ports
Pieces Im
ported (000s)
Shanghai Nation Number of ports
13
15
17
19
21
23
25
0
2000
4000
6000
8000
10000
12000
14000
1869
1870
1871
1872
1873
1874
1875
1876
1877
1878
1879
1880
1881
1882
1883
1884
1885
1886
1887
1888
1889
1890
1891
Number o
f Ports
Peculs
Year
Shanghai China Number of CMC Ports
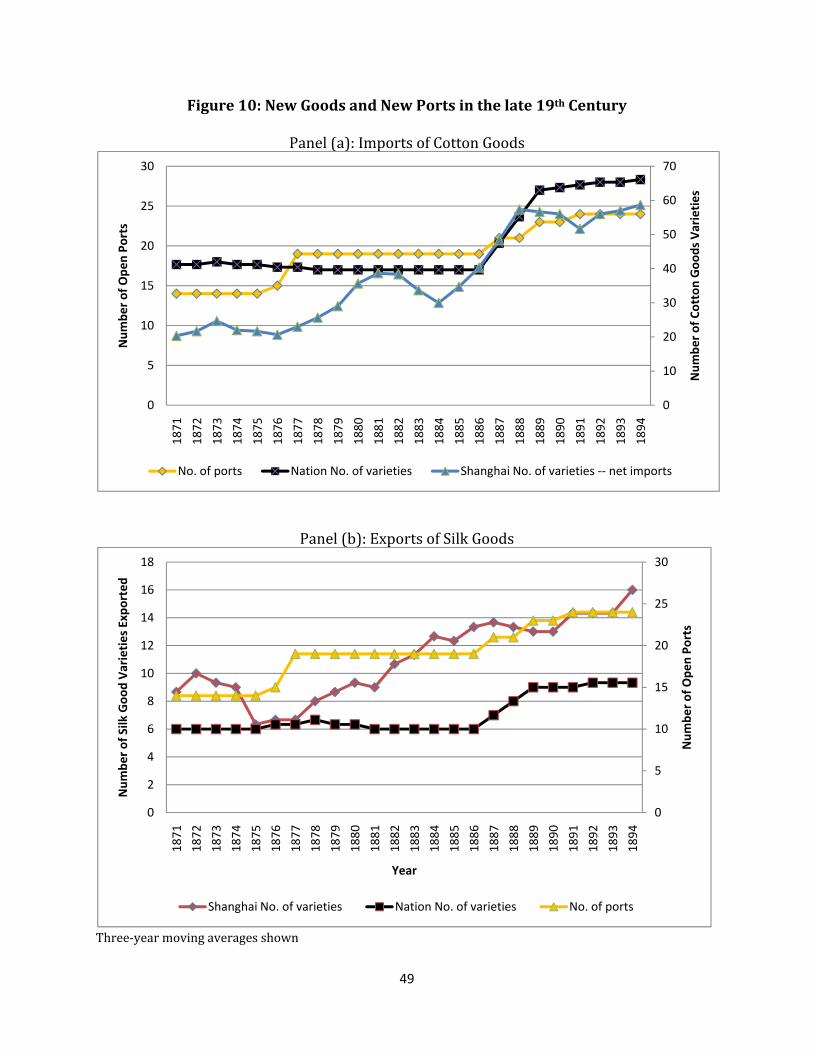
49
Figure 10: New Goods and New Ports in the late 19th Century
Panel (a): Imports of Cotton Goods
Panel (b): Exports of Silk Goods
Three‐year moving averages shown
0
10
20
30
40
50
60
70
0
5
10
15
20
25
301871
1872
1873
1874
1875
1876
1877
1878
1879
1880
1881
1882
1883
1884
1885
1886
1887
1888
1889
1890
1891
1892
1893
1894
Number of Cotton Goods Varieties
Number of Open Ports
No. of ports Nation No. of varieties Shanghai No. of varieties ‐‐ net imports
0
5
10
15
20
25
30
0
2
4
6
8
10
12
14
16
18
1871
1872
1873
1874
1875
1876
1877
1878
1879
1880
1881
1882
1883
1884
1885
1886
1887
1888
1889
1890
1891
1892
1893
1894
Number of Open Ports
Number of Silk Good Varieties Exported
Year
Shanghai No. of varieties Nation No. of varieties No. of ports
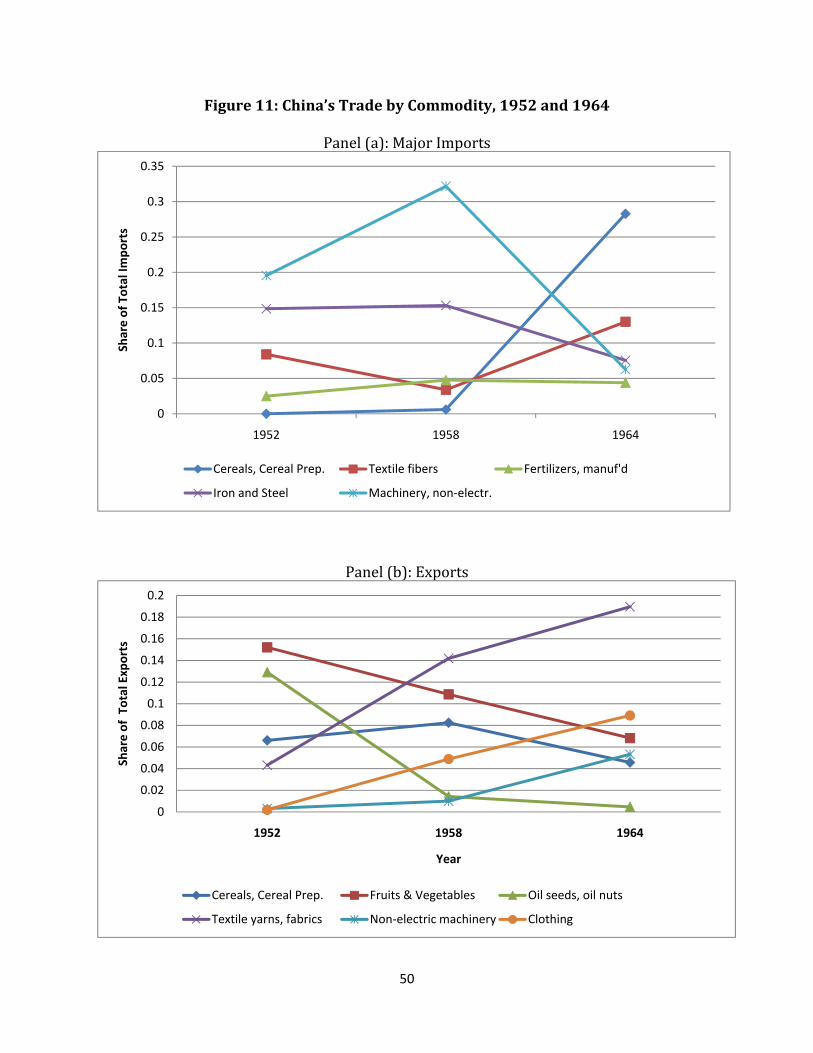
50
Figure 11: China’s Trade by Commodity, 1952 and 1964
Panel (a): Major Imports
Panel (b): Exports
0
0.05
0.1
0.15
0.2
0.25
0.3
0.35
1952 1958 1964
Share of To
tal Imports
Cereals, Cereal Prep. Textile fibers Fertilizers, manuf'd
Iron and Steel Machinery, non‐electr.
0
0.02
0.04
0.06
0.08
0.1
0.12
0.14
0.16
0.18
0.2
1952 1958 1964
Share of Total Exports
Year
Cereals, Cereal Prep. Fruits & Vegetables Oil seeds, oil nuts
Textile yarns, fabrics Non‐electric machinery Clothing
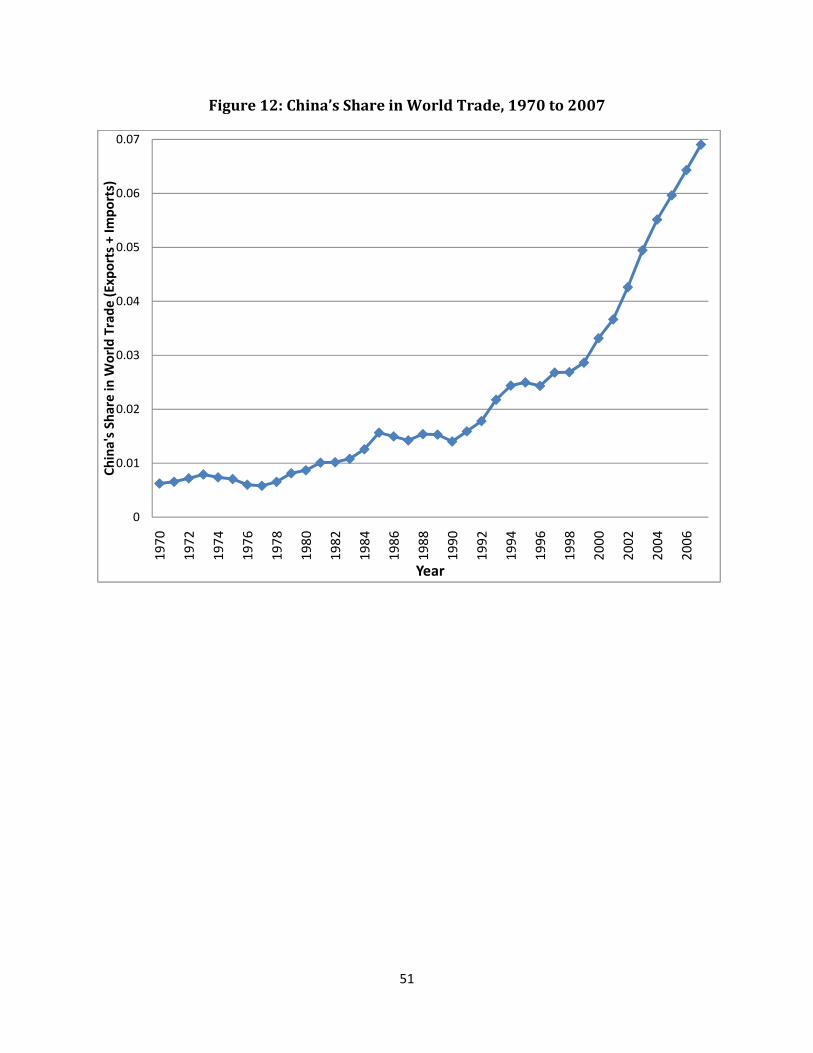
51
Figure 12: China’s Share in World Trade, 1970 to 2007
0
0.01
0.02
0.03
0.04
0.05
0.06
0.07
1970
1972
1974
1976
1978
1980
1982
1984
1986
1988
1990
1992
1994
1996
1998
2000
2002
2004
2006
China's Share in
World Trade (Exports + Im
ports)
Year
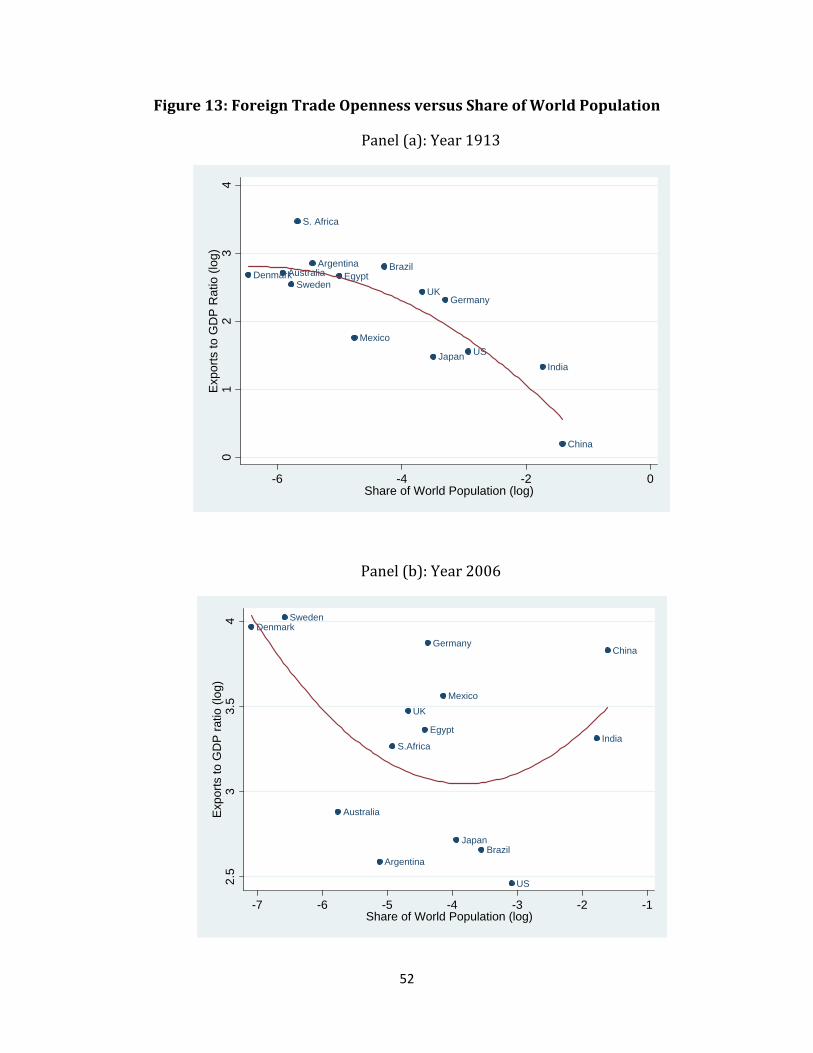
52
Figure 13: Foreign Trade Openness versus Share of World Population
Panel (a): Year 1913
Panel (b): Year 2006
S. Africa
Egypt
US
Mexico
Argentina Brazil
China
IndiaJapan
Germany
Denmark
UKSweden
Australia
01
23
4E
xpor
ts to
GD
P R
atio
(lo
g)
-6 -4 -2 0Share of World Population (log)
Argentina
Australia
Brazil
China
Denmark
Egypt
Germany
India
Japan
Mexico
S.Africa
Sweden
UK
US2.5
33.
54
Exp
orts
to
GD
P r
atio
(lo
g)
-7 -6 -5 -4 -3 -2 -1Share of World Population (log)