Embed Size (px)
Citation preview
Gut, 1970, 11, 430-437
Cholelithiasis: A clinical and dietary survey
MARY WHEELER, LOIS LOFTUS HILLS, AND BETTY LABYFrom the Department of Surgery and the Department of Statistics, University of Melbourne
SUMMARY Cholelithiasis among male and female patients at the Royal Melbourne Hospitalwas studied, and the incidence of the disease in relation to various clinical and dietary factorsis discussed. The patients are distinguished by sex and country of origin, a distinction beingmade between patients born in Australia and those born in southern Europe and now livingin Australia. Appropriate control groups were also studied.
It was shown that the incidence of cholelithiasis is higher in women than in men (3.0% asopposed to 0.7% in the Melbourne Hospital group), and higher among patients born insouthern Europe than in Australia. A correlation was also established between marriageand the disease, and, in women, between having had children and the disease.The dietary investigations showed that in Australia those patients with cholelithiasis
were fatter than the control patients. Equally well there seemed to be a strong family tendencyto develop gallstones. No association was found between cholelithiasis and blood grouping.
In the comparison of the southern European group and the Australian-born group it wasshown that the former group had a higher incidence of the disease (9.3 % as opposed to 2.3 %),and that the overall incidence of cholelithiasis increased with age in men and was constant inwomen. However, when taken separately, the incidence in Australian female patients didincrease with age, the higher proportion of women from southern Europe with the diseasewhere the incidence was, in fact, evenly distributed in all age groups, accounting for thisapparent constancy. It was also shown that a woman born in southern Europe increased therisk to herself of developing gallstones within two to five years of moving to Australia, and thecontributory factors are discussed.
Clinical Investigations
In the clinical survey all patients in the publicwards of the Royal Melbourne Hospital withproven gallstones were interviewed between1 March 1964 and 31 December 1965 (excludingDecember 1964 and January 1965). Only patientswith symptoms attributable to the disease were
chosen for the survey, though it is possible thatsome patients with 'silent' gallstones were
included in the control group.The patients forming the control group were
interviewed during the same period, the group
being designed to have the same ratio, male:female, as the patients with gallstones. Usingrandom numbers one male and four femaleswere chosen from the names of each 100 maleand female patients on the daily admissionlists. Any patient whose gall bladder had beenremoved previously was automatically excludedfrom the control group.During the 20 months of the survey, 396
patients with cholelithiasis were interviewed,79 men and 317 women. The control groupconsisted of 397 patients, including 70 men and327 women.
on 29 March 2019 by guest. P
rotected by copyright.http://gut.bm
j.com/
Gut: first published as 10.1136/gut.11.5.430 on 1 M
ay 1970. Dow
nloaded from
Cholelithiasis: A clinical and dietary survey
Country of Birth Males' Females'
Cholelithiasis Patients Control Patients Total Cholelithiasis Patients Control Patients Total
Australia 56 57 113 201 258 459British Isles 6 7 13 29 34 63Southern Europe 8 3 11 57 20 77Other places 9 3 12 30 IS 45
Total 79 70 149 317 327 644
Table I Country ofbirthI= 4-82, 2 df not significant.'= 30-1, 3 df significant at 1 % level.
PERCENTAGE AGE DISTRIBUTIONCOUNTRY OF BIRTHApproximately 27% of all patients admitted tothe Royal Melbourne Hospital were not bornin Australia. In Table I patients are groupedaccording to their country of birth, eitherAustralia, or the British Isles including England,Scotland, Wales, Northern Ireland, and Eire, orsouthern Europe including Italy, Greece, Malta,and Cyprus. The remaining patients are enteredas coming from other places. Almost half of thepatients born in the British Isles had lived inAustralia for more than 30 years and the majorityfor more than 10 years. On the other hand,most of the patients from southern Europe hadbeen in Australia for less than 10 years.When separated into the four geographical
regions there was a difference in the proportionof females among the group of cholelithiasispatients and the control group. The high percent-age of southern European women with gallstonescontributed largely to this result (Table I).
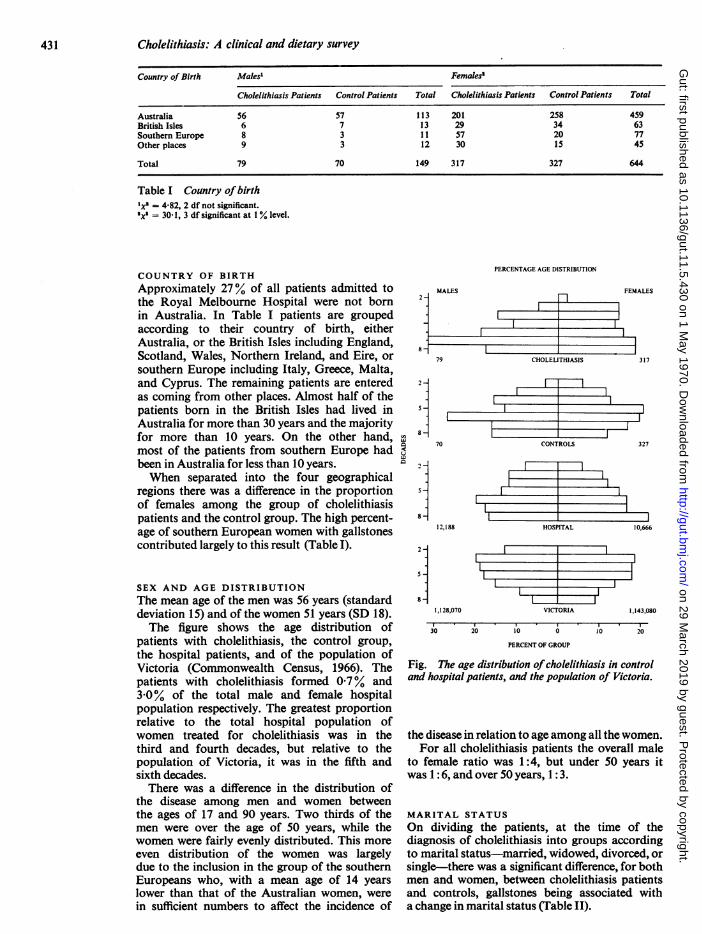
SEX AND AGE DISTRIBUTIONThe mean age of the men was 56 years (standarddeviation 15) and of the women 51 years (SD 18).The figure shows the age distribution of
patients with cholelithiasis, the control group,the hospital patients, and of the population ofVictoria (Commonwealth Census, 1966). Thepatients with cholelithiasis formed 0.7% and3.0% of the total male and female hospitalpopulation respectively. The greatest proportionrelative to the total hospital population ofwomen treated for cholelithiasis was in thethird and fourth decades, but relative to thepopulation of Victoria, it was in the fifth andsixth decades.There was a difference in the distribution of
the disease among men and women betweenthe ages of 17 and 90 years. Two thirds of themen were over the age of 50 years, while thewomen were fairly evenly distributed. This moreeven distribution of the women was largelydue to the inclusion in the group of the southernEuropeans who, with a mean age of 14 yearslower than that of the Australian women, werein sufficient numbers to affect the incidence of
MALES
79
2-
5-
C-8-
70
-IFEMALES
fl--_
1CHOLELITHIASIS 3317
CONTROLS 327
8-
28-
5 -
8-
12,188
1,128,070
30
VICTORIA I1,143,080
20 10 0 10 20
PERCENT OF GROUP
Fig. The age distribution ofcholelithiasis in controland hospital patients, and the population of Victoria.
the disease in relation to age among all the women.For all cholelithiasis patients the overall male
to female ratio was 1:4, but under 50 years itwas 1: 6, and over 50 years, 1: 3.
MARITAL STATUSOn dividing the patients, at the time of thediagnosis of cholelithiasis into groups accordingto marital status-married, widowed, divorced, orsingle-there was a significant difference, for bothmen and women, between cholelithiasis patientsand controls, gallstones being associated witha change in marital status (Table II).
i
r--.1
----1
431
2
on 29 March 2019 by guest. P
rotected by copyright.http://gut.bm
j.com/
Gut: first published as 10.1136/gut.11.5.430 on 1 M
ay 1970. Dow
nloaded from
Mary Wheeler, Lois Loftus Hills, and Betty Laby
Marital Status Males' Females'
Cholelithiasis Control Patients Total Cholelithiasis Control Patients TotalPatients Patients
MarriedObserved value 61 45 106 220 200 420Expected value 56.2 49-8 206-7 213.3WidowedObserved value 12 7 19 76 52 128Expected value 63-0 65.0Separated, divorcedObserved value 11 26 37Expected value 10-1 8-9 18-2 18.8
SingleObserved value 6 18 24 10 49 59Expected value 12-7 11-3 29.0 30.0
Total 79 70 149 317 327 644
Table II Marital status at time of confirmation ofgallstonesx= 9.2, 2 df significant at 1% level.'= 37.2, 3 df significant at 1 % level.
Number of Australians Southern Europeans'Children
All Women" Married Women'
Cholelithiasis Control Total Cholelithiasis Control Total Cholelithiasis Control TotalPatients Patients Patients Patients Patients Patients
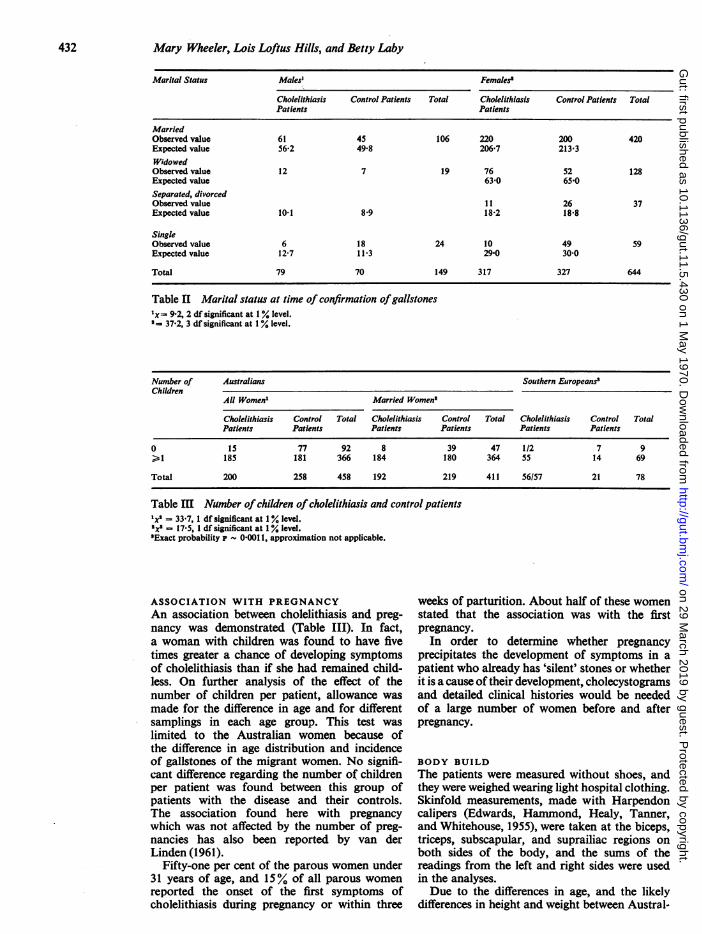
0 1S 77 92 8 39 47 112 7 9>1 185 181 366 184 180 364 55 14 69
Total 200 258 458 192 219 411 56157 21 78
Table M Number of children of cholelithiasis and control patientsxs = 33.7, 1 df significant at 1% level.Ixs - 17.5, 1 df significant at 1% level.'Exact probability P - 0.0011, approximation not applicable.
ASSOCIATION WITH PREGNANCYAn association between cholelithiasis and preg-nancy was demonstrated (Table III). In fact,a woman with children was found to have fivetimes greater a chance of developing symptomsof cholelithiasis than if she had remained child-less. On further analysis of the effect of thenumber of children per patient, allowance wasmade for the difference in age and for differentsamplings in each age group. This test waslimited to the Australian women because ofthe difference in age distribution and incidenceof gallstones of the migrant women. No signifi-cant difference regarding the number of childrenper patient was found between this group ofpatients with the disease and their controls.The association found here with pregnancywhich was not affected by the number of preg-nancies has also been reported by van derLinden (1961).
Fifty-one per cent of the parous women under31 years of age, and 15% of all parous womenreported the onset of the first symptoms ofcholelithiasis during pregnancy or within three
weeks of parturition. About half of these womenstated that the association was with the firstpregnancy.
In order to determine whether pregnancyprecipitates the development of symptoms in apatient who already has 'silent' stones or whetherit is a cause of their development, cholecystogramsand detailed clinical histories would be neededof a large number of women before and afterpregnancy.
BODY BUILDThe patients were measured without shoes, andthey were weighed wearing light hospital clothing.Skinfold measurements, made with Harpendoncalipers (Edwards, Hammond, Healy, Tanner,and Whitehouse, 1955), were taken at the biceps,triceps, subscapular, and suprailiac regions onboth sides of the body, and the sums of thereadings from the left and right sides were usedin the analyses.Due to the differences in age, and the likely
differences in height and weight between Austral-
432
on 29 March 2019 by guest. P
rotected by copyright.http://gut.bm
j.com/
Gut: first published as 10.1136/gut.11.5.430 on 1 M
ay 1970. Dow
nloaded from
Cholelithiasis: A clinical and dietary survey
Males Females
Cholelithiasis Control Cholelithiasis ControlPatients Patients Patients Patients
Age (years)n 56 57 201 258Mean 57.8 53-7 53.9 49.7Standard deviation 14.8 16-6 18.2 16.9
Height (cm)n 55 56 198 248Mean 171.8 172-2 159.2 160-0Standard deviation 7.65 7-88 6-43 6.60
Weight (kg)n 52 57 199 251Mean 69-2 67-7 63.6 58-6Standard deviation 12-3 10.2 11.9 13.1
Biceps (mm)n 39 47 159 206Mean 4.28 3.79 8.75 7-15Standard deviation 1.48 1-25 3-92 3-44
Triceps (mm)n 39 47 159 206Mean 7-56 6-17 17.41 14-08Standard deviation 3-08 2-31 6-56 6-03
Subscapular (mm)n 39 47 159 206Mean 10-98 8-74 16.47 12.52Standard deviation 4.09 3.34 7.28 6.18
Suprailiac (mm)n 39 47 159 206Mean 10-96 7-66 16-55 12-92Standard deviation 502 3-81 7.48 6-84
Table IV Body build measurements of the Australianpatients and controls
Number of Sisters of Family Size" in Family Size' inPropositus with Gallstones Cholelithiasis Patients (317) Control Patients (327)
1 2 3 4 5 1 2 3 4 5
None 74 44 23 36 13 76 74 48 20 15One 6 8 8 4 4 1 2 2 3 0Two and three 0 0 0 0 3 0 0 1 0 1
Total 80 52 31 40 20 77 76 51 23 16
Table V Family histories ofgallstones'Excluding propositus.
ian and migrant patients, the patients, both maleand female, were grouped regionally for multi-variate analyses of age, height, weight, and theskinfold measurements.
Because of the small numbers involved, no
attempt was made to draw any conclusions re-
garding the migrant groups, but, with all variablesincluded, a significant difference for both men
and women appeared between the Australianpatients with cholelithiasis and their controls(Table IV). Although the Australian women withthe disease were older, shorter, and heavierthan their controls, age, height, and weightdid not affect the significance levels. There was,
however, a significant difference in the skinfoldmeasurements. In other words, the Australianwomen with gallstones were fatter than the con-
trol patients, as were the Australian men.
FAMILIAL INCIDENCEPatients were asked if any members of thefamily (parents, siblings, or offspring) were
known to have gallstones. A significantly higherproportion of cholelithiasis patients (64%) hada parent, usually the mother, with a historyof the disease than did the controls (49 %). Also,the women with gallstones had significantlymore sisters who were known to have gallstonesthan had their corresponding controls. Familysize was taken into account when comparingthe siblings, and because of the unequal distri-bution of cholelithiasis between the sexes,
brothers and sisters were separated, but thenumber of brothers was too small for statisticalanalysis (Table V).Of the 397 cholelithiasis patients, 12 had 15
offspring between them with the disease; of the396 controls four had four offspring betweenthem with gallstones. There was only one son ineach of these two groups of offspring.
These results confirm a familial tendency forthe disease, but no conclusion can be drawnas to whether this is due to environmental or
hereditary factors. Van der Linden and Lindelof(1965) have suggested that there is a geneticfactor in the development of cholelithiasis sincethey found that the disease occurred more
often among the brothers and sisters thanamong the husbands and wives of patients withgallstones.
ABO BLOOD GROUPINGThe ABO blood grouping of 384 cholelithiasispatients was compared with that of 4,423hospital patients who in 1961 had been typed
Blood Group Cholelithiasis Royal MelbournePatients Hospital Population
(1961)
Number Number
0 171 (44.5%) 2,091 (47.3%)A 147 (38.3%) 1,732 (39.2%)B 49 (12-8%) 450 (10-1%)AB 17 (4.4%) 150 (3.4%)
Total 384 4,423
Table VI ABO blood groupinglx' = 4.00, 3 df not significant.
before possible blood transfusion. No significantdifference was found between the blood groupingof the men and women, either for the patientswith gallstones or for the hospital patientsin 1961, and so the men and women were com-bined for this test. There was no associationbetween cholelithiasis and blood grouping(Table VI).
Because of the relatively high proportion of
433
on 29 March 2019 by guest. P
rotected by copyright.http://gut.bm
j.com/
Gut: first published as 10.1136/gut.11.5.430 on 1 M
ay 1970. Dow
nloaded from
Mary Wheeler, Lois Loftus Hills, and Betty Laby
southern European patients with cholelithiasis,and the possibility of a different distributionof blood groups, the effect on this distributionwas tested but found not to be significant.An association between cholelithiasis and
blood group A has been reported in Europe byKj0lbye and Neilson (1959), and by Czaplicki,Stanowski, and Szepietowski (1964). In the USAMayo and Fergeson (1953) found no such re-
lationship, while Hauch and Moore (1963)recorded a significant association with groupAB.
Dietary Investigations
Investigations into the influence of diet on thedevelopment of symptoms of gallstone diseasewere carried out separately and in two parts.
Initially all patients in the public wards ofthe Royal Melbourne Hospital with provengallstones were interviewed from March 1964to March 1965. Over the following 12 monthsinformation from a control group was gathered.To fit the time available to the observer, every106th patient admitted to the hospital wasinterviewed. With the male to female ratio setat 2:5, the sex of the patient to be seen nextwas chosen from a randomized list.Of the diet histories taken from patients with
cholelithiasis, 18% were unsatisfactory andwere rejected. Almost 60% of patients con-sidered for the control group were unsuitableas either an interview was not possible, thepatient had a history of cholecystitis, diabetes,or endocrine disorders, or insufficient data on
diet were obtained. The diet histories obtainedfrom the cholelithiasis patients were for an
'average' week before symptoms of gallstonedisease appeared (pain, and/or jaundice), andfrom control patients an 'average' week at thetime of interview. An 'average' week was a
composite ofsummer and winter intake.A computer was used to calculate the average
daily intake in grams of protein, fat, carbo-hydrate, and alcohol from the assessment ofthe quantities of food eaten in a week. The
Country of Birth Cholelithiasi Patients Control Patients
Males Females Males Females
Australia 17 36 15 44British Isles 0 3 1 1Southern Europe 1 9 3 4Other places 1 4 3 1
Total 19 52 22 S0
Table VII Country of birth and sex ofpatients
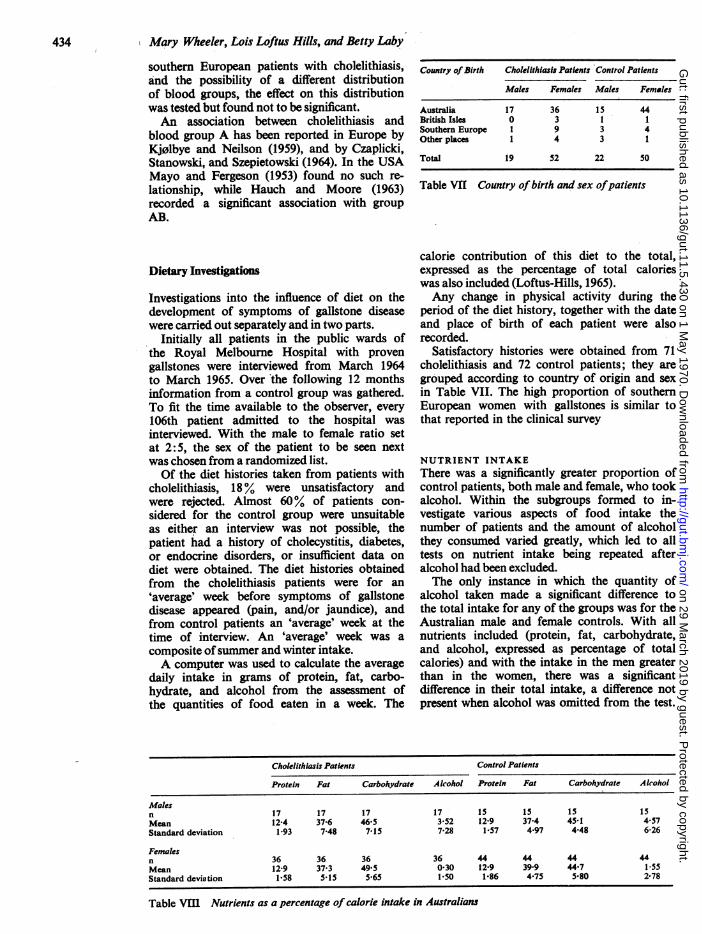
calorie contribution of this diet to the total,expressed as the percentage of total calorieswas also included (Loftus-Hills, 1965).Any change in physical activity during the
period of the diet history, together with the dateand place of birth of each patient were alsorecorded.
Satisfactory histories were obtained from 71cholelithiasis and 72 control patients; they aregrouped according to country of origin and sexin Table VII. The high proportion of southernEuropean women with gallstones is similar tothat reported in the clinical survey
NUTRIENT INTAKEThere was a significantly greater proportion ofcontrol patients, both male and female, who tookalcohol. Within the subgroups formed to in-vestigate various aspects of food intake thenumber of patients and the amount of alcoholthey consumed varied greatly, which led to alltests on nutrient intake being repeated afteralcohol had been excluded.The only instance in which the quantity of
alcohol taken made a significant difference tothe total intake for any of the groups was for theAustralian male and female controls. With allnutrients included (protein, fat, carbohydrate,and alcohol, expressed as percentage of totalcalories) and with the intake in the men greaterthan in the women, there was a significantdifference in their total intake, a difference notpresent when alcohol was omitted from the test.
Cholelithiasis Patients Control Patients
Protein Fat Carbohydrate Alcohol Protein Fat Carbohydrate Alcohol
Malesn 17 17 17 17 1I 15 15 15Mean 12.4 37-6 46.5 3.52 12.9 37.4 45S1 4.57Standard deviation 1-93 7-48 7-15 7-28 1 57 4-97 4-48 6-26
Femalesn 36 36 36 36 44 44 44 44Mean 12-9 37.3 49.5 0.30 12.9 39.9 44.7 l 55Standard deviation 1.58 5.155I65 l 50 1.86 4 75 580 2 78
Table VIII Nutrients as a percentage of calorie intake in Australians
434
on 29 March 2019 by guest. P
rotected by copyright.http://gut.bm
j.com/
Gut: first published as 10.1136/gut.11.5.430 on 1 M
ay 1970. Dow
nloaded from
Cholelithiasis: A clinical and dietary survey
With nutrients expressed as a percentage of totalcalories there was a significant difference betweenAustralian women with cholelithiasis and the con-trol patients in the intake of all nutrients. Asmaller intake of fat by the cholelithiasis patientswas the biggest contributory factor to thedifference. (Later in the survey it was seen thatthe nutrient intake in the country of their birthof the southern European women with chole-lithiasis and their controls showed this samedifference when alcohol was excluded.) It maybe noted that when nutrients were expressed inactual amounts, no significant differences wereobtained.
It is well known that people with gallstonesexperience difficulty in digesting fat. The signifi-cantly lower intake of fat by cholelithiasispatients could be an early reaction to the presenceof gallstones which had not, as yet, caused severesymptoms of the disease.The means and standard deviations for the
Australians of the intake of nutrients expressedas percentage of total calories are shown inTable VIII.
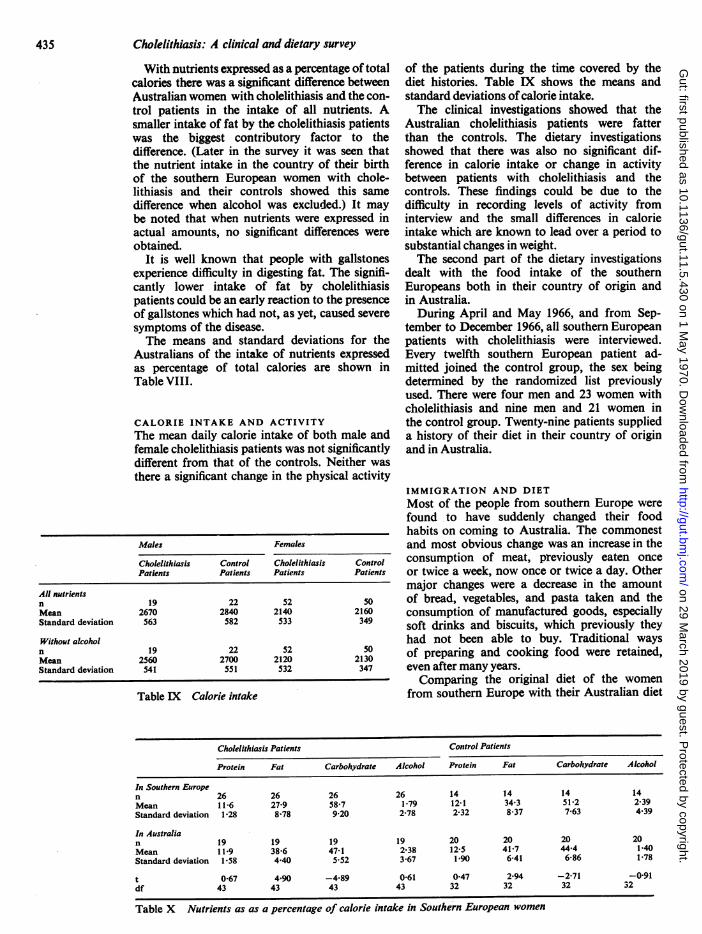
CALORIE INTAKE AND ACTIVITYThe mean daily calorie intake of both male andfemale cholelithiasis patients was not significantlydifferent from that of the controls. Neither wasthere a significant change in the physical activity
Males Females
Cholelithiasis Control Cholelithiasis ControlPatients Patients Patients Patients
All nutrientsn 19 22 52 S0Mean 2670 2840 2140 2160Standard deviation 563 582 533 349
Without alcoholn 19 22 52 S0Mean 2560 2700 2120 2130Standard deviation 541 551 532 347
Table IX Calorie intake
of the patients during the time covered by thediet histories. Table IX shows the means andstandard deviations of calorie intake.The clinical investigations showed that the
Australian cholelithiasis patients were fatterthan the controls. The dietary investigationsshowed that there was also no significant dif-ference in calorie intake or change in activitybetween patients with cholelithiasis and thecontrols. These findings could be due to thedifficulty in recording levels of activity frominterview and the small differences in calorieintake which are known to lead over a period tosubstantial changes in weight.The second part of the dietary investigations
dealt with the food intake of the southernEuropeans both in their country of origin andin Australia.During April and May 1966, and from Sep-
tember to December 1966, all southern Europeanpatients with cholelithiasis were interviewed.Every twelfth southern European patient ad-mitted joined the control group, the sex beingdetermined by the randomized list previouslyused. There were four men and 23 women withcholelithiasis and nine men and 21 women inthe control group. Twenty-nine patients supplieda history of their diet in their country of originand in Australia.
IMMIGRATION AND DIET
Most of the people from southern Europe were
found to have suddenly changed their foodhabits on coming to Australia. The commonestand most obvious change was an increase in theconsumption of meat, previously eaten once
or twice a week, now once or twice a day. Othermajor changes were a decrease in the amountof bread, vegetables, and pasta taken and theconsumption of manufactured goods, especiallysoft drinks and biscuits, which previously theyhad not been able to buy. Traditional waysof preparing and cooking food were retained,even after many years.Comparing the original diet of the women
from southern Europe with their Australian diet
Cholelithiasis Patients Control Patients
Protein Fat Carbohydrate Alcohol Protein Fat Carbohydrate Alcohol
In Southern Europen 26 26 26 26 14 14 14 14Mean 11-6 27-9 58.7 1-79 12-1 34-3 51.2 2-39Standard deviation 1-28 8-78 9-20 2-78 2-32 8-37 7-63 4.39
In Australian 19 19 19 19 20 20 20 20Mean 11 9 38-6 47-1 2-38 12-5 41-7 44-4 1-40Standard deviation 1-58 4.40 5.52 3-67 1-90 6-41 6-86 1-78
t 0-67 4*90 -4-89 0-61 0 47 2.94 -2-71 -0-91df 43 43 43 43 32 32 32 32
Table X Nutrients as as a percentage of calorie intake in Southern European women
435
on 29 March 2019 by guest. P
rotected by copyright.http://gut.bm
j.com/
Gut: first published as 10.1136/gut.11.5.430 on 1 M
ay 1970. Dow
nloaded from
Mary Wheeler, Lois Loftus Hills, and Betty Laby
it was shown that on coming to Australia theyconsumed significantly more fat and less carbo-hydrate. Data for the group of southern Europeanmales are not significant because of the smallnumber of histories obtained (Table X).The increased intake of fat of the females
derived primarily from the increased consump-tion of meat. The protein intake was not signifi-cantly changed in quantity; its quality, however,was greatly enhanced, again because of theincreased meat intake. The carbohydrate intakewas significantly reduced by their eating lessbread and pasta.
Confirmation of the dietary pattern obtainedfor patients in rural Italy is obtained fromFidanza, Fidanza-Alberti, Ferro-Luzzi, andProja (1964).With nutrients, including alcohol, expressed
as a percentage of total calories for the malecholelithiasis and control patients from southernEurope there was no significant difference in thenutrient intake in Australia. There were too fewhistories obtained from these groups of theirlocal diet to allow valid testing.The southern European women with chole-
lithiasis and their respective controls showed nosignificant difference in nutrient intake inAustralia or in southern Europe. It was alsoshown that there was no significant differencebetween the nutrient intake of the southernEuropeans in Australia and that of the localAustralians.
IMMIGRATION AND CHOLELITHIASIS
Change in incidenceOver a five and a half month period(26November1965 to 12 May 1966) the incidence of gallstonesamong southern European women was 9.3%compared with 2-5 % in the Australian women.This difference was significant at the 1 % level.There was no significant difference in the inci-dence in the men.
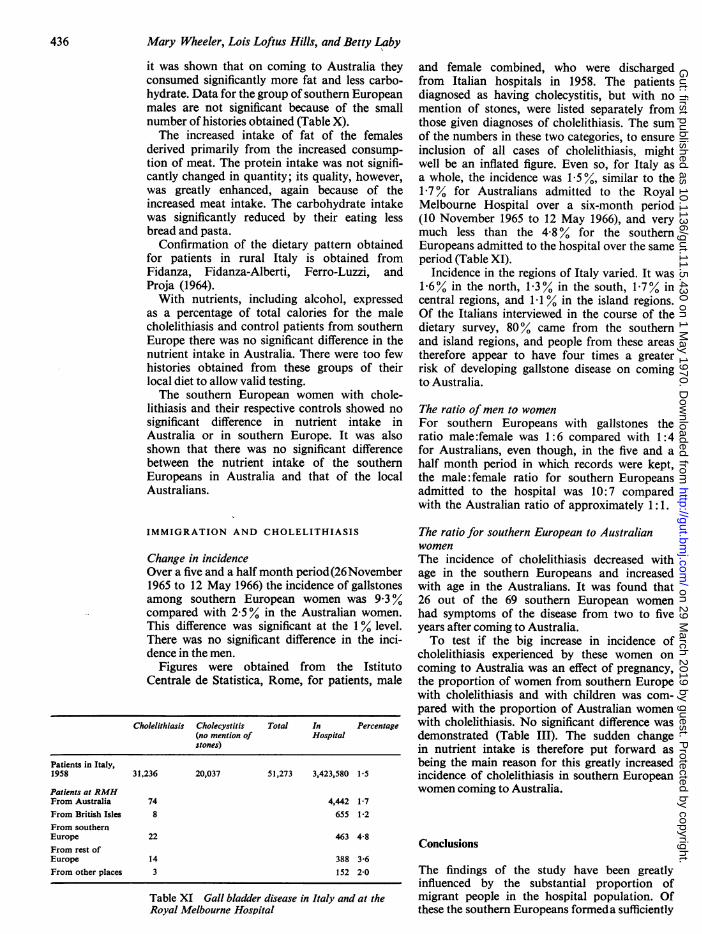
Figures were obtained from the IstitutoCentrale de Statistica, Rome, for patients, male
Cholelithiasis Cholecystitis Total In Percentage(no mention of Hospitalstones)
Patients in Italy,1958 31,236 20,037 51,273 3,423,580 1-5
Patients at RMHFrom Australia 74 4,442 1-7From British Isles 8 655 1.2From southernEurope 22 463 4-8From rest ofEurope 14 388 3-6From other places 3 152 2-0
Table XI Gall bladder disease in Italy and at theRoyal Melbourne Hospital
and female combined, who were dischargedfrom Italian hospitals in 1958. The patientsdiagnosed as having cholecystitis, but with nomention of stones, were listed separately fromthose given diagnoses of cholelithiasis. The sumof the numbers in these two categories, to ensureinclusion of all cases of cholelithiasis, mightwell be an inflated figure. Even so, for Italy asa whole, the incidence was 1.5%, similar to the1.7% for Australians admitted to the RoyalMelbourne Hospital over a six-month period(10 November 1965 to 12 May 1966), and verymuch less than the 4.8% for the southernEuropeans admitted to the hospital over the sameperiod (Table XI).
Incidence in the regions of Italy varied. It was1.6% in the north, 1-3% in the south, 1.7% incentral regions, and 1.1 % in the island regions.Of the Italians interviewed in the course of thedietary survey, 80% came from the southernand island regions, and people from these areastherefore appear to have four times a greaterrisk of developing gallstone disease on comingto Australia.
The ratio ofmen to womenFor southern Europeans with gallstones theratio male:female was 1:6 compared with 1:4for Australians, even though, in the five and ahalf month period in which records were kept,the male: female ratio for southern Europeansadmitted to the hospital was 10:7 comparedwith the Australian ratio of approximately 1:1.
The ratio for southern European to AustralianwomenThe incidence of cholelithiasis decreased withage in the southern Europeans and increasedwith age in the Australians. It was found that26 out of the 69 southern European womenhad symptoms of the disease from two to fiveyears after coming to Australia.To test if the big increase in incidence of
cholelithiasis experienced by these women oncoming to Australia was an effect of pregnancy,the proportion of women from southern Europewith cholelithiasis and with children was com-pared with the proportion of Australian womenwith cholelithiasis. No significant difference wasdemonstrated (Table III). The sudden changein nutrient intake is therefore put forward asbeing the main reason for this greatly increasedincidence of cholelithiasis in southern Europeanwomen coming to Australia.
Conclusions
The findings of the study have been greatlyinfluenced by the substantial proportion ofmigrant people in the hospital population. Ofthese the southern Europeans formeda sufficiently
436
on 29 March 2019 by guest. P
rotected by copyright.http://gut.bm
j.com/
Gut: first published as 10.1136/gut.11.5.430 on 1 M
ay 1970. Dow
nloaded from
437 Cholelithiasis: A clinical and dietary survey
large and distinct group to allow separatemeasurement of some of their characteristics.For the total hospital population the occur-
rence of cholelithiasis was shown to be associatedwith age, sex of the patient, change of maritalstatus, pregnancy, and any family history of thedisease; for the Australians, the degree of bodyfat determined by skinfold measurements,and for the southern European females, changein nutrient intake appeared to be linked withincrease in incidence of the disease.The familial effect on the incidence of chole-
lithiasis could be made up of both hereditaryand environmental factors, and could also bereflected in the finding of greater skinfoldmeasurements in Australians with the diseasethan in controls.
Marriage was shown to be associated with anincreased incidence of gallstone disease, andcould also bring about changes in subcutaneousfat.The association of cholelithiasis and pregnancy
must be a major factor contributing to thegreater incidence of the disease in women thanin men. Although no enquiry was made aboutchange of diet with the onset of pregnancy, thiscould also be a factor.The marked change in nutrient intake of
southern European women on coming to Aus-tralia, not experienced by Australian women,is probably the reason for the increased incidenceof the disease in the former group of patients, forthe effects of pregnancy would not explain thisgreatly increased incidence. Because of theirsmall numbers it was not possible to demonstratethe influence of nutrient change in the southernEuropean males.
In statistical analyses each variable increasesthe sample number required. In this study manymore patients would be needed to establishfully the effects of age, marriage, pregnancy,ethnic origins, diet, and subcutaneous fat whichare all related to each other.
From the separate analyses we have done itwould seem that pregnancy and a suddenchange in diet, both factors leading to a markedchange in the metabolic conditions of individuals,are associated with an increased incidence ofcholelithiasis.
We are grateful to Professor M. R. Ewing, of theDepartment of Surgery, University of Melbourne,who initiated the study, for his continuous encourage-ment and support, and to the honorary medicalstaff of the Royal Melbourne Hospital for permissionto interview their patients. Our thanks are due tothe Royal Melbourne Hospital for work ancillaryto the survey. It is a pleasure to acknowledge thegenerous assistance of Professor E. J. Williams andother members of the staff of the Department ofStatistics, University of Melbourne.
Part of the work was financed by a Thomas andElizabeth Ross Research Scholarship, and part bya grant from the Victor Hurley Research Fund toone of us (M.B.W.).
References
Czaplicki, S., Stanowski, E., and Szepietowski, J. (1964). Bloodgroups in cholelithiasis, gastric cancer and ulcer. Pol.Tyg. lek., 19,630-632.
Edwards, C. A. W., Hammond, W. H., Healy, M. J. R., Tanner,J. M., and Whitehouse, R. H. (1955). Design and accuracyof calipers for measuring subcutaneous tissue thickness.Brit.J.Nutr., 9, 133-143.
Fidanza, F., Fidanza-Alberti, A., Ferro-Luzzi, G., and Proja, M.(1964). Dietary surveys in connection with the epidemi-ology of heart disease: results in Italy. Voeding, 25,502-509.
Hauch, E. W., and Moore, F. J. (1963). Is cholelithiasis associatedwith a specific blood group? Gastroenterology, 44, 125-126.
Kj0obye, J. J., and Nielsen, E. L. (1959). ABO blood groups incholelithiasis. Acta genet. (Basel), 9, 213-220.
Linden, van der W. (1961). Some biological traits in femalegallstone-disease patients. Acta chir. scand., Suppl. 269.
Linden, van der W., and Lindelof, G. (1965). The familial occur-rence of gallstone disease. Acta Genet. (Basel), 15, 159-164.
Loftus-Hills. L., (1965). Nutrient intake calculations by electroniccomputer. J. diet. Ass. Vict., 16, 1.
Mayo, C. W., and Fergeson, J. 0. (1953). Are certain diseasesassociated with specific blood groups or Rh antigen?Arch. Surg., 66, 406-409.
on 29 March 2019 by guest. P
rotected by copyright.http://gut.bm
j.com/
Gut: first published as 10.1136/gut.11.5.430 on 1 M
ay 1970. Dow
nloaded from


![CHOLELITHIASIS [Autosaved]](https://img.pdfslide.net/doc/110x75/577ce5051a28abf1038fa5b3/cholelithiasis-autosaved.jpg)


