Embed Size (px)
Citation preview
CHOLLAS CREEK
BACTERIA TOTAL MAXIMUM DAILY LOAD
2015–2016 COMPLIANCE MONITORING REPORT
Submitted to the San Diego Regional Water Quality Control Board by:
City of San Diego
City of La Mesa
City of Lemon Grove
County of San Diego
San Diego Unified Port District
California Department of Transportation
Prepared by:
Amec Foster Wheeler Environment & Infrastructure, Inc.
San Diego, California
December 2016

Chollas Creek Bacteria TMDL 2015–2016 Compliance Monitoring Report December 2016
i
TABLE OF CONTENTS
Page
ACRONYMS AND ABBREVIATIONS ......................................................................................... v
EXECUTIVE SUMMARY ...................................................................................................... ES-1
1.0 INTRODUCTION ..........................................................................................................1-1
1.1 Document Overview ...........................................................................................1-2
1.2 Chollas Creek Watershed and Background of Bacteria Total Maximum
Daily Load ..........................................................................................................1-2
1.3 Compliance Timeline for Bacteria Total Maximum Daily Load ............................1-4
1.4 Compliance Requirements for Bacteria Total Maximum Daily Load....................1-6
1.4.1 Compliance Determination ......................................................................1-6
1.4.2 Receiving Water Limitations ....................................................................1-7
2.0 MONITORING AND ANALYTICAL METHODS ............................................................2-1
2.1 Compliance Monitoring Locations .......................................................................2-1
2.2 Wet Weather Compliance Monitoring .................................................................2-4
2.3 Dry Weather Compliance Monitoring ..................................................................2-4
2.4 Analytical Methods .............................................................................................2-4
2.5 Optional Field Measurements and Observations ................................................2-5
2.6 Measurement Quality Objectives ........................................................................2-6
2.7 Wet Weather Single-Sample Maximum Exceedance Frequency ........................2-7
2.8 Wet Season Geometric Mean and Exceedance Frequency ................................2-7
2.9 Dry Season Geometric Mean and Exceedance Frequency ................................2-8
2.10 Precipitation and Flow Data ................................................................................2-9
3.0 HYDROLOGY AND MONITORING SUMMARY ...........................................................3-1
3.1 Wet Weather: Hydrology and Monitoring Summary ............................................3-1
3.1.1 Wet Weather Event 1—November 4, 2015 .............................................3-3
3.1.2 Wet Weather Event 2—December 29, 2015 ...........................................3-5
3.1.3 Wet Weather Event 3—January 9, 2016 .................................................3-7
3.2 Dry Weather: Hydrology and Monitoring Summary .............................................3-9
4.0 MONITORING RESULTS .............................................................................................4-1
4.1 Wet Weather Fecal Indicator Bacteria Concentrations .......................................4-1
4.2 Dry Weather Fecal Indicator Bacteria Concentrations ........................................4-3
5.0 COMPLIANCE EVALUATION ......................................................................................5-1
5.1 Wet Weather Single-Sample Maximum Exceedance Frequencies .....................5-1
5.2 Wet Season Geometric Mean Exceedance Frequencies ....................................5-2
5.3 Dry Season Geometric Mean Exceedance Frequencies .....................................5-4
5.4 Progress Toward Attaining Interim and Final Receiving Water Limitations .........5-9
6.0 SUMMARY ...................................................................................................................6-1
6.1 Characterization of Current Fecal Indicator Bacteria Concentrations ..................6-1
6.2 Evaluation of Progress Toward Meeting Bacteria TMDL Numeric Targets .........6-1
7.0 REFERENCES .............................................................................................................7-1
Chollas Creek Bacteria TMDL 2015–2016 Compliance Monitoring Report December 2015
TABLE OF CONTENTS (CONTINUED)
Page
ii
LIST OF TABLES
Table ES-1. 2015–2016 Bacteria TMDL Exceedance Frequencies in Chollas Creek........... ES-3
Table 1-1. Interim and Final Receiving Water Limitations for Creeks ...................................1-8
Table 2-1. Bacteria TMDL Compliance Monitoring Locations in Chollas Creek ....................2-2
Table 2-2. Fecal Indicator Bacteria Constituents ..................................................................2-5
Table 2-3. Optional In Situ Field Measurement Detection Ranges .......................................2-6
Table 3-1. Wet Weather Monthly Rainfall Summary .............................................................3-1
Table 3-2. Rainfall and Flow Totals for Monitored Events ....................................................3-2
Table 3-3. Dry Season Monthly Rainfall Summary ...............................................................3-9
Table 3-4. Dry Weather Sampling Summary and Antecedent Dry Days ............................. 3-11
Table 4-1. Wet Weather Analytical Results ..........................................................................4-2
Table 5-1. 2015–2016 Wet Weather Single-Sample Maximum Exceedance Frequencies .........................................................................................................5-2
Table 5-2. 2015–2016 Wet Weather Exceedance Frequencies and Compliance Reduction Milestones ...........................................................................................5-2
Table 5-3. 2015–2016 Wet Season Geometric Mean Exceedance Frequencies ..................5-3
Table 5-4. 2015–2016 Wet Season Exceedance Frequencies and Compliance Reduction Milestones ...........................................................................................5-3
Table 5-5. 2016 Dry Season Geometric Mean Exceedance Frequencies ............................5-5
Table 5-6. 2015 Dry Season Exceedance Frequencies and Compliance Milestones ...........5-5
Table 5-7. 2015–2016 General Progress Toward Interim and Final RWLs for Chollas Creek ...................................................................................................................5-9
Table 6-1. 2015–2016 Bacteria TMDL Exceedance Frequencies in Chollas Creek Watershed ...........................................................................................................6-3
LIST OF FIGURES
Figure 1-1. Chollas Creek Watershed ...................................................................................1-5
Figure 1-2. Compliance Monitoring Timeline .........................................................................1-6
Figure 2-1. Bacteria TMDL Compliance Monitoring Locations for Chollas Creek ..................2-3
Figure 3-1. Wet Weather 1 Photographs ...............................................................................3-3
Figure 3-2. Wet Weather 1 Hydrographs, SD8(1) and Z Street .............................................3-4
Figure 3-3. Wet Weather 2 Photographs ...............................................................................3-5
Figure 3-4. Wet Weather 2 Hydrographs, SD8(1) and Z Street .............................................3-6
Figure 3-5. Wet Weather 3 Hydrographs, SD8(1) and Z Street .............................................3-8
Figure 3-6. Estimated Percentage of Dry Weather Flow Days During the 2015–2016 Wet Season .............................................................................................................. 3-10
Figure 4-1. 2015–2016 Wet Weather Fecal Indicator Bacteria Concentrations .....................4-3
Figure 4-2 2015–2016 Dry Weather Fecal Indicator Bacteria Concentrations at CTL(1) ......4-4
Figure 4-3. 2015–2016 Dry Weather Fecal Indicator Bacteria Concentrations at SD8(1) ......4-5
Figure 4-4. 2015–2016 Dry Weather Fecal Indicator Bacteria Concentrations at Z Street .....4-6
Figure 5-1. 2015–2016 FIB Densities and Geometric Means—CTL(1)..................................5-6
Figure 5-2. 2015–2016 FIB Densities and Geometric Means—SD8(1) .................................5-7
Figure 5-3. 2015–2016 FIB Densities and Geometric Means— Z Street ...............................5-8
Chollas Creek Bacteria TMDL 2015–2016 Compliance Monitoring Report December 2015
TABLE OF CONTENTS (CONTINUED)
Page
iii
LIST OF APPENDICES
Appendix A QUALITY ASSURANCE/QUALITY CONTROL SUMMARY
Appendix B 2015-2016 WET WEATHER FIELD AND ANALYTICAL RESULTS
Appendix C 2015-2016 DRY WEATHER FIELD AND ANALYTICAL RESULTS
Appendix D 2012–2015 HISTORICAL DATA RESULTS
Appendix E WET WEATHER ANALYTICAL LABORATORY REPORTS
Appendix F WET WEATHER FIELD DATA SHEETS
Appendix G BACTERIA TMDL AND MS4 PERMIT DISCREPANCIES

Chollas Creek Bacteria TMDL 2015–2016 Compliance Monitoring Report December 2016
iv
This page intentionally left blank
Chollas Creek Bacteria TMDL 2015–2016 Compliance Monitoring Report December 2016
v
ACRONYMS AND ABBREVIATIONS
> greater than
< less than
# number
% percent
°C degrees Celsius
303(d) List CWA Section 303(d) List of Water Quality Limited Segments
µS/cm microsiemens per centimeter
Amec Foster
Wheeler Amec Foster Wheeler Environment & Infrastructure, Inc.
Bacteria TMDL
A Resolution Amending the Water Quality Control Plan for the San Diego Basin
(9) To Incorporate Revised Total Maximum Daily Loads for Indicator Bacteria
Project I—Twenty Beaches and Creeks in the San Diego Region (Including
Tecolote Creek) (Regional Board, 2010)
Basin Plan Water Quality Control Plan for San Diego Basin (Regional Board, 2011)
Caltrans California Department of Transportation
cf cubic feet
cfs cubic feet per second
CFU colony-forming unit
CTL(1) compliance monitoring location in tidal prism of Chollas Creek
CWA Clean Water Act
DW dry weather
e estimated value
E. coli Escherichia coli
EMTS (City of San Diego) Environmental Monitoring & Technical Services Laboratory
FIB fecal indicator bacteria
L liters
MDL method detection limit
mL milliliters
MLS mass loading station
MPN most probable number
MQO measurement quality objective
MS4 municipal separate storm sewer system
MS4 Permit
National Pollutant Discharge Elimination System (NPDES) Permit and Waste
Discharge Requirements for Discharges from the Municipal Separate Storm
Sewer System (MS4) Draining the Watersheds Within the San Diego Region,
Order Number R9 2013-0001 (Regional Board, 2013)
NOAA National Oceanic and Atmospheric Administration
NPDES National Pollutant Discharge Elimination System
NR not recorded or value lost because of a database software malfunction
NTU Nephelometric turbidity unit
QA quality assurance
Chollas Creek Bacteria TMDL 2015–2016 Compliance Monitoring Report December 2015
ACRONYMS AND ABBREVIATIONS (continued)
vi
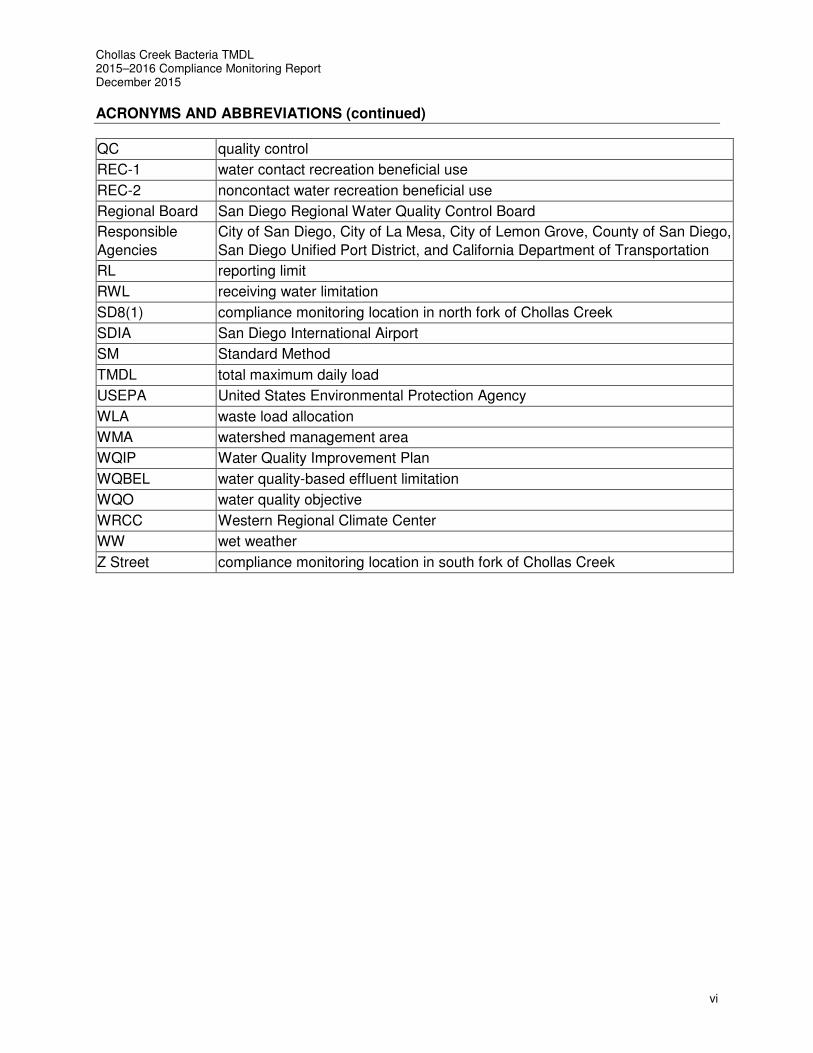
QC quality control
REC-1 water contact recreation beneficial use
REC-2 noncontact water recreation beneficial use
Regional Board San Diego Regional Water Quality Control Board
Responsible
Agencies
City of San Diego, City of La Mesa, City of Lemon Grove, County of San Diego,
San Diego Unified Port District, and California Department of Transportation
RL reporting limit
RWL receiving water limitation
SD8(1) compliance monitoring location in north fork of Chollas Creek
SDIA San Diego International Airport
SM Standard Method
TMDL total maximum daily load
USEPA United States Environmental Protection Agency
WLA waste load allocation
WMA watershed management area
WQIP Water Quality Improvement Plan
WQBEL water quality-based effluent limitation
WQO water quality objective
WRCC Western Regional Climate Center
WW wet weather
Z Street compliance monitoring location in south fork of Chollas Creek
Chollas Creek Bacteria TMDL 2015–2016 Compliance Monitoring Report December 2015
ES-1
EXECUTIVE SUMMARY
This report presents the 2015–2016 compliance monitoring data required by the Bacteria Total
Maximum Daily Load (Bacteria TMDL) for Chollas Creek, under Resolution No. R9-2010-0001 of
the San Diego Regional Water Quality Control Board (Regional Board) in 20101, as incorporated
into the Regional Board’s Order Number R9-2013-00012 (Municipal Separate Storm Sewer
System [MS4] Permit) in 2013. This report was developed to meet the assessment requirements
of the MS4 Permit.
The Bacteria TMDL monitoring program assesses the conditions of the receiving waters and has
the following objectives:
• Characterize levels of bacteria concentrations at compliance monitoring locations.
• Track progress toward meeting the Bacteria TMDL numeric targets.
Fecal indicator bacteria (FIB) sampling for the compliance monitoring season (October 2015–
September 2016) was conducted at three creek monitoring locations:
• CTL(1) (Chollas Creek tidal location)—the Chollas Creek tidal prism consists of primarily
brackish water and is located downstream of the confluence of the north and south forks.
• SD8(1) (north Chollas Creek location) and Z Street (south Chollas Creek location)—the
two mass loading stations (MLSs) in the north and south forks of Chollas Creek,
respectively, consist of freshwater when flowing.
Z Street was approved by the Regional Board prior to the start of the 2015–2016 wet season as a permanent replacement site for the former monitoring location (DPR3) because of channel restoration efforts at the DPR3 monitoring location. This report summarizes FIB concentrations and key hydrologic data by compliance monitoring
location and season for the 2015–2016 monitoring season (October 1, 2015 – September 30,
2016). Compliance is assessed by comparing analytical results for Enterococcus and fecal
coliform with applicable receiving water limitations (RWLs), in accordance with the Bacteria TMDL
requirements in Attachment E of the MS4 Permit. The RWLs are a combination of numeric targets
for bacteria density and allowable exceedance frequencies. The single-sample maximum numeric
targets are required to be achieved only during wet weather with a 22 percent final allowable
exceedance frequency. For dry weather days, the 30-day geometric mean numeric targets must
be achieved with a 0 percent exceedance frequency. The compliance schedule includes interim
milestones that must be achieved to demonstrate progress prior to attaining full compliance with
wet and dry weather total maximum daily loads (TMDLs).
1 A Resolution Amending the Water Quality Control Plan for the San Diego Basin (9) To Incorporate Revised Total
Maximum Daily Loads for Indicator Bacteria Project I—Twenty Beaches and Creeks in the San Diego Region (Including Tecolote Creek), February 10, 2010
2 National Pollutant Discharge Elimination System (NPDES) Permit and Waste Discharge Requirements for Discharges from the Municipal Separate Storm Sewer System (MS4) Draining the Watersheds Within the San Diego Region, May 14, 2013
Chollas Creek Bacteria TMDL 2015–2016 Compliance Monitoring Report December 2015
ES-2
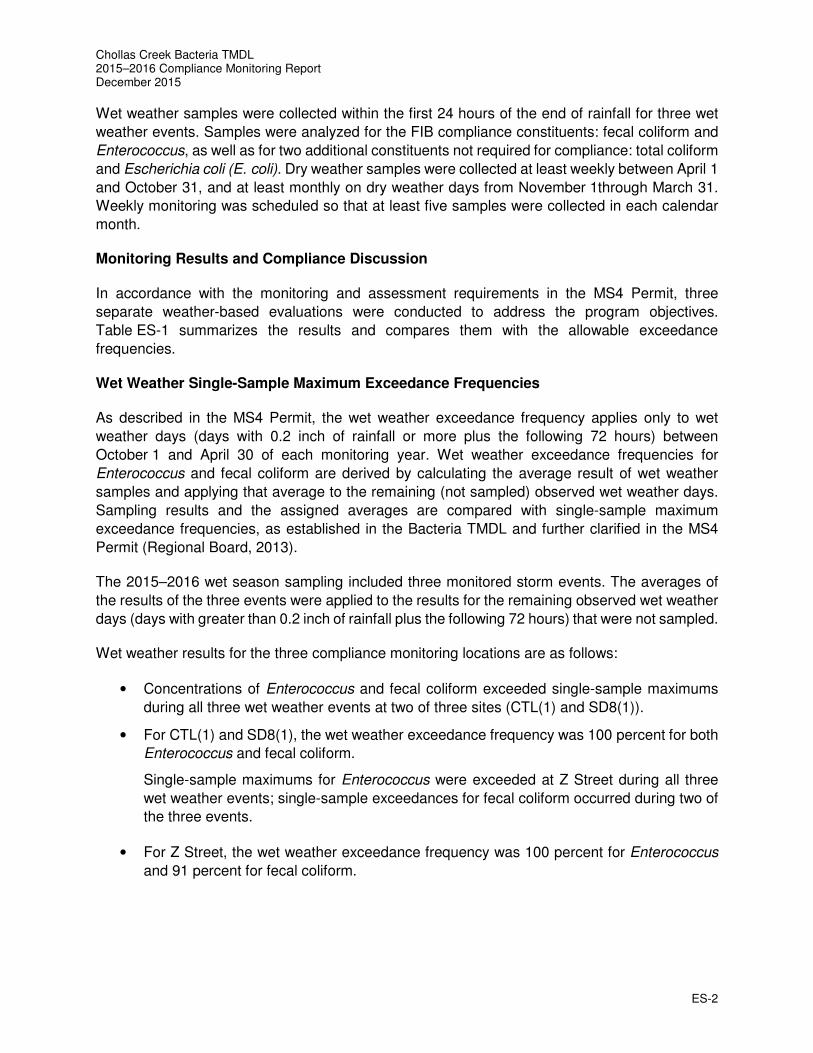
Wet weather samples were collected within the first 24 hours of the end of rainfall for three wet
weather events. Samples were analyzed for the FIB compliance constituents: fecal coliform and
Enterococcus, as well as for two additional constituents not required for compliance: total coliform
and Escherichia coli (E. coli). Dry weather samples were collected at least weekly between April 1
and October 31, and at least monthly on dry weather days from November 1through March 31.
Weekly monitoring was scheduled so that at least five samples were collected in each calendar
month.
Monitoring Results and Compliance Discussion
In accordance with the monitoring and assessment requirements in the MS4 Permit, three
separate weather-based evaluations were conducted to address the program objectives.
Table ES-1 summarizes the results and compares them with the allowable exceedance
frequencies.
Wet Weather Single-Sample Maximum Exceedance Frequencies
As described in the MS4 Permit, the wet weather exceedance frequency applies only to wet
weather days (days with 0.2 inch of rainfall or more plus the following 72 hours) between
October 1 and April 30 of each monitoring year. Wet weather exceedance frequencies for
Enterococcus and fecal coliform are derived by calculating the average result of wet weather
samples and applying that average to the remaining (not sampled) observed wet weather days.
Sampling results and the assigned averages are compared with single-sample maximum
exceedance frequencies, as established in the Bacteria TMDL and further clarified in the MS4
Permit (Regional Board, 2013).
The 2015–2016 wet season sampling included three monitored storm events. The averages of
the results of the three events were applied to the results for the remaining observed wet weather
days (days with greater than 0.2 inch of rainfall plus the following 72 hours) that were not sampled.
Wet weather results for the three compliance monitoring locations are as follows:
• Concentrations of Enterococcus and fecal coliform exceeded single-sample maximums
during all three wet weather events at two of three sites (CTL(1) and SD8(1)).
• For CTL(1) and SD8(1), the wet weather exceedance frequency was 100 percent for both
Enterococcus and fecal coliform.
Single-sample maximums for Enterococcus were exceeded at Z Street during all three
wet weather events; single-sample exceedances for fecal coliform occurred during two of
the three events.
• For Z Street, the wet weather exceedance frequency was 100 percent for Enterococcus
and 91 percent for fecal coliform.
Chollas Creek Bacteria TMDL 2015–2016 Compliance Monitoring Report December 2015
ES-3
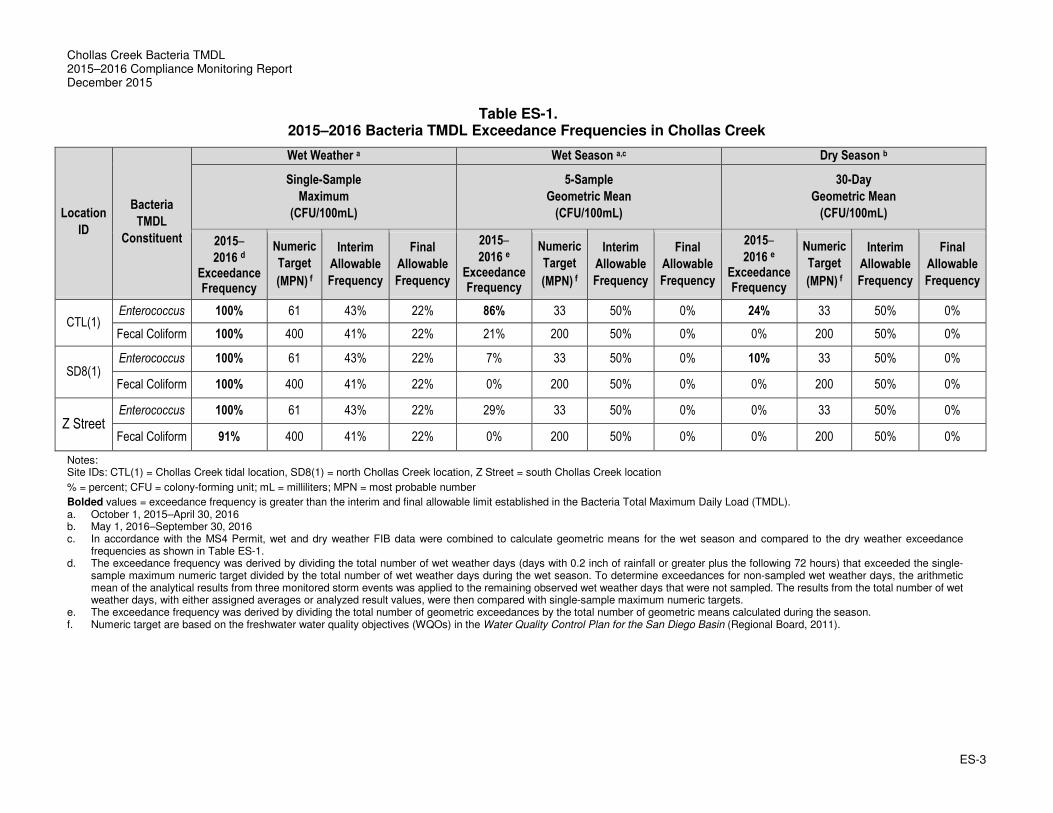
Table ES-1. 2015–2016 Bacteria TMDL Exceedance Frequencies in Chollas Creek
Location
ID
Bacteria
TMDL
Constituent
Wet Weather a Wet Season a,c Dry Season b
Single-Sample
Maximum
(CFU/100mL)
5-Sample
Geometric Mean
(CFU/100mL)
30-Day
Geometric Mean
(CFU/100mL)
2015–
2016 d
Exceedance Frequency
Numeric
Target
(MPN) f
Interim
Allowable
Frequency
Final
Allowable
Frequency
2015–
2016 e
Exceedance Frequency
Numeric
Target
(MPN) f
Interim
Allowable
Frequency
Final
Allowable
Frequency
2015–
2016 e
Exceedance Frequency
Numeric
Target
(MPN) f
Interim
Allowable
Frequency
Final
Allowable
Frequency
CTL(1) Enterococcus 100% 61 43% 22% 86% 33 50% 0% 24% 33 50% 0%
Fecal Coliform 100% 400 41% 22% 21% 200 50% 0% 0% 200 50% 0%
SD8(1) Enterococcus 100% 61 43% 22% 7% 33 50% 0% 10% 33 50% 0%
Fecal Coliform 100% 400 41% 22% 0% 200 50% 0% 0% 200 50% 0%
Z Street Enterococcus 100% 61 43% 22% 29% 33 50% 0% 0% 33 50% 0%
Fecal Coliform 91% 400 41% 22% 0% 200 50% 0% 0% 200 50% 0%
Notes: Site IDs: CTL(1) = Chollas Creek tidal location, SD8(1) = north Chollas Creek location, Z Street = south Chollas Creek location
% = percent; CFU = colony-forming unit; mL = milliliters; MPN = most probable number
Bolded values = exceedance frequency is greater than the interim and final allowable limit established in the Bacteria Total Maximum Daily Load (TMDL). a. October 1, 2015–April 30, 2016 b. May 1, 2016–September 30, 2016 c. In accordance with the MS4 Permit, wet and dry weather FIB data were combined to calculate geometric means for the wet season and compared to the dry weather exceedance
frequencies as shown in Table ES-1. d. The exceedance frequency was derived by dividing the total number of wet weather days (days with 0.2 inch of rainfall or greater plus the following 72 hours) that exceeded the single-
sample maximum numeric target divided by the total number of wet weather days during the wet season. To determine exceedances for non-sampled wet weather days, the arithmetic mean of the analytical results from three monitored storm events was applied to the remaining observed wet weather days that were not sampled. The results from the total number of wet weather days, with either assigned averages or analyzed result values, were then compared with single-sample maximum numeric targets.
e. The exceedance frequency was derived by dividing the total number of geometric exceedances by the total number of geometric means calculated during the season. f. Numeric target are based on the freshwater water quality objectives (WQOs) in the Water Quality Control Plan for the San Diego Basin (Regional Board, 2011).
Chollas Creek Bacteria TMDL 2015–2016 Compliance Monitoring Report December 2015
ES-4
Wet Season Geometric Means and Exceedance Frequencies
The wet season evaluation combines all dry and wet weather samples collected between
October 1, 2015, and April 30, 2016. Exceedance frequencies for Enterococcus and fecal coliform
are derived by calculating a rolling geometric mean using the most recent five sampling results.
The total number of geometric exceedances is divided by the total number of wet season
geometric means to derive an overall wet season exceedance frequency. Calculations for the
2015–2016 wet season included 14 geometric means.
Wet season results for the three compliance monitoring locations are as follows:
Chollas Creek Tidal Location (CTL(1)):
• CTL(1) is not hydrologically connected to the upper watershed during most dry weather
days. However, CTL(1) is tidally influenced, which allows for successful sampling year
round.
• CTL(1) location was successfully sampled during the 15 dry weather visits and the 3 wet
weather events during the wet season.
• The combined wet season exceedance frequencies for Enterococcus and fecal coliform
are 86 percent and 21 percent, respectively.
• CTL(1) is not currently achieving interim or final allowable exceedance frequencies for
Enterococcus.
• CTL(1) is achieving the interim allowable exceedance frequencies for fecal coliform, but
not the final allowable exceedance frequencies at this time.
North Chollas Creek Location (SD8(1)):
• During the wet season, three wet weather events were sampled at SD8(1).
• There was no measurable flow during the 14 scheduled dry weather events that occurred
during the 2015–2016 wet season (October 1 through April 30).
• The combined wet season exceedance frequencies for Enterococcus and fecal coliform
are 7 percent and 0 percent, respectively.
• SD8(1) is currently achieving interim allowable exceedance frequencies but not final
allowable exceedance frequencies for Enterococcus.
• SD8(1) is currently achieving both interim and final allowable exceedance frequencies for
fecal coliform.
South Chollas Creek Location (Z Street):
• During the wet season, three wet weather events were sampled at Z Street.
• Measurable flow was not observed during 11 of 14 scheduled dry weather events that
occurred during the wet season.
• Exceedance frequencies for compliance constituents Enterococcus and fecal coliform are
29 percent and 0 percent, respectively.
Chollas Creek Bacteria TMDL 2015–2016 Compliance Monitoring Report December 2015
ES-5
• Z Street is currently achieving interim allowable exceedance frequencies but not final
allowable exceedance frequencies for Enterococcus.
• Z Street is currently achieving both interim and final allowable exceedance frequencies for
fecal coliform.
Dry Season Geometric Means and Exceedance Frequencies
The dry season is May 1 through September 30 of each monitoring year. Dry season exceedance
frequencies for Enterococcus and fecal coliform are calculated using a rolling geometric mean of
no fewer than five sampling results per 30-day period, as described in the Water Quality Control
Plan for the San Diego Basin (Basin Plan) (Regional Board, 2011). The dry season exceedance
frequency is calculated by dividing the total number of 30-day geometric means that exceed the
30-day geometric mean RWLs by the total number of geometric means calculated during the dry
season (Regional Board, 2013). When a compliance location had little or no flow, a value of 0.1
colony-forming units (CFU) was assigned as the concentration so that the dry conditions
associated with that sampling day were included in the overall compliance evaluation.
Dry season FIB exceedance results for the three compliance monitoring locations are as follows:
Chollas Creek Tidal Location (CTL(1)):
• The north and south fork compliance locations upstream of CTL(1) are typically dry on dry
weather days. However, CTL(1) is located in a tidally influenced segment of Chollas
Creek, which allows for successful sampling year round.
• The TMDL numeric target for Enterococcus was exceeded at CTL(1) on 5 of 21 calculated
geometric means during the 2016 dry season. However, the 5 exceedances were driven
by one elevated sample result.
• The maximum geometric mean value was 34.6 CFU/100mL, which slightly exceeds the
Bacteria TMDL numeric target of 33 CFU/100mL for Enterococcus in Creeks.
• The dry season exceedance frequencies for Enterococcus and fecal coliform were
24 percent and 0 percent, respectively.
• CTL(1) is not currently achieving interim or final allowable exceedance frequencies for
Enterococcus.
• CTL(1) is achieving both interim and final allowable exceedance frequencies for fecal
coliform.
North Chollas Creek Location (SD8(1)):
• Dry weather flows at this location were observed during five scheduled dry weather events.
• The exceedance frequency for Enterococcus was 10 percent.
• The exceedance frequency for fecal coliform was 0 percent.
• SD8(1) is achieving interim goals for Enterococcus and both interim and final goals for
fecal coliform during the dry season.
Chollas Creek Bacteria TMDL 2015–2016 Compliance Monitoring Report December 2015
ES-6
South Chollas Creek Location (Z Street):
• Dry weather flows were not observed at this location during all 25 scheduled dry weather events.
• Exceedance frequencies for compliance constituents Enterococcus and fecal coliform
were both 0 percent.
• Z Street is achieving both the interim and final allowable exceedance frequencies for
Enterococcus and fecal coliform during the dry season.
Summary
During wet weather, the entire watershed is hydraulically connected and recreational water quality
standards are exceeded at all compliance monitoring locations. However, wet weather flows are
too high and dangerous for recreational activities to be safely performed. All locations have
elevated levels of FIB and are not currently meeting the wet weather RWLs.
During dry weather, the upper watershed is not typically hydraulically connected to the lower
segment of the creek. Few exceedances, if any, occur at the upstream MLS locations during the
dry season, because most days are observed to be dry at these locations. The lower portion of
the creek, below where the north and south forks converge, is tidally influenced and water levels
are sufficient to support recreational activities year round. The electrical conductivity
measurements taken at CTL(1), range from 43.3 to 60.3 milliSiemens per centimeter (mS/cm),
indicating that flows are brackish to pure saltwater during dry weather During most dry weather
days, the north and south fork compliance locations are dry with no flows reaching the CTL(1)
monitoring location. Despite brackish concentrations in the lower portion, Chollas Creek is listed
as a freshwater creek and thus results are compared with freshwater TMDL numeric targets.
Compliance monitoring data also indicate a greater likelihood for Enterococcus exceedances than
fecal coliform exceedances. This observation is typical in natural and urban environments shown
by data collected for other bacteria studies, as Enterococcus has been shown to persist and even
grow in the environment without a proximate or recent source of contamination (Byappanahalli et
al., 2012). Based on current monitoring, sources of dry weather exceedances at the Chollas Creek
tidal location (CTL(1)) are not known; potential sources may be land-use areas directly draining
to this segment of Chollas Creek or natural sources (regrowth) and wildlife, or the exceedances
may result from the hydrology and residence time of brackish water. It is evident that the upstream
portions of Chollas Creek are not typically contributing to exceedances at the Chollas Creek tidal
location during dry weather because the portions of the watershed are not hydraulically
connected.
The north and south Chollas Creek locations showed little to no flow during dry weather
conditions. During these extended dry periods, if water was present, it was for a short duration
and water levels were typically below 2 inches in depth and therefore too low to support water
contact recreation beneficial use (REC-1) or noncontact water recreation (REC-2) activities.
Overall, Chollas Creek is meeting the interim dry weather RWLs and making progress toward
meeting the final dry weather allowable exceedance frequencies. Most of the exceedances at the
compliance monitoring locations occur during the wet season because of residual storm flows.
Chollas Creek Bacteria TMDL 2015–2016 Compliance Monitoring Report December 2016
Page 1-1
1.0 INTRODUCTION
The Chollas Creek Watershed supports various beneficial uses, including noncontact water
recreation (REC-2), warm freshwater habitat, and wildlife habitat; water contact recreation
(REC-1) is listed as a potential beneficial use. In 2002, and again in 2010, the Clean Water Act
(CWA) Section 303(d) List of Water Quality Limited Segments (303(d) List) indicated that the
greatest cause of water body impairments in the San Diego region was elevated bacteria levels,
which impact recreational activities and cause potential for human health risks. Elevated bacteria
densities of Enterococcus and fecal coliform affect the beneficial uses of Chollas Creek and the
potential for water contact recreation.
The goal of the Bacteria Total Maximum Daily Load (Bacteria TMDL) (Regional Board, 2010) is
to restore recreational beneficial uses of Chollas Creek. The Bacteria TMDL compliance
monitoring program employs phased monitoring over the course of the compliance schedule to
evaluate receiving water conditions, identify potential sources, and develop compliance
strategies. The initial phase of the monitoring program focuses on characterizing bacteria
concentrations in the receiving water. After key compliance milestones, if exceedances persist in
the receiving water, the second phase will implement follow-up monitoring to determine whether
municipal separate storm sewer system (MS4) sources are causing the exceedances and then
implement strategies to control MS4 sources. Special studies will be implemented on the basis of
the available data and resources to address management questions regarding the Bacteria
TMDL.
This report presents the 2015–2016 Chollas Creek Bacteria TMDL compliance monitoring data,
in accordance with Attachment E.6 of Order Number R9 2013-0001, National Pollutant Discharge
Elimination System (NPDES) Permit and Waste Discharge Requirements for Discharges from the
Municipal Separate Storm Sewer System (MS4) Draining the Watersheds Within the San Diego
Region (MS4 Permit). Attachment E.6 presents the requirements for Resolution No. R9-2010-
0001, A Resolution Amending the Water Quality Control Plan for the San Diego Basin (9) to
Incorporate Revised Total Maximum Daily Loads for Indicator Bacteria Project I—Twenty
Beaches and Creeks in the San Diego Region (Including Tecolote Creek) (Bacteria TMDL) (San
Diego Regional Water Quality Control Board [Regional Board], 2013). Monitoring was performed
to meet the requirements of the MS4 Permit and to generate data to support the San Diego Bay
Water Quality Improvement Plan (WQIP) (San Diego Bay Municipal Agencies, 2016).
The Bacteria TMDL monitoring program assesses the conditions of the receiving waters and has
the following goals:
• Characterize levels of bacteria concentrations at compliance monitoring locations.
• Track progress toward meeting the Bacteria TMDL numeric targets.
Chollas Creek Bacteria TMDL 2015–2016 Compliance Monitoring Report December 2016
Page 1-2
Sampling activities focused on the receiving water. Indicator bacteria sampling for the 2015–2016
compliance monitoring season was conducted at three compliance monitoring locations in the
lower portion of Chollas Creek during wet and dry weather, in accordance with the requirements
of Attachment E.6 of the MS4 Permit.
1.1 Document Overview
This report summarizes the 2015–2016 compliance monitoring conducted to meet the
requirements of the Bacteria TMDL in the MS4 Permit. The data generated will support the
Chollas Creek watershed source control planning and strategies to achieve compliance with the
Bacteria TMDL. This compliance monitoring report has six sections:
• Section 1—Introduction: Information on the Chollas Creek Watershed, beneficial uses,
the Bacteria TMDL, receiving water numeric targets and compliance schedule, and
program objectives;
• Section 2—Monitoring and Analytical Methodology: Overview of the compliance
monitoring locations, wet and dry weather sampling methodology, analytical methodology,
measurement quality objectives (MQOs), and MS4 Permit requirements;
• Section 3—Hydrology and Monitoring Summary: Hydrology summaries, event data,
and observations; and wet and dry weather monitoring results;
• Section 4—Monitoring Results: Fecal indicator bacteria (FIB) results from 2015–2016
and evaluation of seasonal patterns in FIB concentrations;
• Section 5—Compliance Evaluation: Evaluation of current receiving water conditions per
the MS4 Permit and comparison with the Bacteria TMDL receiving water limitations
(RWLs), based on 2015–2016 data;
• Section 6—Conclusions and Recommendations: Summary of current receiving water
conditions in Chollas Creek related to the program goals and recommendations for future
monitoring.
1.2 Chollas Creek Watershed and Background of Bacteria Total Maximum Daily Load
The Chollas Creek Watershed encompasses approximately 18,000 acres of mainly urbanized
land in the San Diego Mesa Hydrologic Area and is within the larger Pueblo San Diego Hydrologic
Unit. Located southeast of the downtown area of the City of San Diego, Chollas Creek has two
main tributaries, the north fork and the south fork. The drainage area of the north fork
(8,794 acres) is larger than that of the south fork (7,575 acres). The headwaters of the north fork
originate approximately 1.5 miles west of the jurisdictional boundary of the City of La Mesa. The
south fork flows to the west-southwest from its headwaters in the City of Lemon Grove, and is the
product of two smaller creek branches. The north and south forks merge approximately 0.8 mile
east of the mouth of Chollas Creek at San Diego Bay, in a tidally influenced section of the creek.
Chollas Creek Bacteria TMDL 2015–2016 Compliance Monitoring Report December 2016
Page 1-3
The established beneficial use of Chollas Creek’s surface waters is REC-2, and REC-1 is listed
as a potential use. In 2002, contact recreation in the lower 1.2 miles of Chollas Creek was deemed
impaired by FIB and the water segment was placed on the 303(d) List. REC-1 and REC-2 are
defined in the Water Quality Control Plan for San Diego Basin (Basin Plan) as follows (Regional
Board, 2011):
• Water Contact Recreation (REC-1) uses of water are for recreational activities involving
body contact with water, where ingestion of water is reasonably possible. These uses
include, but are not limited to, swimming, wading, and fishing.
• Noncontact Water Recreation (REC-2) uses of water are for recreational activities near
water, but not normally involving body contact with water, where ingestion of water is
reasonably possible. These uses include, but are not limited to, picnicking, sunbathing,
hiking, sightseeing, and aesthetic enjoyment.
The Bacteria TMDL was developed by the Regional Board for impaired beaches and creeks on
the 2002 303(d) List to attain and maintain FIB water quality standards. Separate wet weather
and dry weather total maximum daily loads (TMDLs) were calculated for each FIB (total coliform,
fecal coliform, and Enterococcus). The Regional Board acknowledges that exceedances of the
REC-1 water quality objectives (WQOs) may be partially due to natural sources and so included
in the wet weather TMDLs an allowable exceedance frequency based on a reference system
approach. This approach accounts for bacterial loads contributed from natural sources and is
based on conditions at Leo Carrillo Beach in Los Angeles County, California. Each MS4
discharger has been assigned a waste load allocation (WLA) and will be responsible for reducing
its bacterial load and demonstrating that discharges are not causing exceedances of the numeric
WQOs and of allowable exceedance frequencies in the receiving water.
According to the Bacteria TMDL, MS4 discharges are “anthropogenic in nature and the most
significant controllable source of bacteria” (Regional Board, 2010). Each MS4 was assigned an
individual WLA for bacteria. The TMDL used a conservative approach by selecting the most
stringent numeric targets. For Chollas Creek, the TMDL numeric targets are based on REC-1
WQOs from the Basin Plan. According to the TMDL, “water quality objectives for REC-2 are less
stringent than the water quality objectives for REC-1; therefore, attainment of REC-1 objectives
through the implementation of the TMDLs will, a fortiori, provide the requisite water quality for
REC-2” (Regional Board, 2011).
The approved Bacteria TMDL identifies the Lead Agency and the Responsible Agencies
(excluding owners and operators of small MS4s) for the Chollas Creek Watershed, as follows:
• City of San Diego (Lead Agency)
• City of La Mesa
• City of Lemon Grove
• San Diego County
• San Diego Unified Port District
• California Department of Transportation (Caltrans)
Chollas Creek Bacteria TMDL 2015–2016 Compliance Monitoring Report December 2016
Page 1-4
On May 24, 2013, the Regional Board incorporated the Bacteria TMDL into the MS4 Permit
(Regional Board, 2013). The MS4 Permit clarifies the final RWLs (as most probable numbers
[MPNs]) for Enterococcus and fecal coliform. (Total coliform has been removed from the RWLs
for creeks as a clarification to the TMDLs.)
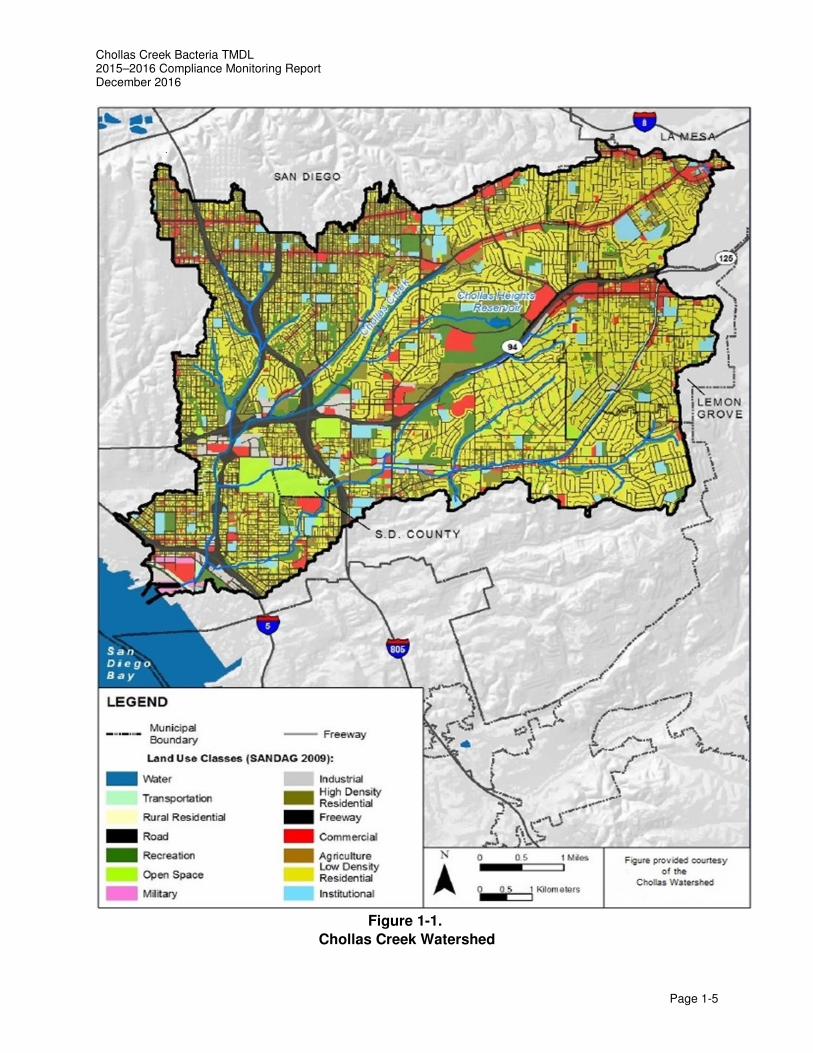
The Responsible Agencies are collaborating to implement monitoring programs and management
strategies for the Chollas Creek Watershed. Figure 1-1 depicts the watershed boundaries, land
use within the watershed, and the jurisdictional boundaries of the Responsible Agencies.
1.3 Compliance Timeline for Bacteria Total Maximum Daily Load
The Bacteria TMDL compliance monitoring timeline outlines interim reduction milestones over the
20-year compliance period (2011–2031). The Bacteria TMDL compliance timeline began in
April 2011, after approval of the Bacteria TMDL by the State Water Resources Control Board
Office of Administrative Law. Compliance monitoring began in July 2013, after adoption of the
MS4 Permit. After the Dry Weather Exceedance Reduction Milestone in 2018, follow-up
monitoring will be implemented on the basis of annual exceedances of allowable exceedance
frequencies in Chollas Creek to investigate potential sources. The San Diego Bay WQIP
incorporates all of the requirements of the Chollas Creek Bacteria TMDL and provides a
comprehensive, watershed-based approach to management strategies designed to address
priority receiving water conditions, including approved TMDLs, draft TMDLs, and other
constituents of concern in the San Diego Bay WMA (San Diego Bay Municipal Agencies, 2016).
The ultimate goal of the San Diego Bay Water Quality Improvement Plan (WQIP) is to prevent
MS4 discharges from causing or contributing to beneficial use impairments in the San Diego Bay
Watershed Management Area (WMA). Currently, the Responsible Agencies are participating in
the San Diego Regional Reference Stream Study to determine the exceedance frequency of
bacteria in reference streams that is caused by natural sources. The study may be used to update
the scientific basis of numeric targets for the Bacteria TMDL reopener in 2018.
Chollas Creek Bacteria TMDL 2015–2016 Compliance Monitoring Report December 2016
Page 1-5
Figure 1-1.
Chollas Creek Watershed
Chollas Creek Bacteria TMDL 2015–2016 Compliance Monitoring Report December 2016
Page 1-6
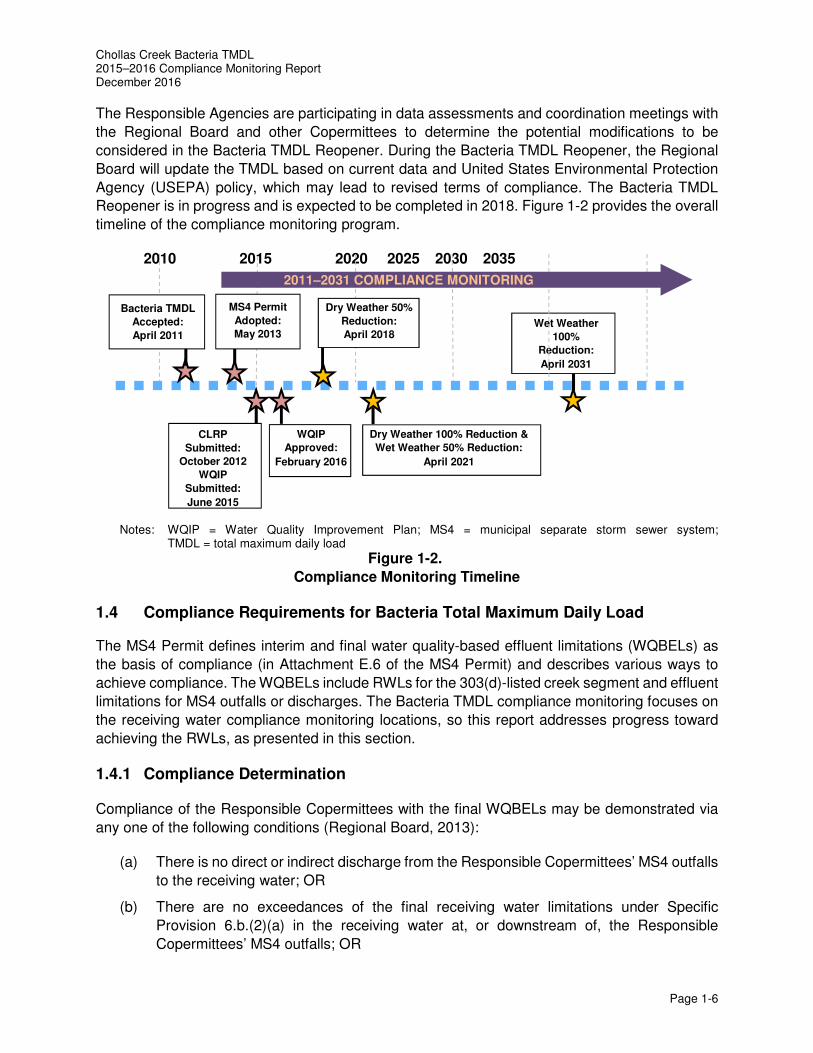
The Responsible Agencies are participating in data assessments and coordination meetings with
the Regional Board and other Copermittees to determine the potential modifications to be
considered in the Bacteria TMDL Reopener. During the Bacteria TMDL Reopener, the Regional
Board will update the TMDL based on current data and United States Environmental Protection
Agency (USEPA) policy, which may lead to revised terms of compliance. The Bacteria TMDL
Reopener is in progress and is expected to be completed in 2018. Figure 1-2 provides the overall
timeline of the compliance monitoring program.
2010 2015 2020 2025 2030 2035
Notes: WQIP = Water Quality Improvement Plan; MS4 = municipal separate storm sewer system;
TMDL = total maximum daily load
Figure 1-2.
Compliance Monitoring Timeline
1.4 Compliance Requirements for Bacteria Total Maximum Daily Load
The MS4 Permit defines interim and final water quality-based effluent limitations (WQBELs) as
the basis of compliance (in Attachment E.6 of the MS4 Permit) and describes various ways to
achieve compliance. The WQBELs include RWLs for the 303(d)-listed creek segment and effluent
limitations for MS4 outfalls or discharges. The Bacteria TMDL compliance monitoring focuses on
the receiving water compliance monitoring locations, so this report addresses progress toward
achieving the RWLs, as presented in this section.
1.4.1 Compliance Determination
Compliance of the Responsible Copermittees with the final WQBELs may be demonstrated via
any one of the following conditions (Regional Board, 2013):
(a) There is no direct or indirect discharge from the Responsible Copermittees’ MS4 outfalls
to the receiving water; OR
(b) There are no exceedances of the final receiving water limitations under Specific
Provision 6.b.(2)(a) in the receiving water at, or downstream of, the Responsible
Copermittees’ MS4 outfalls; OR
Wet Weather
100%
Reduction:
April 2031
CLRP
Submitted:
October 2012
WQIP
Submitted:
June 2015
Dry Weather 50%
Reduction:
April 2018
Bacteria TMDL
Accepted:
April 2011
Dry Weather 100% Reduction &
Wet Weather 50% Reduction:
April 2021
2011–2031 COMPLIANCE MONITORING
MS4 Permit
Adopted:
May 2013
WQIP
Approved:
February 2016
Chollas Creek Bacteria TMDL 2015–2016 Compliance Monitoring Report December 2016
Page 1-7
(c) There are no exceedances of the final effluent limitations under Specific
Provision 6.b.(2)(b)(i) at the Responsible Copermittees’ MS4 outfalls; OR
(d) The pollutant load reductions for discharges from the Responsible Copermittees’ MS4
outfalls are greater than or equal to the final effluent limitations under Specific Provision
6.b.(2)(b)(ii); OR
(e) The Responsible Copermittees demonstrate that exceedances of the final receiving
water limitations under Specific Provision 6.b.(2)(a) in the receiving water are due to
loads from natural sources AND pollutant loads from the Copermittees’ MS4 outfalls are
not causing or contributing to the exceedances; OR
(f) There are no exceedances of the interim receiving water limitations under Specific
Provision 6.c.(2)(a) in the receiving water at, or downstream of, the Responsible
Copermittees’ MS4 outfalls; OR
(g) The pollutant load reductions for discharges from the Responsible Copermittees’ MS4
outfalls are greater than or equal to the interim effluent limitations under Specific
Provision 6.c.(2)(b); OR
(h) The Responsible Copermittees have submitted and are fully implementing a WQIP that
is accepted by the Regional Board and provides reasonable assurance that the interim
TMDL compliance requirements will be achieved by the interim compliance dates.
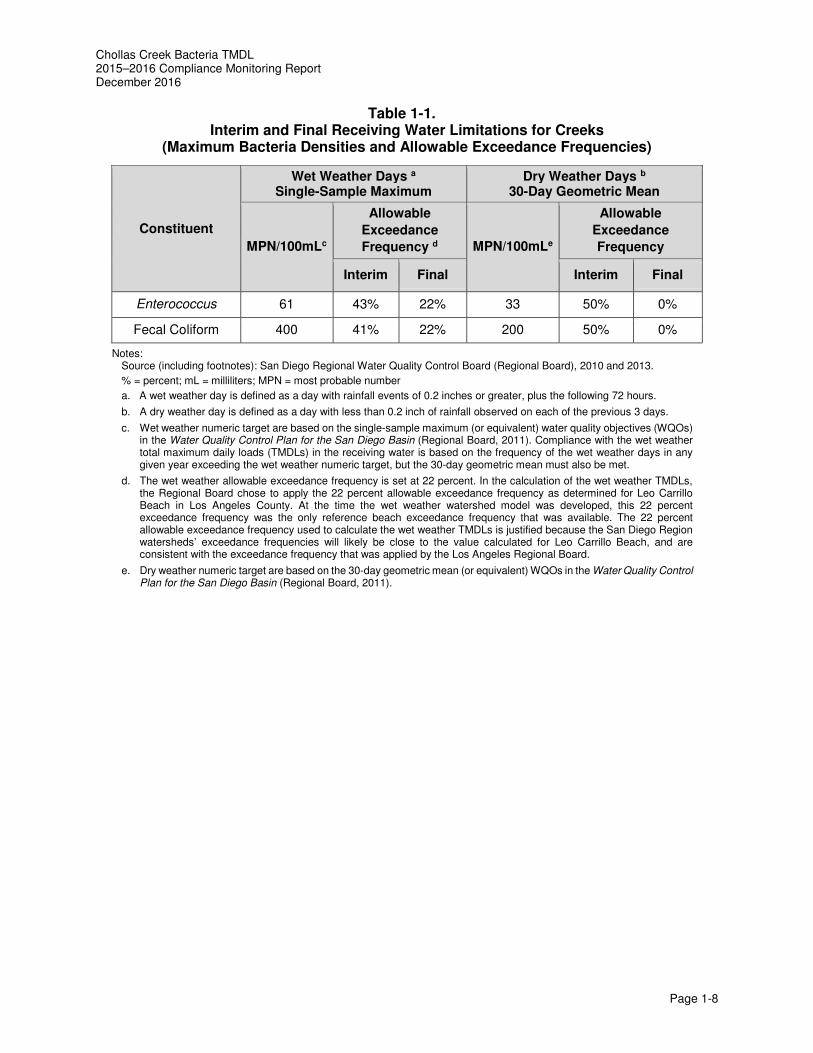
1.4.2 Receiving Water Limitations
The RWLs are a combination of numeric targets for bacteria density and allowable exceedance
frequencies. The MS4 Permit clarifies the final RWLs for Enterococcus and fecal coliform, and
removes total coliform as a numeric target for creeks. Numeric targets for creeks are based on
freshwater WQOs in the Water Quality Control Plan for the San Diego Basin (Basin Plan)
(Regional Board, 2011).
Wet Weather
Per the MS4 Permit, interim compliance with the Bacteria TMDL requires a 50 percent reduction
in wet weather exceedance frequencies by 2021, resulting in a 43 percent allowable frequency
as the interim target for Enterococcus and a 41 percent allowable frequency for fecal coliform.
Full compliance with the TMDL requires a 22 percent maximum exceedance frequency for wet
weather by 2031. Interim and final wet weather exceedance frequency targets for both
constituents for Chollas Creek are presented in Table 1-1.
Dry Weather
The interim Bacteria TMDL allowable exceedance frequencies for Chollas Creek as provided in
the MS4 Permit require a 50 percent reduction in dry weather exceedances from the “existing”
dry weather exceedance frequencies by 2018. Based on data available between 1996 and 2002,
the City of San Diego estimated the historical exceedance frequency of the 30-day geometric
mean to be 100 percent in Chollas Creek, resulting in a 50 percent allowable exceedance
frequency as the interim target. Full compliance with the TMDL requires a 0 percent exceedance
frequency for dry weather by 2021. Interim and final dry weather exceedance frequencies for both
constituents for Chollas Creek are presented in Table 1-1.
Chollas Creek Bacteria TMDL 2015–2016 Compliance Monitoring Report December 2016
Page 1-8
Table 1-1. Interim and Final Receiving Water Limitations for Creeks
(Maximum Bacteria Densities and Allowable Exceedance Frequencies)
Constituent
Wet Weather Days a Single-Sample Maximum
Dry Weather Days b 30-Day Geometric Mean
MPN/100mLc
Allowable
Exceedance
Frequency d MPN/100mLe
Allowable
Exceedance
Frequency
Interim Final Interim Final
Enterococcus 61 43% 22% 33 50% 0%
Fecal Coliform 400 41% 22% 200 50% 0%
Notes: Source (including footnotes): San Diego Regional Water Quality Control Board (Regional Board), 2010 and 2013.
% = percent; mL = milliliters; MPN = most probable number
a. A wet weather day is defined as a day with rainfall events of 0.2 inches or greater, plus the following 72 hours.
b. A dry weather day is defined as a day with less than 0.2 inch of rainfall observed on each of the previous 3 days.
c. Wet weather numeric target are based on the single-sample maximum (or equivalent) water quality objectives (WQOs) in the Water Quality Control Plan for the San Diego Basin (Regional Board, 2011). Compliance with the wet weather total maximum daily loads (TMDLs) in the receiving water is based on the frequency of the wet weather days in any given year exceeding the wet weather numeric target, but the 30-day geometric mean must also be met.
d. The wet weather allowable exceedance frequency is set at 22 percent. In the calculation of the wet weather TMDLs, the Regional Board chose to apply the 22 percent allowable exceedance frequency as determined for Leo Carrillo Beach in Los Angeles County. At the time the wet weather watershed model was developed, this 22 percent exceedance frequency was the only reference beach exceedance frequency that was available. The 22 percent allowable exceedance frequency used to calculate the wet weather TMDLs is justified because the San Diego Region watersheds’ exceedance frequencies will likely be close to the value calculated for Leo Carrillo Beach, and are consistent with the exceedance frequency that was applied by the Los Angeles Regional Board.
e. Dry weather numeric target are based on the 30-day geometric mean (or equivalent) WQOs in the Water Quality Control Plan for the San Diego Basin (Regional Board, 2011).
Chollas Creek Bacteria TMDL 2015–2016 Compliance Monitoring Report December 2016
2-1
2.0 MONITORING AND ANALYTICAL METHODS
This section outlines the methods that were used in the monitoring program, laboratory analysis,
data assessment, and quality assurance and quality control (QA/QC) processes to meet the
program objectives. The Chollas Creek Diazinon, Dissolved Metals, and Bacteria TMDL
Monitoring Plan (Monitoring Plan) describes in detail the sampling, analytical, and QA/QC
procedures (Amec Foster Wheeler Environment & Infrastructure, Inc. [Amec Foster Wheeler],
2016a).
2.1 Compliance Monitoring Locations
Chollas Creek has two main stem tributaries that converge and discharge into San Diego Bay.
The Bacteria TMDL identifies the lower 1.2 miles of Chollas Creek as the targeted segment in the
TMDL. The MS4 Permit requires receiving water compliance monitoring to be at or near the mouth
of the creek and one or more locations upstream of the mouth. To adequately evaluate mass
loading from the watershed, the Responsible Agencies selected three monitoring locations.
• The first location, CTL(1), is near the mouth of the Creek, approximately 100 yards south
of the confluence of the north and south forks of Chollas Creek. CTL(1) (the Chollas Creek
tidal location), is centrally located in the Bacteria TMDL-listed segment and also reflects
the loading of the entire watershed. This tidal location is as far downstream as can be
accessed for monitoring within the City of San Diego’s jurisdiction. (The area below CTL(1)
cannot be monitored because it is accessible only via federal property, which is on both
sides of the Chollas Creek mouth and along the bay shoreline.)
• The two mass loading stations (MLSs) in the Chollas Creek Watershed, SD8(1) (north
Chollas Creek location) and Z Street (south Chollas Creek location), are located near the
upper boundary of the 303(d)-listed segment. The two stations depict the watershed
contribution from the two main stems. Z Street was approved by the Regional Board prior
to the start of the 2015–2016 wet season as a permanent replacement site for the former
monitoring location (DPR3) because of channel restoration at this monitoring location.
SD8(1) and Z Street are upstream of the tidally influenced section of Chollas Creek. Although the
exact extent of the tidal reach is not known, visual observations suggest the tidally influenced
portion of Chollas Creek extends roughly the same distance as the 303(d) listed segment.
Table 2-1 provides the site location, a description, and a photograph of each compliance
monitoring location.
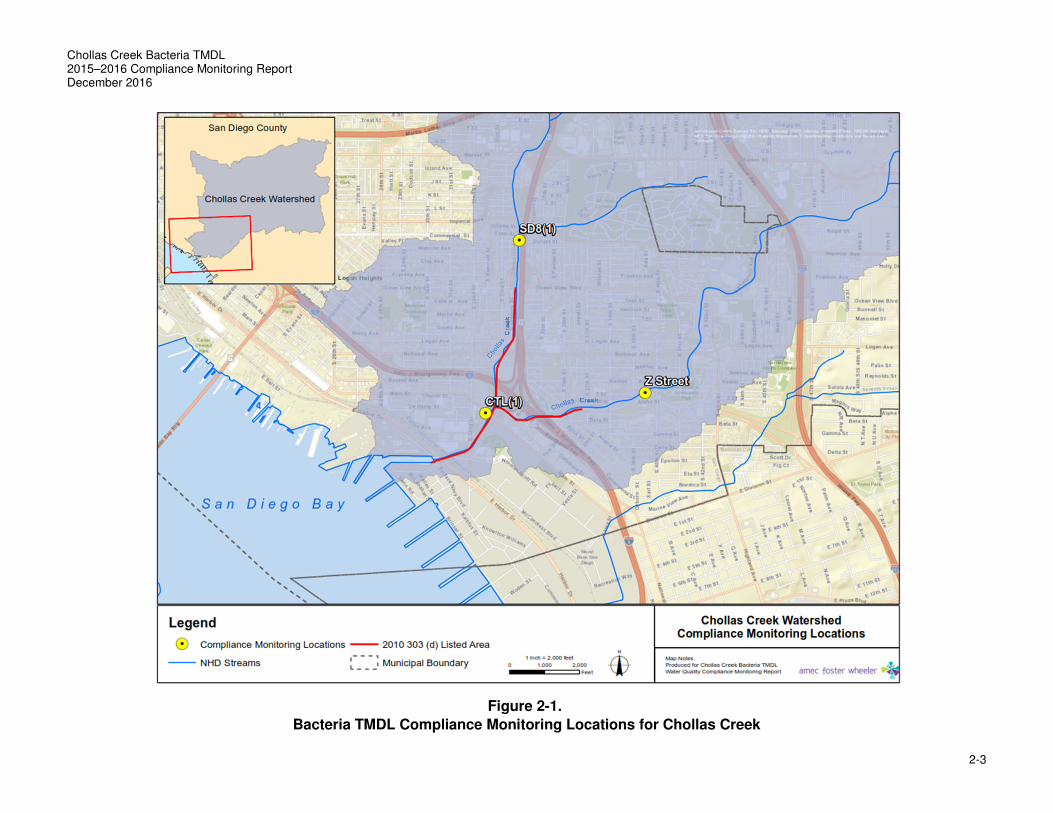
Figure 2-1 is a map showing the compliance monitoring locations within the 303(d) listed segment
of the Watershed.
Chollas Creek Bacteria TMDL 2015–2016 Compliance Monitoring Report December 2016
2-2
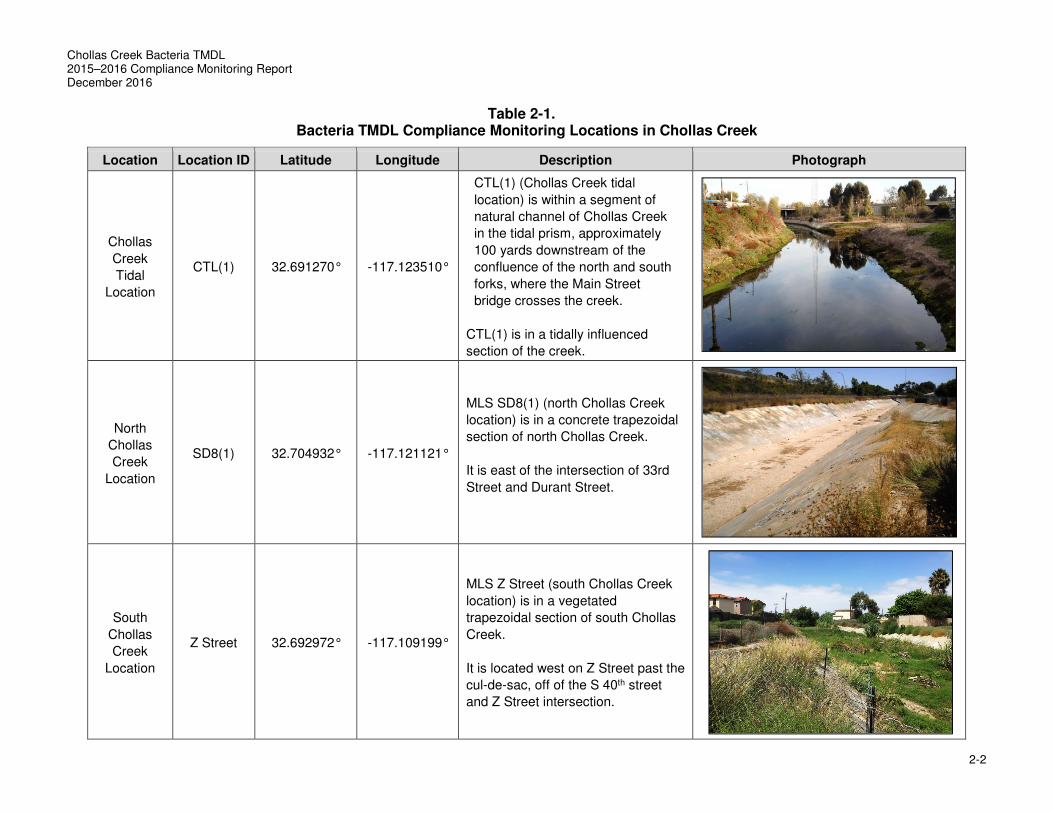
Table 2-1. Bacteria TMDL Compliance Monitoring Locations in Chollas Creek
Location Location ID Latitude Longitude Description Photograph
Chollas
Creek
Tidal
Location
CTL(1) 32.691270° -117.123510°
CTL(1) (Chollas Creek tidal
location) is within a segment of
natural channel of Chollas Creek
in the tidal prism, approximately
100 yards downstream of the
confluence of the north and south
forks, where the Main Street
bridge crosses the creek.
CTL(1) is in a tidally influenced
section of the creek.
North
Chollas
Creek
Location
SD8(1) 32.704932° -117.121121°
MLS SD8(1) (north Chollas Creek
location) is in a concrete trapezoidal
section of north Chollas Creek.
It is east of the intersection of 33rd
Street and Durant Street.
South
Chollas
Creek
Location
Z Street 32.692972° -117.109199°
MLS Z Street (south Chollas Creek
location) is in a vegetated
trapezoidal section of south Chollas
Creek.
It is located west on Z Street past the
cul-de-sac, off of the S 40th street
and Z Street intersection.
Chollas Creek Bacteria TMDL 2015–2016 Compliance Monitoring Report December 2016
2-3
Figure 2-1.
Bacteria TMDL Compliance Monitoring Locations for Chollas Creek
Chollas Creek Bacteria TMDL 2015–2016 Compliance Monitoring Report December 2016
2-4
2.2 Wet Weather Compliance Monitoring
Wet weather monitoring was conducted by Amec Foster Wheeler field teams during three storm
events during the 2015–2016 wet season (October 1 through April 30). The storms with greater
than 0.2 inch of rainfall were targeted for analysis. One grab water sample was collected per
storm within 24 hours after the end of rainfall. Bacteria grab samples were analyzed by the City
of San Diego Environmental Monitoring and Technical Services (EMTS) laboratory or Weck
Laboratories, Inc. Flow and rainfall data were collected for SD8(1) and Z Street as part of the
Diazinon and Dissolved Metals TMDLs (Regional Board, 2002 and 2007), and were used to
develop event hydrographs for the Chollas Creek Bacteria TMDL monitoring program. Collection
of rainfall and flow data is described in Section 2.10.
2.3 Dry Weather Compliance Monitoring
Dry weather monitoring was performed at the compliance monitoring locations from October 2015
through April 2016. Weekly dry weather monitoring was conducted during October 2015, and April
through September 2016, so that at least five samples were collected in each calendar month.
Although the MS4 Permit defines the dry season as between May 1 and September 30, the weekly
sampling was conducted during October and April to capture conditions during the time period
with greater potential for recreational activities. From November 2015 through March 2016, dry
weather monitoring occurred monthly, consistent with the requirements of the MS4 Permit.
Dry weather events may occur on dry weather days with an antecedent dry period of 72 hours
with less than 0.1 inch of rainfall. Grab water samples were collected only when measurable flow
was present. All dry weather samples were collected by City of San Diego Storm Water
Department staff. Bacteria samples were analyzed by the City of San Diego EMTS laboratory.
2.4 Analytical Methods
FIB are surrogates used to measure the potential presence of bacteria, fecal material, and
associated fecal pathogens. FIB such as Enterococcus and fecal coliform are part of the intestinal
flora of warm-blooded animals. Measurements of fecal indicator organisms have long been used
to protect swimmers from illnesses that may be contracted from recreational activities in surface
waters contaminated by fecal pollution. These organisms have been used as good indicators of
harmful pathogens that may be present in water bodies (Regional Board, 2011). As a clarification
to the TMDLs, the MS4 Permit clarified the final RWLs, which require the Bacteria TMDL
compliance samples to be analyzed for Enterococcus and fecal coliform; total coliform has been
removed from the RWLs for creeks. The analytical methods used generated comparable results.
The USEPA recommends using WQOs based on Escherichia coli (E. coli) for freshwaters
because E. coli is a better indicator of pathogens and so better protects human health (United
States Environmental Protection Agency [USEPA], 2012). Neither E. coli nor total coliform water
quality monitoring is required for Chollas Creek compliance monitoring locations. However, the
City of San Diego voluntarily elected to continue analyzing total coliform to maintain consistency
with the Bacteria TMDL and, per USEPA recommendations, added E. coli to begin developing a
dataset in anticipation of future requirements. The monitoring results for E. coli and total coliform
are provided as additional data in Appendices B, C, and D. Table 2-2 lists analytical constituents,
methods, method detection limits (MDLs), and target reporting limits (RLs).
Chollas Creek Bacteria TMDL 2015–2016 Compliance Monitoring Report December 2016
2-5
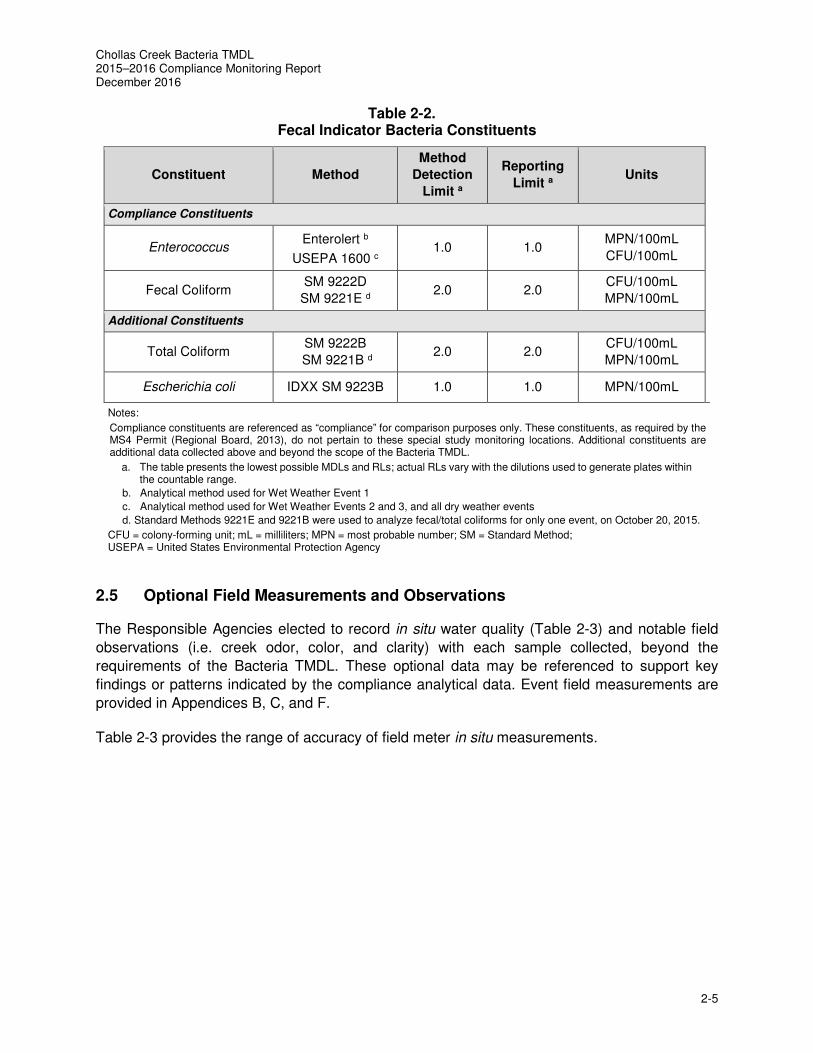
Table 2-2. Fecal Indicator Bacteria Constituents
Constituent Method
Method
Detection
Limit a
Reporting
Limit a Units
Compliance Constituents
Enterococcus Enterolert b
USEPA 1600 c 1.0 1.0
MPN/100mL
CFU/100mL
Fecal Coliform SM 9222D
SM 9221E d 2.0 2.0
CFU/100mL
MPN/100mL
Additional Constituents
Total Coliform SM 9222B
SM 9221B d 2.0 2.0
CFU/100mL
MPN/100mL
Escherichia coli IDXX SM 9223B 1.0 1.0 MPN/100mL
Notes:
Compliance constituents are referenced as “compliance” for comparison purposes only. These constituents, as required by the MS4 Permit (Regional Board, 2013), do not pertain to these special study monitoring locations. Additional constituents are additional data collected above and beyond the scope of the Bacteria TMDL.
a. The table presents the lowest possible MDLs and RLs; actual RLs vary with the dilutions used to generate plates within the countable range.
b. Analytical method used for Wet Weather Event 1
c. Analytical method used for Wet Weather Events 2 and 3, and all dry weather events
d. Standard Methods 9221E and 9221B were used to analyze fecal/total coliforms for only one event, on October 20, 2015.
CFU = colony-forming unit; mL = milliliters; MPN = most probable number; SM = Standard Method; USEPA = United States Environmental Protection Agency
2.5 Optional Field Measurements and Observations
The Responsible Agencies elected to record in situ water quality (Table 2-3) and notable field
observations (i.e. creek odor, color, and clarity) with each sample collected, beyond the
requirements of the Bacteria TMDL. These optional data may be referenced to support key
findings or patterns indicated by the compliance analytical data. Event field measurements are
provided in Appendices B, C, and F.
Table 2-3 provides the range of accuracy of field meter in situ measurements.
Chollas Creek Bacteria TMDL 2015–2016 Compliance Monitoring Report December 2016
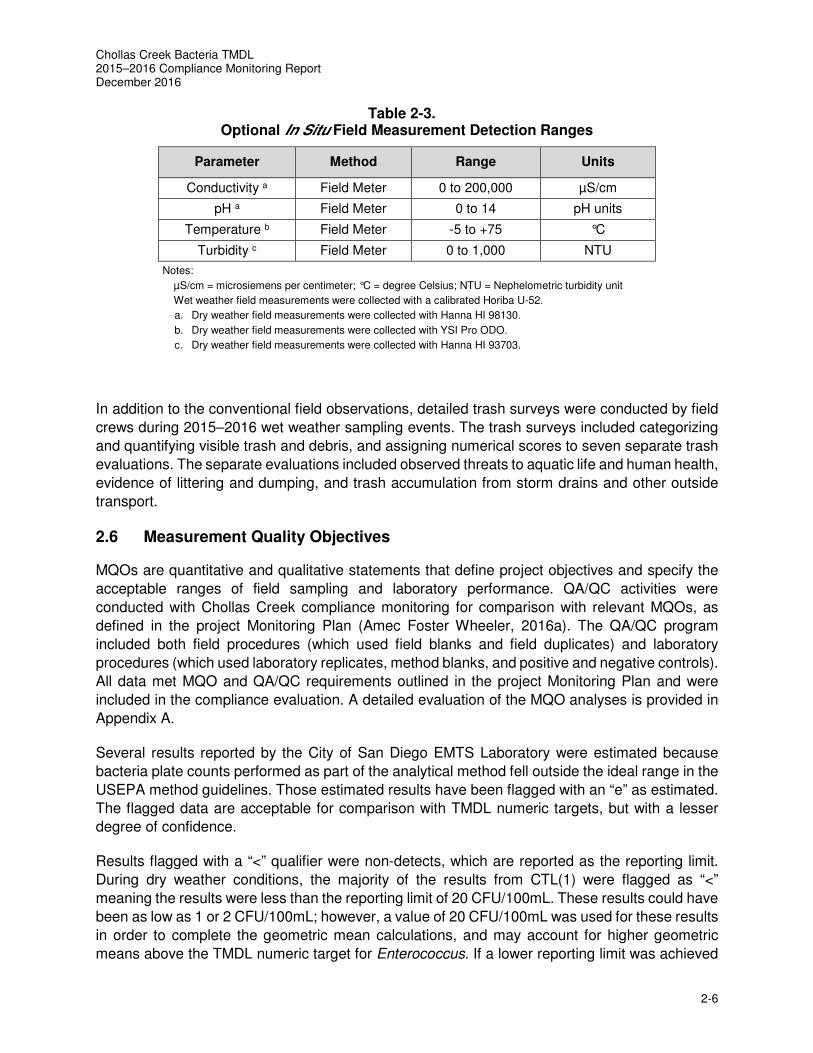
2-6
Table 2-3. Optional In Situ Field Measurement Detection Ranges
Parameter Method Range Units
Conductivity a Field Meter 0 to 200,000 µS/cm
pH a Field Meter 0 to 14 pH units
Temperature b Field Meter -5 to +75 °C
Turbidity c Field Meter 0 to 1,000 NTU
Notes:
µS/cm = microsiemens per centimeter; °C = degree Celsius; NTU = Nephelometric turbidity unit
Wet weather field measurements were collected with a calibrated Horiba U-52.
a. Dry weather field measurements were collected with Hanna HI 98130.
b. Dry weather field measurements were collected with YSI Pro ODO.
c. Dry weather field measurements were collected with Hanna HI 93703.
In addition to the conventional field observations, detailed trash surveys were conducted by field
crews during 2015–2016 wet weather sampling events. The trash surveys included categorizing
and quantifying visible trash and debris, and assigning numerical scores to seven separate trash
evaluations. The separate evaluations included observed threats to aquatic life and human health,
evidence of littering and dumping, and trash accumulation from storm drains and other outside
transport.
2.6 Measurement Quality Objectives
MQOs are quantitative and qualitative statements that define project objectives and specify the
acceptable ranges of field sampling and laboratory performance. QA/QC activities were
conducted with Chollas Creek compliance monitoring for comparison with relevant MQOs, as
defined in the project Monitoring Plan (Amec Foster Wheeler, 2016a). The QA/QC program
included both field procedures (which used field blanks and field duplicates) and laboratory
procedures (which used laboratory replicates, method blanks, and positive and negative controls).
All data met MQO and QA/QC requirements outlined in the project Monitoring Plan and were
included in the compliance evaluation. A detailed evaluation of the MQO analyses is provided in
Appendix A.
Several results reported by the City of San Diego EMTS Laboratory were estimated because
bacteria plate counts performed as part of the analytical method fell outside the ideal range in the
USEPA method guidelines. Those estimated results have been flagged with an “e” as estimated.
The flagged data are acceptable for comparison with TMDL numeric targets, but with a lesser
degree of confidence.
Results flagged with a “<” qualifier were non-detects, which are reported as the reporting limit.
During dry weather conditions, the majority of the results from CTL(1) were flagged as “<”
meaning the results were less than the reporting limit of 20 CFU/100mL. These results could have
been as low as 1 or 2 CFU/100mL; however, a value of 20 CFU/100mL was used for these results
in order to complete the geometric mean calculations, and may account for higher geometric
means above the TMDL numeric target for Enterococcus. If a lower reporting limit was achieved
Chollas Creek Bacteria TMDL 2015–2016 Compliance Monitoring Report December 2016
2-7
for the same samples, the geometric mean would have likely been below the TMDL numeric
target.
2.7 Wet Weather Single-Sample Maximum Exceedance Frequency
Wet weather exceedances are based on a comparison of the frequency of exceedances of the
single-sample maximum numeric target to the allowable 22 percent exceedance frequency. Wet
weather events include the storm day(s) (0.2 inch of rainfall or greater) and the following 72 hours,
resulting in a minimum wet weather event duration of four days. Per the MS4 Permit, for monitored
storm events, the highest reported result from a storm event will be applied to each day for the
duration of that event. An inferred exceedance frequency must be calculated to account non-
monitored storm events.
For the remaining wet weather days that are not associated with a monitored event, the average
(arithmetic mean) of the highest reported results from each of the three monitored wet weather
events is assigned to the remaining wet weather days in the wet season.
Arithmetic Mean (�) = X1 + X2 + X3… Xn
n
where: Xn is the highest reported concentration of the monitored event
n is the number of monitored storm events
The wet weather exceedance frequency is then determined by dividing the number of wet weather
days that exceeded the single-sample maximum numeric target by the total number of wet
weather days observed during the 2015–2016 wet season. A list of observed wet weather days
for the 2015–2016 wet season, both monitored and observed, are presented in Appendix B.
Wet Weather Exceedance Frequency (%) = 100 ∗ �(WWD> Wet Weather Numeric Target)
ΣWWD
where: ΣWWD is the sum of wet weather days (0.2 inch of rainfall or more) and the
following 72 hours
A list of observed wet weather days for the 2015–2016 wet season, both monitored and observed,
is presented in Appendix B.
2.8 Wet Season Geometric Mean and Exceedance Frequency
Per the MS4 Permit, a wet season exceedance frequency was calculated using the combined wet
and dry weather results between October 1, 2015, and September 30, 2016, and was compared
with dry weather numeric targets. During the wet season, the amount of time summarized by each
geometric mean varies. Dry weather sampling was conducted weekly during the wet season in
October 2015 and April 2016, and monthly from November 2015 through March 2016. In addition,
three wet weather events were captured during the wet season; one sample was collected for
each wet weather event. A rolling geometric mean calculation was calculated from the five most
recent wet season samples. With each subsequent sample collected, the first sample from the
preceding five-sample geometric mean was dropped.
Chollas Creek Bacteria TMDL 2015–2016 Compliance Monitoring Report December 2016
2-8
At SD8(1) and Z Street, when there was insufficient flow during dry weather, no sample was
collected or analyzed. The visits to a dry site were used in the wet season geometric mean
exceedance frequency evaluation because the site was dry and therefore not contributing a
bacteria load. To meet the prescribed dry weather geometric mean frequency, statistics were
calculated for dry events at SD8(1) and Z Street by assigning a concentration value of 0.1 colony-
forming unit (CFU) (rather than 0.0 CFU) when these sites were not flowing. A zero value is
undefined logarithmically and so would be unusable in the geometric mean calculation. The wet
season geometric mean is calculated as follows:
5-Sample Geometric Mean = ( )( )( )( )( )54321
n ΧΧΧΧΧ
where: n is the number of individual results used in the calculation
Xn is sample n result (e.g., X1 = November result, X2 = Wet Weather 1 Result)
A wet season exceedance occurs when a geometric mean exceeds the dry weather numeric
target. The first geometric mean was calculated after the fifth sample in October 2015. To
determine the wet season exceedance frequency, the number of wet season geometric means
that exceed the dry weather numeric target was divided by the total number of calculated wet
season geometric means, as follows:
Wet Season Exceedance Frequency (%) = 100 ∗ Wet Season Gn > DW
Wet Season Gn
where: Wet Season Gn is the number of dry season geometric means
DW is the dry weather numeric target
2.9 Dry Season Geometric Mean and Exceedance Frequency
Dry season geometric mean and exceedance frequency calculations are detailed below.
The MS4 Permit states that the geometric mean calculation should be consistent with the Basin
Plan (Regional Board, 2011). A 30-day rolling geometric mean calculation is based on a minimum
of five samples for any 30-day period, and is calculated as follows:
30-Day Geometric Mean = ( )( )( )( )( )54321
n ΧΧΧΧΧ
where: n is the number of individual results used in the calculation
Xn is week n result (e.g., X1 = week 1 result)
Dry season monitoring began in early May 2016; the first geometric mean was calculated after
the fifth sample in late May 2016. With each subsequent sample collected, the first sample from
the preceding five-sample geometric mean was dropped. Samples collected between May 1 and
September 30 are used in this calculation. At SD8(1) and Z Street, when there was insufficient
flow, no sample was collected or analyzed. The visits to a dry site were used in the dry weather
geometric mean frequency evaluation because the site was dry and therefore not contributing a
bacteria load. To meet the prescribed dry weather geometric mean frequency, statistics were
calculated for dry events at SD8(1) and Z Street by assigning a concentration value of 0.1 colony-
Chollas Creek Bacteria TMDL 2015–2016 Compliance Monitoring Report December 2016
2-9
forming unit (CFU) (rather than 0.0 CFU) when these sites were not flowing. A zero value is
undefined logarithmically and so would be unusable in the geometric mean calculation.
A dry weather exceedance occurs when the geometric mean exceeds the dry weather numeric
target. The first exceedance frequency was calculated in late May 2016, after the first geometric
mean calculation. The number of geometric means that exceed the dry weather numeric target is
divided by the total number of calculated dry season geometric means to determine the dry
season exceedance frequency, as expressed below.
Dry Season Exceedance Frequency (%) = 100 ∗ Dry Season Gn > DW
Dry Season Gn
where: Dry Season Gn is the number of dry season geometric means
DW is the dry weather numeric target
2.10 Precipitation and Flow Data
Historical daily rainfall amounts generated by the National Weather Service were used to assess
annual rainfall and the historical average for San Diego County. The Monitoring Plan specifies to
use the San Diego International Airport (SDIA) rain gauge for mobilization of wet weather
sampling (Amec Foster Wheeler, 2016a). However, several storm events in the 2015–2016 wet
season were underrepresented by the SDIA rain gauge when compared with other rain gauges
in the San Diego region. Therefore, the 2015–2016 wet season rainfall data from SDIA were
averaged with rainfall data from Montgomery Field for better representation of unequal rainfall
distribution across several storm events. The average precipitation amounts measured by the
SDIA and Montgomery Field rain gauges were also used to determine the total number of
observed wet weather days during the 2015–2016 season.
Flow and rainfall data were collected for SD8(1) and Z Street as part of the Diazinon and Dissolved
Metals TMDLs (Regional Board Resolution Nos. R9-2002-0123 and R9-2007-0043, respectively),
and were used to develop event hydrographs for the Chollas Creek Bacteria TMDL monitoring
program (Amec Foster Wheeler, 2016b). Flow and rainfall data were logged in five-minute
intervals during each monitored event.
Flow was measured using a Sigma 950 area-velocity bubbler flow meter and a bubbler level
sensor. Flow was calculated in the flow meter using level data and a head-versus-flow table that
was developed for the Responsible Agencies’ compliance monitoring (Amec Foster Wheeler,
2016b). Rainfall was measured by a tipping bucket rain gauge at both SD8(1) and Z Street.
Chollas Creek Bacteria TMDL 2015–2016 Compliance Monitoring Report December 2016
2-10
This page intentionally left blank.
Chollas Creek Bacteria TMDL 2015–2016 Compliance Monitoring Report December 2016
3-1
3.0 HYDROLOGY AND MONITORING SUMMARY
This section summarizes wet and dry weather events, including hydrology, flow conditions, and
key observations. Field measurements and analytical results for wet weather are presented in
Appendix B; those dry for weather are in Appendix C.
3.1 Wet Weather: Hydrology and Monitoring Summary
Precipitation data from the SDIA and Montgomery Field were used to track the total number of
wet weather days, as defined in the MS4 Permit. Measured rainfall was compared with the
historical monthly averages recorded at SDIA from 1981 to 2010. This comparison will support
future evaluations of annual precipitation and potential effects on FIB concentrations, or the
assessment of exceedances. The historical data were accessed through the Western Regional
Climate Center (WRCC) website (WRCC, 2010, accessed in 2016).3
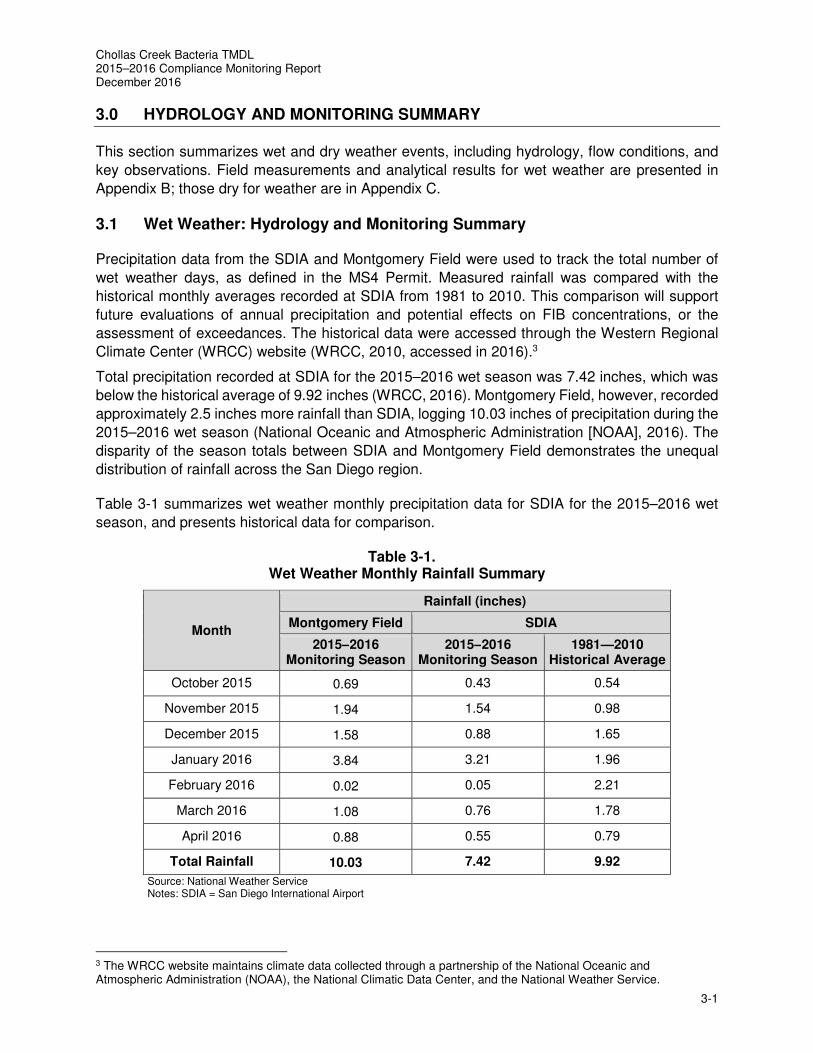
Total precipitation recorded at SDIA for the 2015–2016 wet season was 7.42 inches, which was
below the historical average of 9.92 inches (WRCC, 2016). Montgomery Field, however, recorded
approximately 2.5 inches more rainfall than SDIA, logging 10.03 inches of precipitation during the
2015–2016 wet season (National Oceanic and Atmospheric Administration [NOAA], 2016). The
disparity of the season totals between SDIA and Montgomery Field demonstrates the unequal
distribution of rainfall across the San Diego region.
Table 3-1 summarizes wet weather monthly precipitation data for SDIA for the 2015–2016 wet
season, and presents historical data for comparison.
Table 3-1. Wet Weather Monthly Rainfall Summary
Month
Rainfall (inches)
Montgomery Field SDIA
2015–2016 Monitoring Season
2015–2016 Monitoring Season
1981—2010 Historical Average
October 2015 0.69 0.43 0.54
November 2015 1.94 1.54 0.98
December 2015 1.58 0.88 1.65
January 2016 3.84 3.21 1.96
February 2016 0.02 0.05 2.21
March 2016 1.08 0.76 1.78
April 2016 0.88 0.55 0.79
Total Rainfall 10.03 7.42 9.92
Source: National Weather Service Notes: SDIA = San Diego International Airport
3 The WRCC website maintains climate data collected through a partnership of the National Oceanic and Atmospheric Administration (NOAA), the National Climatic Data Center, and the National Weather Service.
Chollas Creek Bacteria TMDL 2015–2016 Compliance Monitoring Report December 2016
3-2
For the Bacteria TMDL compliance monitoring, a qualifying wet weather event occurs on days
with equal or greater than 0.2 inch of rainfall, preceded by at least 72 hours of less than 0.1 inch
of rainfall. Three storm events were successfully captured at all three compliance monitoring
locations. Wet Weather Event 1 was a medium- to large-sized storm event, with 1.12 inches of
recorded rainfall; Wet Event 2 was a small event, with 0.19 inch recorded; and Wet Event 3 was
a very large event, with nearly 3 inches of recorded rainfall.
The Chollas Creek watershed response varies throughout the wet season based on factors such
as antecedent soil moisture conditions, impervious area, rainfall amount, and rainfall intensity.
During larger storms, runoff from pervious surfaces can increase after soils are completely
saturated. Earlier in the season, the soil conditions throughout the watershed are drier and
increased infiltration results in less runoff. Later in the season, the ground is more saturated,
resulting in greater discharge volumes and peak flows. Storm flows were observed to be too
dangerous for recreational activities in the creek, especially in the concrete-lined segments.
Each monitored storm event is described in detail in the following sections.
Table 3-2 presents the precipitation and flow summaries for the three monitored wet weather
events at SD8(1) and Z Street. These flow and rainfall data, collected as part of the Diazinon
TMDL and the Dissolved Metals TMDL (Amec Foster Wheeler, 2016b) provide a hydrologic
overview of wet weather events. However, these data are not required to be collected for the
Bacteria TMDL Compliance Program.
Table 3-2. Rainfall and Flow Totals for Monitored Events
Event Date SDIA Rain (inches)
Montgomery Field Rain (inches)
Location a
North Chollas Creek Location, SD8(1) b
South Chollas Creek Location, Z Street b
Rain (inches)
Estimated Flow (cf)
Rain (inches)
Estimated Flow (cf)
Wet Weather
Event 1 11/4/2015 1.12 1.41 1.27 15,800,000 1.40 16,100,000
Wet Weather
Event 2 12/29/2015 0.19 c 0.24 0.18 1,080,000 0.24 314,000
Wet Weather
Event 3 1/9/2016 2.98 3.40 3.07 86,100,000 2.36 d 40,600,000
Notes: cf = cubic feet
a. Compliance monitoring location CTL(1) is not listed because it is a tidally influenced location and freshwater flows cannot be accurately recorded.
b. Precipitation and flow data are recorded at SD8(1) and Z Street as part of the Diazinon TMDL and the Dissolved Metals TMDL (Amec Foster Wheeler, 2016b). These data are not a requirement of the Bacteria TMDL compliance monitoring program.
c. Wet Weather Event 2 did not exceed 0.2 inch at SDIA or the SD8(1) rain gauge. However, Montgomery Field and other rain gauges in the Chollas Creek Watershed exceeded the 0.2-inch target.
d. The rainfall data suggests the tipping bucket rain gauge at Z Street may have become clogged with debris during Wet Weather Event 3; therefore, total rainfall may not be accurately represented for the south Chollas Creek MLS area during.
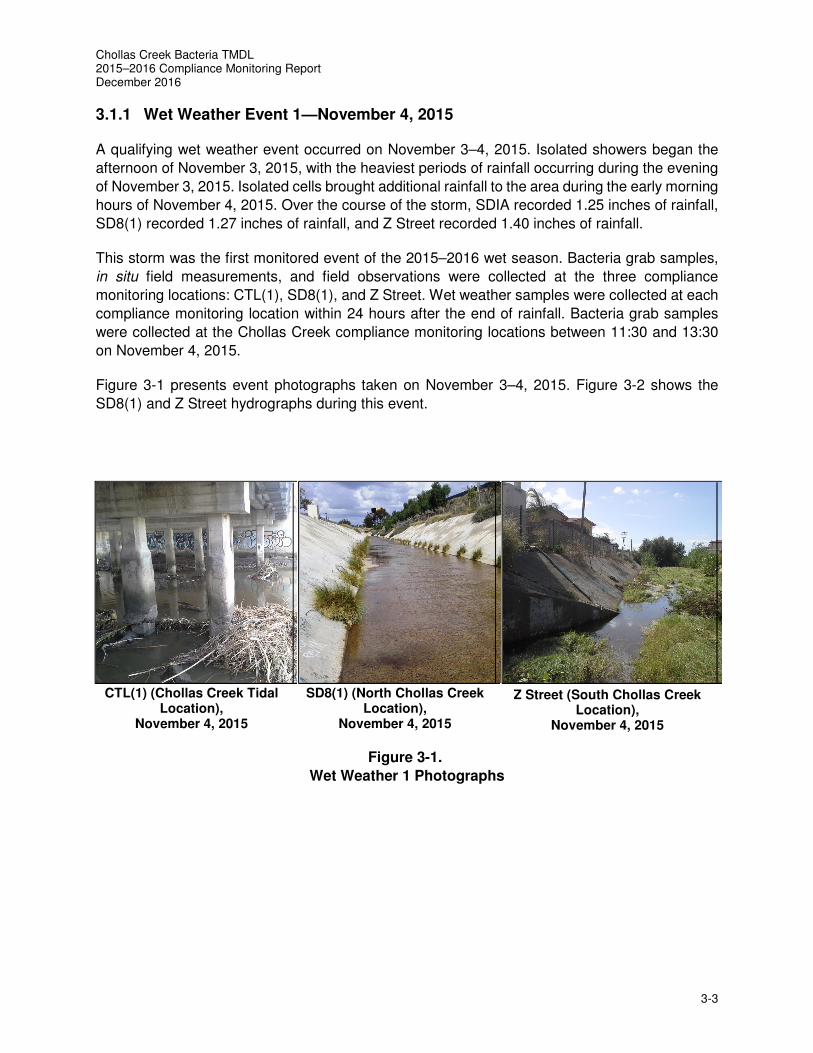
Chollas Creek Bacteria TMDL 2015–2016 Compliance Monitoring Report December 2016
3-3
3.1.1 Wet Weather Event 1—November 4, 2015
A qualifying wet weather event occurred on November 3–4, 2015. Isolated showers began the
afternoon of November 3, 2015, with the heaviest periods of rainfall occurring during the evening
of November 3, 2015. Isolated cells brought additional rainfall to the area during the early morning
hours of November 4, 2015. Over the course of the storm, SDIA recorded 1.25 inches of rainfall,
SD8(1) recorded 1.27 inches of rainfall, and Z Street recorded 1.40 inches of rainfall.
This storm was the first monitored event of the 2015–2016 wet season. Bacteria grab samples,
in situ field measurements, and field observations were collected at the three compliance
monitoring locations: CTL(1), SD8(1), and Z Street. Wet weather samples were collected at each
compliance monitoring location within 24 hours after the end of rainfall. Bacteria grab samples
were collected at the Chollas Creek compliance monitoring locations between 11:30 and 13:30
on November 4, 2015.
Figure 3-1 presents event photographs taken on November 3–4, 2015. Figure 3-2 shows the
SD8(1) and Z Street hydrographs during this event.
CTL(1) (Chollas Creek Tidal Location),
November 4, 2015
SD8(1) (North Chollas Creek Location),
November 4, 2015
Z Street (South Chollas Creek Location),
November 4, 2015
Figure 3-1.
Wet Weather 1 Photographs
Chollas Creek Bacteria TMDL 2015–2016 Compliance Monitoring Report December 2016
3-4
Notes: SD8(1) = north Chollas Creek location, Z Street = south Chollas Creek location; cf = cubic feet; cfs = cubic feet per second; in. = inch
Figure 3-2.
Wet Weather 1 Hydrographs, SD8(1) and Z Street
Chollas Creek Bacteria TMDL 2015–2016 Compliance Monitoring Report December 2016
3-5
3.1.2 Wet Weather Event 2—December 29, 2015
The season’s second monitored wet weather event occurred on December 28–29, 2015. Showers
began the afternoon of December 28, 2015, and continued intermittently through
December 29, 2015, with the most intense rainfall occurring in the evening on
December 28, 2015. Over the course of the storm, SDIA recorded 0.22 inch of rainfall, SD8(1)
recorded 0.18 inch of rainfall, and Z Street recorded 0.24 inch. Wet weather samples were
collected at each compliance monitoring location within 24 hours after the end of rainfall. Bacteria
grab samples were collected at the SD8(1) and Z Street compliance monitoring locations between
10:00 and 11:00 on December 29, 2015.
Figure 3-3 presents photographs of Wet Event 2 taken on December 29, 2015. Figure 3-4
presents the hydrographs from SD8(1) and Z Street during this event.
CTL(1) (Chollas Creek Tidal
Location), December 29, 2015
SD8(1) (North Chollas Creek
Location), December 29, 2015
Z Street (South Chollas Creek
Location), December 29, 2015
Figure 3-3.
Wet Weather 2 Photographs
Chollas Creek Bacteria TMDL 2015–2016 Compliance Monitoring Report December 2016
3-6
Notes: SD8(1) = north Chollas Creek location, Z Street = south Chollas Creek location; cf = cubic feet; cfs = cubic feet per second; in. = inch
Figure 3-4.
Wet Weather 2 Hydrographs, SD8(1) and Z Street
Chollas Creek Bacteria TMDL 2015–2016 Compliance Monitoring Report December 2016
3-7
3.1.3 Wet Weather Event 3—January 9, 2016
The third and final monitored event of the 2015–2016 wet season occurred on January 4–9, 2016.
Showers began the evening of January 4, 2016, and continued intermittently through the late
morning of January 8, 2016, with the heaviest rainfall occurring during the afternoon of
January 5, 2016. Over the course of the storm, SDIA recorded 3.35 inches and SD8(1) recorded
3.07 inches. The Z Street rain gauge recorded 2.36 inches of rainfall; however, the data indicate
that the rain gauge may have become clogged during the storm event.
Wet weather samples were collected at each compliance monitoring location within 24 hours after
the end of a storm event. Bacteria grab samples were collected at the Chollas Creek compliance
monitoring locations between 04:15 and 04:45 on January 9, 2016.
Wet Weather Event 3 photographs are not presented because sample collection occurred before
sunrise and clear photographs could not be obtained. Figure 3-5 presents the hydrographs from
SD8(1) and Z Street during this event.
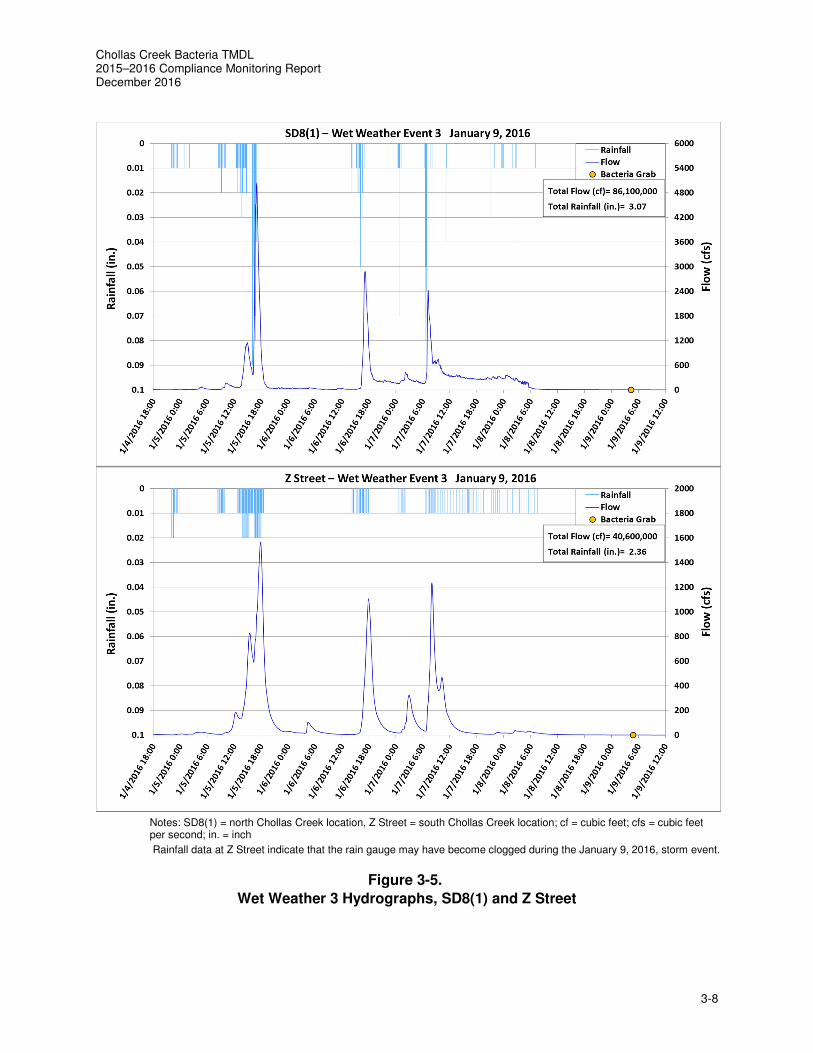
Chollas Creek Bacteria TMDL 2015–2016 Compliance Monitoring Report December 2016
3-8
Notes: SD8(1) = north Chollas Creek location, Z Street = south Chollas Creek location; cf = cubic feet; cfs = cubic feet per second; in. = inch
Rainfall data at Z Street indicate that the rain gauge may have become clogged during the January 9, 2016, storm event.
Figure 3-5.
Wet Weather 3 Hydrographs, SD8(1) and Z Street
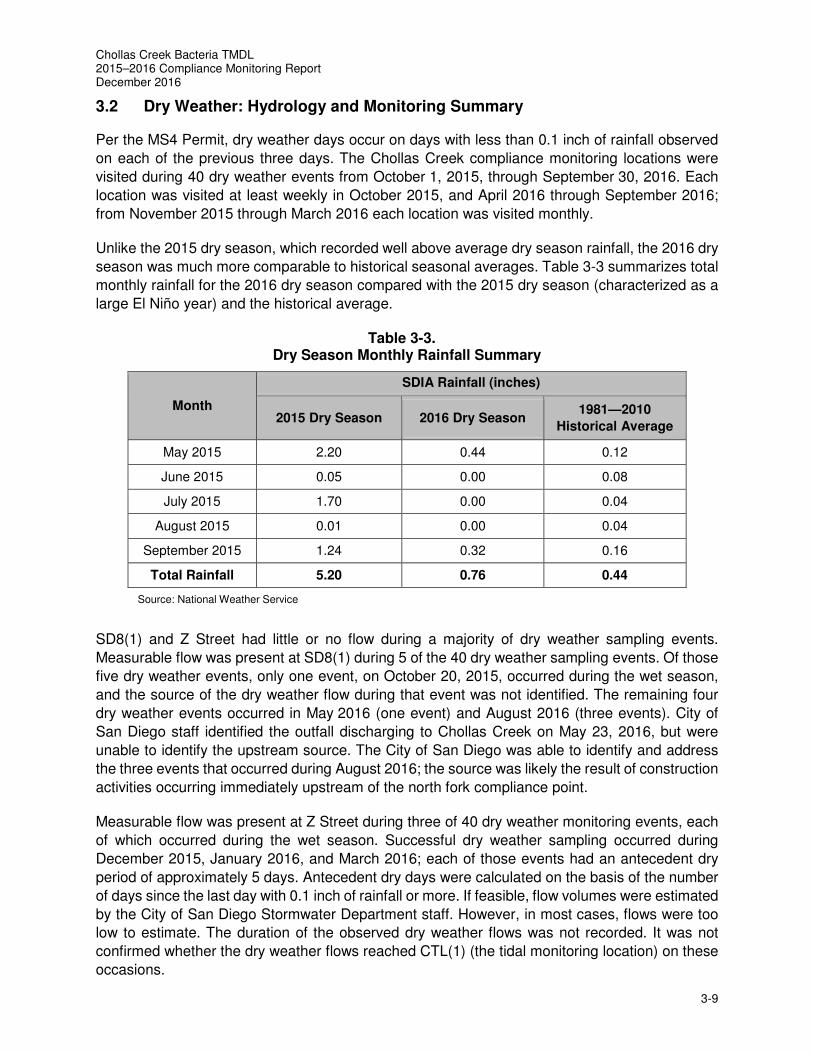
Chollas Creek Bacteria TMDL 2015–2016 Compliance Monitoring Report December 2016
3-9
3.2 Dry Weather: Hydrology and Monitoring Summary
Per the MS4 Permit, dry weather days occur on days with less than 0.1 inch of rainfall observed
on each of the previous three days. The Chollas Creek compliance monitoring locations were
visited during 40 dry weather events from October 1, 2015, through September 30, 2016. Each
location was visited at least weekly in October 2015, and April 2016 through September 2016;
from November 2015 through March 2016 each location was visited monthly.
Unlike the 2015 dry season, which recorded well above average dry season rainfall, the 2016 dry
season was much more comparable to historical seasonal averages. Table 3-3 summarizes total
monthly rainfall for the 2016 dry season compared with the 2015 dry season (characterized as a
large El Niño year) and the historical average.
Table 3-3. Dry Season Monthly Rainfall Summary
Month
SDIA Rainfall (inches)
2015 Dry Season 2016 Dry Season 1981—2010
Historical Average
May 2015 2.20 0.44 0.12
June 2015 0.05 0.00 0.08
July 2015 1.70 0.00 0.04
August 2015 0.01 0.00 0.04
September 2015 1.24 0.32 0.16
Total Rainfall 5.20 0.76 0.44
Source: National Weather Service
SD8(1) and Z Street had little or no flow during a majority of dry weather sampling events.
Measurable flow was present at SD8(1) during 5 of the 40 dry weather sampling events. Of those
five dry weather events, only one event, on October 20, 2015, occurred during the wet season,
and the source of the dry weather flow during that event was not identified. The remaining four
dry weather events occurred in May 2016 (one event) and August 2016 (three events). City of
San Diego staff identified the outfall discharging to Chollas Creek on May 23, 2016, but were
unable to identify the upstream source. The City of San Diego was able to identify and address
the three events that occurred during August 2016; the source was likely the result of construction
activities occurring immediately upstream of the north fork compliance point.
Measurable flow was present at Z Street during three of 40 dry weather monitoring events, each
of which occurred during the wet season. Successful dry weather sampling occurred during
December 2015, January 2016, and March 2016; each of those events had an antecedent dry
period of approximately 5 days. Antecedent dry days were calculated on the basis of the number
of days since the last day with 0.1 inch of rainfall or more. If feasible, flow volumes were estimated
by the City of San Diego Stormwater Department staff. However, in most cases, flows were too
low to estimate. The duration of the observed dry weather flows was not recorded. It was not
confirmed whether the dry weather flows reached CTL(1) (the tidal monitoring location) on these
occasions.
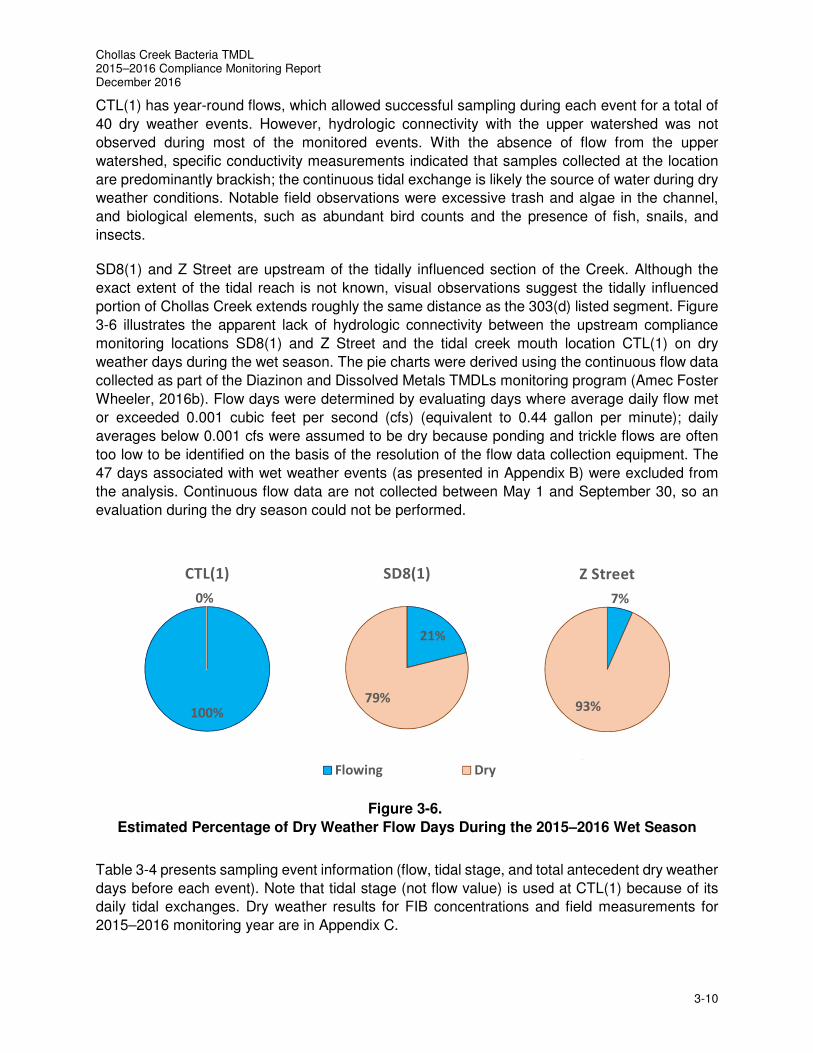
Chollas Creek Bacteria TMDL 2015–2016 Compliance Monitoring Report December 2016
3-10
CTL(1) has year-round flows, which allowed successful sampling during each event for a total of
40 dry weather events. However, hydrologic connectivity with the upper watershed was not
observed during most of the monitored events. With the absence of flow from the upper
watershed, specific conductivity measurements indicated that samples collected at the location
are predominantly brackish; the continuous tidal exchange is likely the source of water during dry
weather conditions. Notable field observations were excessive trash and algae in the channel,
and biological elements, such as abundant bird counts and the presence of fish, snails, and
insects.
SD8(1) and Z Street are upstream of the tidally influenced section of the Creek. Although the
exact extent of the tidal reach is not known, visual observations suggest the tidally influenced
portion of Chollas Creek extends roughly the same distance as the 303(d) listed segment. Figure
3-6 illustrates the apparent lack of hydrologic connectivity between the upstream compliance
monitoring locations SD8(1) and Z Street and the tidal creek mouth location CTL(1) on dry
weather days during the wet season. The pie charts were derived using the continuous flow data
collected as part of the Diazinon and Dissolved Metals TMDLs monitoring program (Amec Foster
Wheeler, 2016b). Flow days were determined by evaluating days where average daily flow met
or exceeded 0.001 cubic feet per second (cfs) (equivalent to 0.44 gallon per minute); daily
averages below 0.001 cfs were assumed to be dry because ponding and trickle flows are often
too low to be identified on the basis of the resolution of the flow data collection equipment. The
47 days associated with wet weather events (as presented in Appendix B) were excluded from
the analysis. Continuous flow data are not collected between May 1 and September 30, so an
evaluation during the dry season could not be performed.
Figure 3-6.
Estimated Percentage of Dry Weather Flow Days During the 2015–2016 Wet Season
Table 3-4 presents sampling event information (flow, tidal stage, and total antecedent dry weather
days before each event). Note that tidal stage (not flow value) is used at CTL(1) because of its
daily tidal exchanges. Dry weather results for FIB concentrations and field measurements for
2015–2016 monitoring year are in Appendix C.
21%
79%
SD8(1)
Flowing Dry
7%
93%
Z Street
Flowing Dry
100%
0%
CTL(1)
Flowing Dry
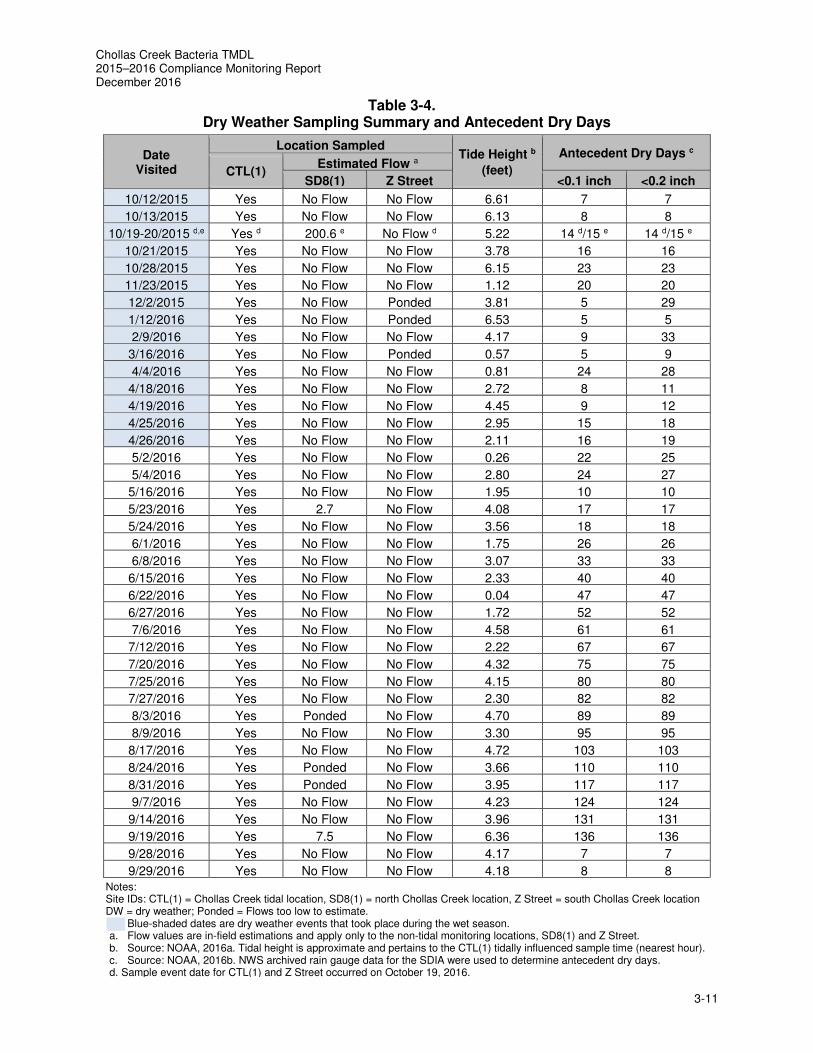
Chollas Creek Bacteria TMDL 2015–2016 Compliance Monitoring Report December 2016
3-11
Table 3-4. Dry Weather Sampling Summary and Antecedent Dry Days
Date Visited
Location Sampled Tide Height b
(feet)
Antecedent Dry Days c
CTL(1) Estimated Flow a
SD8(1) Z Street <0.1 inch <0.2 inch
10/12/2015 Yes No Flow No Flow 6.61 7 7
10/13/2015 Yes No Flow No Flow 6.13 8 8
10/19-20/2015 d,e Yes d 200.6 e No Flow d 5.22 14 d/15 e 14 d/15 e
10/21/2015 Yes No Flow No Flow 3.78 16 16
10/28/2015 Yes No Flow No Flow 6.15 23 23
11/23/2015 Yes No Flow No Flow 1.12 20 20
12/2/2015 Yes No Flow Ponded 3.81 5 29
1/12/2016 Yes No Flow Ponded 6.53 5 5
2/9/2016 Yes No Flow No Flow 4.17 9 33
3/16/2016 Yes No Flow Ponded 0.57 5 9
4/4/2016 Yes No Flow No Flow 0.81 24 28
4/18/2016 Yes No Flow No Flow 2.72 8 11
4/19/2016 Yes No Flow No Flow 4.45 9 12
4/25/2016 Yes No Flow No Flow 2.95 15 18
4/26/2016 Yes No Flow No Flow 2.11 16 19
5/2/2016 Yes No Flow No Flow 0.26 22 25
5/4/2016 Yes No Flow No Flow 2.80 24 27
5/16/2016 Yes No Flow No Flow 1.95 10 10
5/23/2016 Yes 2.7 No Flow 4.08 17 17
5/24/2016 Yes No Flow No Flow 3.56 18 18
6/1/2016 Yes No Flow No Flow 1.75 26 26
6/8/2016 Yes No Flow No Flow 3.07 33 33
6/15/2016 Yes No Flow No Flow 2.33 40 40
6/22/2016 Yes No Flow No Flow 0.04 47 47
6/27/2016 Yes No Flow No Flow 1.72 52 52
7/6/2016 Yes No Flow No Flow 4.58 61 61
7/12/2016 Yes No Flow No Flow 2.22 67 67
7/20/2016 Yes No Flow No Flow 4.32 75 75
7/25/2016 Yes No Flow No Flow 4.15 80 80
7/27/2016 Yes No Flow No Flow 2.30 82 82
8/3/2016 Yes Ponded No Flow 4.70 89 89
8/9/2016 Yes No Flow No Flow 3.30 95 95
8/17/2016 Yes No Flow No Flow 4.72 103 103
8/24/2016 Yes Ponded No Flow 3.66 110 110
8/31/2016 Yes Ponded No Flow 3.95 117 117
9/7/2016 Yes No Flow No Flow 4.23 124 124
9/14/2016 Yes No Flow No Flow 3.96 131 131
9/19/2016 Yes 7.5 No Flow 6.36 136 136
9/28/2016 Yes No Flow No Flow 4.17 7 7
9/29/2016 Yes No Flow No Flow 4.18 8 8
Notes: Site IDs: CTL(1) = Chollas Creek tidal location, SD8(1) = north Chollas Creek location, Z Street = south Chollas Creek location DW = dry weather; Ponded = Flows too low to estimate.
Blue-shaded dates are dry weather events that took place during the wet season. a. Flow values are in-field estimations and apply only to the non-tidal monitoring locations, SD8(1) and Z Street. b. Source: NOAA, 2016a. Tidal height is approximate and pertains to the CTL(1) tidally influenced sample time (nearest hour). c. Source: NOAA, 2016b. NWS archived rain gauge data for the SDIA were used to determine antecedent dry days. d. Sample event date for CTL(1) and Z Street occurred on October 19, 2016.
Chollas Creek Bacteria TMDL 2015–2016 Compliance Monitoring Report December 2016
3-12
This page intentionally left blank
Chollas Creek Bacteria TMDL 2015–2016 Compliance Monitoring Report December 2016
4-1
4.0 MONITORING RESULTS
This section presents FIB data collected from October 2015 through September 2016.
Additionally, historical FIB data collected beginning in 2012 are provided in Appendix D.
Appendix B presents additional wet weather data, including analytical results, optional field
measurements, and observed wet weather days, for the 2015–2016 wet season. Appendix E
contains the 2015–2016 wet weather laboratory reports. Appendix F contains the wet weather
field data sheets.
4.1 Wet Weather Fecal Indicator Bacteria Concentrations
Elevated FIB concentrations were detected in all three monitored storm events of the 2015–2016
storm season. Long-term FIB concentration trends have not been evaluated. The extended
periods of drought during winter months may influence seasonal results, because the watershed
system as a whole is flushed out less frequently than in years with normal rainfall. Fecal coliform
concentrations tend to decrease later in the wet season. Concentrations of Enterococcus, which
is thought to replicate and persist in extra-enteric environments and may be more resistant to
harsh environments than other indicator species, did not decrease later in the season
(Byappanahalli et al., 2012).
Table 4-1 lists the current wet weather analytical results at the three Chollas Creek compliance
monitoring locations. With the exception of fecal coliform detected at Z Street during Wet Weather
Event 2, the FIB concentrations at all compliance monitoring locations exceeded the single-
sample maximum numeric target for all three wet weather events monitored, as presented in
Figure 4-1.
Chollas Creek Bacteria TMDL 2015–2016 Compliance Monitoring Report November 2016
4-2
Table 4-1.
Wet Weather Analytical Results
Analyte Unit Numeric
Target Method
Reporting
Limit a
WW1, 11/4/2015 WW2, 12/29/2015 WW3, 1/9/2016
CTL(1) SD8(1) Z Street CTL(1) SD8(1) Z Street CTL(1) SD8(1) Z Street
Enterococcus CFU/
100mL 61
SM 9230C b 20–1000 28,000 13,000 34,000 9,800 3,200 3,200 1,300 1,600 1,100
USEPA 1600 c
Fecal Coliform CFU/
100mL 400 SM 9222D d 20–1000 66,000 54,000 58,000 2,000 2,200 320 2,500 1,100 1,400
Notes: Site IDs: CTL(1) = Chollas Creek tidal location, SD8(1) = north Chollas Creek location, Z Street = south Chollas Creek location; CFU = colony-forming unit; mL = milliliters; RL = reporting limit; SM = Standard Method; USEPA = U.S. Environmental Protection Agency Bolded values indicate that the value exceeds the single-sample maximum numeric target. a. Reporting limit values vary with the dilutions used to generate plates within the countable range. b. Analytical method used for Wet Weather Event 1. c. Analytical method used for Wet Weather Event 2 and Wet Weather Event 3. d. Analytical method used for all Wet Weather Events.
Chollas Creek Bacteria TMDL 2015–2016 Compliance Monitoring Report December 2016
4-3
Figure 4-1.
2015–2016 Wet Weather Fecal Indicator Bacteria Concentrations
4.2 Dry Weather Fecal Indicator Bacteria Concentrations
SD8(1) location had flow during five dry weather monitoring events during the 2015–2016 season.
Prior to October 20, 2016, the first of those events, dry weather flows had not been observed
since December 2013. During dry weather, the creek at Z Street was most likely to flow from
residual stormwater runoff. The south Chollas Creek location was typically dry with flow observed
only 8 of the 40 dry weather events and 7 of the 8 monitored dry weather events occurred within
seven days after a storm event. The weekly monitoring records show that these dry weather flows
were short-lived at the south Chollas Creek location. Prior to this monitoring period, no dry
weather flows had been observed at this location since December 2013.
Figures 4-2 through 4-4 depict each dry weather monitored event in the 2015–2016 monitoring
season and the reported FIB concentrations for dry weather samples collected. The blue-shaded
areas represent dry weather results that occurred during the wet season, when greater
concentrations were more likely to occur. During the dry season, the majority of CTL(1) results
were qualified as less than the reporting limit of 20 CFU/100mL. Since a lower reporting limit could
not be achieved, the results are presented as 20 CFU/100mL.
1
10
100
1,000
10,000
100,000
1,000,000
CTL(1) SD8(1) Z Street CTL(1) SD8(1) Z Street CTL(1) SD8(1) Z Street
Co
nc
en
trati
on
(C
FU
/10
0m
L)
Wet Weather 1 November 4, 2015
Wet Weather 3 January 9, 2016
Wet Weather 2December 29, 2015
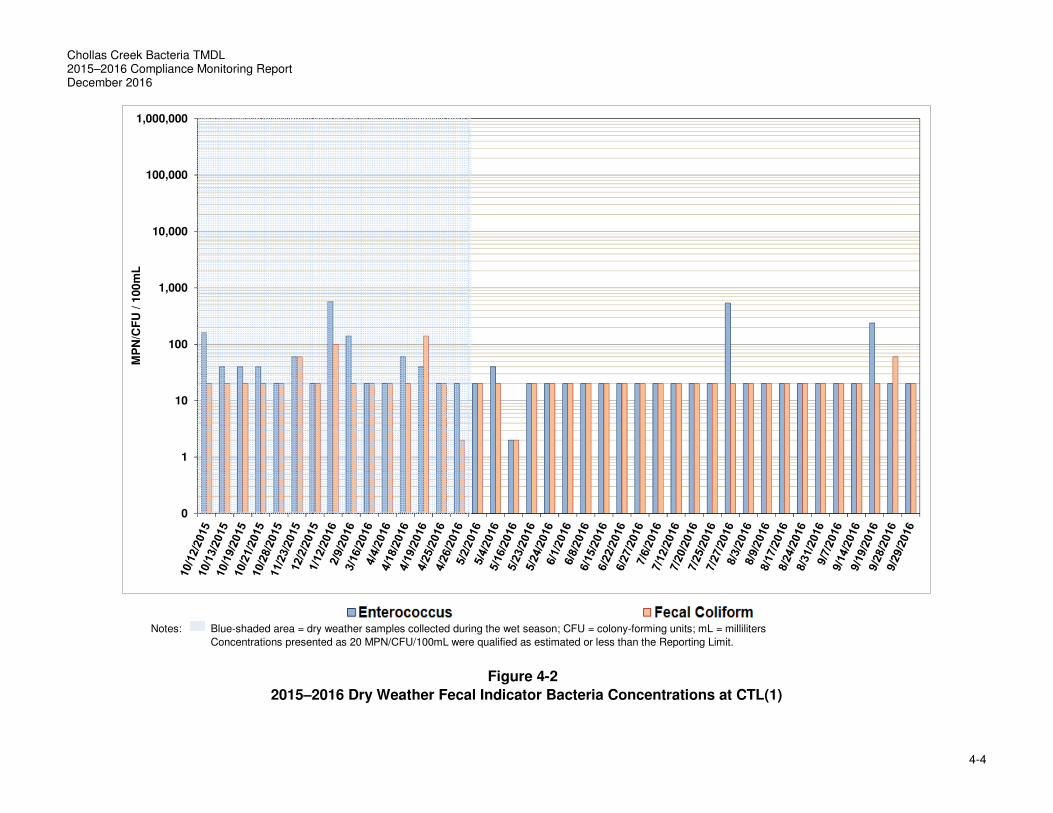
Chollas Creek Bacteria TMDL 2015–2016 Compliance Monitoring Report December 2016
4-4
Notes: Blue-shaded area = dry weather samples collected during the wet season; CFU = colony-forming units; mL = milliliters
Concentrations presented as 20 MPN/CFU/100mL were qualified as estimated or less than the Reporting Limit.
Figure 4-2
2015–2016 Dry Weather Fecal Indicator Bacteria Concentrations at CTL(1)
0
1
10
100
1,000
10,000
100,000
1,000,000
MP
N/C
FU
/ 1
00
mL
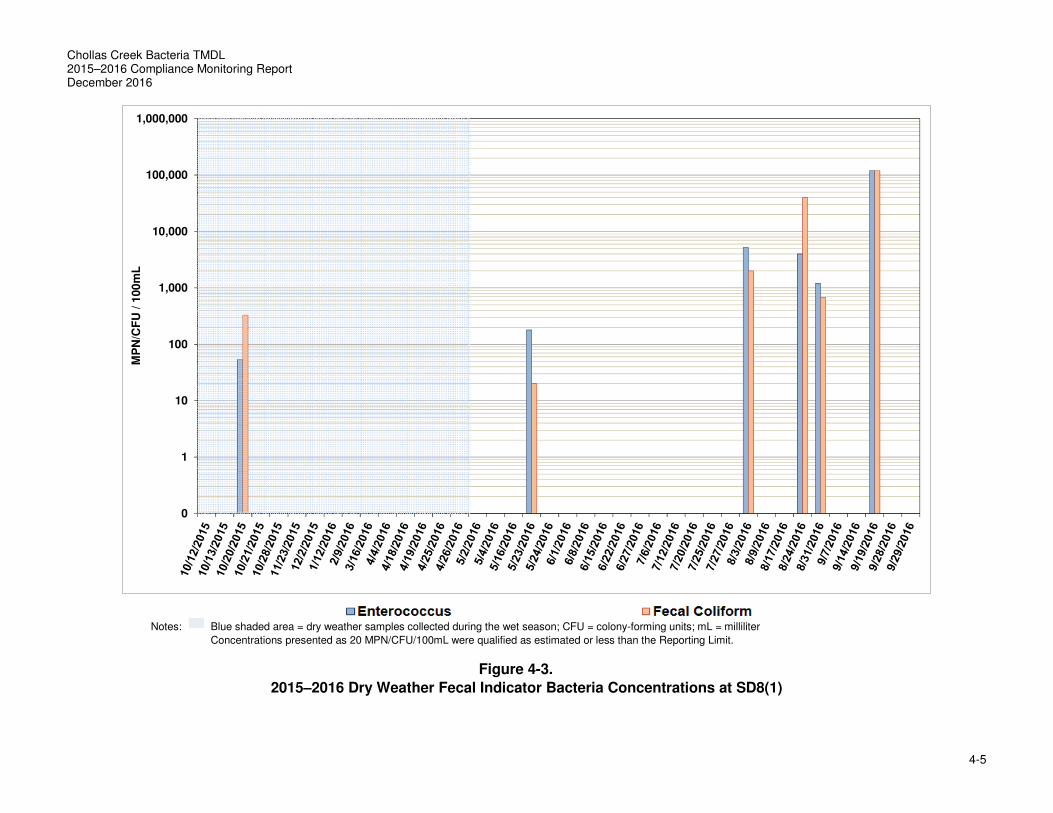
Chollas Creek Bacteria TMDL 2015–2016 Compliance Monitoring Report December 2016
4-5
Notes: Blue shaded area = dry weather samples collected during the wet season; CFU = colony-forming units; mL = milliliter
Concentrations presented as 20 MPN/CFU/100mL were qualified as estimated or less than the Reporting Limit.
Figure 4-3.
2015–2016 Dry Weather Fecal Indicator Bacteria Concentrations at SD8(1)
0
1
10
100
1,000
10,000
100,000
1,000,000
MP
N/C
FU
/ 1
00
mL
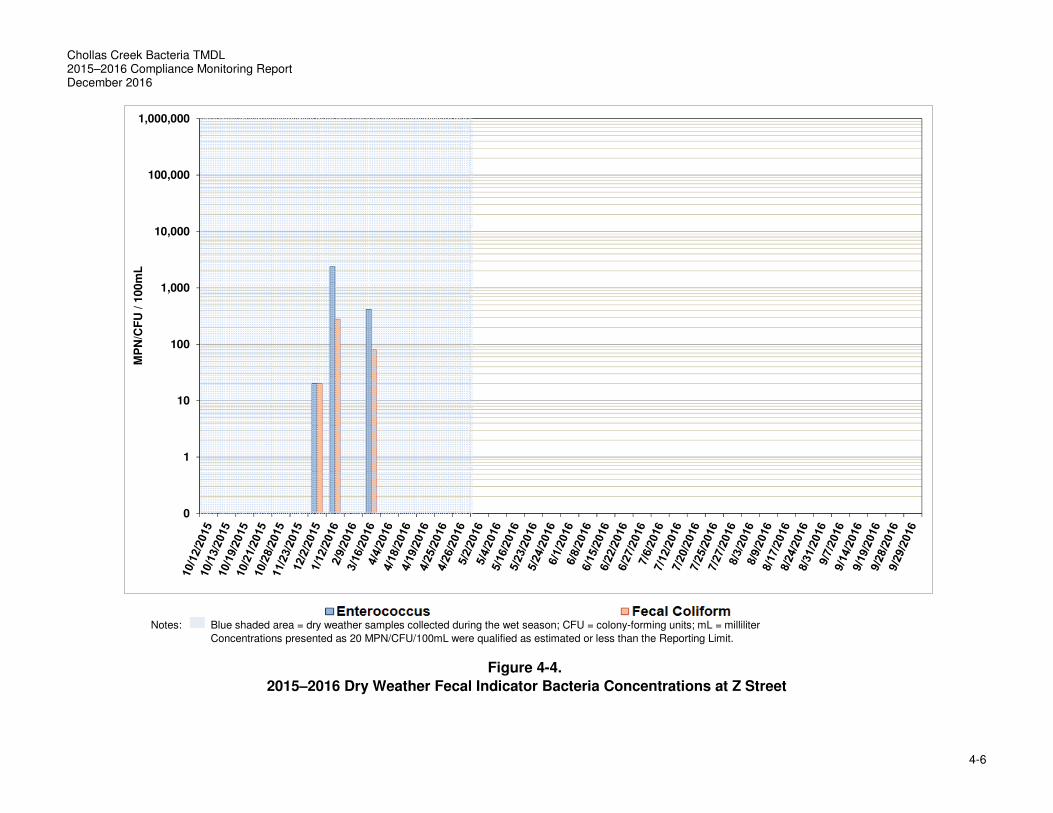
Chollas Creek Bacteria TMDL 2015–2016 Compliance Monitoring Report December 2016
4-6
Notes: Blue shaded area = dry weather samples collected during the wet season; CFU = colony-forming units; mL = milliliter
Concentrations presented as 20 MPN/CFU/100mL were qualified as estimated or less than the Reporting Limit.
Figure 4-4.
2015–2016 Dry Weather Fecal Indicator Bacteria Concentrations at Z Street
0
1
10
100
1,000
10,000
100,000
1,000,000
MP
N/C
FU
/ 1
00
mL
Chollas Creek Bacteria TMDL 2015–2016 Compliance Monitoring Report December 2016
5-1
5.0 COMPLIANCE EVALUATION
This section presents the results of the compliance evaluation for wet and dry seasons in
accordance with the assessment requirements in Attachment E.6 of the MS4 Permit. FIB data
collected between October 2015 and September 2016 were used to assess compliance in
accordance with the MS4 Permit. Separate evaluations were completed using single-sample
maximum exceedance frequencies for wet weather results and geometric mean exceedance
frequencies for both combined wet weather and dry weather results during the wet season and
dry weather results collected during the dry season. Several inconsistencies were identified in
Attachment E.6.6 of the MS4 Permit that may affect the interpretation of compliance; these
inconsistencies are explained in detail in Appendix G.
5.1 Wet Weather Single-Sample Maximum Exceedance Frequencies
Per the MS4 Permit assessment requirements, the wet weather exceedance frequency is inferred
from the three sampled wet weather events. A wet weather day, as defined in the MS4 Permit,
includes any wet weather storm event with more than 0.2 inch of rainfall, plus the following
72 hours. The 2015–2016 wet season had a total of 47 wet weather days. Wet weather days
identified during the 2015–2016 wet season are detailed in Appendix B. For each compliance
monitoring location, this assessment applied the arithmetic mean of the three wet weather sample
results to each non-sampled wet weather day. A total of 14 of the 47 wet weather days were
associated with sampled storm events (three storm events plus the following 72 hours per event)
and the average of the results was assigned to each of the remaining 33 wet days. This
assessment resulted in an exceedance frequency of 100 percent of wet weather numeric targets
at all compliance sites.
Table 5-1 presents the wet weather numeric target and exceedance days for each compliance
monitoring location, as well as exceedance frequencies. Additional results, including optional field
measurements and observed wet weather days for this monitoring year, are presented in
Appendix C.
Table 5-2 compares the wet weather exceedance frequencies with wet weather compliance
interim and final reduction milestones.
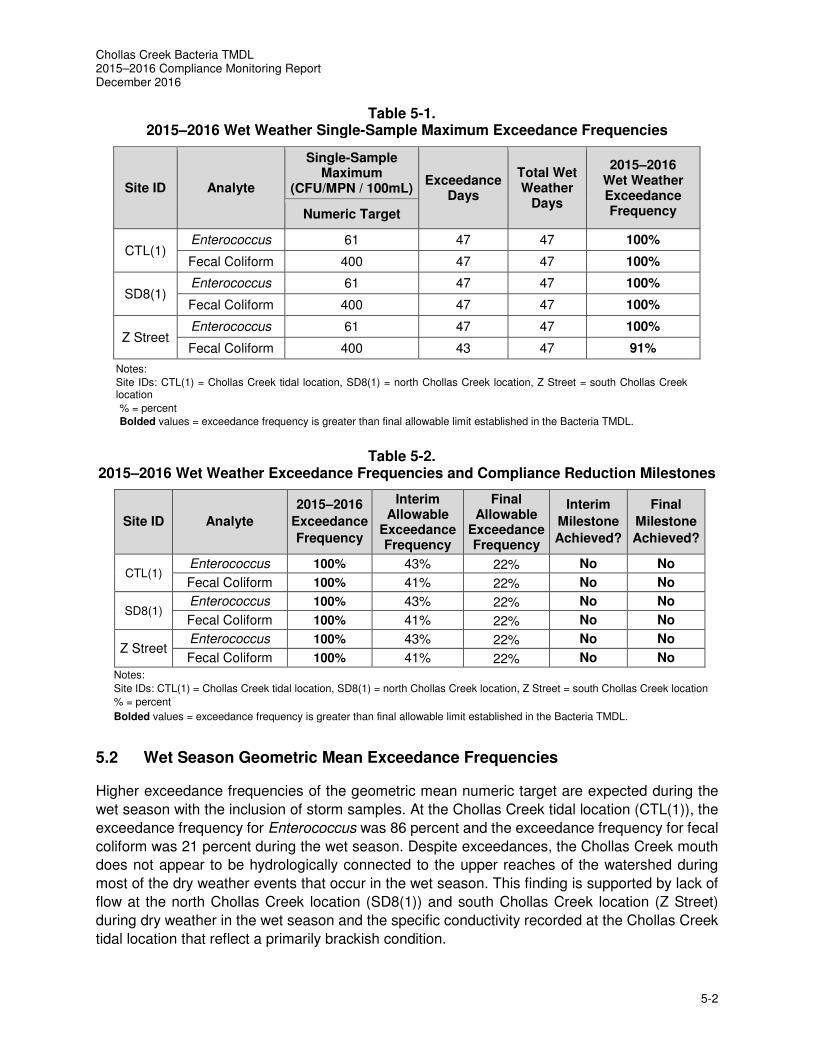
Chollas Creek Bacteria TMDL 2015–2016 Compliance Monitoring Report December 2016
5-2
Table 5-1. 2015–2016 Wet Weather Single-Sample Maximum Exceedance Frequencies
Site ID Analyte
Single-Sample Maximum
(CFU/MPN / 100mL) Exceedance
Days
Total Wet Weather
Days
2015–2016 Wet Weather Exceedance Frequency Numeric Target
CTL(1) Enterococcus 61 47 47 100%
Fecal Coliform 400 47 47 100%
SD8(1) Enterococcus 61 47 47 100%
Fecal Coliform 400 47 47 100%
Z Street Enterococcus 61 47 47 100%
Fecal Coliform 400 43 47 91%
Notes:
Site IDs: CTL(1) = Chollas Creek tidal location, SD8(1) = north Chollas Creek location, Z Street = south Chollas Creek location
% = percent
Bolded values = exceedance frequency is greater than final allowable limit established in the Bacteria TMDL.
Table 5-2. 2015–2016 Wet Weather Exceedance Frequencies and Compliance Reduction Milestones
Site ID Analyte
2015–2016
Exceedance
Frequency
Interim Allowable
Exceedance
Frequency
Final Allowable
Exceedance
Frequency
Interim
Milestone
Achieved?
Final
Milestone
Achieved?
CTL(1) Enterococcus 100% 43% 22% No No
Fecal Coliform 100% 41% 22% No No
SD8(1) Enterococcus 100% 43% 22% No No
Fecal Coliform 100% 41% 22% No No
Z Street Enterococcus 100% 43% 22% No No
Fecal Coliform 100% 41% 22% No No
Notes:
Site IDs: CTL(1) = Chollas Creek tidal location, SD8(1) = north Chollas Creek location, Z Street = south Chollas Creek location
% = percent
Bolded values = exceedance frequency is greater than final allowable limit established in the Bacteria TMDL.
5.2 Wet Season Geometric Mean Exceedance Frequencies
Higher exceedance frequencies of the geometric mean numeric target are expected during the
wet season with the inclusion of storm samples. At the Chollas Creek tidal location (CTL(1)), the
exceedance frequency for Enterococcus was 86 percent and the exceedance frequency for fecal
coliform was 21 percent during the wet season. Despite exceedances, the Chollas Creek mouth
does not appear to be hydrologically connected to the upper reaches of the watershed during
most of the dry weather events that occur in the wet season. This finding is supported by lack of
flow at the north Chollas Creek location (SD8(1)) and south Chollas Creek location (Z Street)
during dry weather in the wet season and the specific conductivity recorded at the Chollas Creek
tidal location that reflect a primarily brackish condition.
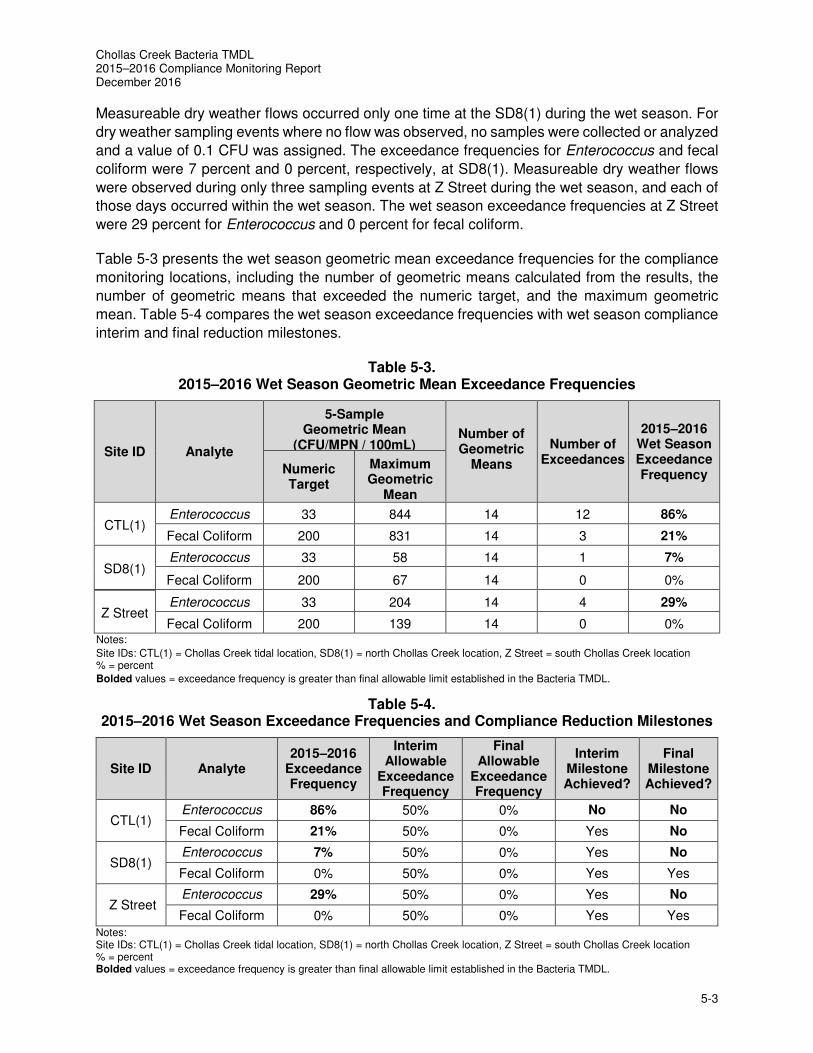
Chollas Creek Bacteria TMDL 2015–2016 Compliance Monitoring Report December 2016
5-3
Measureable dry weather flows occurred only one time at the SD8(1) during the wet season. For
dry weather sampling events where no flow was observed, no samples were collected or analyzed
and a value of 0.1 CFU was assigned. The exceedance frequencies for Enterococcus and fecal
coliform were 7 percent and 0 percent, respectively, at SD8(1). Measureable dry weather flows
were observed during only three sampling events at Z Street during the wet season, and each of
those days occurred within the wet season. The wet season exceedance frequencies at Z Street
were 29 percent for Enterococcus and 0 percent for fecal coliform.
Table 5-3 presents the wet season geometric mean exceedance frequencies for the compliance
monitoring locations, including the number of geometric means calculated from the results, the
number of geometric means that exceeded the numeric target, and the maximum geometric
mean. Table 5-4 compares the wet season exceedance frequencies with wet season compliance
interim and final reduction milestones.
Table 5-3. 2015–2016 Wet Season Geometric Mean Exceedance Frequencies
Site ID Analyte
5-Sample Geometric Mean
(CFU/MPN / 100mL) Number of Geometric
Means
Number of Exceedances
2015–2016 Wet Season Exceedance Frequency Numeric
Target
Maximum Geometric
Mean
CTL(1) Enterococcus 33 844 14 12 86%
Fecal Coliform 200 831 14 3 21%
SD8(1) Enterococcus 33 58 14 1 7%
Fecal Coliform 200 67 14 0 0%
Z Street Enterococcus 33 204 14 4 29%
Fecal Coliform 200 139 14 0 0% Notes:
Site IDs: CTL(1) = Chollas Creek tidal location, SD8(1) = north Chollas Creek location, Z Street = south Chollas Creek location % = percent
Bolded values = exceedance frequency is greater than final allowable limit established in the Bacteria TMDL.
Table 5-4. 2015–2016 Wet Season Exceedance Frequencies and Compliance Reduction Milestones
Site ID Analyte 2015–2016
Exceedance Frequency
Interim Allowable
Exceedance Frequency
Final Allowable
Exceedance Frequency
Interim Milestone Achieved?
Final Milestone Achieved?
CTL(1) Enterococcus 86% 50% 0% No No
Fecal Coliform 21% 50% 0% Yes No
SD8(1) Enterococcus 7% 50% 0% Yes No
Fecal Coliform 0% 50% 0% Yes Yes
Z Street Enterococcus 29% 50% 0% Yes No
Fecal Coliform 0% 50% 0% Yes Yes
Notes: Site IDs: CTL(1) = Chollas Creek tidal location, SD8(1) = north Chollas Creek location, Z Street = south Chollas Creek location % = percent Bolded values = exceedance frequency is greater than final allowable limit established in the Bacteria TMDL.
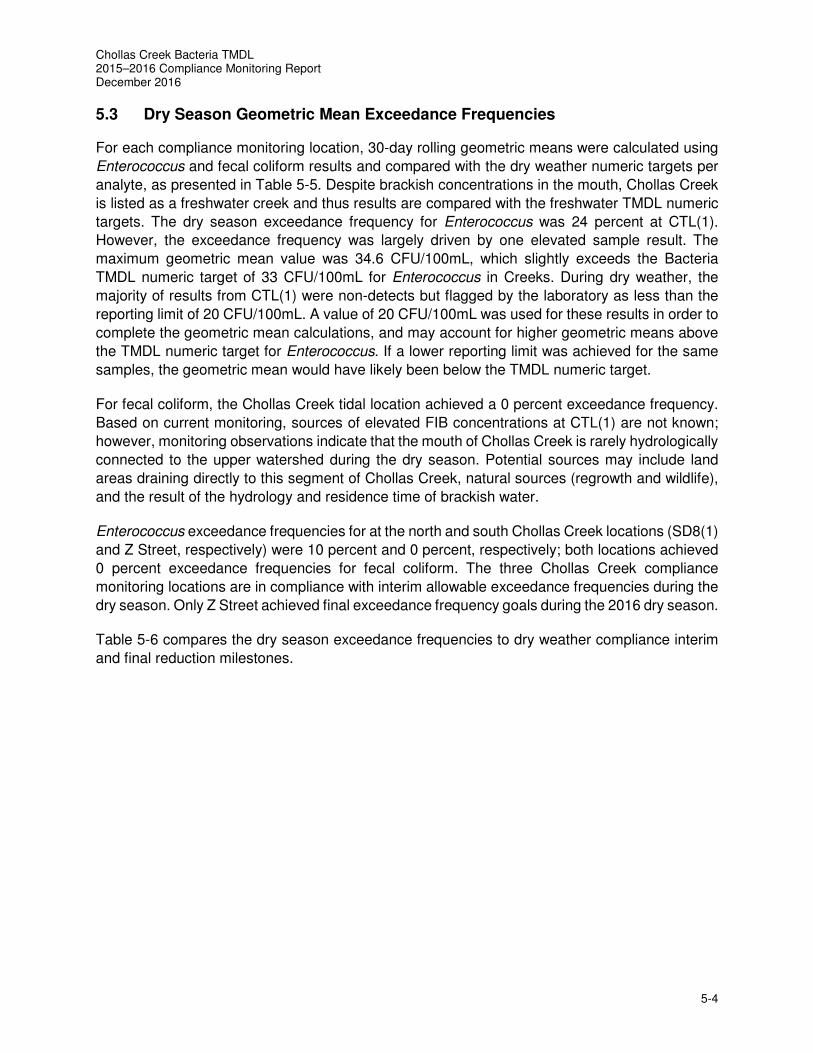
Chollas Creek Bacteria TMDL 2015–2016 Compliance Monitoring Report December 2016
5-4
5.3 Dry Season Geometric Mean Exceedance Frequencies
For each compliance monitoring location, 30-day rolling geometric means were calculated using
Enterococcus and fecal coliform results and compared with the dry weather numeric targets per
analyte, as presented in Table 5-5. Despite brackish concentrations in the mouth, Chollas Creek
is listed as a freshwater creek and thus results are compared with the freshwater TMDL numeric
targets. The dry season exceedance frequency for Enterococcus was 24 percent at CTL(1).
However, the exceedance frequency was largely driven by one elevated sample result. The
maximum geometric mean value was 34.6 CFU/100mL, which slightly exceeds the Bacteria
TMDL numeric target of 33 CFU/100mL for Enterococcus in Creeks. During dry weather, the
majority of results from CTL(1) were non-detects but flagged by the laboratory as less than the
reporting limit of 20 CFU/100mL. A value of 20 CFU/100mL was used for these results in order to
complete the geometric mean calculations, and may account for higher geometric means above
the TMDL numeric target for Enterococcus. If a lower reporting limit was achieved for the same
samples, the geometric mean would have likely been below the TMDL numeric target.
For fecal coliform, the Chollas Creek tidal location achieved a 0 percent exceedance frequency.
Based on current monitoring, sources of elevated FIB concentrations at CTL(1) are not known;
however, monitoring observations indicate that the mouth of Chollas Creek is rarely hydrologically
connected to the upper watershed during the dry season. Potential sources may include land
areas draining directly to this segment of Chollas Creek, natural sources (regrowth and wildlife),
and the result of the hydrology and residence time of brackish water.
Enterococcus exceedance frequencies for at the north and south Chollas Creek locations (SD8(1)
and Z Street, respectively) were 10 percent and 0 percent, respectively; both locations achieved
0 percent exceedance frequencies for fecal coliform. The three Chollas Creek compliance
monitoring locations are in compliance with interim allowable exceedance frequencies during the
dry season. Only Z Street achieved final exceedance frequency goals during the 2016 dry season.
Table 5-6 compares the dry season exceedance frequencies to dry weather compliance interim
and final reduction milestones.
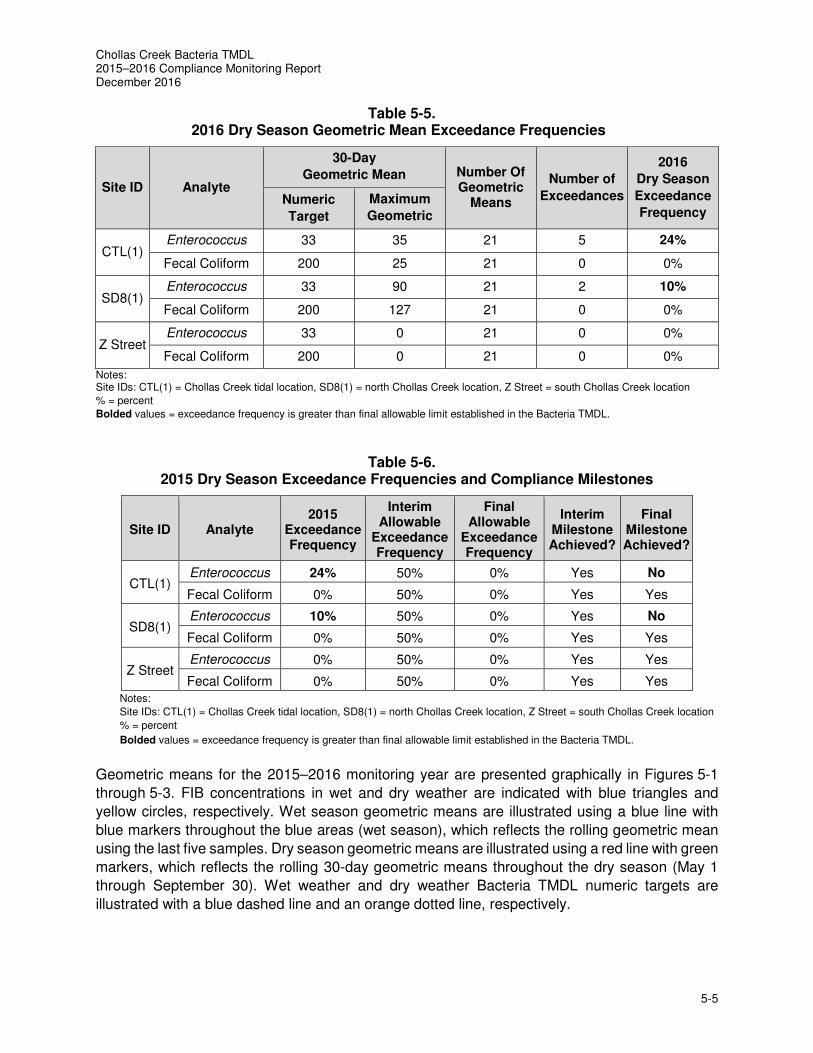
Chollas Creek Bacteria TMDL 2015–2016 Compliance Monitoring Report December 2016
5-5
Table 5-5. 2016 Dry Season Geometric Mean Exceedance Frequencies
Site ID Analyte
30-Day
Geometric Mean
(CFU/MPN / 100mL)
Number Of Geometric
Means
Number of
Exceedances
2016
Dry Season
Exceedance
Frequency Numeric
Target
Maximum
Geometric
Mean
CTL(1) Enterococcus 33 35 21 5 24%
Fecal Coliform 200 25 21 0 0%
SD8(1) Enterococcus 33 90 21 2 10%
Fecal Coliform 200 127 21 0 0%
Z Street Enterococcus 33 0 21 0 0%
Fecal Coliform 200 0 21 0 0%
Notes: Site IDs: CTL(1) = Chollas Creek tidal location, SD8(1) = north Chollas Creek location, Z Street = south Chollas Creek location
% = percent
Bolded values = exceedance frequency is greater than final allowable limit established in the Bacteria TMDL.
Table 5-6. 2015 Dry Season Exceedance Frequencies and Compliance Milestones
Site ID Analyte 2015
Exceedance Frequency
Interim Allowable
Exceedance Frequency
Final Allowable
Exceedance Frequency
Interim Milestone Achieved?
Final Milestone Achieved?
CTL(1) Enterococcus 24% 50% 0% Yes No
Fecal Coliform 0% 50% 0% Yes Yes
SD8(1) Enterococcus 10% 50% 0% Yes No
Fecal Coliform 0% 50% 0% Yes Yes
Z Street Enterococcus 0% 50% 0% Yes Yes
Fecal Coliform 0% 50% 0% Yes Yes
Notes:
Site IDs: CTL(1) = Chollas Creek tidal location, SD8(1) = north Chollas Creek location, Z Street = south Chollas Creek location
% = percent
Bolded values = exceedance frequency is greater than final allowable limit established in the Bacteria TMDL.
Geometric means for the 2015–2016 monitoring year are presented graphically in Figures 5-1
through 5-3. FIB concentrations in wet and dry weather are indicated with blue triangles and
yellow circles, respectively. Wet season geometric means are illustrated using a blue line with
blue markers throughout the blue areas (wet season), which reflects the rolling geometric mean
using the last five samples. Dry season geometric means are illustrated using a red line with green
markers, which reflects the rolling 30-day geometric means throughout the dry season (May 1
through September 30). Wet weather and dry weather Bacteria TMDL numeric targets are
illustrated with a blue dashed line and an orange dotted line, respectively.
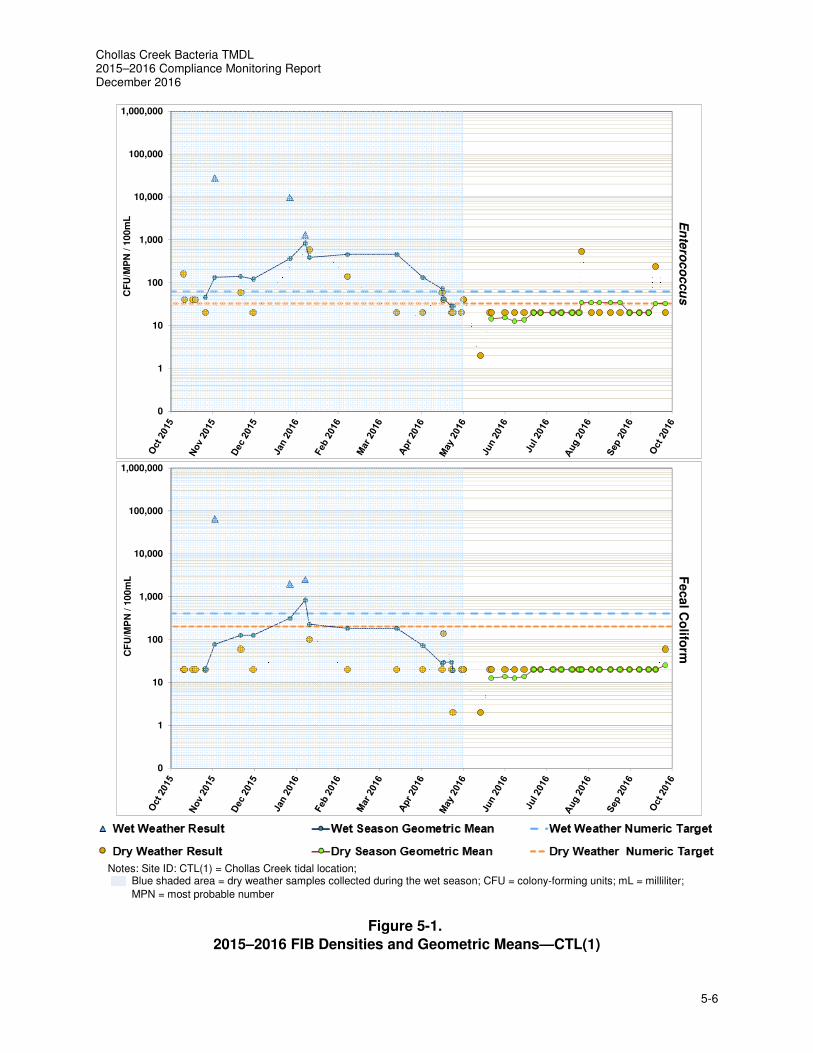
Chollas Creek Bacteria TMDL 2015–2016 Compliance Monitoring Report December 2016
5-6
Notes: Site ID: CTL(1) = Chollas Creek tidal location; Blue shaded area = dry weather samples collected during the wet season; CFU = colony-forming units; mL = milliliter;
MPN = most probable number
Figure 5-1.
2015–2016 FIB Densities and Geometric Means—CTL(1)
0
1
10
100
1,000
10,000
100,000
1,000,000
CF
U/M
PN
/ 1
00
mL E
nte
roc
oc
cu
s
0
1
10
100
1,000
10,000
100,000
1,000,000
CF
U/M
PN
/ 1
00
mL
Fe
ca
l Co
liform
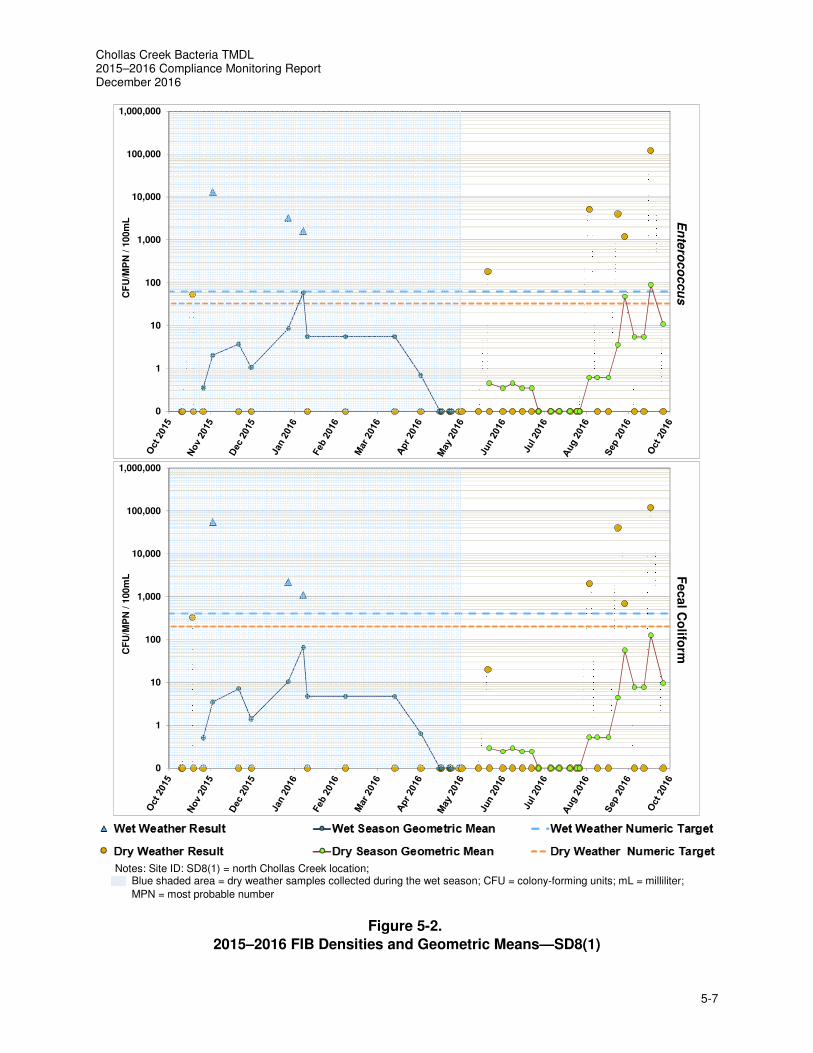
Chollas Creek Bacteria TMDL 2015–2016 Compliance Monitoring Report December 2016
5-7
Notes: Site ID: SD8(1) = north Chollas Creek location; Blue shaded area = dry weather samples collected during the wet season; CFU = colony-forming units; mL = milliliter;
MPN = most probable number
Figure 5-2.
2015–2016 FIB Densities and Geometric Means—SD8(1)
0
1
10
100
1,000
10,000
100,000
1,000,000
CF
U/M
PN
/ 1
00
mL E
nte
roc
oc
cu
s
0
1
10
100
1,000
10,000
100,000
1,000,000
CF
U/M
PN
/ 1
00
mL F
eca
l Co
liform
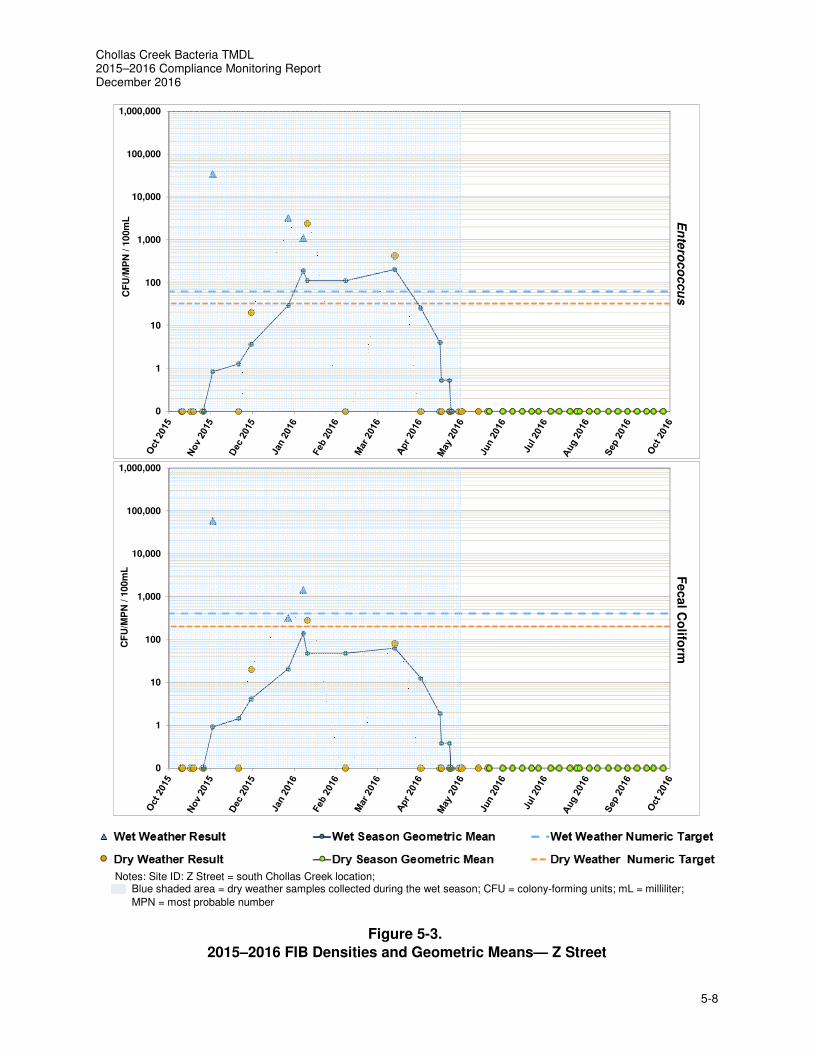
Chollas Creek Bacteria TMDL 2015–2016 Compliance Monitoring Report December 2016
5-8
Notes: Site ID: Z Street = south Chollas Creek location; Blue shaded area = dry weather samples collected during the wet season; CFU = colony-forming units; mL = milliliter;
MPN = most probable number
Figure 5-3.
2015–2016 FIB Densities and Geometric Means— Z Street
0
1
10
100
1,000
10,000
100,000
1,000,000
CF
U/M
PN
/ 1
00m
L En
tero
co
ccu
s
0
1
10
100
1,000
10,000
100,000
1,000,000
CF
U/M
PN
/ 1
00
mL F
eca
l Co
liform
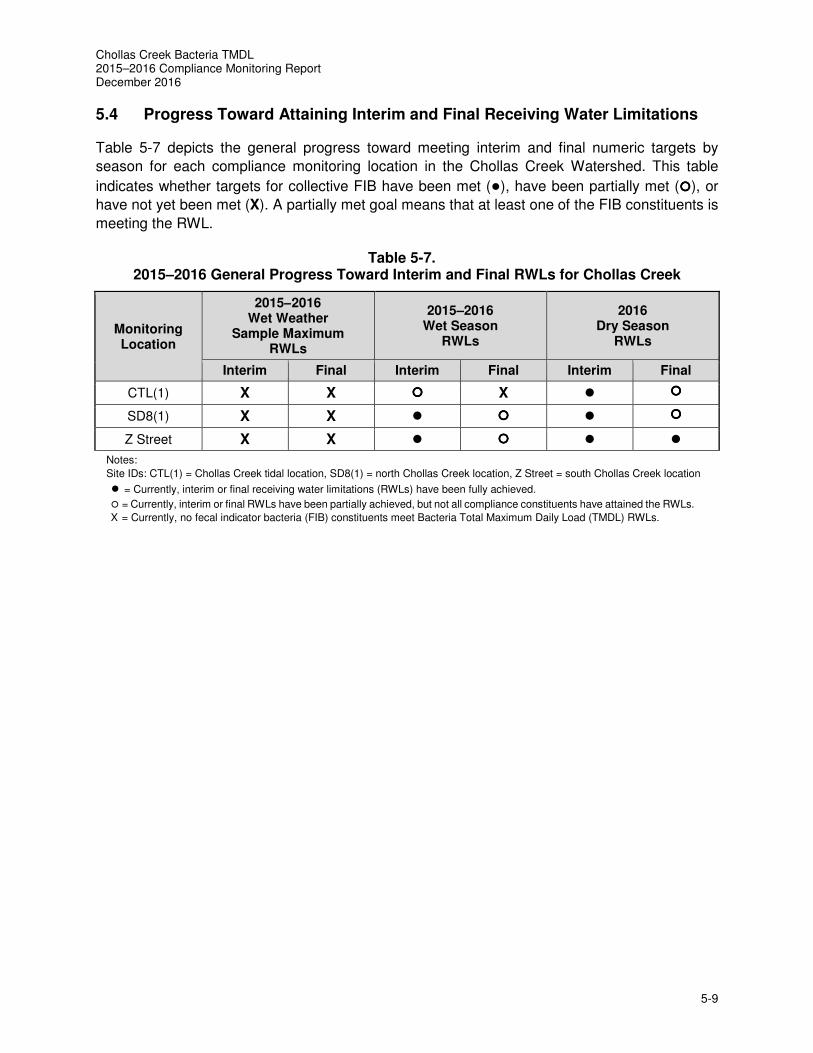
Chollas Creek Bacteria TMDL 2015–2016 Compliance Monitoring Report December 2016
5-9
5.4 Progress Toward Attaining Interim and Final Receiving Water Limitations
Table 5-7 depicts the general progress toward meeting interim and final numeric targets by
season for each compliance monitoring location in the Chollas Creek Watershed. This table
indicates whether targets for collective FIB have been met (●), have been partially met (����), or
have not yet been met (X). A partially met goal means that at least one of the FIB constituents is
meeting the RWL.
Table 5-7. 2015–2016 General Progress Toward Interim and Final RWLs for Chollas Creek
Monitoring Location
2015–2016 Wet Weather
Sample Maximum RWLs
2015–2016 Wet Season
RWLs
2016 Dry Season
RWLs
Interim Final Interim Final Interim Final
CTL(1) X X ���� X � ���� SD8(1) X X � ���� � ���� Z Street X X � ���� � �
Notes:
Site IDs: CTL(1) = Chollas Creek tidal location, SD8(1) = north Chollas Creek location, Z Street = south Chollas Creek location
● = Currently, interim or final receiving water limitations (RWLs) have been fully achieved.
� = Currently, interim or final RWLs have been partially achieved, but not all compliance constituents have attained the RWLs.
X = Currently, no fecal indicator bacteria (FIB) constituents meet Bacteria Total Maximum Daily Load (TMDL) RWLs.

Chollas Creek Bacteria TMDL 2015–2016 Compliance Monitoring Report December 2016
5-10
This page intentionally left blank.
Chollas Creek Bacteria TMDL 2015–2016 Compliance Monitoring Report December 2016
6-1
6.0 SUMMARY
This section summarizes current receiving water conditions in Chollas Creek related to the project
goals. The monitoring program has generated sufficient data to evaluate the project goals on the
basis of current conditions.
6.1 Characterization of Current Fecal Indicator Bacteria Concentrations
During storm events, the entire watershed is hydraulically connected and recreational water
quality standards are exceeded at all compliance monitoring locations. However, wet weather
flows are too high and dangerous for recreational activities to be safely performed. All locations
have elevated levels of FIB and are not currently meeting the wet weather RWLs.
Monitoring data indicate that the upper watershed is not typically hydraulically connected to the
lower segment of the creek during dry weather. Few exceedances, if any, occur at the upstream
MLS locations during the dry season, because most days are observed to be dry at these
locations. The lower portion of the creek, below where the north and south forks converge, is tidal
and water levels are sufficient to support recreational activities year round. Both the lack of dry
weather flows at the upstream MLS locations and the electrical conductivity measurements taken
at CTL(1), ranging from 43.3 to 60.3 milliSiemens per centimeter (mS/cm), suggest that flows are
or are close to pure saltwater during dry weather, fed by tidal fluctuations. Despite brackish
conditions in the lower portion of Chollas Creek, results are currently compared to freshwater
TMDL numeric targets.
Compliance monitoring data also indicate a greater frequency for Enterococcus exceedances
than fecal coliform exceedances. This observation is consistent with data collected for other
bacteria contamination studies, as Enterococcus has been shown to persist and even grow in the
environment without a proximate or recent source of contamination (Byappanahalli et al., 2012).
Sources of dry weather exceedances at the Chollas Creek tidal location (CTL(1)) are not known;
potential sources may be land-use areas directly draining to this segment of Chollas Creek or
natural sources (regrowth) and wildlife, or may result from the hydrology and residence time of
brackish water. It is evident that the upstream portions of Chollas Creek may not be contributing
to exceedances at the Chollas Creek tidal location during dry weather conditions because the
portions of the watershed are not hydraulically connected.
Overall, Chollas Creek is meeting the interim dry weather RWLs and making progress toward
meeting the final dry weather allowable exceedance frequencies. A majority of exceedances at
the compliance monitoring locations occur during the wet season as a result of residual storm
flows.
6.2 Evaluation of Progress toward Meeting Bacteria TMDL Numeric Targets
Interim and final RWLs for wet weather were not attained this year for all compliance monitoring
location. However, Chollas Creek is making progress toward meeting the dry weather RWLs. The
three compliance monitoring locations are meeting both interim dry weather RWLs. The 2015–
2016 monitoring results are summarized below.
Chollas Creek Bacteria TMDL 2015–2016 Compliance Monitoring Report December 2016
6-2
Wet Weather Single Sample Maximum Comparison
• Currently, no compliance monitoring locations achieved interim or final wet weather RWLs
for Enterococcus or fecal coliform.
Wet Season Geometric Mean Comparison
• Two of three compliance monitoring locations attained the interim dry weather RWLs for
Enterococcus and fecal coliform during the wet season.
• None of the compliance monitoring locations attained final dry weather RWLs for
Enterococcus and fecal coliform during the wet season.
Dry Season Geometric Mean Comparison
• The south Chollas Creek location (Z Street) attained the interim and final dry weather
RWLs for Enterococcus and fecal coliform during the dry season.
• The north Chollas Creek location (SD8(1)) and Chollas Creek tidal location attained
interim dry weather RWLs for Enterococcus and fecal coliform and final dry weather RWLs
for fecal coliform
Table 6-1 presents the exceedance frequencies by season in the Chollas Creek Watershed.
Chollas Creek Bacteria TMDL 2015–2016 Compliance Monitoring Report December 2016
6-3
Table 6-1.
2015–2016 Bacteria TMDL Exceedance Frequencies in Chollas Creek Watershed
Site ID
Bacteria
TMDL
Constituent
Wet Weather a Wet Season a,c Dry Season b
Single-Sample
Maximum
(CFU/100mL)
5-Sample
Geometric Mean
(CFU/100mL)
30-Day
Geometric Mean
(CFU/100mL)
2015–
2016 d
Exceedance Frequency
Interim
Allowable
Frequency
Final
Allowable
Frequency
2015–
2016 d
Exceedance Frequency
Interim
Allowable
Frequency
Final
Allowable
Frequency
2015–
2016 d
Exceedance Frequency
Interim
Allowable
Frequency
Final
Allowable
Frequency
CTL(1) Enterococcus 100% 43% 22% 86% 50% 0% 24% 50% 0%
Fecal Coliform 100% 41% 22% 21% 50% 0% 0% 50% 0%
SD8(1) Enterococcus 100% 43% 22% 7% 50% 0% 10% 50% 0%
Fecal Coliform 100% 41% 22% 0% 50% 0% 0% 50% 0%
Z Street Enterococcus 100% 43% 22% 29% 50% 0% 0% 50% 0%
Fecal Coliform 91% 41% 22% 0% 50% 0% 0% 50% 0%
Notes: Site IDs: CTL(1) = Chollas Creek tidal location, SD8(1) = north Chollas Creek location, Z Street = south Chollas Creek location
% = percent
Bolded values = exceedance frequency is greater than the interim and final allowable limit established in the Bacteria Total Maximum Daily Load (TMDL). a. October 1, 2015–April 30, 2016 b. May 1, 2016–September 30, 2016 c. In accordance with the MS4 Permit, wet and dry weather FIB data were combined to calculate geometric means for the wet season and compared to the dry weather exceedance frequencies
as shown in Table ES-1. d. The exceedance frequency was derived by dividing the total number of wet weather days (days with 0.2 inch of rainfall or greater plus the following 72 hours) that exceeded the single-
sample maximum numeric target divided by the total number of wet weather days during the wet season. To determine exceedances for non-sampled wet weather days, the arithmetic mean of the analytical results from three monitored storm events was applied to the remaining observed wet weather days that were not sampled. The results from the total number of wet weather days, with either assigned averages or analyzed result values, were then compared with single-sample maximum numeric targets.
e. The exceedance frequency was derived by dividing the total number of geometric exceedances by the total number of geometric means calculated during the season.
Chollas Creek Bacteria TMDL 2015–2016 Compliance Monitoring Report December 2016
6-4
This page intentionally left blank.
Chollas Creek Bacteria TMDL 2015–2016 Compliance Monitoring Report December 2016
7-1
7.0 REFERENCES
Amec Foster Wheeler, Environment & Infrastructure, Inc. (Amec Foster Wheeler). 2015. Chollas
Creek Bacteria Total Maximum Daily Load 2014–2015 Compliance Monitoring Report.
Prepared for: Amec Foster Wheeler Environment & Infrastructure, Inc. December.
Amec Foster Wheeler. 2016a. Chollas Creek Diazinon, Dissolved Metals, and Bacteria TMDLs
Monitoring Plan. Prepared for the City of San Diego. Prepared for: City of San Diego,
County of San Diego, Unites States Navy, San Diego Unified port District, City of La Mesa,
City of Lemon Grove, and the California Department of Transportation (Caltrans). January.
Amec Foster Wheeler. 2016b. Chollas Creek Dissolved Metals Total Maximum Daily Load 2015–
2016 Compliance Monitoring Report. Final. Prepared by Amec Foster Wheeler
Environment & Infrastructure, Inc. June.
Byappanahalli, Muruleedhara N.; Nevers, Meredith B.; Korajkic, Asja; Staley, Zachery R.; and
Harwood, Valerie J, 2012. Enterococci in the Environment. Microbiology and Molecular
Biology Reviews. 76(4): 685-706.
City of San Diego. 2012. Chollas Watershed Comprehensive Load Reduction Plan. Prepared by:
Tetra Tech, Inc. July.
National Oceanic Atmospheric Administration (NOAA), 2016a. Tides and Currents.
http://tidesandcurrents.noaa.gov/waterlevels.html?id=9410170. Website accessed in
October 2016.
NOAA, 2016b. Western Regional Headquarters. Annual Daily Rainfall Archive.
http://www.wrh.noaa.gov/sgx/obs/rtp/rtpmap.php?wfo=sgx. Website accessed in
September 2016.
San Diego Regional Water Quality Control Board (Regional Board). 2002. Resolution R9-2002-
0123. Total Maximum Daily Load for Diazinon in Chollas Creek Watershed, San Diego
County. August.
Regional Board. 2007. Resolution No. R9-2007-0043. A Resolution Adopting an Amendment to
the Water Quality Control Plan for the San Diego Basin (9) to Incorporate Total Maximum
Daily Loads for Dissolved Copper, Lead, and Zinc in Chollas Creek, Tributary to San Diego
Bay.
Regional Board. 2010. Resolution No. R9-2010-0001, A Resolution Amending the Water Quality
Control Plan for the San Diego Basin (9) to Incorporate Revised Total Maximum Daily
Loads for Indicator Bacteria Project I—Twenty Beaches and Creeks in the San Diego
Region (Including Tecolote Creek) (Bacteria TMDL) February 10.
Regional Board. 2011. Water Quality Control Plan for the San Diego Basin (9) (Basin Plan).
Regional Board. 2013. Resolution No. R9-2013-0001, National Pollutant Discharge Elimination
System (NPDES) Permit and Waste Discharge Requirements for Discharges from the
MS4s Draining the Watershed in the San Diego Region (MS4 Permit). May 14.
Chollas Creek Bacteria TMDL 2015–2016 Compliance Monitoring Report December 2016
7-2
San Diego Bay Municipal Agencies. 2016. Water Quality Improvement Plan: San Diego Bay
Watershed Management Area. Final. February.
United States Environmental Protection Agency (USEPA). 2012. 2012 Recreational Water Quality
Criteria. EPA 820-F-12-061. Washington, DC.
Western Regional Climate Center (WRCC). San Diego WSO Airport, California (047740). Period
of Record Monthly Climate Summary. Period of Record: January 1981 to December 2010.
http://www.wrcc.dri.edu/cgi-bin/cliMAIN.pl?ca7740. Website accessed in September
2016.