Embed Size (px)
Citation preview
Christian Kjølseth, University of Oslo, Norway ― NorFERM, Gol, Norway, 04 October 2008 1/36
UNIVERSITY OF OSLO
Grain boundary resistance in ionic conductors
Christian Kjølseth
Department of Chemistry, University of OsloCentre for Materials Science and Nanotechnology (SMN)Forskningsparken, Gaustadalléen 21, 0349 Oslo, Norway
Christian Kjølseth, University of Oslo, Norway ― NorFERM, Gol, Norway, 04 October 2008 2/36
UNIVERSITY OF OSLOIntroduction
Grain boundary core – space charge model
Brick layer model
Grain boundary resistance
Grain boundaries in ionic conductors
Experimental investigation
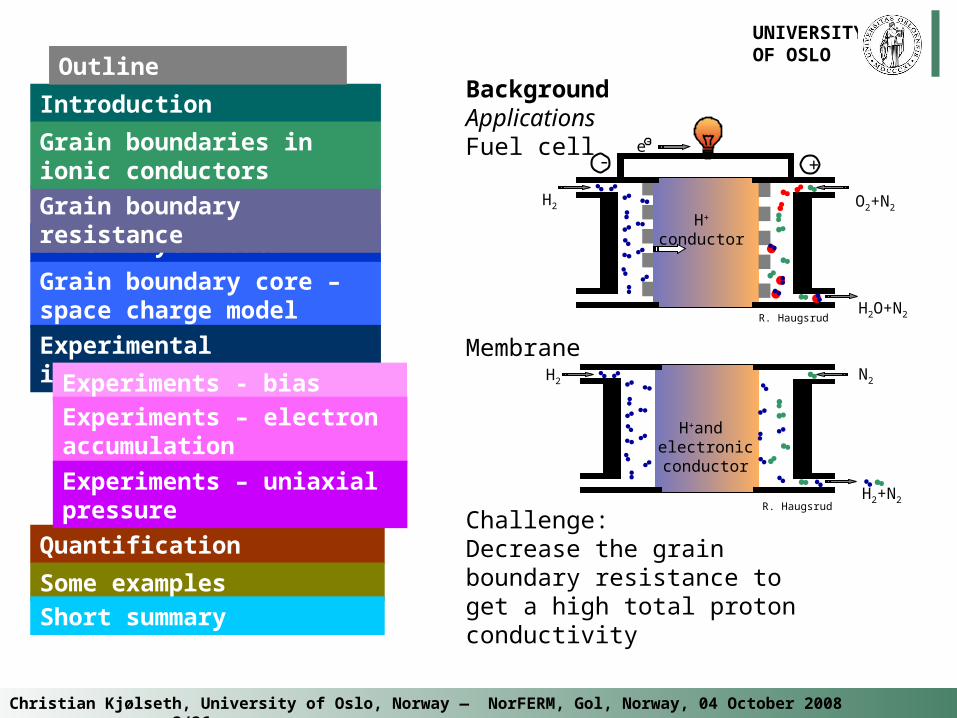
Background ApplicationsFuel cell
Membrane
Challenge: Decrease the grain boundary resistance to get a high total proton conductivity
+ --
H+
conductor
e
O2+N2
H2O+N2
H2
H2+N2
H2 N2
H+and electronicconductor
R. Haugsrud
R. Haugsrud
Outline
Experiments - bias
Experiments – electron accumulation
Quantification
Experiments – uniaxial pressure
Some examples
Short summary
Christian Kjølseth, University of Oslo, Norway ― NorFERM, Gol, Norway, 04 October 2008 3/36
UNIVERSITY OF OSLO
Introduction
What is a grain boundary?
• Structural definition:A narrow zone corresponding to one crystallographic
orientation to another, thus separating one grain from another. The atom in each grain are arranged in an orderly pattern, the irregular junction of the two adjacent grains is known as the grain boundary.
• Electrical definitionThe zone between two grains which have electrical
properties differing that of grain interior. The grain boundary properties is dependent on external conditions such as temperature and atmosphere.
Christian Kjølseth, University of Oslo, Norway ― NorFERM, Gol, Norway, 04 October 2008 4/36
UNIVERSITY OF OSLO
Grain boundaries in ionic conductors
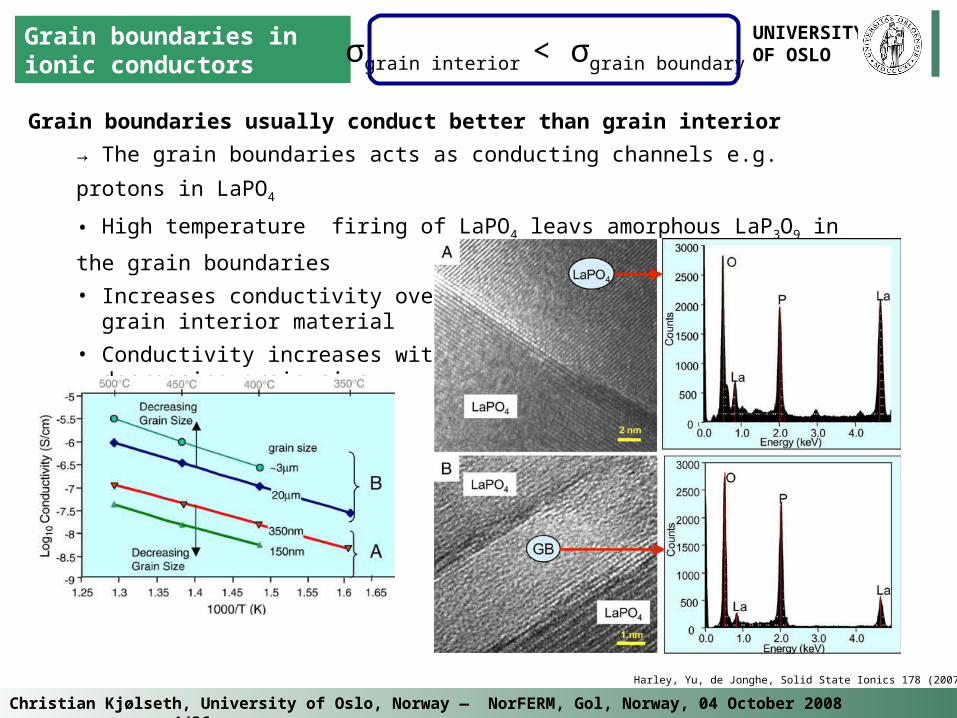
Grain boundaries usually conduct better than grain interior
→ The grain boundaries acts as conducting channels e.g. protons in LaPO4
• High temperature firing of LaPO4 leavs amorphous LaP3O9 in the grain boundaries
• Increases conductivity over grain interior material
• Conductivity increases with decreasing grain size
σgrain interior < σgrain boundary
Harley, Yu, de Jonghe, Solid State Ionics 178 (2007) 769
Christian Kjølseth, University of Oslo, Norway ― NorFERM, Gol, Norway, 04 October 2008 5/36
UNIVERSITY OF OSLO
0 1x10⁸ 2x10⁸ 3x10⁸ 4x10⁸ 5x10⁸
0
1x10⁸
2x10⁸
3x10⁸
4x10⁸
5x10⁸
BaZr0.9
Y0.1
O3- in wet O
2 at 225 °C
X /
Oh
m c
m
R / Ohm cm
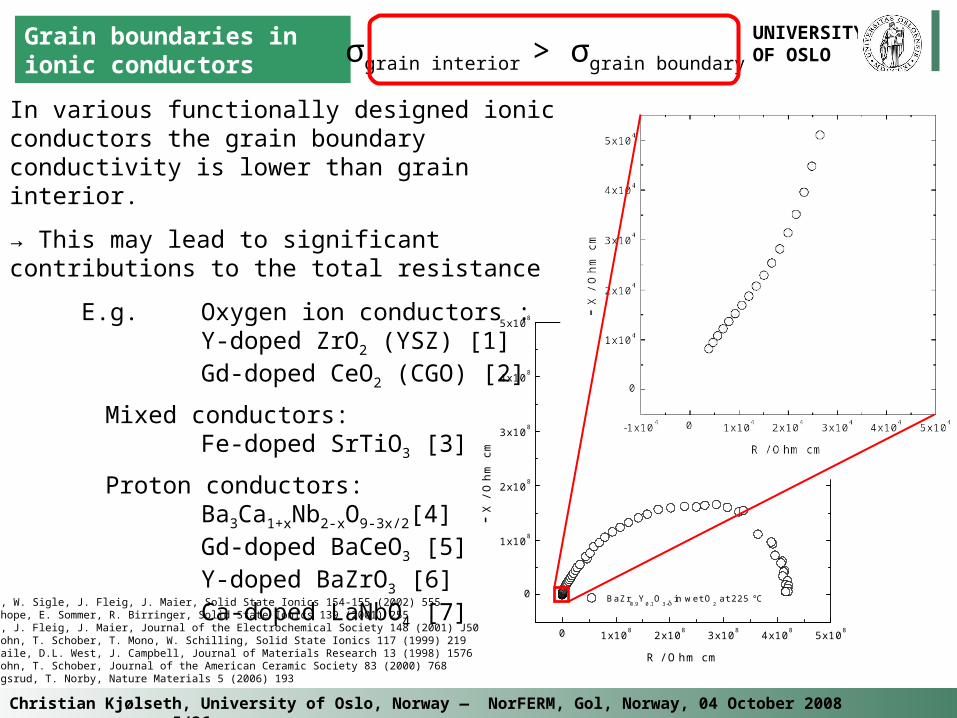
In various functionally designed ionic conductors the grain boundary conductivity is lower than grain interior.
→ This may lead to significant contributions to the total resistance
E.g. Oxygen ion conductors :Y-doped ZrO2 (YSZ) [1]Gd-doped CeO2 (CGO) [2]
Mixed conductors: Fe-doped SrTiO3 [3]
Proton conductors:Ba3Ca1+xNb2-xO9-3x/2[4] Gd-doped BaCeO3 [5]Y-doped BaZrO3 [6]Ca-doped LaNbO4 [7]
[1] X. Guo, W. Sigle, J. Fleig, J. Maier, Solid State Ionics 154-155 (2002) 555[2] A. Tschope, E. Sommer, R. Birringer, Solid State Ionics 139 (2001) 255 [3] X. Guo, J. Fleig, J. Maier, Journal of the Electrochemical Society 148 (2001) J50 [4] H.G. Bohn, T. Schober, T. Mono, W. Schilling, Solid State Ionics 117 (1999) 219 [5] S.M. Haile, D.L. West, J. Campbell, Journal of Materials Research 13 (1998) 1576[6] H.G. Bohn, T. Schober, Journal of the American Ceramic Society 83 (2000) 768 [7] R. Haugsrud, T. Norby, Nature Materials 5 (2006) 193
Grain boundaries in ionic conductors σgrain interior > σgrain boundary
Christian Kjølseth, University of Oslo, Norway ― NorFERM, Gol, Norway, 04 October 2008 6/36
UNIVERSITY OF OSLO
Grain boundary resistance
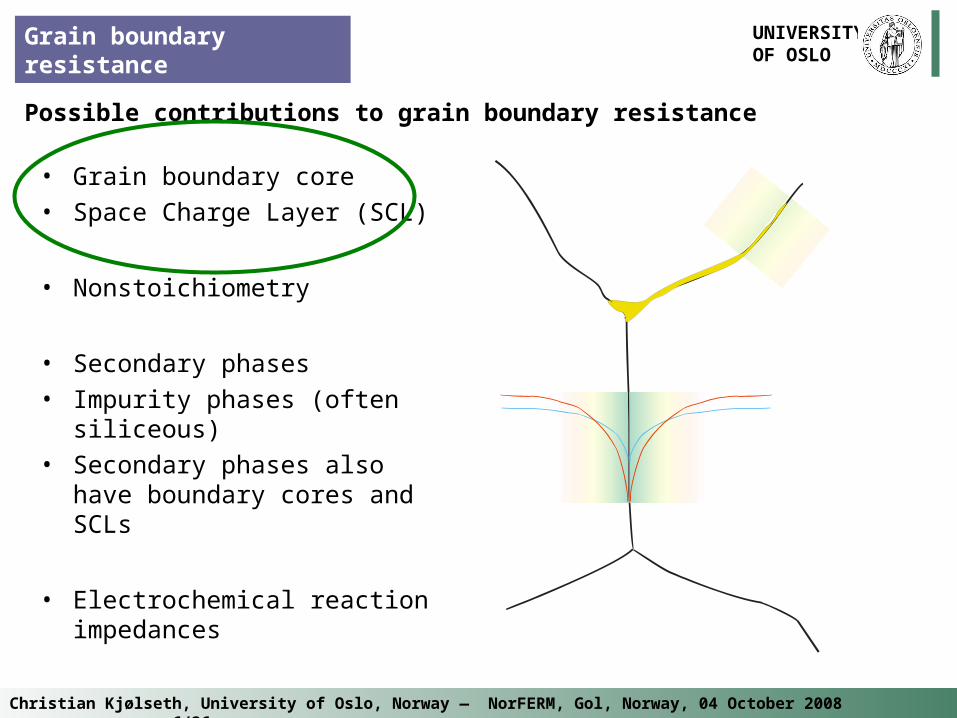
Possible contributions to grain boundary resistance
• Grain boundary core• Space Charge Layer (SCL)
• Nonstoichiometry
• Secondary phases• Impurity phases (often
siliceous)• Secondary phases also have
boundary cores and SCLs
• Electrochemical reaction impedances
Christian Kjølseth, University of Oslo, Norway ― NorFERM, Gol, Norway, 04 October 2008 7/36
UNIVERSITY OF OSLO
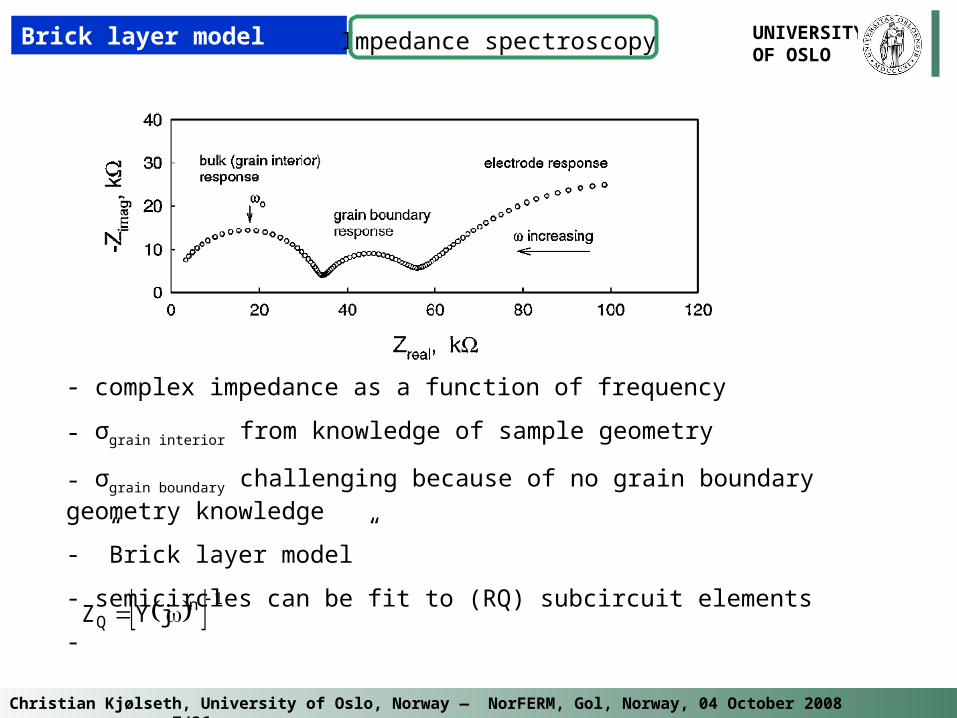
- complex impedance as a function of frequency
- σgrain interior from knowledge of sample geometry
- σgrain boundary challenging because of no grain boundary geometry knowledge
- ”Brick layer model”
- semicircles can be fit to (RQ) subcircuit elements
-
Brick layer model
1nQ jYZ
Impedance spectroscopy
Christian Kjølseth, University of Oslo, Norway ― NorFERM, Gol, Norway, 04 October 2008 8/36
UNIVERSITY OF OSLO
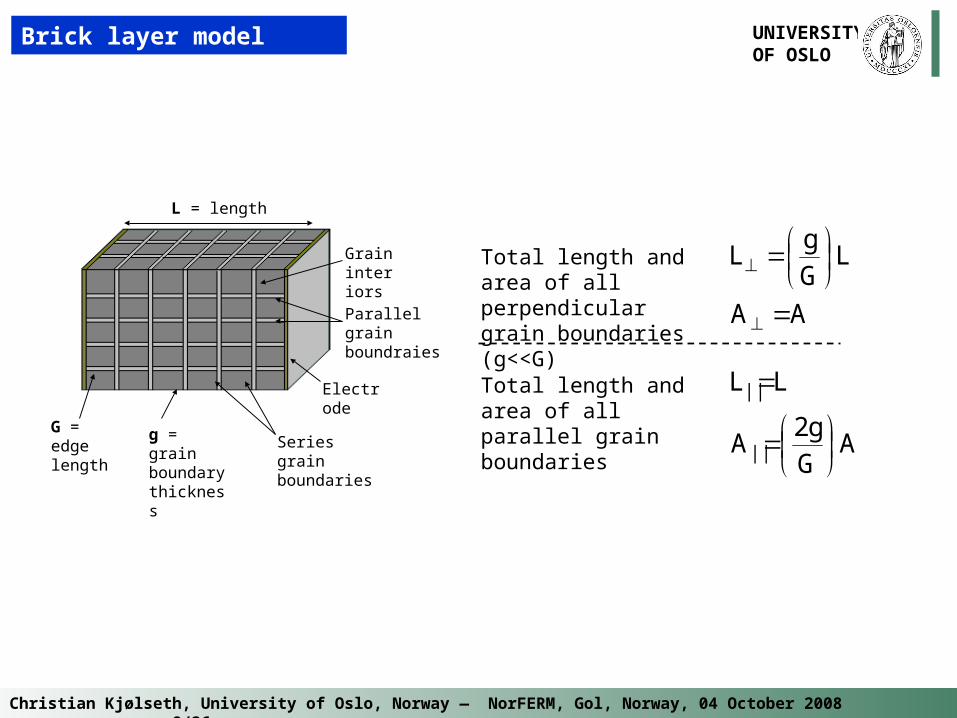
Brick layer model
G = edge length
g = grain boundary thickness
Grain interiors
Electrode
Series grain boundaries
Parallel grain boundraies
L = length
AA
LGg
L
Total length and area of all perpendicular grain boundaries (g<<G)
AGg2
A
LL
||
||Total length and area of all parallel grain boundaries
Christian Kjølseth, University of Oslo, Norway ― NorFERM, Gol, Norway, 04 October 2008 9/36
UNIVERSITY OF OSLO
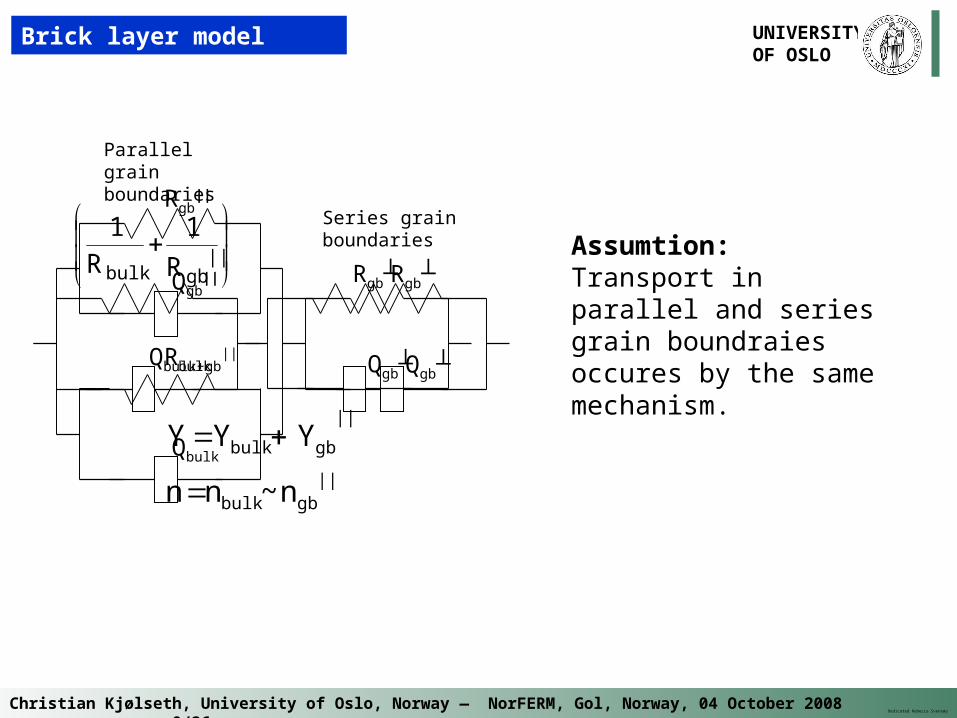
Rgb┴
Qgb┴
Qbulk
Rbulk
Rgb||
Qgb||
Parallel grain boundaries
Series grain boundaries
Rgb┴
Qgb┴Qbulk+gb||
||gbbulk R
1R
1
Dedicated Rebecca Svensøy
||gbbulk
||
gbbulk
n~nn
YYY
Assumtion: Transport in parallel and series grain boundraies occures by the same mechanism.
Brick layer model
Christian Kjølseth, University of Oslo, Norway ― NorFERM, Gol, Norway, 04 October 2008 10/36
UNIVERSITY OF OSLO
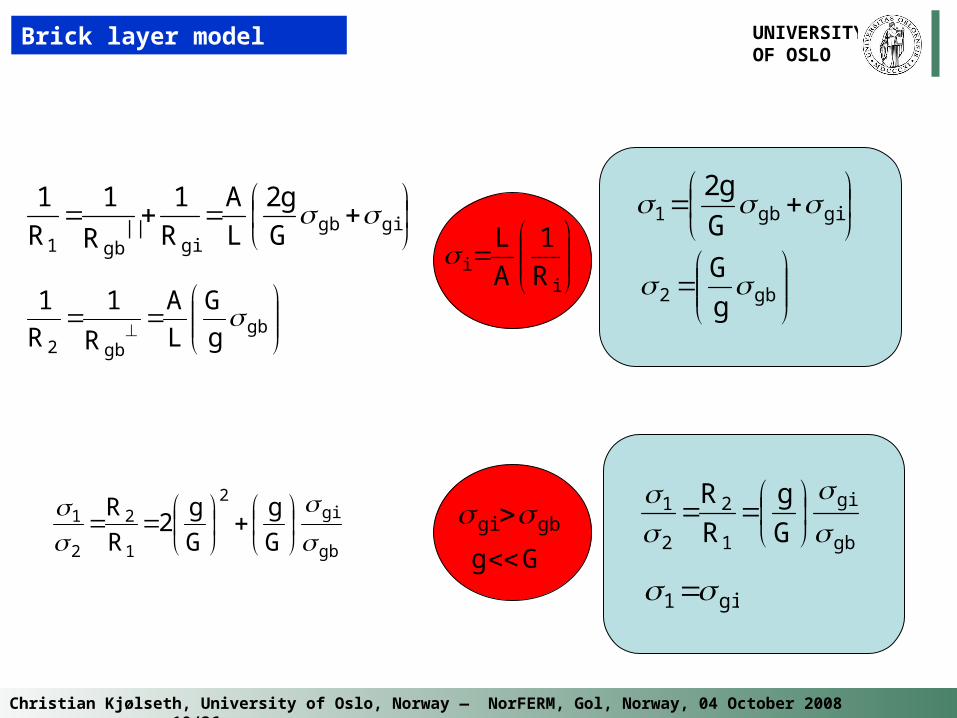
gigb
gigb1 G
g2
L
A
R
1
R
1
R
1 ||
gb
gb2 g
G
L
A
R
1
R
1
gigb1 G
g2
gb2 g
G
ii R
1
A
L
gb
gi2
1
2
2
1
G
g
G
g2
R
R
gb
gi
1
2
2
1
G
g
R
R
gi1
gbgi
Brick layer model
Gg
Christian Kjølseth, University of Oslo, Norway ― NorFERM, Gol, Norway, 04 October 2008 11/36
UNIVERSITY OF OSLO
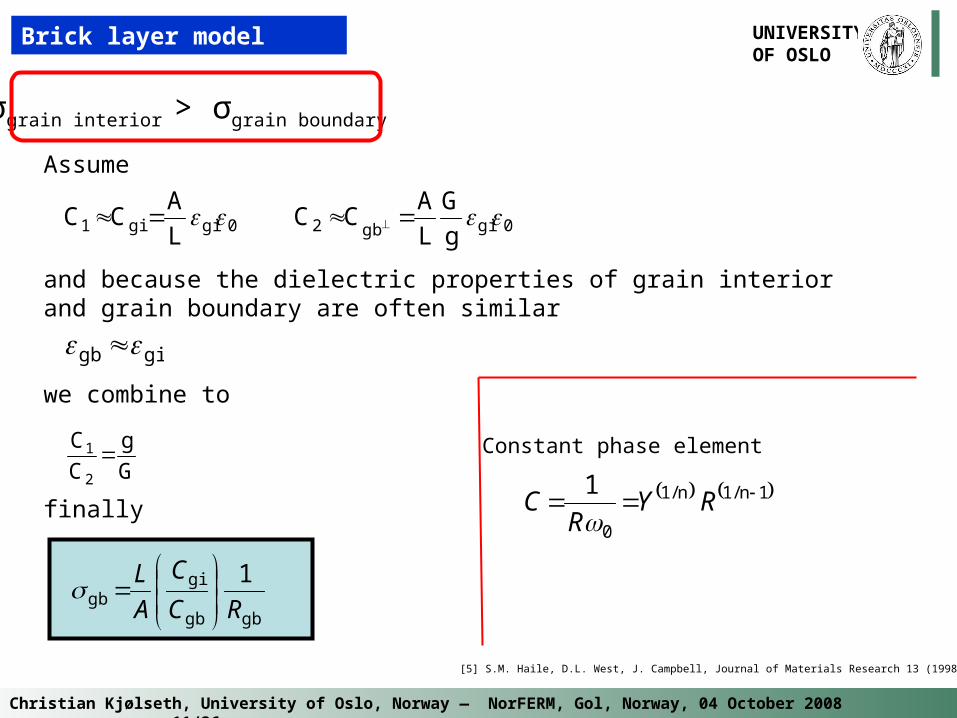
Assume
and because the dielectric properties of grain interior and grain boundary are often similar
we combine to
finally
Brick layer model
0gigb20gigi1 g
G
L
ACC
L
ACC
G
g
C
C
2
1
gigb
gbgb
gigb
1
RC
C
A
L
σgrain interior > σgrain boundary
Constant phase element
1n1n1
0
1 // RYR
C
[5] S.M. Haile, D.L. West, J. Campbell, Journal of Materials Research 13 (1998) 1576
Christian Kjølseth, University of Oslo, Norway ― NorFERM, Gol, Norway, 04 October 2008 12/36
UNIVERSITY OF OSLO
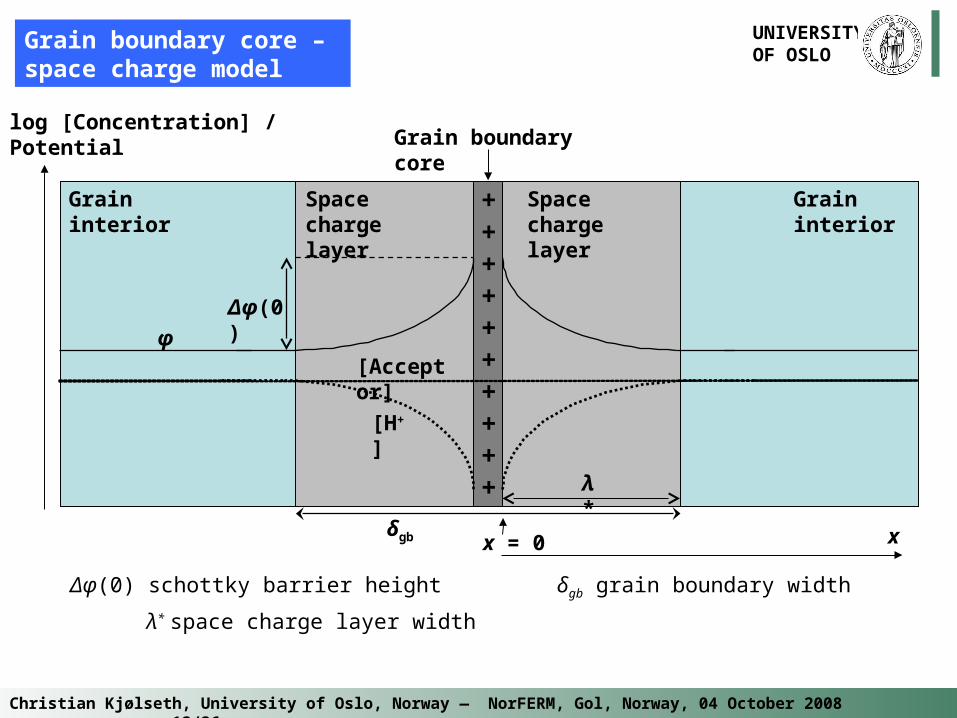
Grain boundary core – space charge model
Grain boundary core
x = 0
λ*
x δgb
log [Concentration] /Potential
++++++++++
φ
Δφ(0)
Grain interior Grain interior
Space charge layer
Space charge layer
Δφ(0) schottky barrier height δgb grain boundary width λ* space charge layer width
[H+]
[Acceptor]
Christian Kjølseth, University of Oslo, Norway ― NorFERM, Gol, Norway, 04 October 2008 13/36
UNIVERSITY OF OSLO
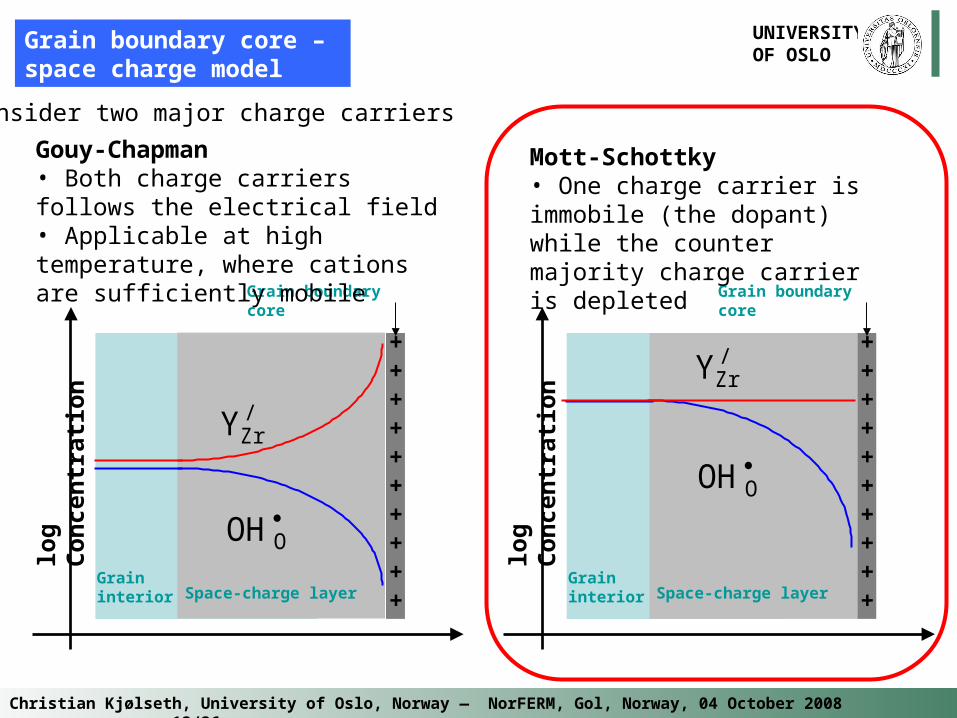
Grain boundary core – space charge model
log
Co
nce
ntr
atio
n
++++++++++
Grain interior Space-charge layer
OOH
Grain boundary core
/ZrY
log
Co
nce
ntr
atio
n
++++++++++
Grain interior Space-charge layer
OOH
Grain boundary core
/ZrY
Gouy-Chapman• Both charge carriers follows the electrical field • Applicable at high temperature, where cations are sufficiently mobile
Mott-Schottky • One charge carrier is immobile (the dopant) while the counter majority charge carrier is depleted
Consider two major charge carriers
Christian Kjølseth, University of Oslo, Norway ― NorFERM, Gol, Norway, 04 October 2008 14/36
UNIVERSITY OF OSLO
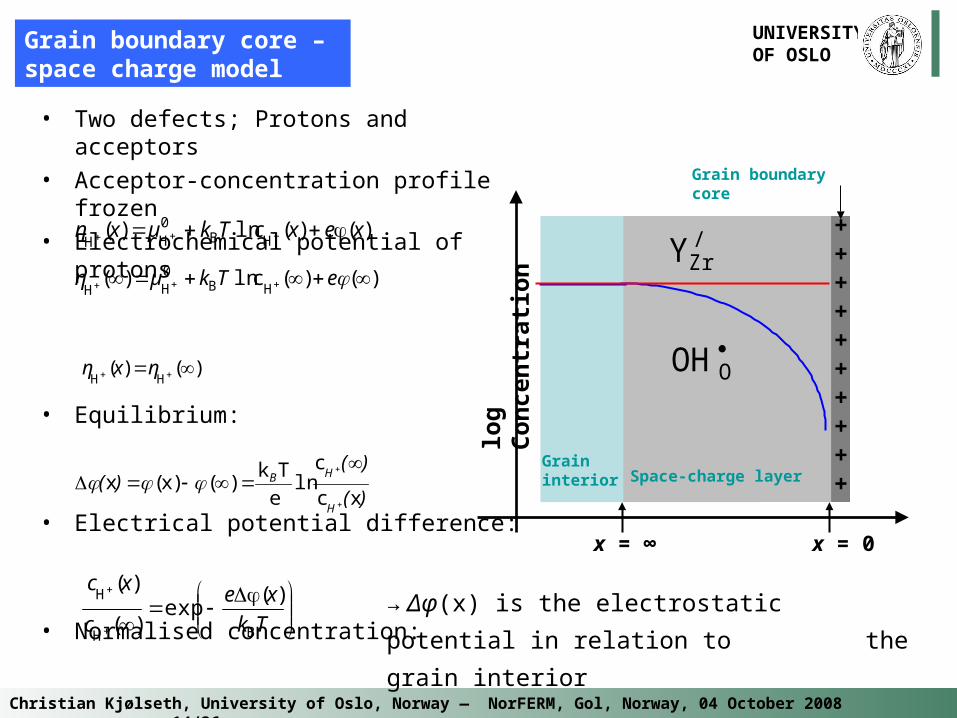
• Two defects; Protons and acceptors
• Acceptor-concentration profile frozen
• Electrochemical potential of protons
• Equilibrium:
• Electrical potential difference:
• Normalised concentration:
)()()(HB
0HH
xexcTkµxη ln
)()(c)(HB
0HH
eTkµη ln
)()(HH
ηxη
)(
)()(
H
HB
xc
cln
e
Tk)()x(x
Tk
xe
c
xc
BH
H )()(
)(exp
Grain boundary core – space charge model
log
Co
nce
ntr
atio
n
++++++++++
Grain interior Space-charge layer
OOH
Grain boundary core
/ZrY
→ Δφ(x) is the electrostatic potential in relation to
the grain interior
x = 0x = ∞
Christian Kjølseth, University of Oslo, Norway ― NorFERM, Gol, Norway, 04 October 2008 15/36
UNIVERSITY OF OSLO
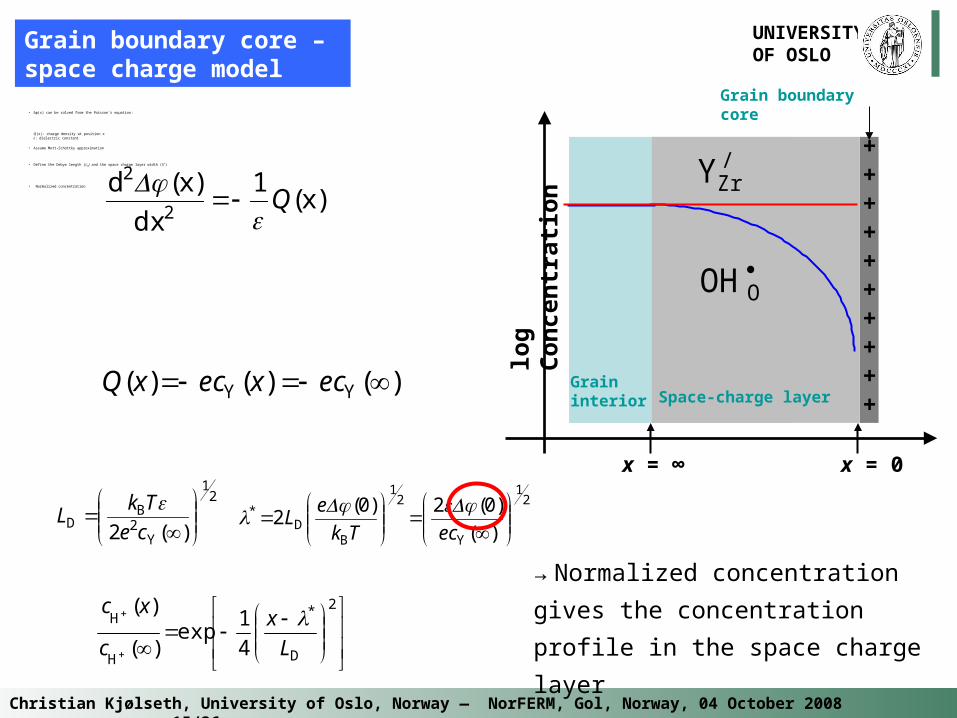
Grain boundary core – space charge model
• Δφ(x) can be solved from the Poisson’s equation:
Q(x): charge density at position xε: dielectric constant
• Assume Mott-Schottky approximation
• Define the Debye length (LD) and the space charge layer width (λ*)
• Normalized concentration
)()(
x1
dx
xd2
2
Q
→ Normalized concentration gives
the concentration profile in the space
charge layer
log
Co
nce
ntr
atio
n
++++++++++
Grain interior Space-charge layer
OOH
Grain boundary core
/ZrY
x = 0x = ∞
)()()( YY ecxecxQ
21
Y2B
D2
)(ce
TkL
21
Y
21
BD
0202
)(
)()(*
ecTk
eL
2
DH
H
41
L
x
c
xc *
exp)(
)(
Christian Kjølseth, University of Oslo, Norway ― NorFERM, Gol, Norway, 04 October 2008 16/36
UNIVERSITY OF OSLO
Grain boundary core – space charge model
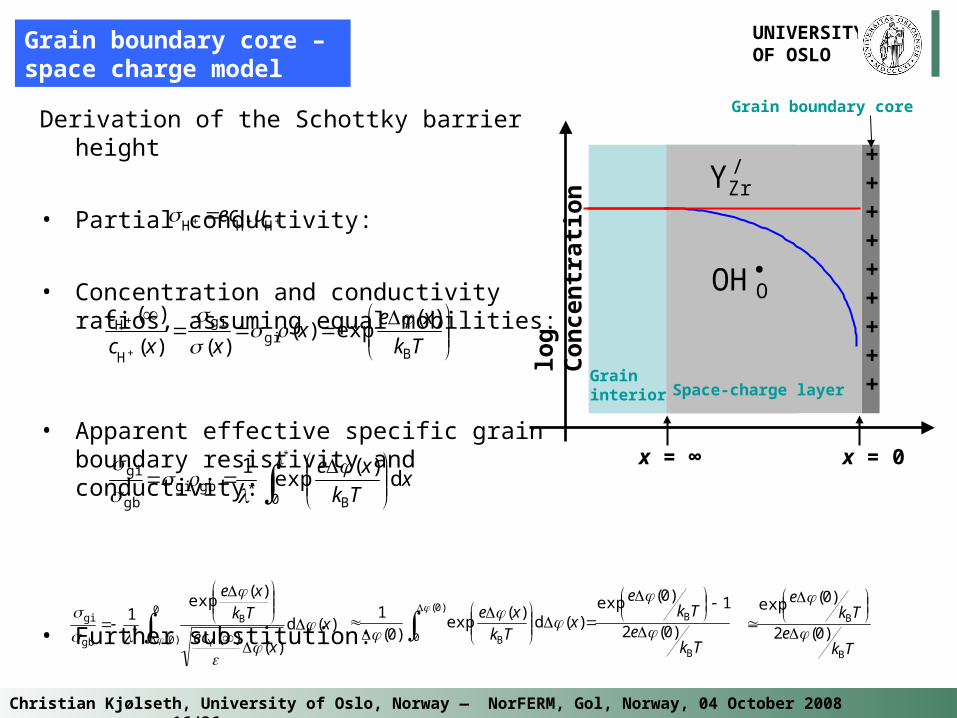
Derivation of the Schottky barrier height
• Partial conductivity:
• Concentration and conductivity ratios, assuming equal mobilities:
• Apparent effective specific grain boundary resistivity and conductivity:
• Further substitution:
HHH
uec
Tk
xex
xxc
c
Bgi
gi
H
H )(exp)(
)()(
)(
xTk
xed
1
B0gbgi
gb
gi
)(exp
*
*
0
0 Y
B
gb
gi d1
)(* )(
)()(
)(exp
x
xec
Tk
xe
)(
)(
)(exp)(
)(exp
)(
0
0
B
B
B02
10
d0
1
Tke
Tke
xTk
xe
Tke
Tke
B
B
02
0
)(
)(exp
log
Co
nce
ntr
atio
n
+++++++++Grain
interior Space-charge layer
OOH
Grain boundary core
/ZrY
x = 0x = ∞
Christian Kjølseth, University of Oslo, Norway ― NorFERM, Gol, Norway, 04 October 2008 17/36
UNIVERSITY OF OSLO
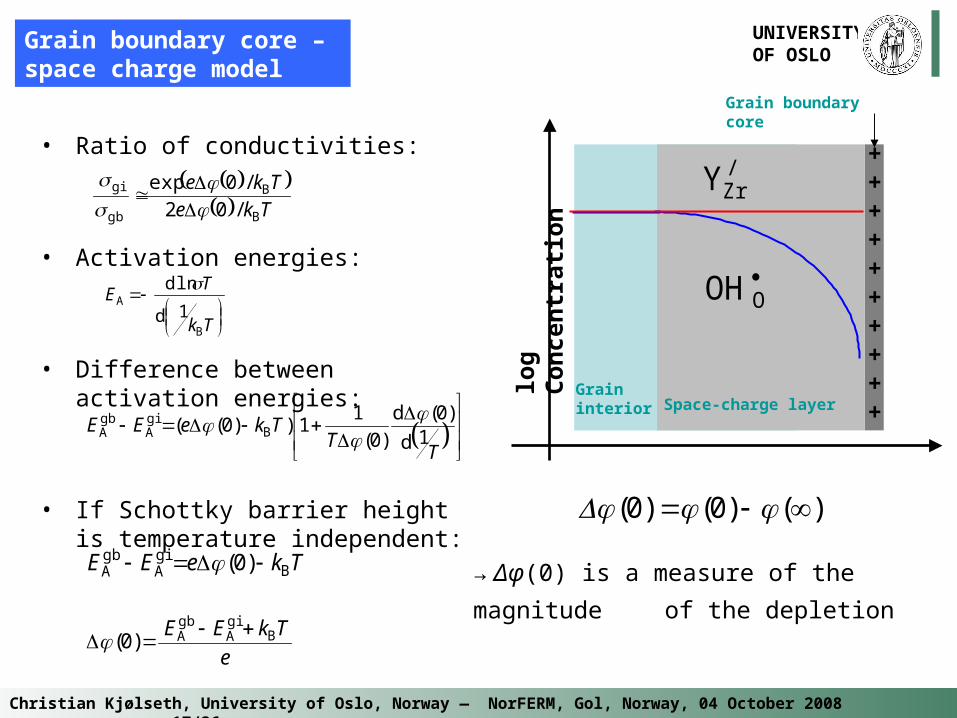
Grain boundary core – space charge model
• Ratio of conductivities:
• Activation energies:
• Difference between activation energies:
• If Schottky barrier height is temperature independent:
Tke
Tke
B
B
gb
gi
020/
/exp
Tk
TE
B
A1d
d ln
T
TTkeEE
1d
0d0
110 B
giA
gbA
)(
)())((
TkeEE BgiA
gbA 0 )(
e
TkEE BgiA
gbA0
)(
log
Co
nce
ntr
atio
n
++++++++++
Grain interior Space-charge layer
OOH
Grain boundary core
/ZrY
)()()( 00
→ Δφ(0) is a measure of the magnitude
of the depletion
Christian Kjølseth, University of Oslo, Norway ― NorFERM, Gol, Norway, 04 October 2008 18/36
UNIVERSITY OF OSLO
Grain boundary core – space charge model
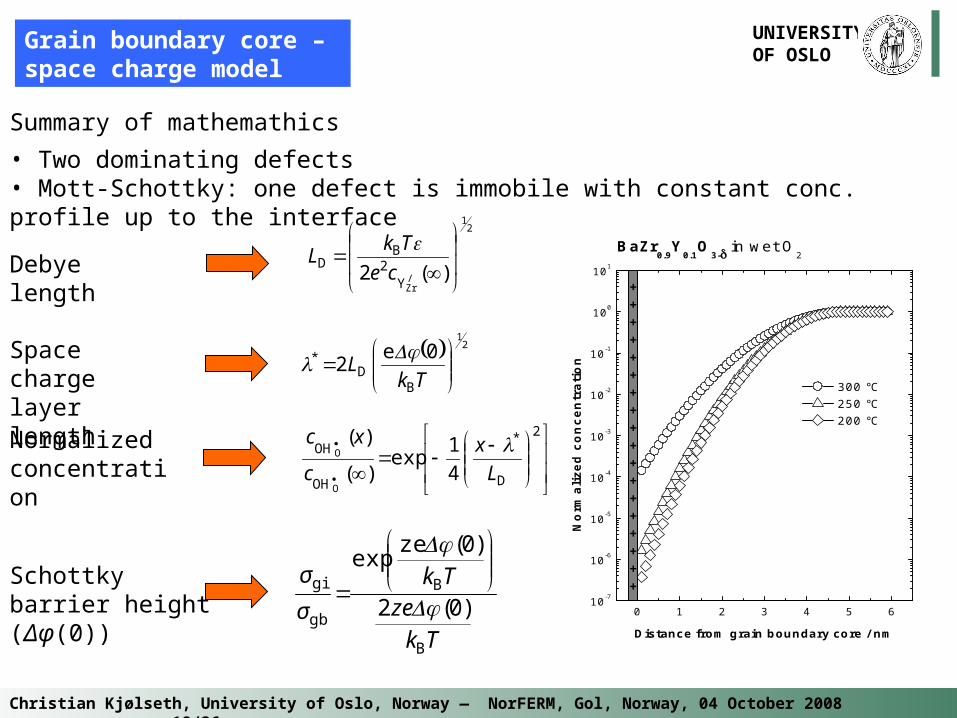
Summary of mathemathics
• Two dominating defects• Mott-Schottky: one defect is immobile with constant conc. profile up to the interface
21
BD
0e2
TkL
*Space charge layer length
Tk
zeTk
σ
σ
B
B
gb
gi
02
0ze
)(
)(exp
Schottky barrier height (Δφ(0))
21
ZrY2
BD
2
)(/ce
TkL
Debye length
2
DOH
OH
4
1
O
O
L
x
c
xc *
exp)(
)( Normalized concentration
0 1 2 3 4 5 610-7
10-6
10-5
10-4
10-3
10-2
10-1
100
101
BaZr0.9
Y0.1
O3- in wet O
2
No
rma
lize
d c
on
ce
ntr
ati
on
Distance from grain boundary core / nm
300 °C 250 °C 200 °C
++++++++++++++++++
Christian Kjølseth, University of Oslo, Norway ― NorFERM, Gol, Norway, 04 October 2008 19/36
UNIVERSITY OF OSLO
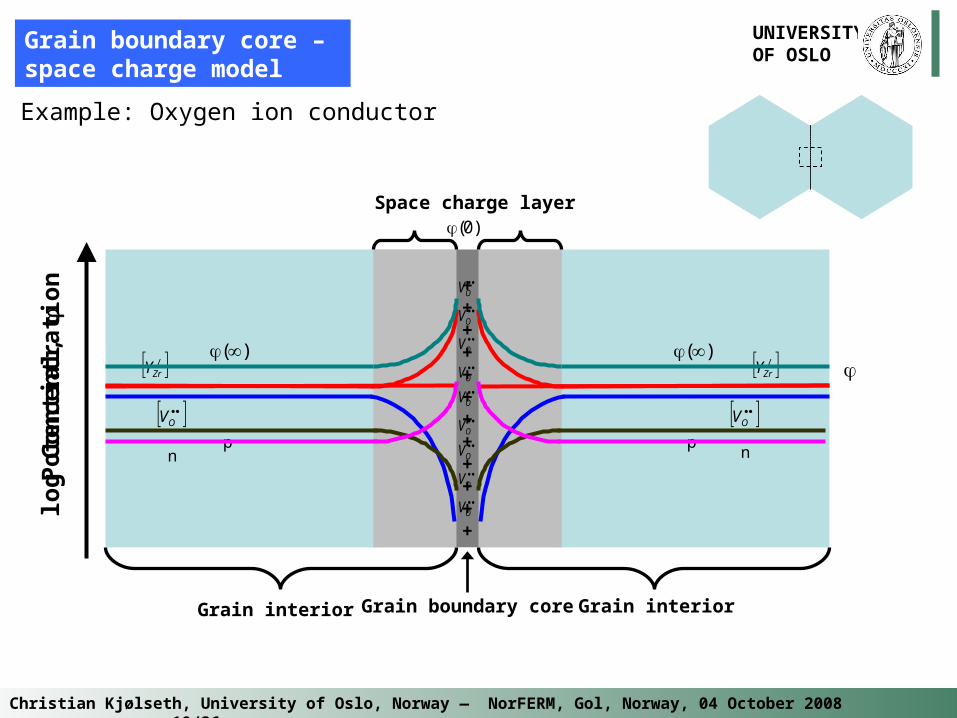
Example: Oxygen ion conductor
Grain interior Grain interiorGrain boundary core
++++++++++++
OV
OV
OV
OV
OV
OV
OV
OV
OV
)(
)(0
)(
Po
ten
tial
,
log
Co
nce
ntr
atio
n
/ZrY /
ZrY
OV
OV
Space charge layer
Grain boundary core – space charge model
p pnn
Christian Kjølseth, University of Oslo, Norway ― NorFERM, Gol, Norway, 04 October 2008 20/36
UNIVERSITY OF OSLO
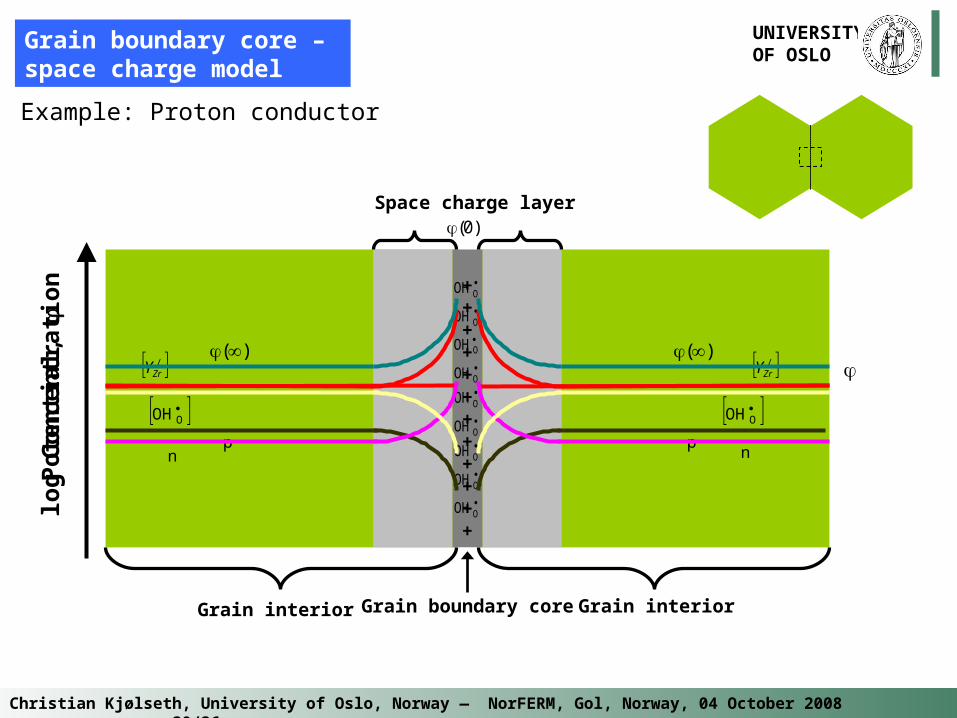
Example: Proton conductor
Grain interior Grain interiorGrain boundary core
++++++++++++
OOH
OOHOOH
OOH
OOH
OOH
OOH
OOH
OOH
)(
)(0
)(
Po
ten
tial
,
log
Co
nce
ntr
atio
n
/ZrY /
ZrY
OOH
OOH
Space charge layer
Grain boundary core – space charge model
p pnn
Christian Kjølseth, University of Oslo, Norway ― NorFERM, Gol, Norway, 04 October 2008 21/36
UNIVERSITY OF OSLO
Experimental investigation
Experiments - bias
Experiments – electron accumulation
Experiments – uniaxial pressure
Quantification
Christian Kjølseth, University of Oslo, Norway ― NorFERM, Gol, Norway, 04 October 2008 22/36
UNIVERSITY OF OSLO
+ Bias -
log
Co
nce
ntr
atio
n
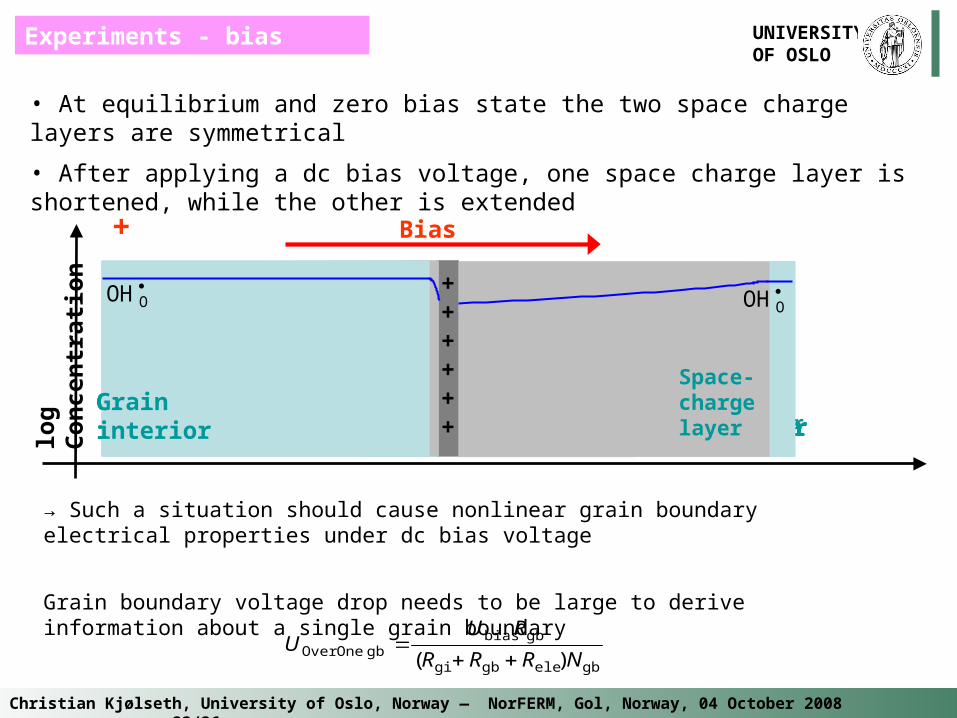
• At equilibrium and zero bias state the two space charge layers are symmetrical
• After applying a dc bias voltage, one space charge layer is shortened, while the other is extended
++++++
Grain interior
Space-charge layer
OOH
OOH
Space-charge layer
Grain interior
OOH
++++++
Grain interior
Space-charge layer
OOH
OOH
Space-charge layer
Grain interior
OOH
++++++
Grain interior
Space-charge layer
OOH
OOH
Space-charge layer
Grain interior
OOH
++++++
Grain interior
Space-charge layer
OOH
OOH
Space-charge layer
Grain interior
OOH
++++++
Grain interior
OOH
OOH
Space-charge layer
OOH
++++++
Grain interior
OOH
OOH
Space-charge layer
OOH
→ Such a situation should cause nonlinear grain boundary electrical properties under dc bias voltage
Grain boundary voltage drop needs to be large to derive information about a single grain boundary
gbelegbgi
gbbiasgbOneOver NRRR
RUU
)(
Experiments - bias
Christian Kjølseth, University of Oslo, Norway ― NorFERM, Gol, Norway, 04 October 2008 23/36
UNIVERSITY OF OSLO
0.0 2.0x10⁷ 4.0x10⁷ 6.0x10⁷-4.0x10⁷
-2.0x10⁷
0.0
2.0x10⁷
4.0x10⁷
R / Ohm cm
-X /
Oh
m c
m
BaZr0.9
Y0.1
O3- in wet O
2 @ 225oC
0 V 3 V 9 V 15 V
0 1 2 3 4 5
0.0
1.0x10⁻⁴
2.0x10⁻⁴
3.0x10⁻⁴
4.0x10⁻⁴
5.0x10⁻⁴
6.0x10⁻⁴
7.0x10⁻⁴
Cur
rent
/ m
A
Voltage over an average grain boundary, Uaverage gb
/ mV
OV
OOH
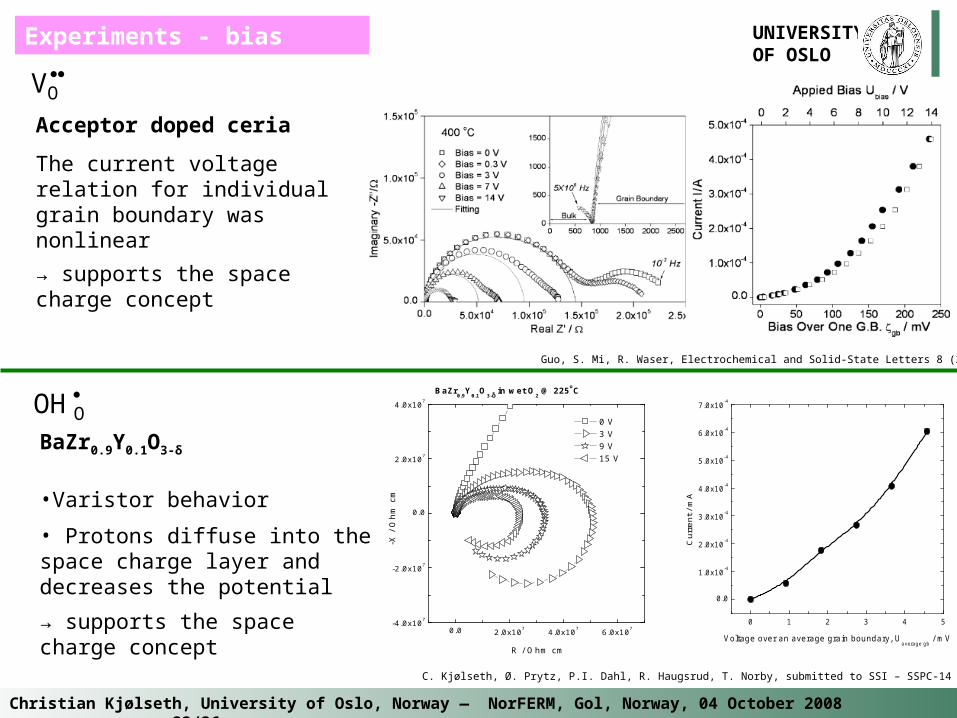
Acceptor doped ceria
The current voltage relation for individual grain boundary was nonlinear
→ supports the space charge concept
Guo, S. Mi, R. Waser, Electrochemical and Solid-State Letters 8 (2005) J1
BaZr0.9Y0.1O3-δ
•Varistor behavior
• Protons diffuse into the space charge layer and decreases the potential
→ supports the space charge concept
C. Kjølseth, Ø. Prytz, P.I. Dahl, R. Haugsrud, T. Norby, submitted to SSI – SSPC-14 Kyoto 2008
Experiments - bias
Christian Kjølseth, University of Oslo, Norway ― NorFERM, Gol, Norway, 04 October 2008 24/36
UNIVERSITY OF OSLO
log
Co
nce
ntr
atio
n +++++++++
Grain interior Space-charge layer
OOH
Grain boundary core
/ZrY
n
10-48 10-38 10-28 10-18 10-810-9
10-8
10-7
10-6
10-5
10-4
/
S c
m-1
pO2 / atm
Grain interior Grain boundary
BaZr0.9
Y0.1
O3- at 250C
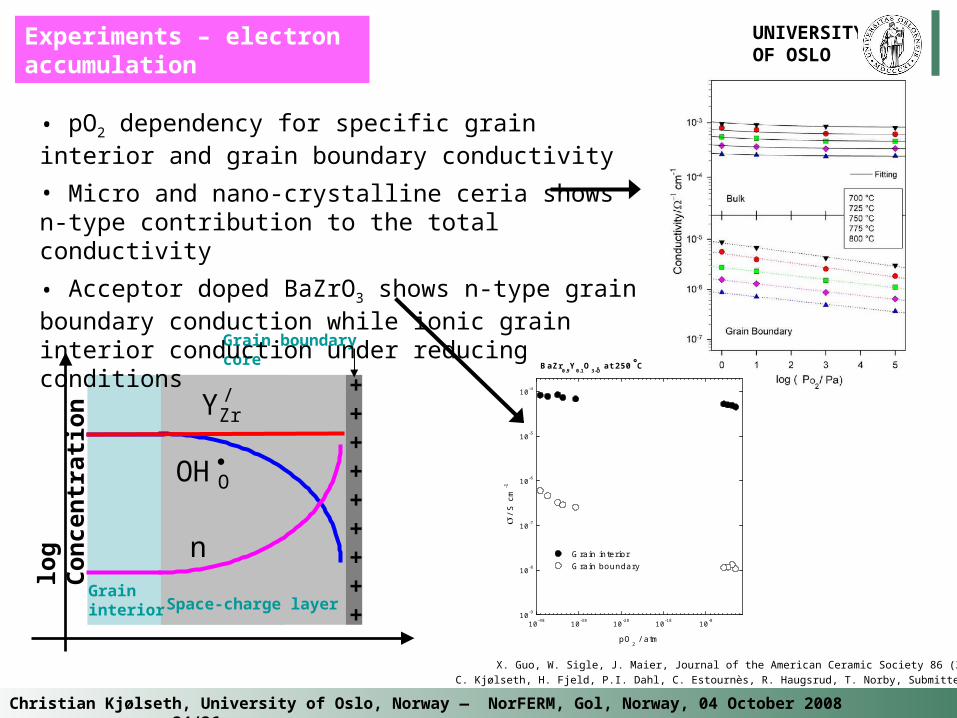
• pO2 dependency for specific grain interior and grain boundary conductivity
• Micro and nano-crystalline ceria shows n-type contribution to the total conductivity
• Acceptor doped BaZrO3 shows n-type grain boundary conduction while ionic grain interior conduction under reducing conditions
X. Guo, W. Sigle, J. Maier, Journal of the American Ceramic Society 86 (2003) 77
C. Kjølseth, H. Fjeld, P.I. Dahl, C. Estournès, R. Haugsrud, T. Norby, Submitted (2008)
Experiments – electron accumulation
Christian Kjølseth, University of Oslo, Norway ― NorFERM, Gol, Norway, 04 October 2008 25/36
UNIVERSITY OF OSLO
Space-charge layer
Grain interior
TiO2
TiO2
TiO2
TiO2
Grain interiorSpace-charge layer
–
–
–
Ti2O3
Ti2O3
Ti2O3
+
+
+
+++++
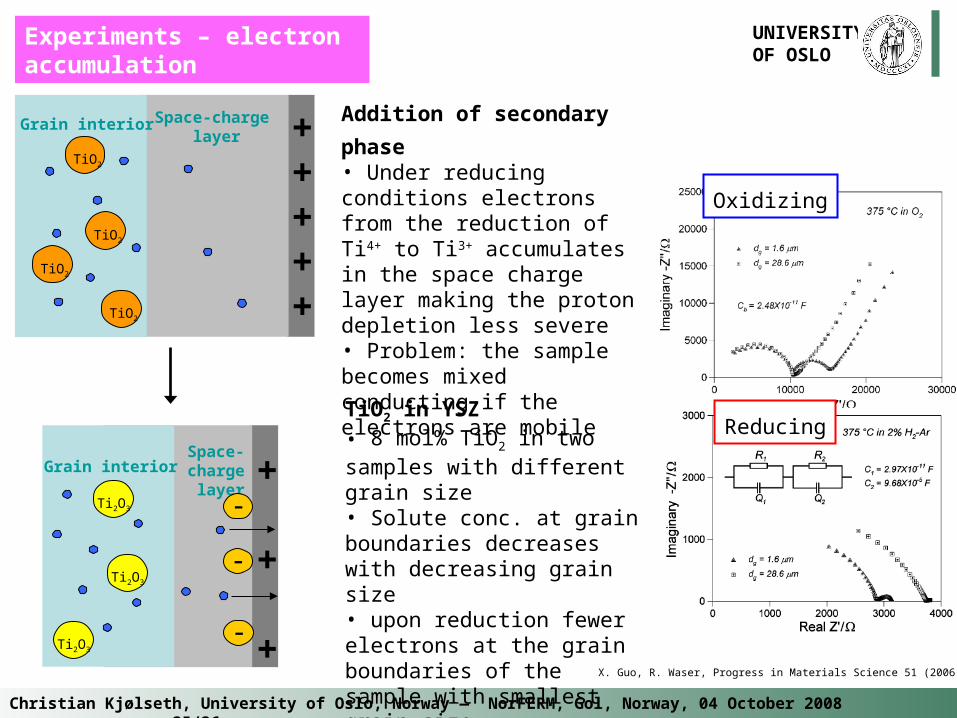
Addition of secondary phase• Under reducing conditions electrons from the reduction of Ti4+ to Ti3+ accumulates in the space charge layer making the proton depletion less severe• Problem: the sample becomes mixed conducting if the electrons are mobile
TiO2 in YSZ• 8 mol% TiO2 in two samples with different grain size• Solute conc. at grain boundaries decreases with decreasing grain size• upon reduction fewer electrons at the grain boundaries of the sample with smallest grain size
Oxidizing
Reducing
X. Guo, R. Waser, Progress in Materials Science 51 (2006) 151
Experiments – electron accumulation
Christian Kjølseth, University of Oslo, Norway ― NorFERM, Gol, Norway, 04 October 2008 26/36
UNIVERSITY OF OSLO
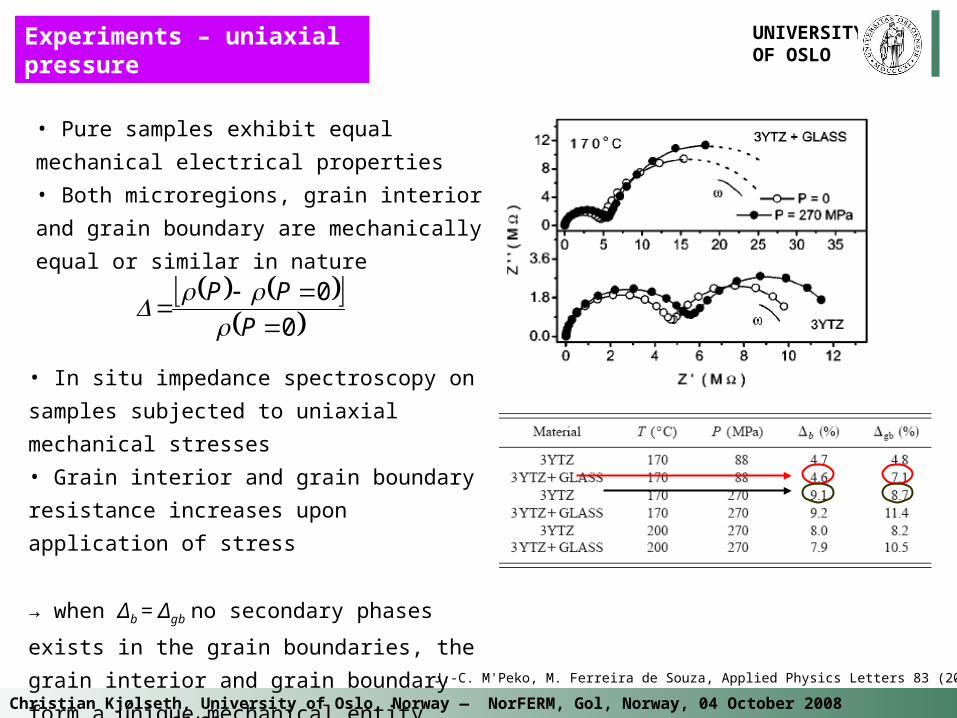
Experiments – uniaxial pressure
• Pure samples exhibit equal mechanical
electrical properties
• Both microregions, grain interior and grain
boundary are mechanically equal or similar in
nature
0
0
P
PP
• In situ impedance spectroscopy on samples
subjected to uniaxial mechanical stresses
• Grain interior and grain boundary resistance
increases upon application of stress
→ when Δb = Δgb no secondary phases exists in
the grain boundaries, the grain interior and grain
boundary form a unique mechanical entity
→ supports space charge theory J.-C. M'Peko, M. Ferreira de Souza, Applied Physics Letters 83 (2003) 737.
Christian Kjølseth, University of Oslo, Norway ― NorFERM, Gol, Norway, 04 October 2008 27/36
UNIVERSITY OF OSLO
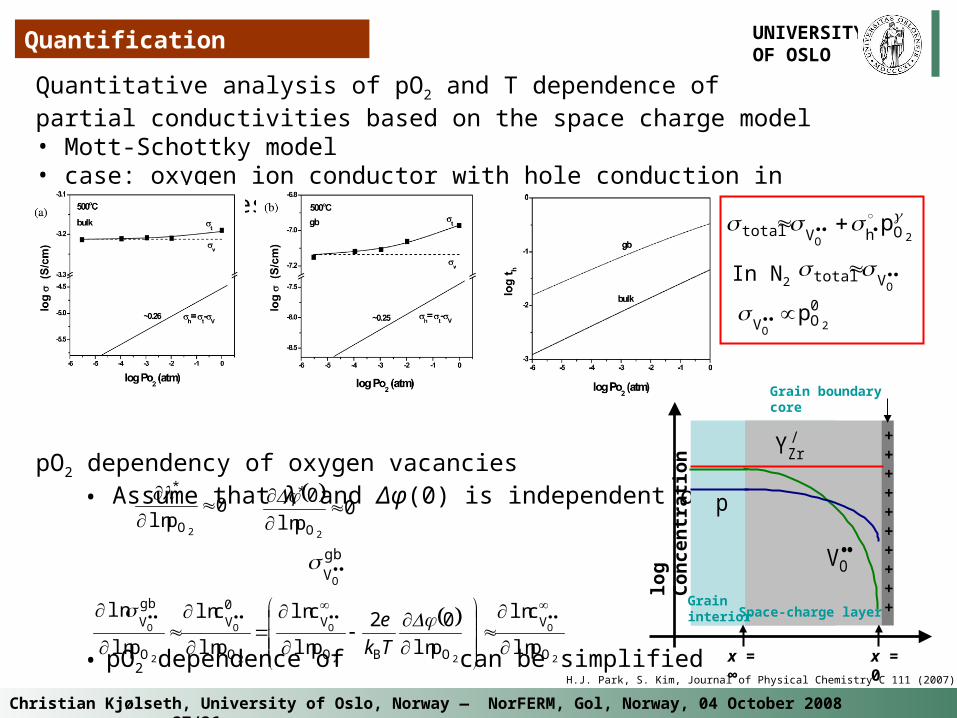
Quantitative analysis of pO2 and T dependence of partial conductivities based on the space charge model• Mott-Schottky model• case: oxygen ion conductor with hole conduction in grain boundaries
pO2 dependency of oxygen vacancies• Assume that λ* and Δφ(0) is independent of pO2
• pO2 dependence of can be simplified
Quantification
0p
2O
ln
* 0
p
0
2O
ln
gb
VO
2
O
22
O
2
O
2
O
O
V
OBO
V
O
0V
O
gb
V
p
c
p
02
p
c
p
c
p ln
ln
lnln
ln
ln
ln
ln
ln
Tk
e
log
Co
nce
ntr
atio
n ++++++++++Grain
interior Space-charge layer
OV
Grain boundary core
/ZrY
x = 0x = ∞
p
2O
OhVtotal p
OVtotal In N2
0OV 2O
p
H.J. Park, S. Kim, Journal of Physical Chemistry C 111 (2007) 14903
Christian Kjølseth, University of Oslo, Norway ― NorFERM, Gol, Norway, 04 October 2008 28/36
UNIVERSITY OF OSLO
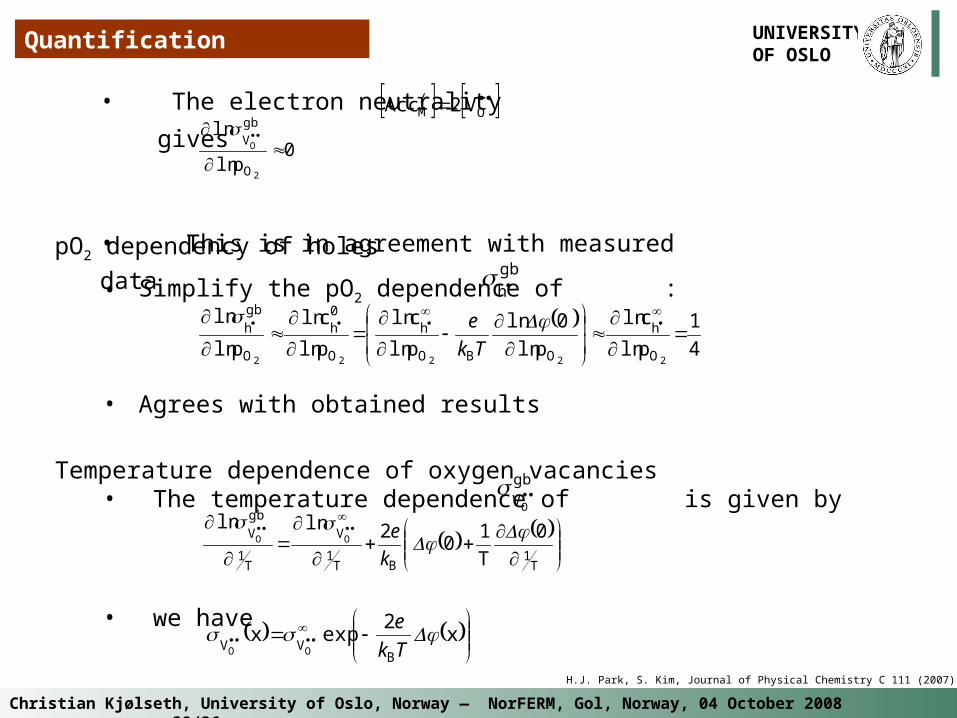
Quantification
pO2 dependency of holes
• Simplify the pO2 dependence of :
• Agrees with obtained results
Temperature dependence of oxygen vacancies• The temperature dependence of is given by
• we have
gb
VO
T1
BT1
V
T1
gb
V 0
T
10
2OO
k
elnln
x2
xB
VV OO
Tk
eexp
• The electron neutrality gives
• This is in agreement with measured data
OM V2Acc /
0p
2
O
O
gb
V
ln
ln
4
1
p
c
p
0
p
c
p
c
p22222 O
h
OBO
h
O
0h
O
gbh
ln
ln
ln
ln
ln
ln
ln
ln
ln
ln Tk
e
gbh
H.J. Park, S. Kim, Journal of Physical Chemistry C 111 (2007) 14903
Christian Kjølseth, University of Oslo, Norway ― NorFERM, Gol, Norway, 04 October 2008 29/36
UNIVERSITY OF OSLO
Quantification
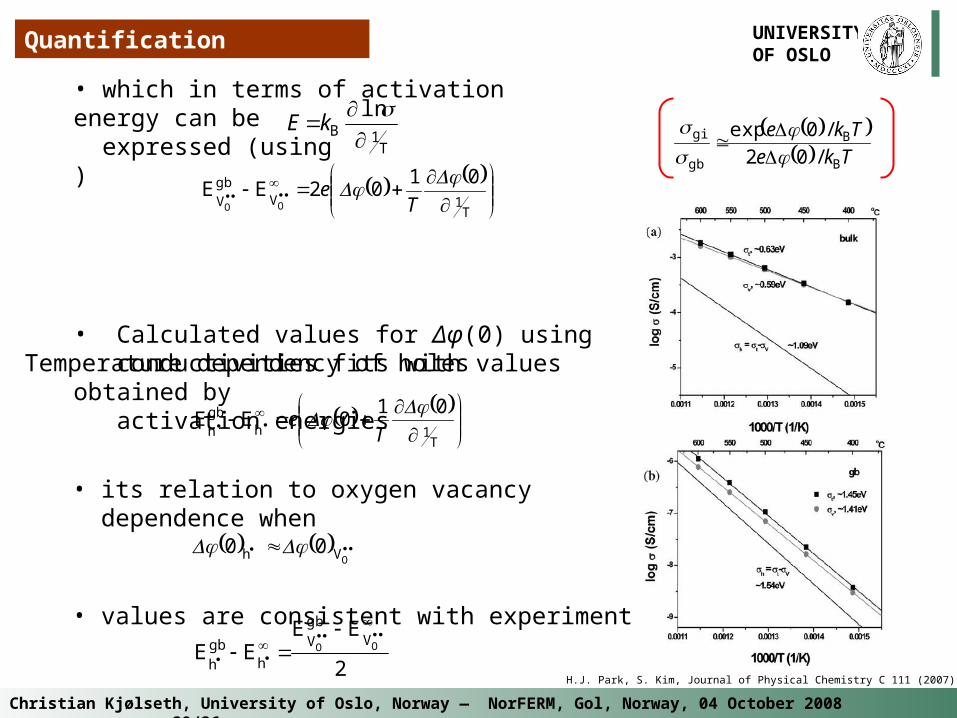
Temperature dependency of holes
• its relation to oxygen vacancy dependence when
• values are consistent with experimental data
T1h
gb
h
010EE
T
e
2
EEEE OO
Vgb
V
hgbh
OVh 00
• which in terms of activation energy can be expressed (using )
• Calculated values for Δφ(0) using conductivities fits with values obtained by activation energies
T1B
lnkE
T1V
gb
V
0102EE
OO
T
e
Tke
Tke
B
B
gb
gi
020/
/exp
H.J. Park, S. Kim, Journal of Physical Chemistry C 111 (2007) 14903
Christian Kjølseth, University of Oslo, Norway ― NorFERM, Gol, Norway, 04 October 2008 30/36
UNIVERSITY OF OSLO
Quantification
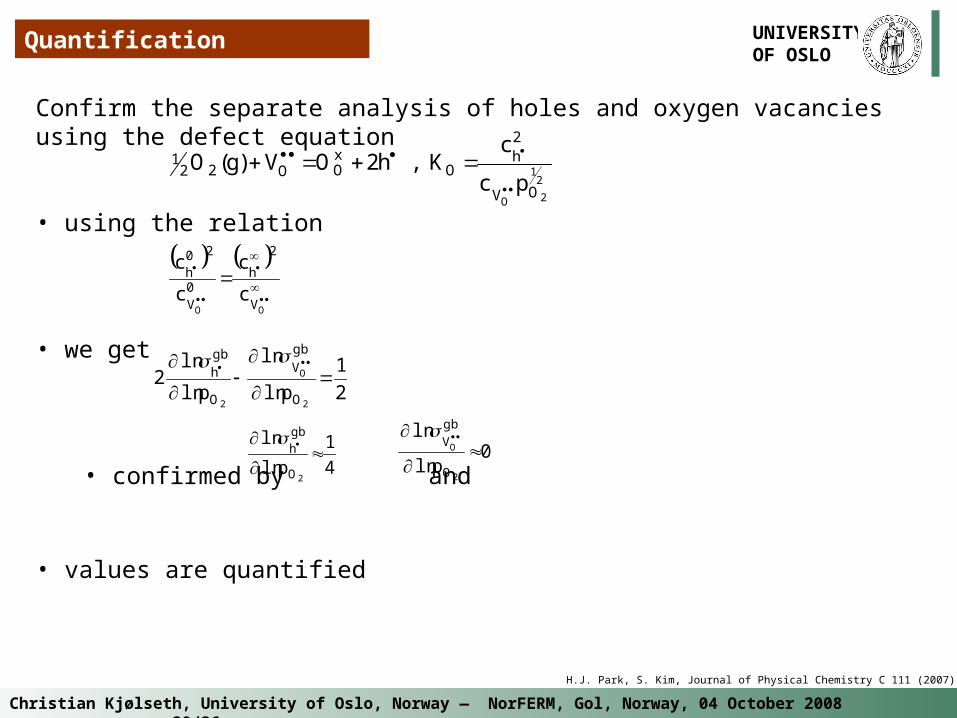
Confirm the separate analysis of holes and oxygen vacancies using the defect equation
• using the relation
• we get
• confirmed by and
• values are quantified
21
2OOV
2h
OxOO22
1
pc
cKh2OVgO
,)(
OO V
2
h0V
20h
c
c
c
c
2
1
pp2
2
O
2 O
gb
V
O
gbh
ln
ln
ln
ln
0p
2
O
O
gb
V
ln
ln
4
1
p2O
gbh
ln
ln
H.J. Park, S. Kim, Journal of Physical Chemistry C 111 (2007) 14903
Christian Kjølseth, University of Oslo, Norway ― NorFERM, Gol, Norway, 04 October 2008 31/36
UNIVERSITY OF OSLO
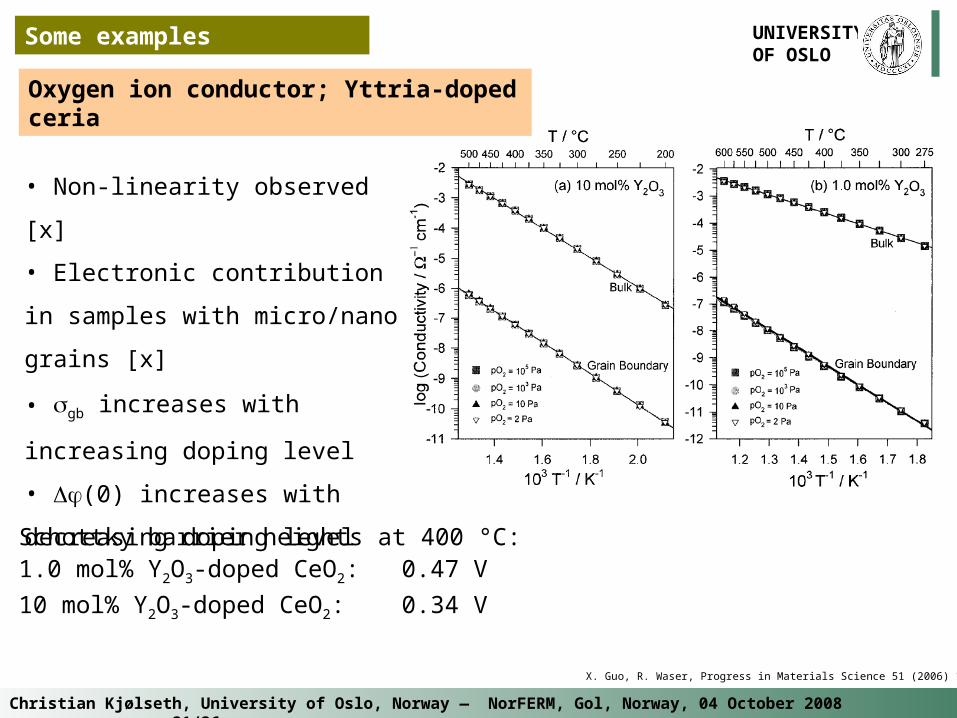
• Non-linearity observed [x]
• Electronic contribution in samples
with micro/nano grains [x]
• gb increases with increasing
doping level
• (0) increases with decreasing
doping level
Schottky barrier heights at 400 °C: 1.0 mol% Y2O3-doped CeO2: 0.47 V
10 mol% Y2O3-doped CeO2: 0.34 V
Oxygen ion conductor; Yttria-doped ceria
Some examples
X. Guo, R. Waser, Progress in Materials Science 51 (2006) 151
Christian Kjølseth, University of Oslo, Norway ― NorFERM, Gol, Norway, 04 October 2008 32/36
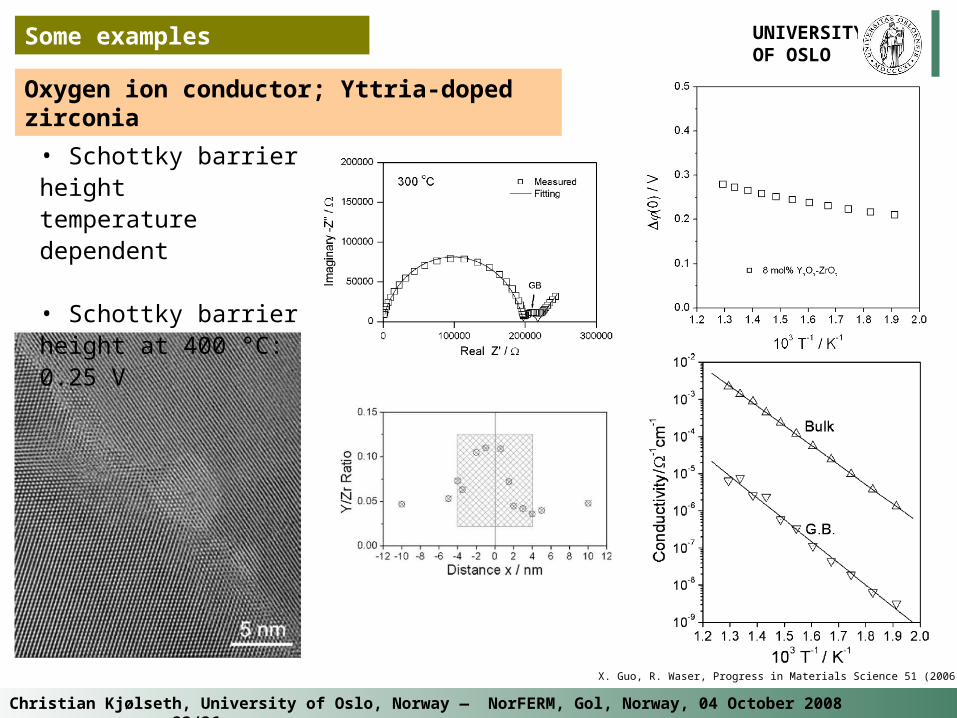
UNIVERSITY OF OSLOOxygen ion conductor; Yttria-doped zirconia
Some examples
• Schottky barrier height temperature dependent
• Schottky barrier height at 400 °C: 0.25 V
X. Guo, R. Waser, Progress in Materials Science 51 (2006) 151
Christian Kjølseth, University of Oslo, Norway ― NorFERM, Gol, Norway, 04 October 2008 33/36
UNIVERSITY OF OSLO
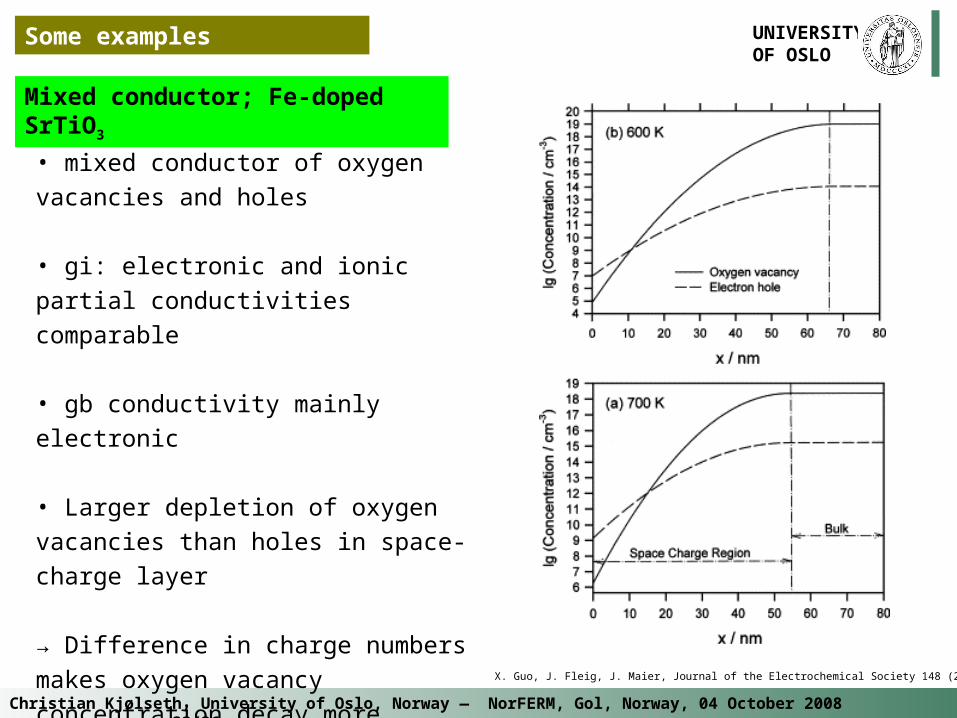
• mixed conductor of oxygen vacancies
and holes
• gi: electronic and ionic partial
conductivities comparable
• gb conductivity mainly electronic
• Larger depletion of oxygen vacancies
than holes in space-charge layer
→ Difference in charge numbers makes
oxygen vacancy concentration decay
more steeply than hole concentration
Mixed conductor; Fe-doped SrTiO3
Some examples
X. Guo, J. Fleig, J. Maier, Journal of the Electrochemical Society 148 (2001) J50
Christian Kjølseth, University of Oslo, Norway ― NorFERM, Gol, Norway, 04 October 2008 34/36
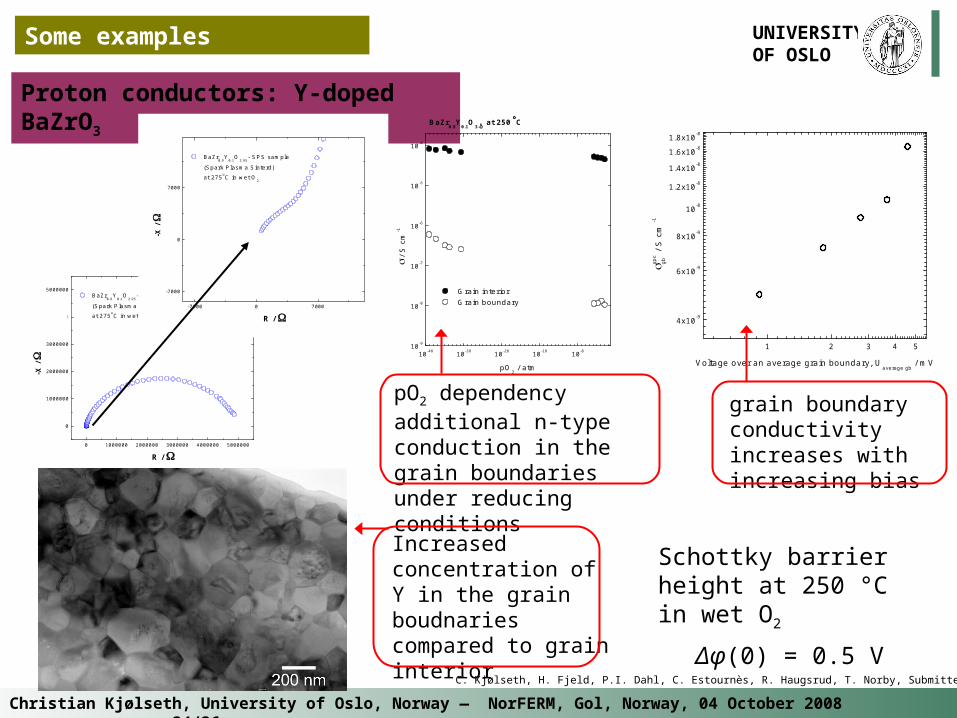
UNIVERSITY OF OSLOProton conductors: Y-doped BaZrO3
Some examples
0 1000000 2000000 3000000 4000000 5000000
0
1000000
2000000
3000000
4000000
5000000
BaZr0.9
Y0.1
O2.95
- SPS sample
(Spark Plasma Sinterd)
at 275oC in wet O2
-X
/
R /
-7000 0 7000
-7000
0
7000
BaZr0.9
Y0.1
O2.95
- SPS sample
(Spark Plasma Sinterd)
at 275oC in wet O2
-X
/
R /
10-48 10-38 10-28 10-18 10-810-9
10-8
10-7
10-6
10-5
10-4
/
S c
m-1
pO2 / atm
Grain interior Grain boundary
BaZr0.9
Y0.1
O3- at 250C
1 2 3 4 5
4x10⁻⁹
6x10⁻⁹
8x10⁻⁹
10-8
1.2x10⁻⁸
1.4x10⁻⁸
1.6x10⁻⁸
1.8x10⁻⁸
spc
gb /
S c
m-1
Voltage over an average grain boundary, Uaverage gb
/ mV
Schottky barrier height at 250 °C in wet O2
Δφ(0) = 0.5 V
pO2 dependency additional n-type conduction in the grain boundaries under reducing conditions
grain boundary conductivity increases with increasing bias
Increased concentration of Y in the grain boudnaries compared to grain interior
C. Kjølseth, H. Fjeld, P.I. Dahl, C. Estournès, R. Haugsrud, T. Norby, Submitted (2008)
Christian Kjølseth, University of Oslo, Norway ― NorFERM, Gol, Norway, 04 October 2008 35/36
UNIVERSITY OF OSLO
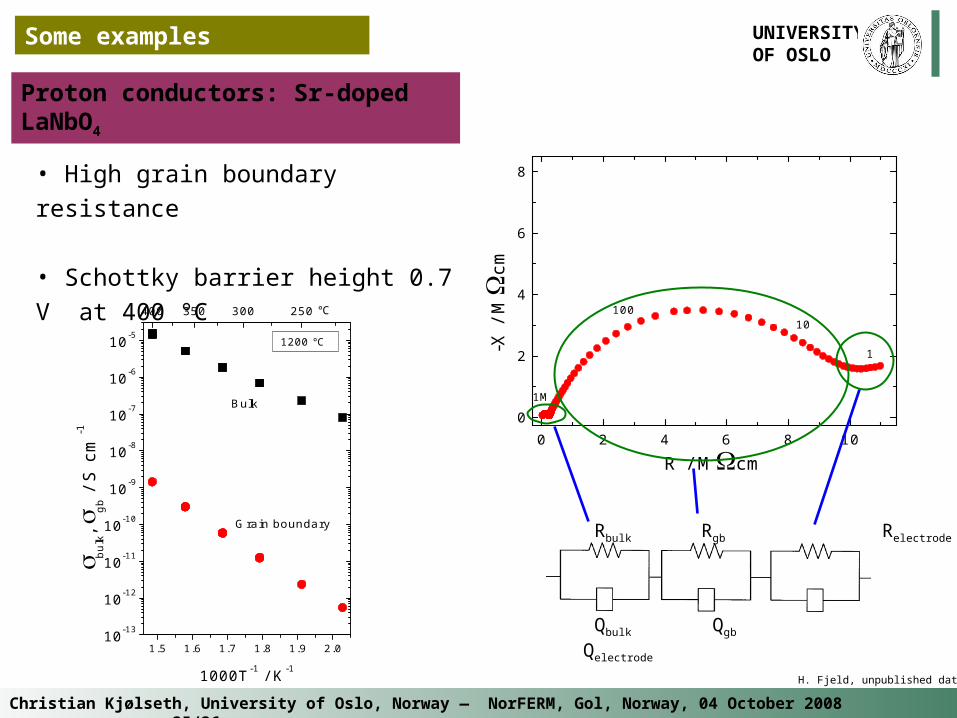
Some examples
Proton conductors: Sr-doped LaNbO4
• High grain boundary resistance
• Schottky barrier height 0.7 V at 400 °C
0 2 4 6 8 100
2
4
6
8
-X /
M
cm
R / Mcm
1
10100
1M
Rbulk Rgb Relectrode
Qbulk Qgb Qelectrode
H. Fjeld, unpublished data
1.5 1.6 1.7 1.8 1.9 2.010-13
10-12
10-11
10-10
10-9
10-8
10-7
10-6
10-5
400 350 300 250
bulk,
gb /
S c
m-1
1000T-1 / K-1
Grain boundary
°C
Bulk
1200 °C
Christian Kjølseth, University of Oslo, Norway ― NorFERM, Gol, Norway, 04 October 2008 36/36
UNIVERSITY OF OSLO
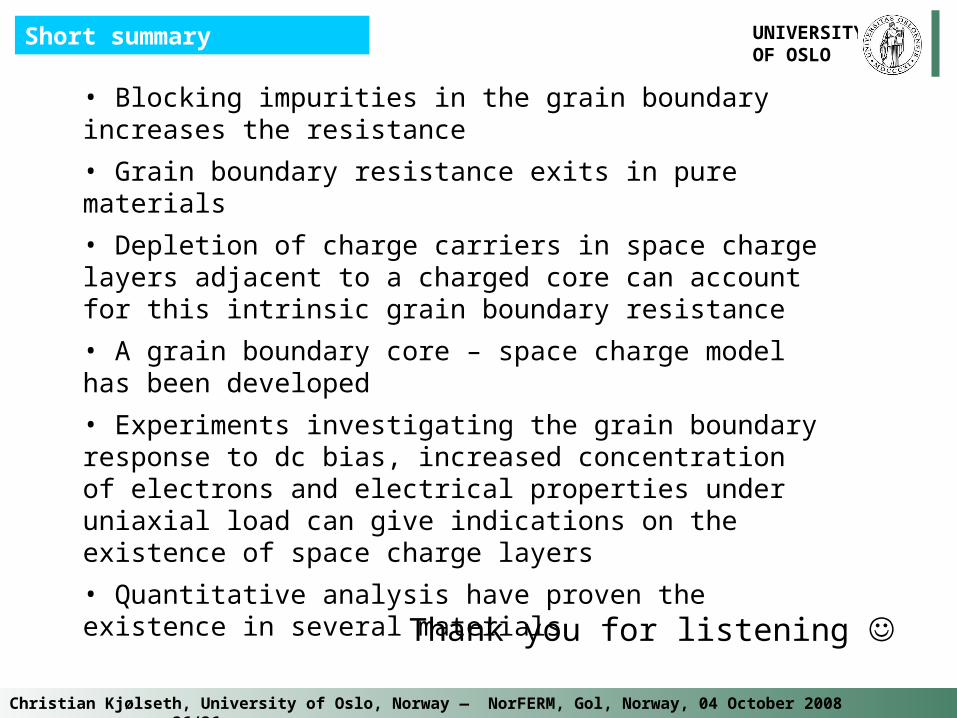
Short summary
• Blocking impurities in the grain boundary increases the resistance
• Grain boundary resistance exits in pure materials
• Depletion of charge carriers in space charge layers adjacent to a charged core can account for this intrinsic grain boundary resistance
• A grain boundary core – space charge model has been developed
• Experiments investigating the grain boundary response to dc bias, increased concentration of electrons and electrical properties under uniaxial load can give indications on the existence of space charge layers
• Quantitative analysis have proven the existence in several materials
Thank you for listening
Christian Kjølseth, University of Oslo, Norway ― NorFERM, Gol, Norway, 04 October 2008 37/36
UNIVERSITY OF OSLO
Christian Kjølseth, University of Oslo, Norway ― NorFERM, Gol, Norway, 04 October 2008 38/36
UNIVERSITY OF OSLO

Christian Kjølseth, University of Oslo, Norway ― NorFERM, Gol, Norway, 04 October 2008 39/36
UNIVERSITY OF OSLO
Christian Kjølseth, University of Oslo, Norway ― NorFERM, Gol, Norway, 04 October 2008 40/36
UNIVERSITY OF OSLO
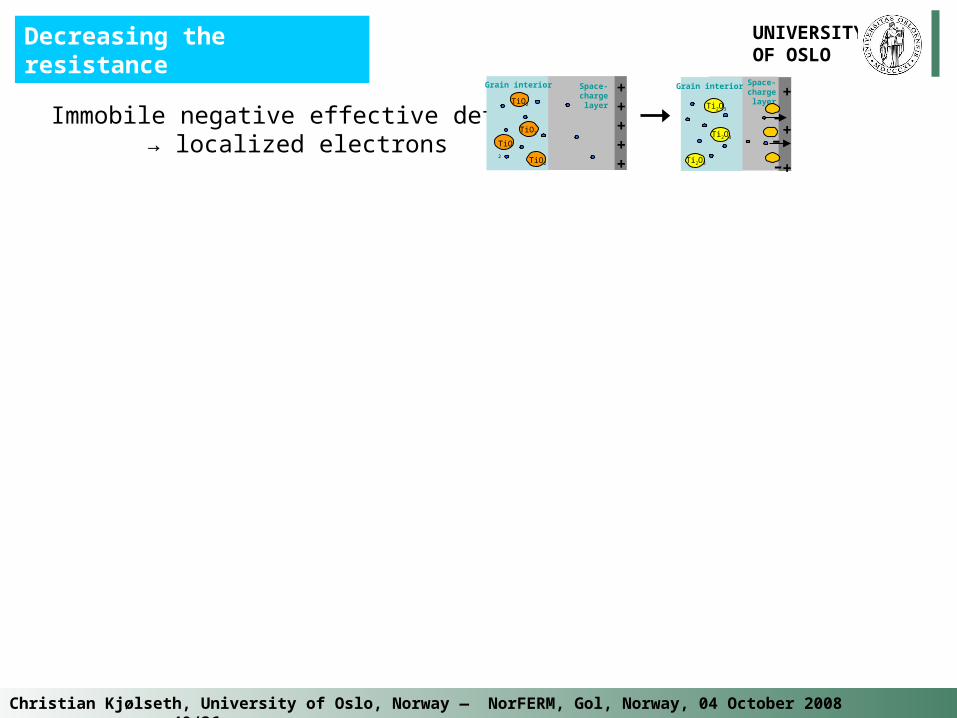
Decreasing the resistance
Immobile negative effective defects → localized electrons
Space-charge layer
Grain interior
TiO2
TiO2
TiO2
TiO2
Grain interior Space-charge layer
–
–
Ti2O3
Ti2O3
Ti2O3
+
+
+
+++++
–