Embed Size (px)
Citation preview
S1
Chrysaorenes Assembling Coronoid Hydrocarbons via the Fold-in Synthesis
by Marcin Majewski Tadeusz Lis Joanna Cybińska and Marcin Stępień
Supporting Information
Table of contents
Experimental details page S2
Synthetic procedures page S4
Additional schemes page S10
Additional figures page S14
Additional tables page S28
1H and 13C NMR spectra page S34
Mass spectra page S45
References page S50
Electronic Supplementary Material (ESI) for ChemCommThis journal is copy The Royal Society of Chemistry 2015
S2
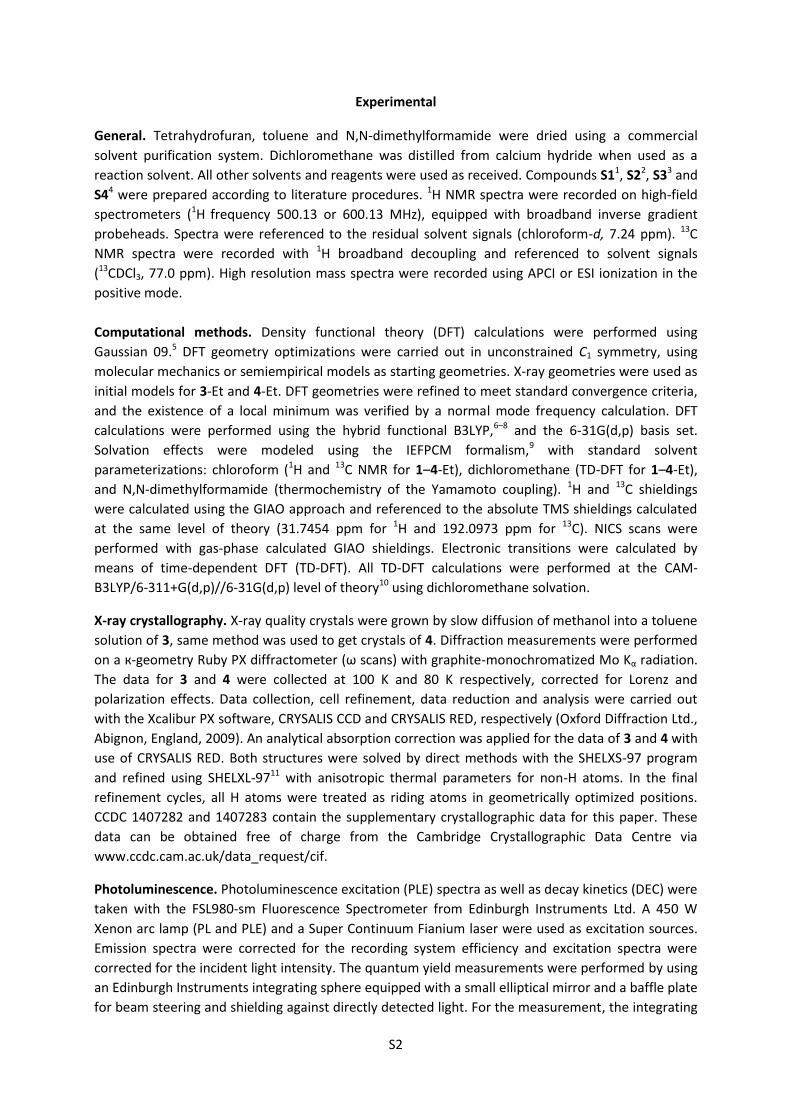
Experimental
General Tetrahydrofuran toluene and NN-dimethylformamide were dried using a commercial
solvent purification system Dichloromethane was distilled from calcium hydride when used as a
reaction solvent All other solvents and reagents were used as received Compounds S11 S22 S33 and
S44 were prepared according to literature procedures 1H NMR spectra were recorded on high-field
spectrometers (1H frequency 50013 or 60013 MHz) equipped with broadband inverse gradient
probeheads Spectra were referenced to the residual solvent signals (chloroform-d 724 ppm) 13C
NMR spectra were recorded with 1H broadband decoupling and referenced to solvent signals
(13CDCl3 770 ppm) High resolution mass spectra were recorded using APCI or ESI ionization in the
positive mode
Computational methods Density functional theory (DFT) calculations were performed using
Gaussian 095 DFT geometry optimizations were carried out in unconstrained C1 symmetry using
molecular mechanics or semiempirical models as starting geometries X-ray geometries were used as
initial models for 3-Et and 4-Et DFT geometries were refined to meet standard convergence criteria
and the existence of a local minimum was verified by a normal mode frequency calculation DFT
calculations were performed using the hybrid functional B3LYP6ndash8 and the 6-31G(dp) basis set
Solvation effects were modeled using the IEFPCM formalism9 with standard solvent
parameterizations chloroform (1H and 13C NMR for 1ndash4-Et) dichloromethane (TD-DFT for 1ndash4-Et)
and NN-dimethylformamide (thermochemistry of the Yamamoto coupling) 1H and 13C shieldings
were calculated using the GIAO approach and referenced to the absolute TMS shieldings calculated
at the same level of theory (317454 ppm for 1H and 1920973 ppm for 13C) NICS scans were
performed with gas-phase calculated GIAO shieldings Electronic transitions were calculated by
means of time-dependent DFT (TD-DFT) All TD-DFT calculations were performed at the CAM-
B3LYP6-311+G(dp)6-31G(dp) level of theory10 using dichloromethane solvation
X-ray crystallography X-ray quality crystals were grown by slow diffusion of methanol into a toluene
solution of 3 same method was used to get crystals of 4 Diffraction measurements were performed
on a к-geometry Ruby PX diffractometer (ω scans) with graphite-monochromatized Mo Kα radiation
The data for 3 and 4 were collected at 100 K and 80 K respectively corrected for Lorenz and
polarization effects Data collection cell refinement data reduction and analysis were carried out
with the Xcalibur PX software CRYSALIS CCD and CRYSALIS RED respectively (Oxford Diffraction Ltd
Abignon England 2009) An analytical absorption correction was applied for the data of 3 and 4 with
use of CRYSALIS RED Both structures were solved by direct methods with the SHELXS-97 program
and refined using SHELXL-9711 with anisotropic thermal parameters for non-H atoms In the final
refinement cycles all H atoms were treated as riding atoms in geometrically optimized positions
CCDC 1407282 and 1407283 contain the supplementary crystallographic data for this paper These
data can be obtained free of charge from the Cambridge Crystallographic Data Centre via
wwwccdccamacukdata_requestcif
Photoluminescence Photoluminescence excitation (PLE) spectra as well as decay kinetics (DEC) were
taken with the FSL980-sm Fluorescence Spectrometer from Edinburgh Instruments Ltd A 450 W
Xenon arc lamp (PL and PLE) and a Super Continuum Fianium laser were used as excitation sources
Emission spectra were corrected for the recording system efficiency and excitation spectra were
corrected for the incident light intensity The quantum yield measurements were performed by using
an Edinburgh Instruments integrating sphere equipped with a small elliptical mirror and a baffle plate
for beam steering and shielding against directly detected light For the measurement the integrating
S3
sphere replaces the standard sample holder inside the sample chamber Calculations of quantum
yields were made using the software provided by Edinburgh Instruments
S4
Synthesis
NN-(36-dibromo-99-diethyl-9H-fluorene-27-diyl)diacetamide (S5) In a 500 mL round-bottomed
flask equipped with a stirring bar compound S4 (215 g 639 mmol) was dissolved in dry NN-
dimethylformamide (250 mL) under nitrogen atmosphere The solution was kept under dark and
bromine (819 mL 160 mmol) was added dropwise The mixture was stirred under nitrogen for 20
hours After that water (1 L) was added and a yellow-brown precipitate was formed The mixture was
filtered under reduced pressure and the precipitate was dried in vacuo The resulting product did not
require further purification (170 g 864) 1H NMR (600 MHz chloroform-d 300 K) δ 837 s 2H) δ
773 (s 2H) δ 770 (s 2H) δ 225 (s 6H) δ 200 (q 4H 3J = 73 Hz) δ 031 (t 6H 3J = 73 Hz) 13C NMR
(151 MHz chloroform-d 300 K) δ 16816 15080 13698 13466 12631 12294 11636 11172
5682 3273 3235 2978 2515 846 836 HRMS (ESI+) mz [M + H]+ Calcd for C21H23Br2N2O2
4930133 Found 4930121
36-dibromo-99-diethyl-9H-fluorene-27-diamine (S6) To a 2000 mL round-bottomed flask
equipped with a reflux condenser and a stirring bar compound S5 (316 g 639 mmol) was dissolved
in methanol (1000 mL) Potassium hydroxide (574 g 1020 mmol) was added to the mixture under
nitrogen The mixture was heated to 90 degC and stirred for 18 hours The solvent was removed on a
rotary evaporator and the product in the form of red-brown crystals was formed and used without
further purification (260 g 991 ) 1H NMR (600 MHz chloroform-d 300 K) δ 753 (s 2H) δ 665 (s
2H) δ 406 (s 4H) δ 185 (q 4H 3J = 74 Hz) δ 031 (t 6H 3J = 74 Hz) 13C NMR (151 MHz
chloroform-d 300 K) δ 14995 14229 13340 12261 11041 10811 5575 3304 842 HRMS
(ESI+) mz [M + H]+ Calcd for C17H19Br2N2 4089910 Found 4089913
36-dibromo-99-diethyl-27-diiodo-9H-fluorene (S7) In a round-bottomed flask equipped with a
magnetic stirring bar compound S6 (260 g 634 mmol) was suspended in a 10 water solution of
sulfuric acid The suspension was cooled to room temperature and further cooled to 0 degC in an ice
bath Aqueous solution of sodium nitrite (175 g 254 mmol in 90 mL of water) was added dropwise
to the suspension and stirred for 45 min To the solution potassium iodide (10523 g 634 mmol)
dissolved in 90 mL of water was added slowly The resulting solution was allowed to reach room
temperature and was stirred for 1 hour Aqueous solution of sodium sulphite (1 L) was added and the
mixture was extracted with dichloromethane The organic layers were combined dried with
anhydrous sodium sulphate filtered and the solvent was removed on a rotary evaporator The crude
product was purified by column chromatography (silicagel dichloromethane) The first fraction was
S5
collected and concentrated on a rotary evaporator to yield yellow-brown crystals (25 g 624 ) 1H
NMR (600 MHz chloroform-d 300 K) δ 789 (s 2H) δ 777 (s 2H) δ 193 (q 4H 3J = 74 Hz) δ 031
(t 6H 3J = 74 Hz) 13C NMR (151 MHz chloroform-d 300 K) δ 15026 13472 12830 12409
10045 5622 3231 886
36-dibromo-99-diethyl-9H-fluorene-27-dicarbaldehyde (S8) In a 500 mL round-bottomed flask
equipped with a stirring bar and septum compound S7 (118 g 187 mmol) was dissolved in dry
tetrahydrofuran (300 mL) under nitrogen atmosphere The solution was cooled in an acetone‒liquid
nitrogen bath to ‒78 degC and a solution of isopropylmagnesium chloride (1961 mL 392 mmol 2 M
solution in tetrahydrofuran) was added dropwise After stirring for 15 minutes dry NN-
dimethylformamide (578 mL 747 mmol) was added and the solution was allowed to reach room
temperature and was stirred for an additional hour Aqueous solution of ammonium chloride was
added and the reaction mixture was extracted with dichloromethane The organic layers were
combined dried over anhydrous sodium sulphate filtered and the solvent was removed on a rotary
evaporator The crude product was purified by column chromatography (silicagel
dichloromethane‒hexanes = 21) The third fraction was collected and concentrated on a rotary
evaporator to give orange crystals (538 g 661 ) 1H NMR (600 MHz chloroform-d 300 K) δ 1043
(s 2H) δ 799 (s 2H) δ 790 (s 2H) δ 207 (q 4H 3J = 74 Hz) δ 027 (t 6H 3J = 74 Hz) 13C NMR (151
MHz chloroform-d 300 K) δ 19181 15112 14573 13326 12654 12633 12423 5690 3211
841 HRMS (APCI) mz [M + H]+ Calcd for C19H17Br2O2 4349590 Found 4349595
(36-dibromo-99-diethyl-9H-fluorene-27-diyl)dimethanol (S9) In a 50 mL round-bottomed flask
equipped with a magnetic stirring bar compound S8 (500 mg 12 mmol) and sodium borohydride
(130 mg 34 mmol) were suspended in dry tetrahydrofuran (25 mL) The mixture was stirred in room
temperature overnight after which a yellow precipitate was formed Water (30 mL) was added and
then the mixture was extracted with dichloromethane Combined organic extracts were dried with
anhydrous sodium sulphate and filtered Solvents were removed on a rotary evaporator yielding an
orange-brown crystals (482 mg 955 ) The product was used without further purification 1H NMR
(600 MHz chloroform-d 300 K) δ 780 (s 2H) δ 742 (s 2H) δ 481 (d 4H J = 64 Hz) δ 200 (q 4H 3J = 73 Hz) δ 027 (t 6H 3J = 73 Hz) 13C NMR (151 MHz chloroform-d 300 K) δ 14978 14121
13878 12411 12330 12104 6545 5637 3245 848 HRMS (APCI) mz [M ]+ Calcd for
C19H20Br2O2 4379825 Found 4379771
S6
36-dibromo-27-bis(chloromethyl)-99-diethyl-9H-fluorene (S10) In a 50 mL round-bottomed flask
equipped with a magnetic stirring bar compound S9 (500 mg 11 mmol) was dissolved in freshly
distilled dichloromethane (15 mL) to which catalytic amounts of NN-dimethylformamide (25 microL)
were added With continuous stirring thionyl chloride (181 microL 25 mmol) was added to the reaction
mixture After one hour of stirring the solvent and excess of thionyl chloride were removed on a
rotary evaporator yielding a brown crystals (520 mg 960 ) The product was used without further
purification 1H NMR (600 MHz chloroform-d 300 K) δ 786 (s 2H) δ 741 (s 2H) δ 476 (s 4H) δ
200 (q 4H 3J = 73 Hz) δ 030 (t 6H 3J = 73 Hz) 13C NMR (151 MHz chloroform-d 300 K) δ 15018
14175 13596 12532 12476 12293 5640 4667 3236 848 HRMS (APCI) mz [M ]+ Calcd for
C19H18Br2Cl2 4739147 Found 4739290
36-dibromo-2-chloromethyl-7-triphenylphosphine-99-diethyl-9H-fluorene (S11) In a 50 mL
pressure tube equipped with a magnetic stirring bar compound S10 (550 mg 12 mmol) and
triphenylphosphine (907 mg 346 mmol) were dissolved in dry toluene (25 mL) The reaction mixture
was sealed heated at 120 degC and stirred for 12 hours after which time a yellow precipitate was
formed The reaction mixture was cooled to room temperature diluted with dichloromethane and
the solvents were removed on a rotary evaporator The precipitate was washed with hexane and
dried yielding yellow-white crystals (1035 g 895 ) 1H NMR (600 MHz chloroform-d 300 K) δ
776 (t 6H 3J = 726 Hz) δ 769 (m 12H) δ 760 (m 12H) δ 759 (s 2H) δ 727 (s 2H) δ 580 (d 4H 3J = 144 Hz) δ 140 (q 4H 3J = 72 Hz) δ -018 (t 6H 3J = 72 Hz) 13C NMR (151 MHz chloroform-d
300 K) δ 15027 14124 13511 13435 13018 12799 12698 12572 12438 11771 11715
5616 3147 842 HRMS (ESI+) mz [M2+] Calcd for C55H48Br2P2 4640793 Found 4640799
S7
(33rsquo3rsquorsquo66rsquo6rsquorsquo-hexabromo-99rsquo9rsquorsquo9rsquorsquorsquo9rsquorsquorsquorsquo9rsquorsquorsquorsquorsquo-hexaethyl)[222]-(27)-fluorenophanetriene (3-Et)
To a 250 mL three-necked round-bottomed flask equipped with a reflux condenser septum and
syringe pump adapter were placed zinc powder (2250 mg 344 mmol) and copper(I) iodide (210 mg
11 mmol) The apparatus was filled with nitrogen and oxygen-free tetrahydrofuran (130 mL) was
introduced through a syringe Titanium tetrachloride (189 mL 172 mmol) was added dropwise the
septum was replaced with a glass stopper and the reaction mixture was heated and stirred under
reflux for 3 hours Subsequently a solution of compound S8 (100 mg 023 mmol) in oxygen-free
tetrahydrofuran (50 mL) was added to the reaction mixture using a syringe pump in 3 hours and the
mixture was stirred under reflux for another 12 hours After that time it was cooled down to room
temperature Aqueous ammonia (5 150 mL) was added and the mixture was stirred for 1 hour
Extraction with dichloromethane followed by drying the combined organic layers over anhydrous
sodium sulphate and removing the solvents on a rotary evaporator gave a yellow-green solid It was
purified using column chromatography (silicagel dichloromethanehexane = 110) yielding pale
green crystals (16 mg 173 ) 1H NMR (500 MHz chloroform-d 300 K) δ 763 (s 6H) δ 688 (s 6H)
δ 687 (s 6H) δ 135 (q 12H 3J = 74 Hz) δ 011 (t 18H 3J = 74 Hz) 13C NMR (600 MHz chloroform-
d 300 K) δ 14959 14018 13662 13243 12527 12364 12206 5478 3106 872 HRMS
(APCI+) mz [M ]+ Calcd for C57H48Br6 12058851 Found 12059023
(33rsquo3rsquorsquo3rsquorsquorsquo66rsquo6rsquorsquo6rsquorsquorsquo-octabromo-99rsquo9rsquorsquo9rsquorsquorsquo9rsquorsquorsquorsquo9rsquorsquorsquorsquorsquo9rsquorsquorsquorsquorsquorsquo9rsquorsquorsquorsquorsquorsquorsquo-octaethyl)[2222]-(27)-
fluorenephanetetraene (4-Et) In a 100 mL round-bottomed flask compound S8 (79 mg 018 mmol)
and compound S11 (200 mg 019 mmol) were dissolved in freshly distilled oxygen free
dichloromethane (80 mL) Aqueous sodium hydroxide (50 620 microL) was added dropwise to the
solution using a syringe During the addition the mixture was kept under a nitrogen atmosphere and
protected from light After the addition the solution was stirred for 1 hour After that time the
mixture was diluted with water and extracted with dichloromethane Combined extracts were dried
over anhydrous sodium sulphate filtered and the solvent was removed on a rotary evaporator
The crude material was purified using column chromatography (silicagel dichloromethanehexanes =
16) yielding pale green crystals (35 mg 239 ) 1H NMR (500 MHz chloroform-d 300 K) δ 782 (s
S8
8H) δ 701 (s 8H) δ 677 (s 8H) δ 142 (q 16H 3J = 74 Hz) δ 002 (t 24H 3J = 74 Hz) 13C NMR (151
MHz chloroform-d 300 K) δ 14963 14055 13618 13080 12483 12426 12301 5555 3130
855 HRMS (APCI+) mz [M ]+ Calcd for C76H64Br8 16078490 Found 16078971
[3]chrysaorene (1-Et) In a 50 mL Schlenk flask equipped with a magnetic stirring bar compound 3-Et
(22 mg 181 micromol) was placed and the vessel was capped with a septum The atmosphere within the
flask was then changed a few times to nitrogen after which bis(15-cyclooctadiene)nickel(0) (45 mg
016 mmol) and 22rsquo-bibyridyl (26 mg 016 mmol) were added in a glove-box Dry NN-
dimethylformamide (7 mL) was then added to the vessel in a constant flow of nitrogen and the
mixture was sealed with a glass stopper After subsequent changing of the atmosphere to nitrogen
one more time the reaction mixture was heated to 85 degrees and stirred for 18 hours It was then
cooled down to room temperature diluted with water and extracted with dichloromethane The
combined organic extracts were dried over anhydrous sodium sulphate filtered and the solvents
were removed on a rotary evaporator The crude mixture was filtered through a short silica plug to
remove the solid impurities Subsequent purification by column chromatography (silicagel
dichloromethanehexane = 16) gave the product in a form of pale yellow solid (65 mg 489 ) 1H
NMR (600 MHz chloroform-d 300 K) δ 927 (s 6H) δ 763 (s 6H) δ 761 (s 6H) δ 231 (q 6H 3J =
74 Hz) δ 209 (q 6H 3J = 73 Hz) δ 119 (t 9H 3J = 74 Hz) δ -041 (t 9H 3J = 73 Hz) 13C NMR (151
MHz chloroform-d 300 K) δ 14951 14179 13156 13094 12637 12319 11713 5940 3549
2980 1009 826 HRMS (APCI+) mz [M + H]+ Calcd for C57H49 7333829 Found 7333834 UV-vis
(dichloromethane 295 K) [nm] ( in M-1cm-1) 250 (761middot104) 281 (644middot104) 309 (427middot104) 316
(441middot104) 330 (342middot104) 348 (358middot104) 373 (148middot104) 396 (184middot104)
S9
[4]chrysaorene (2-Et) In a 25 mL Schlenk flask equipped with a magnetic stirring bar compound 4-Et
(15 mg 93 micromol) was placed and the vessel was capped with a septum The atmosphere within the
flask was then changed a few times to nitrogen after which bis(15-cyclooctadiene)nickel(0) (31 mg
1110 micromol) and 22rsquo-bibyridyl (17 mg 1110 micromol) were added in a glove-box Dry NN-
dimethylformamide (5 mL) was then added to the vessel in a constant flow of nitrogen and the
mixture was sealed with a glass stopper After subsequent changing of the atmosphere to nitrogen
one more time the reaction mixture was heated to 85 degrees and stirred for 18 hours It was then
cooled down to room temperature diluted with water and extracted with dichloromethane The
combined organic extracts were dried over anhydrous sodium sulphate filtered and the solvents
were removed on a rotary evaporator The crude mixture was filtered through a short silica plug to
remove the solid impurities Subsequent purification by column chromatography (silicagel
dichloromethanehexane = 16) gave the product in a form of pale yellow solid (4 mg 441 ) 1H
NMR (500 MHz chloroform-d 300 K) δ 970 (s 8H) δ 791 (s 8H) δ 784 (s 8H) δ 230 (q 16H 3J =
74 Hz) δ 042 (t 24H 3J = 74 Hz) 13C NMR (151 MHz chloroform-d 300 K) δ 14910 14122
13244 13084 12728 12308 11442 5430 3440 839 HRMS (APCI+) mz [M + H]+ Calcd for
C76H65 97751 Found 97753 UV-vis (dichloromethane 295 K) [nm] ( in M-1cm-1) 265 (244middot104)
296 (133middot104) 313 (167middot104) 319 (169middot104) 341 (206middot104) 366 (115middot104) 384 (126middot104) 398
(699middot103)
S10
Scheme S1 Synthesis of compounds S1-4-Et Reagents and conditions a) fuming HNO3 (20 equiv)
AcOH b) N2H4 (4 equiv) PdC (002 equiv) EtOH c) Ac2O (30 equiv) AcOH d) Br2 (25 equiv) DMF
e) KOH (16 equiv) MeOH f) 1 H2SO4H2O 2 NaNO2 (4 equiv) 3 KI (10 equiv)H2O g) 1 i-PrMgCl
(21 equiv)THF 2 DMF (4 equiv) h) NaBH4 (3 equiv) THF i) SOCl2 (22 equiv) DCM DMF j) PPh3
(3 equiv) toluene k) TiCl4 (75 equiv) CuI (48 equiv) Zn (150 equiv) THF l) NaOHaq (65 equiv)
DCM
S11
Scheme S2 1H and 13C chemical shifts of 3-Et and 4-Et (full assignment based on data obtained from
COSY ROESY HSQC and HMBC experiments)
S12
Scheme S3 1H and 13C chemical shifts of 1-Et and 2-Et (full assignment based on data obtained from
COSY ROESY HSQC and HMBC experiments)
S13
Scheme S4 Macrocyclic conjugation pathways in 1 and 2 [28]- [32]- [36]- and [40]annulene
pathways in 2 are constructed by inclusion of outer parts of phenanthrene units as shown for 1
S14
Figure S1 Molecular structure of 3-Et (co-crystalizing solvent dichloromethane also visible)
S15
Figure S2 Molecular structure of 4-Et (co-crystalizing solvent toluene also visible)
S16
Figure S3 Correlation between 1H NMR chemical shifts of 3-Et derived from experiment (δexptl 500
MHz chloroform-d 300 K) and theory (δcalcd GIAO-B3LYP6-31G(dp)PCM(CHCl3)) Signals in the
experimental spectrum were assigned on the basis of 2D NMR data
Figure S4 Correlation between 13C NMR chemical shifts of 3-Et derived from experiment (δexptl 600
MHz chloroform-d 300 K) and theory (δcalcd GIAO-B3LYP6-31G(dp)PCM(CHCl3)) Signals in the
experimental spectrum were assigned on the basis of 2D NMR data The calculated shift of carbon c
does not include the relativistic effect of the attached Br atom
y = 09915x + 02767Rsup2 = 0997
-1
1
3
5
7
-1 1 3 5 7
δexptl(1H)
δcalcd(1H)
y = 09557x + 5237Rsup2 = 0987
0
20
40
60
80
100
120
140
160
0 20 40 60 80 100 120 140 160
δexptl(13C)
δcalcd(13C)
S17
Figure S5 Correlation between 1H NMR chemical shifts of 4-Et derived from experiment (δexptl 500
MHz chloroform-d 300 K) and theory (δcalcd GIAO-B3LYP6-31G(dp)PCM(CHCl3)) Signals in the
experimental spectrum were assigned on the basis of 2D NMR data
Figure S6 Correlation between 13C NMR chemical shifts of 4-Et derived from experiment 151 MHz
chloroform-d 300 K) and theory (δcalcd GIAO-B3LYP6-31G(dp)PCM(CHCl3)) Signals in the
experimental spectrum were assigned on the basis of 2D NMR data The calculated shift of carbon c
does not include the relativistic effect of the attached Br atom
y = 09944x + 01523Rsup2 = 09985
-1
1
3
5
7
9
-1 1 3 5 7 9
δexptl(1H)
δcalcd(1H)
y = 09686x + 37185Rsup2 = 09891
0
20
40
60
80
100
120
140
160
0 20 40 60 80 100 120 140 160
δexptl(13C)
δcalcd(13C)
S18
Figure S7 Correlation between 1H NMR chemical shifts of 1-Et derived from experiment (δexptl 600
MHz chloroform-d 300 K) and theory (δcalcd GIAO-B3LYP6-31G(dp)PCM(CHCl3)) Signals in the
experimental spectrum were assigned on the basis of 2D NMR data
Figure S8 Correlation between 13C NMR chemical shifts of 1-Et derived from experiment (δexptl 151
MHz chloroform-d 300 K) and theory (δcalcd GIAO-B3LYP6-31G(dp)PCM(CHCl3)) Signals in the
experimental spectrum were assigned on the basis of 2D NMR data
y = 10159x + 00411Rsup2 = 09994
-1
1
3
5
7
9
-1 1 3 5 7 9
δexptl(1H)
δcalcd(1H)
y = 09457x + 42108
Rsup2 = 09986
0
20
40
60
80
100
120
140
160
0 20 40 60 80 100 120 140 160
δexptl(13C)
δcalcd(13C)
S19
Figure S9 Correlation between 1H NMR chemical shifts of 2-Et derived from experiment (δexptl 600
MHz chloroform-d 300 K) and theory (δcalcd GIAO-B3LYP6-31G(dp)PCM(CHCl3)) Signals in the
experimental spectrum were assigned on the basis of 2D NMR data
Figure S10 Correlation between 13C NMR chemical shifts of 2-Et derived from experiment (δexptl 151
MHz chloroform-d 300 K) and theory (δcalcd GIAO-B3LYP6-31G(dp)PCM(CHCl3)) Signals in the
experimental spectrum were assigned on the basis of 2D NMR data
y = 10166x + 0055
Rsup2 = 09994
0
2
4
6
8
10
0 2 4 6 8 10
δexptl(1H)
δcalcd(1H)
y = 09469x + 42433Rsup2 = 09992
0
20
40
60
80
100
120
140
160
0 20 40 60 80 100 120 140 160
δexptl(13C)
δcalcd(13C)
S20
10 20 30 40 50 60 70 80 90 100
1E-3
001
01
1
Log
Norm
lized
In
ten
sity
tns
Model ExpDec1
Equationy = A1exp(-xt1) + y0
Reduced Chi-Sqr 958665E-6
Adj R-Square 099971
Value Standard Error
Normalized1
y0 8E-4 0
A1 808283 001427
t1 392706 000265
k 025464 1719E-4
tau 272203 000184
Model ExpDec1
Equationy = A1exp(-xt1) + y0
Reduced Chi-Sqr 11007E-5
Adj R-Square 099971
Value Standard Error
Normalized1
y0 749513E-4 669951E-5
A1 279424 000238
t1 801384 000459
k 012478 714923E-5
tau 555477 000318
Figure S11 Decay traces of the emissions monitored at 437 nm (1-Et) and 447 nm (2-Et) under 395
nm excitation (Super Continuum Fianium Laser)
S21
Figure S12 Quantum yield determinations for 1-Et (top) and 2-Et (bottom)
S22
Figure S13 Chromaticity diagrams for 1-Et (x = 016 y = 009 and u = 017 v = 022) and 2-Et
(x = 015 y = 01 and u = 015 v = 023)
S23
Figure S14 KohnndashSham frontier orbitals calculated for 1-Et (left) and 2-Et (right) at the
PCM(DCM)B3LYP6-311+G(dp)6-31G(dp) level of theory
S24
Figure S15 Comparison of DFT-optimized geometries of 2-Et (blue) and 5-Et (red B3LYP6-31G(dp)
gas phase)
S25
Figure S16 NICS(1) scans for 2-Et 6-Et and phenanthrene Nuclear shieldings were evaluated 1 Aring
above the ring plane using GIAO-B3LYP6-31G(dp)
-18
-16
-14
-12
-10
-8
-6
-4
-2
0
2
4
-5 0 5 10 15
2-Et
6-Et
phenanthrene
benzenecentroid
chrysaorenecentroid
NICS(1)
scan coordinate
S26
Figure S17 DFT-optimized structure of 3-Et (B3LYP6-31G(dp))
S27
Figure S18 DFT-optimized structure of 4-Et (B3LYP6-31G(dp))
S28
Table S1 Bond length variation between chrysaorenes and the reference system 5-Et[a]
group bond[b]
1-Et 2-Et 5-Et Δ(1-Et ndash 5-Et) Δ(2-Et ndash 5-Et)
rim
ah 1547 1520 1529 0018 ndash0009
ab 1385 1371 1375 0010 ndash0004
bc 1430 1414 1419 0011 ndash0005
cg 1438 1430 1433 0005 ndash0003
gg 1368 1357 1361 0007 ndash0004
mean 0010 ndash0005
hub
ff 1457 1478 1466 ndash0009 0012
ef 1376 1390 1384 ndash0008 0006
de 1406 1419 1414 ndash0008 0005
dd 1458 1465 1460 ndash0002 0005
mean ndash0007 0007
spoke
cd 1427 1432 1431 ndash0004 0001
fa 1416 1422 1421 ndash0005 0001
mean ndash0005 0001
[a] B3LYP6-31G(dp) geometries [b] Bond definitions
S29
Table S2 Computational data for DFT-optimized structures
Structure[a] Functional Basis set Solvation Code[b] Energy[c] [au]
ZPV[d] [au]
lowest freq[e] [cmndash1]
ΔG[f] [au]
1-Et B3LYP 6-31G(dp) gas phase c3Etcont ndash2201155124 0879676 2950 ndash2200349383
B3LYP 6-31G(dp) chloroform c3EtCHCl3cont ndash2201161824 0879472 2952 ndash2200356244
CAM-B3LYP 6-31G(dp) DCM c3Et_S0_CAM ndash2199875261 0890989 2980 ndash2199057629
CAM-B3LYP 6-311+G(dp) DCM ndash2200318806
2-Et B3LYP 6-31G(dp) gas phase c4Et ndash2934960175 1173886 744 ndash2933880899
B3LYP 6-31G(dp) chloroform c4EtCHCl3 ndash2934969275 1173156 620 ndash2933891240
CAM-B3LYP 6-31G(dp) DCM c4Et_S0_CAM ndash2933255625 1188493 341 ndash2932162641
CAM-B3LYP 6-311+G(dp) DCM ndash2933843386
3-Et B3LYP 6-31G(dp) gas phase 3_Et_Xray ndash17631322441 0882496 760 ndash17630536224
B3LYP 6-31G(dp) chloroform 3_Et_XrayCHCl3 ndash17631330429 0881911 922 ndash17630544606
4-Et B3LYP 6-31G(dp) gas phase 4_Et_Xrayf ndash23508440909 1177296 382 ndash23507390923
B3LYP 6-31G(dp) chloroform 4_Et_XrayCHCl3 ndash23508450612 1176343 484 ndash23507401682
5-Et B3LYP 6-31G(dp) gas phase hd2 ndash1392444143 0594712 2031 ndash1391910343
6-Et B3LYP 6-31G(dp) gas phase hd3 ndash2126185352 0888216 1175 ndash2125377818
7 B3LYP 6-31G(dp) gas phase phen_Br2cont ndash5682927318 0195174 2053 ndash5682776848
8 B3LYP 6-31G(dp) gas phase phencont ndash539554443 0194558 9591 ndash539394736
[a] As defined in Scheme 2 [b] Data set name (Cartesian coordinates available as pdb files) [c] Electronic energy [d] Zero-point vibrational energy [e] Lowest vibrational
frequency [f] Gibbs free energy
S30
Table S3 TD-DFT electronic transitions calculated for 1-Et
No Energy (cmndash1)
λ (nm)
f[a] Major excitations[b]
1 27684 3612 0000 Hndash1raquoLUMO (46) HOMOraquoL+1 (46)
2 30217 3309 0351 Hndash2raquoLUMO (14) Hndash1raquoL+1 (13) Hndash1raquoL+2 (33) HOMOraquoLUMO (13)
3 30219 3309 0351 Hndash2raquoL+1 (14) Hndash1raquoLUMO (13) HOMOraquoL+1 (13) HOMOraquoL+2 (34)
4 32329 3093 0001 Hndash4raquoLUMO (18) Hndash3raquoL+1 (19) Hndash1raquoL+3 (16) HOMOraquoL+4 (17)
5 32359 3090 0596 Hndash1raquoL+1 (23) HOMOraquoLUMO (23)
6 32360 3090 0596 Hndash1raquoLUMO (23) HOMOraquoL+1 (23)
7 34583 2892 0010 Hndash1raquoL+1 (42) HOMOraquoLUMO (41)
8 34753 2877 0000 Hndash2raquoL+2 (50) 9 35397 2825 0111 Hndash4raquoL+1 (13)
Hndash3raquoLUMO (13) HOMOraquoL+2 (31) HOMOraquoL+5 (13)
10 35398 2825 0112 Hndash4raquoLUMO (13) Hndash3raquoL+1 (13) Hndash1raquoL+2 (31) Hndash1raquoL+5 (13)
11 36832 2715 0828 Hndash3raquoL+2 (23) Hndash2raquoLUMO (41)
12 36835 2715 0830 Hndash4raquoL+2 (23) Hndash2raquoL+1 (41)
13 38597 2591 0000 Hndash6raquoL+2 (25) Hndash4raquoL+3 (14) Hndash3raquoL+4 (14)
14 39229 2549 0034 Hndash4raquoL+1 (10) Hndash3raquoLUMO (10) HOMOraquoL+5 (37)
15 39231 2549 0033 Hndash4raquoLUMO (10) Hndash3raquoL+1 (10) Hndash1raquoL+5 (37)
16 39445 2535 0126 Hndash4raquoLUMO (26) Hndash3raquoL+1 (26) Hndash1raquoL+3 (16) HOMOraquoL+4 (16)
17 39755 2515 0450 Hndash6raquoL+4 (10) Hndash3raquoL+2 (17) Hndash3raquoL+5 (16)
18 39757 2515 0449 Hndash6raquoL+3 (10) Hndash4raquoL+2 (17) Hndash4raquoL+5 (16)
19 40414 2474 0000 Hndash4raquoL+1 (20) Hndash3raquoLUMO (20) Hndash2raquoL+5 (22)
20 41277 2423 0350 21 41279 2423 0349 22 41695 2398 0174 Hndash6raquoLUMO (44)
Hndash1raquoL+5 (17) 23 41697 2398 0170 Hndash6raquoL+1 (45)
HOMOraquoL+5 (17) 24 43470 2300 0203 Hndash5raquoLUMO (45) 25 43472 2300 0202 Hndash5raquoL+1 (45)
No Energy (cmndash1)
λ (nm)
f[a] Major excitations[b]
26 43798 2283 0000 Hndash6raquoL+2 (10) Hndash4raquoL+1 (10) Hndash3raquoLUMO (10) Hndash2raquoL+2 (28)
27 44207 2262 0081 Hndash1raquoL+7 (26) HOMOraquoL+7 (25)
28 44210 2262 0081 Hndash1raquoL+7 (25) HOMOraquoL+7 (26)
29 44676 2238 0008 Hndash5raquoL+2 (56) 30 44681 2238 0340 Hndash5raquoLUMO (10)
Hndash2raquoL+3 (24) 31 44682 2238 0337 Hndash5raquoL+1 (10)
Hndash2raquoL+4 (23) 32 45379 2204 0144 Hndash6raquoLUMO (14)
Hndash3raquoL+2 (26) Hndash2raquoL+4 (11)
33 45386 2203 0142 Hndash6raquoL+1 (14) Hndash4raquoL+2 (26) Hndash2raquoL+3 (11)
34 45673 2189 0000 Hndash6raquoL+2 (30) Hndash6raquoL+5 (14)
35 46062 2171 0002 Hndash1raquoL+8 (11) Hndash1raquoL+11 (15) HOMOraquoL+9 (11) HOMOraquoL+12 (15)
36 46297 2160 0269 HOMOraquoL+6 (55) 37 46298 2160 0270 Hndash1raquoL+6 (55) 38 46720 2140 0000 Hndash6raquoL+2 (10)
Hndash2raquoL+5 (43) 39 47065 2125 0000 HOMOraquoL+10 (39)
HOMOraquoL+13 (17) 40 47068 2125 0000 Hndash1raquoL+10 (39)
Hndash1raquoL+13 (17) 41 47263 2116 0003 Hndash4raquoL+4 (25)
Hndash3raquoL+3 (32) 42 47264 2116 0003 Hndash4raquoL+3 (29)
Hndash3raquoL+4 (29) 43 47315 2113 0005 Hndash4raquoL+4 (37)
Hndash3raquoL+3 (30) 44 47506 2105 0018 Hndash5raquoL+5 (15)
Hndash1raquoL+16 (12) HOMOraquoL+17 (12)
45 47550 2103 0000 Hndash1raquoL+17 (12) HOMOraquoL+16 (12)
46 48006 2083 0079 Hndash5raquoL+3 (13) Hndash3raquoL+5 (25) Hndash2raquoL+4 (17)
47 48008 2083 0079 Hndash5raquoL+4 (13) Hndash4raquoL+5 (25) Hndash2raquoL+3 (17)
48 48231 2073 0000 Hndash2raquoL+7 (10) 49 48814 2049 0013 Hndash4raquoL+7 (10)
HOMOraquoL+13 (12) 50 48816 2048 0013 Hndash3raquoL+7 (10)
Hndash1raquoL+13 (12)
[a] Oscillator strength [b] Contributions smaller than 10 are
not included H = HOMO L = LUMO Orbitals are numbered
consecutively regardless of possible degeneracies
S31
Table S4 TD-DFT electronic transitions calculated for 2-Et
No Energy (cmndash1)
λ (nm)
f[a] Major excitations[b]
1 27464 3641 0000 Hndash2raquoL+2 (11) Hndash1raquoL+1 (11) HOMOraquoLUMO (67)
2 30357 3294 1476 Hndash2raquoLUMO (11) Hndash1raquoLUMO (29) HOMOraquoL+1 (31)
3 30357 3294 1476 Hndash2raquoLUMO (29) Hndash1raquoLUMO (11) HOMOraquoL+2 (31)
4 30778 3249 0000 Hndash3raquoLUMO (21) HOMOraquoL+3 (30)
5 32594 3068 0000 Hndash4raquoLUMO (29) Hndash2raquoL+5 (10) Hndash1raquoL+4 (10) HOMOraquoL+7 (16)
6 32743 3054 0451 Hndash5raquoLUMO (15) Hndash1raquoL+3 (11) HOMOraquoL+4 (17)
7 32743 3054 0451 Hndash6raquoLUMO (15) Hndash2raquoL+3 (11) HOMOraquoL+5 (17)
8 34634 2887 0000 Hndash7raquoLUMO (15) Hndash4raquoL+3 (10) Hndash2raquoL+1 (18) Hndash1raquoL+2 (18)
9 35256 2836 0000 Hndash3raquoL+3 (35) 10 35733 2799 0134 Hndash2raquoLUMO (13)
Hndash1raquoL+3 (25) HOMOraquoL+2 (10)
11 35733 2799 0134 Hndash2raquoL+3 (25) Hndash1raquoLUMO (13) HOMOraquoL+1 (10)
12 36277 2757 0000 Hndash3raquoLUMO (30) HOMOraquoL+3 (36)
13 37002 2703 1295 Hndash3raquoL+1 (11) Hndash2raquoLUMO (14)
14 37002 2703 1295 Hndash3raquoL+2 (11) Hndash1raquoLUMO (14)
15 37160 2691 0000 HOMOraquoL+6 (30) 16 37559 2662 0000 Hndash2raquoL+1 (31)
Hndash1raquoL+2 (31) 17 39296 2545 0000 Hndash3raquoL+6 (10)
Hndash2raquoL+2 (10) Hndash1raquoL+1 (10) HOMOraquoLUMO (11)
18 39531 2530 0000 Hndash6raquoL+1 (20) Hndash5raquoL+2 (20) Hndash4raquoL+3 (12) Hndash4raquoL+6 (11)
19 39596 2526 0260 Hndash6raquoLUMO (12) Hndash5raquoLUMO (20) HOMOraquoL+4 (17)
20 39596 2526 0260 Hndash6raquoLUMO (20) Hndash5raquoLUMO (12) HOMOraquoL+5 (17)
21 40255 2484 0000 Hndash4raquoLUMO (34) Hndash2raquoL+5 (10) Hndash1raquoL+4 (10) HOMOraquoL+7 (16)
22 40779 2452 1425 Hndash5raquoL+6 (12) Hndash4raquoL+4 (11)
23 40779 2452 1425 Hndash6raquoL+6 (12) Hndash4raquoL+5 (11)
No Energy (cmndash1)
λ (nm)
f[a] Major excitations[b]
24 41247 2424 0000 Hndash6raquoL+5 (12) Hndash5raquoL+4 (12) Hndash4raquoL+3 (23) Hndash4raquoL+6 (10)
25 41333 2419 0000 Hndash2raquoL+4 (10) Hndash1raquoL+5 (10) HOMOraquoLUMO (14)
26 41833 2390 0000 Hndash8raquoLUMO (33) HOMOraquoL+6 (22)
27 41948 2384 0000 Hndash6raquoL+2 (21) Hndash5raquoL+1 (21) Hndash3raquoL+6 (13)
28 41950 2384 0049 Hndash1raquoL+3 (18) 29 41950 2384 0049 Hndash2raquoL+3 (18) 30 42959 2328 0315 Hndash1raquoL+7 (17) 31 42959 2328 0315 Hndash2raquoL+7 (17) 32 43157 2317 0000 Hndash3raquoLUMO (24)
Hndash2raquoL+2 (11) Hndash1raquoL+1 (11) HOMOraquoL+3 (14)
33 43630 2292 0000 Hndash2raquoL+4 (24) Hndash2raquoL+5 (10) Hndash1raquoL+4 (10) Hndash1raquoL+5 (24)
34 43830 2282 0000 HOMOraquoL+8 (67) 35 44243 2260 0259 Hndash1raquoL+3 (14) 36 44243 2260 0259 Hndash2raquoL+3 (14) 37 44386 2253 0000 Hndash7raquoLUMO (60) 38 44892 2228 0092 Hndash6raquoLUMO (10)
HOMOraquoL+4 (12) 39 44892 2228 0092 Hndash5raquoLUMO (10)
HOMOraquoL+5 (12) 40 45020 2221 0000 Hndash7raquoL+3 (21)
HOMOraquoL+7 (38) 41 45432 2201 0000 Hndash1raquoL+8 (29)
HOMOraquoL+10 (27) 42 45432 2201 0000 Hndash2raquoL+8 (29)
HOMOraquoL+11 (27) 43 45718 2187 0000 Hndash3raquoLUMO (10)
Hndash2raquoL+5 (15) Hndash1raquoL+4 (15) HOMOraquoL+6 (14)
44 45744 2186 0000 Hndash6raquoL+1 (27) Hndash5raquoL+2 (27) Hndash4raquoLUMO (27)
45 45988 2174 0077 Hndash10raquoLUMO (11) Hndash1raquoL+6 (25)
46 45988 2174 0077 Hndash9raquoLUMO (11) Hndash2raquoL+6 (25)
47 46161 2166 0000 Hndash3raquoL+3 (45) 48 46311 2159 0000 Hndash3raquoL+7 (13)
HOMOraquoL+9 (34) 49 46427 2154 0000 HOMOraquoL+12 (52)
HOMOraquoL+23 (11) 50 46916 2131 0194 Hndash7raquoL+1 (13)
Hndash7raquoL+2 (11)
[a] Oscillator strength [b] Contributions smaller than 10 are
not included H = HOMO L = LUMO Orbitals are numbered
consecutively regardless of possible degeneracies
S32
Table S5 Crystal data and structure refinement for 3-EtmiddotCH2Cl2
Identification code mm01a
Empirical formula C57H48Br6CH2Cl2
Formula weight 129735
Temperature 100(2) K
Wavelength 071073 Aring
Crystal system Triclinic
Space group P-1
Unit cell dimensions a = 13600(4) Aring = 10628(5)deg
b = 14111(5) Aring = 9405(4)deg
c = 16306(5) Aring = 11805(5)deg
Volume 2574(2) Aring
Z 2
Density (calculated) 1674 Mgm3
Absorption coefficient 4821 mm-1
F(000) 1284
Crystal size 037 x 014 x 003 mm3
Theta range for data collection 287 to 3059deg
Index ranges -19lt=hlt=17 -19lt=klt=19 -13lt=llt=23
Reflections collected 20444
Independent reflections 14059 [R(int) = 00424]
Completeness to theta = 2550deg 996
Absorption correction Analytical
Max and min transmission 0867 and 0381
Refinement method Full-matrix least-squares on F2
Data restraints parameters 14059 0 595
Goodness-of-fit on F2 1023
Final R indices [Igt2sigma(I)] R1 = 00597 wR2 = 00951
R indices (all data) R1 = 01047 wR2 = 01138
Largest diff peak and hole 090 and -097 e Aring-3
S33
Table S6 Crystal data and structure refinement for 4-EtmiddotC7H8
Identification code dstem1
Empirical formula C76H64Br8C7H8
Formula weight 170869
Temperature 79(9) K
Wavelength 071073 Aring
Crystal system Orthorhombic
Space group P b c n
Unit cell dimensions a = 29202(12) Aring = 90deg
b = 17637(1) Aring = 90deg
c = 14745(8) Aring = 90deg
Volume 7594(1) Aring3
Z 4
Density (calculated) 1575 Mgm3
Absorption coefficient 4271 mm-1
F(000) 3600
Crystal size 053 x 044 x 038 mm3
Theta range for data collection 279 to 3074deg
Index ranges -41lt=hlt=34 -14lt=klt=25 -19lt=llt=20
Reflections collected 34296
Independent reflections 10861 [R(int) = 00362]
Completeness to theta = 2550deg 998
Absorption correction Analytical
Max and min transmission 0325 and 0231
Refinement method Full-matrix least-squares on F2
Data restraints parameters 10861 0 412
Goodness-of-fit on F2 1025
Final R indices [Igt2sigma(I)] R1 = 00496 wR2 = 01165
R indices (all data) R1 = 00837 wR2 = 01342
Largest diff peak and hole 2893 and -0701 eAring-3
S34
Figure S19 1H NMR spectrum of S5 (chloroform-d 600 MHz 300 K there are some solubility problems)
Figure S20 13C NMR spectrum of S5 (chloroform-d 151 MHz 300 K there are some solubility problems)
100 95 90 85 80 75 70 65 60 55 50 45 40 35 30 25 20 15 10 05 ppm
03
1
12
3
15
5
20
0
22
5
72
4 S
77
0
77
3
83
7
310
230
301
083
098
100
210 200 190 180 170 160 150 140 130 120 110 100 90 80 70 60 50 40 30 20 10 0 ppm
83
6
84
6
251
5
297
8
323
5327
3
568
2
770
1 S
1117
2
1163
6
1229
4
1263
1
1346
6
1369
8
1508
0
1681
6
S35
Figure S21 1H NMR spectrum of S6 (chloroform-d 600 MHz 300 K)
Figure S22 13C NMR spectrum of S6 (chloroform-d 600 MHz 300 K)
95 90 85 80 75 70 65 60 55 50 45 40 35 30 25 20 15 10 05 00 ppm
03
1
08
2
12
4
15
3
18
5
40
7
66
5
72
4 S
75
3
308
205
201
105
100
210 200 190 180 170 160 150 140 130 120 110 100 90 80 70 60 50 40 30 20 10 0 ppm
84
2
330
4
557
5
770
0 S
1081
1
1104
1
1226
1
1334
0
1422
9
1499
5
S36
Figure S23 1H NMR spectrum of S7 (chloroform-d 600 MHz 300 K)
Figure S24 13C NMR spectrum of S7 (chloroform-d 151 MHz 300 K)
100 95 90 85 80 75 70 65 60 55 50 45 40 35 30 25 20 15 10 05 ppm
03
1
19
3
24
0
72
4 S
77
7
78
9
300
207
104
100
210 200 190 180 170 160 150 140 130 120 110 100 90 80 70 60 50 40 30 20 10 0 ppm
84
6
323
1
562
2
770
2 S
1004
5
1240
9
1283
0
1347
2
1502
6
S37
Figure S25 1H NMR spectrum of S8 (chloroform-d 600 MHz 300 K)
Figure S26 13C NMR spectrum of S8 (chloroform-d 151 MHz 300 K)
105 100 95 90 85 80 75 70 65 60 55 50 45 40 35 30 25 20 15 10 05 ppm
02
7
20
7
72
4 S
79
1
79
9
104
3
304
205
104
100
097
210 200 190 180 170 160 150 140 130 120 110 100 90 80 70 60 50 40 30 20 10 0 ppm
84
1
321
1
569
0
770
1 S
1242
3
1263
3
1265
4
1332
6
1457
3
1511
2
1918
2
S38
Figure S27 1H NMR spectrum of S9 (chloroform-d 600 MHz 300 K)
Figure S28 13C NMR spectrum of S9 (chloroform-d 151 MHz 300 K)
95 90 85 80 75 70 65 60 55 50 45 40 35 30 25 20 15 10 05 00 ppm
02
7
15
0
15
3
20
1
48
1
72
4 S
74
2
78
1
305
297
205
103
100
210 200 190 180 170 160 150 140 130 120 110 100 90 80 70 60 50 40 30 20 10 0 ppm
84
8
324
5
563
7
654
5
770
4 S
1210
4
1233
0
1241
1
1387
8
1412
1
1497
8
S39
Figure S29 1H NMR spectrum of S10 (chloroform-d 600 MHz 300 K)
Figure S30 13C NMR spectrum of S10 (chloroform-d 151 MHz 300 K)
95 90 85 80 75 70 65 60 55 50 45 40 35 30 25 20 15 10 05 ppm
03
0
15
2
20
0
47
7
72
4 S
74
1
78
6
303
207
203
104
100
210 200 190 180 170 160 150 140 130 120 110 100 90 80 70 60 50 40 30 20 10 0 ppm
84
9
323
6
466
7
564
0
770
7 S
1229
3
1247
6
1253
2
1359
6
1417
5
1501
8
S40
Figure S31 1H NMR spectrum of S11 (chloroform-d 600 MHz 300 K)
Figure S32 13C NMR spectrum of S11 (chloroform-d 151 MHz 300 K)
80 75 70 65 60 55 50 45 40 35 30 25 20 15 10 05 00 ppm
-01
8
14
0
25
1
58
0
72
4 S
72
7
75
976
0
76
9
77
6
301
207
199
100
108
605
607
309
210 200 190 180 170 160 150 140 130 120 110 100 90 80 70 60 50 40 30 20 10 0 ppm
84
2
311
6
314
7
561
6
770
1 S
1171
5
1177
1
1243
8
1257
21269
8
1279
9
1301
8
1343
5
1351
21412
4
1502
7
S41
Figure S33 1H NMR spectrum of 3-Et (chloroform-d 500 MHz 300 K)
Figure S34 13C NMR spectrum of 3-Et (chloroform-d 151 MHz 300 K)
95 90 85 80 75 70 65 60 55 50 45 40 35 30 25 20 15 10 05 00 ppm
01
1
08
6
13
5
15
1
21
5
68
7
68
8
72
4 S
76
3
304
202
102
101
100
210 200 190 180 170 160 150 140 130 120 110 100 90 80 70 60 50 40 30 20 10 0 ppm
87
2
297
1
310
6
547
8
770
1 S
1220
6
1236
4
1252
7
1324
3
1366
2
1401
8
1495
9
S42
Figure S35 1H NMR spectrum of 4-Et (chloroform-d 500 MHz 300 K)
Figure S36 13C NMR spectrum of 4-Et (chloroform-d 151 MHz 300 K)
95 90 85 80 75 70 65 60 55 50 45 40 35 30 25 20 15 10 05 00 ppm
00
2
08
7
14
2
15
3
67
7
70
1
72
4 S
78
2
304
207
098
096
100
210 200 190 180 170 160 150 140 130 120 110 100 90 80 70 60 50 40 30 20 10 0 ppm
85
5
313
0
555
5
770
0 S
1230
1
1242
61248
3
1308
0
1361
8
1405
5
1496
3
S43
Figure S37 1H NMR spectrum of 1-Et (chloroform-d 600 MHz 300 K)
Figure S38 13C NMR spectrum of 1-Et (chloroform-d 151 MHz 300 K)
95 90 85 80 75 70 65 60 55 50 45 40 35 30 25 20 15 10 05 00 ppm
-04
1
11
9
15
1
20
9
23
1
72
4 S
76
1
76
3
92
7
148
154
101
104
101
101
100
210 200 190 180 170 160 150 140 130 120 110 100 90 80 70 60 50 40 30 20 10 0 ppm
82
6
100
9
298
0
354
9
594
0
770
0
1171
3
1231
9
1263
7
1309
4
1315
6
1417
9
1495
1
S44
Figure S39 1H NMR spectrum of 2-Et (chloroform-d 500 MHz 300 K there are some solubility problems)
Figure S40 13C NMR spectrum of 2-Et (chloroform-d 151 MHz 300 K there are some solubility problems)
05101520253035404550556065707580859095 ppm
04
2
08
2
12
4
13
2
14
1
15
1
23
0
72
4 S
78
4
79
1
97
0
305
207
103
104
100
210 200 190 180 170 160 150 140 130 120 110 100 90 80 70 60 50 40 30 20 10 0 ppm
83
9
344
0
543
0
770
1 S
1144
2
1230
8
1272
8
1308
4
1324
4
1412
2
1491
0
S45
Figure S41 High resolution mass spectrum of S5 (ESI+ top experimental bottom simulated)
Figure S42 High resolution mass spectrum of S6 (ESI+ top experimental bottom simulated)
4930133
4940168
4950110
4960144
4970086
4980122
MM Mm12_000002d +MS
4930121
4940154
4950102
4960134
4970081
4980113
MM Mm12_000002d C21H22Br2N2O2 M+nH 4930100
05
10
15
20
25
8x10
Intens
0
500
1000
1500
2000
491 492 493 494 495 496 497 498 499 mz
4085388
4089913
40965534099825
4109892
4119922
4129871
41399044143762 4146416
MM Mm13_000001d +MS
4089910
4099943
4109890
4119922
4129869
4139902
MM Mm13_000001d C17H18Br2N2 M+nH 4089900
05
10
15
20
7x10
Intens
0
500
1000
1500
2000
408 409 410 411 412 413 414 mz
S46
Figure S43 High resolution mass spectrum of S8 (APCI+ top experimental bottom simulated)
Figure S44 High resolution mass spectrum of S9 (APCI+ top experimental bottom simulated)
4349595
4359630
4369580
4379615
4389564
+MS 06min 33
4349590
4359623
4369570
4379603
4389550
C19H16Br2O2 M+nH 434960
1
2
3
4
5
5x10
Intens
0
500
1000
1500
2000
434 435 436 437 438 439 mz
4379771
4389670
4399738
4409660
4419725
4429605
+MS 03min 17
4379825
4389858
4399805
4409838
4419784
4429817
C19H20Br2O2 M 4379800
02
04
06
08
10
12
5x10
Intens
0
500
1000
1500
2000
438 439 440 441 442 443 mz
S47
Figure S45 High resolution mass spectrum of S10 (APCI+ top experimental bottom simulated)
Figure S46 High resolution mass spectrum of S11 (APCI+ top experimental bottom simulated)
4739290
4749220
4759252
4769225
4779232
4789245
4799238
4810399
4819735
+MS 02min 10
4739147
4749180
4759125
4769160
4779098
4789131
4799077
48091104819047
C19H18Br2Cl2 M 473920
2
4
6
4x10
Intens
0
500
1000
1500
2000
474 475 476 477 478 479 480 481 482 mz
4640799
4645815
4650787
4655801
4660775
4665789
4670804
MM Mm18_000002d +MS
4640794
4645810
4650787
4655800 4660775
4665790
4670807
MM Mm18_000002d C55H48Br2P2 M 928160
1
2
3
4
8x10
Intens
0
500
1000
1500
2000
4635 4640 4645 4650 4655 4660 4665 4670 4675 mz
S48
Figure S47 High resolution mass spectrum of 3-Et (APCI+ top experimental bottom simulated)
Figure S48 High resolution mass spectrum of 4-Et (APCI+) top experimental bottom simulated)
1205902312069040
12078963
12088989
12098947
12108956 12118937
12128940
12138943
12148938
12158953
12168951
12178982
12188994
+MS 01min 8
1205885112068884
12078830
12088864
12098811
12108844
12118801
12128823
12138772
12148803
12158751
12168782
12178815
12188762
C57H48Br6 M 1205890
1
2
3
4x10
Intens
0
500
1000
1500
2000
1206 1208 1210 1212 1214 1216 1218 mz
16098954
16108932
16118882
16128844
16138820
16148810
16158804
16168795
16178794
16188779
16198797
16208784
16218822
16228836
1623890416249000 16259203
+MS 02min 14
1609844916108483
16118429
16128462
16138410
16148442
16158408
16168422
16178371
16188402
16198350
16208381
16218413
16228360
16238393
C76H64Br8 M 16078500
02
04
06
08
10
5x10
Intens
0
500
1000
1500
2000
2500
1608 1610 1612 1614 1616 1618 1620 1622 1624 1626 mz
S49
Figure S49 High resolution mass spectrum of 1-Et (APCI+ top experimental bottom simulated)
Figure S50 High resolution mass spectrum of 2-Et (APCI+ top experimental bottom simulated)
7333834
7343867
7353903
7363940 7374065
+MS 06min 35
7333829
7343862
7353896
7363929
C57H48 M+nH 7333800
05
10
15
20
5x10
Intens
0
500
1000
1500
2000
733 734 735 736 737 738 mz
9775294
9785336
9795377
9805409
9815431
+MS 05min 28
9775081
9785114
9795148
9805181
C76H64 M+nH 977510
1
2
3
4
5
6
4x10
Intens
0
500
1000
1500
2000
977 978 979 980 981 982 983 mz
S50
References
(1) Ranger M Rondeau D Leclerc M Macromolecules 1997 30 (25) 7686ndash7691 (2) Li X Xiao Y Qian X Org Lett 2008 10 (13) 2885ndash2888 (3) Bavin P M G Org Synth 1960 40 5 (4) Guo L He S Jian T Lai Y Liu J Nargund R Sebhat I Ujjainwalla F Ye Z Young J
Acylated Spiropiperidine Derivatives as Melanocortin-4 Receptor Agonists WO2004089307 October 22 2004
(5) Frisch M J Trucks G W Schlegel H B Scuseria G E Robb M A Cheeseman J R Scalmani G Barone V Mennucci B Petersson G A Nakatsuji H Caricato M Li X Hratchian H P Izmaylov A F Bloino J Zheng G Sonnenberg J L Hada M Ehara M Toyota K Fukuda R Hasegawa J Ishida M Nakajima T Honda Y Kitao O Nakai H Vreven T Montgomery Jr J A Peralta J E Ogliaro F Bearpark M Heyd J J Brothers E Kudin K N Staroverov V N Kobayashi R Normand J Raghavachari K Rendell A Burant J C Iyengar S S Tomasi J Cossi M Rega N Millam J M Klene M Knox J E Cross J B Bakken V Adamo C Jaramillo J Gomperts R Stratmann R E Yazyev O Austin A J Cammi R Pomelli C Ochterski J W Martin R L Morokuma K Zakrzewski V G Voth G A Salvador P Dannenberg J J Dapprich S Daniels A D Farkas Ouml Foresman J B Ortiz J V Cioslowski J Fox D J Gaussian 09 Revision D01
(6) Becke A D Phys Rev A 1988 38 (6) 3098ndash3100 (7) Becke A D J Chem Phys 1993 98 (7) 5648ndash5652 (8) Lee C Yang W Parr R G Phys Rev B 1988 37 (2) 785ndash789 (9) Tomasi J Mennucci B Cammi R Chem Rev 2005 105 (8) 2999ndash3094 (10) Yanai T Tew D P Handy N C Chem Phys Lett 2004 393 (1ndash3) 51ndash57 (11) Sheldrick G M Acta Crystallogr A 2008 64 (1) 112ndash122
S2
Experimental
General Tetrahydrofuran toluene and NN-dimethylformamide were dried using a commercial
solvent purification system Dichloromethane was distilled from calcium hydride when used as a
reaction solvent All other solvents and reagents were used as received Compounds S11 S22 S33 and
S44 were prepared according to literature procedures 1H NMR spectra were recorded on high-field
spectrometers (1H frequency 50013 or 60013 MHz) equipped with broadband inverse gradient
probeheads Spectra were referenced to the residual solvent signals (chloroform-d 724 ppm) 13C
NMR spectra were recorded with 1H broadband decoupling and referenced to solvent signals
(13CDCl3 770 ppm) High resolution mass spectra were recorded using APCI or ESI ionization in the
positive mode
Computational methods Density functional theory (DFT) calculations were performed using
Gaussian 095 DFT geometry optimizations were carried out in unconstrained C1 symmetry using
molecular mechanics or semiempirical models as starting geometries X-ray geometries were used as
initial models for 3-Et and 4-Et DFT geometries were refined to meet standard convergence criteria
and the existence of a local minimum was verified by a normal mode frequency calculation DFT
calculations were performed using the hybrid functional B3LYP6ndash8 and the 6-31G(dp) basis set
Solvation effects were modeled using the IEFPCM formalism9 with standard solvent
parameterizations chloroform (1H and 13C NMR for 1ndash4-Et) dichloromethane (TD-DFT for 1ndash4-Et)
and NN-dimethylformamide (thermochemistry of the Yamamoto coupling) 1H and 13C shieldings
were calculated using the GIAO approach and referenced to the absolute TMS shieldings calculated
at the same level of theory (317454 ppm for 1H and 1920973 ppm for 13C) NICS scans were
performed with gas-phase calculated GIAO shieldings Electronic transitions were calculated by
means of time-dependent DFT (TD-DFT) All TD-DFT calculations were performed at the CAM-
B3LYP6-311+G(dp)6-31G(dp) level of theory10 using dichloromethane solvation
X-ray crystallography X-ray quality crystals were grown by slow diffusion of methanol into a toluene
solution of 3 same method was used to get crystals of 4 Diffraction measurements were performed
on a к-geometry Ruby PX diffractometer (ω scans) with graphite-monochromatized Mo Kα radiation
The data for 3 and 4 were collected at 100 K and 80 K respectively corrected for Lorenz and
polarization effects Data collection cell refinement data reduction and analysis were carried out
with the Xcalibur PX software CRYSALIS CCD and CRYSALIS RED respectively (Oxford Diffraction Ltd
Abignon England 2009) An analytical absorption correction was applied for the data of 3 and 4 with
use of CRYSALIS RED Both structures were solved by direct methods with the SHELXS-97 program
and refined using SHELXL-9711 with anisotropic thermal parameters for non-H atoms In the final
refinement cycles all H atoms were treated as riding atoms in geometrically optimized positions
CCDC 1407282 and 1407283 contain the supplementary crystallographic data for this paper These
data can be obtained free of charge from the Cambridge Crystallographic Data Centre via
wwwccdccamacukdata_requestcif
Photoluminescence Photoluminescence excitation (PLE) spectra as well as decay kinetics (DEC) were
taken with the FSL980-sm Fluorescence Spectrometer from Edinburgh Instruments Ltd A 450 W
Xenon arc lamp (PL and PLE) and a Super Continuum Fianium laser were used as excitation sources
Emission spectra were corrected for the recording system efficiency and excitation spectra were
corrected for the incident light intensity The quantum yield measurements were performed by using
an Edinburgh Instruments integrating sphere equipped with a small elliptical mirror and a baffle plate
for beam steering and shielding against directly detected light For the measurement the integrating
S3
sphere replaces the standard sample holder inside the sample chamber Calculations of quantum
yields were made using the software provided by Edinburgh Instruments
S4
Synthesis
NN-(36-dibromo-99-diethyl-9H-fluorene-27-diyl)diacetamide (S5) In a 500 mL round-bottomed
flask equipped with a stirring bar compound S4 (215 g 639 mmol) was dissolved in dry NN-
dimethylformamide (250 mL) under nitrogen atmosphere The solution was kept under dark and
bromine (819 mL 160 mmol) was added dropwise The mixture was stirred under nitrogen for 20
hours After that water (1 L) was added and a yellow-brown precipitate was formed The mixture was
filtered under reduced pressure and the precipitate was dried in vacuo The resulting product did not
require further purification (170 g 864) 1H NMR (600 MHz chloroform-d 300 K) δ 837 s 2H) δ
773 (s 2H) δ 770 (s 2H) δ 225 (s 6H) δ 200 (q 4H 3J = 73 Hz) δ 031 (t 6H 3J = 73 Hz) 13C NMR
(151 MHz chloroform-d 300 K) δ 16816 15080 13698 13466 12631 12294 11636 11172
5682 3273 3235 2978 2515 846 836 HRMS (ESI+) mz [M + H]+ Calcd for C21H23Br2N2O2
4930133 Found 4930121
36-dibromo-99-diethyl-9H-fluorene-27-diamine (S6) To a 2000 mL round-bottomed flask
equipped with a reflux condenser and a stirring bar compound S5 (316 g 639 mmol) was dissolved
in methanol (1000 mL) Potassium hydroxide (574 g 1020 mmol) was added to the mixture under
nitrogen The mixture was heated to 90 degC and stirred for 18 hours The solvent was removed on a
rotary evaporator and the product in the form of red-brown crystals was formed and used without
further purification (260 g 991 ) 1H NMR (600 MHz chloroform-d 300 K) δ 753 (s 2H) δ 665 (s
2H) δ 406 (s 4H) δ 185 (q 4H 3J = 74 Hz) δ 031 (t 6H 3J = 74 Hz) 13C NMR (151 MHz
chloroform-d 300 K) δ 14995 14229 13340 12261 11041 10811 5575 3304 842 HRMS
(ESI+) mz [M + H]+ Calcd for C17H19Br2N2 4089910 Found 4089913
36-dibromo-99-diethyl-27-diiodo-9H-fluorene (S7) In a round-bottomed flask equipped with a
magnetic stirring bar compound S6 (260 g 634 mmol) was suspended in a 10 water solution of
sulfuric acid The suspension was cooled to room temperature and further cooled to 0 degC in an ice
bath Aqueous solution of sodium nitrite (175 g 254 mmol in 90 mL of water) was added dropwise
to the suspension and stirred for 45 min To the solution potassium iodide (10523 g 634 mmol)
dissolved in 90 mL of water was added slowly The resulting solution was allowed to reach room
temperature and was stirred for 1 hour Aqueous solution of sodium sulphite (1 L) was added and the
mixture was extracted with dichloromethane The organic layers were combined dried with
anhydrous sodium sulphate filtered and the solvent was removed on a rotary evaporator The crude
product was purified by column chromatography (silicagel dichloromethane) The first fraction was
S5
collected and concentrated on a rotary evaporator to yield yellow-brown crystals (25 g 624 ) 1H
NMR (600 MHz chloroform-d 300 K) δ 789 (s 2H) δ 777 (s 2H) δ 193 (q 4H 3J = 74 Hz) δ 031
(t 6H 3J = 74 Hz) 13C NMR (151 MHz chloroform-d 300 K) δ 15026 13472 12830 12409
10045 5622 3231 886
36-dibromo-99-diethyl-9H-fluorene-27-dicarbaldehyde (S8) In a 500 mL round-bottomed flask
equipped with a stirring bar and septum compound S7 (118 g 187 mmol) was dissolved in dry
tetrahydrofuran (300 mL) under nitrogen atmosphere The solution was cooled in an acetone‒liquid
nitrogen bath to ‒78 degC and a solution of isopropylmagnesium chloride (1961 mL 392 mmol 2 M
solution in tetrahydrofuran) was added dropwise After stirring for 15 minutes dry NN-
dimethylformamide (578 mL 747 mmol) was added and the solution was allowed to reach room
temperature and was stirred for an additional hour Aqueous solution of ammonium chloride was
added and the reaction mixture was extracted with dichloromethane The organic layers were
combined dried over anhydrous sodium sulphate filtered and the solvent was removed on a rotary
evaporator The crude product was purified by column chromatography (silicagel
dichloromethane‒hexanes = 21) The third fraction was collected and concentrated on a rotary
evaporator to give orange crystals (538 g 661 ) 1H NMR (600 MHz chloroform-d 300 K) δ 1043
(s 2H) δ 799 (s 2H) δ 790 (s 2H) δ 207 (q 4H 3J = 74 Hz) δ 027 (t 6H 3J = 74 Hz) 13C NMR (151
MHz chloroform-d 300 K) δ 19181 15112 14573 13326 12654 12633 12423 5690 3211
841 HRMS (APCI) mz [M + H]+ Calcd for C19H17Br2O2 4349590 Found 4349595
(36-dibromo-99-diethyl-9H-fluorene-27-diyl)dimethanol (S9) In a 50 mL round-bottomed flask
equipped with a magnetic stirring bar compound S8 (500 mg 12 mmol) and sodium borohydride
(130 mg 34 mmol) were suspended in dry tetrahydrofuran (25 mL) The mixture was stirred in room
temperature overnight after which a yellow precipitate was formed Water (30 mL) was added and
then the mixture was extracted with dichloromethane Combined organic extracts were dried with
anhydrous sodium sulphate and filtered Solvents were removed on a rotary evaporator yielding an
orange-brown crystals (482 mg 955 ) The product was used without further purification 1H NMR
(600 MHz chloroform-d 300 K) δ 780 (s 2H) δ 742 (s 2H) δ 481 (d 4H J = 64 Hz) δ 200 (q 4H 3J = 73 Hz) δ 027 (t 6H 3J = 73 Hz) 13C NMR (151 MHz chloroform-d 300 K) δ 14978 14121
13878 12411 12330 12104 6545 5637 3245 848 HRMS (APCI) mz [M ]+ Calcd for
C19H20Br2O2 4379825 Found 4379771
S6
36-dibromo-27-bis(chloromethyl)-99-diethyl-9H-fluorene (S10) In a 50 mL round-bottomed flask
equipped with a magnetic stirring bar compound S9 (500 mg 11 mmol) was dissolved in freshly
distilled dichloromethane (15 mL) to which catalytic amounts of NN-dimethylformamide (25 microL)
were added With continuous stirring thionyl chloride (181 microL 25 mmol) was added to the reaction
mixture After one hour of stirring the solvent and excess of thionyl chloride were removed on a
rotary evaporator yielding a brown crystals (520 mg 960 ) The product was used without further
purification 1H NMR (600 MHz chloroform-d 300 K) δ 786 (s 2H) δ 741 (s 2H) δ 476 (s 4H) δ
200 (q 4H 3J = 73 Hz) δ 030 (t 6H 3J = 73 Hz) 13C NMR (151 MHz chloroform-d 300 K) δ 15018
14175 13596 12532 12476 12293 5640 4667 3236 848 HRMS (APCI) mz [M ]+ Calcd for
C19H18Br2Cl2 4739147 Found 4739290
36-dibromo-2-chloromethyl-7-triphenylphosphine-99-diethyl-9H-fluorene (S11) In a 50 mL
pressure tube equipped with a magnetic stirring bar compound S10 (550 mg 12 mmol) and
triphenylphosphine (907 mg 346 mmol) were dissolved in dry toluene (25 mL) The reaction mixture
was sealed heated at 120 degC and stirred for 12 hours after which time a yellow precipitate was
formed The reaction mixture was cooled to room temperature diluted with dichloromethane and
the solvents were removed on a rotary evaporator The precipitate was washed with hexane and
dried yielding yellow-white crystals (1035 g 895 ) 1H NMR (600 MHz chloroform-d 300 K) δ
776 (t 6H 3J = 726 Hz) δ 769 (m 12H) δ 760 (m 12H) δ 759 (s 2H) δ 727 (s 2H) δ 580 (d 4H 3J = 144 Hz) δ 140 (q 4H 3J = 72 Hz) δ -018 (t 6H 3J = 72 Hz) 13C NMR (151 MHz chloroform-d
300 K) δ 15027 14124 13511 13435 13018 12799 12698 12572 12438 11771 11715
5616 3147 842 HRMS (ESI+) mz [M2+] Calcd for C55H48Br2P2 4640793 Found 4640799
S7
(33rsquo3rsquorsquo66rsquo6rsquorsquo-hexabromo-99rsquo9rsquorsquo9rsquorsquorsquo9rsquorsquorsquorsquo9rsquorsquorsquorsquorsquo-hexaethyl)[222]-(27)-fluorenophanetriene (3-Et)
To a 250 mL three-necked round-bottomed flask equipped with a reflux condenser septum and
syringe pump adapter were placed zinc powder (2250 mg 344 mmol) and copper(I) iodide (210 mg
11 mmol) The apparatus was filled with nitrogen and oxygen-free tetrahydrofuran (130 mL) was
introduced through a syringe Titanium tetrachloride (189 mL 172 mmol) was added dropwise the
septum was replaced with a glass stopper and the reaction mixture was heated and stirred under
reflux for 3 hours Subsequently a solution of compound S8 (100 mg 023 mmol) in oxygen-free
tetrahydrofuran (50 mL) was added to the reaction mixture using a syringe pump in 3 hours and the
mixture was stirred under reflux for another 12 hours After that time it was cooled down to room
temperature Aqueous ammonia (5 150 mL) was added and the mixture was stirred for 1 hour
Extraction with dichloromethane followed by drying the combined organic layers over anhydrous
sodium sulphate and removing the solvents on a rotary evaporator gave a yellow-green solid It was
purified using column chromatography (silicagel dichloromethanehexane = 110) yielding pale
green crystals (16 mg 173 ) 1H NMR (500 MHz chloroform-d 300 K) δ 763 (s 6H) δ 688 (s 6H)
δ 687 (s 6H) δ 135 (q 12H 3J = 74 Hz) δ 011 (t 18H 3J = 74 Hz) 13C NMR (600 MHz chloroform-
d 300 K) δ 14959 14018 13662 13243 12527 12364 12206 5478 3106 872 HRMS
(APCI+) mz [M ]+ Calcd for C57H48Br6 12058851 Found 12059023
(33rsquo3rsquorsquo3rsquorsquorsquo66rsquo6rsquorsquo6rsquorsquorsquo-octabromo-99rsquo9rsquorsquo9rsquorsquorsquo9rsquorsquorsquorsquo9rsquorsquorsquorsquorsquo9rsquorsquorsquorsquorsquorsquo9rsquorsquorsquorsquorsquorsquorsquo-octaethyl)[2222]-(27)-
fluorenephanetetraene (4-Et) In a 100 mL round-bottomed flask compound S8 (79 mg 018 mmol)
and compound S11 (200 mg 019 mmol) were dissolved in freshly distilled oxygen free
dichloromethane (80 mL) Aqueous sodium hydroxide (50 620 microL) was added dropwise to the
solution using a syringe During the addition the mixture was kept under a nitrogen atmosphere and
protected from light After the addition the solution was stirred for 1 hour After that time the
mixture was diluted with water and extracted with dichloromethane Combined extracts were dried
over anhydrous sodium sulphate filtered and the solvent was removed on a rotary evaporator
The crude material was purified using column chromatography (silicagel dichloromethanehexanes =
16) yielding pale green crystals (35 mg 239 ) 1H NMR (500 MHz chloroform-d 300 K) δ 782 (s
S8
8H) δ 701 (s 8H) δ 677 (s 8H) δ 142 (q 16H 3J = 74 Hz) δ 002 (t 24H 3J = 74 Hz) 13C NMR (151
MHz chloroform-d 300 K) δ 14963 14055 13618 13080 12483 12426 12301 5555 3130
855 HRMS (APCI+) mz [M ]+ Calcd for C76H64Br8 16078490 Found 16078971
[3]chrysaorene (1-Et) In a 50 mL Schlenk flask equipped with a magnetic stirring bar compound 3-Et
(22 mg 181 micromol) was placed and the vessel was capped with a septum The atmosphere within the
flask was then changed a few times to nitrogen after which bis(15-cyclooctadiene)nickel(0) (45 mg
016 mmol) and 22rsquo-bibyridyl (26 mg 016 mmol) were added in a glove-box Dry NN-
dimethylformamide (7 mL) was then added to the vessel in a constant flow of nitrogen and the
mixture was sealed with a glass stopper After subsequent changing of the atmosphere to nitrogen
one more time the reaction mixture was heated to 85 degrees and stirred for 18 hours It was then
cooled down to room temperature diluted with water and extracted with dichloromethane The
combined organic extracts were dried over anhydrous sodium sulphate filtered and the solvents
were removed on a rotary evaporator The crude mixture was filtered through a short silica plug to
remove the solid impurities Subsequent purification by column chromatography (silicagel
dichloromethanehexane = 16) gave the product in a form of pale yellow solid (65 mg 489 ) 1H
NMR (600 MHz chloroform-d 300 K) δ 927 (s 6H) δ 763 (s 6H) δ 761 (s 6H) δ 231 (q 6H 3J =
74 Hz) δ 209 (q 6H 3J = 73 Hz) δ 119 (t 9H 3J = 74 Hz) δ -041 (t 9H 3J = 73 Hz) 13C NMR (151
MHz chloroform-d 300 K) δ 14951 14179 13156 13094 12637 12319 11713 5940 3549
2980 1009 826 HRMS (APCI+) mz [M + H]+ Calcd for C57H49 7333829 Found 7333834 UV-vis
(dichloromethane 295 K) [nm] ( in M-1cm-1) 250 (761middot104) 281 (644middot104) 309 (427middot104) 316
(441middot104) 330 (342middot104) 348 (358middot104) 373 (148middot104) 396 (184middot104)
S9
[4]chrysaorene (2-Et) In a 25 mL Schlenk flask equipped with a magnetic stirring bar compound 4-Et
(15 mg 93 micromol) was placed and the vessel was capped with a septum The atmosphere within the
flask was then changed a few times to nitrogen after which bis(15-cyclooctadiene)nickel(0) (31 mg
1110 micromol) and 22rsquo-bibyridyl (17 mg 1110 micromol) were added in a glove-box Dry NN-
dimethylformamide (5 mL) was then added to the vessel in a constant flow of nitrogen and the
mixture was sealed with a glass stopper After subsequent changing of the atmosphere to nitrogen
one more time the reaction mixture was heated to 85 degrees and stirred for 18 hours It was then
cooled down to room temperature diluted with water and extracted with dichloromethane The
combined organic extracts were dried over anhydrous sodium sulphate filtered and the solvents
were removed on a rotary evaporator The crude mixture was filtered through a short silica plug to
remove the solid impurities Subsequent purification by column chromatography (silicagel
dichloromethanehexane = 16) gave the product in a form of pale yellow solid (4 mg 441 ) 1H
NMR (500 MHz chloroform-d 300 K) δ 970 (s 8H) δ 791 (s 8H) δ 784 (s 8H) δ 230 (q 16H 3J =
74 Hz) δ 042 (t 24H 3J = 74 Hz) 13C NMR (151 MHz chloroform-d 300 K) δ 14910 14122
13244 13084 12728 12308 11442 5430 3440 839 HRMS (APCI+) mz [M + H]+ Calcd for
C76H65 97751 Found 97753 UV-vis (dichloromethane 295 K) [nm] ( in M-1cm-1) 265 (244middot104)
296 (133middot104) 313 (167middot104) 319 (169middot104) 341 (206middot104) 366 (115middot104) 384 (126middot104) 398
(699middot103)
S10
Scheme S1 Synthesis of compounds S1-4-Et Reagents and conditions a) fuming HNO3 (20 equiv)
AcOH b) N2H4 (4 equiv) PdC (002 equiv) EtOH c) Ac2O (30 equiv) AcOH d) Br2 (25 equiv) DMF
e) KOH (16 equiv) MeOH f) 1 H2SO4H2O 2 NaNO2 (4 equiv) 3 KI (10 equiv)H2O g) 1 i-PrMgCl
(21 equiv)THF 2 DMF (4 equiv) h) NaBH4 (3 equiv) THF i) SOCl2 (22 equiv) DCM DMF j) PPh3
(3 equiv) toluene k) TiCl4 (75 equiv) CuI (48 equiv) Zn (150 equiv) THF l) NaOHaq (65 equiv)
DCM
S11
Scheme S2 1H and 13C chemical shifts of 3-Et and 4-Et (full assignment based on data obtained from
COSY ROESY HSQC and HMBC experiments)
S12
Scheme S3 1H and 13C chemical shifts of 1-Et and 2-Et (full assignment based on data obtained from
COSY ROESY HSQC and HMBC experiments)
S13
Scheme S4 Macrocyclic conjugation pathways in 1 and 2 [28]- [32]- [36]- and [40]annulene
pathways in 2 are constructed by inclusion of outer parts of phenanthrene units as shown for 1
S14
Figure S1 Molecular structure of 3-Et (co-crystalizing solvent dichloromethane also visible)
S15
Figure S2 Molecular structure of 4-Et (co-crystalizing solvent toluene also visible)
S16
Figure S3 Correlation between 1H NMR chemical shifts of 3-Et derived from experiment (δexptl 500
MHz chloroform-d 300 K) and theory (δcalcd GIAO-B3LYP6-31G(dp)PCM(CHCl3)) Signals in the
experimental spectrum were assigned on the basis of 2D NMR data
Figure S4 Correlation between 13C NMR chemical shifts of 3-Et derived from experiment (δexptl 600
MHz chloroform-d 300 K) and theory (δcalcd GIAO-B3LYP6-31G(dp)PCM(CHCl3)) Signals in the
experimental spectrum were assigned on the basis of 2D NMR data The calculated shift of carbon c
does not include the relativistic effect of the attached Br atom
y = 09915x + 02767Rsup2 = 0997
-1
1
3
5
7
-1 1 3 5 7
δexptl(1H)
δcalcd(1H)
y = 09557x + 5237Rsup2 = 0987
0
20
40
60
80
100
120
140
160
0 20 40 60 80 100 120 140 160
δexptl(13C)
δcalcd(13C)
S17
Figure S5 Correlation between 1H NMR chemical shifts of 4-Et derived from experiment (δexptl 500
MHz chloroform-d 300 K) and theory (δcalcd GIAO-B3LYP6-31G(dp)PCM(CHCl3)) Signals in the
experimental spectrum were assigned on the basis of 2D NMR data
Figure S6 Correlation between 13C NMR chemical shifts of 4-Et derived from experiment 151 MHz
chloroform-d 300 K) and theory (δcalcd GIAO-B3LYP6-31G(dp)PCM(CHCl3)) Signals in the
experimental spectrum were assigned on the basis of 2D NMR data The calculated shift of carbon c
does not include the relativistic effect of the attached Br atom
y = 09944x + 01523Rsup2 = 09985
-1
1
3
5
7
9
-1 1 3 5 7 9
δexptl(1H)
δcalcd(1H)
y = 09686x + 37185Rsup2 = 09891
0
20
40
60
80
100
120
140
160
0 20 40 60 80 100 120 140 160
δexptl(13C)
δcalcd(13C)
S18
Figure S7 Correlation between 1H NMR chemical shifts of 1-Et derived from experiment (δexptl 600
MHz chloroform-d 300 K) and theory (δcalcd GIAO-B3LYP6-31G(dp)PCM(CHCl3)) Signals in the
experimental spectrum were assigned on the basis of 2D NMR data
Figure S8 Correlation between 13C NMR chemical shifts of 1-Et derived from experiment (δexptl 151
MHz chloroform-d 300 K) and theory (δcalcd GIAO-B3LYP6-31G(dp)PCM(CHCl3)) Signals in the
experimental spectrum were assigned on the basis of 2D NMR data
y = 10159x + 00411Rsup2 = 09994
-1
1
3
5
7
9
-1 1 3 5 7 9
δexptl(1H)
δcalcd(1H)
y = 09457x + 42108
Rsup2 = 09986
0
20
40
60
80
100
120
140
160
0 20 40 60 80 100 120 140 160
δexptl(13C)
δcalcd(13C)
S19
Figure S9 Correlation between 1H NMR chemical shifts of 2-Et derived from experiment (δexptl 600
MHz chloroform-d 300 K) and theory (δcalcd GIAO-B3LYP6-31G(dp)PCM(CHCl3)) Signals in the
experimental spectrum were assigned on the basis of 2D NMR data
Figure S10 Correlation between 13C NMR chemical shifts of 2-Et derived from experiment (δexptl 151
MHz chloroform-d 300 K) and theory (δcalcd GIAO-B3LYP6-31G(dp)PCM(CHCl3)) Signals in the
experimental spectrum were assigned on the basis of 2D NMR data
y = 10166x + 0055
Rsup2 = 09994
0
2
4
6
8
10
0 2 4 6 8 10
δexptl(1H)
δcalcd(1H)
y = 09469x + 42433Rsup2 = 09992
0
20
40
60
80
100
120
140
160
0 20 40 60 80 100 120 140 160
δexptl(13C)
δcalcd(13C)
S20
10 20 30 40 50 60 70 80 90 100
1E-3
001
01
1
Log
Norm
lized
In
ten
sity
tns
Model ExpDec1
Equationy = A1exp(-xt1) + y0
Reduced Chi-Sqr 958665E-6
Adj R-Square 099971
Value Standard Error
Normalized1
y0 8E-4 0
A1 808283 001427
t1 392706 000265
k 025464 1719E-4
tau 272203 000184
Model ExpDec1
Equationy = A1exp(-xt1) + y0
Reduced Chi-Sqr 11007E-5
Adj R-Square 099971
Value Standard Error
Normalized1
y0 749513E-4 669951E-5
A1 279424 000238
t1 801384 000459
k 012478 714923E-5
tau 555477 000318
Figure S11 Decay traces of the emissions monitored at 437 nm (1-Et) and 447 nm (2-Et) under 395
nm excitation (Super Continuum Fianium Laser)
S21
Figure S12 Quantum yield determinations for 1-Et (top) and 2-Et (bottom)
S22
Figure S13 Chromaticity diagrams for 1-Et (x = 016 y = 009 and u = 017 v = 022) and 2-Et
(x = 015 y = 01 and u = 015 v = 023)
S23
Figure S14 KohnndashSham frontier orbitals calculated for 1-Et (left) and 2-Et (right) at the
PCM(DCM)B3LYP6-311+G(dp)6-31G(dp) level of theory
S24
Figure S15 Comparison of DFT-optimized geometries of 2-Et (blue) and 5-Et (red B3LYP6-31G(dp)
gas phase)
S25
Figure S16 NICS(1) scans for 2-Et 6-Et and phenanthrene Nuclear shieldings were evaluated 1 Aring
above the ring plane using GIAO-B3LYP6-31G(dp)
-18
-16
-14
-12
-10
-8
-6
-4
-2
0
2
4
-5 0 5 10 15
2-Et
6-Et
phenanthrene
benzenecentroid
chrysaorenecentroid
NICS(1)
scan coordinate
S26
Figure S17 DFT-optimized structure of 3-Et (B3LYP6-31G(dp))
S27
Figure S18 DFT-optimized structure of 4-Et (B3LYP6-31G(dp))
S28
Table S1 Bond length variation between chrysaorenes and the reference system 5-Et[a]
group bond[b]
1-Et 2-Et 5-Et Δ(1-Et ndash 5-Et) Δ(2-Et ndash 5-Et)
rim
ah 1547 1520 1529 0018 ndash0009
ab 1385 1371 1375 0010 ndash0004
bc 1430 1414 1419 0011 ndash0005
cg 1438 1430 1433 0005 ndash0003
gg 1368 1357 1361 0007 ndash0004
mean 0010 ndash0005
hub
ff 1457 1478 1466 ndash0009 0012
ef 1376 1390 1384 ndash0008 0006
de 1406 1419 1414 ndash0008 0005
dd 1458 1465 1460 ndash0002 0005
mean ndash0007 0007
spoke
cd 1427 1432 1431 ndash0004 0001
fa 1416 1422 1421 ndash0005 0001
mean ndash0005 0001
[a] B3LYP6-31G(dp) geometries [b] Bond definitions
S29
Table S2 Computational data for DFT-optimized structures
Structure[a] Functional Basis set Solvation Code[b] Energy[c] [au]
ZPV[d] [au]
lowest freq[e] [cmndash1]
ΔG[f] [au]
1-Et B3LYP 6-31G(dp) gas phase c3Etcont ndash2201155124 0879676 2950 ndash2200349383
B3LYP 6-31G(dp) chloroform c3EtCHCl3cont ndash2201161824 0879472 2952 ndash2200356244
CAM-B3LYP 6-31G(dp) DCM c3Et_S0_CAM ndash2199875261 0890989 2980 ndash2199057629
CAM-B3LYP 6-311+G(dp) DCM ndash2200318806
2-Et B3LYP 6-31G(dp) gas phase c4Et ndash2934960175 1173886 744 ndash2933880899
B3LYP 6-31G(dp) chloroform c4EtCHCl3 ndash2934969275 1173156 620 ndash2933891240
CAM-B3LYP 6-31G(dp) DCM c4Et_S0_CAM ndash2933255625 1188493 341 ndash2932162641
CAM-B3LYP 6-311+G(dp) DCM ndash2933843386
3-Et B3LYP 6-31G(dp) gas phase 3_Et_Xray ndash17631322441 0882496 760 ndash17630536224
B3LYP 6-31G(dp) chloroform 3_Et_XrayCHCl3 ndash17631330429 0881911 922 ndash17630544606
4-Et B3LYP 6-31G(dp) gas phase 4_Et_Xrayf ndash23508440909 1177296 382 ndash23507390923
B3LYP 6-31G(dp) chloroform 4_Et_XrayCHCl3 ndash23508450612 1176343 484 ndash23507401682
5-Et B3LYP 6-31G(dp) gas phase hd2 ndash1392444143 0594712 2031 ndash1391910343
6-Et B3LYP 6-31G(dp) gas phase hd3 ndash2126185352 0888216 1175 ndash2125377818
7 B3LYP 6-31G(dp) gas phase phen_Br2cont ndash5682927318 0195174 2053 ndash5682776848
8 B3LYP 6-31G(dp) gas phase phencont ndash539554443 0194558 9591 ndash539394736
[a] As defined in Scheme 2 [b] Data set name (Cartesian coordinates available as pdb files) [c] Electronic energy [d] Zero-point vibrational energy [e] Lowest vibrational
frequency [f] Gibbs free energy
S30
Table S3 TD-DFT electronic transitions calculated for 1-Et
No Energy (cmndash1)
λ (nm)
f[a] Major excitations[b]
1 27684 3612 0000 Hndash1raquoLUMO (46) HOMOraquoL+1 (46)
2 30217 3309 0351 Hndash2raquoLUMO (14) Hndash1raquoL+1 (13) Hndash1raquoL+2 (33) HOMOraquoLUMO (13)
3 30219 3309 0351 Hndash2raquoL+1 (14) Hndash1raquoLUMO (13) HOMOraquoL+1 (13) HOMOraquoL+2 (34)
4 32329 3093 0001 Hndash4raquoLUMO (18) Hndash3raquoL+1 (19) Hndash1raquoL+3 (16) HOMOraquoL+4 (17)
5 32359 3090 0596 Hndash1raquoL+1 (23) HOMOraquoLUMO (23)
6 32360 3090 0596 Hndash1raquoLUMO (23) HOMOraquoL+1 (23)
7 34583 2892 0010 Hndash1raquoL+1 (42) HOMOraquoLUMO (41)
8 34753 2877 0000 Hndash2raquoL+2 (50) 9 35397 2825 0111 Hndash4raquoL+1 (13)
Hndash3raquoLUMO (13) HOMOraquoL+2 (31) HOMOraquoL+5 (13)
10 35398 2825 0112 Hndash4raquoLUMO (13) Hndash3raquoL+1 (13) Hndash1raquoL+2 (31) Hndash1raquoL+5 (13)
11 36832 2715 0828 Hndash3raquoL+2 (23) Hndash2raquoLUMO (41)
12 36835 2715 0830 Hndash4raquoL+2 (23) Hndash2raquoL+1 (41)
13 38597 2591 0000 Hndash6raquoL+2 (25) Hndash4raquoL+3 (14) Hndash3raquoL+4 (14)
14 39229 2549 0034 Hndash4raquoL+1 (10) Hndash3raquoLUMO (10) HOMOraquoL+5 (37)
15 39231 2549 0033 Hndash4raquoLUMO (10) Hndash3raquoL+1 (10) Hndash1raquoL+5 (37)
16 39445 2535 0126 Hndash4raquoLUMO (26) Hndash3raquoL+1 (26) Hndash1raquoL+3 (16) HOMOraquoL+4 (16)
17 39755 2515 0450 Hndash6raquoL+4 (10) Hndash3raquoL+2 (17) Hndash3raquoL+5 (16)
18 39757 2515 0449 Hndash6raquoL+3 (10) Hndash4raquoL+2 (17) Hndash4raquoL+5 (16)
19 40414 2474 0000 Hndash4raquoL+1 (20) Hndash3raquoLUMO (20) Hndash2raquoL+5 (22)
20 41277 2423 0350 21 41279 2423 0349 22 41695 2398 0174 Hndash6raquoLUMO (44)
Hndash1raquoL+5 (17) 23 41697 2398 0170 Hndash6raquoL+1 (45)
HOMOraquoL+5 (17) 24 43470 2300 0203 Hndash5raquoLUMO (45) 25 43472 2300 0202 Hndash5raquoL+1 (45)
No Energy (cmndash1)
λ (nm)
f[a] Major excitations[b]
26 43798 2283 0000 Hndash6raquoL+2 (10) Hndash4raquoL+1 (10) Hndash3raquoLUMO (10) Hndash2raquoL+2 (28)
27 44207 2262 0081 Hndash1raquoL+7 (26) HOMOraquoL+7 (25)
28 44210 2262 0081 Hndash1raquoL+7 (25) HOMOraquoL+7 (26)
29 44676 2238 0008 Hndash5raquoL+2 (56) 30 44681 2238 0340 Hndash5raquoLUMO (10)
Hndash2raquoL+3 (24) 31 44682 2238 0337 Hndash5raquoL+1 (10)
Hndash2raquoL+4 (23) 32 45379 2204 0144 Hndash6raquoLUMO (14)
Hndash3raquoL+2 (26) Hndash2raquoL+4 (11)
33 45386 2203 0142 Hndash6raquoL+1 (14) Hndash4raquoL+2 (26) Hndash2raquoL+3 (11)
34 45673 2189 0000 Hndash6raquoL+2 (30) Hndash6raquoL+5 (14)
35 46062 2171 0002 Hndash1raquoL+8 (11) Hndash1raquoL+11 (15) HOMOraquoL+9 (11) HOMOraquoL+12 (15)
36 46297 2160 0269 HOMOraquoL+6 (55) 37 46298 2160 0270 Hndash1raquoL+6 (55) 38 46720 2140 0000 Hndash6raquoL+2 (10)
Hndash2raquoL+5 (43) 39 47065 2125 0000 HOMOraquoL+10 (39)
HOMOraquoL+13 (17) 40 47068 2125 0000 Hndash1raquoL+10 (39)
Hndash1raquoL+13 (17) 41 47263 2116 0003 Hndash4raquoL+4 (25)
Hndash3raquoL+3 (32) 42 47264 2116 0003 Hndash4raquoL+3 (29)
Hndash3raquoL+4 (29) 43 47315 2113 0005 Hndash4raquoL+4 (37)
Hndash3raquoL+3 (30) 44 47506 2105 0018 Hndash5raquoL+5 (15)
Hndash1raquoL+16 (12) HOMOraquoL+17 (12)
45 47550 2103 0000 Hndash1raquoL+17 (12) HOMOraquoL+16 (12)
46 48006 2083 0079 Hndash5raquoL+3 (13) Hndash3raquoL+5 (25) Hndash2raquoL+4 (17)
47 48008 2083 0079 Hndash5raquoL+4 (13) Hndash4raquoL+5 (25) Hndash2raquoL+3 (17)
48 48231 2073 0000 Hndash2raquoL+7 (10) 49 48814 2049 0013 Hndash4raquoL+7 (10)
HOMOraquoL+13 (12) 50 48816 2048 0013 Hndash3raquoL+7 (10)
Hndash1raquoL+13 (12)
[a] Oscillator strength [b] Contributions smaller than 10 are
not included H = HOMO L = LUMO Orbitals are numbered
consecutively regardless of possible degeneracies
S31
Table S4 TD-DFT electronic transitions calculated for 2-Et
No Energy (cmndash1)
λ (nm)
f[a] Major excitations[b]
1 27464 3641 0000 Hndash2raquoL+2 (11) Hndash1raquoL+1 (11) HOMOraquoLUMO (67)
2 30357 3294 1476 Hndash2raquoLUMO (11) Hndash1raquoLUMO (29) HOMOraquoL+1 (31)
3 30357 3294 1476 Hndash2raquoLUMO (29) Hndash1raquoLUMO (11) HOMOraquoL+2 (31)
4 30778 3249 0000 Hndash3raquoLUMO (21) HOMOraquoL+3 (30)
5 32594 3068 0000 Hndash4raquoLUMO (29) Hndash2raquoL+5 (10) Hndash1raquoL+4 (10) HOMOraquoL+7 (16)
6 32743 3054 0451 Hndash5raquoLUMO (15) Hndash1raquoL+3 (11) HOMOraquoL+4 (17)
7 32743 3054 0451 Hndash6raquoLUMO (15) Hndash2raquoL+3 (11) HOMOraquoL+5 (17)
8 34634 2887 0000 Hndash7raquoLUMO (15) Hndash4raquoL+3 (10) Hndash2raquoL+1 (18) Hndash1raquoL+2 (18)
9 35256 2836 0000 Hndash3raquoL+3 (35) 10 35733 2799 0134 Hndash2raquoLUMO (13)
Hndash1raquoL+3 (25) HOMOraquoL+2 (10)
11 35733 2799 0134 Hndash2raquoL+3 (25) Hndash1raquoLUMO (13) HOMOraquoL+1 (10)
12 36277 2757 0000 Hndash3raquoLUMO (30) HOMOraquoL+3 (36)
13 37002 2703 1295 Hndash3raquoL+1 (11) Hndash2raquoLUMO (14)
14 37002 2703 1295 Hndash3raquoL+2 (11) Hndash1raquoLUMO (14)
15 37160 2691 0000 HOMOraquoL+6 (30) 16 37559 2662 0000 Hndash2raquoL+1 (31)
Hndash1raquoL+2 (31) 17 39296 2545 0000 Hndash3raquoL+6 (10)
Hndash2raquoL+2 (10) Hndash1raquoL+1 (10) HOMOraquoLUMO (11)
18 39531 2530 0000 Hndash6raquoL+1 (20) Hndash5raquoL+2 (20) Hndash4raquoL+3 (12) Hndash4raquoL+6 (11)
19 39596 2526 0260 Hndash6raquoLUMO (12) Hndash5raquoLUMO (20) HOMOraquoL+4 (17)
20 39596 2526 0260 Hndash6raquoLUMO (20) Hndash5raquoLUMO (12) HOMOraquoL+5 (17)
21 40255 2484 0000 Hndash4raquoLUMO (34) Hndash2raquoL+5 (10) Hndash1raquoL+4 (10) HOMOraquoL+7 (16)
22 40779 2452 1425 Hndash5raquoL+6 (12) Hndash4raquoL+4 (11)
23 40779 2452 1425 Hndash6raquoL+6 (12) Hndash4raquoL+5 (11)
No Energy (cmndash1)
λ (nm)
f[a] Major excitations[b]
24 41247 2424 0000 Hndash6raquoL+5 (12) Hndash5raquoL+4 (12) Hndash4raquoL+3 (23) Hndash4raquoL+6 (10)
25 41333 2419 0000 Hndash2raquoL+4 (10) Hndash1raquoL+5 (10) HOMOraquoLUMO (14)
26 41833 2390 0000 Hndash8raquoLUMO (33) HOMOraquoL+6 (22)
27 41948 2384 0000 Hndash6raquoL+2 (21) Hndash5raquoL+1 (21) Hndash3raquoL+6 (13)
28 41950 2384 0049 Hndash1raquoL+3 (18) 29 41950 2384 0049 Hndash2raquoL+3 (18) 30 42959 2328 0315 Hndash1raquoL+7 (17) 31 42959 2328 0315 Hndash2raquoL+7 (17) 32 43157 2317 0000 Hndash3raquoLUMO (24)
Hndash2raquoL+2 (11) Hndash1raquoL+1 (11) HOMOraquoL+3 (14)
33 43630 2292 0000 Hndash2raquoL+4 (24) Hndash2raquoL+5 (10) Hndash1raquoL+4 (10) Hndash1raquoL+5 (24)
34 43830 2282 0000 HOMOraquoL+8 (67) 35 44243 2260 0259 Hndash1raquoL+3 (14) 36 44243 2260 0259 Hndash2raquoL+3 (14) 37 44386 2253 0000 Hndash7raquoLUMO (60) 38 44892 2228 0092 Hndash6raquoLUMO (10)
HOMOraquoL+4 (12) 39 44892 2228 0092 Hndash5raquoLUMO (10)
HOMOraquoL+5 (12) 40 45020 2221 0000 Hndash7raquoL+3 (21)
HOMOraquoL+7 (38) 41 45432 2201 0000 Hndash1raquoL+8 (29)
HOMOraquoL+10 (27) 42 45432 2201 0000 Hndash2raquoL+8 (29)
HOMOraquoL+11 (27) 43 45718 2187 0000 Hndash3raquoLUMO (10)
Hndash2raquoL+5 (15) Hndash1raquoL+4 (15) HOMOraquoL+6 (14)
44 45744 2186 0000 Hndash6raquoL+1 (27) Hndash5raquoL+2 (27) Hndash4raquoLUMO (27)
45 45988 2174 0077 Hndash10raquoLUMO (11) Hndash1raquoL+6 (25)
46 45988 2174 0077 Hndash9raquoLUMO (11) Hndash2raquoL+6 (25)
47 46161 2166 0000 Hndash3raquoL+3 (45) 48 46311 2159 0000 Hndash3raquoL+7 (13)
HOMOraquoL+9 (34) 49 46427 2154 0000 HOMOraquoL+12 (52)
HOMOraquoL+23 (11) 50 46916 2131 0194 Hndash7raquoL+1 (13)
Hndash7raquoL+2 (11)
[a] Oscillator strength [b] Contributions smaller than 10 are
not included H = HOMO L = LUMO Orbitals are numbered
consecutively regardless of possible degeneracies
S32
Table S5 Crystal data and structure refinement for 3-EtmiddotCH2Cl2
Identification code mm01a
Empirical formula C57H48Br6CH2Cl2
Formula weight 129735
Temperature 100(2) K
Wavelength 071073 Aring
Crystal system Triclinic
Space group P-1
Unit cell dimensions a = 13600(4) Aring = 10628(5)deg
b = 14111(5) Aring = 9405(4)deg
c = 16306(5) Aring = 11805(5)deg
Volume 2574(2) Aring
Z 2
Density (calculated) 1674 Mgm3
Absorption coefficient 4821 mm-1
F(000) 1284
Crystal size 037 x 014 x 003 mm3
Theta range for data collection 287 to 3059deg
Index ranges -19lt=hlt=17 -19lt=klt=19 -13lt=llt=23
Reflections collected 20444
Independent reflections 14059 [R(int) = 00424]
Completeness to theta = 2550deg 996
Absorption correction Analytical
Max and min transmission 0867 and 0381
Refinement method Full-matrix least-squares on F2
Data restraints parameters 14059 0 595
Goodness-of-fit on F2 1023
Final R indices [Igt2sigma(I)] R1 = 00597 wR2 = 00951
R indices (all data) R1 = 01047 wR2 = 01138
Largest diff peak and hole 090 and -097 e Aring-3
S33
Table S6 Crystal data and structure refinement for 4-EtmiddotC7H8
Identification code dstem1
Empirical formula C76H64Br8C7H8
Formula weight 170869
Temperature 79(9) K
Wavelength 071073 Aring
Crystal system Orthorhombic
Space group P b c n
Unit cell dimensions a = 29202(12) Aring = 90deg
b = 17637(1) Aring = 90deg
c = 14745(8) Aring = 90deg
Volume 7594(1) Aring3
Z 4
Density (calculated) 1575 Mgm3
Absorption coefficient 4271 mm-1
F(000) 3600
Crystal size 053 x 044 x 038 mm3
Theta range for data collection 279 to 3074deg
Index ranges -41lt=hlt=34 -14lt=klt=25 -19lt=llt=20
Reflections collected 34296
Independent reflections 10861 [R(int) = 00362]
Completeness to theta = 2550deg 998
Absorption correction Analytical
Max and min transmission 0325 and 0231
Refinement method Full-matrix least-squares on F2
Data restraints parameters 10861 0 412
Goodness-of-fit on F2 1025
Final R indices [Igt2sigma(I)] R1 = 00496 wR2 = 01165
R indices (all data) R1 = 00837 wR2 = 01342
Largest diff peak and hole 2893 and -0701 eAring-3
S34
Figure S19 1H NMR spectrum of S5 (chloroform-d 600 MHz 300 K there are some solubility problems)
Figure S20 13C NMR spectrum of S5 (chloroform-d 151 MHz 300 K there are some solubility problems)
100 95 90 85 80 75 70 65 60 55 50 45 40 35 30 25 20 15 10 05 ppm
03
1
12
3
15
5
20
0
22
5
72
4 S
77
0
77
3
83
7
310
230
301
083
098
100
210 200 190 180 170 160 150 140 130 120 110 100 90 80 70 60 50 40 30 20 10 0 ppm
83
6
84
6
251
5
297
8
323
5327
3
568
2
770
1 S
1117
2
1163
6
1229
4
1263
1
1346
6
1369
8
1508
0
1681
6
S35
Figure S21 1H NMR spectrum of S6 (chloroform-d 600 MHz 300 K)
Figure S22 13C NMR spectrum of S6 (chloroform-d 600 MHz 300 K)
95 90 85 80 75 70 65 60 55 50 45 40 35 30 25 20 15 10 05 00 ppm
03
1
08
2
12
4
15
3
18
5
40
7
66
5
72
4 S
75
3
308
205
201
105
100
210 200 190 180 170 160 150 140 130 120 110 100 90 80 70 60 50 40 30 20 10 0 ppm
84
2
330
4
557
5
770
0 S
1081
1
1104
1
1226
1
1334
0
1422
9
1499
5
S36
Figure S23 1H NMR spectrum of S7 (chloroform-d 600 MHz 300 K)
Figure S24 13C NMR spectrum of S7 (chloroform-d 151 MHz 300 K)
100 95 90 85 80 75 70 65 60 55 50 45 40 35 30 25 20 15 10 05 ppm
03
1
19
3
24
0
72
4 S
77
7
78
9
300
207
104
100
210 200 190 180 170 160 150 140 130 120 110 100 90 80 70 60 50 40 30 20 10 0 ppm
84
6
323
1
562
2
770
2 S
1004
5
1240
9
1283
0
1347
2
1502
6
S37
Figure S25 1H NMR spectrum of S8 (chloroform-d 600 MHz 300 K)
Figure S26 13C NMR spectrum of S8 (chloroform-d 151 MHz 300 K)
105 100 95 90 85 80 75 70 65 60 55 50 45 40 35 30 25 20 15 10 05 ppm
02
7
20
7
72
4 S
79
1
79
9
104
3
304
205
104
100
097
210 200 190 180 170 160 150 140 130 120 110 100 90 80 70 60 50 40 30 20 10 0 ppm
84
1
321
1
569
0
770
1 S
1242
3
1263
3
1265
4
1332
6
1457
3
1511
2
1918
2
S38
Figure S27 1H NMR spectrum of S9 (chloroform-d 600 MHz 300 K)
Figure S28 13C NMR spectrum of S9 (chloroform-d 151 MHz 300 K)
95 90 85 80 75 70 65 60 55 50 45 40 35 30 25 20 15 10 05 00 ppm
02
7
15
0
15
3
20
1
48
1
72
4 S
74
2
78
1
305
297
205
103
100
210 200 190 180 170 160 150 140 130 120 110 100 90 80 70 60 50 40 30 20 10 0 ppm
84
8
324
5
563
7
654
5
770
4 S
1210
4
1233
0
1241
1
1387
8
1412
1
1497
8
S39
Figure S29 1H NMR spectrum of S10 (chloroform-d 600 MHz 300 K)
Figure S30 13C NMR spectrum of S10 (chloroform-d 151 MHz 300 K)
95 90 85 80 75 70 65 60 55 50 45 40 35 30 25 20 15 10 05 ppm
03
0
15
2
20
0
47
7
72
4 S
74
1
78
6
303
207
203
104
100
210 200 190 180 170 160 150 140 130 120 110 100 90 80 70 60 50 40 30 20 10 0 ppm
84
9
323
6
466
7
564
0
770
7 S
1229
3
1247
6
1253
2
1359
6
1417
5
1501
8
S40
Figure S31 1H NMR spectrum of S11 (chloroform-d 600 MHz 300 K)
Figure S32 13C NMR spectrum of S11 (chloroform-d 151 MHz 300 K)
80 75 70 65 60 55 50 45 40 35 30 25 20 15 10 05 00 ppm
-01
8
14
0
25
1
58
0
72
4 S
72
7
75
976
0
76
9
77
6
301
207
199
100
108
605
607
309
210 200 190 180 170 160 150 140 130 120 110 100 90 80 70 60 50 40 30 20 10 0 ppm
84
2
311
6
314
7
561
6
770
1 S
1171
5
1177
1
1243
8
1257
21269
8
1279
9
1301
8
1343
5
1351
21412
4
1502
7
S41
Figure S33 1H NMR spectrum of 3-Et (chloroform-d 500 MHz 300 K)
Figure S34 13C NMR spectrum of 3-Et (chloroform-d 151 MHz 300 K)
95 90 85 80 75 70 65 60 55 50 45 40 35 30 25 20 15 10 05 00 ppm
01
1
08
6
13
5
15
1
21
5
68
7
68
8
72
4 S
76
3
304
202
102
101
100
210 200 190 180 170 160 150 140 130 120 110 100 90 80 70 60 50 40 30 20 10 0 ppm
87
2
297
1
310
6
547
8
770
1 S
1220
6
1236
4
1252
7
1324
3
1366
2
1401
8
1495
9
S42
Figure S35 1H NMR spectrum of 4-Et (chloroform-d 500 MHz 300 K)
Figure S36 13C NMR spectrum of 4-Et (chloroform-d 151 MHz 300 K)
95 90 85 80 75 70 65 60 55 50 45 40 35 30 25 20 15 10 05 00 ppm
00
2
08
7
14
2
15
3
67
7
70
1
72
4 S
78
2
304
207
098
096
100
210 200 190 180 170 160 150 140 130 120 110 100 90 80 70 60 50 40 30 20 10 0 ppm
85
5
313
0
555
5
770
0 S
1230
1
1242
61248
3
1308
0
1361
8
1405
5
1496
3
S43
Figure S37 1H NMR spectrum of 1-Et (chloroform-d 600 MHz 300 K)
Figure S38 13C NMR spectrum of 1-Et (chloroform-d 151 MHz 300 K)
95 90 85 80 75 70 65 60 55 50 45 40 35 30 25 20 15 10 05 00 ppm
-04
1
11
9
15
1
20
9
23
1
72
4 S
76
1
76
3
92
7
148
154
101
104
101
101
100
210 200 190 180 170 160 150 140 130 120 110 100 90 80 70 60 50 40 30 20 10 0 ppm
82
6
100
9
298
0
354
9
594
0
770
0
1171
3
1231
9
1263
7
1309
4
1315
6
1417
9
1495
1
S44
Figure S39 1H NMR spectrum of 2-Et (chloroform-d 500 MHz 300 K there are some solubility problems)
Figure S40 13C NMR spectrum of 2-Et (chloroform-d 151 MHz 300 K there are some solubility problems)
05101520253035404550556065707580859095 ppm
04
2
08
2
12
4
13
2
14
1
15
1
23
0
72
4 S
78
4
79
1
97
0
305
207
103
104
100
210 200 190 180 170 160 150 140 130 120 110 100 90 80 70 60 50 40 30 20 10 0 ppm
83
9
344
0
543
0
770
1 S
1144
2
1230
8
1272
8
1308
4
1324
4
1412
2
1491
0
S45
Figure S41 High resolution mass spectrum of S5 (ESI+ top experimental bottom simulated)
Figure S42 High resolution mass spectrum of S6 (ESI+ top experimental bottom simulated)
4930133
4940168
4950110
4960144
4970086
4980122
MM Mm12_000002d +MS
4930121
4940154
4950102
4960134
4970081
4980113
MM Mm12_000002d C21H22Br2N2O2 M+nH 4930100
05
10
15
20
25
8x10
Intens
0
500
1000
1500
2000
491 492 493 494 495 496 497 498 499 mz
4085388
4089913
40965534099825
4109892
4119922
4129871
41399044143762 4146416
MM Mm13_000001d +MS
4089910
4099943
4109890
4119922
4129869
4139902
MM Mm13_000001d C17H18Br2N2 M+nH 4089900
05
10
15
20
7x10
Intens
0
500
1000
1500
2000
408 409 410 411 412 413 414 mz
S46
Figure S43 High resolution mass spectrum of S8 (APCI+ top experimental bottom simulated)
Figure S44 High resolution mass spectrum of S9 (APCI+ top experimental bottom simulated)
4349595
4359630
4369580
4379615
4389564
+MS 06min 33
4349590
4359623
4369570
4379603
4389550
C19H16Br2O2 M+nH 434960
1
2
3
4
5
5x10
Intens
0
500
1000
1500
2000
434 435 436 437 438 439 mz
4379771
4389670
4399738
4409660
4419725
4429605
+MS 03min 17
4379825
4389858
4399805
4409838
4419784
4429817
C19H20Br2O2 M 4379800
02
04
06
08
10
12
5x10
Intens
0
500
1000
1500
2000
438 439 440 441 442 443 mz
S47
Figure S45 High resolution mass spectrum of S10 (APCI+ top experimental bottom simulated)
Figure S46 High resolution mass spectrum of S11 (APCI+ top experimental bottom simulated)
4739290
4749220
4759252
4769225
4779232
4789245
4799238
4810399
4819735
+MS 02min 10
4739147
4749180
4759125
4769160
4779098
4789131
4799077
48091104819047
C19H18Br2Cl2 M 473920
2
4
6
4x10
Intens
0
500
1000
1500
2000
474 475 476 477 478 479 480 481 482 mz
4640799
4645815
4650787
4655801
4660775
4665789
4670804
MM Mm18_000002d +MS
4640794
4645810
4650787
4655800 4660775
4665790
4670807
MM Mm18_000002d C55H48Br2P2 M 928160
1
2
3
4
8x10
Intens
0
500
1000
1500
2000
4635 4640 4645 4650 4655 4660 4665 4670 4675 mz
S48
Figure S47 High resolution mass spectrum of 3-Et (APCI+ top experimental bottom simulated)
Figure S48 High resolution mass spectrum of 4-Et (APCI+) top experimental bottom simulated)
1205902312069040
12078963
12088989
12098947
12108956 12118937
12128940
12138943
12148938
12158953
12168951
12178982
12188994
+MS 01min 8
1205885112068884
12078830
12088864
12098811
12108844
12118801
12128823
12138772
12148803
12158751
12168782
12178815
12188762
C57H48Br6 M 1205890
1
2
3
4x10
Intens
0
500
1000
1500
2000
1206 1208 1210 1212 1214 1216 1218 mz
16098954
16108932
16118882
16128844
16138820
16148810
16158804
16168795
16178794
16188779
16198797
16208784
16218822
16228836
1623890416249000 16259203
+MS 02min 14
1609844916108483
16118429
16128462
16138410
16148442
16158408
16168422
16178371
16188402
16198350
16208381
16218413
16228360
16238393
C76H64Br8 M 16078500
02
04
06
08
10
5x10
Intens
0
500
1000
1500
2000
2500
1608 1610 1612 1614 1616 1618 1620 1622 1624 1626 mz
S49
Figure S49 High resolution mass spectrum of 1-Et (APCI+ top experimental bottom simulated)
Figure S50 High resolution mass spectrum of 2-Et (APCI+ top experimental bottom simulated)
7333834
7343867
7353903
7363940 7374065
+MS 06min 35
7333829
7343862
7353896
7363929
C57H48 M+nH 7333800
05
10
15
20
5x10
Intens
0
500
1000
1500
2000
733 734 735 736 737 738 mz
9775294
9785336
9795377
9805409
9815431
+MS 05min 28
9775081
9785114
9795148
9805181
C76H64 M+nH 977510
1
2
3
4
5
6
4x10
Intens
0
500
1000
1500
2000
977 978 979 980 981 982 983 mz
S50
References
(1) Ranger M Rondeau D Leclerc M Macromolecules 1997 30 (25) 7686ndash7691 (2) Li X Xiao Y Qian X Org Lett 2008 10 (13) 2885ndash2888 (3) Bavin P M G Org Synth 1960 40 5 (4) Guo L He S Jian T Lai Y Liu J Nargund R Sebhat I Ujjainwalla F Ye Z Young J
Acylated Spiropiperidine Derivatives as Melanocortin-4 Receptor Agonists WO2004089307 October 22 2004
(5) Frisch M J Trucks G W Schlegel H B Scuseria G E Robb M A Cheeseman J R Scalmani G Barone V Mennucci B Petersson G A Nakatsuji H Caricato M Li X Hratchian H P Izmaylov A F Bloino J Zheng G Sonnenberg J L Hada M Ehara M Toyota K Fukuda R Hasegawa J Ishida M Nakajima T Honda Y Kitao O Nakai H Vreven T Montgomery Jr J A Peralta J E Ogliaro F Bearpark M Heyd J J Brothers E Kudin K N Staroverov V N Kobayashi R Normand J Raghavachari K Rendell A Burant J C Iyengar S S Tomasi J Cossi M Rega N Millam J M Klene M Knox J E Cross J B Bakken V Adamo C Jaramillo J Gomperts R Stratmann R E Yazyev O Austin A J Cammi R Pomelli C Ochterski J W Martin R L Morokuma K Zakrzewski V G Voth G A Salvador P Dannenberg J J Dapprich S Daniels A D Farkas Ouml Foresman J B Ortiz J V Cioslowski J Fox D J Gaussian 09 Revision D01
(6) Becke A D Phys Rev A 1988 38 (6) 3098ndash3100 (7) Becke A D J Chem Phys 1993 98 (7) 5648ndash5652 (8) Lee C Yang W Parr R G Phys Rev B 1988 37 (2) 785ndash789 (9) Tomasi J Mennucci B Cammi R Chem Rev 2005 105 (8) 2999ndash3094 (10) Yanai T Tew D P Handy N C Chem Phys Lett 2004 393 (1ndash3) 51ndash57 (11) Sheldrick G M Acta Crystallogr A 2008 64 (1) 112ndash122
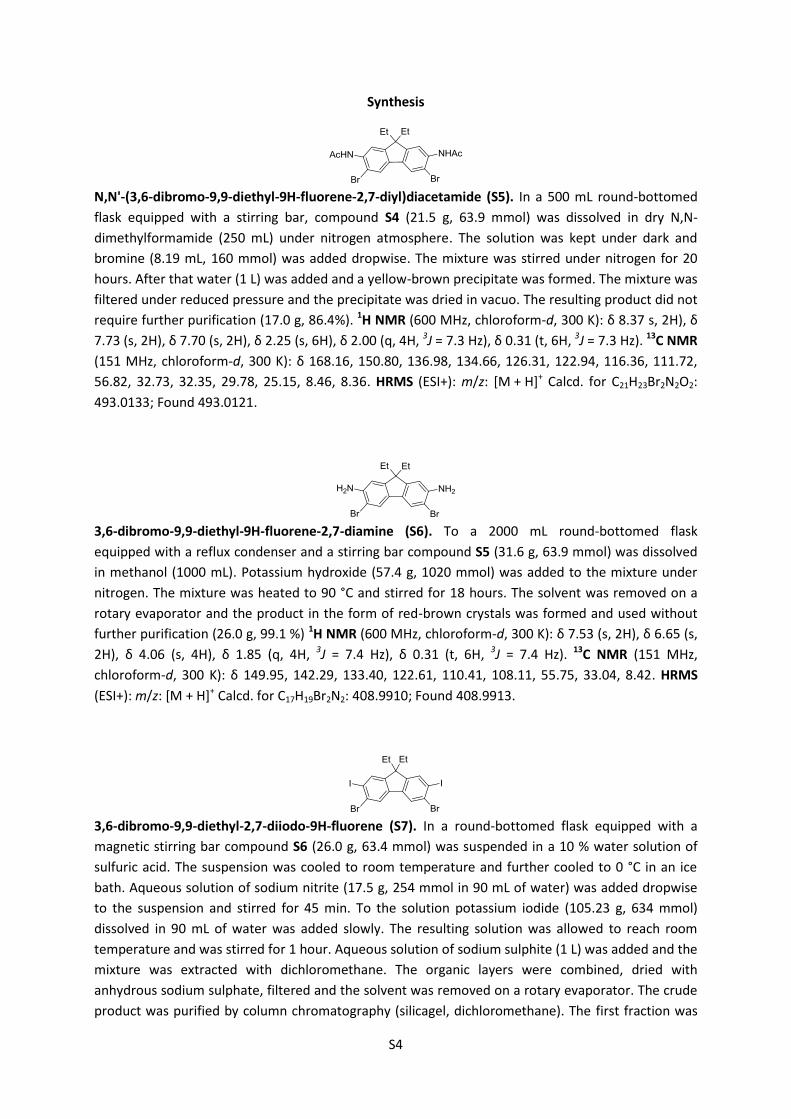
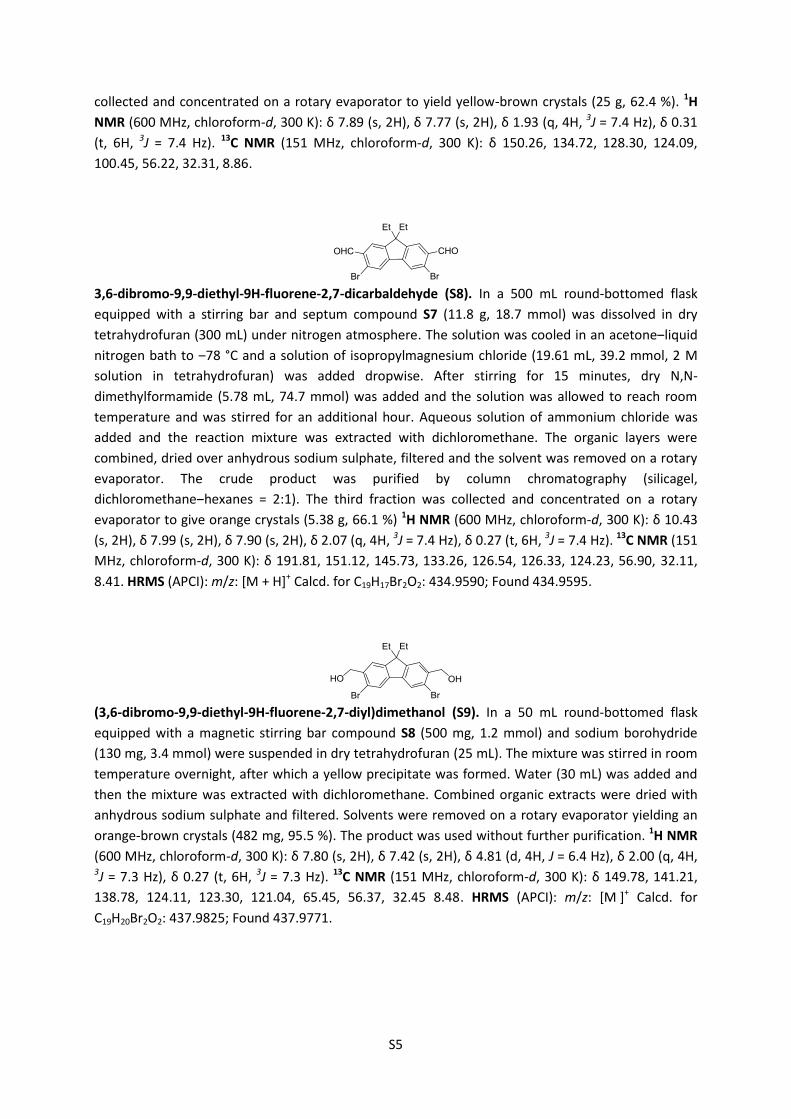
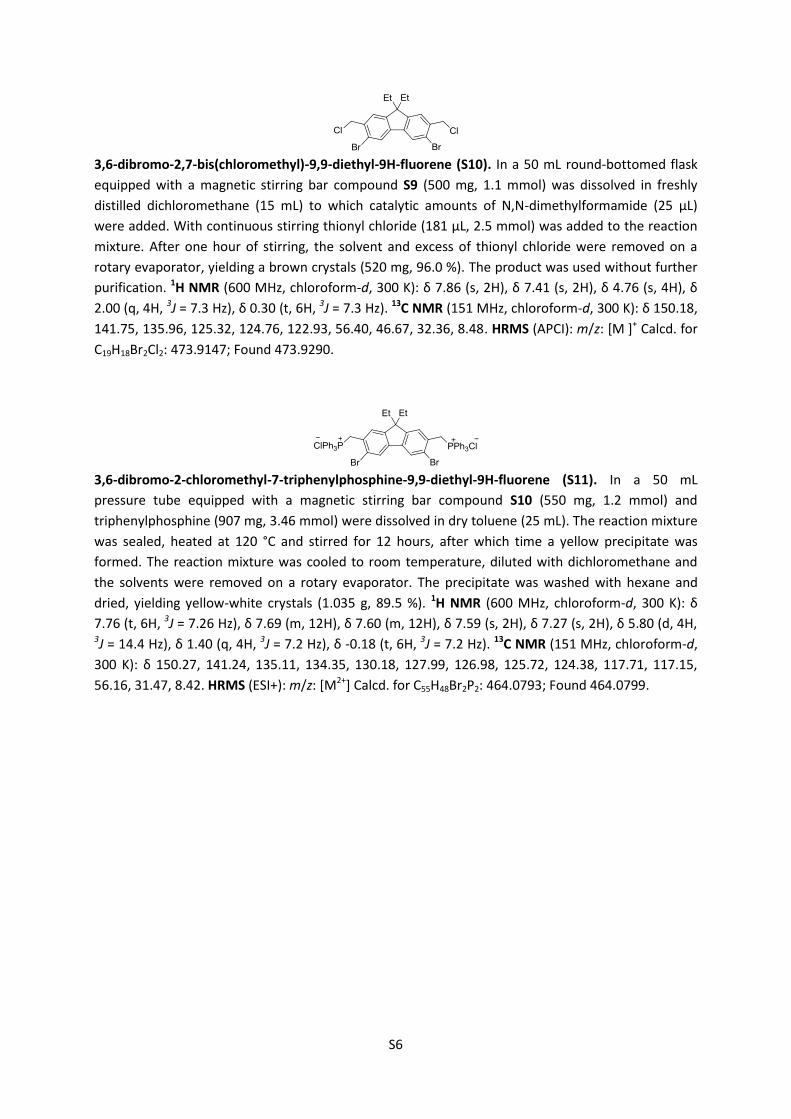
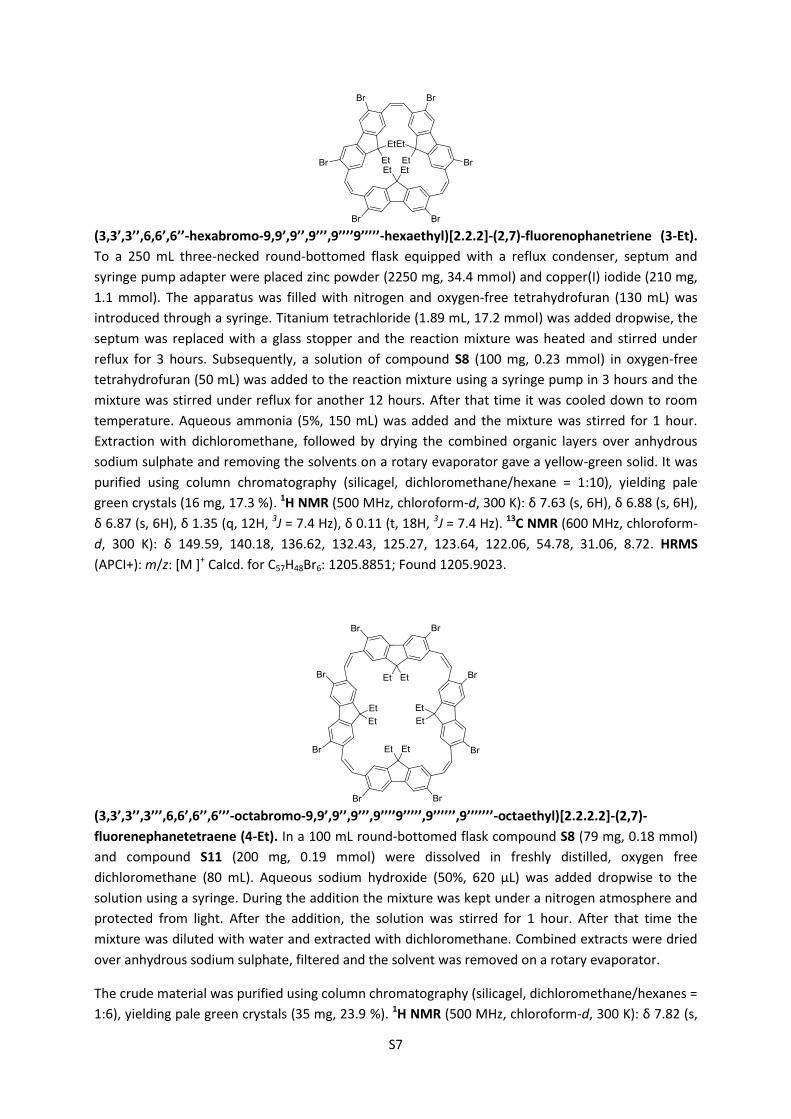
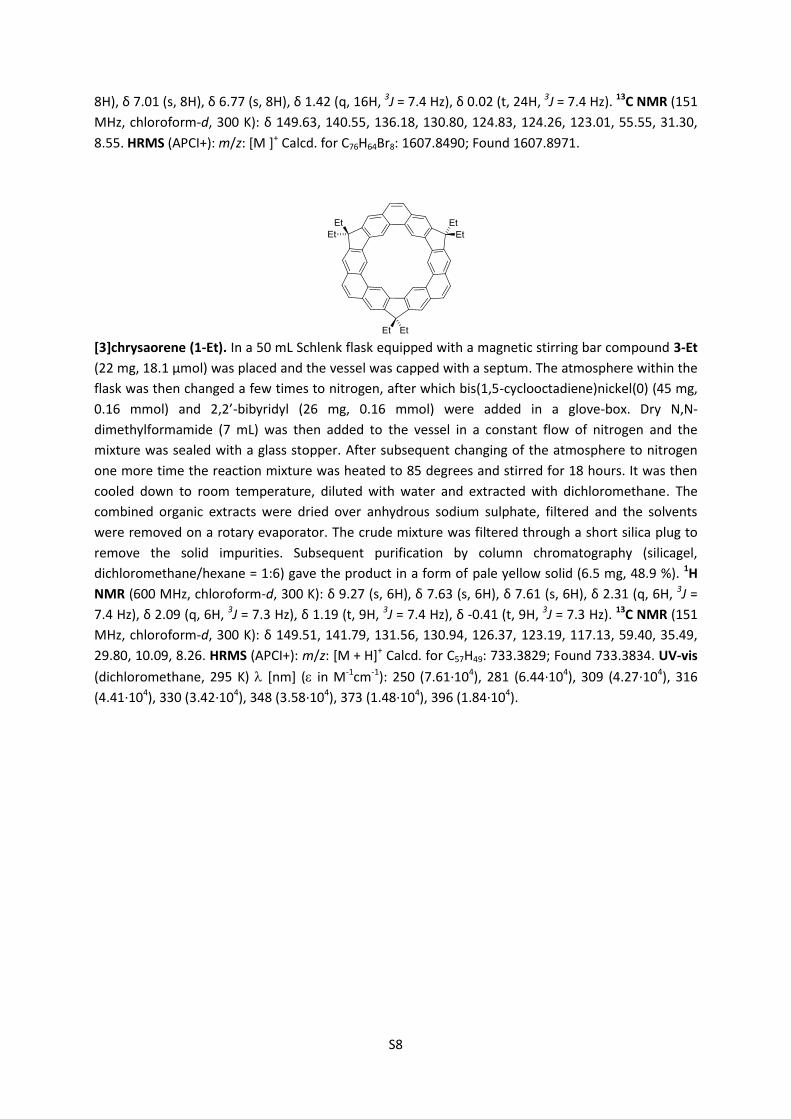
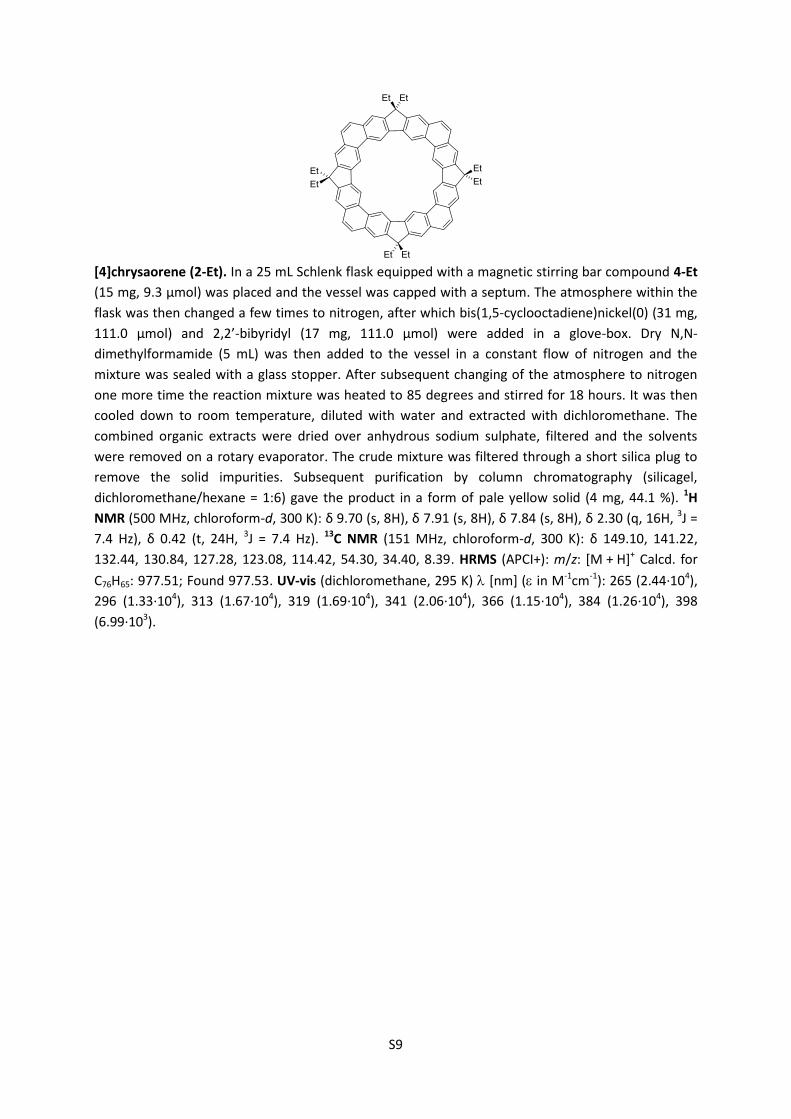
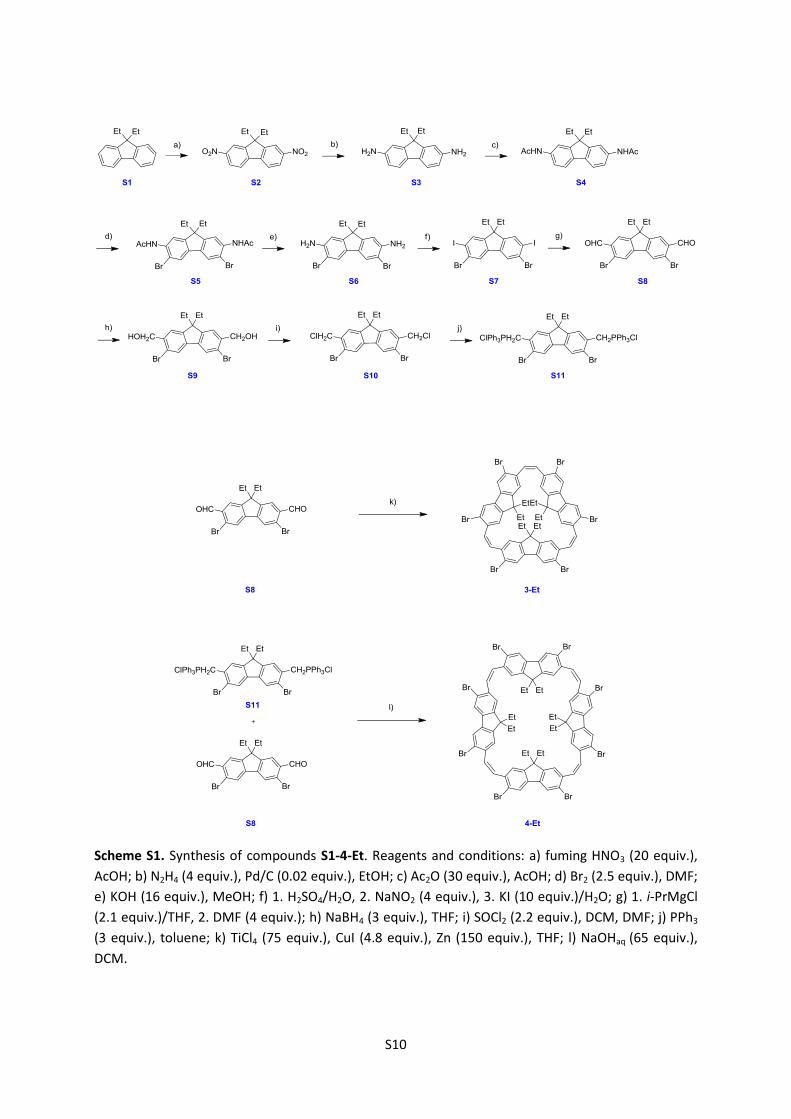
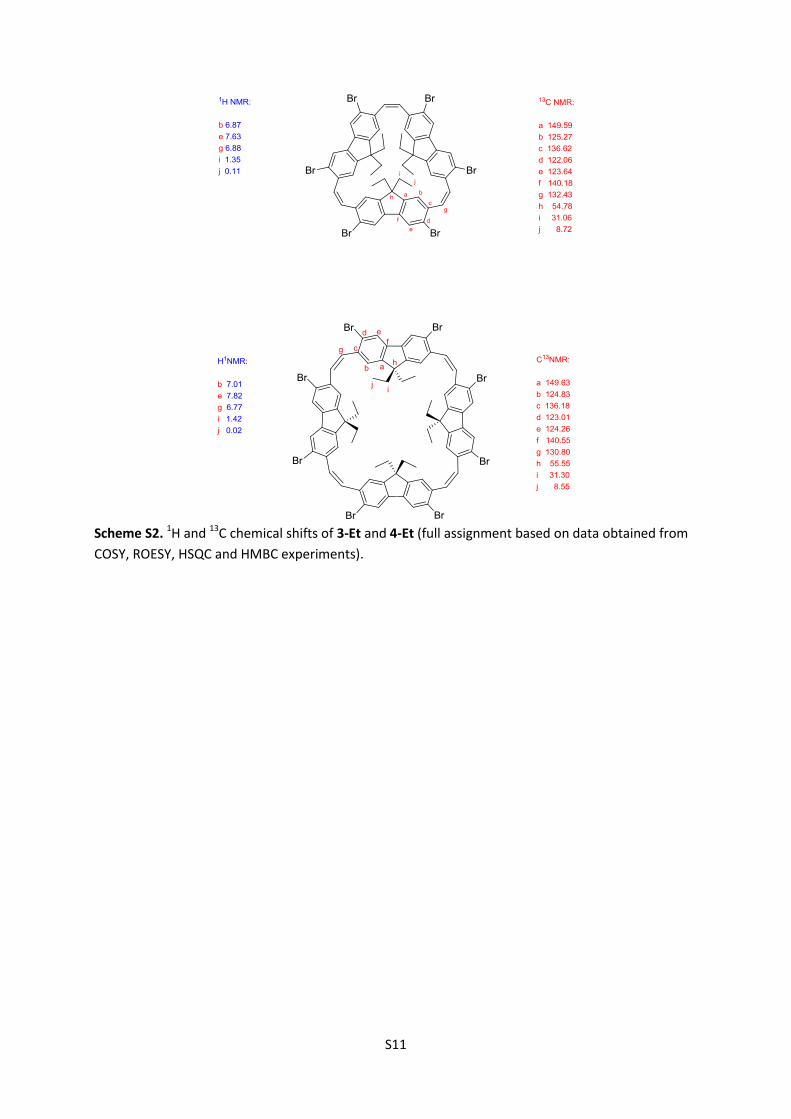
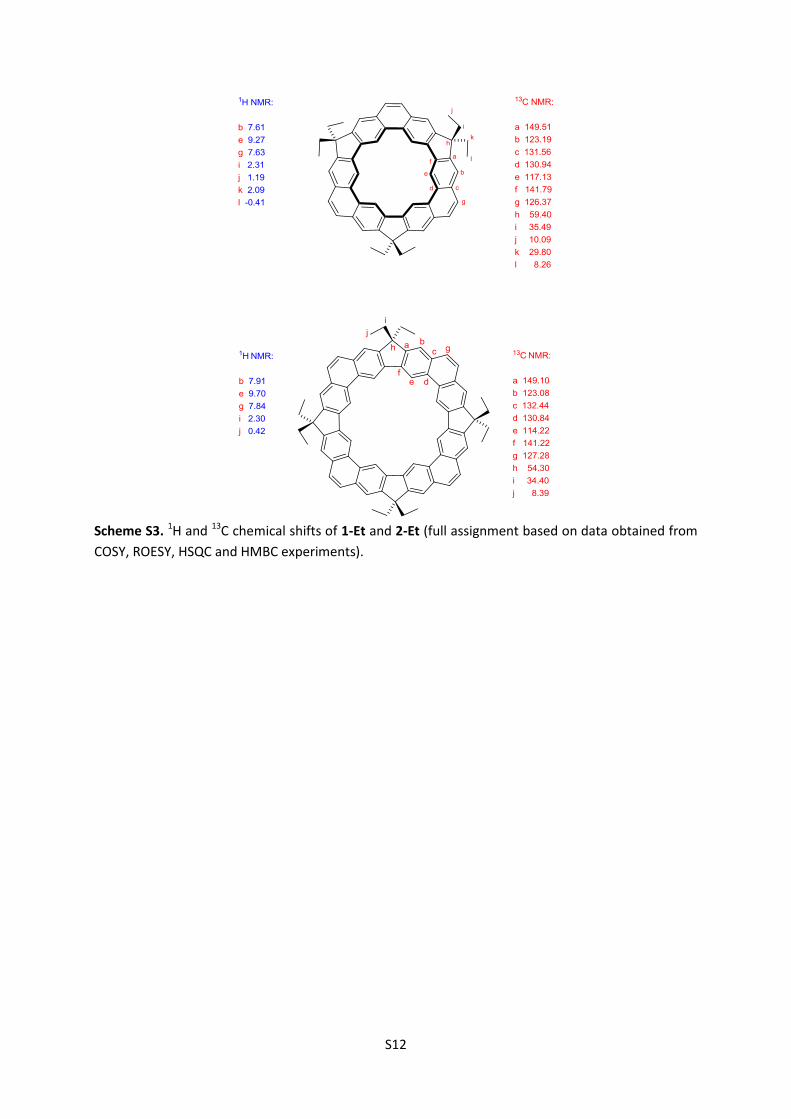
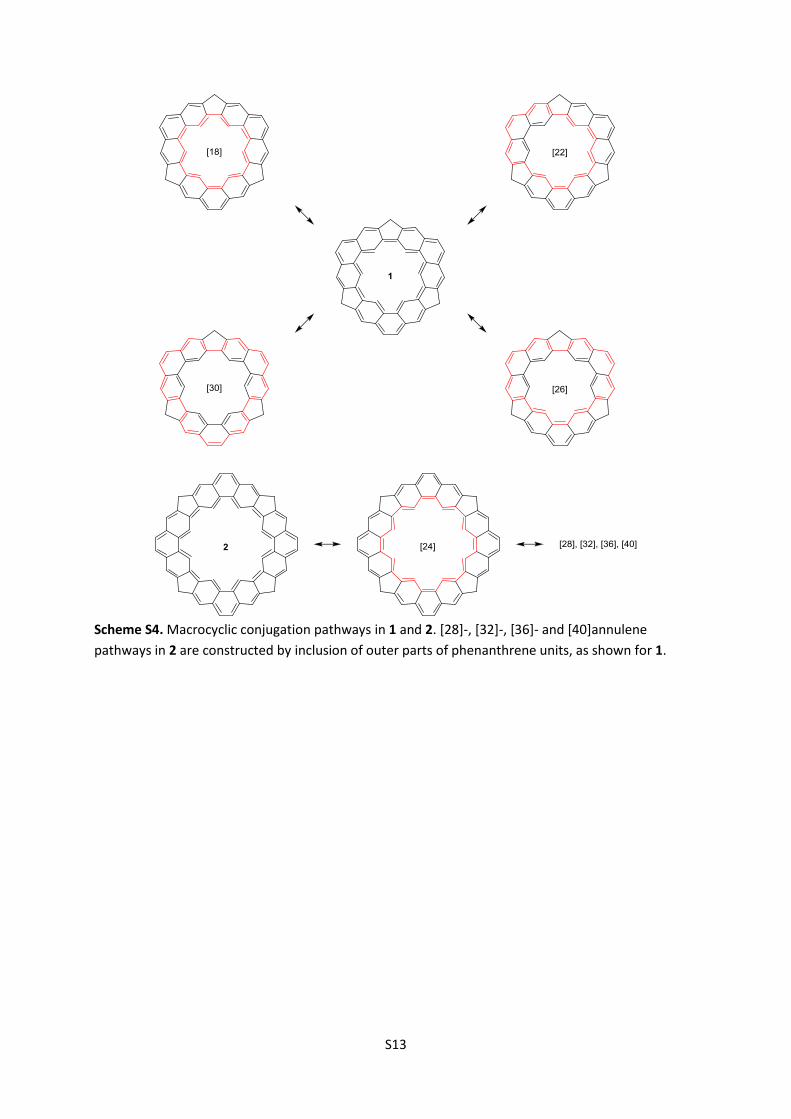
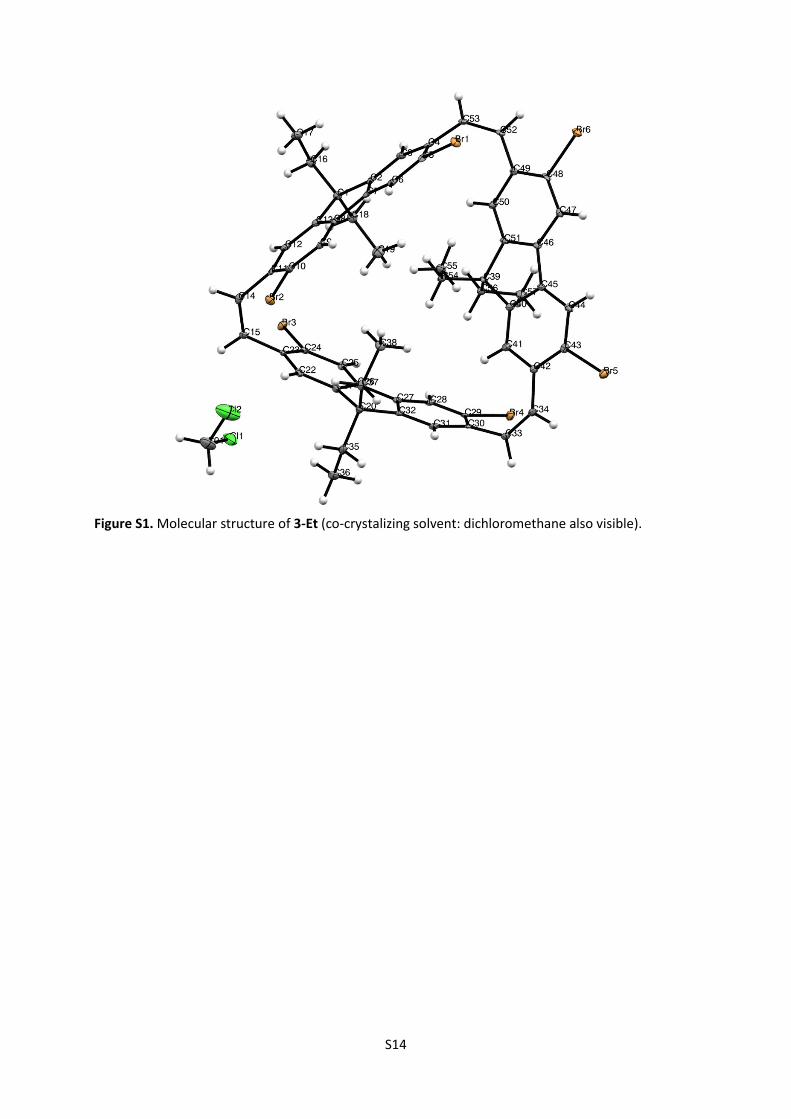
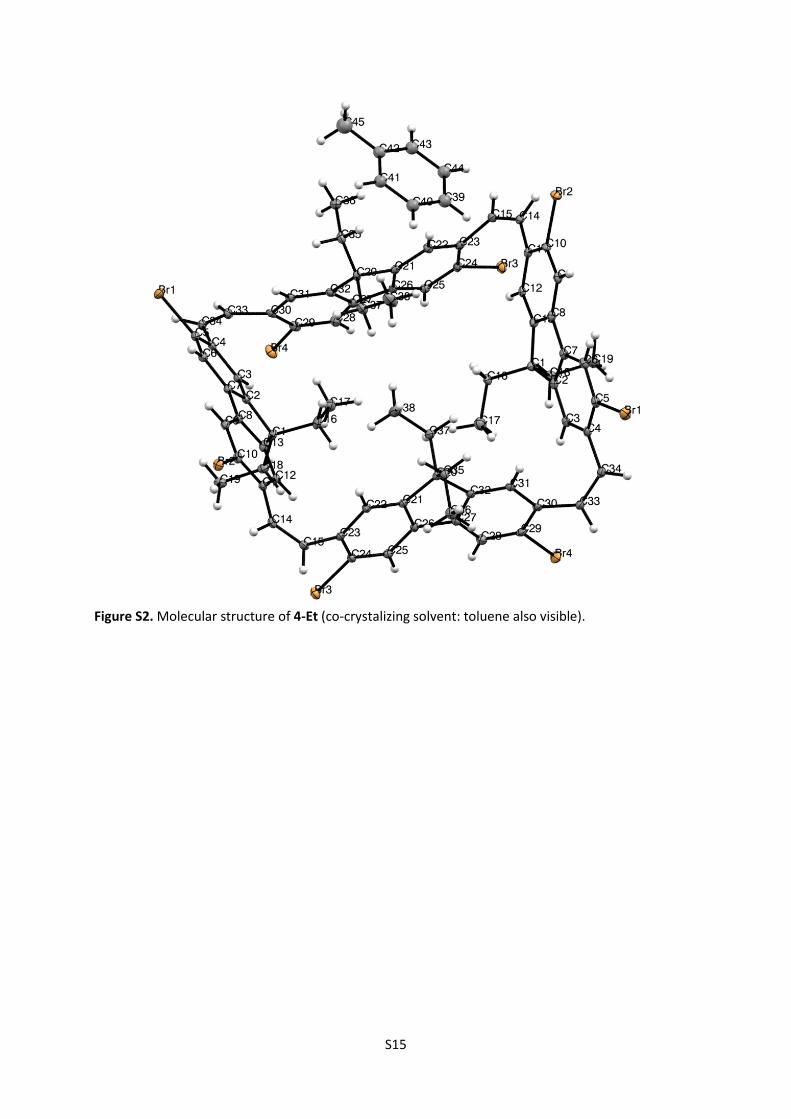
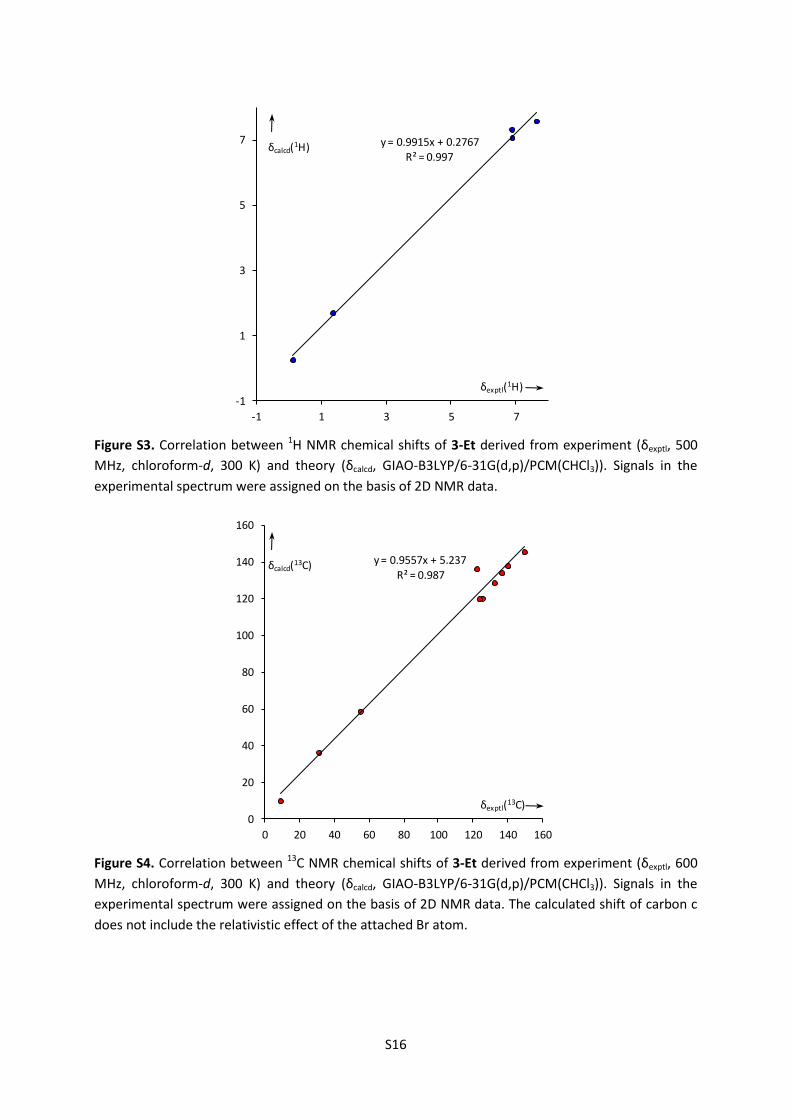
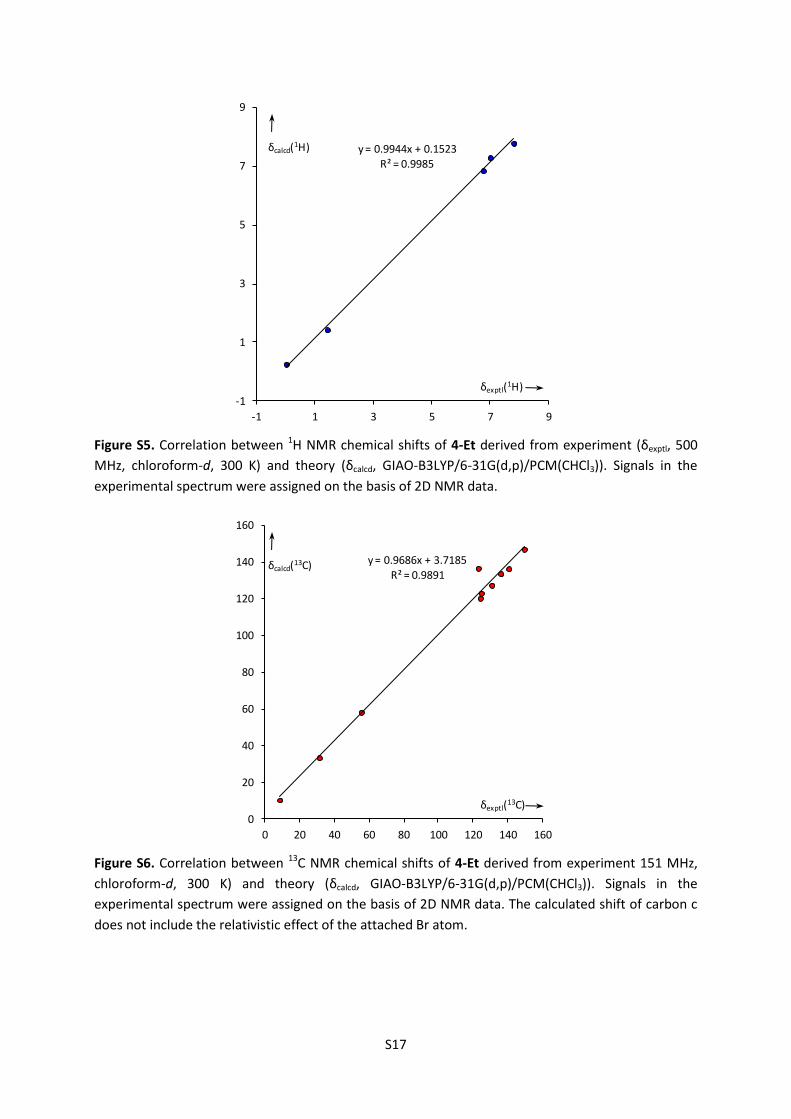
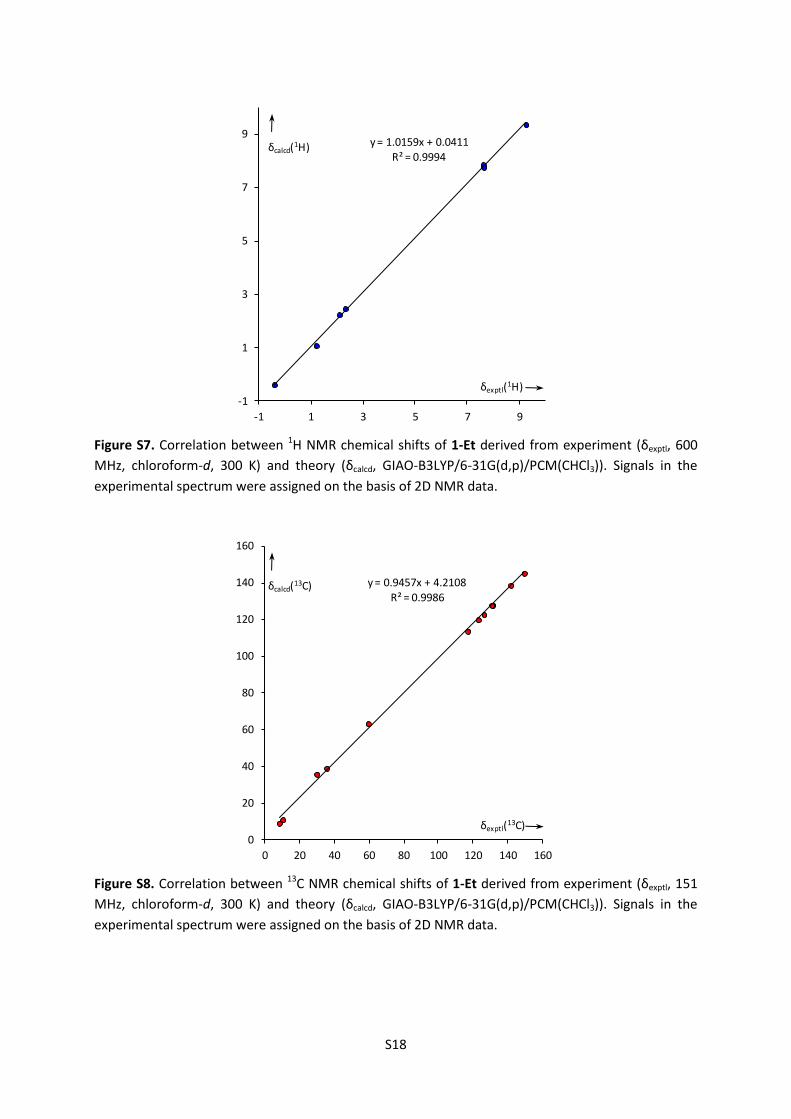
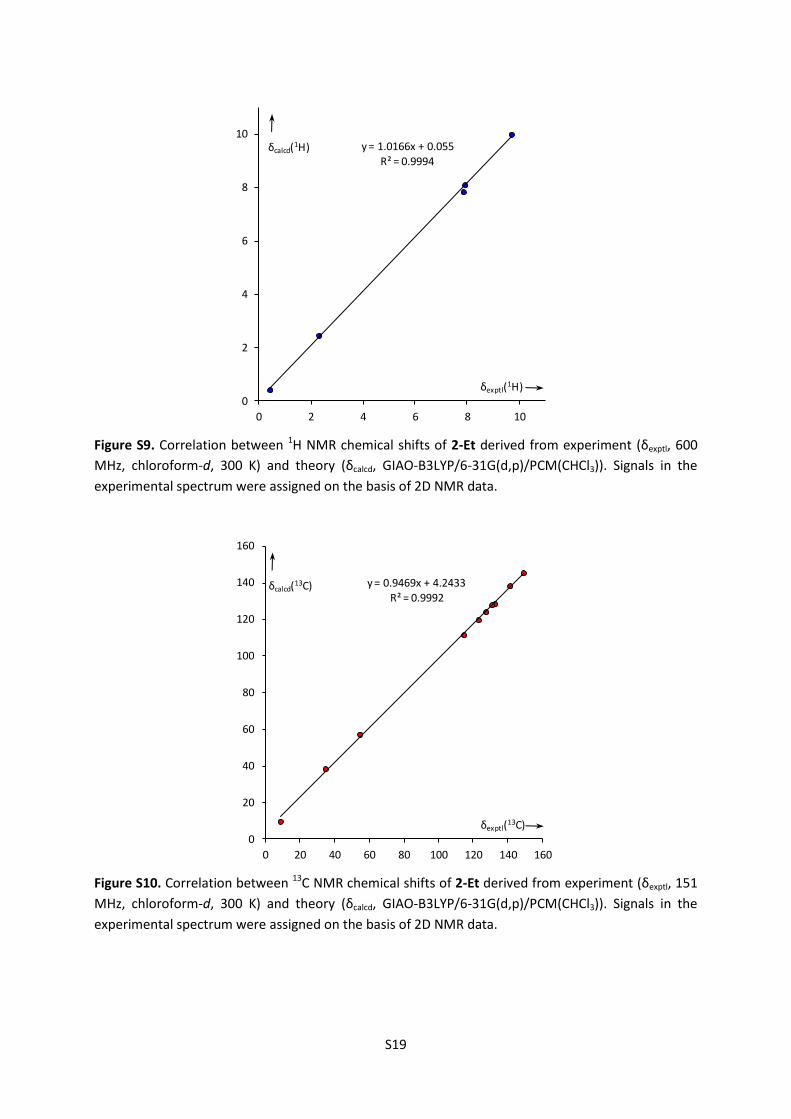
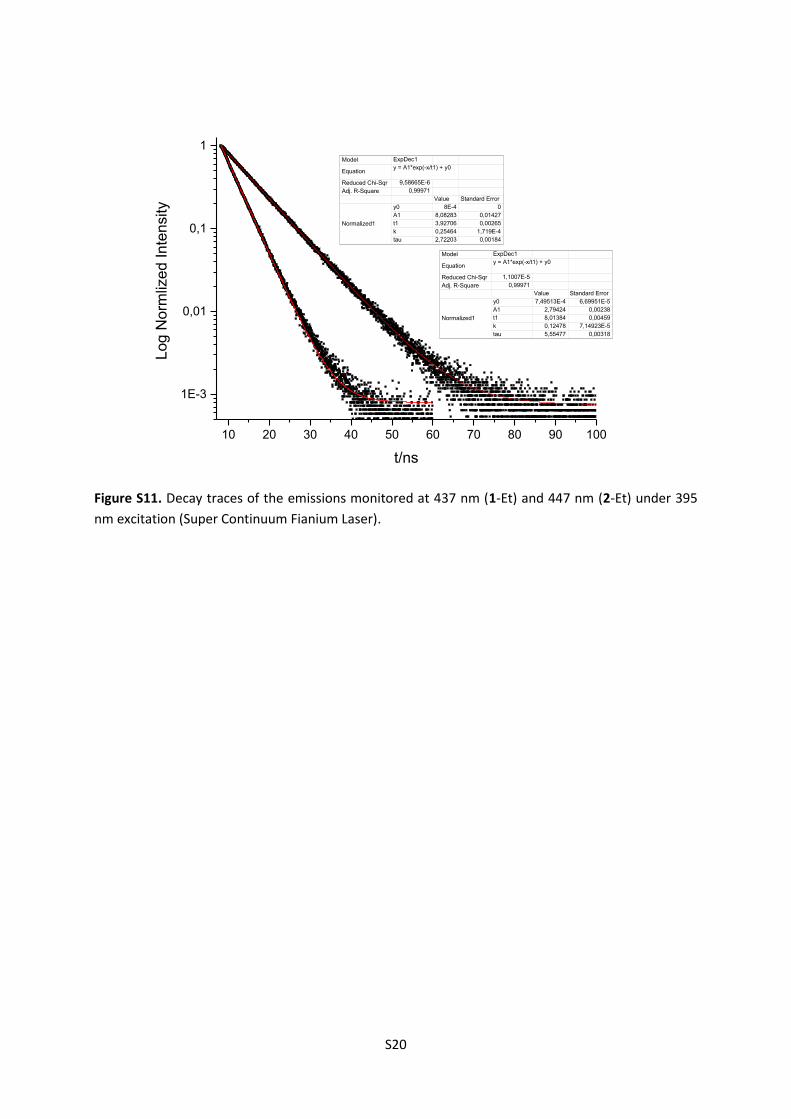
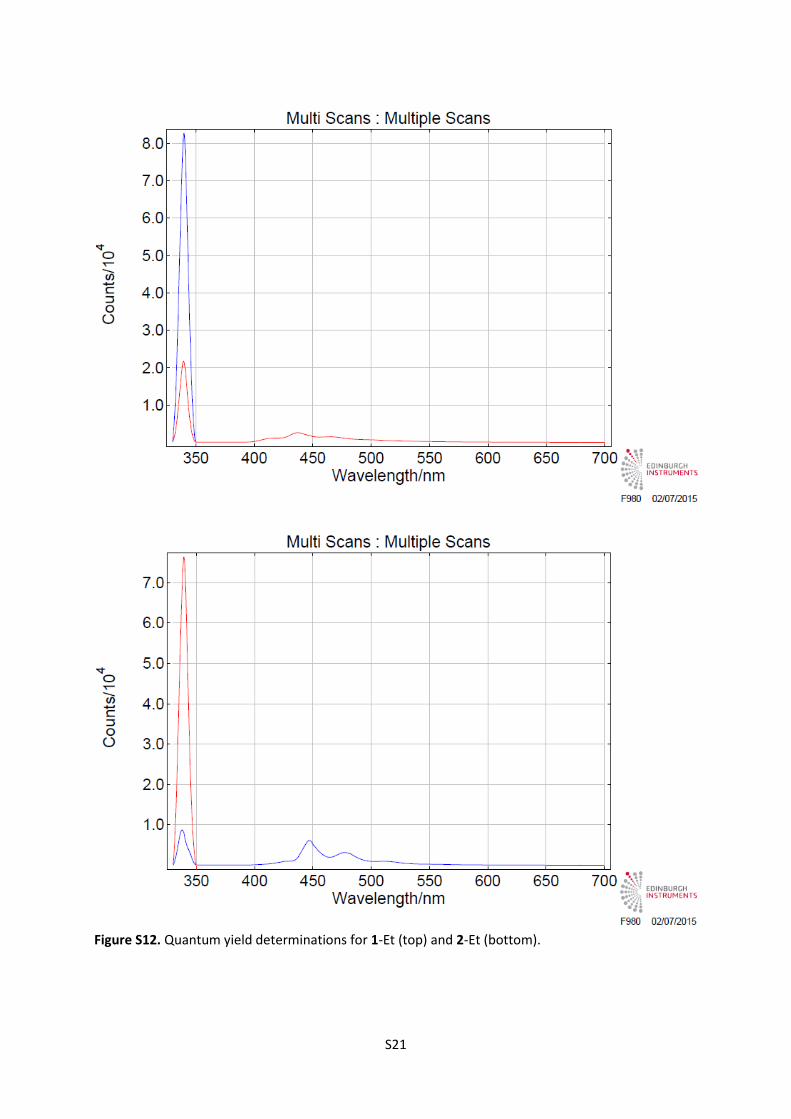
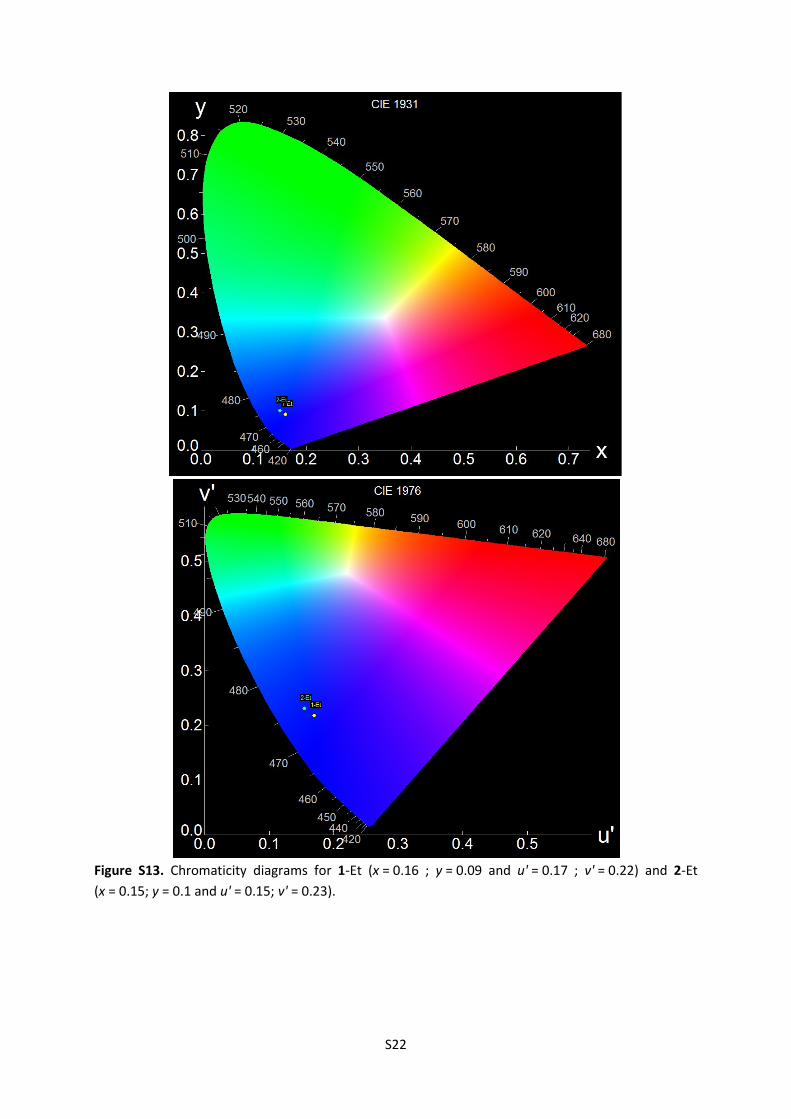
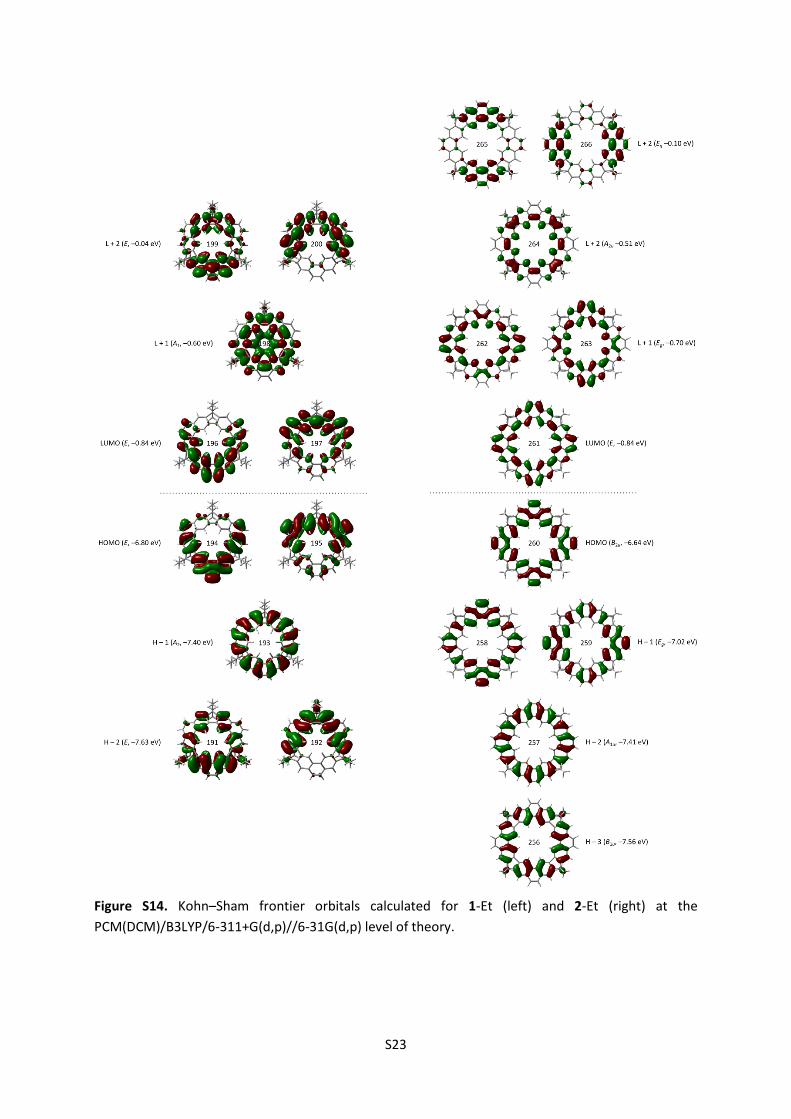
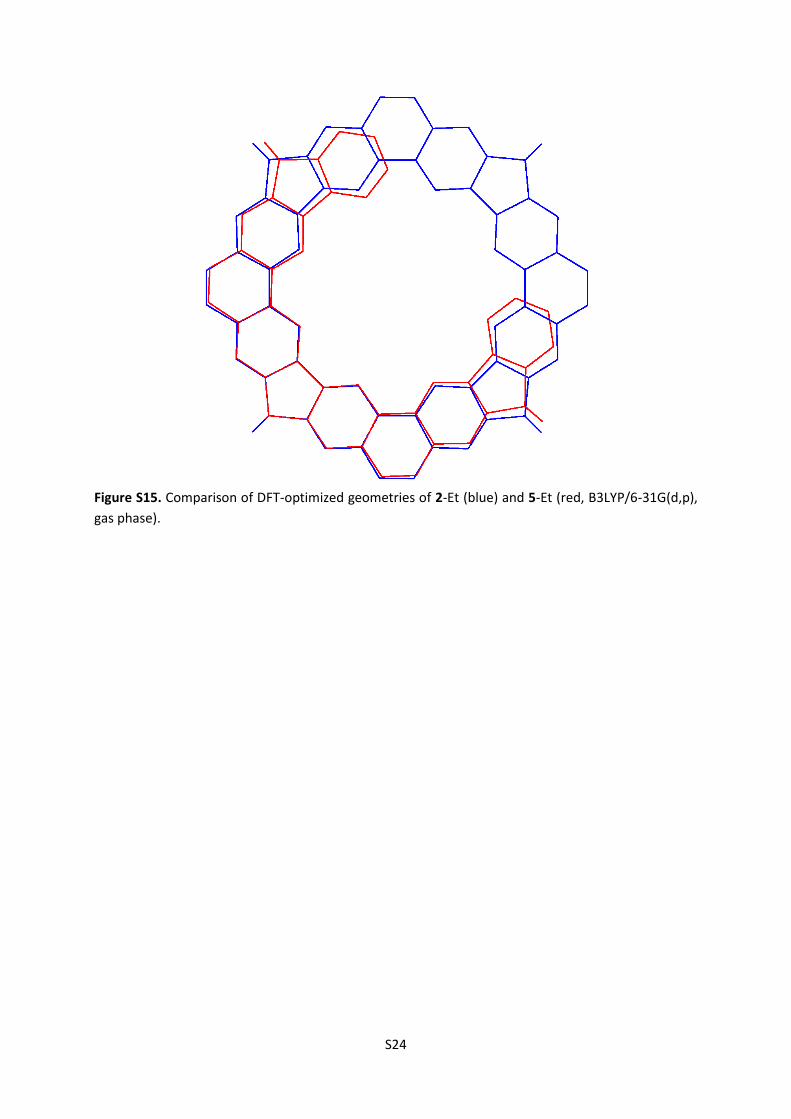
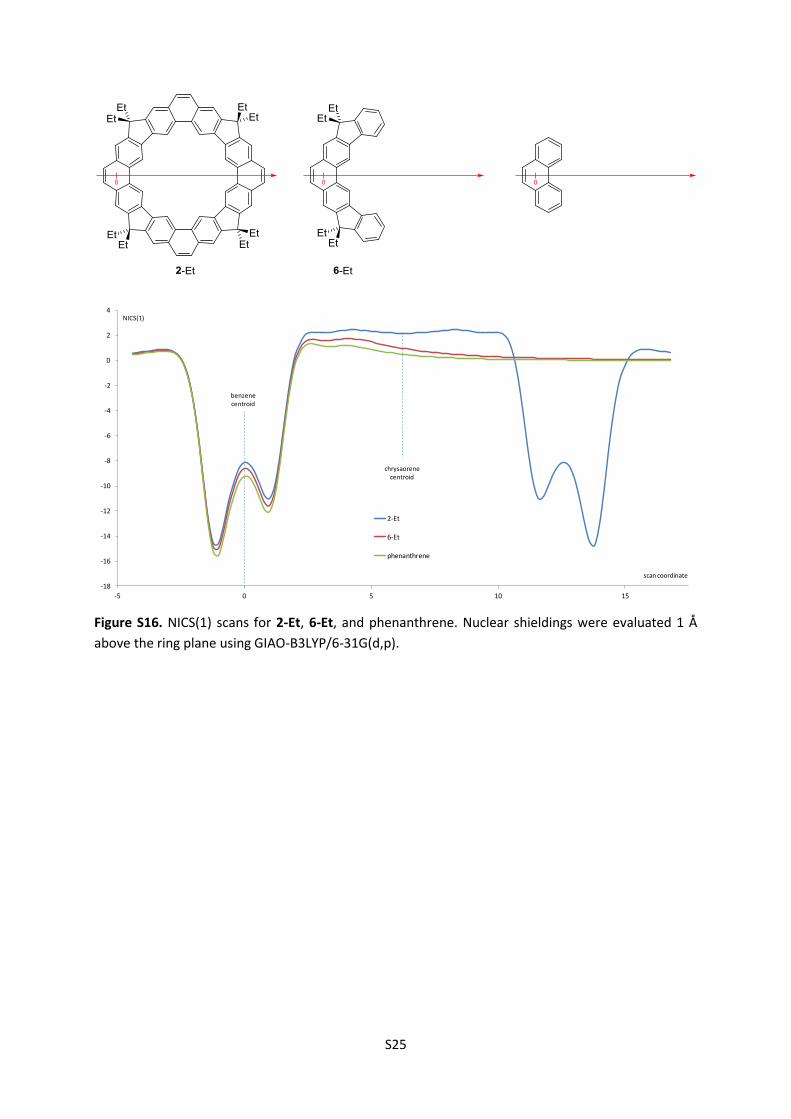
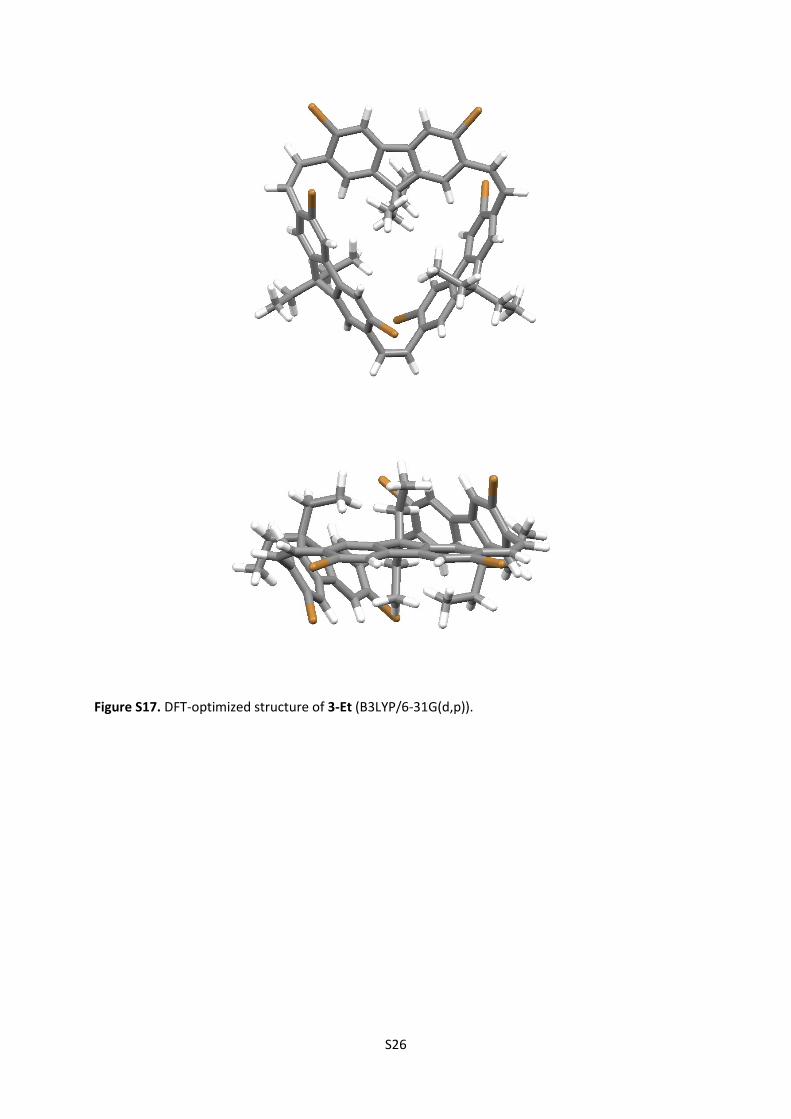
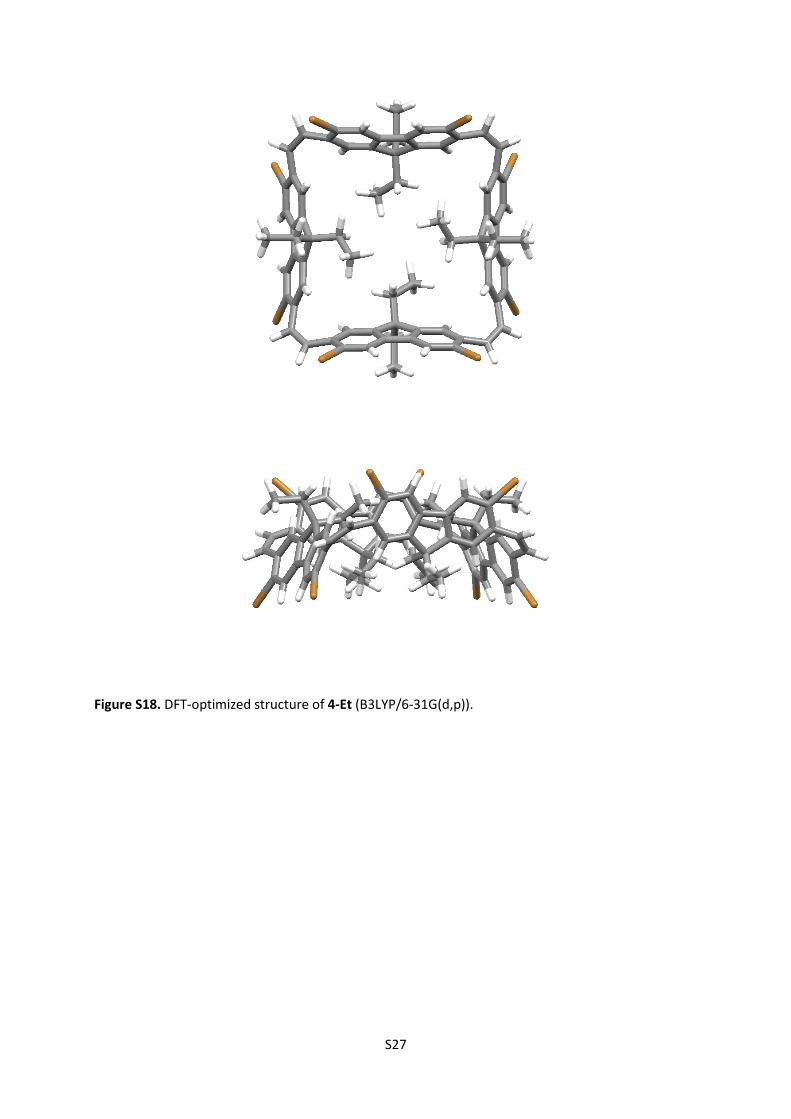
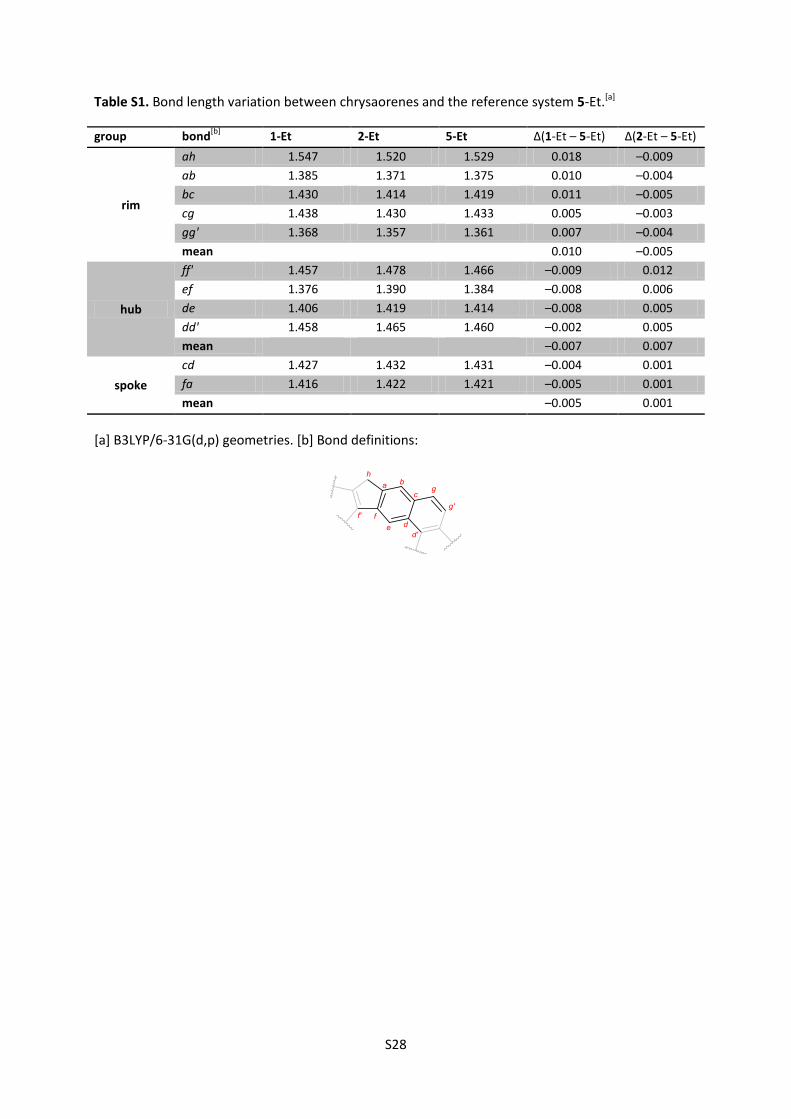
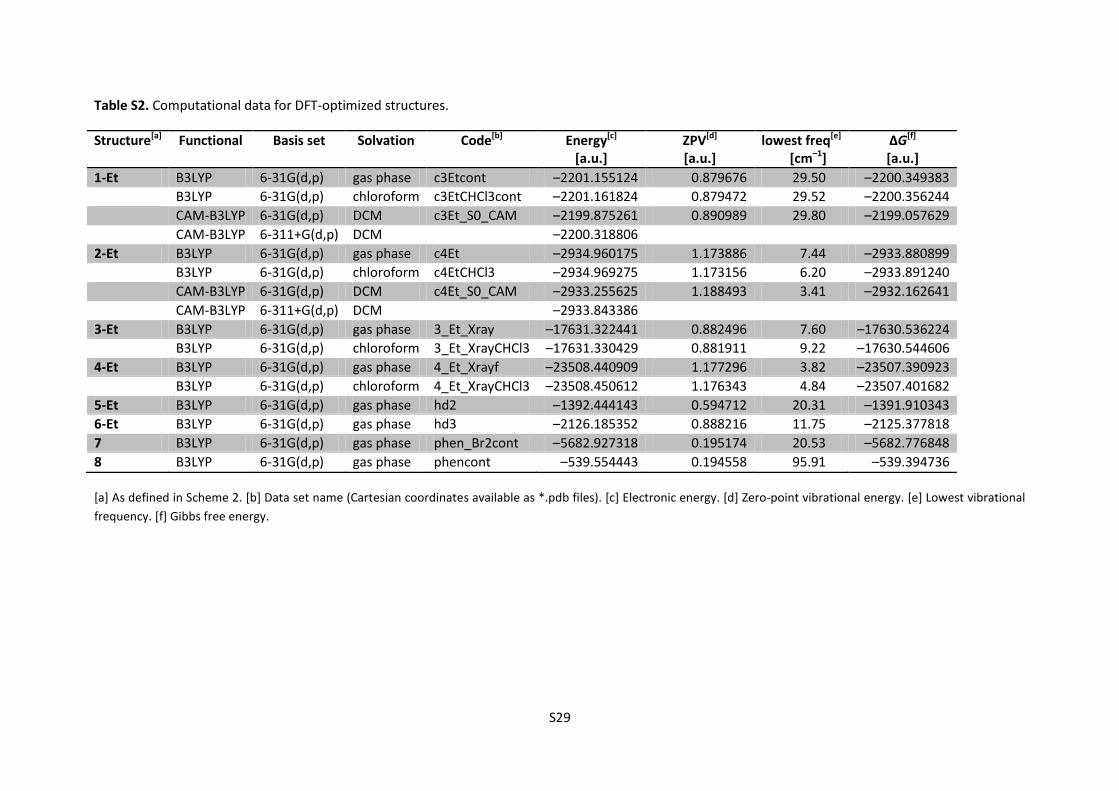
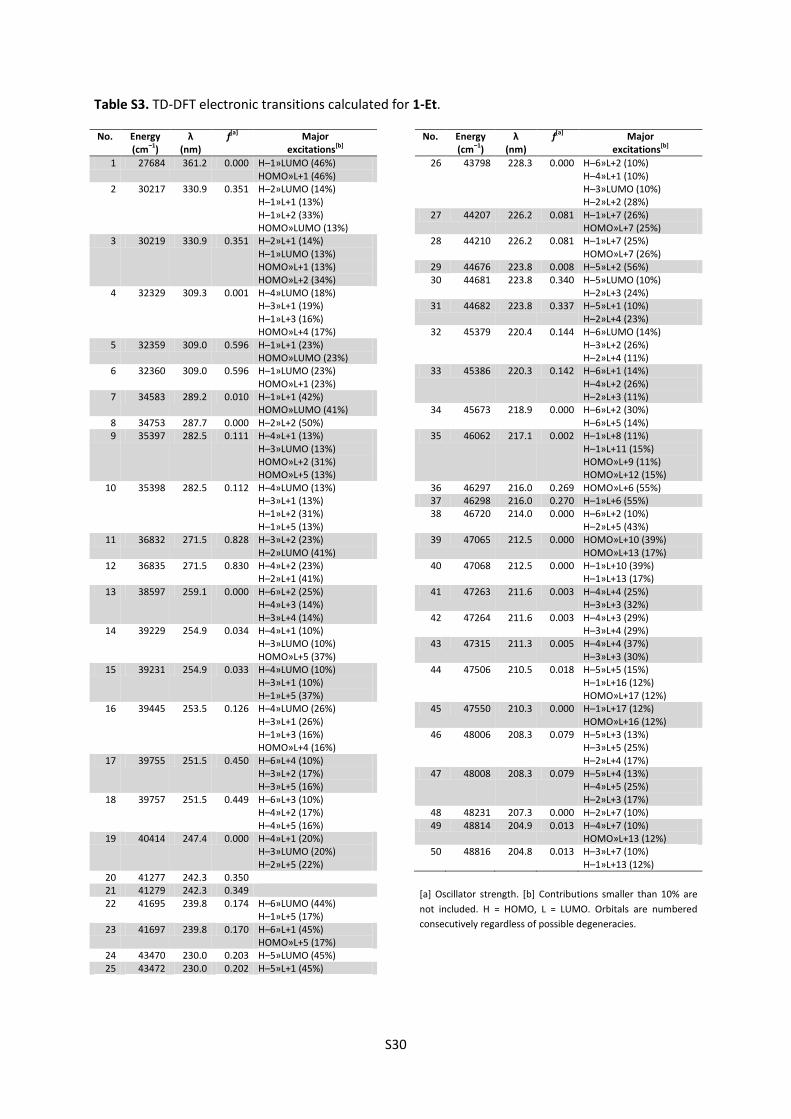
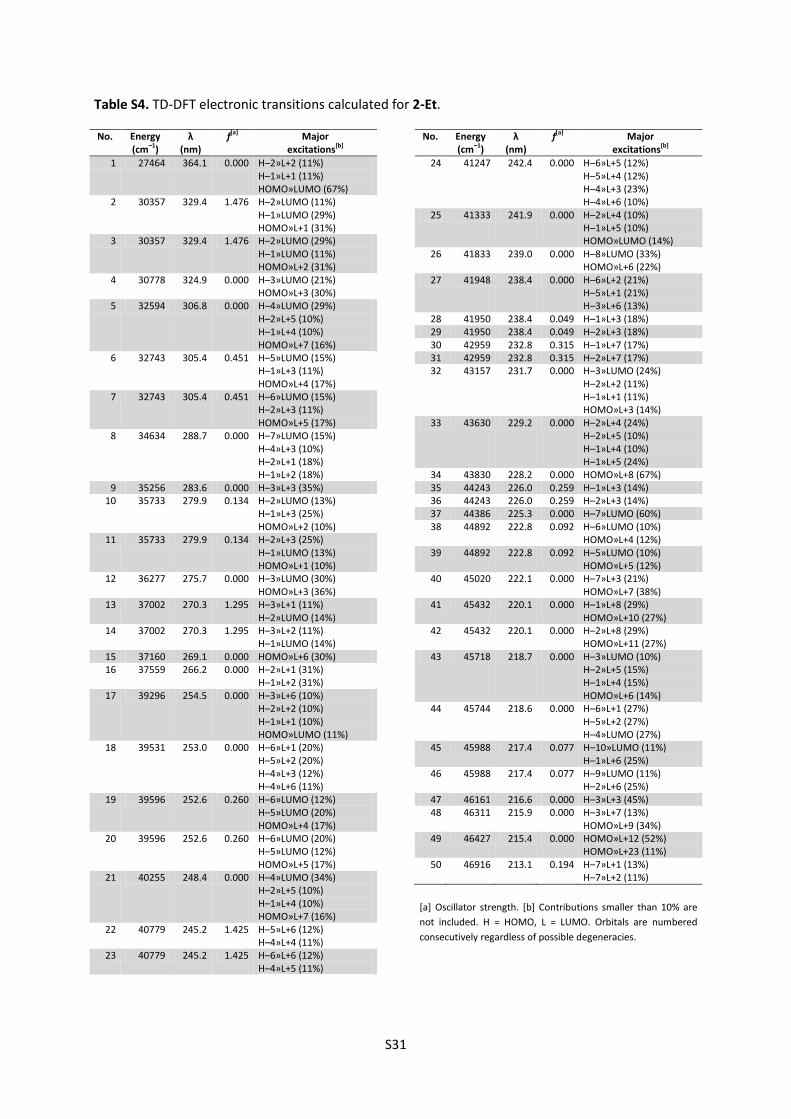
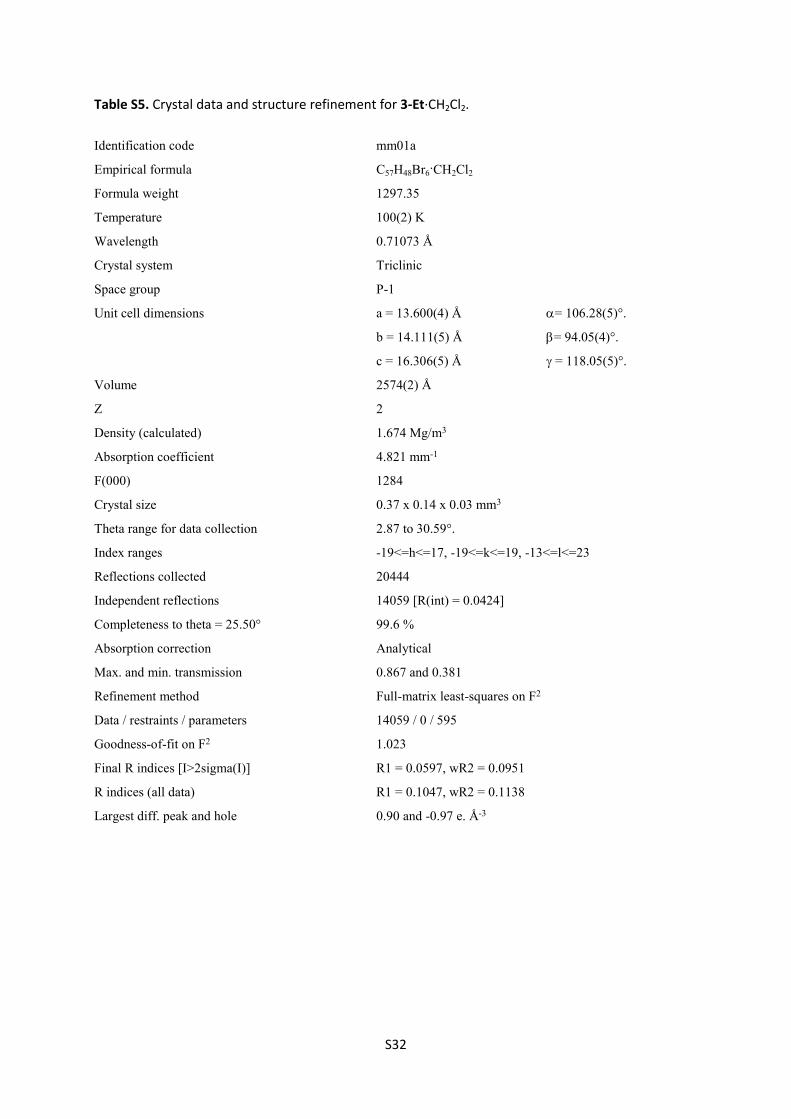
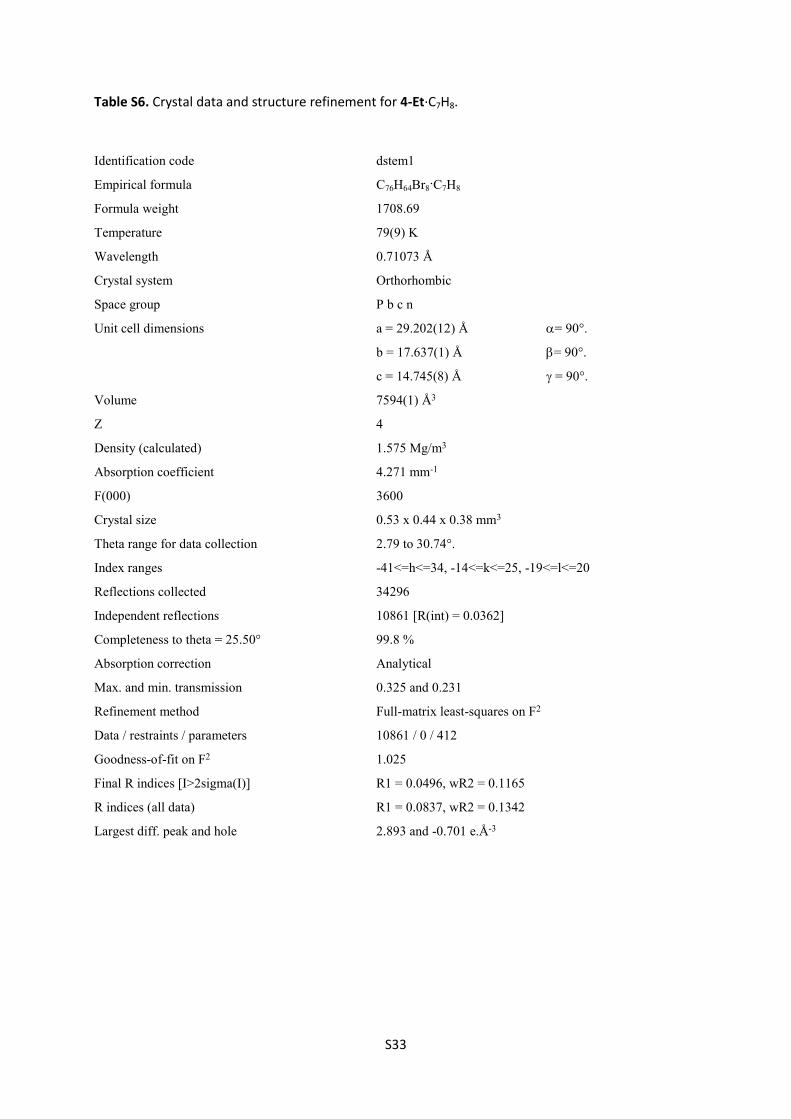
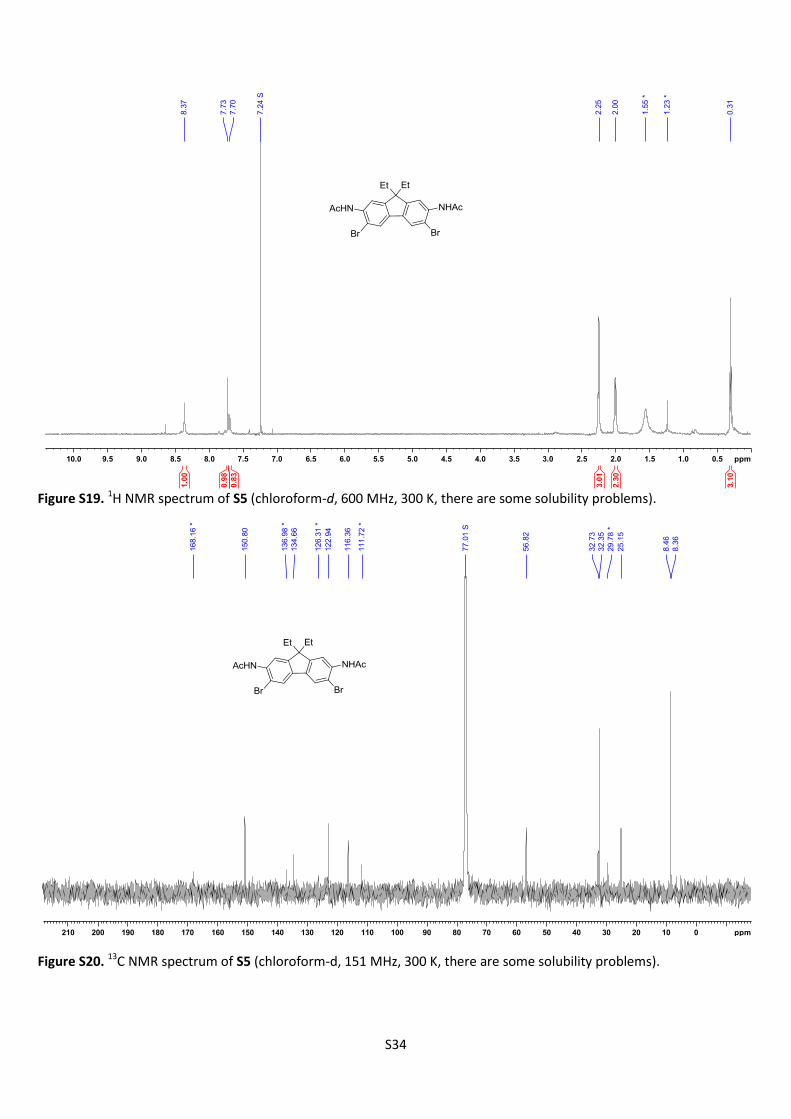
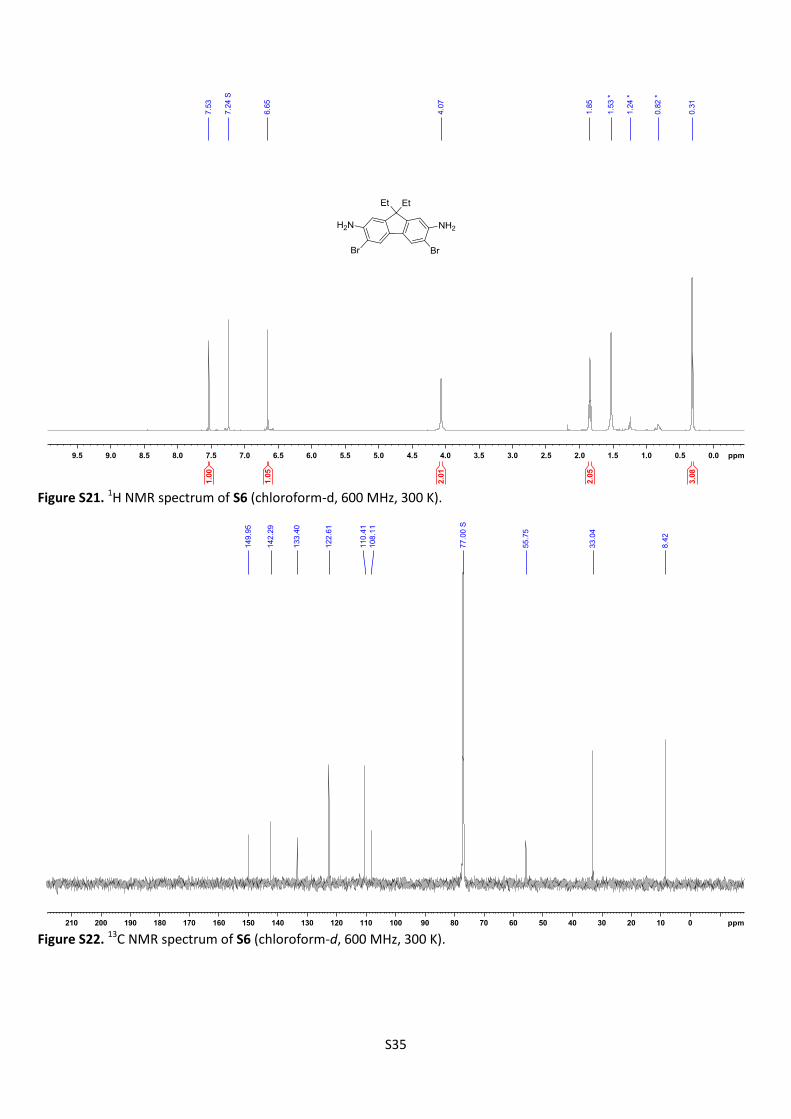
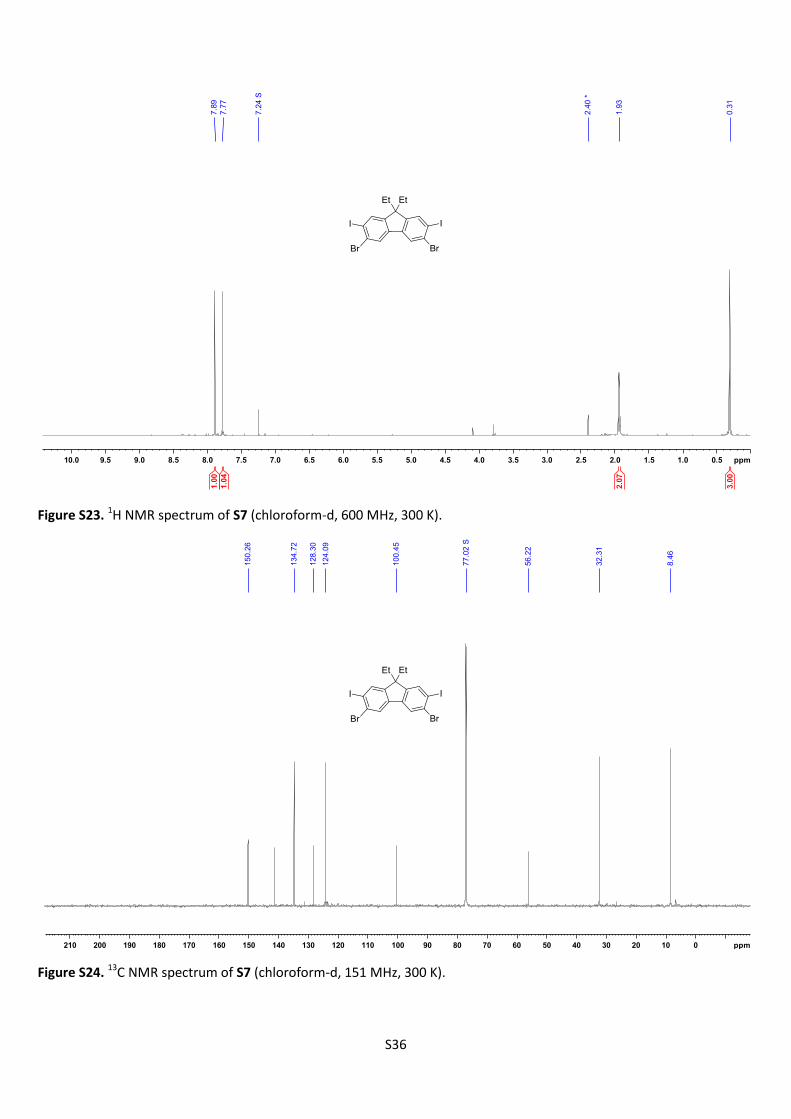
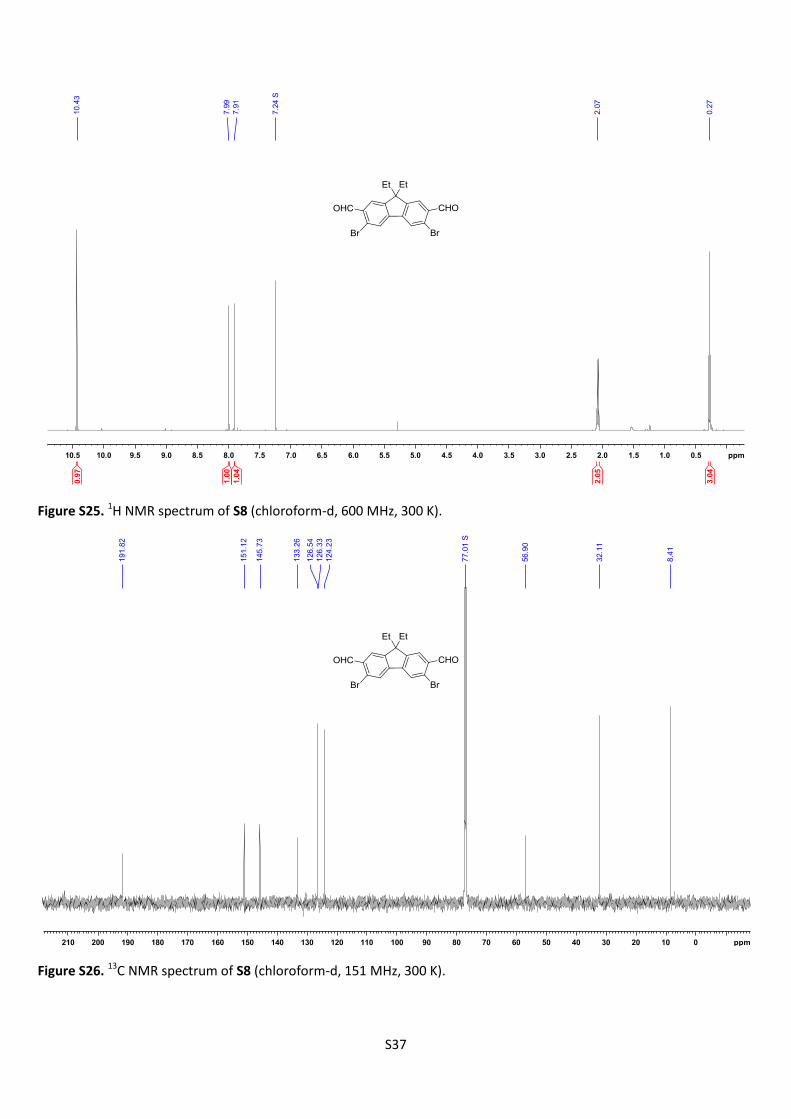
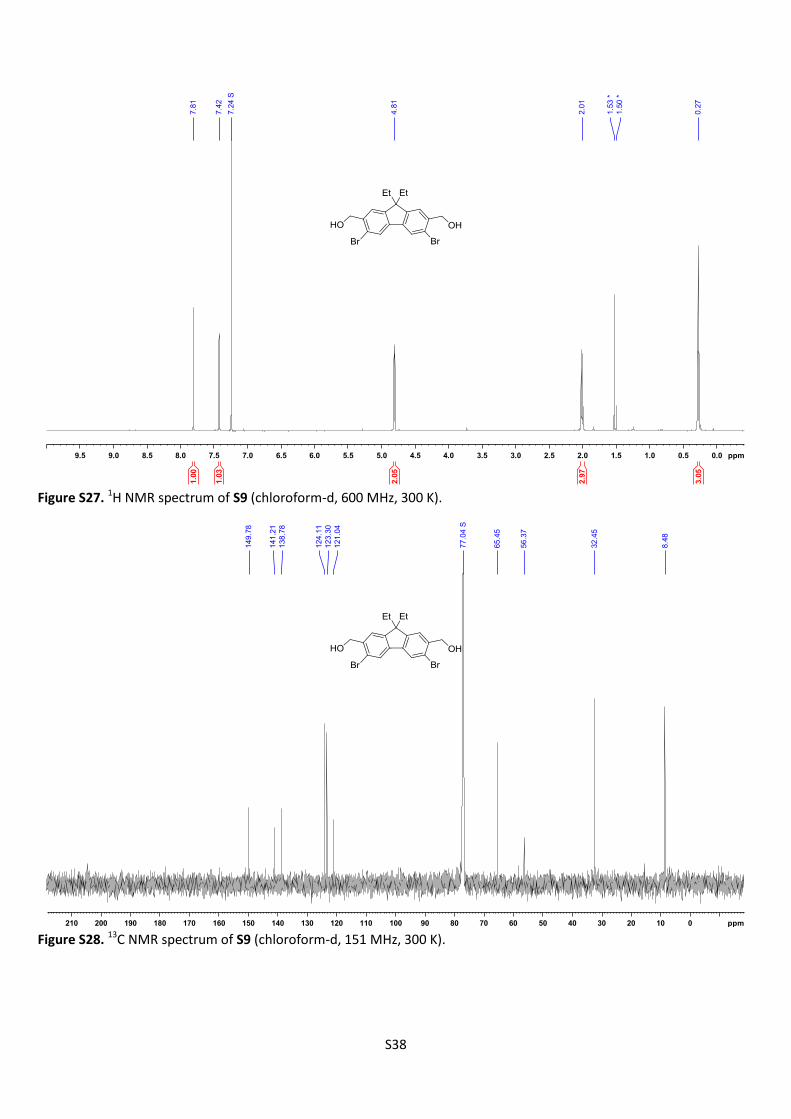
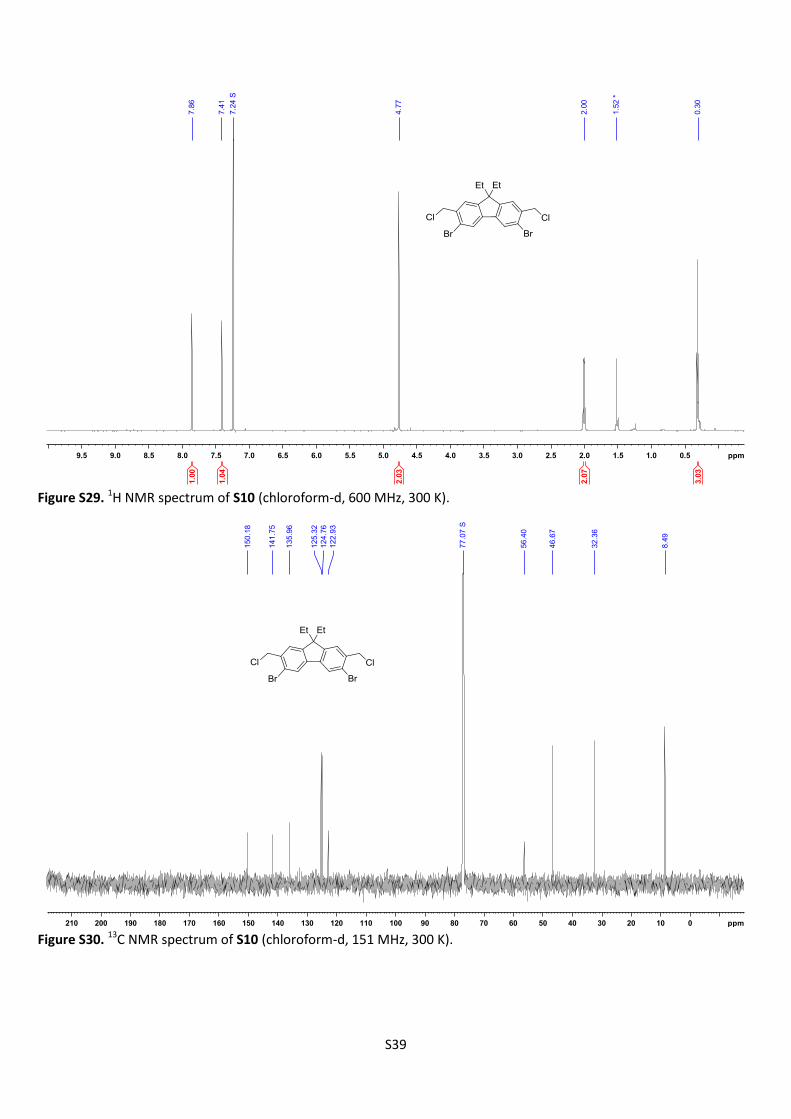
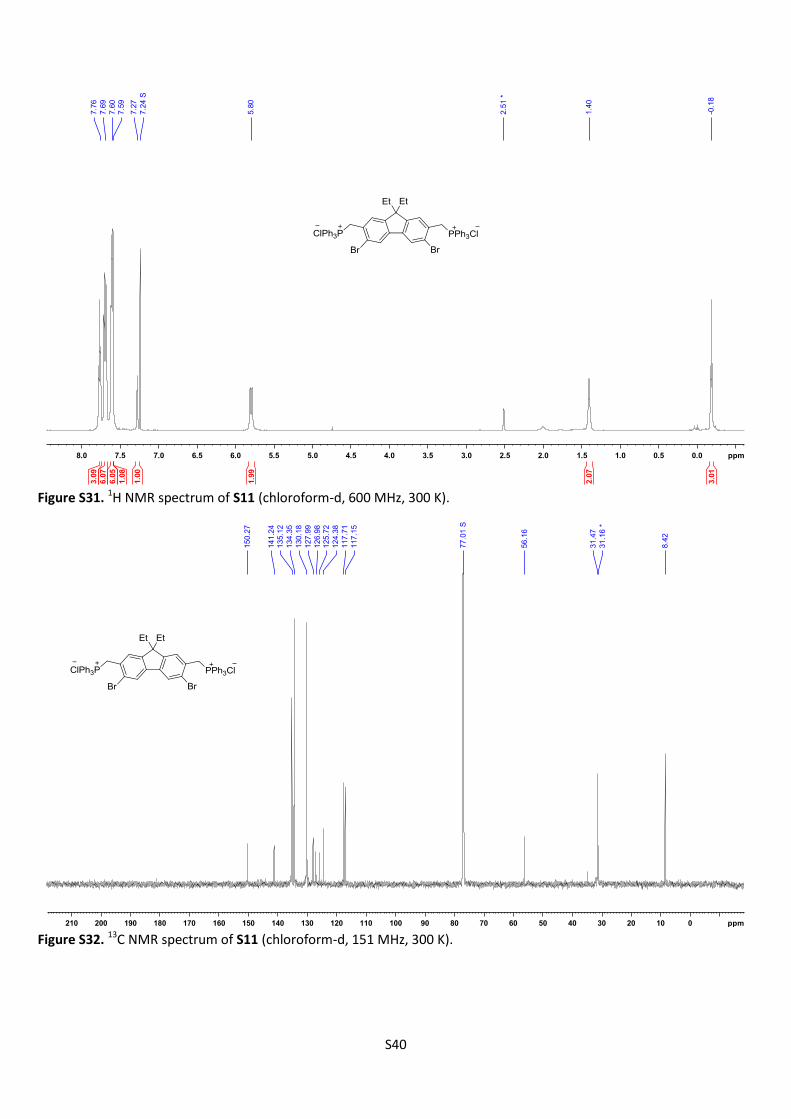
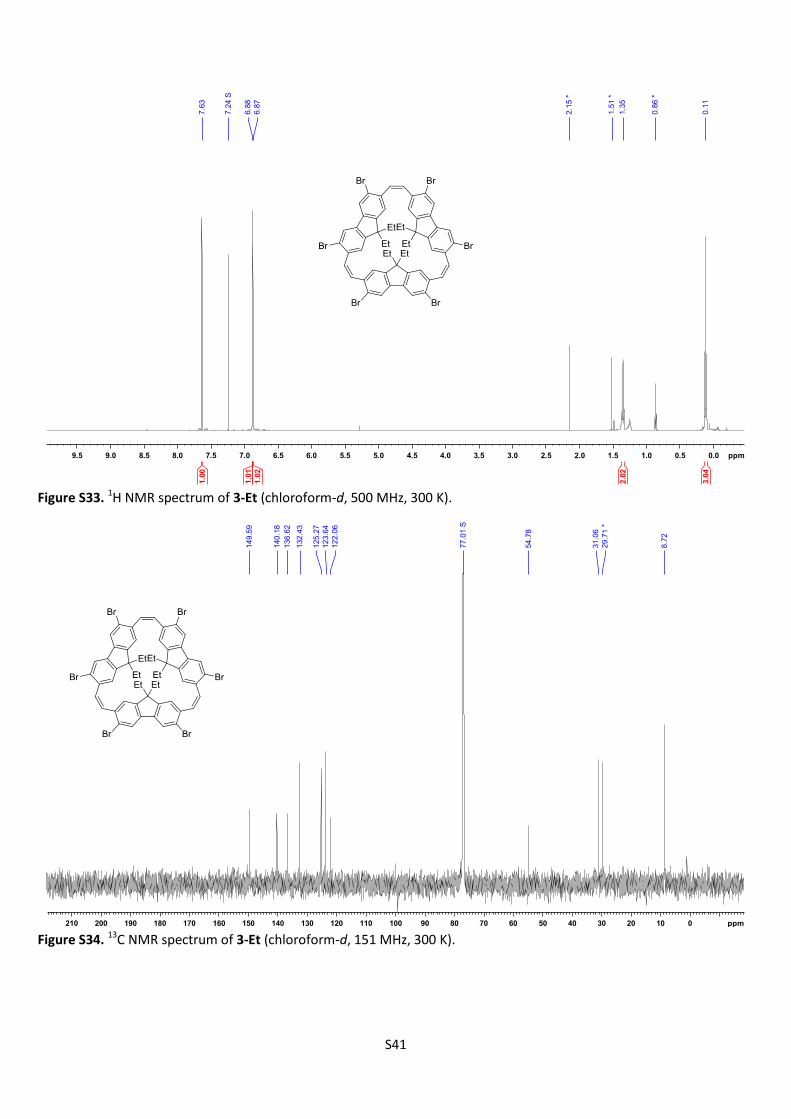
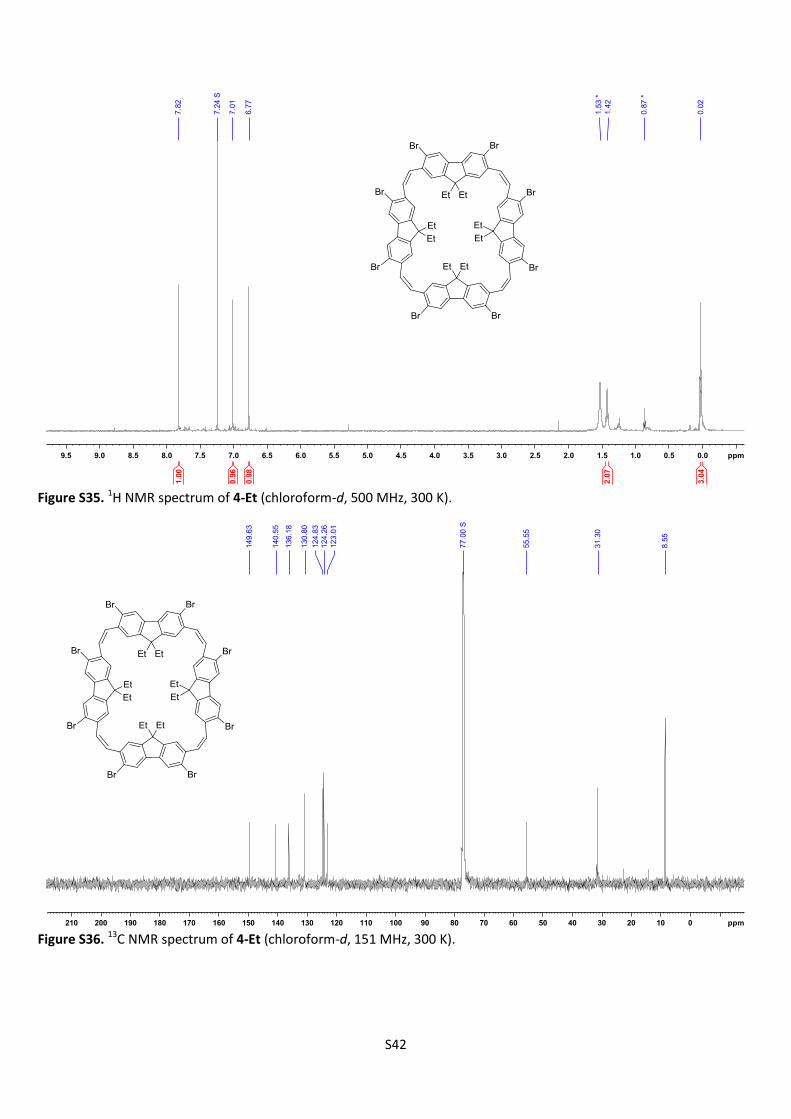
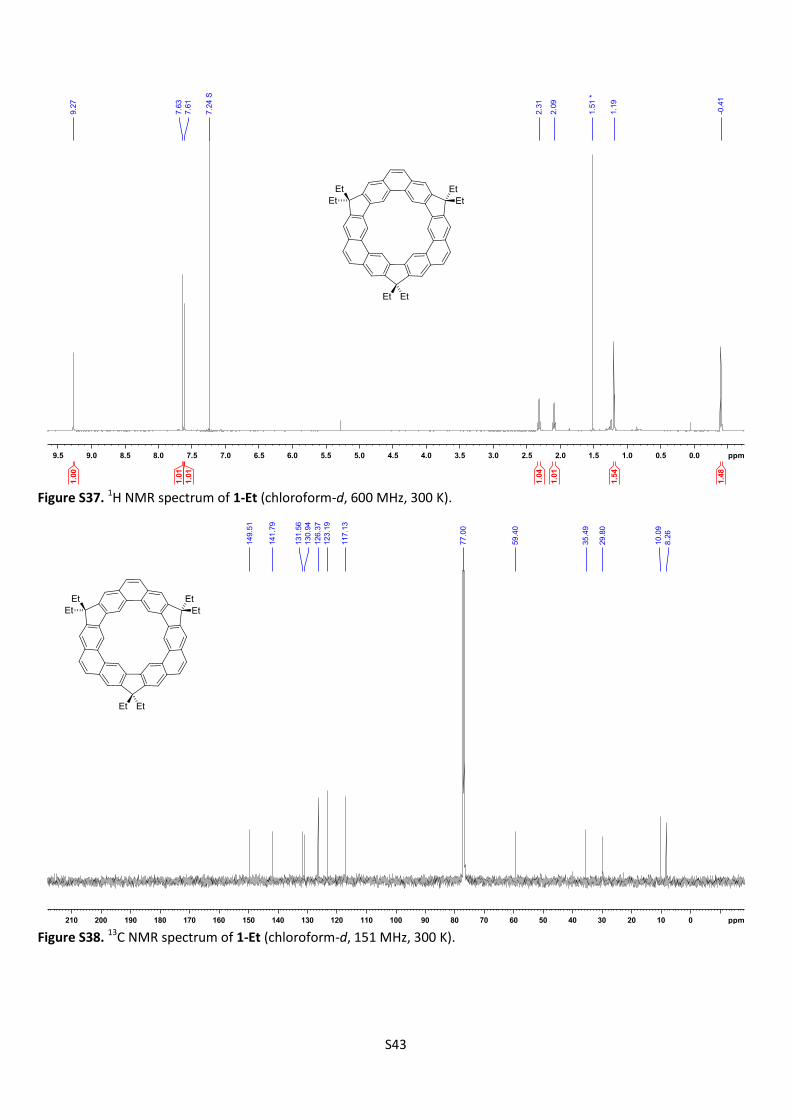
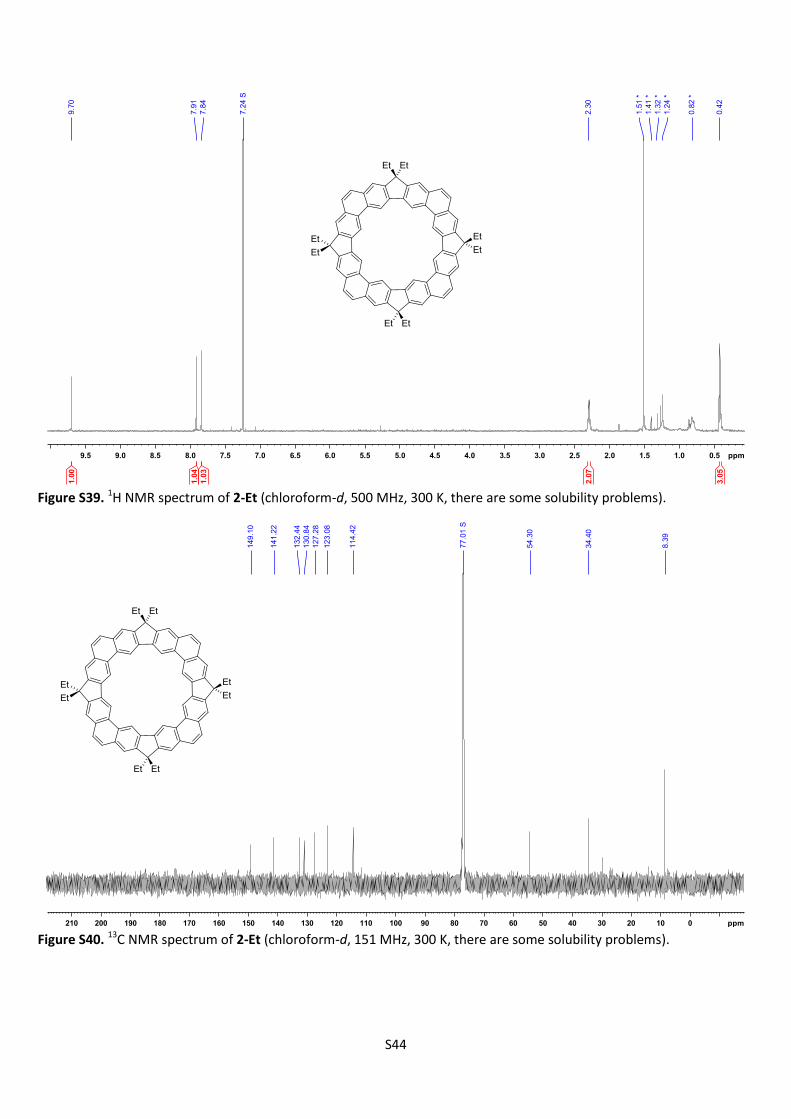
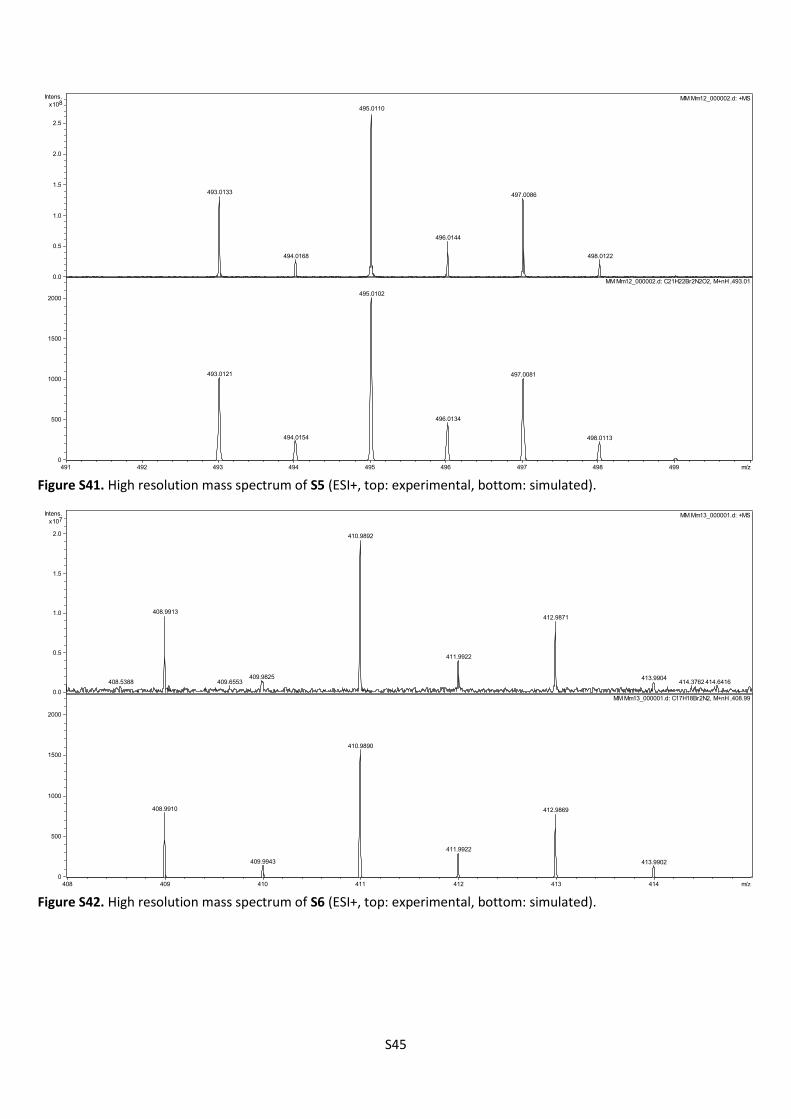
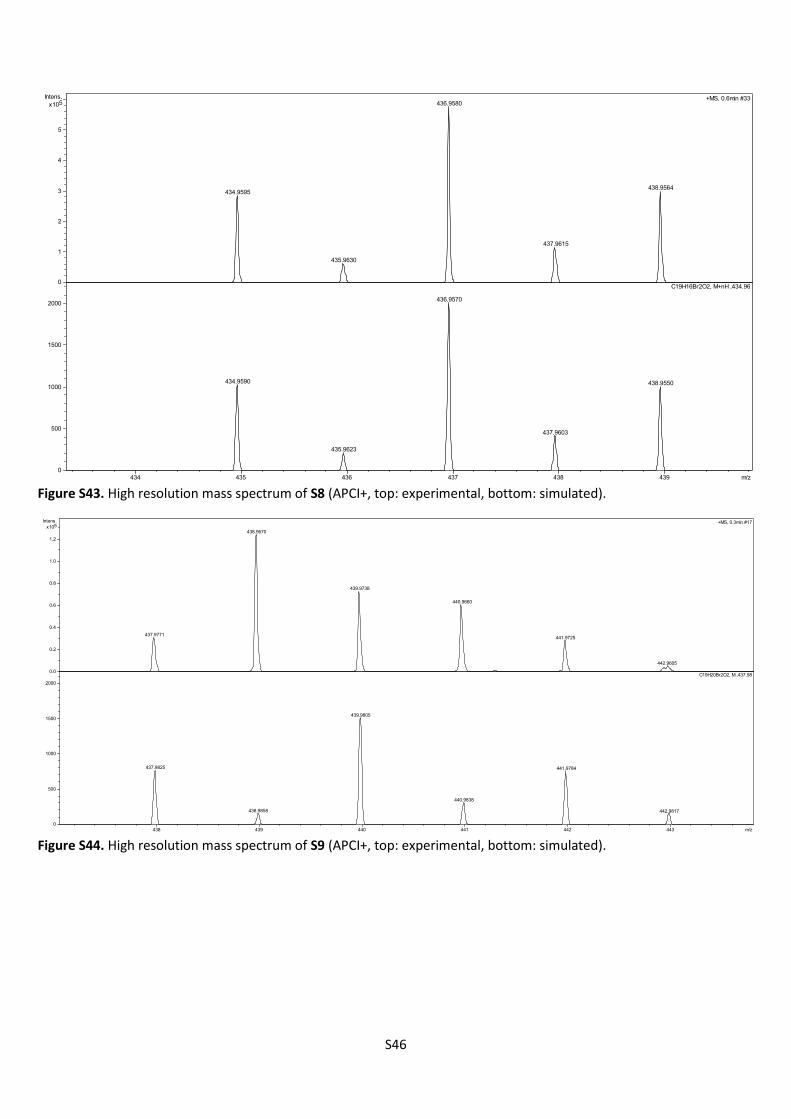
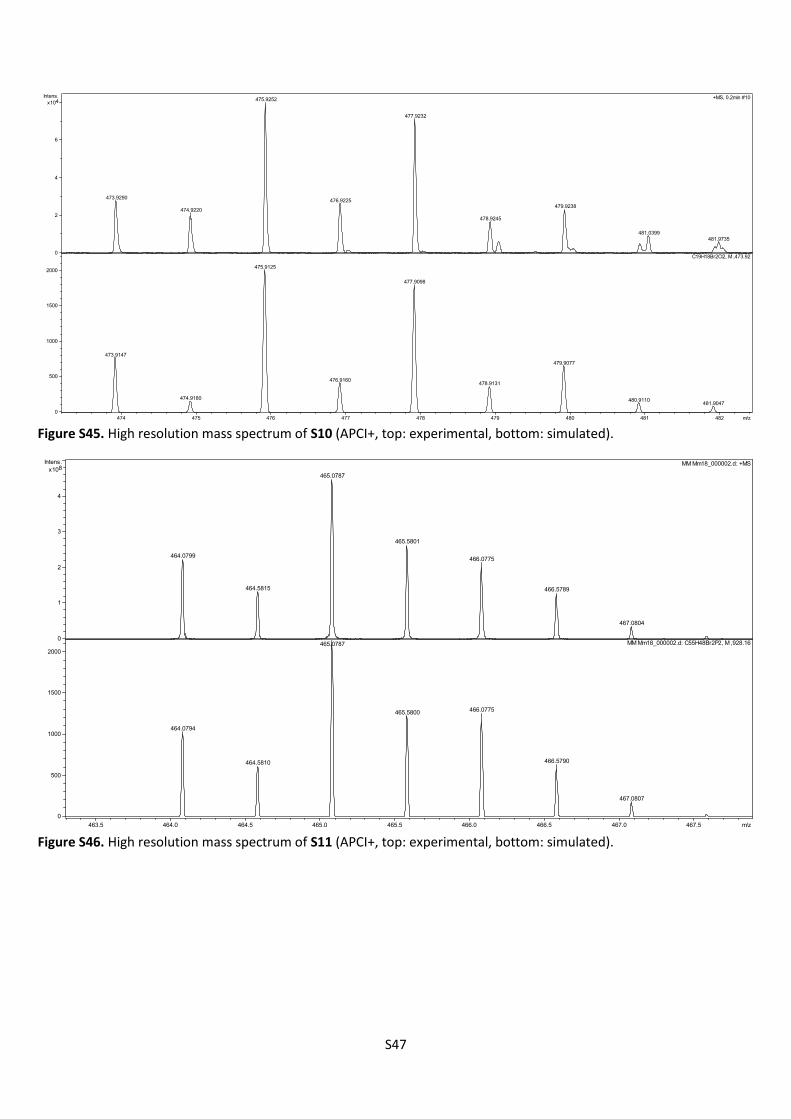
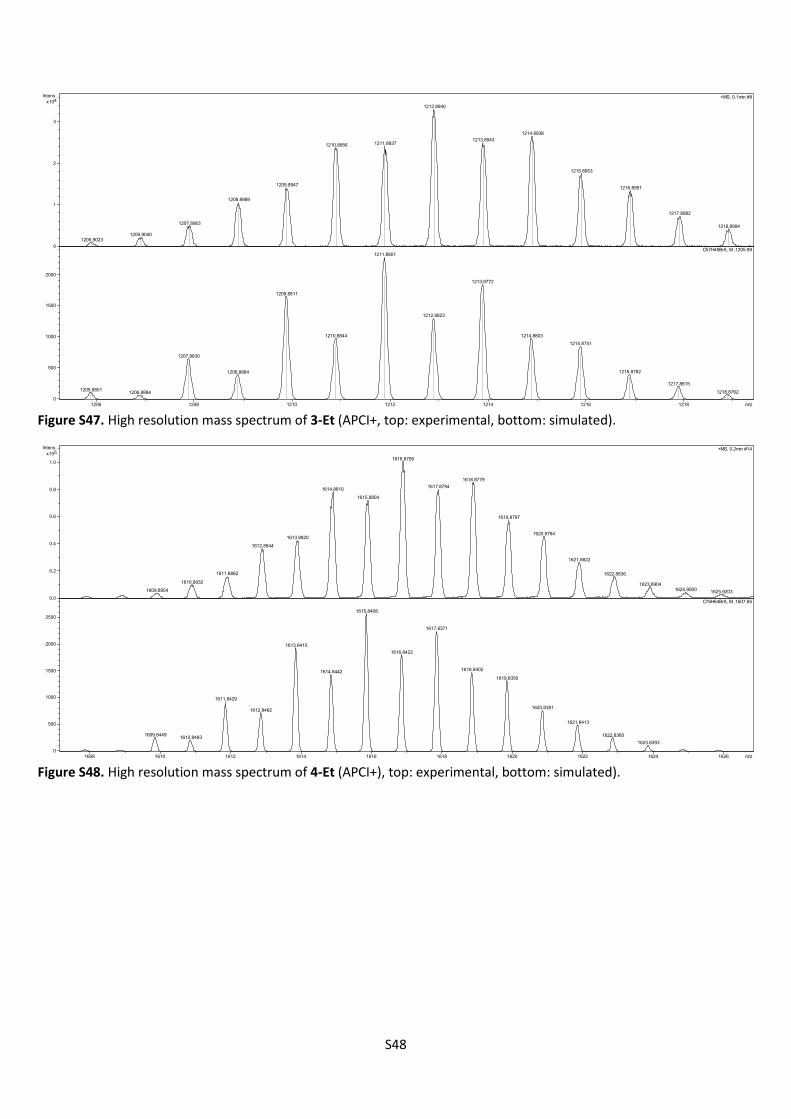
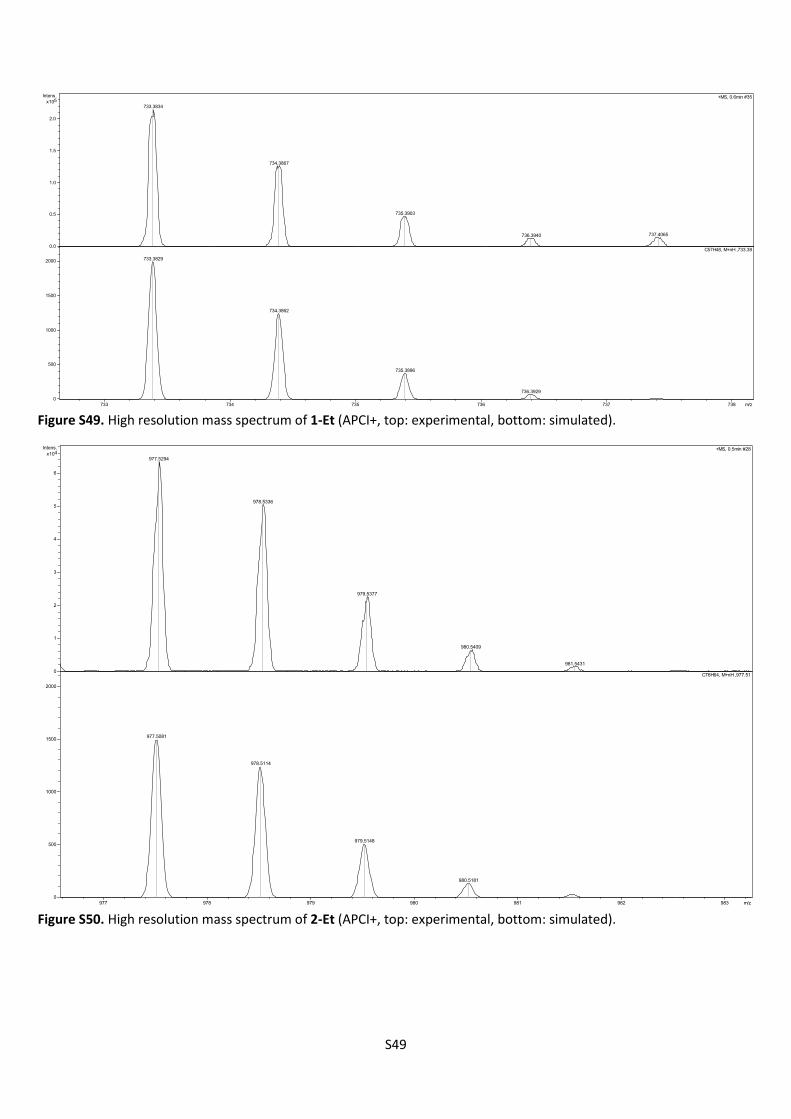