Embed Size (px)
Citation preview
11766 Phys. Chem. Chem. Phys., 2012, 14, 11766–11779 This journal is c the Owner Societies 2012
Cite this: Phys. Chem. Chem. Phys., 2012, 14, 11766–11779
Electronic properties and charge transfer phenomena in Pt nanoparticles
on c-Al2O3: size, shape, support, and adsorbate effectsw
F. Behafarid,aL. K. Ono,
aS. Mostafa,
aJ. R. Croy,
aG. Shafai,
aS. Hong,
a
T. S. Rahman,*aSimon R. Bare
band B. Roldan Cuenya*
a
Received 8th June 2012, Accepted 28th June 2012
DOI: 10.1039/c2cp41928a
This study presents a systematic detailed experimental and theoretical investigation of the electronic
properties of size-controlled free and g-Al2O3-supported Pt nanoparticles (NPs) and their evolution
with decreasing NP size and adsorbate (H2) coverage. A combination of in situ X-ray absorption
near-edge structure (XANES) and density functional theory (DFT) calculations revealed changes in
the electronic characteristics of the NPs due to size, shape, NP–adsorbate (H2) and NP–support
interactions. A correlation between the NP size, number of surface atoms and coordination of such
atoms, and the maximum hydrogen coverage stabilized at a given temperature is established, with
H/Pt ratios exceeding the 1 : 1 ratio previously reported for bulk Pt surfaces.
1. Introduction
Striking changes in the physical and chemical properties of small
metal nanoparticles (NPs) have been reported,1–7 and in some
cases assigned to size-dependent modifications of their electronic
properties, including metal/non-metal transitions, the discretiza-
tion of energy levels, and rehybridization of spd orbitals.2,8
Nevertheless, in addition to intrinsic changes in the NP proper-
ties brought about by specific geometrical features (e.g. NP size
and shape), the role of external influences such as adsorbate and
support effects must also be taken into consideration.
Although significant effort has been dedicated to the investi-
gation of geometric and environmental effects on the electro-
nic properties of metal NPs,9–17 some discrepancies still
remain in the literature regarding the interpretation of certain
experimental trends.16,18–21 These are due in part to the
challenge of synthesizing geometrically well-defined target
material systems, the difficulty of separating the different
influences on a given electronic property (since some correla-
tions exist among them), and the complexity of real-world
experimental NP supports, making related modeling descrip-
tions difficult.
In situ X-ray absorption near edge structure (XANES)
measurements have proven valuable for the study of intrinsic
and extrinsic effects on the electronic properties of
NPs,9–16,19,22–27 since this technique is sensitive to unoccupied
electronic states. The following differences have been observed
when comparing XANES data of nanoscale systems to bulk
systems: (i) modifications in the intensity of the absorption
edge peak (or white line, WL), (ii) an increase/decrease in the
width of the WL, and (iii) a shift in the energy of the
absorption edge. The extent of these modifications was found
to be strongly influenced by extrinsic effects. More specifically,
changes in L3 and L2 XANES spectra of metals upon chemi-
sorption can be explained in terms of orbital hybridization,
charge transfer, and metal–adsorbate scattering.
Although general agreement exists on the correlation
between the integrated area of the adsorption peak and the
amount of chemisorbed hydrogen,16,18–21 it is still unclear
whether the peak energy is influenced by the number of H
adsorption sites on the NP surface, the presence of co-adsorbates,
and the NP size/shape. In the absence of adsorbed hydrogen, a
narrowing of the electron density of states (DOS) and a shift of
the d-band center towards EF have been theoretically
described by comparing unsupported Pt6 NPs and Pt(111),
highlighting that intrinsic effects must also be considered.16
In addition to adsorbate effects, the interaction of the NPs
with the underlying support must also be addressed. This is,
however, a difficult task, since due to specifics of the most
common NP synthesis approaches used, a direct comparison
of the influence of different supports on NPs of identical
geometry (same size and shape) cannot normally be con-
ducted, leading to a convolution of support (extrinsic) and
size/shape (intrinsic) effects. Some groups report a lack of
correlation between the intensity of the absorption peak,
integrated area or energy, and the type of NP support,22,23,28
exclusively assigning the changes observed to adsorbate chemi-
sorption. On the other hand, a theoretical study of a Pt6 cluster
in a zeolite-LTL pore revealed a broadening of the WL for the
supported cluster with respect to bare Pt6 and a concomitant
decrease in the WL intensity in order to maintain the overall
aDepartment of Physics, University of Central Florida, Orlando,Florida 32816, USA. E-mail: [email protected], [email protected]
bUOP LLC, a Honeywell Company, Des Plaines, IL 60017, USAw Electronic supplementary information (ESI) available. See DOI:10.1039/c2cp41928a
PCCP Dynamic Article Links
www.rsc.org/pccp PAPER
This journal is c the Owner Societies 2012 Phys. Chem. Chem. Phys., 2012, 14, 11766–11779 11767
density of d-states constant.10 For Pt NPs on carbon nano-
tubes, the smaller WL of the NPs as compared to bulk Pt was
assigned to charge redistribution between C-2p and Pt-5d
states, which did not lead to the loss of charge.12 For Pt
NPs on SiO2, the increase in the WL observed was assigned to
charge transfer from Pt to SiO2.12 This is another controversial
aspect in the literature, since some groups explain the observed
changes in the XANES data (e.g. energy shift) based on charge
transfer phenomena (to/from adsorbates or the support),
while others on the formation of metal–adsorbate or metal–
support bonds (charge redistribution) leading to changes in
the electron density of states near the Fermi level.19,29 Further-
more, theoretically predicted fluctuating cluster–substrate
interactions and charge transfer phenomena for Pt10 on
g-Al2O3 were correlated with the positive energy shifts experi-
mentally observed with decreasing NP size and decreasing
measurement temperature.11
The present study takes advantage of state-of-the-art nano-
structure fabrication, characterization and ab initio modeling
to gain deep insight into the role played by the geometrical
structure of NPs (size and shape), support, and surface
adsorbates, on their electronic properties. Specifically, we used
size- and shape-selected Pt NPs (produced by micelle encapsu-
lation methods) supported on g-Al2O3 combined with syner-
gistic in situ XANES, cluster shape modeling, and density
functional theory (DFT). The ability of tuning the d-electron
density in supported NPs via a rational geometrical design is
key for the ultimate control of catalytic properties, since
reactivity is strongly influenced by the interaction of d-orbitals
of metals with valence orbitals of reactants.
2. Experimental and theoretical methods
(a) Sample preparation
Size- and shape-selected Pt NPs were prepared by micelle
encapsulation methods. Poly(styrene)-block-poly(2vinylpyridine)
[PS-P2VP] diblock copolymers were dissolved in toluene to
form inverse micelles. Size-selected Pt NPs are created by
dissolving H2PtCl6 into the polymeric solution. Subsequently,
the nanocrystalline g-Al2O3 support (Alfa Aesar, average
crystalline size B40 nm) is added. The Pt loading is 1% by
weight. The encapsulating ligands are eliminated by heating in
50% O2 balanced by He at 648 K for 24 hours. Different NP
sizes can be obtained by changing the molecular weight of the
head (P2VP) of the encapsulating polymer, the metal–P2VP
ratio (micelle loading), and the post-preparation annealing
treatment and atmosphere.30 Our micellar synthesis normally
leads to 3D-like NP structures. Nevertheless, the NP shape can
be changed from 3D to 2D by decreasing the metal loading
into the initially spherical polymeric micelles. Further details
on the sample preparation, synthesis parameters, and trans-
mission electron microscopy (TEM) characterization can be
found in ref. 30–35 and in Table 1.
(b) Structural, electronic characterization (XAFS), and
nanoparticle shape modeling
Pt-L3 edge X-ray absorption fine-structure spectroscopy
(XAFS) data were acquired at beamline X18B of the NSLS
at Brookhaven National Laboratory in transmission mode.
The XAFS samples were prepared by pressing the Pt/g-Al2O3
powders into thin pellets which were mounted in a cell
described previously,36,37 that permitted sample heating via
an external PID controller, liquid nitrogen cooling, as well as
the continuous flow of gases during data acquisition. A
Kapton window in the cell allows both in situX-ray transmission
and fluorescence measurements. A Pt foil was measured
simultaneously with all samples for energy alignment and
calibration purposes. Multiple scans were collected at each
temperature of interest and averaged in order to improve the
signal-to-noise ratio. Measurements were made at different
temperatures under H2 (50% H2 balanced with He for a total
flow rate of 50 ml min�1, S1–S9) and He (S2) atmospheres.
The sample measured in He was first reduced in H2 at 648 K.
Subsequently, the H2 environment was replaced by He and
XAFS data were acquired at different temperatures during
cooling from 648 K to 173 K.
Quantitative determination of the average NP shape was
carried out by analyzing low temperature (166–188 K) extended
X-ray absorption fine structure spectroscopy (EXAFS) data
up to the 4th nearest neighbor contribution, including multiple
scattering paths as described in ref. 30, 33 and 35 and
references therein. The r fitting range was 1.8 A to 5.7 A.
The shapes of our Pt NPs have been resolved by matching
structural information obtained experimentally via EXAFS
(coordination numbers up to the 4th nearest neighbor,
N1–N4) and TEM (NP diameter, d) to analogous data
extracted from a self-generated database containing B4000
model fcc NP shapes.30,38,39 Detailed structural characterization
of the present samples is given in ref. 30, 38 and 39. Additional
information on the determination of the NP shapes is included
in the ESI.w Table 1 shows the shapes that best fitted the
EXAFS and TEM data for each of the samples investigated
and contains information on the ratio of the number of Pt
atoms at the NP surface and perimeter to the total number of
atoms within each NP (Ns/Nt) and that of the number of Pt
atoms in contact with the support to the total number of
atoms within a NP (Nc/Nt) extracted from the selected model
NP shapes. As it is described in more detail in ref. 39, for each
of the samples containing small Pt NPs, only 2–3 similar
shapes were in good agreement with the EXAFS coordination
numbers and TEM diameter (including the experimental error
margins). No shapes are displayed in this manuscript for the
samples containing large NPs (S7–S9), since a large number of
cluster shapes are in agreement with the EXAFS coordination
numbers and TEM diameters.40
Changes in the morphology of our samples as a function of
temperature have not been accounted for in our analysis since
our EXAFS measurements were conducted up to a maximum
temperature of 648 K, which is the same temperature used for
sample calcination (24 h) prior to the in situ spectroscopy
analysis. If any changes in the NP morphology (size and/or
shape) were to occur at 648 K, they should have already taken
place before the XAFS measurements.
In order to gain insight into the electronic properties of Pt
NPs, we present here XANES spectra from the Pt-L3 absorption
edge. These data provide information on the binding energies
of 2p electrons (2p3/2 initial state) and the unoccupied ‘‘d’’
11768 Phys. Chem. Chem. Phys., 2012, 14, 11766–11779 This journal is c the Owner Societies 2012
electron density of states near the Fermi level (d5/2 + d3/2 states).
Since the intensity and integrated area of the Pt-L3 absorption
peak are considered to be proportional to the density of
unoccupied 5d electronic states, they can be used to extract
information on d-level electronic charge redistributions.41 It
should be noted that our experimental set-up, along with our
calibration procedures, allows us to discern relative energy
shifts in the XANES peak position with sensitivity of about
0.1 eV. In order to obtain the peak position, the experimental
data were fitted with a spline curve. In the following section,
we will also provide information on the changes of the area
of the Pt-L3 absorption peak. Different methods have been
used in the literature to calculate this area before and after
NP/adsorbate exposure.15,16,19,20,22,23,42–45 We have used the
area of the second feature (called peak B) observed in raw (not
artificially aligned) difference DXANES spectra as the repre-
sentative parameter. In particular, DXANES areas were
obtained by subtracting the XANES spectrum of the NPs at
648 K from that of the same sample measured at a given lower
temperature, both in hydrogen. In the literature, some authors
have shown similar DXANES plots using as reference spectra
from a Pt foil,16,23 or NPs measured under He16,19,42 and
vacuum.15,20–23,25 Due to the inherent experimental difficulty
of preventing the effect of trace oxygen and moisture possibly
leading to the oxidization of small Pt NPs in conventional
XAFS-compatible cells in the absence of H2, we decided to use
as reference our highest temperature XANES spectra measured
under H2,20 since a minimum H coverage on the NP surface is
expected under those conditions, and lack of chemisorbed
oxygen and/or NP oxidation is ensured under the continuous
H2 flow employed here. Additionally, total spectral areas
were also obtained in the energy range between 11 564 and
11580.6 eV after alignment of all NP spectra, Fig. S3(b) (ESIw).
(c) Theoretical methods
DFT calculations46 were performed using the pseudopotential
approximation and the projector augmented wave method, as
implemented in the Vienna Ab-Initio Simulation Package
(VASP).47,48 The Kohn–Sham wave functions are expanded
in the plane wave basis with a kinetic energy cutoff of 400 eV,
and the Perdew–Burke–Ernzerhof functional used for the
exchange–correlation energy.49 Both unsupported bare Pt
NPs (Pt22, Pt33, Pt44, Pt55, and Pt85) and hydrogen-adsorbed
Pt NPs (Pt22Hx, x = 18, 22, 25, 27, 29, 31, 45, 59 and Pt44Hx,
x = 44, 60, 66) were investigated to provide insight into the
experimental data. The H-adsorbed structures of Pt22Hx and
Pt44Hx were prepared by first filling all low coordinated sites
on the NPs with hydrogen atoms, followed by full ionic
relaxation. Additional details of the model for the bare and
hydrogen-adsorbed Pt NPs (Pt22Hx, x=22, 25, 27, 29, 31) can
be found elsewhere.38 The adsorption energy of a hydrogen
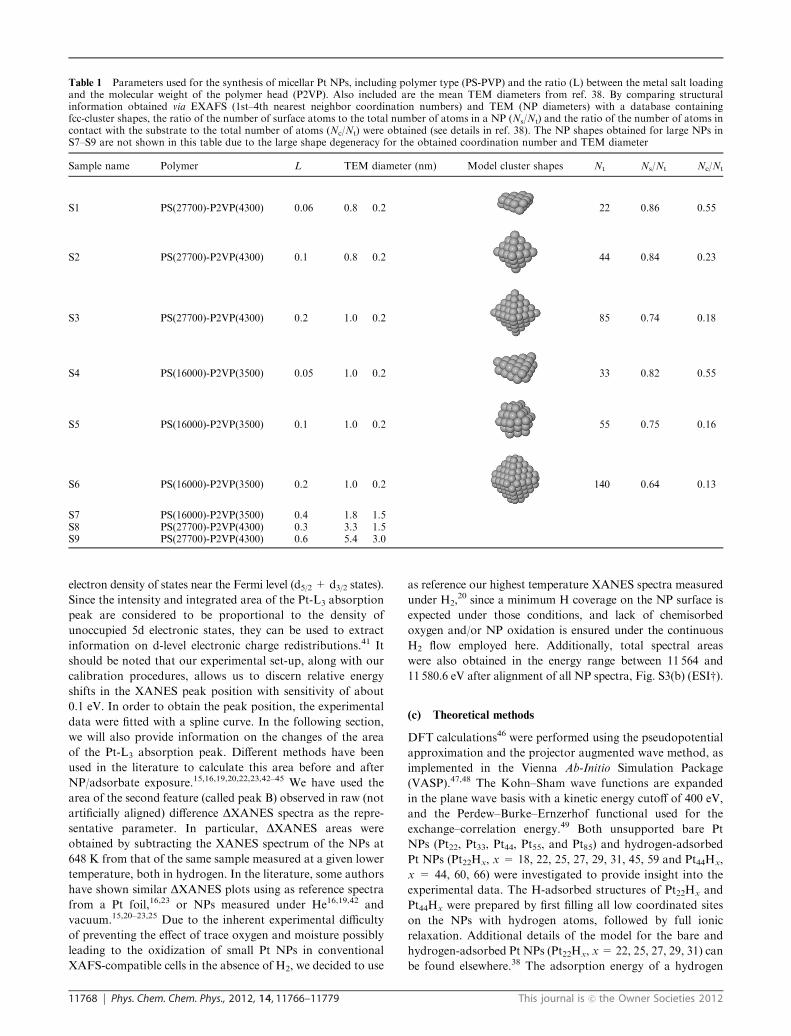
Table 1 Parameters used for the synthesis of micellar Pt NPs, including polymer type (PS-PVP) and the ratio (L) between the metal salt loadingand the molecular weight of the polymer head (P2VP). Also included are the mean TEM diameters from ref. 38. By comparing structuralinformation obtained via EXAFS (1st–4th nearest neighbor coordination numbers) and TEM (NP diameters) with a database containingfcc-cluster shapes, the ratio of the number of surface atoms to the total number of atoms in a NP (Ns/Nt) and the ratio of the number of atoms incontact with the substrate to the total number of atoms (Nc/Nt) were obtained (see details in ref. 38). The NP shapes obtained for large NPs inS7–S9 are not shown in this table due to the large shape degeneracy for the obtained coordination number and TEM diameter
Sample name Polymer L TEM diameter (nm) Model cluster shapes Nt Ns/Nt Nc/Nt
S1 PS(27700)-P2VP(4300) 0.06 0.8 � 0.2 22 0.86 0.55
S2 PS(27700)-P2VP(4300) 0.1 0.8 � 0.2 44 0.84 0.23
S3 PS(27700)-P2VP(4300) 0.2 1.0 � 0.2 85 0.74 0.18
S4 PS(16000)-P2VP(3500) 0.05 1.0 � 0.2 33 0.82 0.55
S5 PS(16000)-P2VP(3500) 0.1 1.0 � 0.2 55 0.75 0.16
S6 PS(16000)-P2VP(3500) 0.2 1.0 � 0.2 140 0.64 0.13
S7 PS(16000)-P2VP(3500) 0.4 1.8 � 1.5S8 PS(27700)-P2VP(4300) 0.3 3.3 � 1.5S9 PS(27700)-P2VP(4300) 0.6 5.4 � 3.0
This journal is c the Owner Societies 2012 Phys. Chem. Chem. Phys., 2012, 14, 11766–11779 11769
atom on a Pt NP was calculated by using Ead = (E[PtmHx] –
E[Ptm] – x/2*E[H2])/x, where E[] represents the DFT total
energy of the NP of interest, and m and x are the number of Pt
and H atoms in the NP, respectively. A supercell of dimension
about 22 � 22 � 22 A3 was used for the smaller NPs
(Pt22, Pt33, Pt44, Pt55) and 27 � 27 � 27 A3 for Pt85. Because
of the large size of the supercells used, only a single k-point
was found to be sufficient for sampling the Brillouin zone. A
Fermi-level smearing of 0.1 eV was used. The threshold for
electronic energy convergence was set to 2 � 10�6 eV, and that
for structural optimization to o1 � 102 eV A�1. A standard
quasi-Newtonian algorithm implemented in VASP was
used for structural optimization. The angular-momentum-
decomposed, local densities of states of the NPs were calcu-
lated by projecting the wave function into a sphere of radius of
1.45 A centered at each Pt atom. Bader charge analysis48,49
was performed to investigate charge transfer/redistribution
upon H adsorption for Pt22 and Pt44 NPs.
3. Results
(a) Electronic properties (XANES)
The effects of the Pt NP size, shape, support, and chemical
environment (adsorbates) on their electronic properties were
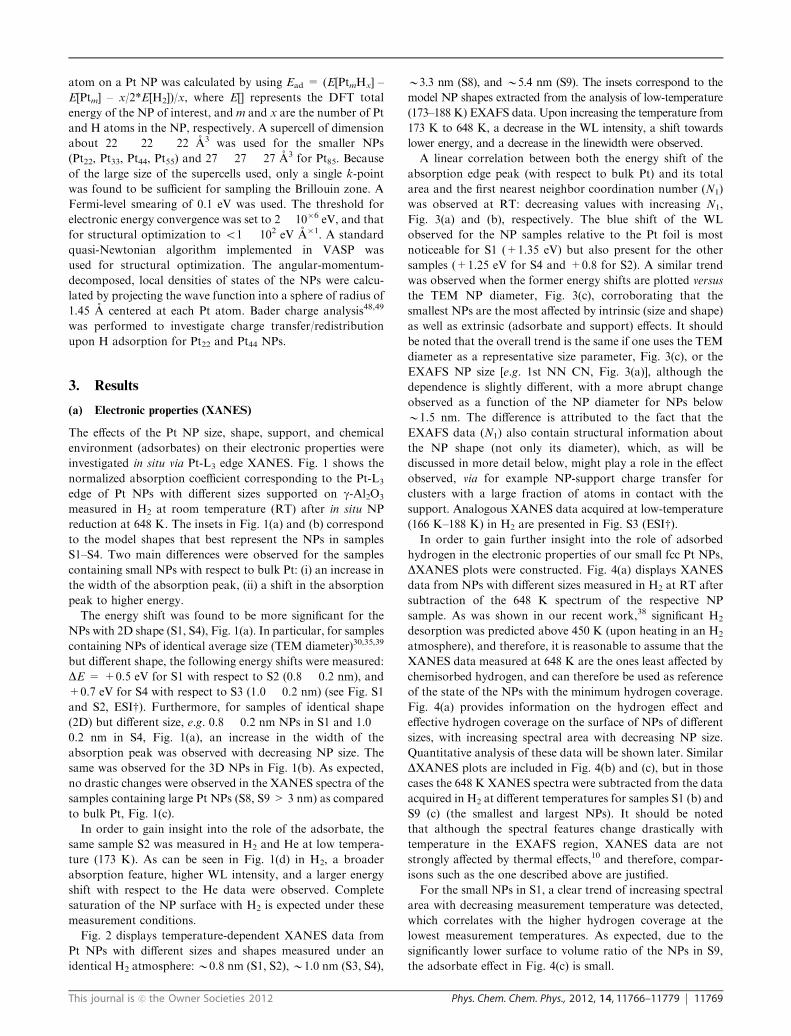
investigated in situ via Pt-L3 edge XANES. Fig. 1 shows the
normalized absorption coefficient corresponding to the Pt-L3
edge of Pt NPs with different sizes supported on g-Al2O3
measured in H2 at room temperature (RT) after in situ NP
reduction at 648 K. The insets in Fig. 1(a) and (b) correspond
to the model shapes that best represent the NPs in samples
S1–S4. Two main differences were observed for the samples
containing small NPs with respect to bulk Pt: (i) an increase in
the width of the absorption peak, (ii) a shift in the absorption
peak to higher energy.
The energy shift was found to be more significant for the
NPs with 2D shape (S1, S4), Fig. 1(a). In particular, for samples
containing NPs of identical average size (TEM diameter)30,35,39
but different shape, the following energy shifts were measured:
DE = +0.5 eV for S1 with respect to S2 (0.8 � 0.2 nm), and
+0.7 eV for S4 with respect to S3 (1.0 � 0.2 nm) (see Fig. S1
and S2, ESIw). Furthermore, for samples of identical shape
(2D) but different size, e.g. 0.8 � 0.2 nm NPs in S1 and 1.0 �0.2 nm in S4, Fig. 1(a), an increase in the width of the
absorption peak was observed with decreasing NP size. The
same was observed for the 3D NPs in Fig. 1(b). As expected,
no drastic changes were observed in the XANES spectra of the
samples containing large Pt NPs (S8, S9 > 3 nm) as compared
to bulk Pt, Fig. 1(c).
In order to gain insight into the role of the adsorbate, the
same sample S2 was measured in H2 and He at low tempera-
ture (173 K). As can be seen in Fig. 1(d) in H2, a broader
absorption feature, higher WL intensity, and a larger energy
shift with respect to the He data were observed. Complete
saturation of the NP surface with H2 is expected under these
measurement conditions.
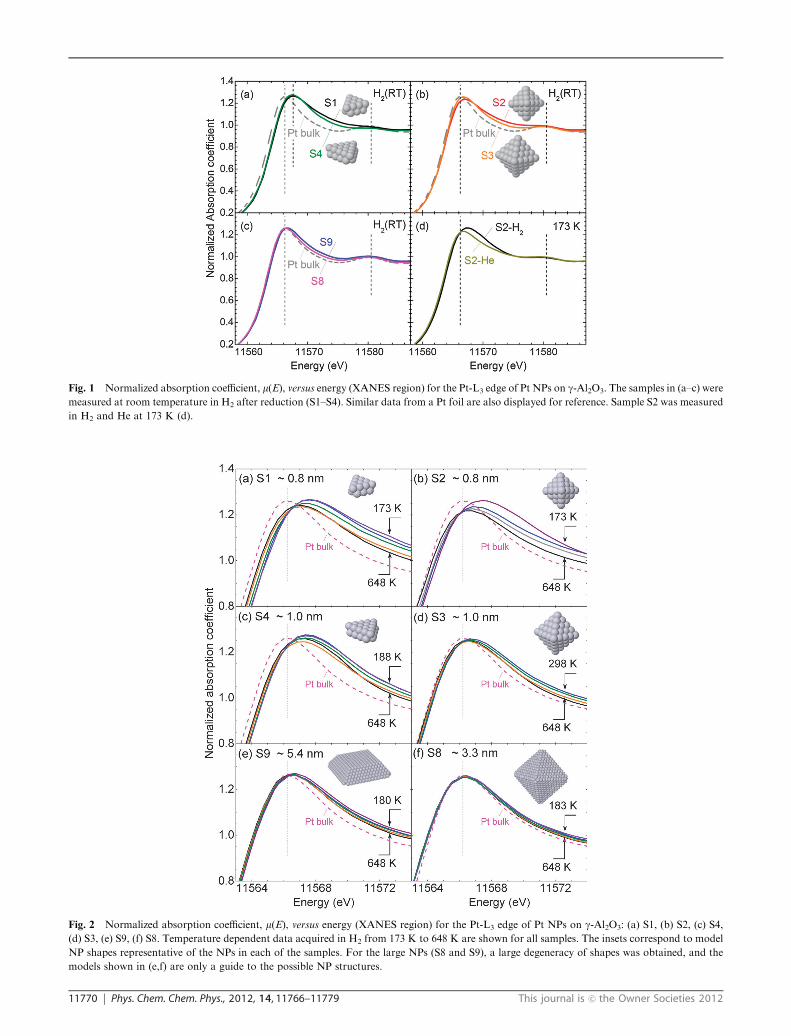
Fig. 2 displays temperature-dependent XANES data from
Pt NPs with different sizes and shapes measured under an
identical H2 atmosphere: B0.8 nm (S1, S2),B1.0 nm (S3, S4),
B3.3 nm (S8), and B5.4 nm (S9). The insets correspond to the
model NP shapes extracted from the analysis of low-temperature
(173–188 K) EXAFS data. Upon increasing the temperature from
173 K to 648 K, a decrease in the WL intensity, a shift towards
lower energy, and a decrease in the linewidth were observed.
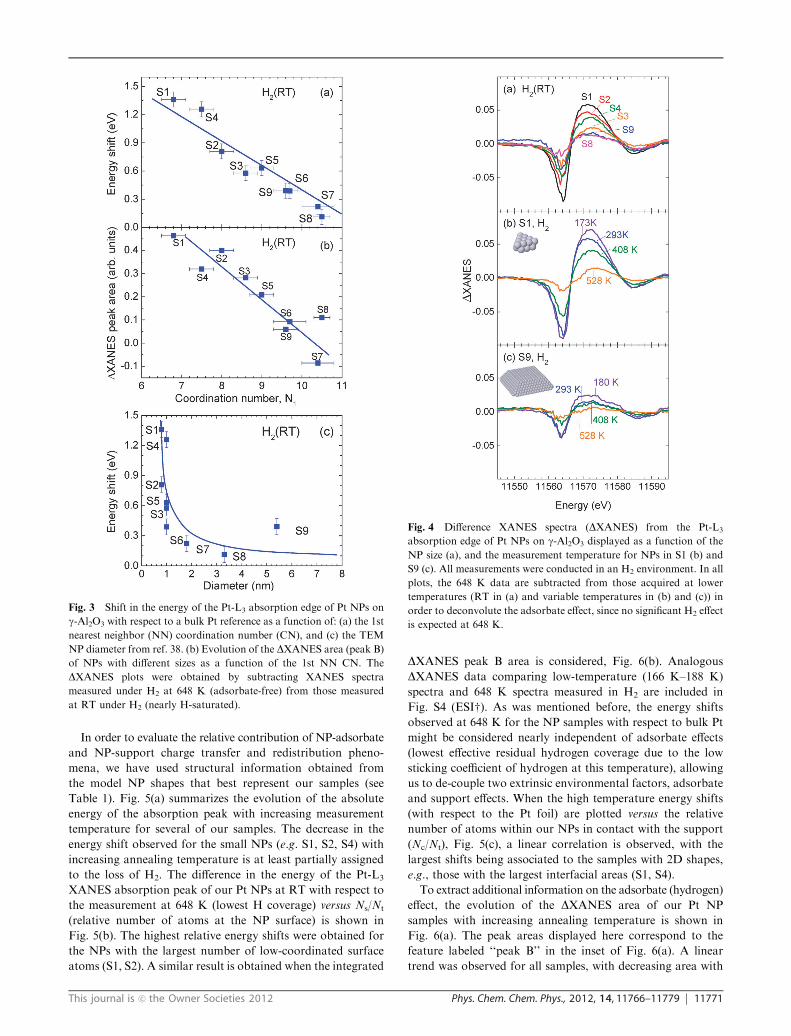
A linear correlation between both the energy shift of the
absorption edge peak (with respect to bulk Pt) and its total
area and the first nearest neighbor coordination number (N1)
was observed at RT: decreasing values with increasing N1,
Fig. 3(a) and (b), respectively. The blue shift of the WL
observed for the NP samples relative to the Pt foil is most
noticeable for S1 (+1.35 eV) but also present for the other
samples (+1.25 eV for S4 and +0.8 for S2). A similar trend
was observed when the former energy shifts are plotted versus
the TEM NP diameter, Fig. 3(c), corroborating that the
smallest NPs are the most affected by intrinsic (size and shape)
as well as extrinsic (adsorbate and support) effects. It should
be noted that the overall trend is the same if one uses the TEM
diameter as a representative size parameter, Fig. 3(c), or the
EXAFS NP size [e.g. 1st NN CN, Fig. 3(a)], although the
dependence is slightly different, with a more abrupt change
observed as a function of the NP diameter for NPs below
B1.5 nm. The difference is attributed to the fact that the
EXAFS data (N1) also contain structural information about
the NP shape (not only its diameter), which, as will be
discussed in more detail below, might play a role in the effect
observed, via for example NP-support charge transfer for
clusters with a large fraction of atoms in contact with the
support. Analogous XANES data acquired at low-temperature
(166 K–188 K) in H2 are presented in Fig. S3 (ESIw).In order to gain further insight into the role of adsorbed
hydrogen in the electronic properties of our small fcc Pt NPs,
DXANES plots were constructed. Fig. 4(a) displays XANES
data from NPs with different sizes measured in H2 at RT after
subtraction of the 648 K spectrum of the respective NP
sample. As was shown in our recent work,38 significant H2
desorption was predicted above 450 K (upon heating in an H2
atmosphere), and therefore, it is reasonable to assume that the
XANES data measured at 648 K are the ones least affected by
chemisorbed hydrogen, and can therefore be used as reference
of the state of the NPs with the minimum hydrogen coverage.
Fig. 4(a) provides information on the hydrogen effect and
effective hydrogen coverage on the surface of NPs of different
sizes, with increasing spectral area with decreasing NP size.
Quantitative analysis of these data will be shown later. Similar
DXANES plots are included in Fig. 4(b) and (c), but in those
cases the 648 K XANES spectra were subtracted from the data
acquired in H2 at different temperatures for samples S1 (b) and
S9 (c) (the smallest and largest NPs). It should be noted
that although the spectral features change drastically with
temperature in the EXAFS region, XANES data are not
strongly affected by thermal effects,10 and therefore, compar-
isons such as the one described above are justified.
For the small NPs in S1, a clear trend of increasing spectral
area with decreasing measurement temperature was detected,
which correlates with the higher hydrogen coverage at the
lowest measurement temperatures. As expected, due to the
significantly lower surface to volume ratio of the NPs in S9,
the adsorbate effect in Fig. 4(c) is small.
11770 Phys. Chem. Chem. Phys., 2012, 14, 11766–11779 This journal is c the Owner Societies 2012
Fig. 1 Normalized absorption coefficient, m(E), versus energy (XANES region) for the Pt-L3 edge of Pt NPs on g-Al2O3. The samples in (a–c) were
measured at room temperature in H2 after reduction (S1–S4). Similar data from a Pt foil are also displayed for reference. Sample S2 was measured
in H2 and He at 173 K (d).
Fig. 2 Normalized absorption coefficient, m(E), versus energy (XANES region) for the Pt-L3 edge of Pt NPs on g-Al2O3: (a) S1, (b) S2, (c) S4,
(d) S3, (e) S9, (f) S8. Temperature dependent data acquired in H2 from 173 K to 648 K are shown for all samples. The insets correspond to model
NP shapes representative of the NPs in each of the samples. For the large NPs (S8 and S9), a large degeneracy of shapes was obtained, and the
models shown in (e,f) are only a guide to the possible NP structures.
This journal is c the Owner Societies 2012 Phys. Chem. Chem. Phys., 2012, 14, 11766–11779 11771
In order to evaluate the relative contribution of NP-adsorbate
and NP-support charge transfer and redistribution pheno-
mena, we have used structural information obtained from
the model NP shapes that best represent our samples (see
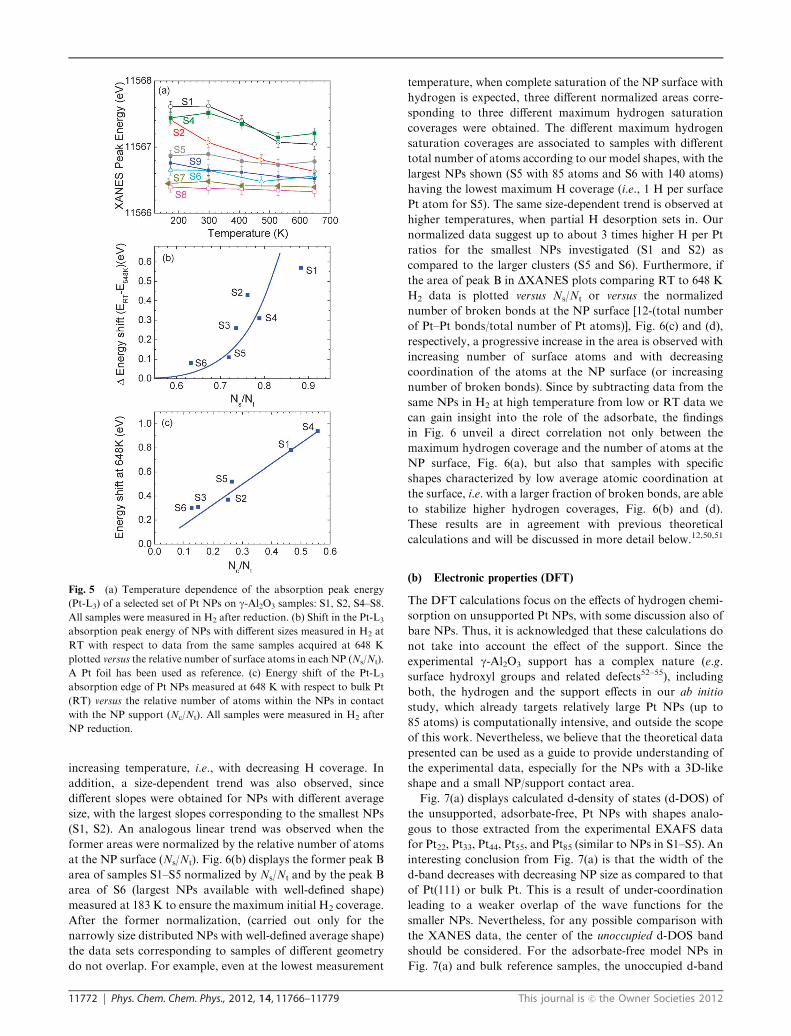
Table 1). Fig. 5(a) summarizes the evolution of the absolute
energy of the absorption peak with increasing measurement
temperature for several of our samples. The decrease in the
energy shift observed for the small NPs (e.g. S1, S2, S4) with
increasing annealing temperature is at least partially assigned
to the loss of H2. The difference in the energy of the Pt-L3
XANES absorption peak of our Pt NPs at RT with respect to
the measurement at 648 K (lowest H coverage) versus Ns/Nt
(relative number of atoms at the NP surface) is shown in
Fig. 5(b). The highest relative energy shifts were obtained for
the NPs with the largest number of low-coordinated surface
atoms (S1, S2). A similar result is obtained when the integrated
DXANES peak B area is considered, Fig. 6(b). Analogous
DXANES data comparing low-temperature (166 K–188 K)
spectra and 648 K spectra measured in H2 are included in
Fig. S4 (ESIw). As was mentioned before, the energy shifts
observed at 648 K for the NP samples with respect to bulk Pt
might be considered nearly independent of adsorbate effects
(lowest effective residual hydrogen coverage due to the low
sticking coefficient of hydrogen at this temperature), allowing
us to de-couple two extrinsic environmental factors, adsorbate
and support effects. When the high temperature energy shifts
(with respect to the Pt foil) are plotted versus the relative
number of atoms within our NPs in contact with the support
(Nc/Nt), Fig. 5(c), a linear correlation is observed, with the
largest shifts being associated to the samples with 2D shapes,
e.g., those with the largest interfacial areas (S1, S4).
To extract additional information on the adsorbate (hydrogen)
effect, the evolution of the DXANES area of our Pt NP
samples with increasing annealing temperature is shown in
Fig. 6(a). The peak areas displayed here correspond to the
feature labeled ‘‘peak B’’ in the inset of Fig. 6(a). A linear
trend was observed for all samples, with decreasing area with
Fig. 3 Shift in the energy of the Pt-L3 absorption edge of Pt NPs on
g-Al2O3 with respect to a bulk Pt reference as a function of: (a) the 1st
nearest neighbor (NN) coordination number (CN), and (c) the TEM
NP diameter from ref. 38. (b) Evolution of the DXANES area (peak B)
of NPs with different sizes as a function of the 1st NN CN. The
DXANES plots were obtained by subtracting XANES spectra
measured under H2 at 648 K (adsorbate-free) from those measured
at RT under H2 (nearly H-saturated).
Fig. 4 Difference XANES spectra (DXANES) from the Pt-L3
absorption edge of Pt NPs on g-Al2O3 displayed as a function of the
NP size (a), and the measurement temperature for NPs in S1 (b) and
S9 (c). All measurements were conducted in an H2 environment. In all
plots, the 648 K data are subtracted from those acquired at lower
temperatures (RT in (a) and variable temperatures in (b) and (c)) in
order to deconvolute the adsorbate effect, since no significant H2 effect
is expected at 648 K.
11772 Phys. Chem. Chem. Phys., 2012, 14, 11766–11779 This journal is c the Owner Societies 2012
increasing temperature, i.e., with decreasing H coverage. In
addition, a size-dependent trend was also observed, since
different slopes were obtained for NPs with different average
size, with the largest slopes corresponding to the smallest NPs
(S1, S2). An analogous linear trend was observed when the
former areas were normalized by the relative number of atoms
at the NP surface (Ns/Nt). Fig. 6(b) displays the former peak B
area of samples S1–S5 normalized by Ns/Nt and by the peak B
area of S6 (largest NPs available with well-defined shape)
measured at 183 K to ensure the maximum initial H2 coverage.
After the former normalization, (carried out only for the
narrowly size distributed NPs with well-defined average shape)
the data sets corresponding to samples of different geometry
do not overlap. For example, even at the lowest measurement
temperature, when complete saturation of the NP surface with
hydrogen is expected, three different normalized areas corre-
sponding to three different maximum hydrogen saturation
coverages were obtained. The different maximum hydrogen
saturation coverages are associated to samples with different
total number of atoms according to our model shapes, with the
largest NPs shown (S5 with 85 atoms and S6 with 140 atoms)
having the lowest maximum H coverage (i.e., 1 H per surface
Pt atom for S5). The same size-dependent trend is observed at
higher temperatures, when partial H desorption sets in. Our
normalized data suggest up to about 3 times higher H per Pt
ratios for the smallest NPs investigated (S1 and S2) as
compared to the larger clusters (S5 and S6). Furthermore, if
the area of peak B in DXANES plots comparing RT to 648 K
H2 data is plotted versus Ns/Nt or versus the normalized
number of broken bonds at the NP surface [12-(total number
of Pt–Pt bonds/total number of Pt atoms)], Fig. 6(c) and (d),
respectively, a progressive increase in the area is observed with
increasing number of surface atoms and with decreasing
coordination of the atoms at the NP surface (or increasing
number of broken bonds). Since by subtracting data from the
same NPs in H2 at high temperature from low or RT data we
can gain insight into the role of the adsorbate, the findings
in Fig. 6 unveil a direct correlation not only between the
maximum hydrogen coverage and the number of atoms at the
NP surface, Fig. 6(a), but also that samples with specific
shapes characterized by low average atomic coordination at
the surface, i.e. with a larger fraction of broken bonds, are able
to stabilize higher hydrogen coverages, Fig. 6(b) and (d).
These results are in agreement with previous theoretical
calculations and will be discussed in more detail below.12,50,51
(b) Electronic properties (DFT)
The DFT calculations focus on the effects of hydrogen chemi-
sorption on unsupported Pt NPs, with some discussion also of
bare NPs. Thus, it is acknowledged that these calculations do
not take into account the effect of the support. Since the
experimental g-Al2O3 support has a complex nature (e.g.
surface hydroxyl groups and related defects52–55), including
both, the hydrogen and the support effects in our ab initio
study, which already targets relatively large Pt NPs (up to
85 atoms) is computationally intensive, and outside the scope
of this work. Nevertheless, we believe that the theoretical data
presented can be used as a guide to provide understanding of
the experimental data, especially for the NPs with a 3D-like
shape and a small NP/support contact area.
Fig. 7(a) displays calculated d-density of states (d-DOS) of
the unsupported, adsorbate-free, Pt NPs with shapes analo-
gous to those extracted from the experimental EXAFS data
for Pt22, Pt33, Pt44, Pt55, and Pt85 (similar to NPs in S1–S5). An
interesting conclusion from Fig. 7(a) is that the width of the
d-band decreases with decreasing NP size as compared to that
of Pt(111) or bulk Pt. This is a result of under-coordination
leading to a weaker overlap of the wave functions for the
smaller NPs. Nevertheless, for any possible comparison with
the XANES data, the center of the unoccupied d-DOS band
should be considered. For the adsorbate-free model NPs in
Fig. 7(a) and bulk reference samples, the unoccupied d-band
Fig. 5 (a) Temperature dependence of the absorption peak energy
(Pt-L3) of a selected set of Pt NPs on g-Al2O3 samples: S1, S2, S4–S8.
All samples were measured in H2 after reduction. (b) Shift in the Pt-L3
absorption peak energy of NPs with different sizes measured in H2 at
RT with respect to data from the same samples acquired at 648 K
plotted versus the relative number of surface atoms in each NP (Ns/Nt).
A Pt foil has been used as reference. (c) Energy shift of the Pt-L3
absorption edge of Pt NPs measured at 648 K with respect to bulk Pt
(RT) versus the relative number of atoms within the NPs in contact
with the NP support (Nc/Nt). All samples were measured in H2 after
NP reduction.
This journal is c the Owner Societies 2012 Phys. Chem. Chem. Phys., 2012, 14, 11766–11779 11773
centers are: 1.17 eV (bulk Pt, not shown), 1.22 eV [Pt(111)],
1.14 eV (Pt85), 1.09 eV (Pt55), 1.02 eV (Pt44), 1.02 eV (Pt33), and
0.96 eV (Pt22). The red energy shift obtained with decreasing
NP size for the adsorbate-free model Pt NPs is in clear
contrast with the trend observed experimentally for the energy
of the Pt-L3 absorption peak maximum in the XANES spectra
acquired at 648 K (nearly adsorbate-free), Fig. 5(a). In fact, a
size-dependent blue shift was observed in our experiments at
all measurement temperatures. This discrepancy might be
ascribed to the fact that while the experimental NPs are
supported on g-Al2O3, the theoretical NPs are free-standing
clusters. Further details will be given in the Discussion section.
No drastic changes in the morphology of the NPs were
observed upon hydrogen chemisorption, as demonstrated in
Fig. S5 (ESIw), comparing DFT models of Pt22, Pt22H25 and
Pt22H31. Nevertheless, since H chemisorption on Pt NPs
induces the relaxation of Pt–Pt distances close to bulk-like
bond lengths,30,38 we have also monitored the evolution of the
d-DOS of the unsupported, adsorbate-free, Pt NPs as a
function of tensile (similar to the effect induced by adsorbates
like H2) or compressive strain, Fig. 7(b). Tensile strain (+2%
and +5%) resulted in a shift of the occupied d-band center
away from the Fermi level, while the opposite trend was
observed on compressively strained NPs (�2% and �5%).
An increase (decrease) in the area of the first peak of the
occupied DOS near EF was also observed under tensile
(compressive) strain. In addition to inducing an expansion of
the Pt NP lattice (morphological change), hydrogen adsorp-
tion may also modify the electronic structure of the NPs. To
deconvolute these two effects, the d-DOS of hydrogen-covered
Pt NPs (Pt22H25) was compared to that of hydrogen free NPs
(Pt22), and that of the Pt22H25 geometric structure but without
the hydrogen atoms, Fig. 7(c). While the d-DOS of Pt22H25
reflects the modifications in the electronic as well as morpho-
logical (lattice expansion) structure of the NP induced by
hydrogen, the calculations from Pt22H25 after hydrogen
removal only reflect the influence of lattice relaxations on
the d-DOS. As can be seen in Fig. 7(c), the d-DOS of the
hydrogen-free NP with the Pt22H25 structure is very similar to
that of the adsorbate-free Pt22. Therefore, it can be concluded
that the changes brought about by hydrogen chemisorption
are mainly of electronic nature.
Furthermore, in agreement with previous findings,17,50,56
addition of hydrogen to our model NPs was found to lead
to an increased bandwidth and a shift of both the occupied
and the unoccupied d-band centers away from the EF,
Fig. 7(c), 8, 9(a) and (b). Fig. 8 shows the d-DOS of clean
Pt22 and Pt44 together with calculations of PtxHy structures
with different hydrogen coverages. The unoccupied d-band
center shown in Fig. 9(a) represents the average position of
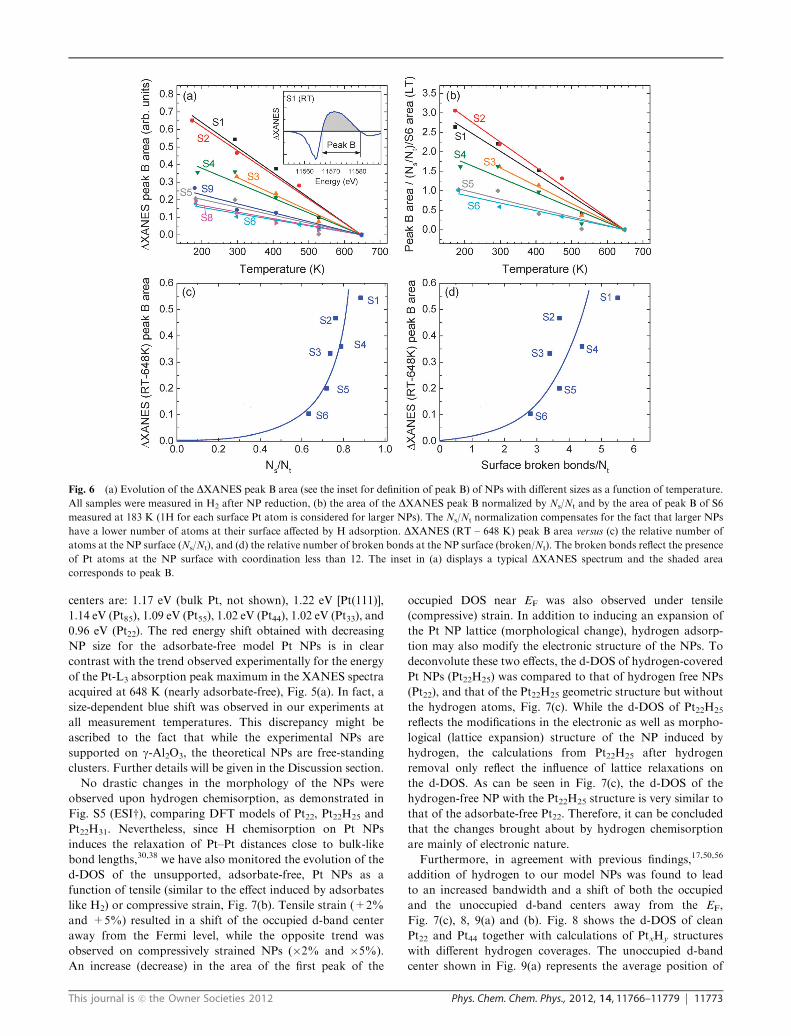
Fig. 6 (a) Evolution of the DXANES peak B area (see the inset for definition of peak B) of NPs with different sizes as a function of temperature.
All samples were measured in H2 after NP reduction, (b) the area of the DXANES peak B normalized by Ns/Nt and by the area of peak B of S6
measured at 183 K (1H for each surface Pt atom is considered for larger NPs). The Ns/Nt normalization compensates for the fact that larger NPs
have a lower number of atoms at their surface affected by H adsorption. DXANES (RT – 648 K) peak B area versus (c) the relative number of
atoms at the NP surface (Ns/Nt), and (d) the relative number of broken bonds at the NP surface (broken/Nt). The broken bonds reflect the presence
of Pt atoms at the NP surface with coordination less than 12. The inset in (a) displays a typical DXANES spectrum and the shaded area
corresponds to peak B.
11774 Phys. Chem. Chem. Phys., 2012, 14, 11766–11779 This journal is c the Owner Societies 2012
unoccupied d-DOS states from 0 to 4 eV, and is expected to
correlate with the position (energy) of the XANES absorption
peak. As can be seen in Fig. 8(a) and 9(a), increasing the
hydrogen coverage results in a blue shift of the unoccupied
d-band center, which is in agreement with our experimental
observation, Fig. 5(a) (increasing energies of the absorption peak
with decreasing measurement temperature in hydrogen, e.g. with
increasing effective H coverage). In addition, a nearly linear
correlation between the position of the unoccupied and occupied
d-band centers of Pt22Hx and Pt44Hx was obtained with increas-
ing hydrogen content, Fig. 9(a) and (b), respectively.
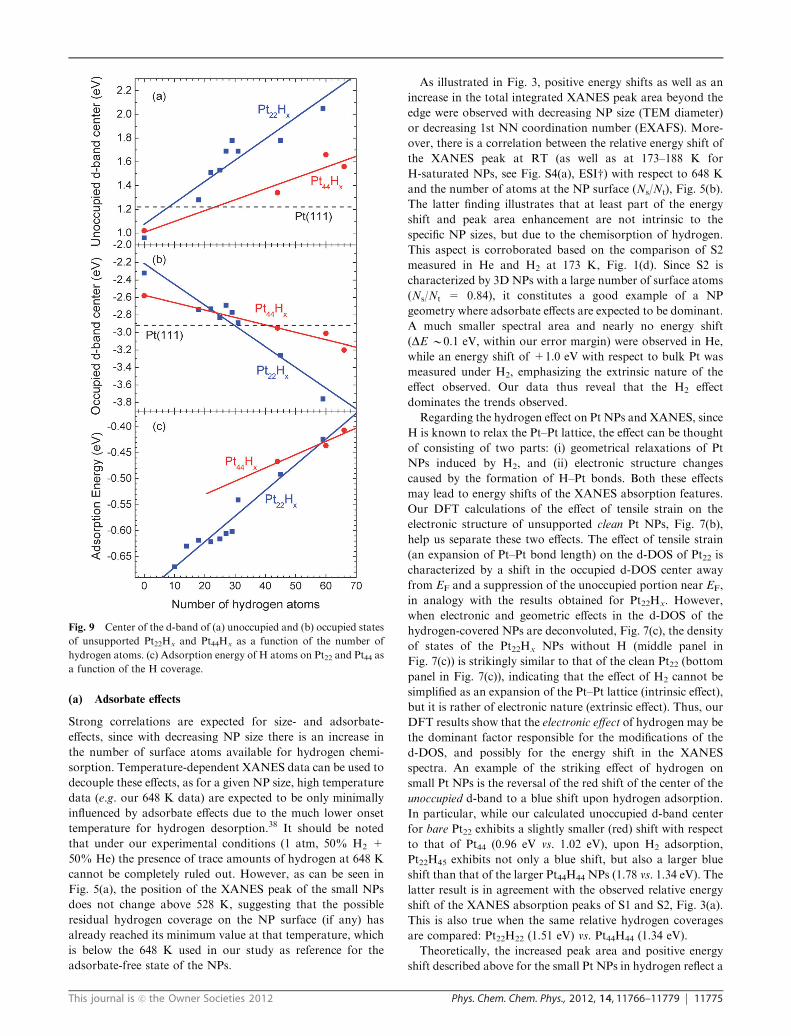
Fig. 9(c) shows the adsorption energy of hydrogen on Pt22and Pt44 NPs as a function of coverage. With increasing
hydrogen coverage, the adsorption energy was found to
decrease due to adsorbate–adsorbate interactions. For the
lowest and highest hydrogen coverages considered, the following
adsorption energies were calculated: Pt22H18 (�0.62 eV),
Pt22H59 (�0.42 eV), Pt44H44 (�0.47 eV), Pt44H66 (�0.61 eV).
The hydrogen adsorption energy of �0.62 eV (�59.8 kJ mol�1)
obtained for the lowest hydrogen coverage on Pt22H18 is in
excellent agreement with the value of �60 kJ mol�1 measured
experimentally by Bus and van Bokhoven for hydrogen
adsorbed on B0.8 nm Pt NPs on Al2O3, which was assigned
to strongly bonded hydrogen.21
4. Discussion
Clear changes in the electronic properties of our Pt NPs as
compared to bulk Pt could be experimentally observed via
XANES, in particular, a positive shift in the peak energy and
an increase in the integrated intensity of the absorption peak.
The origin of these effects has been the subject of intense
debate in the literature.10,15,18,22,25,27,28,44,57–61 While some
references attribute the former effects mainly to the interaction
of atoms in the Pt NPs with hydrogen, others also involve the
NP support. We suggest that some of this discrepancy is due to
the difficulty of separating the different contributions to the
XANES spectra in the absence of geometrically well-defined
NPs with good crystallinity and narrow size distributions, as
well as to the challenge of using a unique synthesis approach
to generate small NPs with either 2D or 3D shape on the same
support in order to evaluate the role of the NP–support
interface. Our micellar synthesis has been proven ideal for
the generation of size- and shape-selected metal NPs in the
sub-2 nm size regime with tunable shape, being thus suitable
for the above investigations and subsequent direct comparison
with first principle theories.
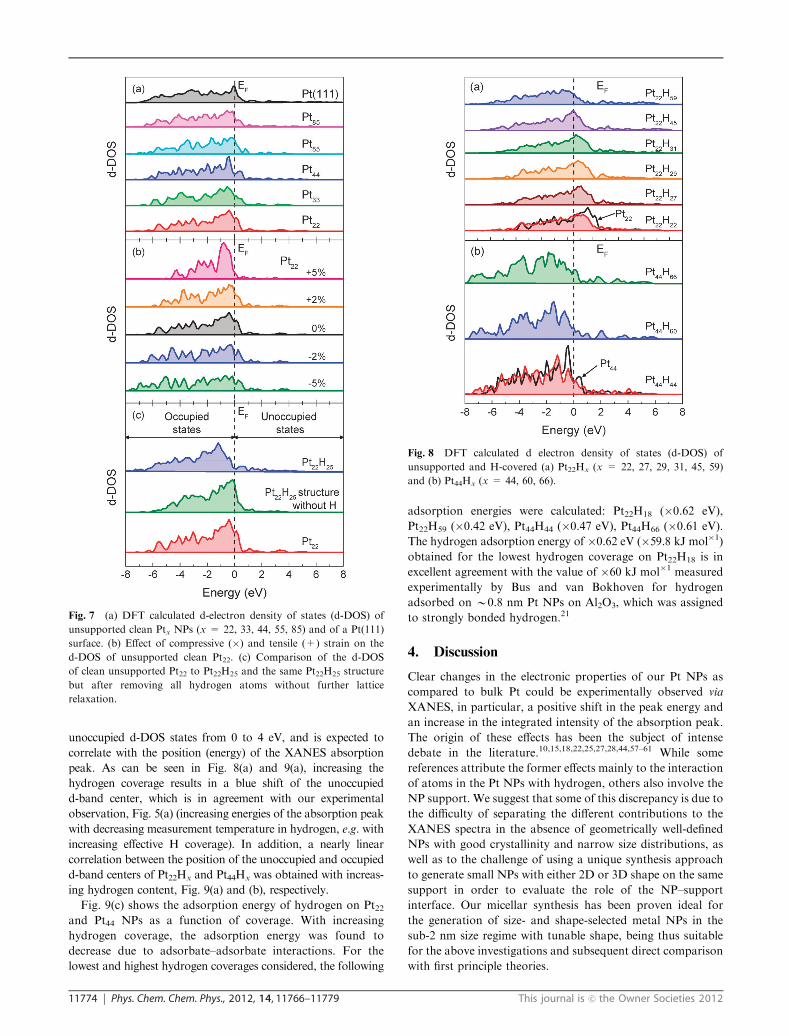
Fig. 7 (a) DFT calculated d-electron density of states (d-DOS) of
unsupported clean Ptx NPs (x = 22, 33, 44, 55, 85) and of a Pt(111)
surface. (b) Effect of compressive (�) and tensile (+) strain on the
d-DOS of unsupported clean Pt22. (c) Comparison of the d-DOS
of clean unsupported Pt22 to Pt22H25 and the same Pt22H25 structure
but after removing all hydrogen atoms without further lattice
relaxation.
Fig. 8 DFT calculated d electron density of states (d-DOS) of
unsupported and H-covered (a) Pt22Hx (x = 22, 27, 29, 31, 45, 59)
and (b) Pt44Hx (x = 44, 60, 66).
This journal is c the Owner Societies 2012 Phys. Chem. Chem. Phys., 2012, 14, 11766–11779 11775
(a) Adsorbate effects
Strong correlations are expected for size- and adsorbate-
effects, since with decreasing NP size there is an increase in
the number of surface atoms available for hydrogen chemi-
sorption. Temperature-dependent XANES data can be used to
decouple these effects, as for a given NP size, high temperature
data (e.g. our 648 K data) are expected to be only minimally
influenced by adsorbate effects due to the much lower onset
temperature for hydrogen desorption.38 It should be noted
that under our experimental conditions (1 atm, 50% H2 +
50% He) the presence of trace amounts of hydrogen at 648 K
cannot be completely ruled out. However, as can be seen in
Fig. 5(a), the position of the XANES peak of the small NPs
does not change above 528 K, suggesting that the possible
residual hydrogen coverage on the NP surface (if any) has
already reached its minimum value at that temperature, which
is below the 648 K used in our study as reference for the
adsorbate-free state of the NPs.
As illustrated in Fig. 3, positive energy shifts as well as an
increase in the total integrated XANES peak area beyond the
edge were observed with decreasing NP size (TEM diameter)
or decreasing 1st NN coordination number (EXAFS). More-
over, there is a correlation between the relative energy shift of
the XANES peak at RT (as well as at 173–188 K for
H-saturated NPs, see Fig. S4(a), ESIw) with respect to 648 K
and the number of atoms at the NP surface (Ns/Nt), Fig. 5(b).
The latter finding illustrates that at least part of the energy
shift and peak area enhancement are not intrinsic to the
specific NP sizes, but due to the chemisorption of hydrogen.
This aspect is corroborated based on the comparison of S2
measured in He and H2 at 173 K, Fig. 1(d). Since S2 is
characterized by 3D NPs with a large number of surface atoms
(Ns/Nt = 0.84), it constitutes a good example of a NP
geometry where adsorbate effects are expected to be dominant.
A much smaller spectral area and nearly no energy shift
(DE B0.1 eV, within our error margin) were observed in He,
while an energy shift of +1.0 eV with respect to bulk Pt was
measured under H2, emphasizing the extrinsic nature of the
effect observed. Our data thus reveal that the H2 effect
dominates the trends observed.
Regarding the hydrogen effect on Pt NPs and XANES, since
H is known to relax the Pt–Pt lattice, the effect can be thought
of consisting of two parts: (i) geometrical relaxations of Pt
NPs induced by H2, and (ii) electronic structure changes
caused by the formation of H–Pt bonds. Both these effects
may lead to energy shifts of the XANES absorption features.
Our DFT calculations of the effect of tensile strain on the
electronic structure of unsupported clean Pt NPs, Fig. 7(b),
help us separate these two effects. The effect of tensile strain
(an expansion of Pt–Pt bond length) on the d-DOS of Pt22 is
characterized by a shift in the occupied d-DOS center away
from EF and a suppression of the unoccupied portion near EF,
in analogy with the results obtained for Pt22Hx. However,
when electronic and geometric effects in the d-DOS of the
hydrogen-covered NPs are deconvoluted, Fig. 7(c), the density
of states of the Pt22Hx NPs without H (middle panel in
Fig. 7(c)) is strikingly similar to that of the clean Pt22 (bottom
panel in Fig. 7(c)), indicating that the effect of H2 cannot be
simplified as an expansion of the Pt–Pt lattice (intrinsic effect),
but it is rather of electronic nature (extrinsic effect). Thus, our
DFT results show that the electronic effect of hydrogen may be
the dominant factor responsible for the modifications of the
d-DOS, and possibly for the energy shift in the XANES
spectra. An example of the striking effect of hydrogen on
small Pt NPs is the reversal of the red shift of the center of the
unoccupied d-band to a blue shift upon hydrogen adsorption.
In particular, while our calculated unoccupied d-band center
for bare Pt22 exhibits a slightly smaller (red) shift with respect
to that of Pt44 (0.96 eV vs. 1.02 eV), upon H2 adsorption,
Pt22H45 exhibits not only a blue shift, but also a larger blue
shift than that of the larger Pt44H44 NPs (1.78 vs. 1.34 eV). The
latter result is in agreement with the observed relative energy
shift of the XANES absorption peaks of S1 and S2, Fig. 3(a).
This is also true when the same relative hydrogen coverages
are compared: Pt22H22 (1.51 eV) vs. Pt44H44 (1.34 eV).
Theoretically, the increased peak area and positive energy
shift described above for the small Pt NPs in hydrogen reflect a
Fig. 9 Center of the d-band of (a) unoccupied and (b) occupied states
of unsupported Pt22Hx and Pt44Hx as a function of the number of
hydrogen atoms. (c) Adsorption energy of H atoms on Pt22 and Pt44 as
a function of the H coverage.
11776 Phys. Chem. Chem. Phys., 2012, 14, 11766–11779 This journal is c the Owner Societies 2012
decrease in the density of electronic states near the Fermi
level, e.g. the transfer of charge from the NPs to either the
support,20,57,62–64 to hydrogen for the formation of Pt–H
bonds (via the creation of anti-bonding states above
EF),15,16,22,28 or to both. In agreement with previous studies,
the Bader atomic charge analysis of H-covered PtxHy NPs
shows that there is a net charge transfer from all Pt atoms
within the NPs to all hydrogen atoms of 0.55 (Pt22H22) and
1.37 electrons (Pt44H44). Thus, the remarkable hydrogen effect
on the electronic structure of Pt NPs can be attributed to
charge transfer from the Pt NPs to hydrogen. However, not all
hydrogen atoms receive electrons from the Pt atoms, but
primarily those adsorbed at corner and edge sites. The calcu-
lated hydrogen adsorption energy in Fig. 9(c) is larger when a
smaller number of adsorbed hydrogen atoms are considered,
since fewer low coordination sites are available for the higher
hydrogen coverages. By comparing similar hydrogen coverages,
e.g. Pt22H22 and Pt44H44 in Fig. 9(c), the hydrogen adsorption
energy was found to strongly depend on the NP size, with
stronger binding of hydrogen to the smaller NPs. This is
assigned to the presence of a larger number of sites with low
coordination in the smaller NPs.
Quantitative information on the amount of adsorbed
hydrogen on Pt NPs has been extracted from the integrated
area of the DXANES absorption peak,15,19,22,23,28,64 and a
linear correlation between the peak area and the H/Pt ratio
established. Some of the former references reported 1.2 : 1 H
per Pt atom.15,22 In the present work, the evolution of the
absorption peak energy and integrated DXANES (peak B)
area with temperature shows a marked size-effect, Fig. 5(a)
and 6(a). For all samples measured in H2, a progressive
decrease in the spectral area was observed with increasing
temperature for the small NP sizes (r1 nm), while such effect
was found to be much less pronounced for the larger clusters.
Charge transfer phenomena should be more prominent at low
temperature due to the overlap of metal, adsorbate, and
support orbitals. The larger WL intensity observed at low
temperature for the small NPs, constitutes an indication of a
decrease in the total charge within the NPs, which has been
transferred to either the hydrogen adsorbate or the support.
As can be seen in Fig. 4, 5(b), 6(a) and (b), the adsorbate effect
is dominant. In particular, for the samples measured in H2, the
increase in the measurement temperature is expected to lead to
a decrease in the effective H2 coverage on the NP surface,
which in turn results in a decrease in the energy shifts, height
of the absorption peak WL, and integrated area. As shown in
the Theory section, higher charge transfer is expected from
metal to hydrogen for Pt atoms with lower coordination
numbers. Also, a larger amount of charge transfer should
affect the XANES region by inducing larger energy shifts
and broadening. Therefore, the smaller NPs would be more
affected by hydrogen adsorbates due to: (i) their higher surface/
bulk ratio, (ii) larger number of H adsorbate atoms per surface
Pt atom, and (iii) larger amount of charge transfer between each
H and Pt atom.
Additional information on the role of the NP geometry
(size and shape) in the binding of hydrogen can be extracted
from Fig. 6(c) and (d). The correlation observed between the
number of surface atoms and the DXANES peak B area
comparing H-covered NPs (RT data) to nearly adsorbate-free
NPs (648 K) of different structures, Fig. 6(c), reveals higher
hydrogen coverages at RT on the NPs with the highest number
of surface atoms (Ns/Nt). The same trend was observed at all
investigated temperatures, including 165–175 K, where the
complete saturation of the NP surface with hydrogen is
expected. After the normalization of the integrated peak areas
by the relative number of surface atoms in each sample and the
peak B area of the largest NPs investigated with well-defined
geometry (S6), Fig. 6(b), clear size-dependent differences can
be seen. In particular, the maximum H coverage stable on the
NPs at any given temperature was found to be strongly
dependent on the NP geometry. Our data also suggest that
the 1 H per 1 Pt atom normalization factor based on H
saturation coverages on Pt(111) surfaces, commonly used to
describe dispersion in NP samples,19 cannot be reliably consi-
dered to extract quantitative information of the absolute
hydrogen coverage per surface atom within small NPs. Indeed,
up to 3 H atoms per Pt atom at the NP surface were obtained
at the lowest investigated temperatures (166–188 K, Fig. 6(b)).
Previous groups reported saturation of the NP surface with
1.2 : 1 H/Pt ratios at room temperature,15,23 and others used
the integrated DXANES area at RT in He as a normalization
factor in the calculation of relative fractional hydrogen
coverages at higher temperatures.19 Nevertheless, our data
indicate that higher H saturation coverages might be obtained
at and below RT, and that the 1 : 1 H/Pt ratio commonly used
in Langmuir adsorption measurements65 likely underestimates
the amount of H that can be stabilized on the surface of a
small Pt NP (r1 nm) with a large fraction of low-coordinated
sites (e.g. steps, corners and edges). This observation is in
agreement with experimental data from Bus et al.21 reporting
H/Pt ratios higher than 1 for Pt NPs and Kip et al.66 for Pt, Rh
and Ir NPs on Al2O3 and SiO2 (from RT measurements). It is
worth mentioning that in the former references the H/Pt ratios
were obtained based on the total number of Pt atoms in a NP
and not the actual number of surface atoms, as it is considered
here. Therefore, even higher H/Pt ratios are expected for
the surface atoms. Furthermore, our experimental data also
demonstrate that the maximum H saturation coverage is
strongly size-dependent, and so is the strength of the Pt–H
bond upon sample heating. In addition, the largest DXANES
areas (e.g. largest H coverage) were not only measured for the
NP shapes with the highest number of low coordinated surface
atoms, Fig. 6(c), but also for those with the largest number of
broken bonds at the NP surface, Fig. 6(d). This indicates that
more hydrogen atoms can be adsorbed on corner and edge
atoms within a NP as compared to higher-coordinated atoms
on a Pt(111) surface. Theoretically, H/Pt saturation ratios of
up to 4 : 1 have been predicted for small Pt NPs with different
structures,50,51 and higher average hydrogen adsorption
energies were obtained for small clusters as compared to bulk.
Upon hydrogen saturation, Pt12H30 structures were reported
on a NaY zeolite67 based on DFT calculations. Furthermore,
a decrease in the hydrogen desorption energy with increasing
coverage was observed, reflecting the lower reactivity of the
clusters with higher surface hydrogen coverages.50 A similar
trend was observed for our Pt22Hx and Pt44Hx NPs, Fig. 9(a).
A size-effect was also described in the literature, with a nearly
This journal is c the Owner Societies 2012 Phys. Chem. Chem. Phys., 2012, 14, 11766–11779 11777
linear increase in the number of H atoms chemisorbed on
small Pt NPs with increasing NP size (o10 atoms).17 The same
general trend was obtained from our calculations, Fig. 9(c).
Simple theoretical models such as the Langmuir model could
not reproduce the hydrogen coverage dependence displayed by
our experimental system, Fig. 6(a). This is assigned to three
important factors: (i) we do not have a single hydrogen
desorption site (e.g. corners, faces, and edges), and therefore,
not a single desorption energy in our complex nanoscale
system, (ii) the desorption energy at a given site might be
different for NPs of different sizes, (iii) the desorption energy
might be coverage dependent, and adsorbate–adsorbate inter-
actions must be considered. These aspects will require future
theoretical work and is beyond the scope of the present study.
(b) Support effects
In our experimental work, the relative contribution of the NP
support to the electronic properties of our NPs can be inferred
from the comparison of samples with identical TEM diameter
but different shape (2D versus 3D), Fig. 1(a and b). As was
described before, larger energy shifts were observed for the
flatter NPs, which are the ones with the highest contact area
with the support. It should be mentioned that contrary to
the case of NPs prepared by conventional impregnation–
precipitation synthesis methods, where the final NP geometry
is strongly influenced by the nature of the support, our
micellar synthesis allows us to create different NP geometries
on the same substrate (g-Al2O3) by changing the metal loading
within a given micellar cage. This allows us to compare the
electronic properties of 2D and 3D NPs on the same substrate
and to separate size from support effects.
Even though with the data at hand we cannot completely
exclude the presence of any residual H atoms on the NP
surface at 648 K under our experimental conditions, we can
still gain insight into the support effect by comparing samples
with nearly the same Ns/Nt ratio (same adsorbate effect) but
clearly distinct Nc/Nt. For a given NP diameter, the samples
with the highest energy shifts (S1 and S4) are also the ones
with the highest Nc/Nt ratio (0.55 for S1 and S4 versus
0.18–0.23 for S2 and S3), suggesting a correlation between
the NP/support contact area and the magnitude of the
XANES peak shift and charge transfer or charge redistribu-
tion effect. For example, since the Ns/Nt ratios (relative
number of surface atoms) for S1 and S2 are nearly identical
(0.84–0.86), a similar NP–adsorbate interaction is expected,
and the energy shift difference observed while comparing these
two samples (DE B0.5 eV) must be largely attributed to
distinct NP–support interactions. This trend is also illustrated
in Fig. 5(c), where the energy shifts measured at high temp-
erature are shown versus Nc/Nt. As discussed before, this high
temperature data are expected to be the least influenced by
adsorbate effects.
As was mentioned in the previous section, contrary trends in
the position of the unoccupied d-band center (DFT) and
absorption edge peak (high temperature XANES data) were
observed with decreasing number of atoms within the NPs for
clean unsupported (DFT) and clean (minimum residual H
coverage at 648 K) Al2O3-supported (experimental) NPs.
More specifically, red energy shifts were obtained for the
model clean NPs with decreasing NP size via DFT, while blue
shifts were observed for the (nearly hydrogen-free) experi-
mental samples at the highest measurement temperature
(648 K). However, it should be noticed that once the hydrogen
effect is taken into account, which is mostly an electronic effect
via charge transfer from Pt atoms to hydrogen, DFT also
reproduces blue shifts of the d-band center of H-covered NPs.
Provided that a support such as Al2O3 may induce a charge
transfer similar to that induced upon hydrogen adsorption
(from the Pt NP to Al2O3), the discrepancy between the DFT
and the observed experiment mentioned above could be
assigned to the support effect, which is not considered in our
DFT calculations. This postulation suggests that the experi-
mental trends are not intrinsic to the specific NP geometries,
but strongly influenced by environmental effects, in the latter
case, by support effects. Following this hypothesis, larger blue
shifts would be expected for NPs with a larger fraction of
atoms in contact with the support. The correlation between the
Pt-L3 peak energy shift of our samples with respect to bulk Pt
at 648K and Nc/Nt (contact area with the support) is demon-
strated in Fig. 5(c).
In the literature, electronic effects underlying metal–support
interactions have been described based on different models.
For example, for Pt NPs supported on the LTL zeolite and on
SiO2, no net charge transfer was reported.42,43,64 Instead,
modification of the valence orbitals of the metal by the
Madelung potential of the support had to be considered.42,43,64
On the other hand, the transfer of charge from interfacial Pt
atoms to defects in Al2O3 was proposed in ref. 64 and 68.
Furthermore, ab initio calculations by Cooper et al.62 for
Pt(111) films on a-Al2O3 revealed the transfer of charge from
Pt to the support when the surface is O-terminated, and in the
opposite direction when it is Al-terminated. Due to the sample
pre-treatment used in our study (prolonged annealing in O2),
an oxygen-terminated (hydroxyl) Al2O3 surface is expected,
and the direction of the charge transfer inferred here based on
the XANES data of the 2D NPs (from Pt to Al2O3) is in
agreement with the previous calculations for Pt thin films. A
broadening of the Pt-L3 WL due to the interaction of small Pt
NPs with LTL-zeolite supports was also previously shown.10
Nevertheless, other groups reported no support effects on the
peak area.22 In our study, the support effect is evident in the
extent of the energy shifts (with respect to bulk Pt).
Our experimental and theoretical findings illustrate the
crucial role of not just geometrical effects, but also environ-
mental influences such as adsorbates and the NP support in
the electronic properties of small Pt NPs. This level of under-
standing might be leveraged in order to tune related material
properties such as catalytic reactivity. By separating the
relative contributions of adsorbate, size, shape, and support
effects to the electronic properties of supported NP catalysts,
insight can be gained into the influence of each of these
parameters on a given catalytic process. For instance, support-
induced strain leading to shifts in the d-band center of the
supported metals will result in distinct binding of adsorbates
to the supported NPs. This might in turn lead to a different
catalytic activity, selectivity and stability. Tuning the NP
shape might also serve to enhance the NP–support contact
11778 Phys. Chem. Chem. Phys., 2012, 14, 11766–11779 This journal is c the Owner Societies 2012
area, maximizing thus the desired interfacial strain. Another
example is the possibility of modifying catalytic performance
via the selection of NP shapes with distinct crystalline facets
and number of low-coordinated surface atoms, which will lead
to different adsorbate binding energies and maximum adsorbate
coverages. Such geometrical changes have associated specific
electronic signatures which can be probed via the combination
of XANES and DFT methods, provided that the experimental
system at hand is geometrically well-defined.
Conclusions
A synergistic combination of XANES, NP shape modeling,
and DFT calculations has allowed us to gain insight into the
correlations between the structure (size and shape), environ-
ment (adsorbate and support) and the electronic properties
of unsupported (DFT) and g-Al2O3-supported Pt NPs
(XANES). Our data reveal that the size-dependent trends
observed in the electronic properties of Pt NPs are not
exclusively intrinsic due to the specific NP geometry, but
largely due to extrinsic parameters such as the chemisorption
of H2 and NP–support interactions, which are strongly
affected by the NP shape and NP–support contact area.
Acknowledgements
The authors are grateful to A. Frenkel (Yeshiva University)
for assistance with the XAFS measurements, to K. Paredis for
his help with the preparation of some of the samples, and to
N. Marinkovic and Q. Wang (BNL) for beamline support.
The XAFS and modeling work was made possible thanks
to funding from the U.S. National Science Foundation
(NSF-DMR-0906562 and NSF-DMR-1006232). The DFT
work was supported by US-DOE grant DE-FG02-07ER46354
and calculations were performed on the cluster Carbon
at CNM-ANL and Stokes at UCF. Synchrotron Catalysis
Consortium facilities at NSLS where the XAFS measurements
were conducted are supported by the U. S. Department of
Energy (DE-FG02-05ER15688). NSLS is supported by the
U. S. Department of Energy (DE-AC02-98CH10866).
References
1 M. Valden, X. Lai and D. W. Goodman, Science, 1998, 281, 1647.2 A. Naitabdi, L. K. Ono and B. Roldan Cuenya, Appl. Phys. Lett.,2006, 89, 043101.
3 Q. S. Mei and K. Lu, Prog. Mater. Sci., 2007, 52, 1175.4 G. D. Barrera, J. A. O. Bruno, T. H. K. Barron and N. L. Allan,J. Phys.: Condens. Matter, 2005, 17, R217.
5 J. H. Kang, L. D. Menard, R. G. Nuzzo and A. I. Frenkel, J. Am.Chem. Soc., 2006, 128, 12068.
6 S. I. Sanchez, L. D. Menard, A. Bram, J. H. Kang, M. W. Small,R. G. Nuzzo and A. I. Frenkel, J. Am. Chem. Soc., 2009, 131, 7040.
7 T. Comaschi, A. Balerna and S. Mobilio, Phys. Rev. B, 2008,77, 075432.
8 X. Lai, T. P. St Clair, M. Valden and D. W. Goodman, Prog. Surf.Sci., 1998, 59, 25.
9 D. Bazin, D. Sayers, J. J. Rehr and C. Mottet, J. Phys. Chem. B,1997, 101, 5332.
10 A. L. Ankudinov, J. J. Rehr, J. J. Low and S. R. Bare, J. Chem.Phys., 2002, 116, 1911.
11 F. Vila, J. J. Rehr, J. Kas, R. G. Nuzzo and A. I. Frenkel, Phys.Rev. B, 2008, 78, 121404.
12 J. Zhou, X. Zhou, X. Sun, R. Li, M. Murphy, Z. Ding, X. Sun andT.-K. Sham, Chem. Phys. Lett., 2007, 437, 229.
13 M.W. Tew, J. T. Miller and J. A. van Bokhoven, J. Phys. Chem. C,2009, 113, 15140.
14 D. E. Ramaker, B. L. Mojet, M. T. Garriga Oostenbrink,J. T. Miller and D. C. Koningsberger, Phys. Chem. Chem. Phys.,1999, 1, 2293.
15 K. Asakura, T. Kubota, W. J. Chun, Y. Iwasawa, K. Ohtani andT. Fujikawa, J. Synchrotron Radiat., 1999, 6, 439.
16 Y. Lei, J. Jelic, L. C. Nitsche, R. Meyer and J. Miller, Top. Catal.,2011, 54, 334.
17 C. G. Zhou, J. P. Wu, A. H. Nie, R. C. Forrey, A. Tachibana andH. S. Cheng, J. Phys. Chem. C, 2007, 111, 12773.
18 A. L. Ankudinov, J. J. Rehr, J. J. Low and S. R. Bare,J. Synchrotron Radiat., 2001, 8, 578.
19 N. Guo, B. R. Fingland, W. D. Williams, V. F. Kispersky, J. Jelic,W. N. Delgass, F. H. Ribeiro, R. J. Meyer and J. T. Miller, Phys.Chem. Chem. Phys., 2010, 12, 5678.
20 D. E. Ramaker and D. C. Koningsberger, Phys. Chem. Chem.Phys., 2010, 12, 5514.
21 E. Bus and J. A. van Bokhoven, Phys. Chem. Chem. Phys., 2007,9, 2894.
22 T. Kubota, K. Asakura, N. Ichikuni and Y. Iwasawa, Chem. Phys.Lett., 1996, 256, 445.
23 S. N. Reifsnyder, M. M. Otten, D. E. Sayers and H. H. Lamb,J. Phys. Chem. B, 1997, 101, 4972.
24 J. A. van Bokhoven and J. T. Miller, J. Phys. Chem. C, 2007,111, 9245.
25 N. Ichikuni and Y. Iwasawa, Catal. Lett., 1993, 20, 87.26 A. L. Ankudinov, J. J. Rehr, J. J. Low and S. R. Bare, Top. Catal.,
2002, 18, 3.27 M. K. Oudenhuijzen, J. A. van Bokhoven, J. T. Miller,
D. E. Ramaker and D. C. Koningsberger, J. Am. Chem. Soc.,2005, 127, 1530.
28 T. Kubota, K. Asakura and Y. Iwasawa, Catal. Lett., 1997,46, 141.
29 N. Schweitzer, H. Xin, E. Nikolla, J. T. Miller and S. Linic, Top.Catal., 2010, 53, 348.
30 B. Roldan Cuenya, J. R. Croy, S. Mostafa, F. Behafarid, L. Li,Z. Zhang, J. C. Yang, Q. Wang and A. I. Frenkel, J. Am. Chem.Soc., 2010, 132, 8747.
31 J. R. Croy, S. Mostafa, H. Heinrich and B. Roldan Cuenya, Catal.Lett., 2009, 131, 21.
32 A. Naitabdi, F. Behafarid and B. Roldan Cuenya, Appl. Phys.Lett., 2009, 94, 083102.
33 S. Mostafa, F. Behafarid, J. R. Croy, L. K. Ono, L. Li, J. C. Yang,A. I. Frenkel and B. Roldan Cuenya, J. Am. Chem. Soc., 2010,132, 15714.
34 L. K. Ono, B. Yuan, H. Heinrich and B. Roldan Cuenya, J. Phys.Chem. C, 2010, 114, 22119.
35 B. Roldan Cuenya, L. K. Ono, J. R. Croy, K. Paredis, A. Kara,H. Heinrich, J. Zhao, E. E. Alp and W. Keune, Phys. Rev. B, 2012,submitted.
36 M. S. Nashner, A. I. Frenkel, D. L. Adler, J. R. Shapley andR. G. Nuzzo, J. Am. Chem. Soc., 1997, 119, 7760.
37 M. S. Nashner, D. M. Somerville, P. D. Lane, D. L. Adler,J. R. Shapley and R. G. Nuzzo, J. Am. Chem. Soc., 1996,118, 12964.
38 B. Roldan Cuenya, M. Alcantara Ortigoza, L. Ono, F. Behafarid,S. Mostafa, J. Croy, K. Paredis, G. Shafai, T. Rahman, L. Li,Z. Zhang and J. Yang, Phys. Rev. B: Condens. Matter Mater.Phys., 2011, 84, 245438.
39 B. Roldan Cuenya, A. I. Frenkel, S. Mostafa, F. Behafarid,J. R. Croy, L. K. Ono and Q. Wang, Phys. Rev. B, 2010,82, 155450.
40 A. I. Frenkel, C. W. Hills and R. G. Nuzzo, J. Phys. Chem. B,2001, 105, 12689.
41 R. Prins and D. C. Koningsberger, in X-ray absorption. Principles,applications, techniques of EXAFS, SEXAFS, and XANES,ed. D. C. Koningsberger and R. Prins, Wiley, New York, vol. 8,ch. 8, 1988.
42 J. T. Miller, B. L. Mojet, D. E. Ramaker and D. C. Koningsberger,Catal. Today, 2000, 62, 101.
43 B. L. Mojet, J. T. Miller, D. E. Ramaker and D. C. Koningsberger,J. Catal., 1999, 186, 373.
This journal is c the Owner Societies 2012 Phys. Chem. Chem. Phys., 2012, 14, 11766–11779 11779
44 M. Vaarkamp, B. L. Mojet, M. J. Kappers, J. T. Miller andD. C. Koningsberger, J. Phys. Chem., 1995, 99, 16067.
45 A. N. Mansour, J. W. Cook and D. E. Sayers, J. Phys. Chem.,1984, 88, 2330.
46 P. Hohenberg and W. Kohn, Phys. Rev., 1964, 136, B864.47 G. Kresse and J. Furthmuller, Phys. Rev. B, 1996, 54, 11169.48 G. Kresse and D. Joubert, Phys. Rev. B, 1999, 59, 1758.49 J. P. Perdew, K. Burke and M. Ernzerhof, Phys. Rev. Lett., 1996,
77, 3865.50 L. Chen, A. C. Cooper, G. P. Pez and H. Cheng, J. Phys. Chem. C,
2007, 111, 5514.51 A. Vargas, G. Santarossa and A. Baiker, J. Phys. Chem. C, 2011,
115, 10661.52 M. Delgado, F. Delbecq, C. C. Santini, F. Lefebvre, S. Norsic,
P. Putaj, P. Sautet and J. M. Basset, J. Phys. Chem. C, 2012,116, 834.
53 M. Digne, P. Sautet, P. Raybaud, P. Euzen and H. Toulhoat,J. Catal., 2004, 226, 54.
54 M. Digne, P. Sautet, P. Raybaud, H. Toulhoat and E. Artacho,J. Phys. Chem. B, 2002, 106, 5155.
55 M. Digne, P. Sautet, P. Raybaud, P. Euzen and H. Toulhoat,J. Catal., 2002, 211, 1.
56 B. Hammer and J. K. Norskov, Nature, 1995, 376, 238.
57 M. Vaarkamp, J. T. Miller, F. S. Modica, G. S. Lane andD. C. Koningsberger, Jpn. J. Appl. Phys., 1993, 32(Suppl.32–2), 454.
58 M. M. Otten, M. J. Clayton and H. H. Lamb, J. Catal., 1994,149, 211.
59 M. G. Samant and M. Boudart, J. Phys. Chem., 1991, 95, 4070.60 A. V. Soldatov, S. Della longa and A. Bianconi, Solid State
Commun., 1993, 85, 863.61 T. Matsuura, T. Fujikawa and H. Kuroda, J. Phys. Soc. Jpn.,
1983, 52, 3275.62 V. R. Cooper, A. M. Kolpak, Y. Yourdshahyan and A. M. Rappe,
Phys. Rev. B, 2005, 72, 081409(R).63 M. Sugimoto, H. Katsuno, T. Hayasaka, N. Ishikawa and
K. Hirasawa, Appl. Catal., A, 1993, 102, 167.64 D. C. Koningsberger, J. de Graaf, B. L. Mojet, D. E. Ramaker and
J. T. Miller, Appl. Catal., A, 2000, 191, 205.65 L. Spenadel and M. Boudart, J. Phys. Chem., 1960, 64, 204.66 B. J. Kip, F. B. M. Duivenvoorden, D. C. Koningsberger and
R. Prins, J. Catal., 1987, 105, 26.67 X. Liu, H. Dilger, R. A. Eichel, J. Kunstmann and E. Roduner,
J. Phys. Chem. B, 2006, 110, 2013.68 J. H. Kwak, J. Hu, D. Mei, C.-W. Yi, D. H. Kim, C. H. F. Peden,
L. F. Allard and J. Szanyi, Science, 2009, 325, 1670.