Embed Size (px)
Citation preview
http://ras.sagepub.com/Administrative SciencesInternational Review of
http://ras.sagepub.com/content/78/2/346The online version of this article can be found at:
DOI: 10.1177/0020852312438783
2012 78: 346International Review of Administrative SciencesTaewoo Nam
Citizens' attitudes toward Open Government and Government 2.0
Published by:
http://www.sagepublications.com
On behalf of:
International Institute of Administrative Sciences
at: can be foundInternational Review of Administrative SciencesAdditional services and information for
http://ras.sagepub.com/cgi/alertsEmail Alerts:
http://ras.sagepub.com/subscriptionsSubscriptions:
http://www.sagepub.com/journalsReprints.navReprints:
http://www.sagepub.com/journalsPermissions.navPermissions:
What is This?
- Jun 12, 2012Version of Record >>
at CAMBRIDGE UNIV LIBRARY on October 16, 2014ras.sagepub.comDownloaded from at CAMBRIDGE UNIV LIBRARY on October 16, 2014ras.sagepub.comDownloaded from
International Review of
Administrative Sciences
78(2) 346–368
! The Author(s) 2012
Reprints and permissions:
sagepub.co.uk/journalsPermissions.nav
DOI: 10.1177/0020852312438783
ras.sagepub.com
InternationalReview ofAdministrativeSciencesArticle
Citizens’ attitudes toward OpenGovernment and Government 2.0
Taewoo NamUniversity at Albany, SUNY, United States
Abstract
This empirical study sees Open Government and Government 2.0 as a new ends and
means of e-government in the United States. The analysis of the data from the Pew
Research Center’s national survey (2009 Government Online) highlights what influences
American citizens’ attitudes toward Open Government and Government 2.0. This
article presents four main findings. First, while the use of existing e-government services
does not significantly influence attitudes toward Open Government, recent use of
Government 2.0 does contribute to positive attitudes toward Government 2.0.
Second, those who value transactions with e-government have a positive attitude
regarding Open Government and Government 2.0. Third, general trust in government
leads to a positive attitude toward the new ends and means of e-government. Finally,
frequent Web use and broadband adoption do not affect citizens’ attitudes concerning
the new modes of e-government. The study reveals that citizens’ attitudes toward
government workings do not change much with the introduction of new goals and
tools of e-government.
Points for practitioners
A government may gain considerable popular support from the public by introducing to
citizens new objectives and channels for the existing e-government. However, govern-
ment practitioners should know that offering new directives and technological tools
does not necessarily guarantee a positive response from citizens. When new goals and
vehicles of e-government reach citizens, a set of conventional determinants, such as
perceived value of government services and general trust in government, shapes the
collective attitude toward new modes of e-government. Practitioners need to assess
leverage by those fundamental factors.
Corresponding author:
Taewoo Nam, Center for Technology in Government, University at Albany, State University of New York, 187
Wolf Road, Suite 301, Albany, New York 12205, USA
Email: [email protected]
at CAMBRIDGE UNIV LIBRARY on October 16, 2014ras.sagepub.comDownloaded from
Keywords
citizen attitudes, e-government, Government 2.0, Open Government, Web 2.0
What is new in today’s e-government?
Since taking office in January 2009, the Obama Administration has envisioned anew direction for the US government: Open Government. Labeling this term ‘new’may be misleading because citizens have long felt the need for Open Government.In addition, for as long as governments have existed, there have been efforts tocreate Open Government in a range of contexts. This article, nevertheless,addresses something different from ‘government as usual’ (Golembiewski andGabris, 1995; Holzer and Halachmi, 1996). Today’s government is exposed tonew opportunities, enabled and facilitated by information and communicationtechnologies (ICTs), to accommodate citizens’ values: e.g. accessibility to informa-tion and services, efficiency and effectiveness of service delivery, and transparencyand accountability in operation and administration (Lathrop and Ruma, 2010).
Two buzzwords currently infiltrating the public sector are Open Governmentand Government 2.0. On the trajectory of e-government development, OpenGovernment and Government 2.0 seem to be, respectively, the new ends andnew means of e-government. This is true not only in the US, but also in otheradvanced industrial democracies, as well as certain developing countries. Theplatform and standard for technology-enabled government are moving frome-government (Government 1.0) to Open Government and Government 2.0(Nam, 2012; Parycek and Sachs, 2009).
This study spotlights the transition of e-government into new modes in terms ofgoals and tools. The new aspects of e-government are not only for government, butalso for the public as customers and users. The focus of this article is on citizens’attitudes toward Open Government and Government 2.0. Given this researchfocus, the subsequent research question becomes: What influences citizens’ attitudestoward Open Government and Government 2.0? Citizens’ evaluation of the perform-ance of new initiatives may vary and change with their adoption of ICTs, usage ofe-government services, trust in government, perceived value of the role ofe-government, and personal socio-demographic backgrounds. This study considersthose factors as potential determinants for attitudes toward the new aspects ofe-government. The article will be structured in four parts. Drawing on the extantliterature, the article explores both new and old themes culminating in currentdiscussions of e-government research (i.e. Open Government, Government 2.0,and citizens’ attitudes and perceptions of e-government), and then establishes sev-eral hypotheses. After describing details of the data (the 2009 Government Onlinesurvey conducted by the Pew Research Center) and measurements, the article pre-sents results of the multivariate regression analysis and tests hypotheses. Finally,the last section addresses further discussions and concluding remarks.
Nam 347
at CAMBRIDGE UNIV LIBRARY on October 16, 2014ras.sagepub.comDownloaded from
New themes and old themes
Open Government
As Open Government has been historically used in various contexts includingfreedom of information, anti-corruption, and transparency (Birkinshaw, 1997;Dawes, 2010; Dawes and Helbig, 2010; Parks, 1957; Rose-Ackerman, 2008), theconcept, per se, cannot be considered novel or recent. The US government’s stronginitiative notwithstanding is making Open Government its new priority objective.On 21 January 2009, his very first day in the White House, President BarackObama signed the Memorandum on Transparency and Open Government, usheringin a new era of open and accountable government meant to bridge the gap betweenthe American people and their government.
My Administration is committed to creating an unprecedented level of openness in
Government. We will work together to ensure the public trust and establish a system
of transparency, public participation, and collaboration. Openness will strengthen
our democracy and promote efficiency and effectiveness in Government.
(see www.WhiteHouse.gov/the_Press_Office/TransparencyandOpenGovernment/)
The Obama Administration seeks to create and institutionalize a culture ofOpen Government, requiring that federal agencies’ Open Government plansaddress transparency, participation, and collaboration, describe a flagship initia-tive, and offer various opportunities for public and agency engagement(Nam, 2012; McDermott, 2010). This study follows that practical conceptualiza-tion of Open Government as an explicitly addressed governmental goal.
Through greater openness and new technologies, the Obama Administrationhopes to empower the public to influence the decisions that affect their lives. Therole of ICTs is central and fundamental to opening government, though technologycannot account for all recent changes in government (Dawes, 2008). The OpenGovernment Initiative upholds transparency, participation, and governance(through collaboration), the core values of e-government. Changing technologies(social networking software, visualization, and virtualization) may offer the newmeans for governance (Dawes, 2009). Now, with the continual advancement ofe-government, public values stated in the directive may become relatively morespecific and tangible as goals, compared to earlier years of e-government whenresearchers (Moon, 2002; Reddick, 2004b; West, 2004) reported no more thanrhetorical performance of e-government (which explains the gap between theactual status of e-government and the envisioned elevated and functioning stage).
Government 2.0
A variety of new technological instruments are available for the development ofe-government. Contemporaries see the ubiquitous, prevailing fashion of Web 2.0,
348 International Review of Administrative Sciences 78(2)
at CAMBRIDGE UNIV LIBRARY on October 16, 2014ras.sagepub.comDownloaded from
which is the second generation of Web access and use, characterized as participa-tory, pervasive and integrated (Mintz, 2008). The second generation Web technol-ogies have the potential to change both the way government delivers services andits relationship with the public. A suite of popular Web 2.0 technologies, such associal networking and social media (Facebook, MySpace), wikis, blogs, microblogs (Twitter), social voting (e.g. IdeaFactory and IdeaStorm platform), mash-up, and multimedia sharing (YouTube, Flickr), can promote open and user-drivengovernance (Millard, 2009).
Government 2.0 refers to the use of Web 2.0 technologies to socialize govern-ment services, processes, and data (DiMaio, 2009). The government’s use of col-laborative technologies is at the heart of Web 2.0. It permits a two-way interactionbetween government and citizens via online comments, live chats, and messagethreads. Despite hopeful expectations for Government 2.0, its status is somewhatcontroversial. While DiMaio (2009) does not view Government 2.0 as a new kindof government, but rather as a means to an end, Tapscott et al. (2008) laudedGovernment 2.0 as the next generation of e-government.
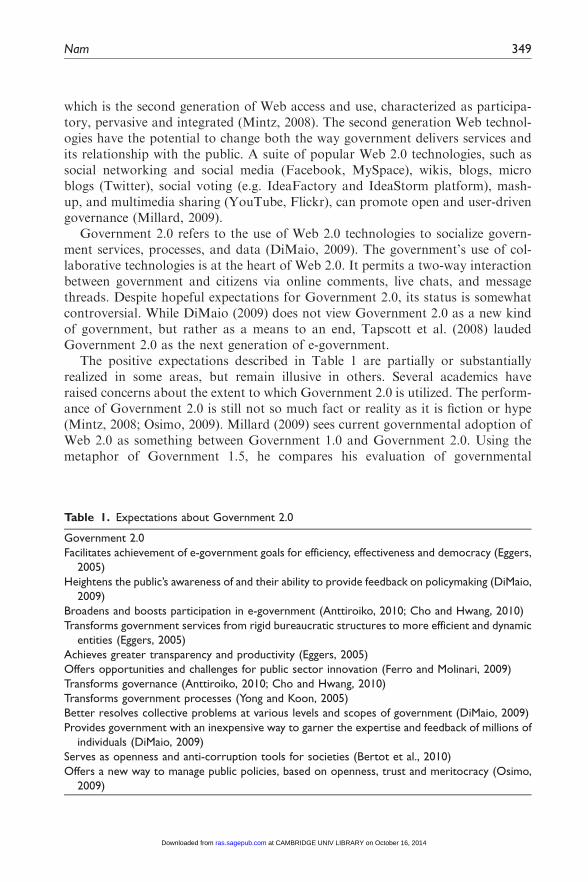
The positive expectations described in Table 1 are partially or substantiallyrealized in some areas, but remain illusive in others. Several academics haveraised concerns about the extent to which Government 2.0 is utilized. The perform-ance of Government 2.0 is still not so much fact or reality as it is fiction or hype(Mintz, 2008; Osimo, 2009). Millard (2009) sees current governmental adoption ofWeb 2.0 as something between Government 1.0 and Government 2.0. Using themetaphor of Government 1.5, he compares his evaluation of governmental
Table 1. Expectations about Government 2.0
Government 2.0
Facilitates achievement of e-government goals for efficiency, effectiveness and democracy (Eggers,
2005)
Heightens the public’s awareness of and their ability to provide feedback on policymaking (DiMaio,
2009)
Broadens and boosts participation in e-government (Anttiroiko, 2010; Cho and Hwang, 2010)
Transforms government services from rigid bureaucratic structures to more efficient and dynamic
entities (Eggers, 2005)
Achieves greater transparency and productivity (Eggers, 2005)
Offers opportunities and challenges for public sector innovation (Ferro and Molinari, 2009)
Transforms governance (Anttiroiko, 2010; Cho and Hwang, 2010)
Transforms government processes (Yong and Koon, 2005)
Better resolves collective problems at various levels and scopes of government (DiMaio, 2009)
Provides government with an inexpensive way to garner the expertise and feedback of millions of
individuals (DiMaio, 2009)
Serves as openness and anti-corruption tools for societies (Bertot et al., 2010)
Offers a new way to manage public policies, based on openness, trust and meritocracy (Osimo,
2009)
Nam 349
at CAMBRIDGE UNIV LIBRARY on October 16, 2014ras.sagepub.comDownloaded from
utilization of Web-based technologies to half-full and half-empty glasses. The ear-lier recognition that the reality of e-government lags behind its rhetoric (Moon,2002) recurs with the rapid mushrooming of Government 2.0.
There are several reasons for the rhetoric–reality gap. The public sector is slowin utilizing Web 2.0 due to privacy, security, and information policy, compared tobusinesses that are able and enthusiastic to employ Web 2.0. Placing policies ofOpen Government into practice requires a cultural shift as well as the operationa-lization of new policies yet undefined. Bertot et al. (2009), recognizing the policy–technology gap, claim that the Obama Administration is now seeking aGovernment 2.0 administration while still residing in a Government 1.0 environ-ment. The fact that excessive enthusiasm (i.e. idolization, faddism, technophilia,and lomanism) for ICTs normally results in failure to develop and use technologysystems in government (Goldfinch, 2007) cannot be ignored, and e-government andGovernment 2.0 may be no exception.
Citizens’ attitudes toward e-government
The attitudes of citizens may be influenced by services that are enabled andadvanced by the employment of new technologies implemented for governmentworkings. Previous empirical studies have surveyed citizens’ attitudes and/or per-ceptions of e-government in terms of trust, satisfaction, and values. There has beena gap between public expectation and perceived governmental performance(Nye et al., 1997; Peters, 2009) that underlines the importance of actual governmentperformance since the objective – that is, the idea or notion – of performance onlyraises citizens’ expectations, and if this objective is not achieved, the previouslymentioned gap widens. The public expectation–perception gap can lead to a declinein the public’s trust of government, a causality that also applies to e-government(Welch et al., 2005). This perceptual distance, in addition to the information gapbetween the public and government, is a major reason for the decline in public trustof government.
Individuals’ longstanding perceptions about government may be unyielding, sothat while elaborate technology may positively affect some citizens’ attitudes, theseadvances may also fail to influence even a slight change in others. Therefore, OpenGovernment driven by Government 2.0 needs to be evaluated from the viewpointof citizens. Combined with the continuous expansion and progress of conventionale-government functions, various new initiatives of e-government are believed toboost citizens’ satisfaction with, and trust in, government performance by cham-pioning the core values of transparency, public participation, and collaboration.
Despite the theoretical importance of the relationship between technology, gov-ernmental workings and citizens’ perception, there is a weakness inherent in empir-ical research, since the degree to which citizens recognize and are satisfied withe-government strategies is often not clearly articulated as a measure of empiricalinvestigation (Welch et al., 2005). The way that citizens view their governmentseems quite abstract in terms of conceptual validity and measurability.
350 International Review of Administrative Sciences 78(2)
at CAMBRIDGE UNIV LIBRARY on October 16, 2014ras.sagepub.comDownloaded from
Considering such a limitation, an array of prior studies have developed andemployed several effective strategies for measuring citizens’ perceptions andattitudes.
Empirical research can be conducted to determine how citizens view and usee-government, for example, by evaluating perceptions, satisfaction, efficacy, trust,and confidence. Focusing on these areas, existing research presents or assumesvarious causal models. Antecedents and determinants of online political participa-tion matter to the extent that use of e-government affects citizens’ attitudes (Tolbertand Mossberger, 2003). In particular, attention to socio-demographic conditionsreveals that the impact of e-government varies across segments within the popula-tion (Mossberger et al., 2003, 2008; Niehaves and Becker, 2008; Tolbert andMossberger, 2003; Welch et al., 2005; West, 2004). Perception of the usefulnessof e-government (perceived use value of e-government) influences citizens’ satisfac-tion with e-government (Kolsaker and Lee-Kelley, 2008) and, consequently, con-tinuous usage of e-government (Carter and Belanger, 2005; Wangpipatwong et al.,2008). Frequent use of e-government has a great impact on trust in government andattitudes toward e-government (Kolsaker and Lee-Kelley, 2008; Sweeney, 2007;Tolbert and Mossberger, 2003), and there is a strong correlation between satisfac-tion with e-government and trust in government (Welch et al., 2005).
Technological factors also deserve consideration. The disparity in degreesof Web use among socio-demographic groups captures the digital divide, whichfundamentally impedes the nationwide spread of e-government use. Therefore,including Web use as an explanatory variable aids in demonstrating the influenceof the digital divide on citizens’ attitudes concerning e-government. Anothertechnological factor is the adoption of broadband Internet connectivity. Sincee-government services, especially Government 2.0-enabled functions, require a(moderately) high level of Web connectivity, dial-up Internet users maylag behind high-speed Internet users who can benefit by using any new featuresof e-government.
Hypotheses
Drawing on the literature review, this study identifies the following factors thatinfluence citizens’ attitudes toward e-government:1 e-government usage intensity,perceived value of e-government, general trust in government, and general use ofthe Internet. In light of those primary factors, this study generates the followinghypotheses. When socio-demographic characteristics are controlled, the studyhypothesizes that the factors would affect citizens’ attitudes regarding OpenGovernment and Government 2.0.
Hypothesis 1: Citizens’ frequent use of e-government positively influences their
attitudes concerning the new ends (Open Government) and means (Government
2.0) of e-government.
Nam 351
at CAMBRIDGE UNIV LIBRARY on October 16, 2014ras.sagepub.comDownloaded from
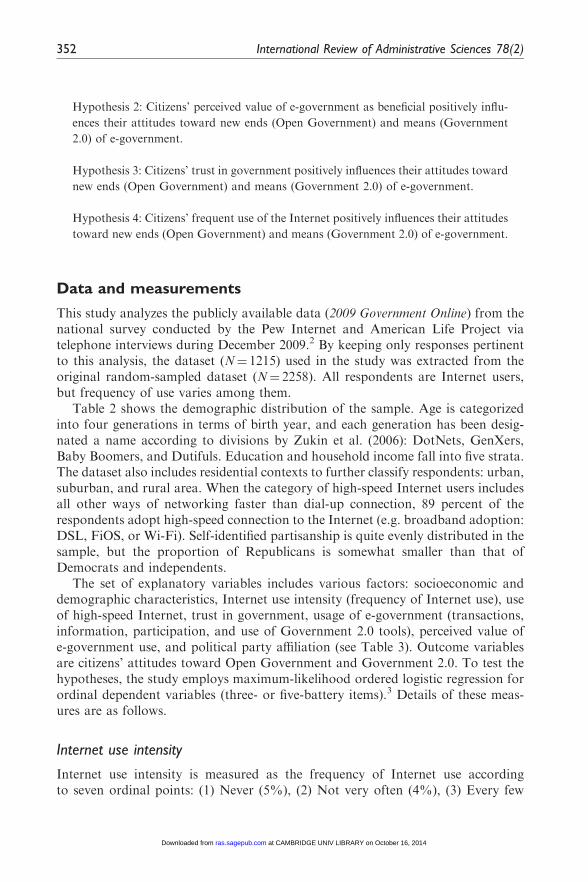
Hypothesis 2: Citizens’ perceived value of e-government as beneficial positively influ-
ences their attitudes toward new ends (Open Government) and means (Government
2.0) of e-government.
Hypothesis 3: Citizens’ trust in government positively influences their attitudes toward
new ends (Open Government) and means (Government 2.0) of e-government.
Hypothesis 4: Citizens’ frequent use of the Internet positively influences their attitudes
toward new ends (Open Government) and means (Government 2.0) of e-government.
Data and measurements
This study analyzes the publicly available data (2009 Government Online) from thenational survey conducted by the Pew Internet and American Life Project viatelephone interviews during December 2009.2 By keeping only responses pertinentto this analysis, the dataset (N¼ 1215) used in the study was extracted from theoriginal random-sampled dataset (N¼ 2258). All respondents are Internet users,but frequency of use varies among them.
Table 2 shows the demographic distribution of the sample. Age is categorizedinto four generations in terms of birth year, and each generation has been desig-nated a name according to divisions by Zukin et al. (2006): DotNets, GenXers,Baby Boomers, and Dutifuls. Education and household income fall into five strata.The dataset also includes residential contexts to further classify respondents: urban,suburban, and rural area. When the category of high-speed Internet users includesall other ways of networking faster than dial-up connection, 89 percent of therespondents adopt high-speed connection to the Internet (e.g. broadband adoption:DSL, FiOS, or Wi-Fi). Self-identified partisanship is quite evenly distributed in thesample, but the proportion of Republicans is somewhat smaller than that ofDemocrats and independents.
The set of explanatory variables includes various factors: socioeconomic anddemographic characteristics, Internet use intensity (frequency of Internet use), useof high-speed Internet, trust in government, usage of e-government (transactions,information, participation, and use of Government 2.0 tools), perceived value ofe-government use, and political party affiliation (see Table 3). Outcome variablesare citizens’ attitudes toward Open Government and Government 2.0. To test thehypotheses, the study employs maximum-likelihood ordered logistic regression forordinal dependent variables (three- or five-battery items).3 Details of these meas-ures are as follows.
Internet use intensity
Internet use intensity is measured as the frequency of Internet use accordingto seven ordinal points: (1) Never (5%), (2) Not very often (4%), (3) Every few
352 International Review of Administrative Sciences 78(2)
at CAMBRIDGE UNIV LIBRARY on October 16, 2014ras.sagepub.comDownloaded from
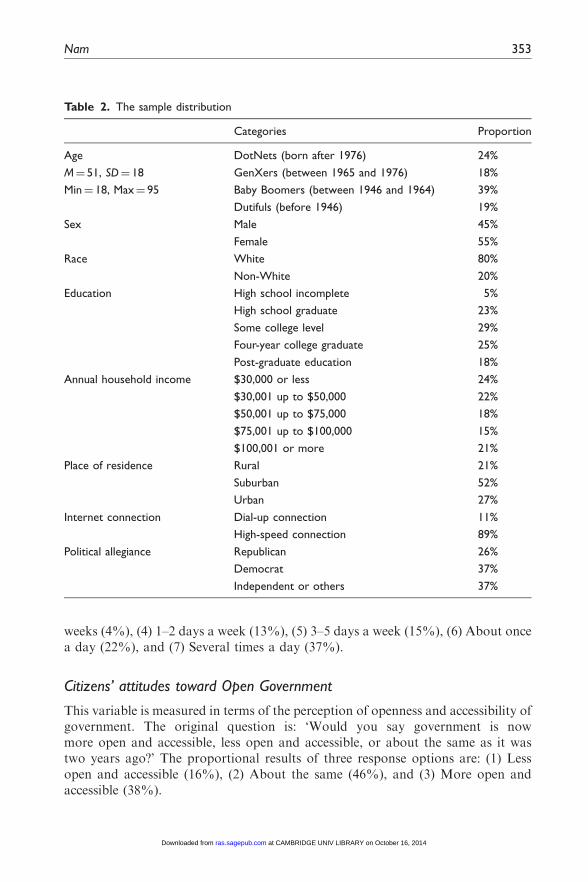
weeks (4%), (4) 1–2 days a week (13%), (5) 3–5 days a week (15%), (6) About oncea day (22%), and (7) Several times a day (37%).
Citizens’ attitudes toward Open Government
This variable is measured in terms of the perception of openness and accessibility ofgovernment. The original question is: ‘Would you say government is nowmore open and accessible, less open and accessible, or about the same as it wastwo years ago?’ The proportional results of three response options are: (1) Lessopen and accessible (16%), (2) About the same (46%), and (3) More open andaccessible (38%).
Table 2. The sample distribution
Categories Proportion
Age DotNets (born after 1976) 24%
M¼ 51, SD¼ 18 GenXers (between 1965 and 1976) 18%
Min¼ 18, Max¼ 95 Baby Boomers (between 1946 and 1964) 39%
Dutifuls (before 1946) 19%
Sex Male 45%
Female 55%
Race White 80%
Non-White 20%
Education High school incomplete 5%
High school graduate 23%
Some college level 29%
Four-year college graduate 25%
Post-graduate education 18%
Annual household income $30,000 or less 24%
$30,001 up to $50,000 22%
$50,001 up to $75,000 18%
$75,001 up to $100,000 15%
$100,001 or more 21%
Place of residence Rural 21%
Suburban 52%
Urban 27%
Internet connection Dial-up connection 11%
High-speed connection 89%
Political allegiance Republican 26%
Democrat 37%
Independent or others 37%
Nam 353
at CAMBRIDGE UNIV LIBRARY on October 16, 2014ras.sagepub.comDownloaded from
Citizens’ attitudes toward Government 2.0 tools
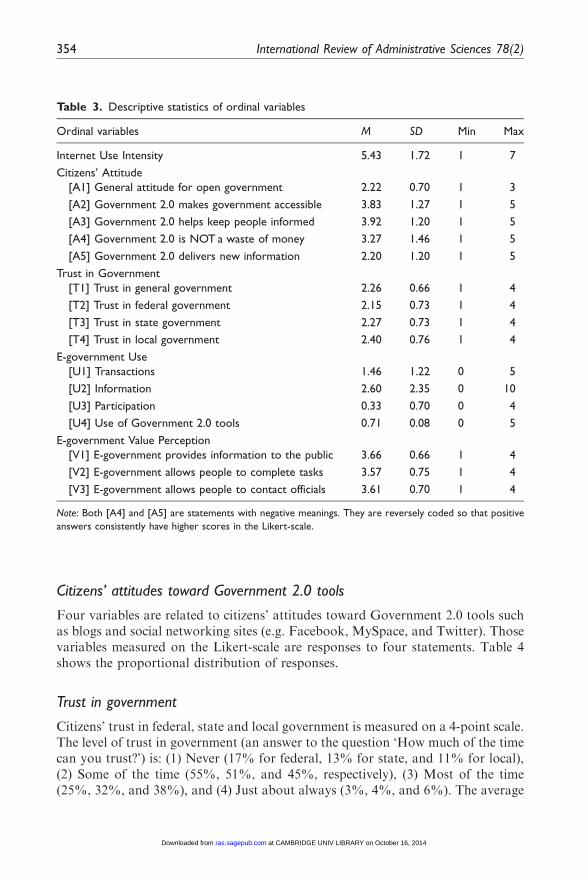
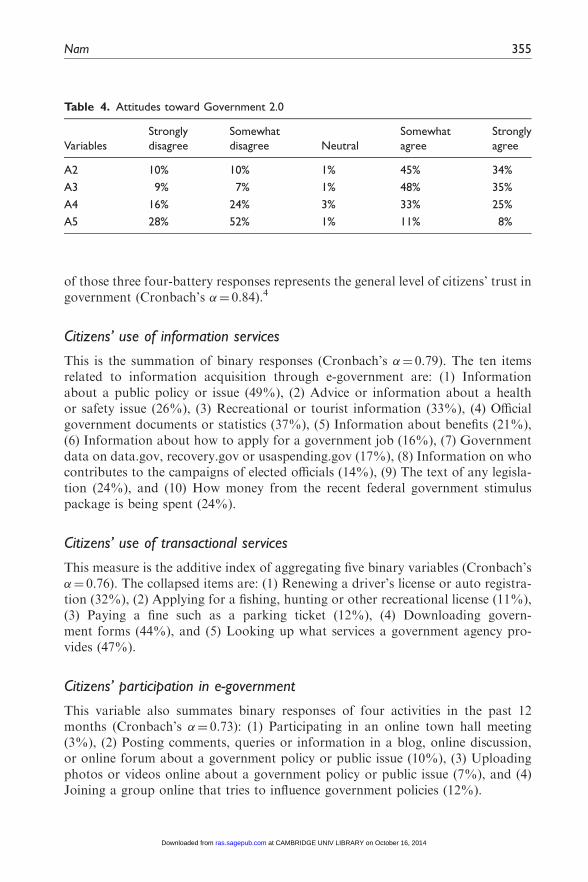
Four variables are related to citizens’ attitudes toward Government 2.0 tools suchas blogs and social networking sites (e.g. Facebook, MySpace, and Twitter). Thosevariables measured on the Likert-scale are responses to four statements. Table 4shows the proportional distribution of responses.
Trust in government
Citizens’ trust in federal, state and local government is measured on a 4-point scale.The level of trust in government (an answer to the question ‘How much of the timecan you trust?’) is: (1) Never (17% for federal, 13% for state, and 11% for local),(2) Some of the time (55%, 51%, and 45%, respectively), (3) Most of the time(25%, 32%, and 38%), and (4) Just about always (3%, 4%, and 6%). The average
Table 3. Descriptive statistics of ordinal variables
Ordinal variables M SD Min Max
Internet Use Intensity 5.43 1.72 1 7
Citizens’ Attitude
[A1] General attitude for open government 2.22 0.70 1 3
[A2] Government 2.0 makes government accessible 3.83 1.27 1 5
[A3] Government 2.0 helps keep people informed 3.92 1.20 1 5
[A4] Government 2.0 is NOT a waste of money 3.27 1.46 1 5
[A5] Government 2.0 delivers new information 2.20 1.20 1 5
Trust in Government
[T1] Trust in general government 2.26 0.66 1 4
[T2] Trust in federal government 2.15 0.73 1 4
[T3] Trust in state government 2.27 0.73 1 4
[T4] Trust in local government 2.40 0.76 1 4
E-government Use
[U1] Transactions 1.46 1.22 0 5
[U2] Information 2.60 2.35 0 10
[U3] Participation 0.33 0.70 0 4
[U4] Use of Government 2.0 tools 0.71 0.08 0 5
E-government Value Perception
[V1] E-government provides information to the public 3.66 0.66 1 4
[V2] E-government allows people to complete tasks 3.57 0.75 1 4
[V3] E-government allows people to contact officials 3.61 0.70 1 4
Note: Both [A4] and [A5] are statements with negative meanings. They are reversely coded so that positive
answers consistently have higher scores in the Likert-scale.
354 International Review of Administrative Sciences 78(2)
at CAMBRIDGE UNIV LIBRARY on October 16, 2014ras.sagepub.comDownloaded from
of those three four-battery responses represents the general level of citizens’ trust ingovernment (Cronbach’s �¼ 0.84).4
Citizens’ use of information services
This is the summation of binary responses (Cronbach’s �¼ 0.79). The ten itemsrelated to information acquisition through e-government are: (1) Informationabout a public policy or issue (49%), (2) Advice or information about a healthor safety issue (26%), (3) Recreational or tourist information (33%), (4) Officialgovernment documents or statistics (37%), (5) Information about benefits (21%),(6) Information about how to apply for a government job (16%), (7) Governmentdata on data.gov, recovery.gov or usaspending.gov (17%), (8) Information on whocontributes to the campaigns of elected officials (14%), (9) The text of any legisla-tion (24%), and (10) How money from the recent federal government stimuluspackage is being spent (24%).
Citizens’ use of transactional services
This measure is the additive index of aggregating five binary variables (Cronbach’s�¼ 0.76). The collapsed items are: (1) Renewing a driver’s license or auto registra-tion (32%), (2) Applying for a fishing, hunting or other recreational license (11%),(3) Paying a fine such as a parking ticket (12%), (4) Downloading govern-ment forms (44%), and (5) Looking up what services a government agency pro-vides (47%).
Citizens’ participation in e-government
This variable also summates binary responses of four activities in the past 12months (Cronbach’s �¼ 0.73): (1) Participating in an online town hall meeting(3%), (2) Posting comments, queries or information in a blog, online discussion,or online forum about a government policy or public issue (10%), (3) Uploadingphotos or videos online about a government policy or public issue (7%), and (4)Joining a group online that tries to influence government policies (12%).
Table 4. Attitudes toward Government 2.0
Variables
Strongly
disagree
Somewhat
disagree Neutral
Somewhat
agree
Strongly
agree
A2 10% 10% 1% 45% 34%
A3 9% 7% 1% 48% 35%
A4 16% 24% 3% 33% 25%
A5 28% 52% 1% 11% 8%
Nam 355
at CAMBRIDGE UNIV LIBRARY on October 16, 2014ras.sagepub.comDownloaded from
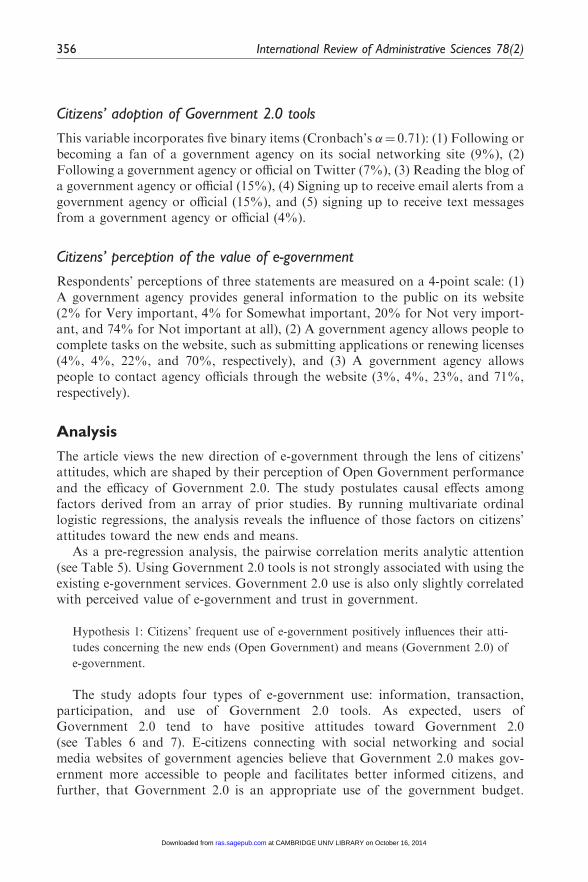
Citizens’ adoption of Government 2.0 tools
This variable incorporates five binary items (Cronbach’s �¼ 0.71): (1) Following orbecoming a fan of a government agency on its social networking site (9%), (2)Following a government agency or official on Twitter (7%), (3) Reading the blog ofa government agency or official (15%), (4) Signing up to receive email alerts from agovernment agency or official (15%), and (5) signing up to receive text messagesfrom a government agency or official (4%).
Citizens’ perception of the value of e-government
Respondents’ perceptions of three statements are measured on a 4-point scale: (1)A government agency provides general information to the public on its website(2% for Very important, 4% for Somewhat important, 20% for Not very import-ant, and 74% for Not important at all), (2) A government agency allows people tocomplete tasks on the website, such as submitting applications or renewing licenses(4%, 4%, 22%, and 70%, respectively), and (3) A government agency allowspeople to contact agency officials through the website (3%, 4%, 23%, and 71%,respectively).
Analysis
The article views the new direction of e-government through the lens of citizens’attitudes, which are shaped by their perception of Open Government performanceand the efficacy of Government 2.0. The study postulates causal effects amongfactors derived from an array of prior studies. By running multivariate ordinallogistic regressions, the analysis reveals the influence of those factors on citizens’attitudes toward the new ends and means.
As a pre-regression analysis, the pairwise correlation merits analytic attention(see Table 5). Using Government 2.0 tools is not strongly associated with using theexisting e-government services. Government 2.0 use is also only slightly correlatedwith perceived value of e-government and trust in government.
Hypothesis 1: Citizens’ frequent use of e-government positively influences their atti-
tudes concerning the new ends (Open Government) and means (Government 2.0) of
e-government.
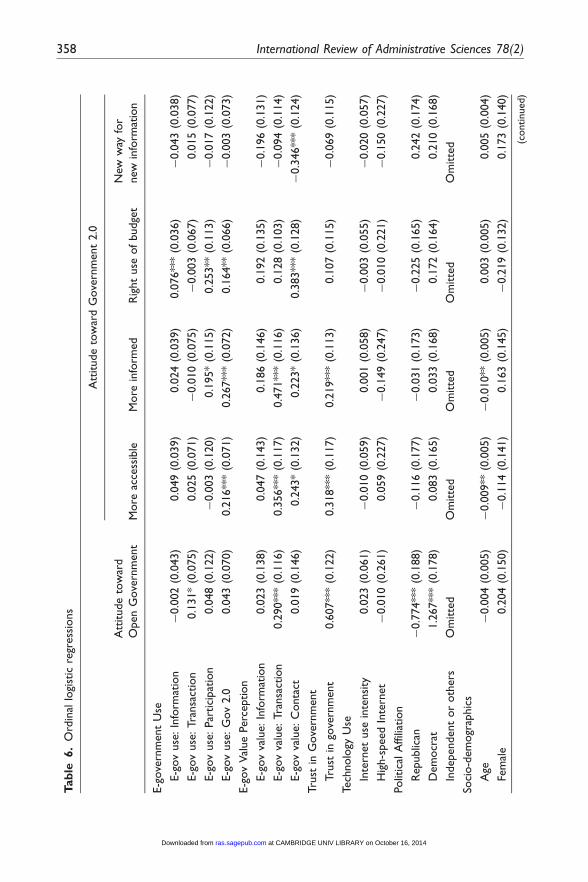
The study adopts four types of e-government use: information, transaction,participation, and use of Government 2.0 tools. As expected, users ofGovernment 2.0 tend to have positive attitudes toward Government 2.0(see Tables 6 and 7). E-citizens connecting with social networking and socialmedia websites of government agencies believe that Government 2.0 makes gov-ernment more accessible to people and facilitates better informed citizens, andfurther, that Government 2.0 is an appropriate use of the government budget.
356 International Review of Administrative Sciences 78(2)
at CAMBRIDGE UNIV LIBRARY on October 16, 2014ras.sagepub.comDownloaded from
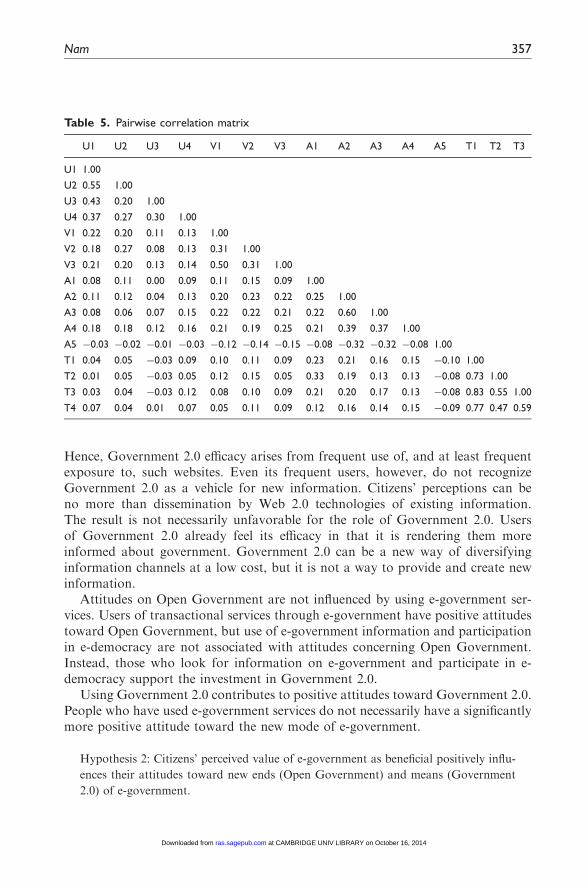
Hence, Government 2.0 efficacy arises from frequent use of, and at least frequentexposure to, such websites. Even its frequent users, however, do not recognizeGovernment 2.0 as a vehicle for new information. Citizens’ perceptions can beno more than dissemination by Web 2.0 technologies of existing information.The result is not necessarily unfavorable for the role of Government 2.0. Usersof Government 2.0 already feel its efficacy in that it is rendering them moreinformed about government. Government 2.0 can be a new way of diversifyinginformation channels at a low cost, but it is not a way to provide and create newinformation.
Attitudes on Open Government are not influenced by using e-government ser-vices. Users of transactional services through e-government have positive attitudestoward Open Government, but use of e-government information and participationin e-democracy are not associated with attitudes concerning Open Government.Instead, those who look for information on e-government and participate in e-democracy support the investment in Government 2.0.
Using Government 2.0 contributes to positive attitudes toward Government 2.0.People who have used e-government services do not necessarily have a significantlymore positive attitude toward the new mode of e-government.
Hypothesis 2: Citizens’ perceived value of e-government as beneficial positively influ-
ences their attitudes toward new ends (Open Government) and means (Government
2.0) of e-government.
Table 5. Pairwise correlation matrix
U1 U2 U3 U4 V1 V2 V3 A1 A2 A3 A4 A5 T1 T2 T3
U1 1.00
U2 0.55 1.00
U3 0.43 0.20 1.00
U4 0.37 0.27 0.30 1.00
V1 0.22 0.20 0.11 0.13 1.00
V2 0.18 0.27 0.08 0.13 0.31 1.00
V3 0.21 0.20 0.13 0.14 0.50 0.31 1.00
A1 0.08 0.11 0.00 0.09 0.11 0.15 0.09 1.00
A2 0.11 0.12 0.04 0.13 0.20 0.23 0.22 0.25 1.00
A3 0.08 0.06 0.07 0.15 0.22 0.22 0.21 0.22 0.60 1.00
A4 0.18 0.18 0.12 0.16 0.21 0.19 0.25 0.21 0.39 0.37 1.00
A5 �0.03 �0.02 �0.01 �0.03 �0.12 �0.14 �0.15 �0.08 �0.32 �0.32 �0.08 1.00
T1 0.04 0.05 �0.03 0.09 0.10 0.11 0.09 0.23 0.21 0.16 0.15 �0.10 1.00
T2 0.01 0.05 �0.03 0.05 0.12 0.15 0.05 0.33 0.19 0.13 0.13 �0.08 0.73 1.00
T3 0.03 0.04 �0.03 0.12 0.08 0.10 0.09 0.21 0.20 0.17 0.13 �0.08 0.83 0.55 1.00
T4 0.07 0.04 0.01 0.07 0.05 0.11 0.09 0.12 0.16 0.14 0.15 �0.09 0.77 0.47 0.59
Nam 357
at CAMBRIDGE UNIV LIBRARY on October 16, 2014ras.sagepub.comDownloaded from
Tab
le6.
Ord
inal
logi
stic
regr
ess
ions
Att
itude
tow
ard
Open
Gove
rnm
ent
Att
itude
tow
ard
Gove
rnm
ent
2.0
More
acce
ssib
leM
ore
info
rmed
Rig
ht
use
of
budge
t
New
way
for
new
info
rmat
ion
E-g
ove
rnm
ent
Use
E-g
ov
use
:In
form
atio
n�
0.0
02
(0.0
43)
0.0
49
(0.0
39)
0.0
24
(0.0
39)
0.0
76**
*(0
.036)
�0.0
43
(0.0
38)
E-g
ov
use
:Tra
nsa
ctio
n0.1
31*
(0.0
75)
0.0
25
(0.0
71)
�0.0
10
(0.0
75)
�0.0
03
(0.0
67)
0.0
15
(0.0
77)
E-g
ov
use
:Par
tici
pat
ion
0.0
48
(0.1
22)
�0.0
03
(0.1
20)
0.1
95*
(0.1
15)
0.2
53**
(0.1
13)
�0.0
17
(0.1
22)
E-g
ov
use
:G
ov
2.0
0.0
43
(0.0
70)
0.2
16**
*(0
.071)
0.2
67**
*(0
.072)
0.1
64**
(0.0
66)
�0.0
03
(0.0
73)
E-g
ov
Val
ue
Perc
eption
E-g
ov
valu
e:In
form
atio
n0.0
23
(0.1
38)
0.0
47
(0.1
43)
0.1
86
(0.1
46)
0.1
92
(0.1
35)
�0.1
96
(0.1
31)
E-g
ov
valu
e:Tra
nsa
ctio
n0.2
90**
*(0
.116)
0.3
56**
*(0
.117)
0.4
71**
*(0
.116)
0.1
28
(0.1
03)
�0.0
94
(0.1
14)
E-g
ov
valu
e:C
onta
ct0.0
19
(0.1
46)
0.2
43*
(0.1
32)
0.2
23*
(0.1
36)
0.3
83**
*(0
.128)
�0.3
46**
*(0
.124)
Tru
stin
Gove
rnm
ent
Tru
stin
gove
rnm
ent
0.6
07**
*(0
.122)
0.3
18**
*(0
.117)
0.2
19**
*(0
.113)
0.1
07
(0.1
15)
�0.0
69
(0.1
15)
Tech
nolo
gyU
se
Inte
rnet
use
inte
nsi
ty0.0
23
(0.0
61)
�0.0
10
(0.0
59)
0.0
01
(0.0
58)
�0.0
03
(0.0
55)
�0.0
20
(0.0
57)
Hig
h-s
peed
Inte
rnet
�0.0
10
(0.2
61)
0.0
59
(0.2
27)
�0.1
49
(0.2
47)
�0.0
10
(0.2
21)
�0.1
50
(0.2
27)
Polit
ical
Affili
atio
n
Republic
an�
0.7
74**
*(0
.188)
�0.1
16
(0.1
77)
�0.0
31
(0.1
73)
�0.2
25
(0.1
65)
0.2
42
(0.1
74)
Dem
ocr
at1.2
67**
*(0
.178)
0.0
83
(0.1
65)
0.0
33
(0.1
68)
0.1
72
(0.1
64)
0.2
10
(0.1
68)
Independent
or
oth
ers
Om
itte
dO
mitte
dO
mitte
dO
mitte
dO
mitte
d
Soci
o-d
em
ogr
aphic
s
Age
�0.0
04
(0.0
05)
�0.0
09**
(0.0
05)
�0.0
10**
(0.0
05)
0.0
03
(0.0
05)
0.0
05
(0.0
04)
Fem
ale
0.2
04
(0.1
50)
�0.1
14
(0.1
41)
0.1
63
(0.1
45)
�0.2
19
(0.1
32)
0.1
73
(0.1
40)
(continued)
358 International Review of Administrative Sciences 78(2)
at CAMBRIDGE UNIV LIBRARY on October 16, 2014ras.sagepub.comDownloaded from
Tab
le6.
Continued
Att
itude
tow
ard
Open
Gove
rnm
ent
Att
itude
tow
ard
Gove
rnm
ent
2.0
More
acce
ssib
leM
ore
info
rmed
Rig
ht
use
of
budge
t
New
way
for
new
info
rmat
ion
White
0.1
10
(0.2
01)
0.0
13
(0.2
07)
�0.2
18
(0.2
16)
0.0
41
(0.2
23)
�0.1
85
(0.2
27)
Educa
tion
�0.0
25
(0.0
57)
0.0
02
(0.0
52)
�0.0
61
(0.0
52)
0.1
37**
(0.0
51)
0.0
02
(0.0
51)
Inco
me
�0.0
17
(0.0
41)
�0.0
66*
(0.0
39)
�0.0
30
(0.0
38)
�0.0
66**
(0.0
36)
�0.0
14
(0.0
39)
Suburb
anre
sidence
0.2
19
(0.2
03)
�0.0
67
(0.1
73)
�0.2
16
(0.1
69)
0.1
50
(0.1
72)
0.1
93
(0.1
65)
Urb
anre
sidence
�0.1
55
(0.2
20)
�0.0
98
(0.1
93)
�0.4
02**
(0.1
95)
�0.0
19
(0.1
96)
�0.0
49
(0.1
87)
Rura
lre
sidence
Om
itte
dO
mitte
dO
mitte
dO
mitte
dO
mitte
d
Cut
10.8
59
(0.7
14)
0.1
19
(0.7
02)
�0.1
31
(0.6
86)
1.7
42
(0.6
70)
�3.3
83
(0.6
60)
Cut
23.5
75
(0.7
28)
0.8
88
(0.7
07)
0.6
08
(0.6
88)
3.1
00
(0.6
77)
�0.8
91
(0.6
46)
Cut
30.9
30
(0.7
07)
0.7
54
(0.6
86)
3.1
80
(0.6
77)
�0.8
11
(0.6
46)
Cut
43.1
50
(0.7
17)
3.2
85
(0.7
05)
4.7
97
(0.6
88)
0.1
46
(0.6
47)
N1201
1201
1201
1201
1201
Log-
likelih
ood
�692.7
3�
939.4
2�
901.5
5�
1,1
00.0
2�
923.0
8
Log-
ratio�
2202.5
0**
*89.0
4**
*119.8
4**
*116.9
4**
*43.3
6**
*
Pse
udo
R2
0.2
275
0.1
452
0.1
623
0.1
505
0.1
209
***p<
0.0
01;**
p<
0.0
1;*p<
0.0
5.R
obust
stan
dar
derr
ors
inpar
enth
ese
s.
Nam 359
at CAMBRIDGE UNIV LIBRARY on October 16, 2014ras.sagepub.comDownloaded from
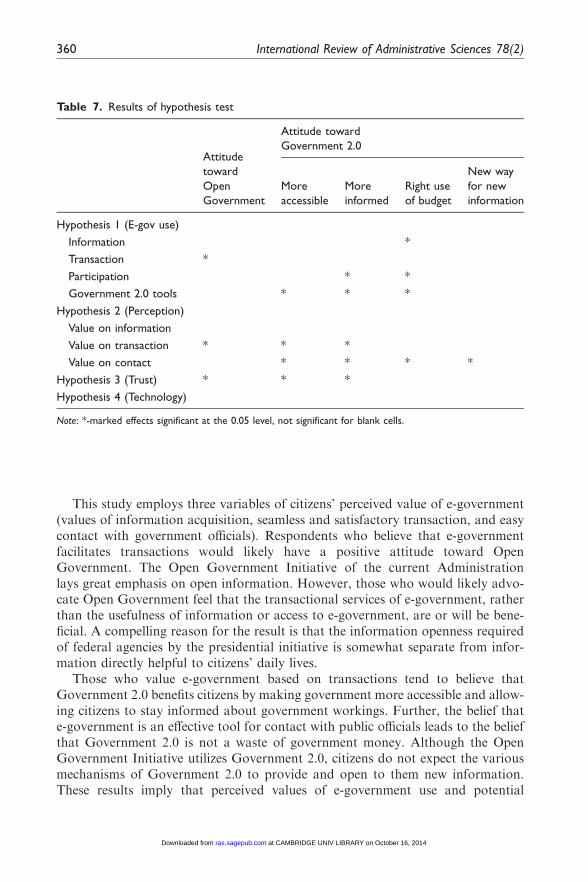
This study employs three variables of citizens’ perceived value of e-government(values of information acquisition, seamless and satisfactory transaction, and easycontact with government officials). Respondents who believe that e-governmentfacilitates transactions would likely have a positive attitude toward OpenGovernment. The Open Government Initiative of the current Administrationlays great emphasis on open information. However, those who would likely advo-cate Open Government feel that the transactional services of e-government, ratherthan the usefulness of information or access to e-government, are or will be bene-ficial. A compelling reason for the result is that the information openness requiredof federal agencies by the presidential initiative is somewhat separate from infor-mation directly helpful to citizens’ daily lives.
Those who value e-government based on transactions tend to believe thatGovernment 2.0 benefits citizens by making government more accessible and allow-ing citizens to stay informed about government workings. Further, the belief thate-government is an effective tool for contact with public officials leads to the beliefthat Government 2.0 is not a waste of government money. Although the OpenGovernment Initiative utilizes Government 2.0, citizens do not expect the variousmechanisms of Government 2.0 to provide and open to them new information.These results imply that perceived values of e-government use and potential
Table 7. Results of hypothesis test
Attitude
toward
Open
Government
Attitude toward
Government 2.0
More
accessible
More
informed
Right use
of budget
New way
for new
information
Hypothesis 1 (E-gov use)
Information *
Transaction *
Participation * *
Government 2.0 tools * * *
Hypothesis 2 (Perception)
Value on information
Value on transaction * * *
Value on contact * * * *
Hypothesis 3 (Trust) * * *
Hypothesis 4 (Technology)
Note: *-marked effects significant at the 0.05 level, not significant for blank cells.
360 International Review of Administrative Sciences 78(2)
at CAMBRIDGE UNIV LIBRARY on October 16, 2014ras.sagepub.comDownloaded from
benefits from it are, to some extent and in some aspects, translated into attitudestoward Open Government and Government 2.0.
Hypothesis 3: Citizens’ trust in government positively influences their attitudes
toward the new ends (Open Government) and means (Government 2.0) of
e-government.
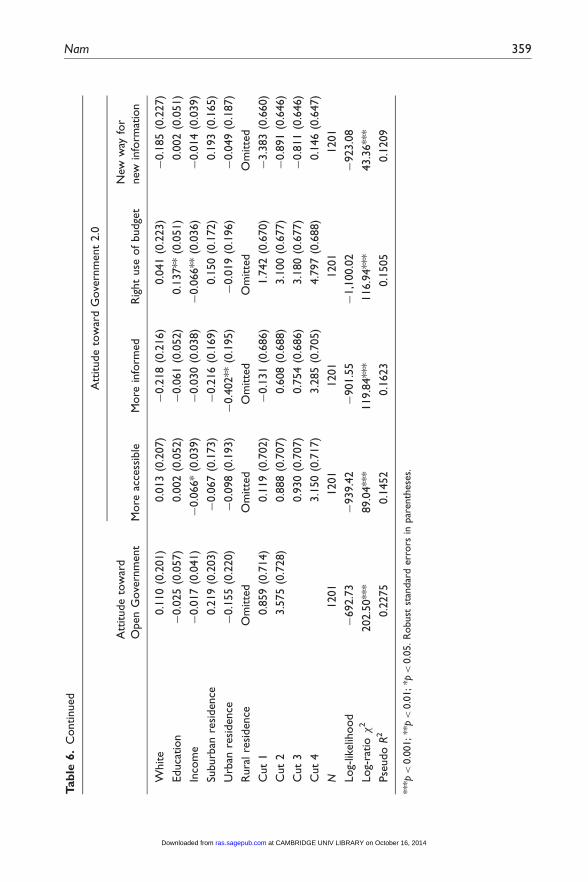
The level of citizens’ general trust in government positively affects their attitudetoward Open Government. Those with a high level of general trust in governmentmaintain trust in government, despite changes in public policies and environments(Putnam, 2000). Such people are likely to have a positive attitude toward OpenGovernment and Government 2.0.
The effect of citizens’ trust in government is overall supportive of OpenGovernment and the generic benefits delivered by the technological means ofe-government. Trust in government increases citizens’ perception of the efficacyof Government 2.0 for providing accessibility and making them more informed.Citizens’ perceptions of Government 2.0 do not significantly support governmentalspending on e-government transformation into 2.0 platforms.
Hypothesis 4: Citizens’ frequent use of the Internet positively influences their attitudes
toward new ends (Open Government) and means (Government 2.0) of e-government.
Frequency of Internet use and access to high-speed Internet do not significantlyinfluence citizens’ attitudes toward Open Government and Government 2.0. Asshown in Table 2, the frequency of use of Government 2.0 tools is very low. Mostrespondents have never taken advantage of the new tools for Open Government. Inthis sense, Government 2.0 may seem to be stuck in its rhetoric stage, as researchers(Moon, 2002; West, 2004) have stated that there is a gap between a targetede-government stage (vision) and the actual stage of e-government maturity (reality).Despite a growing number of frequent Internet users and broadband users, theexpansion of government technology use does not make a positive change in citizens’attitudes toward Government 2.0.
Technology use does not affect attitudes regarding Open Government. Almosthalf (46%) of respondents said their feelings were ‘about the same’ concerninggovernmental openness between the Obama Administration and its predecessor.Government use of ICTs for openness is not yet appealing enough to citizens tosignificantly affect their attitudes toward government. The government goal forcitizens’ enthusiasm, or at least a positive attitude toward Open Governmentand Government 2.0, has not materialized in spite of the increase in physicalaccess to the Internet and frequency of Web use.
In addition, another account convincingly makes sense. Citizens may recognizeboth Open Government and Government 2.0 as distinct from the conventionalservices of e-government. Those who frequently use the Internet are more likelyto be satisfied with e-government (Welch et al., 2005). However, Internet use does
Nam 361
at CAMBRIDGE UNIV LIBRARY on October 16, 2014ras.sagepub.comDownloaded from
not contribute to citizens’ positive attitudes toward the new version of e-govern-ment since only certain select segments of the total population (not inclusive of amajority of Internet users and general e-government users) use Government 2.0and appreciate the performance of Open Government. Therefore, further extensionof e-government faces the challenge of a participation or usage divide with regardto adopting the new mode of e-government.
Meanwhile, socio-demographic controls not hypothesized do not significantlyaffect attitudes toward the new ends and means of e-government. This result isdistinct from empirical findings (the heavy leverage of socio-demographic condi-tions on e-government use) by many empirical studies on e-government use(Akman et al., 2005; Becker et al., 2008; Belanger and Carter, 2006a, 2006b;Goldfinch et al., 2009; Mossberger et al., 2003, 2008; Niehaves and Becker, 2008;Reddick, 2004a; Sipior and Ward, 2005; Tolbert and Mossberger, 2003).Interestingly, average attitudes toward Open Government differ betweenRepublicans and Democrats. The Open Government Initiative of the ObamaAdministration retains strong support from individuals who identify as Democrats.
Further discussion
This section presents implications for government practitioners and researchers.The statistical analysis gives hope while presenting a challenge to extending OpenGovernment beyond existing e-government. Along with testing hypothetical causaleffects, the analysis also highlighted likely advocates of Open Government andGovernment 2.0. Identifying the relationship between attitudes and those factorsbelieved to affect attitudes is not a simple task. While certain users of conventionale-government services perceive potential benefits of e-government and would trans-late their positive attitude toward e-government directly to support of OpenGovernment and Government 2.0, others, who neither use e-government servicesnor value e-government use, do not have much interest in the new options ofe-government. Practitioners and academics of e-government need to be aware ofthe overarching findings, and their implications, presented in the analysis section.
Key findings
To summarize the key findings, this study offers the following propositions.
Proposition 1: Citizens’ perceived values affect their attitudes toward the new modes
of e-government.
Citizens’ perception of potential value has a greater influence on attitudestoward the new direction of e-government than actual experience. Those whohave already experienced Government 2.0 generally have a positive attitudetoward it. However, only a marginal and insignificant percentage of existingusers of e-government show a favorable attitude toward Open Government and
362 International Review of Administrative Sciences 78(2)
at CAMBRIDGE UNIV LIBRARY on October 16, 2014ras.sagepub.comDownloaded from
Government 2.0. Instead, those who value the potential benefits of transactionsthrough e-government are supportive of Open Government and Government 2.0.A distinction exists between those who use transactional services and those whoperceive potential value from such services.
Proposition 2: Citizens’ general trust in government is crucial for their attitudes
toward the new modes of e-government.
Trust in standard government (as opposed to e-government) heavily influencescitizens’ attitudes toward e-government. If governmental efforts to change citizens’attitudes hinge only on technological innovation, government would overlook themore fundamental factor that affects attitudes toward government – namely, citi-zens’ trust in government itself. While both Open Government and Government2.0 are new to most individuals, e-government can also be a still unfamiliar channelto some people when it comes to trusting or distrusting their government. It is rarethat the adoption of new technologies in government will exert a radical impact onthe level of trust in government. To those who have little trust in government, thenew ends and means of e-government may seem illusive.
Proposition 3: Frequency of citizens’ Internet use does not contribute to the variation
in their attitudes toward the new modes of e-government.
Overall, Web use and e-government use do not significantly influence citizens’attitudes toward the new mode of e-government. The gap in frequency of technol-ogy use and broadband adoption, the so-called ‘usage divide’ or ‘access divide’, haslittle impact on citizens’ attitudes toward Open Government and Government 2.0.The minor impact of technological factors on citizens’ attitudes cannot translateinto a positive interpretation, because there might be another divide – i.e. theattitudinal divide for (e-)government. Perceived value and trust exercise a strongerleverage on attitudinal differences over technology adoption and use.
Recommendations for policy
The main findings above suggest policy implications for e-government practi-tioners. First, key factors (trust and perceived value) influencing citizens’ attitudestoward e-government should be considered in a long-term strategy. For that, gov-ernments need to educate citizens (especially the service-needy and the technology-illiterate) about the value of e-government and thereby make them aware of theusefulness of e-government (Jaeger and Thompson, 2003). Trust-building requiresa long-term investment by government because trust is established through long-term relationships (van de Walle et al., 2008; Warkentin et al., 2002). The fact thatcitizens’ trust in government anchors their support for a new e-government initia-tive requires government to consider factors for inspiring general trust, as well as tokeep improving technological convenience through e-government.
Nam 363
at CAMBRIDGE UNIV LIBRARY on October 16, 2014ras.sagepub.comDownloaded from

Second, governments should keep a suite of conventional information and ser-vice channels open for those who are underserved by e-government, least likely tobe online, and thus highly likely to have negative attitudes concerning the goals andtools of e-government. Pushing more Government 2.0 tools might contribute tocitizens’ positive attitudes toward Open Government to some extent, but that doesnot create a rationale for closing the existing e-government services and offlineservices. The new modes of e-government would be meaningful as a functionalextension – not as a replacement – of the government that people already know andare familiar with.
Finally, the implications of this study are broadly applicable to different coun-tries, but with some limitations. Governments in many countries now increasinglypursue further openness by adopting Government 2.0, but the US case is uniquewhen compared to other countries because Open Government is now being drivenby the federal government’s priorities and policies and the use of Web 2.0 in gov-ernment is at an unprecedented level. Some shifts toward Open Government mayappear in many other countries, but to varying degrees from country to countrywith different institutional contexts. E-government practitioners around the globeshould note the ripple effect of national policies, through which various normativedirections for positive public values (for example, openness and transparency) haveprevailed with the impact of policy transfer and policy learning across countriesand regions (Bennett, 1991a, 1991b, 1997; Wolman, 1992).
Future research directions
There needs to be further empirical research on citizens’ attitudes to establish amore comprehensive, albeit parsimonious, model capturing the relationshipsamong key factors. To that end, future studies are expected to develop this researchin three directions. First, the model in this study can be elaborated in a morecomplicated manner by using different data, measures, and methods. This studydoes not consider all possible interrelationships and complex causalities amongfactors. Methodological rigorousness can be improved by testing the same hypoth-eses with a path model or a structural equation model. Second, the relationshipsidentified in this study might be more complicated than what the study suggested. Ifattitude, trust, perception and usage are interrelated, causalities could be endogen-ous at a high level of complexity. Future research can address that issue. Third,developing measures will clarify the relationships among variables. Future researchcan analyze a dataset that includes a set of various theoretical measures such aspsychological and behavioral factors derived from a wide array of research one-government use and attitudes toward government.
Conclusion
Open Government as a new end of government in the Obama Administration is apositive objective for both government and society as a new norm for public values
364 International Review of Administrative Sciences 78(2)
at CAMBRIDGE UNIV LIBRARY on October 16, 2014ras.sagepub.comDownloaded from
such as accessibility, transparency, and citizen engagement. Government prioritiesrequire considerable popular support from the generic public because citizens are notmerely customers and users of governmental services; they are also the financial supportfor government operations through taxes (taxpayers), with the power to support or denythe current administration by voting (deciding whether the incumbent administrationwill continueworking for thenext term). In spite of the attractionof further developmentof Open Government via new technologies, and public acceptance of doing so, it doesnot appear that the US government is perceived and recognized with enthusiasm. Theintroduction of the new ends andmeans of e-government does not significantly contrib-ute to citizens’ supportive attitude towardgovernment.Rather than technological innov-ation, long-standing trust in government and the perceived value of e-governmentsubstantially form citizens’ attitudes toward the new mode of government. To reachthe larger populace of citizens and secure support from them, government needs toimplement strategies to ensure effectiveness of new technological tools and turn new e-government initiatives from hype and rhetoric into hope and actual achievement.
Acknowledgement
This article is an enhanced version of the paper presented at the E-Government Track of the
44th Hawaii International Conference on System Sciences (HICSS-44), Koloa, Hawaii, 4–7January 2011.
Notes
1. For an empirical analysis, e-government, despite a generic understanding and use of theterm, needs operational definition. Its concept broadly includes major internal (backoffice) aspects (i.e. intranet, database, and warehouse) and external (front office) aspects
(i.e. Web-based service delivery, transactional activities, and digital democracy for trans-parent accountability) (Layne and Lee, 2001; Moon, 2002). This study focuses on theexternal functional components of e-government in its practical operational definition.
2. Data and interview questions are sourced from http://www.PewInternet.org/Shared-Content/Data-Sets/2009/December-2009–Government-Online.aspx.
3. If the distances between any two adjacent categories of an ordinal dependent variable are notequal, ordinary least squares (OLS) estimation assuming exactly equal intervals between adja-
cent categories would lead to significantly distorted results and thus ordered logistic estimationis preferred over OLS estimation (Long, 1997). Since the result of the Wald test (investigatingwhether the distances are equal) proposed by Brant (1990) confirms significantly unequal
distances in all ordinal outcome variables, this study relies on ordered logistic estimation.4. Cronbach’s alpha (�) is a statistic for the internal consistency estimate of reliability
among multiple question items (Cronbach, 1951). Its possible fraction value ranges
between 0 (not reliable) and 1 (highly reliable). In social sciences, a rule of thumb usuallyapplies 0.7 as a criterion for cutoff.
References
Akman _I, Yazici A, Mishra A and Arifoglu A (2005) E-government: A global view and an
empirical evaluation of some attributes of citizens. Government Information Quarterly22(2): 239–257.
Nam 365
at CAMBRIDGE UNIV LIBRARY on October 16, 2014ras.sagepub.comDownloaded from
Anttiroiko A (2010) Innovation in democratic e-governance: Benefitting from Web 2.0applications in the public sector. In: Reddick CG (ed.) Citizens and E-government:Evaluating Policy and Management. Hershey, PA: IGI Publishing, 110–130.
Becker J, Niehaves B, Bergener P and Rackers M (2008) Digital divide in eGovernment: TheeInclusion gap model. In: Wimmer MA, Scholl HJ and Ferro E (eds) ElectronicGovernment: Proceedings of the 7th International Conference, EGOV 2008. Berlin/
Heidelberg, Germany: Springer, 231–242.Belanger F and Carter L (2006a) The effects of the digital divide on e-government: An
empirical evaluation. Paper presented at the 39th Hawaii International Conference on
System Sciences (HICSS-39), Kauai, Hawaii, 4–7 January.Belanger F and Carter L (2006b) The impact of the digital divide on e-government use.
Communications of the ACM 52(4): 132–135.Bennett CJ (1991a) How states utilize foreign evidence. Journal of Public Policy 11(1): 31–54.
Bennett CJ (1991b) Review article: What is policy convergence and what causes it? BritishJournal of Political Science 21(2): 215–233.
Bennett CJ (1997) Understanding ripple effects: The cross-national adoption of policy
instruments. Governance 10(3): 213–233.Bertot JC, Jaeger PT, Shuler JA, Simmons SN and Grimes JM (2009) Reconciling govern-
ment documents and e-government: Government information in policy, librarianship,
and education. Government Information Quarterly 26(3): 433–436.Bertot JC, Jaeger PT and Grimes JM (2010) Using ICTs to create a culture of transparency:
E-government and social media as openness and anti-corruption tools for societies.Government Information Quarterly 27(3): 264–271.
Birkinshaw P (1997) Freedom of information. Parliamentary Affairs 50(1): 164–181.Brant R (1990) Assessing proportionality in the proportional odds model for ordinal logistic
regression. Biometrics 46(4): 1171–1178.
Carter L and Belanger F (2005) The influence of perceived characteristics of innovating one-government adoption. Electronic Journal of e-Government 2(1): 11–20.
Cho H and Hwang S (2010) Government 2.0 in Korea: Focusing on e-participation services.
In: Reddick CG (ed.) Politics, Democracy and E-government: Participation and ServiceDelivery. Hershey, PA: IGI Publishing, 94–114.
Cronbach LJ (1951) Coefficient alpha and the internal structure of tests. Psychometrika 16:
297–334.Dawes SS (2008) The evolution and continuing challenges of e-governance. Public
Administration Review 68(Supplement 1): S86–S102.Dawes SS (2009) Governance in the digital age: A research and action framework for an
uncertain future. Government Information Quarterly 26(2): 257–264.Dawes SS (2010) Stewardship and usefulness: Policy principles for information-based trans-
parency. Government Information Quarterly 27(4): 377–383.
Dawes SS and Helbig N (2010) Information strategies for open government: Challenges andprospects for deriving public value from government transparency. Presented at the 9thInternational Federation for Information Processing (IFIP) WG 8.5 International
Conference (EGOV 2010), Lausanne, Switzerland, 29 August–2 September.DiMaio A (2009) Government 2.0: A Gartner definition. Available at: http://blogs.gartner.
com/andrea_dimaio/2009/11/13/government-2-0-a-gartner-definition/.Eggers WD (2005) Government 2.0: Using Technology to Improve Education, Cut Red Tape,
Reduce Gridlock, and Enhance Democracy. Lanham, MA: Rowman & Littlefield.
366 International Review of Administrative Sciences 78(2)
at CAMBRIDGE UNIV LIBRARY on October 16, 2014ras.sagepub.comDownloaded from
Ferro E and Molinari F (2009) Framing Web 2.0 in the process of public sector innovation:Going down the participation ladder. European Journal of ePractice 9(1): 20–34.
Goldfinch S (2007) Pessimism, computer failure, and information systems development in
the public sector. Public Administration Review 67(5): 917–929.Goldfinch S, Gauld R and Herbison P (2009) The participation divide? Political participa-
tion, trust in government, and e-government in Australia and New Zealand. Australian
Journal of Public Administration 68(3): 333–350.Golembiewski RT and Gabris G (1995) Tomorrow’s city management: Guides for avoiding
success-becoming-failure. Public Administration Review 55(3): 240–246.
Holzer M and Halachmi A (1996) Measurement as a means of accountability. InternationalJournal of Public Administration 19(11/12): 1921–1944.
Jaeger PT and Thompson KM (2003) E-government around the world: Lessons, challenges,and future directions. Government Information Quarterly 20(4): 389–394.
Kolsaker A and Lee-Kelley L (2008) Citizens’ attitudes towards e-government and e-govern-ance: A UK study. International Journal of Public Sector Management 21(7): 723–738.
Lathrop D and Ruma L (eds) (2010) Open Government: Collaboration, Transparency, and
Participation in Practice. Sebastopol, CA: O’Reilly Media.Layne K and Lee J (2001) Developing fully functional e-government: A four stage model.
Government Information Quarterly 18(2): 12–36.
Long JS (1997) Regression Models for Categorical and Limited Dependent Variables.Thousands Oaks, CA: Sage Publications.
McDermott P (2010) Building open government. Government Information Quarterly 27(4):401–413.
Millard J (2009) Government 1.5: Is the bottle half full or half empty? European Journal ofePractice 9(1): 35–50.
Mintz D (2008) Government 2.0: Fact or fiction? Public Manager 36(4): 21–24.
Moon MJ (2002) The evolution of e-government among municipalities: Rhetoric or reality?Public Administration Review 62(4): 424–433.
Mossberger K, Tolbert CJ and McNeal RS (2008) Digital Citizenship: The Internet, Society,
and Participation. Cambridge, MA: MIT Press.Mossberger K, Tolbert CJ and Stansbury M (2003) Virtual Inequality: Beyond the Digital
Divide. Washington, DC: Georgetown University Press.
Nam T (2012) Suggesting frameworks of citizen-sourcing via Government 2.0. GovernmentInformation Quarterly 29(1): 12–20.
Niehaves B and Becker J (2008) The age-divide in e-government: Data, interpretations,theory fragments. Paper presented at the 8th IFIP Conference on e-Business,
e-Services, and e-Society (I3E 2008), Tokyo, Japan, 24–26 September.Nye JS, Zelikow PD and King DC (eds) (1997) Why People Don’t Trust Government.
Cambridge, MA: Harvard University Press.
Osimo D (2009) Editorial: Government 2.0 – hype, hope, or reality? European Journal ofePractice 9(1): 2–4.
Parks W (1957) The open government principle: Applying the right to know under the
constitution. George Washington Law Review 26(1): 1–22.Parycek P and Sachs M (2009) Open government: Information flow in Web 2.0. European
Journal of ePractice 9(1): 59–70.Peters BG (2009) American Public Policy: Promise and Performance, 8th edn. Washington,
DC: CQ Press.
Nam 367
at CAMBRIDGE UNIV LIBRARY on October 16, 2014ras.sagepub.comDownloaded from
Putnam RD (2000) Bowling Alone: The Collapse and Revival of American Community. NewYork: Touchstone.
Reddick CG (2004a) Citizen interaction with e-government: From the streets to servers?
Government Information Quarterly 22(1): 38–57.Reddick CG (2004b) A two-stage model of e-government growth: Theories and empirical
evidence for US cities. Government Information Quarterly 21(1): 51–64.
Rose-Ackerman S (2008) Corruption and government. International Peacekeeping 15(3):328–343.
Sipior JC and Ward BT (2005) Bridging the digital divide for e-government inclusion:
A United States case study. Electronic Journal of e-Government 3(3): 137–146.Sweeney ADP (2007) Electronic government-citizen relationships: Exploring citizen perspec-
tives. Journal of Information Technology & Politics 4(2): 101–116.Tapscott D, Williams AD and Herman D (2008) Government 2.0: Transforming
Government and Governance for the Twenty-first Century. Available at: http://www.newparadigm.com/media/gov_transforminggovernment.pdf.
Tolbert CJ and Mossberger K (2003) The effects of e-government on trust and confidence in
government. Paper presented at the Annual National Conference on Digital GovernmentResearch (dg.o 2003), Boston, 18–21 May.
Van deWalle S, van Roosbroek S and Bouckaert G (2008) Trust in the public sector: Is there any
evidence for a long-term decline? International Review of Administrative Sciences 74(1): 47–64.Wangpipatwong S, Chutimaskul W and Papasratorn B (2008) Understanding citizens’ con-
tinuance intention to use e-government website: A composite view of technology accept-ance model and computer self-efficacy. Electronic Journal of e-Government 6(1): 55–64.
Warkentin M, Gefen D, Pavlou PA and Rose GM (2002) Encouraging citizen adoption ofe-government by building trust. Electronic Markets 12(3): 157–162.
Welch EW, Hinnant CC and Moon MJ (2005) Linking citizen satisfaction with
e-government and trust in government. Journal of Public Administration Research andTheory 15(3): 371–391.
West DM (2004) E-government and the transformation of service delivery and citizen atti-
tudes. Public Administration Review 64(1): 15–27.Wolman H (1992) Understanding cross national policy transfers: The case of Britain and the
US. Governance 5(1): 27–45.
Yong JS and Koon L (2005) E-government: Enabling public sector reform. In: Yong JS (ed.)E-government in Asia: Enabling Public Service Innovation in the 21st Century. Singapore:Times Media, 3–21.
Zukin C, Keeter S, Andolina M, Jenkins K and Delli Carpini MX (2006) A New
Engagement? Political Participation, Civic Life, and the Changing American Citizen.New York: Oxford University Press.
Taewoo Nam, is a Ph.D. candidate in Public Administration at the RockefellerCollege of Public Affairs and Policy, University at Albany, State University ofNew York. He is working for the Center for Technology in Government. Hisresearch interests include inter-governmental collaboration, local government man-agement, network governance, citizen participation, and digital government. He isthe author or co-author of articles in Government Information Quarterly,Information Polity, Journal of Information Technology and Politics, and SocialScience and Computer Review.
368 International Review of Administrative Sciences 78(2)
at CAMBRIDGE UNIV LIBRARY on October 16, 2014ras.sagepub.comDownloaded from