Embed Size (px)
Citation preview
2015annual report
CITY OF EDMONTON, ALBERTA, CANADA FOR THE YEAR ENDED DECEMBER 31, 2015
contents
introductory information 4
Our Organization 4
Message from City Council 6
Message from City Manager 8
Legislative and Administrative Organizational Chart 9
Political and Administrative Structure 10
Edmonton... Strong. Stable. Supportive. 12
Our Edmonton… Open Arms. Open Hearts 14
Edmonton’s Accomplishments in 2015 16
Economic Performance 20
financial information 22
Financial Statement Discussion and Analysis 24
Consolidated Financial Statements 52
Management’s Responsibility for Financial Reporting 54
Independent Auditors’ Report 55
Consolidated Statement of Financial Position 56
Consolidated Statement of Operations and Accumulated Surplus 57
Consolidated Statement of Change in Net Financial Assets 58
Consolidated Statement of Cash Flows 59
Consolidated Schedule of Tangible Capital Assets 60
Consolidated Schedule of Segment Disclosures 61
Notes to Consolidated Financial Statements 63
statistical review 90
General Municipal Data 92
Assessment and Tax Levy 93
Investment Funds 94
Long-term Debt 95
Consolidated Expenses 96
Consolidated Revenue and Capital Financing 97
Financial Position, Annual Surplus and Reserves 98
related boards and authorities 99
table of contents
PG 2 2015 ANNUAL REPORT CITY OF EDMONTON INTRODUCTION

CITY OF EDMONTON, ALBERTA, CANADA FOR THE YEAR ENDED DECEMBER 31, 2015
PRODUCED BY THE CITY OF EDMONTON, FINANCIAL SERVICES AND UTILITIES, WITH SUPPORT FROM CORPORATE COMMUNICATIONS, CIVIC DEPARTMENTS, OFFICES AND AGENCIES.
2015annual report
INTRODUCTION 2015 ANNUAL REPORT CITY OF EDMONTON PG 3
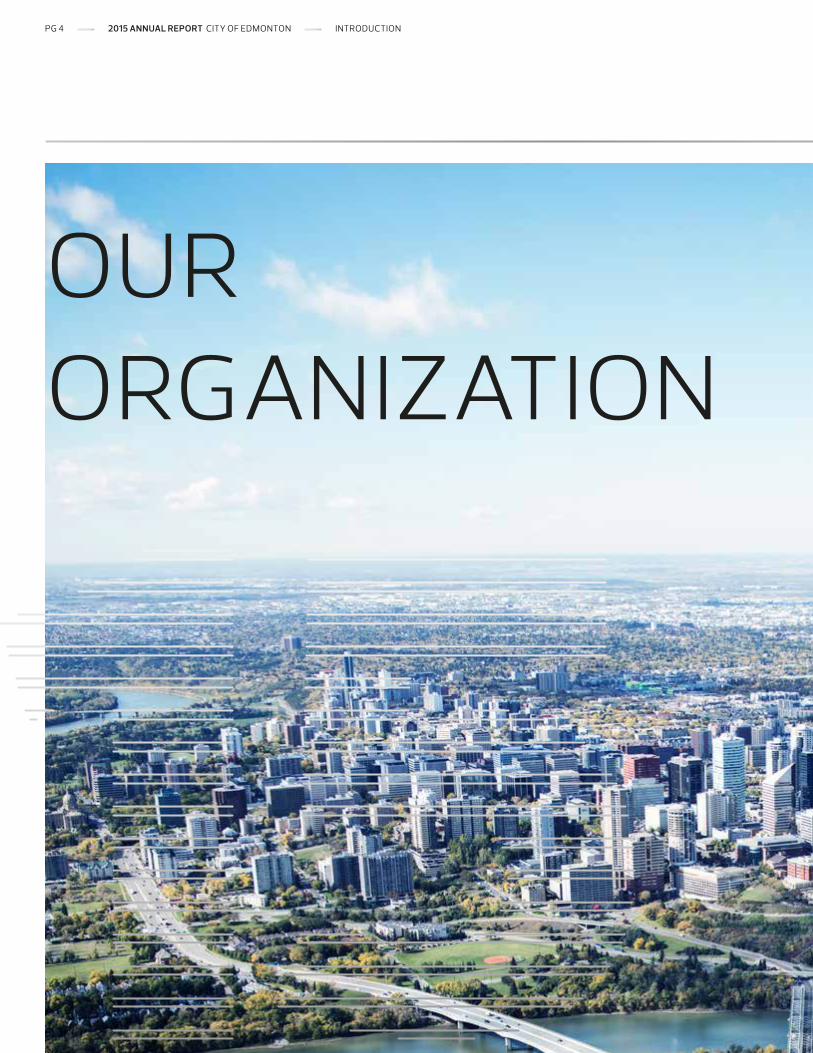
our organization
PG 4 2015 ANNUAL REPORT CITY OF EDMONTON INTRODUCTION
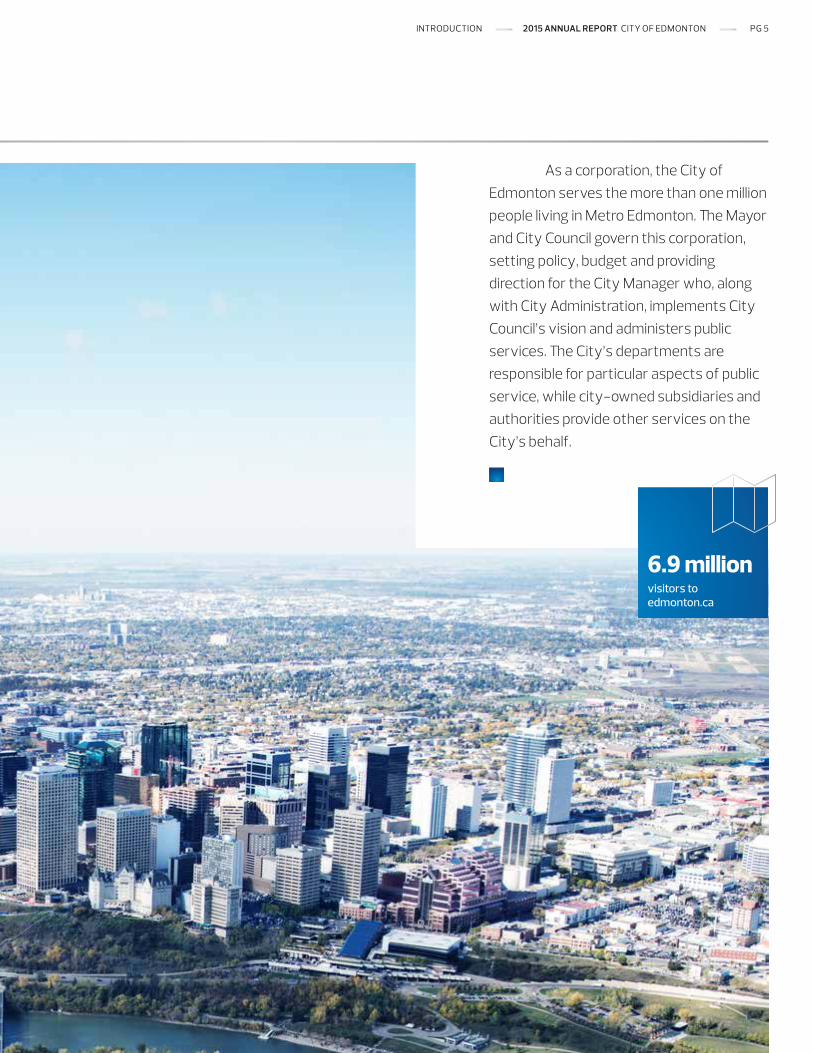
6.9 millionvisitors to edmonton.ca
As a corporation, the City of Edmonton serves the more than one million people living in Metro Edmonton. The Mayor and City Council govern this corporation, setting policy, budget and providing direction for the City Manager who, along with City Administration, implements City Council’s vision and administers public services. The City’s departments are responsible for particular aspects of public service, while city-owned subsidiaries and authorities provide other services on the City’s behalf.
INTRODUCTION 2015 ANNUAL REPORT CITY OF EDMONTON PG 5
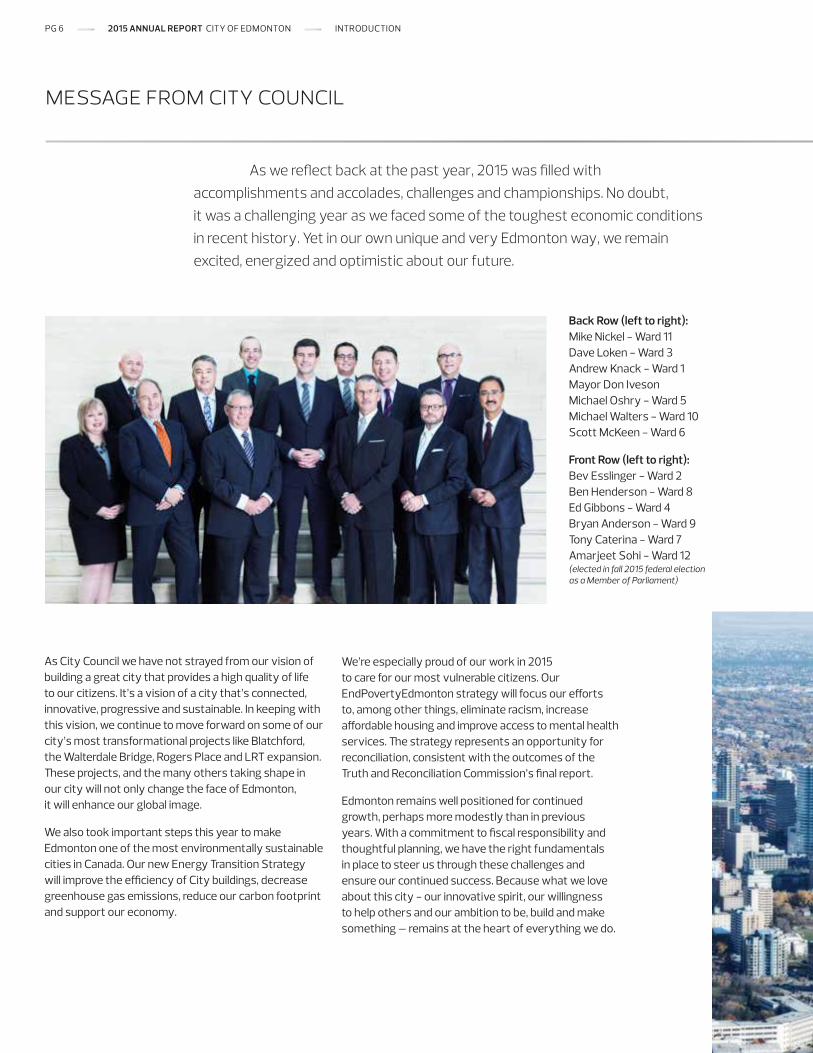
Back Row (left to right): Mike Nickel - Ward 11 Dave Loken - Ward 3 Andrew Knack - Ward 1 Mayor Don Iveson Michael Oshry - Ward 5 Michael Walters - Ward 10 Scott McKeen - Ward 6
Front Row (left to right): Bev Esslinger - Ward 2 Ben Henderson - Ward 8 Ed Gibbons - Ward 4 Bryan Anderson - Ward 9 Tony Caterina - Ward 7 Amarjeet Sohi - Ward 12 (elected in fall 2015 federal election as a Member of Parliament)
As City Council we have not strayed from our vision of building a great city that provides a high quality of life to our citizens. It’s a vision of a city that’s connected, innovative, progressive and sustainable. In keeping with this vision, we continue to move forward on some of our city’s most transformational projects like Blatchford, the Walterdale Bridge, Rogers Place and LRT expansion. These projects, and the many others taking shape in our city will not only change the face of Edmonton, it will enhance our global image.
We also took important steps this year to make Edmonton one of the most environmentally sustainable cities in Canada. Our new Energy Transition Strategy will improve the efficiency of City buildings, decrease greenhouse gas emissions, reduce our carbon footprint and support our economy.
We’re especially proud of our work in 2015 to care for our most vulnerable citizens. Our EndPovertyEdmonton strategy will focus our efforts to, among other things, eliminate racism, increase affordable housing and improve access to mental health services. The strategy represents an opportunity for reconciliation, consistent with the outcomes of the Truth and Reconciliation Commission’s final report.
Edmonton remains well positioned for continued growth, perhaps more modestly than in previous years. With a commitment to fiscal responsibility and thoughtful planning, we have the right fundamentals in place to steer us through these challenges and ensure our continued success. Because what we love about this city - our innovative spirit, our willingness to help others and our ambition to be, build and make something – remains at the heart of everything we do.
message from city council
As we reflect back at the past year, 2015 was filled with accomplishments and accolades, challenges and championships. No doubt, it was a challenging year as we faced some of the toughest economic conditions in recent history. Yet in our own unique and very Edmonton way, we remain excited, energized and optimistic about our future.
PG 6 2015 ANNUAL REPORT CITY OF EDMONTON INTRODUCTION
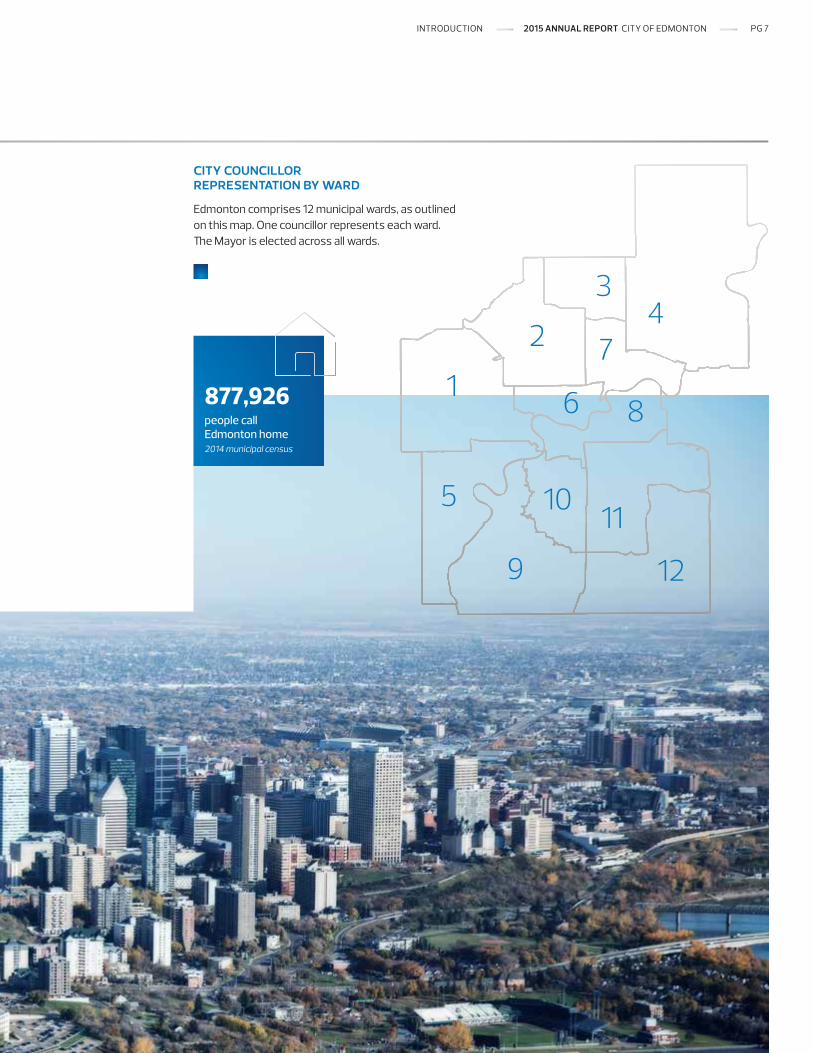
city councillor representation by ward
Edmonton comprises 12 municipal wards, as outlined on this map. One councillor represents each ward. The Mayor is elected across all wards.
12
1110
9
5
6 8
72
34
1877,926people call Edmonton home 2014 municipal census
INTRODUCTION 2015 ANNUAL REPORT CITY OF EDMONTON PG 7

message from city manager
Municipal management is about continual evolution; it is about adapting to changes in our environment and understanding our citizens’ priorities.
Our city fared much better than most parts of the province during the year in dealing with a challenging economy. We adapted our budget for 2016 to 2018 to control cost increases in certain areas, found reductions, and reallocated existing funds to civic services that residents told us are their top priorities.
For the past 20 years, in fact, we have regularly examined our budgets to look for efficiencies and potential revenue streams so that we could take care of emerging needs without adding to the tax levy. In 2016 we will continue to examine whether our resources are used in the best way possible in an intensive program and service review.
Our Administration will also continue our thoughtful, deliberate work to build a workplace culture that fosters collaboration and integration.
We are servant leaders. Our job is to use our skills and expertise to support Council in decision-making and communities in reaching their goals. Throughout the challenge and change of 2015, we have remained steadfast in our commitment to the citizens of Edmonton and to delivering on City Council’s priorities.
Our work is about innovation, growth and building a great city. We are proud to serve the people of Edmonton.
Linda D.M. Cochrane City Manager
PG 8 2015 ANNUAL REPORT CITY OF EDMONTON INTRODUCTION
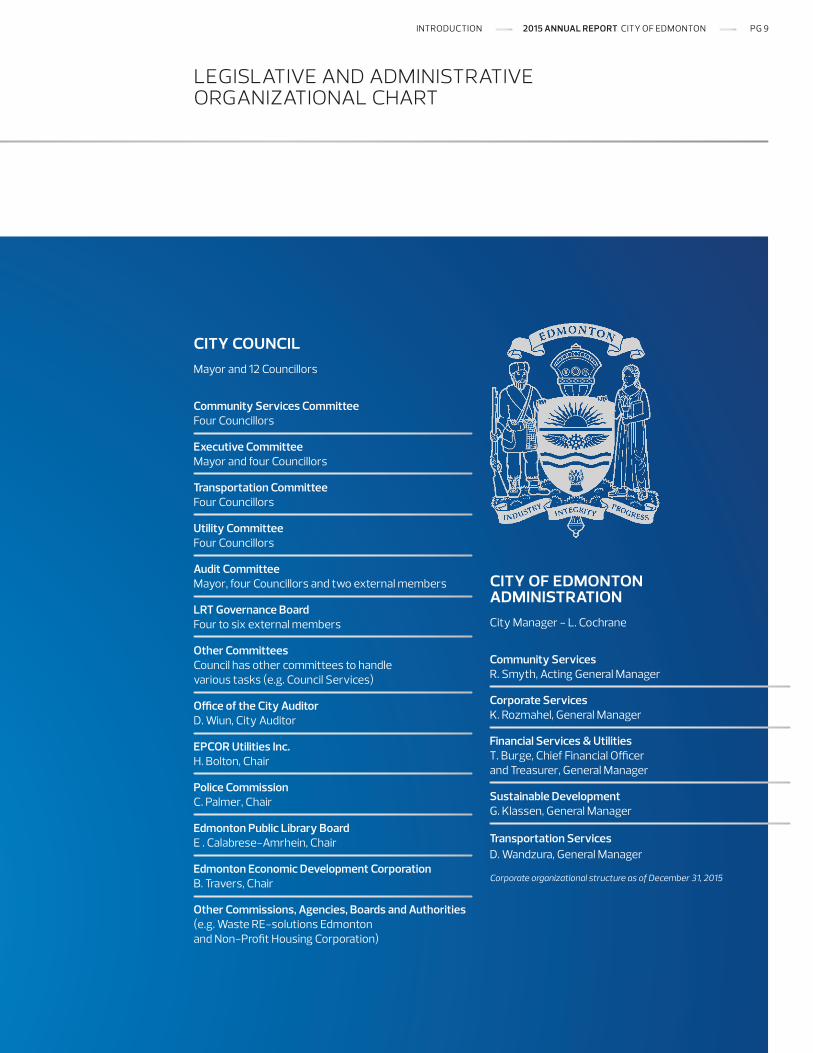
legislative and administrative organizational chart
city councilMayor and 12 Councillors
Community Services Committee Four Councillors
Executive Committee Mayor and four Councillors
Transportation Committee Four Councillors
Utility Committee Four Councillors
Audit Committee Mayor, four Councillors and two external members
LRT Governance Board Four to six external members
Other Committees Council has other committees to handle various tasks (e.g. Council Services)
Office of the City Auditor D. Wiun, City Auditor
EPCOR Utilities Inc. H. Bolton, Chair
Police Commission C. Palmer, Chair
Edmonton Public Library Board E . Calabrese-Amrhein, Chair
Edmonton Economic Development Corporation B. Travers, Chair
Other Commissions, Agencies, Boards and Authorities (e.g. Waste RE-solutions Edmonton and Non-Profit Housing Corporation)
city of edmonton administration City Manager - L. Cochrane
Community Services R. Smyth, Acting General Manager
Corporate Services K. Rozmahel, General Manager
Financial Services & Utilities T. Burge, Chief Financial Officer and Treasurer, General Manager
Sustainable Development G. Klassen, General Manager
Transportation Services D. Wandzura, General Manager
Corporate organizational structure as of December 31, 2015
INTRODUCTION 2015 ANNUAL REPORT CITY OF EDMONTON PG 9
political and administrative structure
city council
Edmonton’s City Council consists of 13 elected representatives including one mayor and 12 councillors. Councillors are elected by voters in the wards they represent and the mayor is elected by all Edmontonians who vote in the civic election. Council provides leadership and direction to the City Manager and City Administration.
Edmonton has 12 wards and each ward is represented by one councillor. The most recent municipal election took place October 21, 2013, with the next municipal election to be held on October 16, 2017. Based on an amendment of the Local Authorities Election Act in 2012, City Council elections are now held every four years. One vacancy on City Council occurred in 2015 when Ward 12 Councillor Amarjeet Sohi was elected in the fall 2015 federal election as a Member of Parliament. A by-election for a new councillor for Ward 12 was held and on February 26, 2016, Mohinder Banga was sworn in as the Ward 12 councillor.
City Council meets two or three times a month and has a number of standing committees that meet regularly, including the Community Services, Transportation, Utility, Executive and Audit committees. Meetings of City Council and committees are open to the public.
The Community Services and Transportation committees are directed by City Council and deal with matters specifically related to items that fall within their jurisdiction. The Executive Committee makes recommendations and advises Council on items that are more corporate and inter-governmental in nature. The Utility Committee reviews and recommends to City Council items related to policy and rate-setting for waste management, sanitary and storm water drainage utilities, as well as the water and wastewater in-city operations of EPCOR. The Audit Committee aids City Council in fulfilling its oversight responsibilities for financial reporting, audit and enterprise risk management.
Edmontonians are appointed to more than 25 agencies, boards, commissions and task forces. Whether advisory, decision-making, quasi-judicial or governing, all provide citizens with an opportunity to participate in the present and future direction setting of the city. An LRT Governance Board of between 4 and 6 members with expertise in finance, design, transportation planning or transportation/civil engineering provides oversight of the procurement, development, design and construction of the Valley Line LRT project.
office of the city auditor
Appointed by and accountable to City Council, the Office of the City Auditor provides internal audit services. In providing such services to the corporation, the Office of the City Auditor performs the key roles of guardian and agent of change by performing independent audits and studies of civic departments and programs.
city administration
City Administration operates under the leadership of the City Manager as Chief Administrative Officer. The City Manager ensures City Administration carries out Council’s direction and administers public services. Simon Farbrother was City Manager from January 2010 to September 2015. Linda Cochrane was Acting City Manager at the end of the year and on March 16, 2016 was appointed by City Council as the permanent City Manager.
Through to the end of 2015, City Administration was organized into five departments along with the Office of the City Manager:
Community Services
Corporate Services
Financial Services and Utilities
Sustainable Development
Transportation Services
A corporate-wide restructuring occurred early in 2016. The new organizational structure is intended to bring together similar corporate functions for better integration.
Each department is responsible for particular aspects of public service, ensuring that citizens have access to the essential services needed in a livable city. In addition to the departments, there are City-owned subsidiaries and authorities that provide services to the City and to the public on the City’s behalf.
PG 10 2015 ANNUAL REPORT CITY OF EDMONTON INTRODUCTION
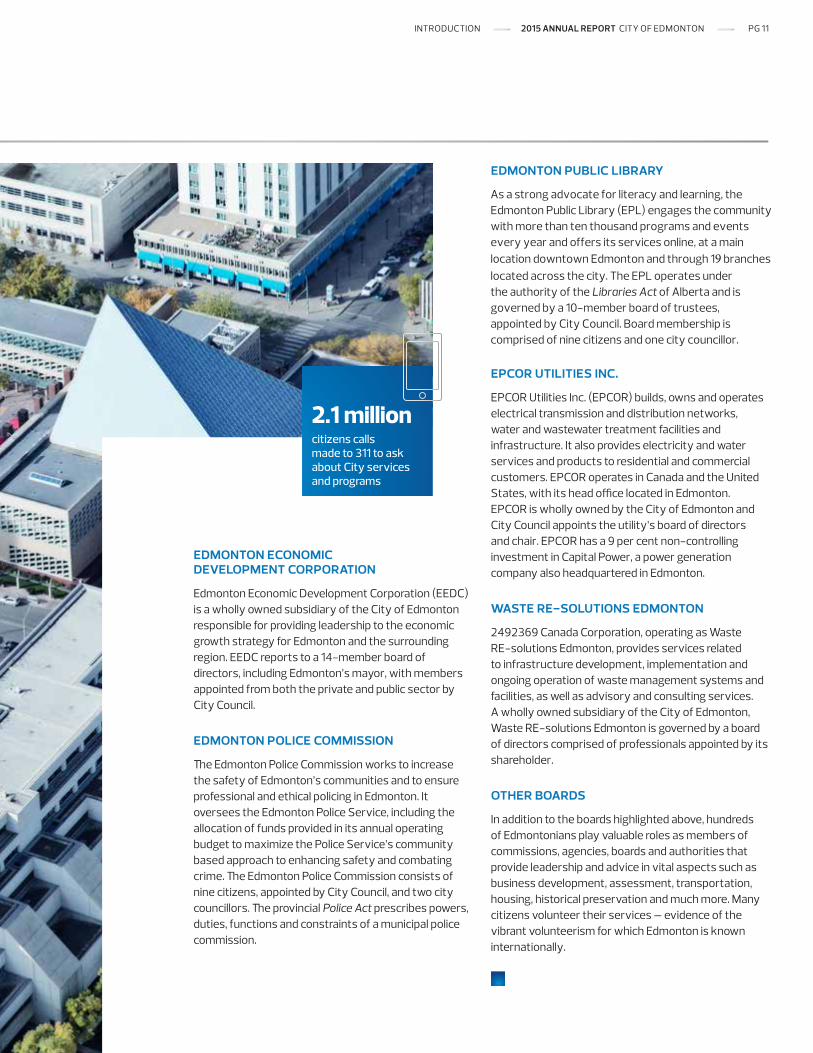
2.1 millioncitizens calls made to 311 to ask about City services and programs
edmonton economic development corporation
Edmonton Economic Development Corporation (EEDC) is a wholly owned subsidiary of the City of Edmonton responsible for providing leadership to the economic growth strategy for Edmonton and the surrounding region. EEDC reports to a 14-member board of directors, including Edmonton’s mayor, with members appointed from both the private and public sector by City Council.
edmonton police commission
The Edmonton Police Commission works to increase the safety of Edmonton’s communities and to ensure professional and ethical policing in Edmonton. It oversees the Edmonton Police Service, including the allocation of funds provided in its annual operating budget to maximize the Police Service’s community based approach to enhancing safety and combating crime. The Edmonton Police Commission consists of nine citizens, appointed by City Council, and two city councillors. The provincial Police Act prescribes powers, duties, functions and constraints of a municipal police commission.
edmonton public library
As a strong advocate for literacy and learning, the Edmonton Public Library (EPL) engages the community with more than ten thousand programs and events every year and offers its services online, at a main location downtown Edmonton and through 19 branches located across the city. The EPL operates under the authority of the Libraries Act of Alberta and is governed by a 10-member board of trustees, appointed by City Council. Board membership is comprised of nine citizens and one city councillor.
epcor utilities inc.
EPCOR Utilities Inc. (EPCOR) builds, owns and operates electrical transmission and distribution networks, water and wastewater treatment facilities and infrastructure. It also provides electricity and water services and products to residential and commercial customers. EPCOR operates in Canada and the United States, with its head office located in Edmonton. EPCOR is wholly owned by the City of Edmonton and City Council appoints the utility’s board of directors and chair. EPCOR has a 9 per cent non-controlling investment in Capital Power, a power generation company also headquartered in Edmonton.
waste re-solutions edmonton
2492369 Canada Corporation, operating as Waste RE-solutions Edmonton, provides services related to infrastructure development, implementation and ongoing operation of waste management systems and facilities, as well as advisory and consulting services. A wholly owned subsidiary of the City of Edmonton, Waste RE-solutions Edmonton is governed by a board of directors comprised of professionals appointed by its shareholder.
other boards
In addition to the boards highlighted above, hundreds of Edmontonians play valuable roles as members of commissions, agencies, boards and authorities that provide leadership and advice in vital aspects such as business development, assessment, transportation, housing, historical preservation and much more. Many citizens volunteer their services – evidence of the vibrant volunteerism for which Edmonton is known internationally.
INTRODUCTION 2015 ANNUAL REPORT CITY OF EDMONTON PG 11

edmonton... strong. stable. supportive.
PG 12 2015 ANNUAL REPORT CITY OF EDMONTON INTRODUCTION

5.7 millionvisits to City of Edmonton recreation facilities
Edmonton’s inventive and resilient spirit was evident again in 2015.Unlike other places, Edmonton kept growing. New jobs, festivals and ventures emerged all over the city. We hosted several world-class sporting events and greeted thousands of new residents. Edmonton welcomed newcomers as eagerly as new ideas. We opened our city and our hearts to Syrian refugees. In 2015, we exhibited relentless courage, innovation and cooperation.
INTRODUCTION 2015 ANNUAL REPORT CITY OF EDMONTON PG 13

our edmonton... open arms. open hearts
Edmonton is an open city. Open-hearted. Open-minded. Open to new people, cultures and ideas. It’s part of what makes our city unique.
PG 14 2015 ANNUAL REPORT CITY OF EDMONTON INTRODUCTION
* based on 2014 municipal census ** 2015 estimate, City of Edmonton
750festivals and events supported by the City
In 2015, Edmonton proved its resilience by maintaining steady growth. Our city gained 28,000 new jobs in 2015, generating 20% of all new jobs in Canada. Thanks to our diversified economy, Edmonton’s unemployment rate sat below the national average. As one of Canada’s most entrepreneurial cities, Edmonton has produced several companies that have become household names.
In some cities, it takes years for newcomers to feel a sense of belonging. In Edmonton, we value new, diverse people who bring innovative ideas and new perspectives to the table. We recently welcomed Syrian refugees and helped families transition to a better, safer life in our city.
In 2015, Edmonton hosted major international sporting events such as FIFA Women’s World Cup, ITU World Triathlon and Red Bull Crashed Ice. Along with dozens of new and returning festivals, Edmonton’s world-class
events are gaining international attention. In fact, Around The Rings ranked Edmonton one of the world’s top 10 sports cities—the only North American city alongside cities like London and Beijing to top the list.
National Geographic named Edmonton one of the Best Summer Trips of 2015. And thanks to Edmonton’s new WinterCity Strategy, we may become one of the best winter trips too. Edmonton is embracing the colder months and heating up our longest season by making winters more wonderful. Strategies combining winter design, winter stories, winter economy and winter life will encourage Edmontonians to get outside and play.
Like many parts of the world, Edmonton experienced the realities of economic cycles that will continue to shift. Change is a universal certainty. What remains constant is our city’s steadfast commitment to citizens. Through courage, cooperation, inventiveness and openness, Edmonton will continue to thrive.
population
City: 877,926* Metro: 1, 278, 000**
land area**
City: 700 km2 Metro: 9, 532 km2
INTRODUCTION 2015 ANNUAL REPORT CITY OF EDMONTON PG 15
edmonton’s accomplishments in 2015
building an extraordinary city
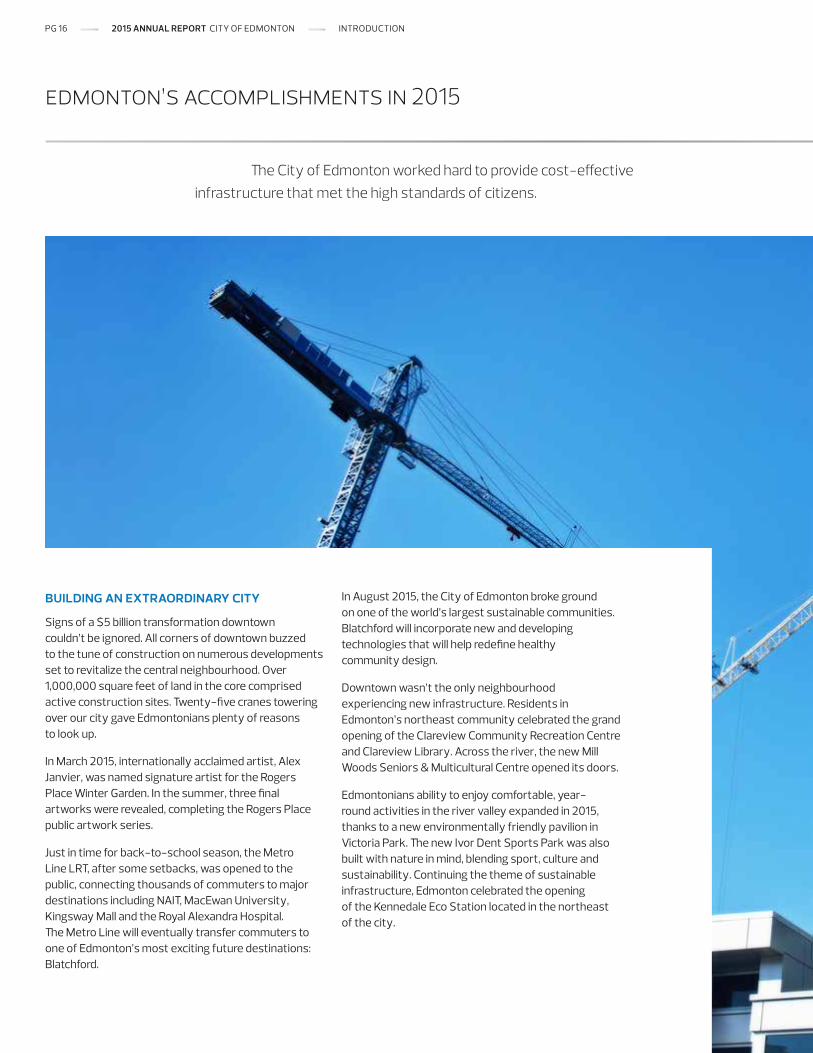
Signs of a $5 billion transformation downtown couldn’t be ignored. All corners of downtown buzzed to the tune of construction on numerous developments set to revitalize the central neighbourhood. Over 1,000,000 square feet of land in the core comprised active construction sites. Twenty-five cranes towering over our city gave Edmontonians plenty of reasons to look up.
In March 2015, internationally acclaimed artist, Alex Janvier, was named signature artist for the Rogers Place Winter Garden. In the summer, three final artworks were revealed, completing the Rogers Place public artwork series.
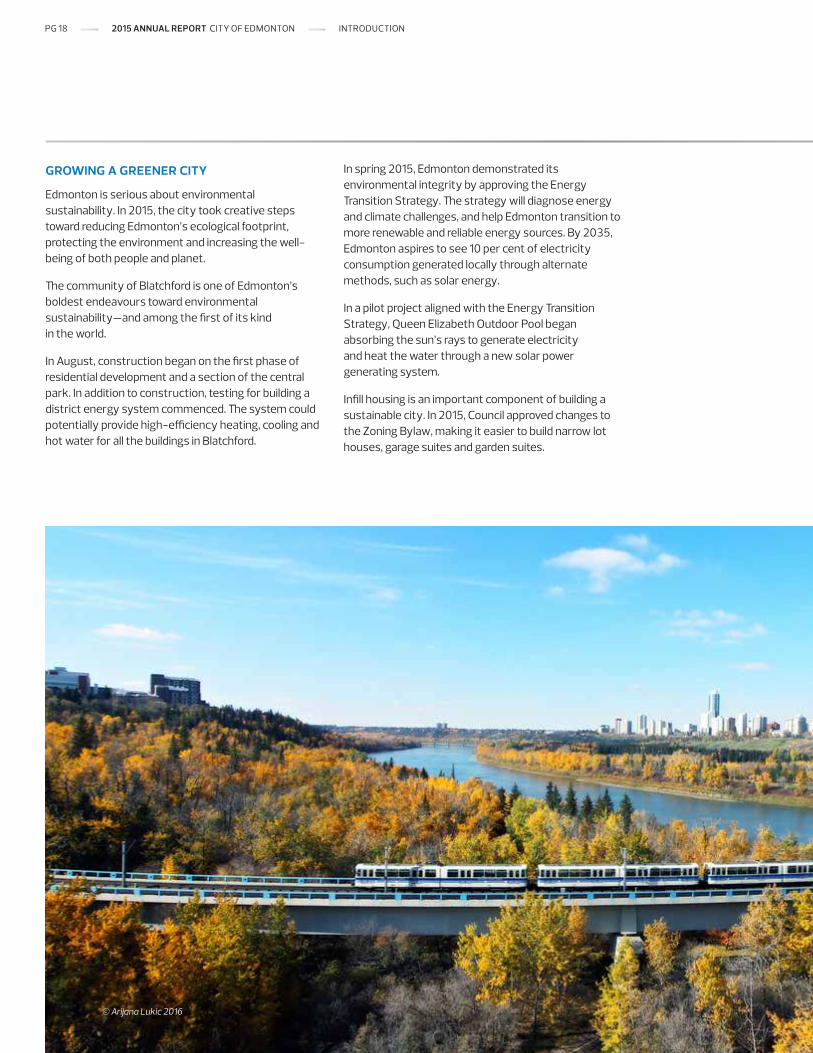
Just in time for back-to-school season, the Metro Line LRT, after some setbacks, was opened to the public, connecting thousands of commuters to major destinations including NAIT, MacEwan University, Kingsway Mall and the Royal Alexandra Hospital. The Metro Line will eventually transfer commuters to one of Edmonton’s most exciting future destinations: Blatchford.
In August 2015, the City of Edmonton broke ground on one of the world’s largest sustainable communities. Blatchford will incorporate new and developing technologies that will help redefine healthy community design.
Downtown wasn’t the only neighbourhood experiencing new infrastructure. Residents in Edmonton’s northeast community celebrated the grand opening of the Clareview Community Recreation Centre and Clareview Library. Across the river, the new Mill Woods Seniors & Multicultural Centre opened its doors.
Edmontonians ability to enjoy comfortable, year-round activities in the river valley expanded in 2015, thanks to a new environmentally friendly pavilion in Victoria Park. The new Ivor Dent Sports Park was also built with nature in mind, blending sport, culture and sustainability. Continuing the theme of sustainable infrastructure, Edmonton celebrated the opening of the Kennedale Eco Station located in the northeast of the city.
The City of Edmonton worked hard to provide cost-effective infrastructure that met the high standards of citizens.
PG 16 2015 ANNUAL REPORT CITY OF EDMONTON INTRODUCTION

31,267applications for development, building and combination permits
energizing the metro economy
Innovation, resilience and a diversified economy helped Metro Edmonton grow in 2015. As the hub for employment, education, business, recreation and medical and social services, Edmonton took steps toward sustainable growth that will benefit everyone in the region.
In 2015, a group of nine Edmonton-area mayors formed an alliance to spearhead new ways of thinking, planning and acting as a metro region. These nine municipalities represent 95 per cent of the region’s population and 96 per cent of its assessment base. The initiative works to improve competitiveness and our approach to planning, growing and promoting the Metro Edmonton region.
Edmonton’s population is expected to reach over 2.1 million by 2064—and the city needs room to grow. In 2015, Edmonton continued conversations with
regional neighbours about annexation, and how to maintain balanced, sustainable growth. Annexation is a vital step forward in boosting the economy and preserving regional vibrancy. Extending boundaries will help to manage future growth and extend infrastructure in a cost-efficient way.
In December, a new highway interchange opened on Queen Elizabeth II Highway and 41 Avenue which helped strengthen what is being called Canada’s Asia-Pacific Gateway. The $205 million project is funded through all three levels of government, including an operating contribution from the City of Edmonton. The interchange will improve connections between different modes of transportation, improve rail and road traffic flows, and facilitate economic development and international trade between Metro Edmonton and the Asia-Pacific countries.
INTRODUCTION 2015 ANNUAL REPORT CITY OF EDMONTON PG 17
growing a greener city
Edmonton is serious about environmental sustainability. In 2015, the city took creative steps toward reducing Edmonton’s ecological footprint, protecting the environment and increasing the well-being of both people and planet.
The community of Blatchford is one of Edmonton’s boldest endeavours toward environmental sustainability—and among the first of its kind in the world.
In August, construction began on the first phase of residential development and a section of the central park. In addition to construction, testing for building a district energy system commenced. The system could potentially provide high-efficiency heating, cooling and hot water for all the buildings in Blatchford.
In spring 2015, Edmonton demonstrated its environmental integrity by approving the Energy Transition Strategy. The strategy will diagnose energy and climate challenges, and help Edmonton transition to more renewable and reliable energy sources. By 2035, Edmonton aspires to see 10 per cent of electricity consumption generated locally through alternate methods, such as solar energy.
In a pilot project aligned with the Energy Transition Strategy, Queen Elizabeth Outdoor Pool began absorbing the sun’s rays to generate electricity and heat the water through a new solar power generating system.
Infill housing is an important component of building a sustainable city. In 2015, Council approved changes to the Zoning Bylaw, making it easier to build narrow lot houses, garage suites and garden suites.
© Arijana Lukic 2016
PG 18 2015 ANNUAL REPORT CITY OF EDMONTON INTRODUCTION
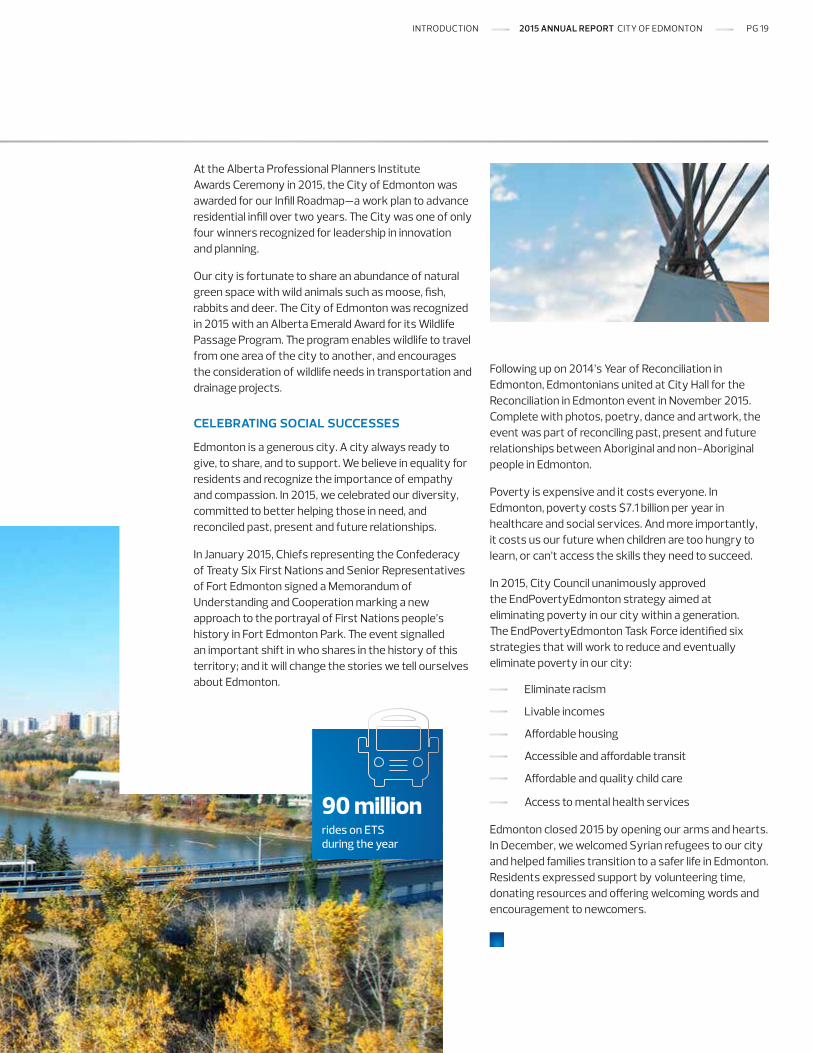
90 millionrides on ETS during the year
At the Alberta Professional Planners Institute Awards Ceremony in 2015, the City of Edmonton was awarded for our Infill Roadmap—a work plan to advance residential infill over two years. The City was one of only four winners recognized for leadership in innovation and planning.
Our city is fortunate to share an abundance of natural green space with wild animals such as moose, fish, rabbits and deer. The City of Edmonton was recognized in 2015 with an Alberta Emerald Award for its Wildlife Passage Program. The program enables wildlife to travel from one area of the city to another, and encourages the consideration of wildlife needs in transportation and drainage projects.
celebrating social successes
Edmonton is a generous city. A city always ready to give, to share, and to support. We believe in equality for residents and recognize the importance of empathy and compassion. In 2015, we celebrated our diversity, committed to better helping those in need, and reconciled past, present and future relationships.
In January 2015, Chiefs representing the Confederacy of Treaty Six First Nations and Senior Representatives of Fort Edmonton signed a Memorandum of Understanding and Cooperation marking a new approach to the portrayal of First Nations people’s history in Fort Edmonton Park. The event signalled an important shift in who shares in the history of this territory; and it will change the stories we tell ourselves about Edmonton.
Following up on 2014’s Year of Reconciliation in Edmonton, Edmontonians united at City Hall for the Reconciliation in Edmonton event in November 2015. Complete with photos, poetry, dance and artwork, the event was part of reconciling past, present and future relationships between Aboriginal and non-Aboriginal people in Edmonton.
Poverty is expensive and it costs everyone. In Edmonton, poverty costs $7.1 billion per year in healthcare and social services. And more importantly, it costs us our future when children are too hungry to learn, or can’t access the skills they need to succeed.
In 2015, City Council unanimously approved the EndPovertyEdmonton strategy aimed at eliminating poverty in our city within a generation. The EndPovertyEdmonton Task Force identified six strategies that will work to reduce and eventually eliminate poverty in our city:
Eliminate racism
Livable incomes
Affordable housing
Accessible and affordable transit
Affordable and quality child care
Access to mental health services
Edmonton closed 2015 by opening our arms and hearts. In December, we welcomed Syrian refugees to our city and helped families transition to a safer life in Edmonton. Residents expressed support by volunteering time, donating resources and offering welcoming words and encouragement to newcomers.
INTRODUCTION 2015 ANNUAL REPORT CITY OF EDMONTON PG 19
Labour Market Developments – 2015 Annual Change
5%6%
4%
2%3%
1%0%
Working Age Population
Employment
Source: Statistics Canada
Metro Edmonton Alberta Canada
% Change
Labour Force
1.051.95
2.33
1.23
2.46
5.30
0.79-0.05
3.73
economic performance
The City of Edmonton, along with the surrounding metropolitan area, was resilient over the course of 2015 amidst declining oil prices as well as sluggish national and global economies.
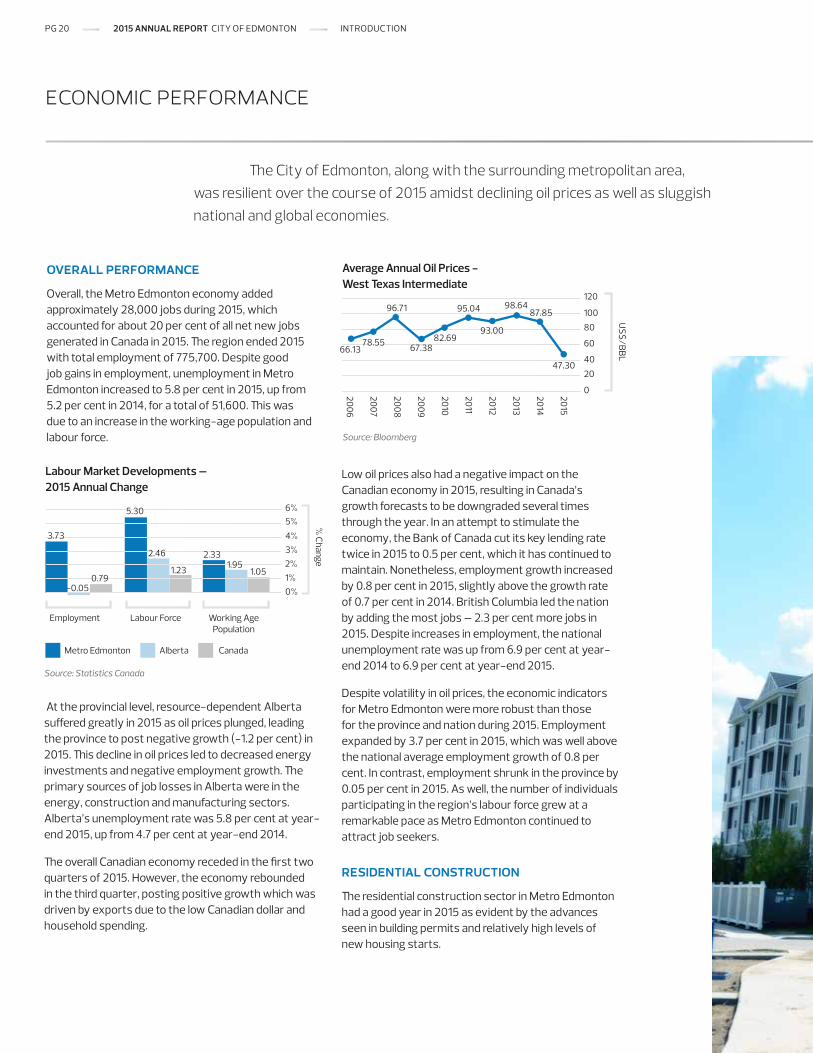
overall performance
Overall, the Metro Edmonton economy added approximately 28,000 jobs during 2015, which accounted for about 20 per cent of all net new jobs generated in Canada in 2015. The region ended 2015 with total employment of 775,700. Despite good job gains in employment, unemployment in Metro Edmonton increased to 5.8 per cent in 2015, up from 5.2 per cent in 2014, for a total of 51,600. This was due to an increase in the working-age population and labour force.
At the provincial level, resource-dependent Alberta suffered greatly in 2015 as oil prices plunged, leading the province to post negative growth (-1.2 per cent) in 2015. This decline in oil prices led to decreased energy investments and negative employment growth. The primary sources of job losses in Alberta were in the energy, construction and manufacturing sectors. Alberta’s unemployment rate was 5.8 per cent at year-end 2015, up from 4.7 per cent at year-end 2014.
The overall Canadian economy receded in the first two quarters of 2015. However, the economy rebounded in the third quarter, posting positive growth which was driven by exports due to the low Canadian dollar and household spending.
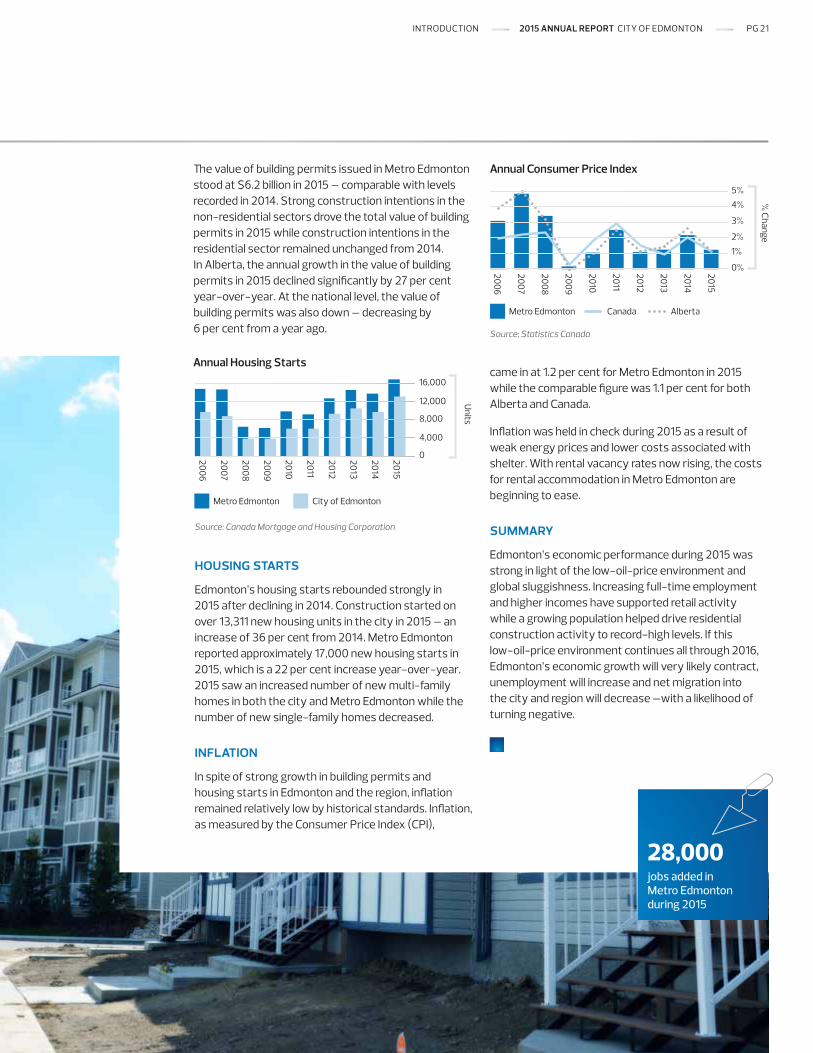
Low oil prices also had a negative impact on the Canadian economy in 2015, resulting in Canada’s growth forecasts to be downgraded several times through the year. In an attempt to stimulate the economy, the Bank of Canada cut its key lending rate twice in 2015 to 0.5 per cent, which it has continued to maintain. Nonetheless, employment growth increased by 0.8 per cent in 2015, slightly above the growth rate of 0.7 per cent in 2014. British Columbia led the nation by adding the most jobs – 2.3 per cent more jobs in 2015. Despite increases in employment, the national unemployment rate was up from 6.9 per cent at year-end 2014 to 6.9 per cent at year-end 2015.
Despite volatility in oil prices, the economic indicators for Metro Edmonton were more robust than those for the province and nation during 2015. Employment expanded by 3.7 per cent in 2015, which was well above the national average employment growth of 0.8 per cent. In contrast, employment shrunk in the province by 0.05 per cent in 2015. As well, the number of individuals participating in the region’s labour force grew at a remarkable pace as Metro Edmonton continued to attract job seekers.
residential construction
The residential construction sector in Metro Edmonton had a good year in 2015 as evident by the advances seen in building permits and relatively high levels of new housing starts.
Source: Bloomberg2007
2006
2011
2009
2013
2008
2012
2010
2014
2015
100
80
60
40
20
0
US$/BBL
Average Annual Oil Prices - West Texas Intermediate
120
66.1378.55
96.71
67.3882.69
95.04
93.00
98.6487.85
47.30
PG 20 2015 ANNUAL REPORT CITY OF EDMONTON INTRODUCTION
Source: Statistics Canada
2007
2006
2011
2009
2013
2008
2012
2010
2014
2015
5%
4%
3%
2%
1%
0%
% C
hange
Annual Consumer Price Index
Metro Edmonton Canada Alberta
Source: Canada Mortgage and Housing Corporation
2006
Annual Housing Starts
2007
2008
2009
2010
2011
2012
2013
2014
2015
Units
16,000
8,000
12,000
4,000
0
Metro Edmonton City of Edmonton
28,000jobs added in Metro Edmonton during 2015
The value of building permits issued in Metro Edmonton stood at $6.2 billion in 2015 – comparable with levels recorded in 2014. Strong construction intentions in the non-residential sectors drove the total value of building permits in 2015 while construction intentions in the residential sector remained unchanged from 2014. In Alberta, the annual growth in the value of building permits in 2015 declined significantly by 27 per cent year-over-year. At the national level, the value of building permits was also down – decreasing by 6 per cent from a year ago.
housing starts
Edmonton’s housing starts rebounded strongly in 2015 after declining in 2014. Construction started on over 13,311 new housing units in the city in 2015 – an increase of 36 per cent from 2014. Metro Edmonton reported approximately 17,000 new housing starts in 2015, which is a 22 per cent increase year-over-year. 2015 saw an increased number of new multi-family homes in both the city and Metro Edmonton while the number of new single-family homes decreased.
inflation
In spite of strong growth in building permits and housing starts in Edmonton and the region, inflation remained relatively low by historical standards. Inflation, as measured by the Consumer Price Index (CPI),
came in at 1.2 per cent for Metro Edmonton in 2015 while the comparable figure was 1.1 per cent for both Alberta and Canada.
Inflation was held in check during 2015 as a result of weak energy prices and lower costs associated with shelter. With rental vacancy rates now rising, the costs for rental accommodation in Metro Edmonton are beginning to ease.
summary
Edmonton’s economic performance during 2015 was strong in light of the low-oil-price environment and global sluggishness. Increasing full-time employment and higher incomes have supported retail activity while a growing population helped drive residential construction activity to record-high levels. If this low-oil-price environment continues all through 2016, Edmonton’s economic growth will very likely contract, unemployment will increase and net migration into the city and region will decrease –with a likelihood of turning negative.
INTRODUCTION 2015 ANNUAL REPORT CITY OF EDMONTON PG 21
financial information
PG 22 2015 ANNUAL REPORT CITY OF EDMONTON FINANCIAL STATEMENT DISCUSSION AND ANALYSIS
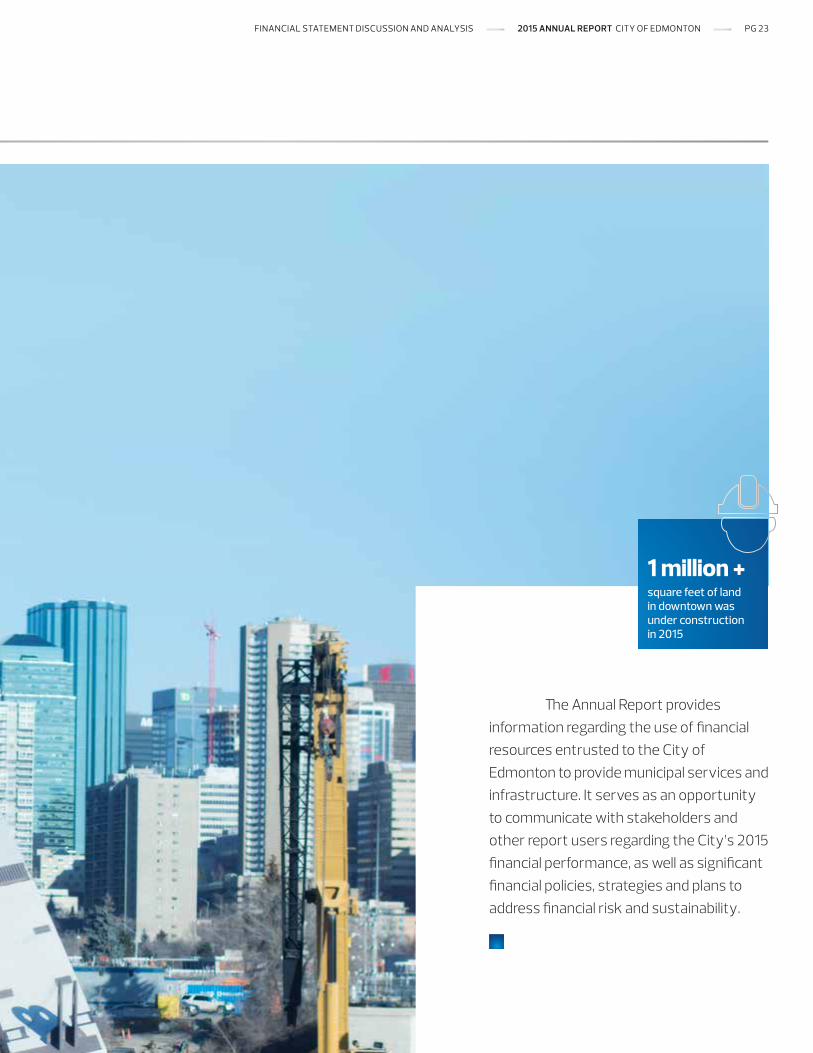
The Annual Report provides information regarding the use of financial resources entrusted to the City of Edmonton to provide municipal services and infrastructure. It serves as an opportunity to communicate with stakeholders and other report users regarding the City’s 2015 financial performance, as well as significant financial policies, strategies and plans to address financial risk and sustainability.
1 million + square feet of land in downtown was under construction in 2015
FINANCIAL STATEMENT DISCUSSION AND ANALYSIS 2015 ANNUAL REPORT CITY OF EDMONTON PG 23
financial statement discussion and analysis
The 2015 Annual Report includes the consolidated financial statements (financial statements) for the City, prepared in accordance with Canadian public sector accounting standards (PSAS).
KPMG LLP have audited the financial statements and have provided the accompanying Independent Auditors’ Report. The financial statements and auditors’ report satisfy a legislative reporting requirement as set out in the Municipal Government Act (MGA) of Alberta. The following financial statement discussion and analysis should be read in conjunction with the financial statements. Both have been prepared by and are the responsibility of Management. A five year statistical review of key information has also been provided.
2015 financial highlightsFor 2015, the City was able to execute its business plan and budget as expected. The City began its first four year capital budget for 2015-2018 which continued investment into key infrastructure projects. The capital budget includes new and upgraded libraries, fire stations, a police campus and a transit garage, the renewal and upgrade of recreation facilities, construction of new transportation assets such as the Valley Line LRT, roads and bridges, and reconstruction of roads through the neighbourhood renewal program. The capital budget strikes a balance between growth and renewal and will advance work on significant capital projects. The 2015 operating budget advanced Council priorities with a property tax increase for civic programs at 5.7 per cent, including 1.5 per cent dedicated to fund neighbourhood renewal.
The City ended the year with a $27.6 million surplus (1.1 per cent of budgeted tax-supported expenses) for general government (tax-supported) operations relative to the budget. The surplus is primarily a result of personnel savings, lower than expected fuel costs and other net favourable variances across City programs, partially offset by greater than expected snow and ice control costs and various other net unfavourable program variances.
The City maintains a healthy financial position with an overall accumulated surplus of $13,599.9 million. The City continues to monitor its financial performance and strategies to address growth and increased demand for services and continues to monitor the impacts of the economic slowdown. An expanded discussion of these challenges is included in the long-term sustainability and risk management portion of this document.
accounting and reporting changesIn 2015, the City adopted PS3260 - Liability for Contaminated Sites. The standard provides guidance on accounting for and reporting a liability for contaminated sites and is effective for years beginning on or after April 1, 2014. The standard was applied on a prospective basis. Generally a liability is to be recognized when contamination exceeds an existing environmental standard and the City is either directly responsible for the contamination or has taken responsibility for the contamination. In addition, the City would expect to give up future economic benefits and the amount of the liability would need to be reasonably estimated. As a result of this standard an additional remediation liability and related operating expense of $0.9 million was recognized at the end of the year. Additional details on the change in accounting policy and the impact on the financial statement balances is disclosed in Note 27 to the financial statements.
Todd Burge, CPA, CMA Chief Financial Officer & Treasurer General Manager
The financial statement discussion and analysis provides a financial overview of the 2015 City operations and also discusses the City’s financial practices related to control and accountability, long-term sustainability and risk management.
PG 24 2015 ANNUAL REPORT CITY OF EDMONTON FINANCIAL STATEMENT DISCUSSION AND ANALYSIS
$2.5 billioninvestment in EPCOR
Effective January 1, 2015 the City’s Fleet services branch was reclassified as a tax-supported operation and has been reflected as such on the Consolidated Statement of Operations and Accumulated Surplus and Schedule 2 – Consolidated Schedule of Segment Disclosures. Prior year amounts reflect Fleet services as an enterprise operation.
significant trendingThe City continues to see growth and net in-migration into the area. Between the 2011 and the 2014 census, the City population grew by 8.1 per cent with minimal changes in the population age distribution. Housing starts more than doubled in the last five years to support this growth and total taxable assessment increased by $30,903.4 million. With a rapidly growing population comes the demand for additional services and infrastructure. The City’s operating expenses increased by $598.3 million since 2011 and net capital asset additions were $6,084.7 million over the same time period. The cost to provide these services and infrastructure were largely paid for with property taxes, user fees, grants and debt. From 2011 to 2015, total revenues increased by $783.0 million. The largest increases in revenues were in the areas of property taxes, subsidiary operations (EPCOR), and capital revenues used to fund capital infrastructure development. Capital revenues are mainly comprised of government transfers and developer and customer contributions. Debt increased by a net $820.2 million between 2011 and 2015 in order to take advantage of lower interest rates and progress on priority infrastructure projects.
Refer to the Statistical Review section of the Annual Report for further information on these trends as well as other statistical data.
financial position The City has maintained a strong financial position ending the year with a net financial asset position (financial assets less liabilities) of $1,081.1 million, an overall increase of $29.8 million over prior year. The significant changes in financial assets and liabilities are discussed in the following sections. The primary components of the net financial asset balance are the City’s investment of $2,515.2 million in the EPCOR subsidiary, investments of $1,748.7 million and long-term debt of $3,033.2 million. Overall the City increased its accumulated surplus to $13,599.9 million, an increase of 6.7 per cent from the prior year balance of $12,745.4 million. The change in the accumulated surplus arises from the annual excess of revenues over expenses for the year of$798.3 million and $56.2 million in other comprehensive income relating to the EPCOR subsidiary.
cash position
The City’s cash position comprises cash and temporary investments. Temporary investments are used to ensure that sufficient cash and liquid assets are available to manage the timing of the City’s operating and capital expenditures. The cash position has decreased to $328.2 million from $442.5 million, an overall decrease of $114.3 million.
The Consolidated Statement of Cash Flows summarizes the sources and uses of cash in 2015. During the year, cash was raised in a combination of $654.1 million from operations, $137.7 million from net borrowing and $71.1 million from investing activities. The City spent $977.2 million to acquire tangible capital assets, net of proceeds on disposal.
FINANCIAL STATEMENT DISCUSSION AND ANALYSIS 2015 ANNUAL REPORT CITY OF EDMONTON PG 25
$793.3 millionmarket value of the Ed Tel Endowment Fund
receivables
Receivables include amounts owed to the City related to taxes, trade and other receivables, local improvements and government transfers. The receivables balance of $473.0 million increased by $168.8 million from the prior year balance of $304.2 million. Note 3 to the financial statements provides further information on the composition of the receivables balance.
The majority of the increase in receivables is related to government grants. At the end of the year the City had $141.9 million in government grant receivables primarily for funding of capital projects, the majority of which were received early in 2016. At the end of 2014, the balance of government grants receivable was $0.3 million. Details on federal and provincial government transfers are provided in Note 18 to the financial statements.
The trade and other receivables increase of $15.8 million is due to year-over-year variations relating to the City’s operations.
Local improvement receivables increased by a net $3.1 million due to local improvement construction completed during the year, less current year local improvement property taxes collected to repay the original cost of the construction. Property owners have the option to pay for local improvements at the outset of the project or finance the local improvement over a period of time. Local improvement revenue is recognized and is receivable from the property owner in the year the project is complete.
investments
All investments held by the City must comply with the MGA, the associated provincial investment regulation, Major City’s Investment Regulation and with the City’s internal investment policy. The goal of the City Council approved investment policy, as overseen by the Investment Committee, is to preserve the original principal and to maximize investment returns within an acceptable and prudent level of risk. Asset mix is determined based upon the investment earning objectives, investment time horizon and level of risk tolerance. The Investment Committee’s role is to oversee the City’s investments. Members are selected to bring both investment and business expertise to the Committee. By monitoring the City’s investment program and implementing changes as necessary, the Committee ensures that the funds are
well positioned and appropriately invested to meet their objectives. The Committee is confident that the asset allocation policies remain appropriate, and will continue to monitor and evaluate the City’s investment program and recommend changes as appropriate. More detailed information on the investment performance and benchmarks is available in the 2015 Investment Committee Annual Report.
The City’s investment custodian, State Street Trust Company, is responsible for the safekeeping of the City’s investments. State Street Trust Company was selected as the City’s investment custodian in 2008. A review of the City’s banking and custodial services is completed periodically.
Included in investments of $1,748.7 million are amounts held as cash, fixed income and common and preferred shares, held within a Short Term Bond Fund, a Balanced Fund, the Ed Tel Endowment Fund and the Sinking Fund. At year end the market value of the investment portfolio was $1,765.2 million, 0.9 per cent above the investment cost.
The largest of the City investment funds is the Ed Tel Endowment Fund, established in 1995, with the investment of $465.0 million in proceeds from the sale of the municipal telephone utility. The objective of the Ed Tel Endowment Fund is to provide a source of income in perpetuity while ensuring that the real purchasing power is maintained. Earnings from the fund are applied under a formula established by City Bylaw 11713. Since inception, the fund has contributed a total of $663.5 million to the City with dividends of $28.6 million provided from the fund in 2015. At June 30, 2015 the Ed Tel Endowment fund market value was 16 per cent above the inflation adjusted principal. As the market value was greater than 15 per cent of the inflation adjusted principal, following Bylaw 11713 the fund was in a position to pay a special dividend. On September 9, 2015 City Council approved a special dividend from the Ed Tel Endowment fund in the amount of $8.0 million to
PG 26 2015 ANNUAL REPORT CITY OF EDMONTON FINANCIAL STATEMENT DISCUSSION AND ANALYSIS
be paid in 2016. The special dividend will be used to fund capital consistent with the budget strategy to redirect investment earnings to capital.
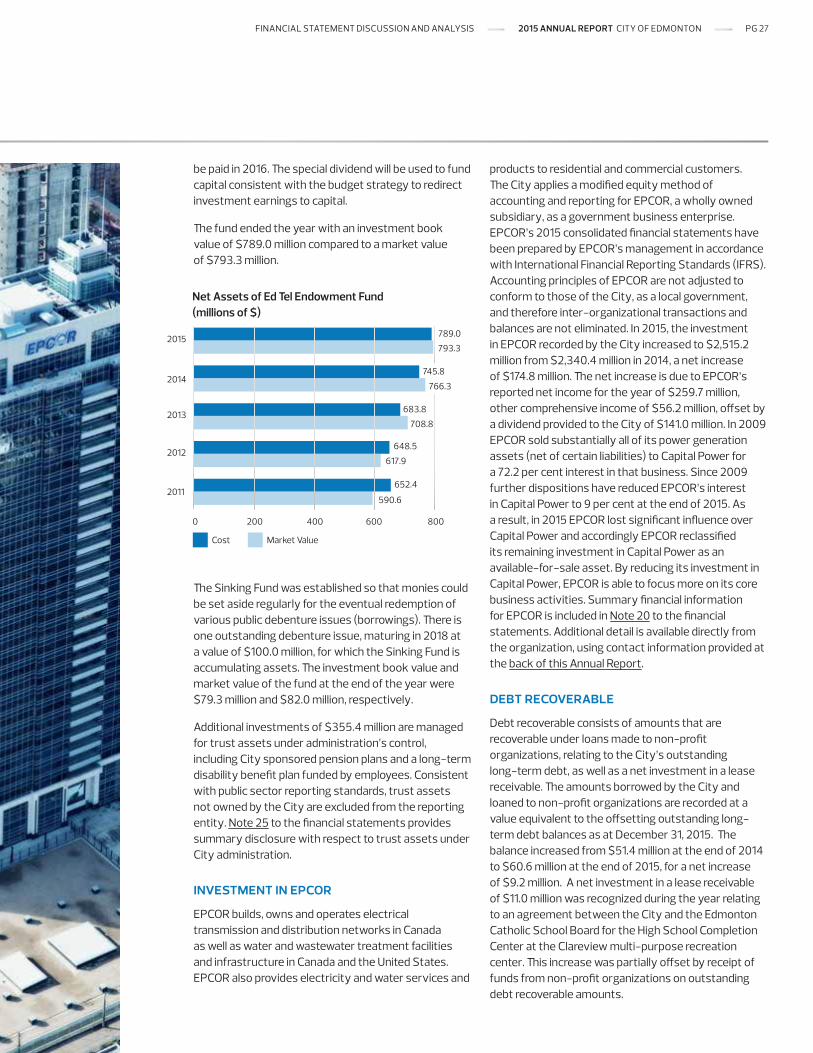
The fund ended the year with an investment book value of $789.0 million compared to a market value of $793.3 million.
The Sinking Fund was established so that monies could be set aside regularly for the eventual redemption of various public debenture issues (borrowings). There is one outstanding debenture issue, maturing in 2018 at a value of $100.0 million, for which the Sinking Fund is accumulating assets. The investment book value and market value of the fund at the end of the year were $79.3 million and $82.0 million, respectively.
Additional investments of $355.4 million are managed for trust assets under administration’s control, including City sponsored pension plans and a long-term disability benefit plan funded by employees. Consistent with public sector reporting standards, trust assets not owned by the City are excluded from the reporting entity. Note 25 to the financial statements provides summary disclosure with respect to trust assets under City administration.
investment in epcor
EPCOR builds, owns and operates electrical transmission and distribution networks in Canada as well as water and wastewater treatment facilities and infrastructure in Canada and the United States. EPCOR also provides electricity and water services and
products to residential and commercial customers. The City applies a modified equity method of accounting and reporting for EPCOR, a wholly owned subsidiary, as a government business enterprise. EPCOR’s 2015 consolidated financial statements have been prepared by EPCOR’s management in accordance with International Financial Reporting Standards (IFRS). Accounting principles of EPCOR are not adjusted to conform to those of the City, as a local government, and therefore inter-organizational transactions and balances are not eliminated. In 2015, the investment in EPCOR recorded by the City increased to $2,515.2 million from $2,340.4 million in 2014, a net increase of $174.8 million. The net increase is due to EPCOR’s reported net income for the year of $259.7 million, other comprehensive income of $56.2 million, offset by a dividend provided to the City of $141.0 million. In 2009 EPCOR sold substantially all of its power generation assets (net of certain liabilities) to Capital Power for a 72.2 per cent interest in that business. Since 2009 further dispositions have reduced EPCOR’s interest in Capital Power to 9 per cent at the end of 2015. As a result, in 2015 EPCOR lost significant influence over Capital Power and accordingly EPCOR reclassified its remaining investment in Capital Power as an available-for-sale asset. By reducing its investment in Capital Power, EPCOR is able to focus more on its core business activities. Summary financial information for EPCOR is included in Note 20 to the financial statements. Additional detail is available directly from the organization, using contact information provided at the back of this Annual Report.
debt recoverable
Debt recoverable consists of amounts that are recoverable under loans made to non-profit organizations, relating to the City’s outstanding long-term debt, as well as a net investment in a lease receivable. The amounts borrowed by the City and loaned to non-profit organizations are recorded at a value equivalent to the offsetting outstanding long-term debt balances as at December 31, 2015. The balance increased from $51.4 million at the end of 2014 to $60.6 million at the end of 2015, for a net increase of $9.2 million. A net investment in a lease receivable of $11.0 million was recognized during the year relating to an agreement between the City and the Edmonton Catholic School Board for the High School Completion Center at the Clareview multi-purpose recreation center. This increase was partially offset by receipt of funds from non-profit organizations on outstanding debt recoverable amounts.
2015
2014
2013
2012
2011
0 200 400 600 800
Cost Market Value
Net Assets of Ed Tel Endowment Fund (millions of $)
789.0
793.3
683.8
708.8
745.8
766.3
648.5
617.9
652.4
590.6
FINANCIAL STATEMENT DISCUSSION AND ANALYSIS 2015 ANNUAL REPORT CITY OF EDMONTON PG 27
land for resale
Land for resale includes land inventory that the City ultimately intends to develop for sale or land determined to be surplus to the municipal needs. The balance is recorded at the lower of cost and estimated net realizable value. Costs associated with preparation for sale are added to the cost of the land. Land for resale decreased by $44.9 million during 2015 resulting in a balance of $199.5 million. This was mainly due to sale of land during the year including the sale of land for development in the arena district.
accounts payable and accrued liabilities
The accounts payable and accrued liabilities balance of $709.4 million at the end of 2015 has decreased by $5.2 million over the prior year balance of $714.6 million.
Trade and other payables increased by $27.6 million due to increases in payables relating to Rogers Place arena construction and other projects underway at year-end and timing differences in payments of outstanding invoices compared to the prior year. These increases were partially offset by decreases in expropriation liabilities due to settlements during the year and various other net variances.
Developer obligations decreased by $41.9 million or 25.4 per cent over prior year. This is largely due to payments for amounts being held at the end of last year pending completion of developments and fulfilment of requirements set out in servicing agreements. The developments were completed and the servicing agreement requirements were met by the end of the year and the payments were released.
The increase in payroll and remittances of $8.6 million is a result of the timing of year end remittances.
Information on the composition of the accounts payable and accrued liability balance is provided in Note 7 to the financial statements.
deferred revenue
Deferred revenue is largely made up of government transfers, provided to fund operating or capital expenses. These revenues are externally restricted until used for the purpose intended. The balance has increased by $101.2 million over 2014, to end the year at $200.1 million, largely due to capital grant funding received or receivable by the City, in advance of capital
expenses. Operating deferred revenue includes amounts for property and facility rental and other revenue amounts received in advance of services provided. Additional detail with respect to balances and changes in deferred revenue is included in Note 8 to the financial statements.
debt
The City utilizes debt to finance capital expenditures under principles and limits established within the City’s Debt Management Fiscal Policy (DMFP). The policy is intended to support the City’s long-term capital plans and strategies, while maintaining long-term financial affordability, flexibility and sustainability. The policy also provides for approval of multi-year debt guidelines with a corresponding debt repayment funding strategy and added flexibility for the application of funds used for debt servicing once debt is retired.
The City has three main types of debt: tax-supported debt funded by tax levy, self-supporting tax-guaranteed debt funded through dedicated non-tax levy revenues and self-liquidating debt funded through programs that are self-sustaining such as utilities and local improvements. As self-supporting tax-guaranteed debt is guaranteed by the tax levy, it is classified as tax-supported debt. The City’s Debt White Paper discusses the City’s policies and strategies with respect to debt management. It is one of the six white papers discussing the key financial principles, strategies and policies to be incorporated into the City’s The Way We Finance strategy (Edmonton’s Fiscal Sustainability Framework). The Debt White Paper is available on the City of Edmonton’s website.
Borrowing completed by the City since 1993 has generally been in the form of amortizing debentures in Canadian dollars administered through the Alberta Capital Finance Authority (ACFA), utilizing the strong debt rating of the Government of Alberta and combined borrowing volumes across Alberta. Interest rates are established at the time of borrowing and remain constant throughout the term of the debenture, eliminating the risk associated with fluctuating interest rates. Payments are made annually or semi-annually. The City continued to benefit from low interest rates for new borrowing during the year with ranges as follows:
Borrowing Terms and Interest Rates
Term Interest rates
5 year 1.09% to 1.34%
10 year 1.78% to 2.03%
15 year 2.24% to 2.60%
20 year 2.51% to 2.83%
25 year 2.78% to 3.04%
30 year 2.78% to 3.20%
35 year 3.18% to 3.50%
PG 28 2015 ANNUAL REPORT CITY OF EDMONTON FINANCIAL STATEMENT DISCUSSION AND ANALYSIS
AA+credit rating from Standard and Poor’s
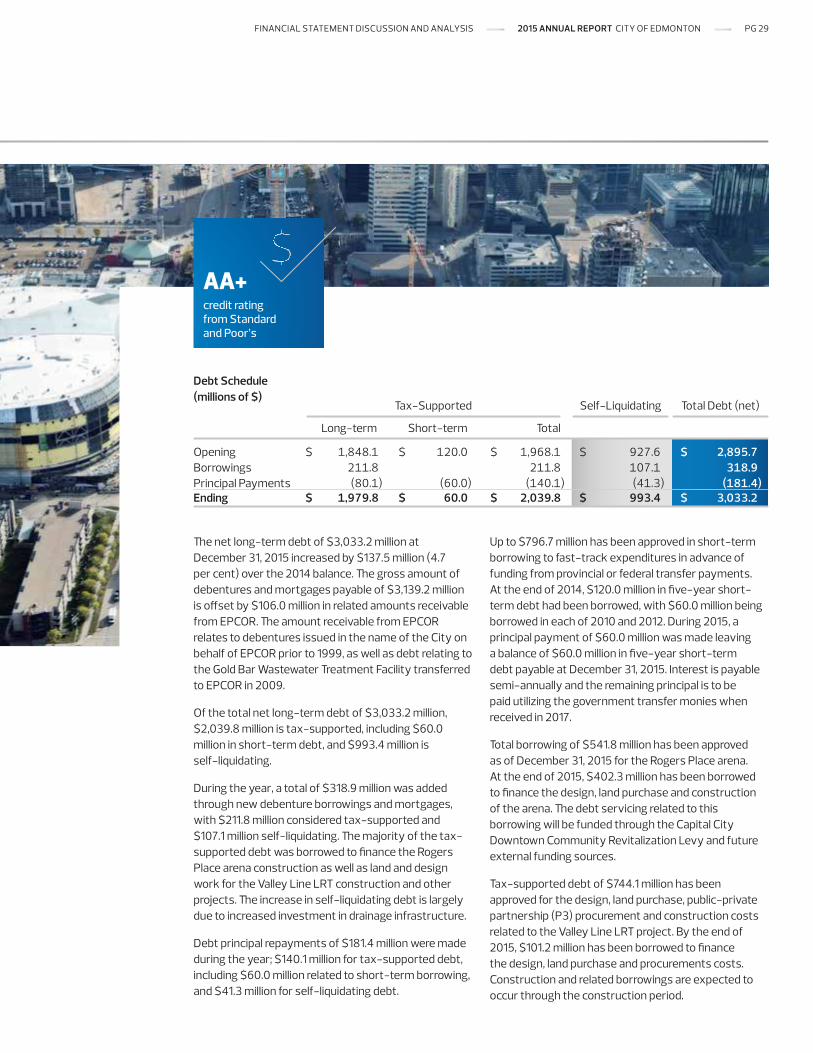
The net long-term debt of $3,033.2 million at December 31, 2015 increased by $137.5 million (4.7 per cent) over the 2014 balance. The gross amount of debentures and mortgages payable of $3,139.2 million is offset by $106.0 million in related amounts receivable from EPCOR. The amount receivable from EPCOR relates to debentures issued in the name of the City on behalf of EPCOR prior to 1999, as well as debt relating to the Gold Bar Wastewater Treatment Facility transferred to EPCOR in 2009.
Of the total net long-term debt of $3,033.2 million, $2,039.8 million is tax-supported, including $60.0 million in short-term debt, and $993.4 million is self-liquidating.
During the year, a total of $318.9 million was added through new debenture borrowings and mortgages, with $211.8 million considered tax-supported and $107.1 million self-liquidating. The majority of the tax-supported debt was borrowed to finance the Rogers Place arena construction as well as land and design work for the Valley Line LRT construction and other projects. The increase in self-liquidating debt is largely due to increased investment in drainage infrastructure.
Debt principal repayments of $181.4 million were made during the year; $140.1 million for tax-supported debt, including $60.0 million related to short-term borrowing, and $41.3 million for self-liquidating debt.
Up to $796.7 million has been approved in short-term borrowing to fast-track expenditures in advance of funding from provincial or federal transfer payments. At the end of 2014, $120.0 million in five-year short-term debt had been borrowed, with $60.0 million being borrowed in each of 2010 and 2012. During 2015, a principal payment of $60.0 million was made leaving a balance of $60.0 million in five-year short-term debt payable at December 31, 2015. Interest is payable semi-annually and the remaining principal is to be paid utilizing the government transfer monies when received in 2017.
Total borrowing of $541.8 million has been approved as of December 31, 2015 for the Rogers Place arena. At the end of 2015, $402.3 million has been borrowed to finance the design, land purchase and construction of the arena. The debt servicing related to this borrowing will be funded through the Capital City Downtown Community Revitalization Levy and future external funding sources.
Tax-supported debt of $744.1 million has been approved for the design, land purchase, public-private partnership (P3) procurement and construction costs related to the Valley Line LRT project. By the end of 2015, $101.2 million has been borrowed to finance the design, land purchase and procurements costs. Construction and related borrowings are expected to occur through the construction period.
Long-term Short-term Total Opening $ 1,848.1 $ 120.0 $ 1,968.1 $ 927.6 $ 2,895.7 Borrowings 211.8 211.8 107.1 318.9 Principal Payments (80.1) (60.0) (140.1) (41.3) (181.4)Ending $ 1,979.8 $ 60.0 $ 2,039.8 $ 993.4 $ 3,033.2
Debt Schedule (millions of $)
Tax-Supported Self-Liquidating Total Debt (net)
FINANCIAL STATEMENT DISCUSSION AND ANALYSIS 2015 ANNUAL REPORT CITY OF EDMONTON PG 29

A Regulation under Section 271 of the MGA establishes limits for municipal debt levels and annual debt servicing costs. The City’s debt limit, as defined by the Regulation, is calculated as two times consolidated revenue net of revenue from subsidiary operations - EPCOR, capital government transfers, and contributed tangible capital assets. Debt servicing costs are not to exceed 35 per cent of the same revenues. The City carries levels of debt and debt servicing well below the legislated limit. Debt servicing, for purposes of calculating the MGA debt servicing limit, is the amount of principal and interest for the subsequent year relating to debt in place at the end of the year reported.
Debt and Debt Service Limits - MGA (millions of $) 2015 2014
Debt limit 5,581.5 5,154.3
Debt limit used 3,033.2 2,895.7
Percentage used (%) 54.3 56.2
Debt service limit 976.8 902.0
Debt service limit used 285.7 319.4
Percentage used (%) 29.3 35.4
Total debt increased over prior year largely due to new borrowings for Rogers Place arena, the Valley Line LRT, Blatchford redevelopment and drainage infrastructure assets, partially offset by debt principal repayments. Total debt servicing decreased from 2014 as a result of the repayment of $60 million in short-term debt reflected as debt servicing in the prior year.
The internal Debt Management Fiscal Policy (DMFP) sets more conservative debt service limits than those established in the MGA, with limits for all City operations and tax-supported operations. Under the
City’s policy, the total debt service limit is set at 22 per cent of total revenues and the tax-supported debt service limit is 15 per cent of tax-supported revenues.
Debt Service Limits - DMFP (millions of $) 2015 2014
Total debt service limit 614.0 567.0
Debt service limit used 304.3 299.4
Percentage used (%) 49.6 52.8
Tax-supported debt service limit 331.0 310.1
Debt service limit used 218.8 215.3
Percentage used (%) 66.1 69.4
As part of the budget strategy initiated in 2010, fluctuating revenue streams within the operating budget, such as investment earnings, are directed to fund a significant portion of the capital expenses in tax-supported programs on an annual basis.
non-financial assets
Non-financial assets include tangible capital assets, inventories and other assets used to provide services. Tangible capital assets are assets managed and held for use in the production or supply of goods and services, for rental to others, for administrative purposes or for development, construction, maintenance or repair of other tangible capital assets. These assets have economic lives that extend beyond a year and are not for sale in the ordinary course of operations.
Net tangible capital assets of $12,449.1 million have increased by 7.0 per cent compared to the 2014 balance of $11,629.9 million. The net increase of $819.2 million is a result of acquisitions and contributions of
PG 30 2015 ANNUAL REPORT CITY OF EDMONTON FINANCIAL STATEMENT DISCUSSION AND ANALYSIS
$1.3 billioncapital asset additions
tangible capital assets of $1,331.2 million, offset by annual amortization of $491.1 million and disposals of assets with a net book value of $20.9 million. Tangible capital assets placed in service were primarily in asset categories of light rail transit, roadways and drainage systems. Schedule 1 - Consolidated Schedule of Tangible Capital Assets to the financial statements provides a continuity schedule for the asset cost and the related accumulated amortization for each of the significant asset types.
2015 was the first year of the 2015-2018 capital budget, approved by City Council in December 2014, and capital spending during the year focused on key growth projects as well as maintenance of existing infrastructure. Capital additions in 2015 of $1,331.2 million, including contributed assets, were similar to the $1,131.3 million level of 2014 and continued a substantive capital investment in city infrastructure for both growth and renewal. Progress was made during the year on significant capital projects, including the neighbourhood renewal program, drainage systems across the city, the Rogers Place arena, Valley Line LRT design and procurement, Walterdale bridge replacement and Whitemud widening.
accumulated surplus
The accumulated surplus reflects the net economic resources that have been built up over time for the City of Edmonton. As reflected in Note 16 to the financial statements, the accumulated surplus consists of restricted and unrestricted amounts, including the 2015 ending position of general government operations, reserves, equity invested in tangible capital assets and advances for construction. The City has maintained a strong accumulated surplus, ending 2015 with a total of $13,599.9 million, an increase of 6.7 per cent from the prior year.
As of December 31, 2015 general government (tax-supported) operations have a year-end position of $27.6 million and the City share of unrestricted excess
sinking fund earnings is $3.2 million. Included in the restricted surplus of $3,789.1 million is $2,515.2 million relating to EPCOR, $789.0 million from the Ed Tel Endowment Fund, a combined accumulated surplus from the enterprise and utility operations of Drainage Services, Land Enterprise, and Waste Management of $81.6 million, as well as $375.6 million in reserves for future expenditures.
Effective January 1, 2015, Fleet services transitioned from an enterprise to tax-supported operation. Prior to 2015, as a municipal enterprise, all annual surpluses and deficits from Fleet services were accumulated in a separate and dedicated retained earnings account, which at the end of 2014 had an accumulated deficit balance of $23.3 million. During 2015 City Council approved a transfer from the Fleet services - Vehicle Replacement reserve of $23.3 million to offset the deficit in the Fleet services retained earnings account and subsequently closed the account. With the transition to a tax-supported operation all surpluses and deficits from Fleet services, along with surpluses and deficits from other tax-supported areas, will be included with general government operations and allocated to the Financial Stabilization reserve at the beginning of the subsequent year.
The utility and enterprise retained earnings of $81.6 million at the end of 2015 decreased by $11.2 million from prior year, excluding the prior year Fleet services enterprise retained earnings. The Drainage Services utility retained earnings decreased by $28.9 million mainly due to use of retained earnings to fund drainage infrastructure, partially offset by net income for the year. Land Enterprise and the Waste Management utility both improved their retained earnings position by $13.3 million and $4.4 million, respectively, due to positive operating results at the end of the year.
FINANCIAL STATEMENT DISCUSSION AND ANALYSIS 2015 ANNUAL REPORT CITY OF EDMONTON PG 31
reserves
The City maintains a Council-approved policy which directs the establishment and processes with respect to reserves. Initial establishment of reserves, as well as transfers to and from reserves, requires the approval of City Council.
In accordance with the policy, a review of reserves was completed in 2015 to ensure they continue to support the financial goals and serve the highest priority needs of the city and its citizens. From this review, City Council approved the establishment of the Rogers Place Arena reserve to accumulate a portion of ticket surcharge revenues to fund major repairs and maintenance of the arena. With expiry of the agreement with Edmonton Northlands the Northlands Capital reserve was closed. The Brownfield Redevelopment reserve was also approved through the review. The City helps cover a portion of the developer testing and remediation costs on abandoned brownfield sites through the Brownfield Phase III grant program. The City’s accumulated surplus will be used to interim finance this program and will be replenished through future municipal property tax uplifts from the redevelopment. The reserve will provide for monitoring and transparency in use of the City’s accumulated surplus. Also through the reserves review City Council formally closed the Vehicle for Hire retained earnings account and established a reserve to accumulate the annual program surpluses and deficits. This was as a result of the Vehicle for Hire commission being disbanded in 2012 and responsibility for managing the program shifting to the City Manager. The reserve policy and balances are monitored on an ongoing basis with the next formal review planned for 2018.
A schedule of reserves has been provided in Note 15 to the financial statements. The reserve balance of $375.6 million also includes reserves of the City of Edmonton Library Board, Edmonton Economic Development Corporation, Non-Profit Housing Corporation and Fort Edmonton Management Company, as approved by their respective Boards.
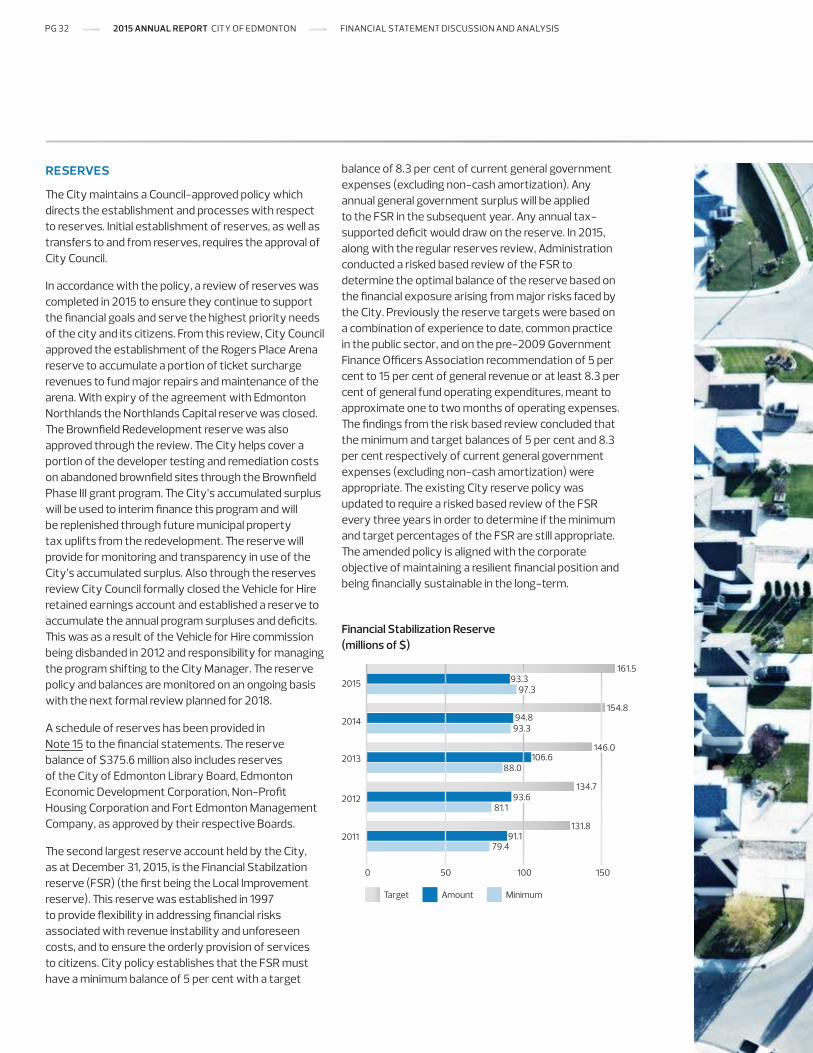
The second largest reserve account held by the City, as at December 31, 2015, is the Financial Stabilzation reserve (FSR) (the first being the Local Improvement reserve). This reserve was established in 1997 to provide flexibility in addressing financial risks associated with revenue instability and unforeseen costs, and to ensure the orderly provision of services to citizens. City policy establishes that the FSR must have a minimum balance of 5 per cent with a target
balance of 8.3 per cent of current general government expenses (excluding non-cash amortization). Any annual general government surplus will be applied to the FSR in the subsequent year. Any annual tax-supported deficit would draw on the reserve. In 2015, along with the regular reserves review, Administration conducted a risked based review of the FSR to determine the optimal balance of the reserve based on the financial exposure arising from major risks faced by the City. Previously the reserve targets were based on a combination of experience to date, common practice in the public sector, and on the pre-2009 Government Finance Officers Association recommendation of 5 per cent to 15 per cent of general revenue or at least 8.3 per cent of general fund operating expenditures, meant to approximate one to two months of operating expenses. The findings from the risk based review concluded that the minimum and target balances of 5 per cent and 8.3 per cent respectively of current general government expenses (excluding non-cash amortization) were appropriate. The existing City reserve policy was updated to require a risked based review of the FSR every three years in order to determine if the minimum and target percentages of the FSR are still appropriate. The amended policy is aligned with the corporate objective of maintaining a resilient financial position and being financially sustainable in the long-term.
161.5
Target Amount Minimum
0 50 100 150
2015
154.82014
146.02013
2011131.8
2012134.7
Financial Stabilization Reserve (millions of $)
88.0106.6
91.179.4
93.681.1
93.394.8
93.397.3
PG 32 2015 ANNUAL REPORT CITY OF EDMONTON FINANCIAL STATEMENT DISCUSSION AND ANALYSIS
$93.3 millionbalance of the Financial Stabilization Reserve
Of the overall reserve balance, an amount of $93.3 million is held within the FSR. The 2015 general government surplus of $27.6 million will be transferred to the FSR in 2016 with $13.5 million then appropriated for funding within the 2016 and 2017 operating budget, as approved by City Council. After reflecting the approved transactions, the adjusted FSR balance of $107.4 million will exceed the minimum level as set within the policy of $97.3 million but will be below the target level of $161.5 million.
During the year, $13.9 million in funding was transferred from the FSR to the appropriated FSR to fund future project expenses and $16.0 million of the appropriated FSR was applied to fund expenses in 2015 as previously approved by Council. Funding within the appropriated FSR of $2.4 million was released back to the FSR as the funding was no longer required.
The Local Improvement reserve accumulates the annual difference between local improvement revenues and debt servicing related to local improvements. In 2015, the reserve balance increased by $8.0 million from the prior year. This was due to revenues recognized for local improvement construction during the year, partially offset by funds used to pay for local improvement debt servicing costs. The City borrows to finance 50 or 100 per cent of the local improvement construction cost. Debt servicing related to the borrowing is repaid through the collection of local improvement amounts from the benefiting property owners.
A Community Revitalization Levy (CRL) is a funding source the City can use to dedicate future property tax revenue in a specific area to fund public projects designed to encourage new development and revitalize a specific area of the City. The City currently has CRLs approved for Belvedere, the Quarters and Downtown. To date, the costs in the early stages of each of the CRLs exceed the CRL revenue, resulting in deficit balances in the CRL reserves. CRL revenues in future years are expected to offset the current reserve deficit balances. Provincial education taxes collected as a part of incremental CRL tax revenues are retained for use within the CRL over its life.
The Traffic Safety and Automated Enforcement reserve policy allocates the annual budgeted photo enforcement revenues to the reserve and also allows for annual surpluses from this program to accumulate in the reserve. The reserve provides for the transparent allocation of automated enforcement revenue towards the Office of Traffic Safety, Edmonton Police Service, other traffic safety initiatives and City Council approved expenditures, such as but not limited to, third party community infrastructure programs. The 2015 year-end balance of the reserve was $29.4 million. A minimum balance of $2.4 million, which is 5% of annual photo enforcement revenues, is required by policy to manage revenue fluctuations. The increase in the reserve balance of $10.8 million represents photo enforcement revenues of $48.2 million in excess of approved expenses of $37.4 million for 2015.
The Interim Financing reserve accommodates timing differences between project operating costs, including debt servicing, and the receipt of future revenue intended to fund those expenses. At the end of 2015, the reserve has a deficit balance of $18.7 million, which will be replenished upon receipt of future revenues.
The Fleet Services - Vehicle Replacement reserve balance at the end of 2015 was $6.8 million, a $18.1 million decrease from the prior year balance of $24.9 million. The reserve accumulated funds during the year for future replacement of municipal vehicles. As previously discussed within the Accumulated Surplus section, $23.3 million in funds were transferred during the year from the reserve to offset the deficit position within the Fleet services retained earnings account. Sales from vehicle proceeds were also transferred to the reserve during the year.
FINANCIAL STATEMENT DISCUSSION AND ANALYSIS 2015 ANNUAL REPORT CITY OF EDMONTON PG 33
equity in tangible capital assets
As summarized in Note 14 to the financial statements, equity in tangible capital assets represents the investment made in tangible capital assets, after deducting the portion financed by outstanding long-term debt, net of long-term debt for land redevelopment, debt secured by Sinking Fund assets and debt recoverable. An increase of $712.6 million for 2015, as a result of the net acquisition of tangible capital assets partially offset by net additional debt, brings the ending balance of Equity in Tangible Capital Assets for the year to $9,597.7 million.
advances for construction
At the end of 2015, $182.2 million of funding/financing is in place where capital expenses have not yet been incurred, compared to $268.0 million at the end of 2014, a net decrease of $85.8 million.
A large majority of the decrease is due to repayment of debt borrowed in advance of capital project construction, partially offset by a net increase in developer contributions and other capital funding sources received in advance of construction.
$2.9 billionin operating revenues
PG 34 2015 ANNUAL REPORT CITY OF EDMONTON FINANCIAL STATEMENT DISCUSSION AND ANALYSIS
The overall operating revenues increase of $256.7 million from the prior year is due to $113.1 million increased taxation revenue from a combined rate increase and growth, $84.0 million increased user fees and sales of goods and services, $68.9 million increased EPCOR earnings, $16.5 million decrease in investment earnings and $7.2 million net increase in other revenue sources.
Property tax is the primary revenue source available to the City to pay for municipal services. In 2015 net taxes available for municipal services of $1,350.8 million accounted for 46.0 per cent of total operating revenues, a similar percentage compared to 2014. Total tax revenues in 2015 were $1,781.4 million, with $427.0 million collected on behalf of the province for education school tax and $3.6 million for business revitalization zones.
Net taxes for municipal services are collected annually to support operations, with certain amounts directed
towards specific programs such as neighbourhood renewal, community revitalization and local improvement projects. The remaining tax revenues are applied generally across all departments. Note 17 to the financial statements provides further detail with respect to tax revenue.
The increase in user fees from prior year is largely due to population growth and increased demand. The increase is consistent with annual growth from prior years. The largest increases were seen in land sales, admission and program revenues at the city’s recreation facilities, as well as drainage and waste rate revenues due to increased consumption and customer counts.
Investment earnings decreased from prior year due to the impact of the global economic slowdown on investment markets. Financial market returns were generally weaker in 2015 as compared to the strength seen during the previous year.
financial operations The Consolidated Statement of Operations and Accumulated Surplus outlines revenues earned by the City and their application (expenses) to provide municipal services.
comparison to prior year
Operating Revenues - Comparison to Prior Year (millions of $) 2015 2014 Actual Actual Change $ Change %
Taxation $ 1,350.8 $ 1,237.7 $ 113.1 9.1User fees and sales 759.0 675.0 84.0 12.4Subsidiary operations - EPCOR 259.7 190.8 68.9 36.1Franchise fees 138.0 133.6 4.4 3.3Investment earnings 133.9 150.4 (16.5) (11.0)Government transfers - operating 120.5 117.5 3.0 2.6Fines and penalties 85.7 83.7 2.0 2.4Licenses and permits 81.2 79.3 1.9 2.4Developer/customer contributions - operating 10.3 14.4 (4.1) (28.5)Total $ 2,939.1 $ 2,682.4 $ 256.7 9.6
FINANCIAL STATEMENT DISCUSSION AND ANALYSIS 2015 ANNUAL REPORT CITY OF EDMONTON PG 35
Operating expense increases of $164.3 million over the prior year primarily related to net increases in personnel costs of $77.2 million, materials goods and utilities of $37.2 million, contracted and general services of $24.2 million and interest and bank charges of $16.3 million. The remainder of the change from prior year was within amortization, loss on asset disposal and grants and other.
The increase in personnel costs is consistent with contractual rate adjustments. Materials, goods and utility costs increased from prior year largely due to costs related to downtown arena land sales. There were increases in contracted and general services across all City departments due to increased activity and general inflationary increases. The net increase in amortization from prior year is due to additional amortization during
the year related to significant road and LRT assets coming into service in 2015, namely the Metro Line LRT, partially offset by a decrease in amortization due to a one-time Fleet services amortization expense increase in 2014 of $35.6 million, to account for the change in the estimated useful life of bus assets. Interest and debt charges increased over prior year predominantly as a result of interest on borrowing related to construction of Rogers Place arena and other significant debt financed projects.
In terms of operating expense variances by function compared to prior year, all areas had increases related to personnel costs. Transportation services incurred additional amortization costs due to significant assets put into service in 2015 as well as an increase in bus maintenance costs.
2015 2014 Actual Actual Change $ Change %
Salaries and wages $ 1,447.9 $ 1,370.7 $ 77.2 5.6Materials, goods and utilities 332.4 295.2 37.2 12.6Contracted and general services 294.4 270.2 24.2 9.0Interest and bank charges 128.9 112.6 16.3 14.5Grants and other 71.8 72.1 (0.3) (0.4)Amortization of tangible capital assets 491.1 479.5 11.6 2.4Loss on disposal/replacement of tangible capital assets 10.2 12.1 (1.9) (15.7)Total $ 2,776.7 $ 2,612.4 $ 164.3 6.3
Operating Expenses by Function - Comparison to Prior Year (millions of $) 2015 2014 Actual Actual Change $ Change %
Transportation services $ 819.1 $ 786.1 $ 33.0 4.2Protective services 606.7 582.3 24.4 4.2Community services 532.2 479.4 52.8 11.0 Waste Management 171.6 160.6 11.0 6.8 Drainage Services 138.6 136.9 1.7 1.2 Land Enterprise 74.0 29.1 44.9 154.3 Fleet services 55.9 81.2 (25.3) (31.2)Corporate administration, general municipal and other 378.6 356.8 21.8 6.1 Total $ 2,776.7 $ 2,612.4 $ 164.3 6.3
Operating Expenses by Object - Comparison to Prior Year (millions of $)
PG 36 2015 ANNUAL REPORT CITY OF EDMONTON FINANCIAL STATEMENT DISCUSSION AND ANALYSIS
2011 20132012 2014 2015$450
$650
$550
$750
$500
$700
$600
$800
(millions of $)
Capital Revenues - Comparison to Prior Years
$655
$736
$662
$488
$636
For financial statement reporting purposes capital revenues comprise government transfers, contributed tangible capital assets, developer and customer contributions and local improvement revenues. These revenue sources are approved by City Council as funding sources for capital projects through the capital budget process. The capital revenue is recognized in the same period the costs for construction of the asset are incurred.
Community services expenses include costs of operating the city recreation facilities as well as debt servicing and other operating costs related to the Quarters and Capital City Downtown Community Revitalization Levy. All other tax-supported debt servicing costs are within corporate administration, general municipal and other.
Community services cost increases were mainly related to operation of new facilities for the full year as well as debt servicing costs for Rogers Place Arena, which are funded through the Capital City Downtown Community Revitalization Levy.
Cost of arena land sold during the year created an increase in expenses for Land Enterprise. The decrease in Fleet services cost from prior year was due to the adjustment to the useful life of bus assets creating a one-time increase in amortization costs in 2014. Cost increases in corporate administration, general municipal and other were generally a result of additional personnel costs and debt servicing on tax-supported capital projects.
FINANCIAL STATEMENT DISCUSSION AND ANALYSIS 2015 ANNUAL REPORT CITY OF EDMONTON PG 37

Capital revenues increased from the prior year by $148.2 million, due to increases in contributed tangible capital assets of $165.8 million and developer and customer contributions of $34.8 million, partially offset by decreases in government transfers recognized of $43.4 million and local improvement revenues of $9.0 million. Contributed tangible capital assets increased from prior year as a result of continued expansion and growth of the city and therefore more developer contributed infrastructure assets such as roads, sidewalks and drainage infrastructure.
Capital developer and customer contributions were greater than prior year due to completion of projects by the end of the year therefore release of developer contributions being held in abeyance.
Government transfers were less when compared to 2014 due to major projects funded through government grants being substantially completed during 2014.
Operating revenues are higher than budget by $198.1 million, or 7.2 per cent of the revenue budget, primarily due to greater than budgeted investment earnings, net income from EPCOR, operating government transfers, and higher than expected land sales, included within user fees and sales. Ed Tel Endowment Fund earnings are not included in the budgeted investment earnings as they are not approved by City Council through the operating
budget process. Investment earnings were greater than budget due to better than expected returns and higher than budgeted fund balances. Government transfers were favourable compared to budget due to the Provincial City Transportation Fund grant of $18.2 million received by the City and applied as an operating contribution towards the 41 st Avenue/Queen Elizabeth II interchange construction.
comparison to budget
2015 2015 Budget Actual Variance $ Variance %
Taxation $ 1,346.0 $ 1,350.8 $ 4.8 0.4 User fees and sales 729.5 759.0 29.5 4.0 Subsidiary operations - EPCOR 209.4 259.7 50.3 24.0 Franchise fees 140.1 138.0 (2.1) (1.5)Investment earnings 33.7 133.9 100.2 297.3Government transfers - operating 102.3 120.5 18.2 17.8 Fines and penalties 88.2 85.7 (2.5) (2.8)Licenses and permits 84.7 81.2 (3.5) (4.1) Developer/ customer contributions - operating 7.1 10.3 3.2 45.1 Total $ 2,741.0 $ 2,939.1 $ 198.1 7.2
Operating Revenue - Comparison to Budget (millions of $)
PG 38 2015 ANNUAL REPORT CITY OF EDMONTON FINANCIAL STATEMENT DISCUSSION AND ANALYSIS
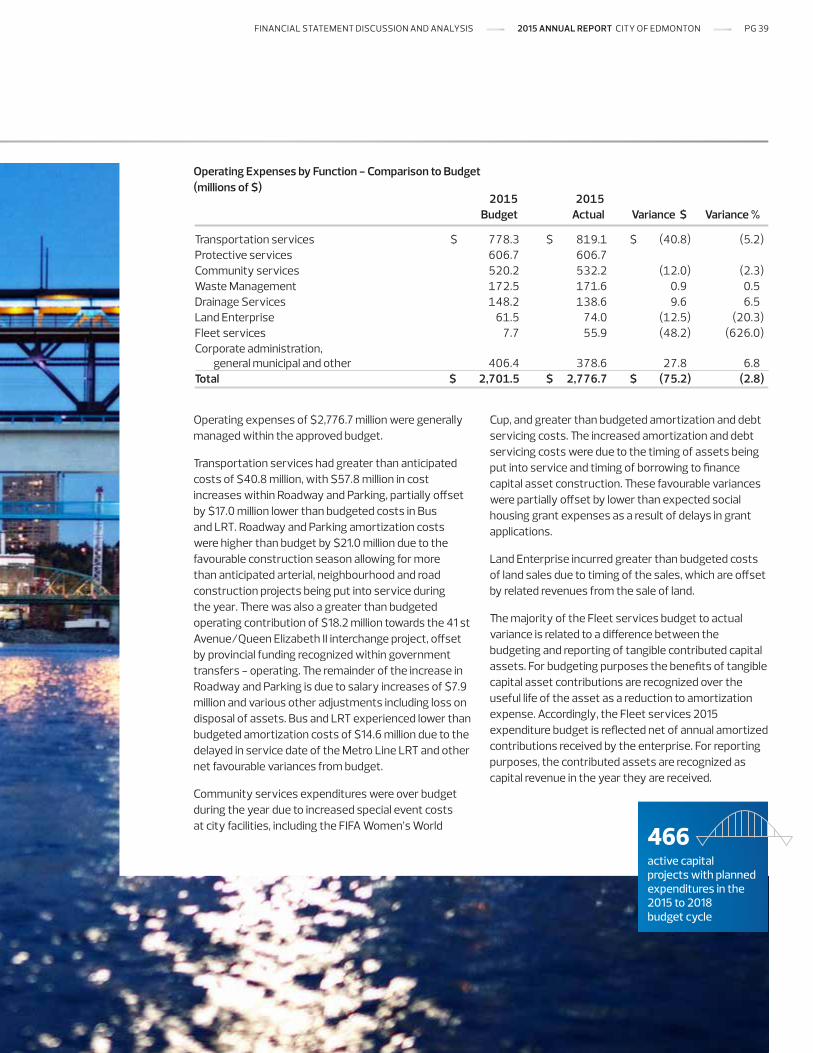
Operating expenses of $2,776.7 million were generally managed within the approved budget.
Transportation services had greater than anticipated costs of $40.8 million, with $57.8 million in cost increases within Roadway and Parking, partially offset by $17.0 million lower than budgeted costs in Bus and LRT. Roadway and Parking amortization costs were higher than budget by $21.0 million due to the favourable construction season allowing for more than anticipated arterial, neighbourhood and road construction projects being put into service during the year. There was also a greater than budgeted operating contribution of $18.2 million towards the 41 st Avenue/Queen Elizabeth II interchange project, offset by provincial funding recognized within government transfers - operating. The remainder of the increase in Roadway and Parking is due to salary increases of $7.9 million and various other adjustments including loss on disposal of assets. Bus and LRT experienced lower than budgeted amortization costs of $14.6 million due to the delayed in service date of the Metro Line LRT and other net favourable variances from budget.
Community services expenditures were over budget during the year due to increased special event costs at city facilities, including the FIFA Women’s World 466
active capital projects with planned expenditures in the 2015 to 2018 budget cycle
2015 2015 Budget Actual Variance $ Variance %
Transportation services $ 778.3 $ 819.1 $ (40.8) (5.2)Protective services 606.7 606.7 Community services 520.2 532.2 (12.0) (2.3)Waste Management 172.5 171.6 0.9 0.5 Drainage Services 148.2 138.6 9.6 6.5 Land Enterprise 61.5 74.0 (12.5) (20.3)Fleet services 7.7 55.9 (48.2) (626.0)Corporate administration, general municipal and other 406.4 378.6 27.8 6.8 Total $ 2,701.5 $ 2,776.7 $ (75.2) (2.8)
Operating Expenses by Function - Comparison to Budget (millions of $)
Cup, and greater than budgeted amortization and debt servicing costs. The increased amortization and debt servicing costs were due to the timing of assets being put into service and timing of borrowing to finance capital asset construction. These favourable variances were partially offset by lower than expected social housing grant expenses as a result of delays in grant applications.
Land Enterprise incurred greater than budgeted costs of land sales due to timing of the sales, which are offset by related revenues from the sale of land.
The majority of the Fleet services budget to actual variance is related to a difference between the budgeting and reporting of tangible contributed capital assets. For budgeting purposes the benefits of tangible capital asset contributions are recognized over the useful life of the asset as a reduction to amortization expense. Accordingly, the Fleet services 2015 expenditure budget is reflected net of annual amortized contributions received by the enterprise. For reporting purposes, the contributed assets are recognized as capital revenue in the year they are received.
FINANCIAL STATEMENT DISCUSSION AND ANALYSIS 2015 ANNUAL REPORT CITY OF EDMONTON PG 39
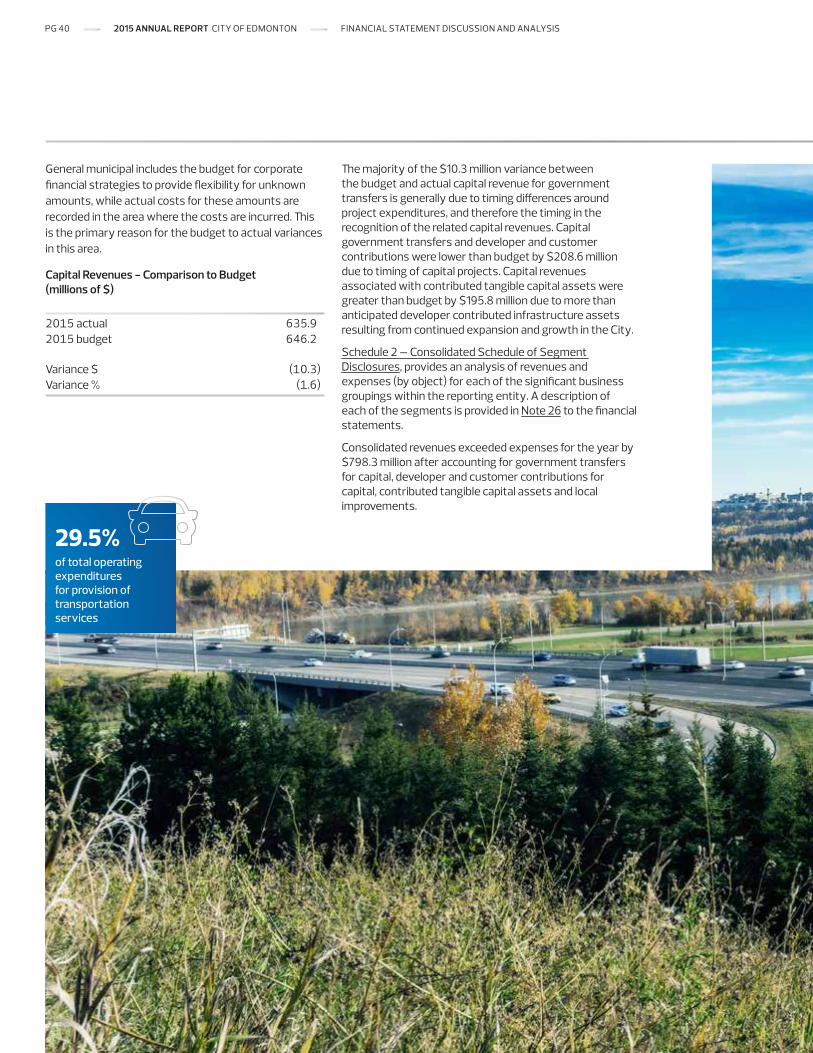
29.5%of total operating expenditures for provision of transportation services
General municipal includes the budget for corporate financial strategies to provide flexibility for unknown amounts, while actual costs for these amounts are recorded in the area where the costs are incurred. This is the primary reason for the budget to actual variances in this area.
Capital Revenues - Comparison to Budget (millions of $)
2015 actual 635.9 2015 budget 646.2 Variance $ (10.3)Variance % (1.6)
The majority of the $10.3 million variance between the budget and actual capital revenue for government transfers is generally due to timing differences around project expenditures, and therefore the timing in the recognition of the related capital revenues. Capital government transfers and developer and customer contributions were lower than budget by $208.6 million due to timing of capital projects. Capital revenues associated with contributed tangible capital assets were greater than budget by $195.8 million due to more than anticipated developer contributed infrastructure assets resulting from continued expansion and growth in the City.
Schedule 2 – Consolidated Schedule of Segment Disclosures, provides an analysis of revenues and expenses (by object) for each of the significant business groupings within the reporting entity. A description of each of the segments is provided in Note 26 to the financial statements.
Consolidated revenues exceeded expenses for the year by $798.3 million after accounting for government transfers for capital, developer and customer contributions for capital, contributed tangible capital assets and local improvements.
PG 40 2015 ANNUAL REPORT CITY OF EDMONTON FINANCIAL STATEMENT DISCUSSION AND ANALYSIS
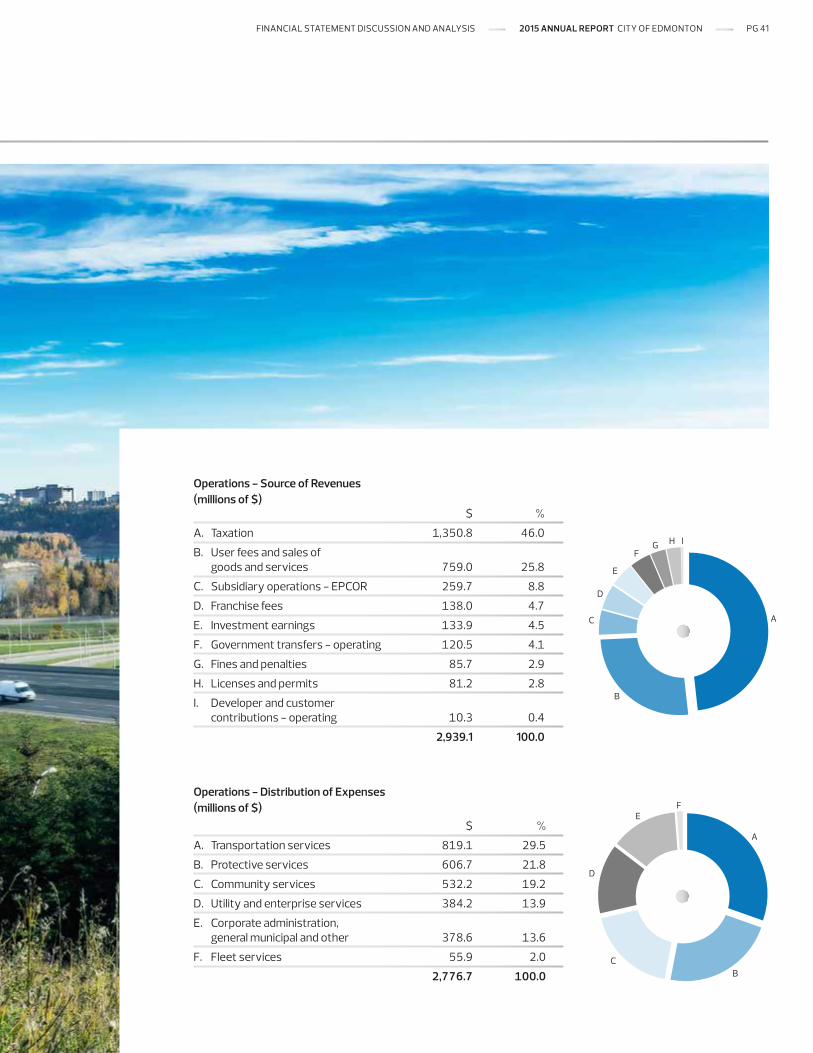
$ %
A. Taxation 1,350.8 46.0
B. User fees and sales of goods and services 759.0 25.8
C. Subsidiary operations - EPCOR 259.7 8.8
D. Franchise fees 138.0 4.7
E. Investment earnings 133.9 4.5
F. Government transfers - operating 120.5 4.1
G. Fines and penalties 85.7 2.9
H. Licenses and permits 81.2 2.8
I. Developer and customer contributions - operating 10.3 0.4
2,939.1 100.0
A
IHGF
E
D
C
B
Operations - Source of Revenues (millions of $)
A
FE
D
CB
$ %
A. Transportation services 819.1 29.5
B. Protective services 606.7 21.8
C. Community services 532.2 19.2
D. Utility and enterprise services 384.2 13.9
E. Corporate administration, general municipal and other 378.6 13.6
F. Fleet services 55.9 2.0
2,776.7 100.0
Operations - Distribution of Expenses (millions of $)
FINANCIAL STATEMENT DISCUSSION AND ANALYSIS 2015 ANNUAL REPORT CITY OF EDMONTON PG 41

responsible fiscal management
In July 2008, based on input provided from thousands of citizens, City Council approved The Way Ahead: City of Edmonton Strategic Plan 2009-2018. The Way Ahead establishes six 10-year strategic goals to achieve the City’s vision for Edmonton in 2040 and to direct long-term planning for the City of Edmonton. New issues, challenges, trends and opportunities will emerge throughout the 10-year life of the strategic plan. City Council monitors and reviews the plans and makes changes as necessary. Ongoing public involvement assists City Council with refining short-term priorities to meet changing economic situations and emerging needs. The Way Ahead was updated in 2014 and continues to be strengthened by adjusting to new opportunities and challenges that arise. City Council reviewed all six 10-year strategic goals in 2015 and revised the transportation goal to reflect the need to create a more integrated transportation system that offers greater travel choices for Edmontonians. City Council also approved corporate outcomes, measures and targets to make sure the City is on track to achieving the overall vision.
The six directional plans support The Way Ahead; The Way We Live, The Way We Green, The Way We Grow, The Way We Move, The Way We Prosper and The Way We Finance (collectively, The Ways). The Way We Live, Green, Grow, Move and Prosper are all approved. The Way We Finance – Edmonton’s Fiscal Sustainability Framework is still under development. The framework will outline how the City will ensure its continued sound fiscal and long-term financial sustainability. Edmonton’s Fiscal Sustainability Framework will build on the solid financial governance policies and practices currently in place, reaffirm what is still relevant and make recommendations on financial policies or strategies. The development of the framework involves an assessment of leading practice and research on several financial policy and strategy topics. White papers have been developed to provide a foundation for discussing the key financial issues and questions related to
debt, franchise fees, investments, user fees and property assessment and taxation. The white papers have been or are scheduled to be presented to City Council’s Executive Committee along with non-statuatory public hearings. Further information on Edmonton’s Fiscal Sustainability Framework, including the white papers, are available on the City’s website.
In order to continue improving planning for Edmonton’s future, the City has now implemented a multi-year operating budget, with opportunities to adjust the budget twice a year through operating budget adjustments approved by City Council. Multi-year budgeting provides more flexibility in how the City finances operations, as funding priorities can be reallocated across different years of the budget and net operating requirements can be assessed over a longer term allowing for more prudent and informed financial decision-making. City Council and Administration will be able to respond to broader economic changes in a responsible way, taking a longer view of Edmonton’s needs, while building stable program and service delivery. Semi-annual operating budget adjustments will accommodate changes in provincial or federal budgets, changes imposed by legislation, Council directed changes to priorities and operating impacts related to the implementation and completion of capital projects. Adjustments can also be made to the budget due to unforeseen changes to economic forecasts affecting costs, service demand volumes, or revenue projections. This multi-year approach allows the City to align strategy, business plans and operating and capital budgets to ensure the dollars are spent to achieve City Council’s vision. A multi-year operating budget also allows for better alignment with Councillor election terms, ultimately resulting in more informed, strategic and well-rounded financial decision making.
financial control and accountabilityThe City maintains the following processes to ensure appropriate financial controls and accountability are maintained and takes a proactive approach to identify and address financial challenges.
PG 42 2015 ANNUAL REPORT CITY OF EDMONTON FINANCIAL STATEMENT DISCUSSION AND ANALYSIS
The 10-year Capital Investment Agenda was updated in 2014. The Capital Investment Agenda (2015-2024) identifies the City’s 10-year capital needs and priorities for growth projects and investment targets for renewal based upon known funding sources, as well as the City’s financial capacity and debt position. It assists Council in making long-term strategic decisions on how to best allocate City resources to build and maintain the infrastructure requirements over the next decade. The 2015-2024 Capital Investment Agenda is available on the City’s website.
City Council’s utility fiscal policies govern the financial relationship between the City and each of the municipally owned or operated utilities. These policies require each utility to charge sufficient rates to recover all operating costs, repay capital debt and earn a return on the City’s equity investment. The policies also require the sanitary and stormwater drainage utilities to pay the City a franchise fee on utility revenue. The City’s waste management utility is exempt from paying a franchise fee to the City.
FINANCIAL STATEMENT DISCUSSION AND ANALYSIS 2015 ANNUAL REPORT CITY OF EDMONTON PG 43
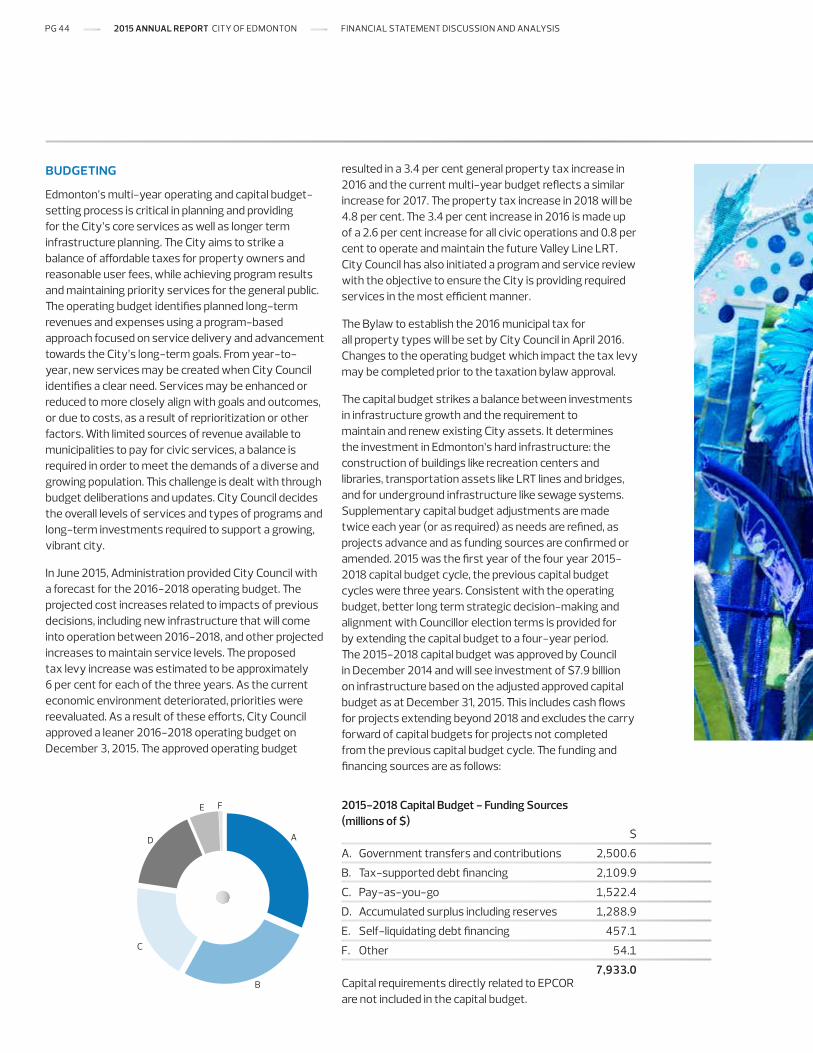
budgeting
Edmonton’s multi-year operating and capital budget-setting process is critical in planning and providing for the City’s core services as well as longer term infrastructure planning. The City aims to strike a balance of affordable taxes for property owners and reasonable user fees, while achieving program results and maintaining priority services for the general public. The operating budget identifies planned long-term revenues and expenses using a program-based approach focused on service delivery and advancement towards the City’s long-term goals. From year-to-year, new services may be created when City Council identifies a clear need. Services may be enhanced or reduced to more closely align with goals and outcomes, or due to costs, as a result of reprioritization or other factors. With limited sources of revenue available to municipalities to pay for civic services, a balance is required in order to meet the demands of a diverse and growing population. This challenge is dealt with through budget deliberations and updates. City Council decides the overall levels of services and types of programs and long-term investments required to support a growing, vibrant city.
In June 2015, Administration provided City Council with a forecast for the 2016-2018 operating budget. The projected cost increases related to impacts of previous decisions, including new infrastructure that will come into operation between 2016-2018, and other projected increases to maintain service levels. The proposed tax levy increase was estimated to be approximately 6 per cent for each of the three years. As the current economic environment deteriorated, priorities were reevaluated. As a result of these efforts, City Council approved a leaner 2016-2018 operating budget on December 3, 2015. The approved operating budget
resulted in a 3.4 per cent general property tax increase in 2016 and the current multi-year budget reflects a similar increase for 2017. The property tax increase in 2018 will be 4.8 per cent. The 3.4 per cent increase in 2016 is made up of a 2.6 per cent increase for all civic operations and 0.8 per cent to operate and maintain the future Valley Line LRT. City Council has also initiated a program and service review with the objective to ensure the City is providing required services in the most efficient manner.
The Bylaw to establish the 2016 municipal tax for all property types will be set by City Council in April 2016. Changes to the operating budget which impact the tax levy may be completed prior to the taxation bylaw approval.
The capital budget strikes a balance between investments in infrastructure growth and the requirement to maintain and renew existing City assets. It determines the investment in Edmonton’s hard infrastructure: the construction of buildings like recreation centers and libraries, transportation assets like LRT lines and bridges, and for underground infrastructure like sewage systems. Supplementary capital budget adjustments are made twice each year (or as required) as needs are refined, as projects advance and as funding sources are confirmed or amended. 2015 was the first year of the four year 2015-2018 capital budget cycle, the previous capital budget cycles were three years. Consistent with the operating budget, better long term strategic decision-making and alignment with Councillor election terms is provided for by extending the capital budget to a four-year period. The 2015-2018 capital budget was approved by Council in December 2014 and will see investment of $7.9 billion on infrastructure based on the adjusted approved capital budget as at December 31, 2015. This includes cash flows for projects extending beyond 2018 and excludes the carry forward of capital budgets for projects not completed from the previous capital budget cycle. The funding and financing sources are as follows:
A
FE
D
C
B
$
A. Government transfers and contributions 2,500.6
B. Tax-supported debt financing 2,109.9
C. Pay-as-you-go 1,522.4
D. Accumulated surplus including reserves 1,288.9
E. Self-liquidating debt financing 457.1
F. Other 54.1
7,933.0 Capital requirements directly related to EPCOR are not included in the capital budget.
2015-2018 Capital Budget - Funding Sources (millions of $)
PG 44 2015 ANNUAL REPORT CITY OF EDMONTON FINANCIAL STATEMENT DISCUSSION AND ANALYSIS
accounting and financial reporting
The City of Edmonton is organized into various business areas, each responsible for managing the delivery of program services in accordance with the resources allocated to those programs. The City currently utilizes a shared services model for financial services. All business areas reporting to the City Manager share a common accounting and reporting system, and financial and accounting services are administered within financial services and delivered to each business area based on their needs. In 2015 accounting and financial reporting functions were centralized in order to improve the quality and timeliness of financial reporting and increase accounting oversight and transactional consistency. The overall objective of centralization is to provide better financial decision-making.
The City of Edmonton Library Board, Edmonton Police Services, Waste RE-solutions Edmonton and Edmonton Combative Sports Commission utilize the same accounting system as the City but report through their own boards or commissions. EPCOR, Edmonton Economic Development Corporation, Non-Profit Housing Corporation and Fort Edmonton Management Company each have independent accounting systems and report through their respective boards.
Monthly operating financial performance reports for areas reporting to the City Manager are reviewed administratively, comparing year-to-date revenues and expenses as well as projections to the end of the fiscal year relative to annual budgets. Quarterly operating reporting is provided to City Council along with recommendations to address opportunities and
challenges. Capital reporting for second, third and fourth quarters is reviewed with City Council as well. Significant progress was made during the year towards integrating financial performance reporting within the capital and operating budget system, allowing for a more detailed and clear comparison of actual results to budgets.
Starting with the 2015 operating budget, the budget was also presented in a format consistent with its presentation in the audited annual financial statements. Significant adjustments reflected in the financial statement budget presentation required to adhere to PSAS were provided. The objective is to provide City Council and other users of the financial statements and budget documents an improved understanding of the budget approved by City Council compared to the actual results reported in the audited financial statements. This version of the annual budget was included for information as a part of the 2015 budget package and is available on the City’s website.
The City continues its commitment to compliance with public sector accounting standards as established by the PSAS board and in 2015 adopted PS3260 - Liability for Contaminated Sites, as discussed under Accounting and Reporting Changes. Details of future accounting standards and pronouncements are included in Note 1 to the financial statements.
$7.9 billioncapital budget from 2015 to 2018
FINANCIAL STATEMENT DISCUSSION AND ANALYSIS 2015 ANNUAL REPORT CITY OF EDMONTON PG 45
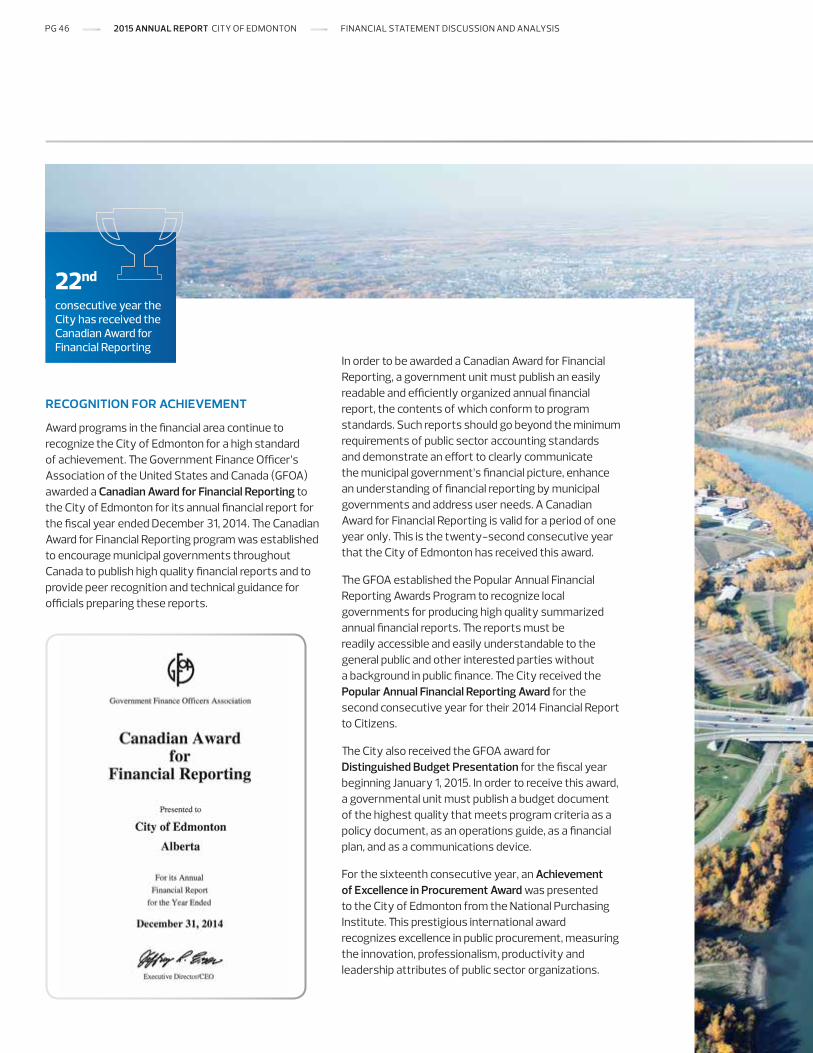
22nd
consecutive year the City has received the Canadian Award for Financial Reporting
recognition for achievement
Award programs in the financial area continue to recognize the City of Edmonton for a high standard of achievement. The Government Finance Officer’s Association of the United States and Canada (GFOA) awarded a Canadian Award for Financial Reporting to the City of Edmonton for its annual financial report for the fiscal year ended December 31, 2014. The Canadian Award for Financial Reporting program was established to encourage municipal governments throughout Canada to publish high quality financial reports and to provide peer recognition and technical guidance for officials preparing these reports.
In order to be awarded a Canadian Award for Financial Reporting, a government unit must publish an easily readable and efficiently organized annual financial report, the contents of which conform to program standards. Such reports should go beyond the minimum requirements of public sector accounting standards and demonstrate an effort to clearly communicate the municipal government’s financial picture, enhance an understanding of financial reporting by municipal governments and address user needs. A Canadian Award for Financial Reporting is valid for a period of one year only. This is the twenty-second consecutive year that the City of Edmonton has received this award.
The GFOA established the Popular Annual Financial Reporting Awards Program to recognize local governments for producing high quality summarized annual financial reports. The reports must be readily accessible and easily understandable to the general public and other interested parties without a background in public finance. The City received the Popular Annual Financial Reporting Award for the second consecutive year for their 2014 Financial Report to Citizens.
The City also received the GFOA award for Distinguished Budget Presentation for the fiscal year beginning January 1, 2015. In order to receive this award, a governmental unit must publish a budget document of the highest quality that meets program criteria as a policy document, as an operations guide, as a financial plan, and as a communications device.
For the sixteenth consecutive year, an Achievement of Excellence in Procurement Award was presented to the City of Edmonton from the National Purchasing Institute. This prestigious international award recognizes excellence in public procurement, measuring the innovation, professionalism, productivity and leadership attributes of public sector organizations.
PG 46 2015 ANNUAL REPORT CITY OF EDMONTON FINANCIAL STATEMENT DISCUSSION AND ANALYSIS
auditing process
The MGA requires municipal councils to appoint an independent auditor. In 2015, a tender for audit services was completed and City Council appointed the firm of KPMG LLP, Chartered Professional Accountants, as External Auditor for a five-year term. The auditor must report to City Council on the annual consolidated financial statements. External audits are also completed for the Provincial Financial Information Return and for each of the pension and benefit plans administered by the City. Certain government transfer programs also require external audit.
The City’s Audit Committee serves as a Committee of Council to assist in fulfilling its oversight responsibilities. Audit Committee is responsible for providing oversight and consideration of audit matters brought forward by the City Auditor and the External Auditor. The Committee includes the Mayor, four Councillors and two public members as outlined under Bylaw 16097, Audit Committee Bylaw. Audit Committee reviews the consolidated financial statements and makes a recommendation to City Council for the approval of the statements.
The City has an internal audit function independent of the City Administration. The Office of the City Auditor reports directly to City Council through Audit Committee, empowered by Bylaw 12424, City Auditor. This bylaw establishes the position of City Auditor and delegates powers, duties, and functions to this position. The City Auditor has two roles:
Agent of Change Role – to conduct proactive and forward looking projects based on the provision of strategic, risk and control-related consulting services to better serve the changing needs of the corporation and bring about improvement in program performance; and
Guardian Role – to conduct projects directed primarily towards providing assurance through review of existing operations, typically focusing on compliance, efficiency, effectiveness, economy and controls.
FINANCIAL STATEMENT DISCUSSION AND ANALYSIS 2015 ANNUAL REPORT CITY OF EDMONTON PG 47
long-term sustainability and risk managementThe City is committed to an integrated approach to risk management, as it is a critical component of the City’s long term sustainability. As with any municipality, there are constant pressures in providing services and service enhancements at a reasonable and affordable cost, balancing the investment between infrastructure growth and renewal projects and ensuring risks are properly managed. A number of strategies are in place or are being developed to mitigate risks faced by the City and to address the ongoing operating and capital funding gaps to ensure the long-term sustainability of the City. Integral to achieving financial sustainability is the continuing use of a comprehensive Enterprise Risk Management Framework. A number of risk management activities are undertaken on an ongoing basis across the corporation. A draft Enterprise Risk Management policy was presented to Audit Committee on February 19, 2016 and was approved by City Council on March 1, 2016. The policy ensures that enterprise risks are proactively evaluated, communicated and managed on an ongoing basis as per the policy.
A corporate Risk Management area provides risk management advice, claims adjusting, purchase of insurance and completes risk control inspections. Risk management analysis has also been embedded into the multi-year business planning process to enhance the level of awareness and transparency of risk.
Furthermore, environmental risks are monitored through internal City practices all of which aid in the effective management of environmental risks and responsibilities.
The City continues to monitor economic conditions and impacts on the City’s financial status so that strategies can be adjusted accordingly. For example, hedges are purchased for future fuel purchases when
deemed beneficial, in order to stabilize operating budgets in the face of fuel price fluctuations. Similarly, forward currency contracts are used to mitigate foreign exchange risk within the City’s foreign equity investments. Borrowing is completed through the Alberta Capital Finance Authority, which allows Alberta municipalities to borrow at interest rates which would not be available to municipalities acting independently. The interest rates are set for the term of the borrowing, therefore reducing risk associated with fluctuation.
The City also has a Financial Stabilization reserve which may be used to address emergent needs without impacting the City’s financial position in the long-term. A financial risk based review was completed for the City in 2015, identifying potential risks faced by the City and the probable financial cost of each risk. The review substantiated the minimum and target balances of the reserve established through City policy.
The City’s Debt Management Fiscal Policy enforces prudent management of debt and ensures debt is used responsibly without burdening the financial health and long-term sustainability of the City.
The first corporate Risk Register for The Way We Live was presented to Audit Committee on September 8, 2014, indicating the top ten key risks faced by the City. The current process is to update the register on an annual basis and present it to the Audit Committee for analysis and discussion.
Additionally, there is an ongoing proactive analysis of the physical, contractual and insurance risks associated with capital projects or major initiatives and appropriate measures are established to identify and control project risk. Recent examples of this practice can be seen with the Rogers Place arena construction and Valley Line LRT projects. In the case of the Rogers Place arena project, a Guaranteed Maximum Price agreement was established with the contractors in order to insulate the City from cost overruns. The Valley Line LRT is being developed with the construction, operation and maintenance provided through a public-private partnership (P3) delivery method, which shares risks between the City and its private partners.
With the current economic environment the city will face economic uncertainty for some time to come. The business plans, operating and capital budgets aim to balance the economic realities of our taxpayers with the need to continue providing services that ensure a great quality of life in Edmonton.
PG 48 2015 ANNUAL REPORT CITY OF EDMONTON FINANCIAL STATEMENT DISCUSSION AND ANALYSIS
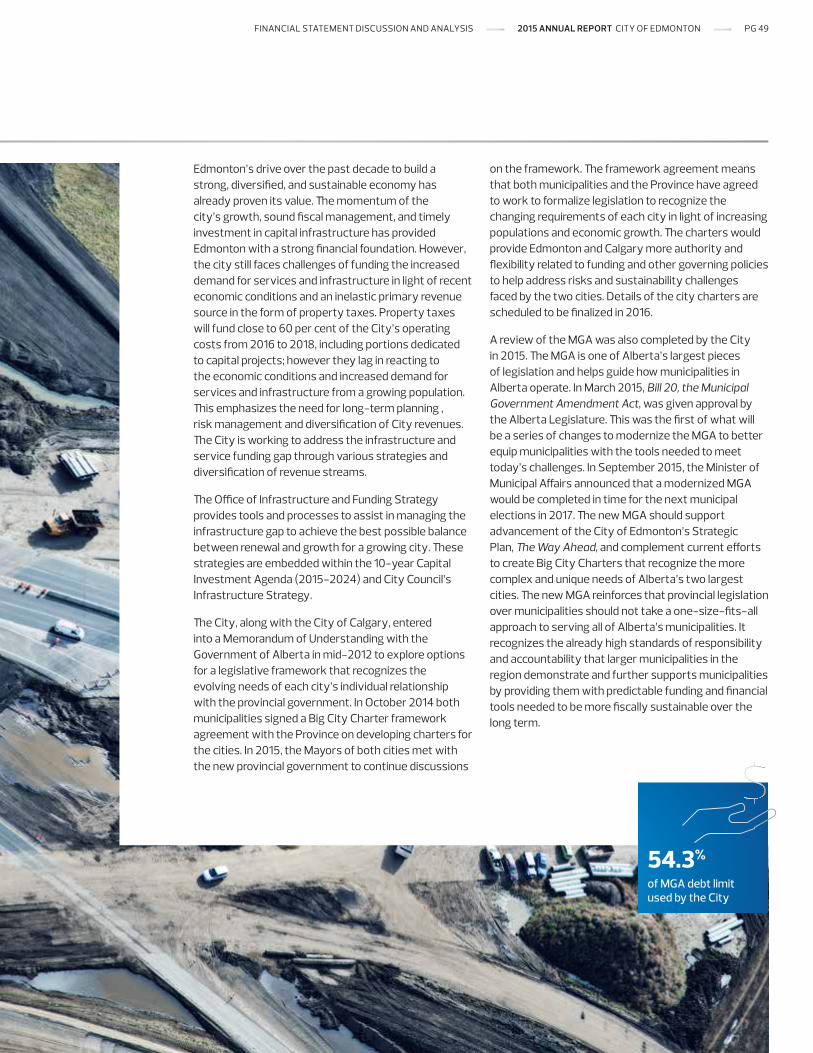
Edmonton’s drive over the past decade to build a strong, diversified, and sustainable economy has already proven its value. The momentum of the city’s growth, sound fiscal management, and timely investment in capital infrastructure has provided Edmonton with a strong financial foundation. However, the city still faces challenges of funding the increased demand for services and infrastructure in light of recent economic conditions and an inelastic primary revenue source in the form of property taxes. Property taxes will fund close to 60 per cent of the City’s operating costs from 2016 to 2018, including portions dedicated to capital projects; however they lag in reacting to the economic conditions and increased demand for services and infrastructure from a growing population. This emphasizes the need for long-term planning , risk management and diversification of City revenues. The City is working to address the infrastructure and service funding gap through various strategies and diversification of revenue streams.
The Office of Infrastructure and Funding Strategy provides tools and processes to assist in managing the infrastructure gap to achieve the best possible balance between renewal and growth for a growing city. These strategies are embedded within the 10-year Capital Investment Agenda (2015-2024) and City Council’s Infrastructure Strategy.
The City, along with the City of Calgary, entered into a Memorandum of Understanding with the Government of Alberta in mid-2012 to explore options for a legislative framework that recognizes the evolving needs of each city’s individual relationship with the provincial government. In October 2014 both municipalities signed a Big City Charter framework agreement with the Province on developing charters for the cities. In 2015, the Mayors of both cities met with the new provincial government to continue discussions
on the framework. The framework agreement means that both municipalities and the Province have agreed to work to formalize legislation to recognize the changing requirements of each city in light of increasing populations and economic growth. The charters would provide Edmonton and Calgary more authority and flexibility related to funding and other governing policies to help address risks and sustainability challenges faced by the two cities. Details of the city charters are scheduled to be finalized in 2016.
A review of the MGA was also completed by the City in 2015. The MGA is one of Alberta’s largest pieces of legislation and helps guide how municipalities in Alberta operate. In March 2015, Bill 20, the Municipal Government Amendment Act, was given approval by the Alberta Legislature. This was the first of what will be a series of changes to modernize the MGA to better equip municipalities with the tools needed to meet today’s challenges. In September 2015, the Minister of Municipal Affairs announced that a modernized MGA would be completed in time for the next municipal elections in 2017. The new MGA should support advancement of the City of Edmonton’s Strategic Plan, The Way Ahead, and complement current efforts to create Big City Charters that recognize the more complex and unique needs of Alberta’s two largest cities. The new MGA reinforces that provincial legislation over municipalities should not take a one-size-fits-all approach to serving all of Alberta’s municipalities. It recognizes the already high standards of responsibility and accountability that larger municipalities in the region demonstrate and further supports municipalities by providing them with predictable funding and financial tools needed to be more fiscally sustainable over the long term.
54.3%
of MGA debt limit used by the City
FINANCIAL STATEMENT DISCUSSION AND ANALYSIS 2015 ANNUAL REPORT CITY OF EDMONTON PG 49

PG 50 2015 ANNUAL REPORT CITY OF EDMONTON FINANCIAL STATEMENT DISCUSSION AND ANALYSIS
conclusion Edmonton has maintained its financial health through 2015 with a relatively strong economic performance when compared with the rest of the province and country. For the fourth consecutive year, Standard & Poor’s has provided the City of Edmonton a rating of AA+. This rating is the second-highest possible, and reflects the City’s strong financial and economical fundamentals. In August 2015, Standard & Poor’s revised their yearly outlook rating of the City of Edmonton from stable to negative. The revised outlook reflected Edmonton’s increasing debt burden, average budgetary performance and potential downgrade in future ratings due to the stalls in the provincial economy. However, the outlook rating also indicated that the city had a strong economy, very strong financial management and exceptional liquidity. The rating considered the management team to be experienced and qualified to effectively enact fiscal policies, as well as effectively respond to external risks. The City has a robust set of financial policies, management of debt and liquidity is prudent, and the business plans detail formal risk management strategies and policies. Debt has been used strategically to move priority capital projects ahead and to capitalize on low interest rates. Although debt levels are increasing, the debt and debt servicing costs remain well within both the legislated and City policy limits.
The recent economic fluctuations have reinforced the need to closely monitor the City’s financial results and to maintain flexibility in developing financial strategies. The City will continue to be challenged in managing emerging competing financial needs as the major center for the region, including finding a balance between maintaining existing services while addressing needs associated with the growth. City Council’s focus on longer-term planning as demonstrated by the multi-year approach to business plans and budgets will help the City position itself well for the future. Furthermore, The Way We Finance (Edmonton’s Fiscal Sustainability Framework) will outline guiding principles to ensure continued sound fiscal management and long-term financial sustainability.
Todd Burge, CPA, CMA Chief Financial Officer & Treasurer General Manager
April 19, 2016
FINANCIAL STATEMENT DISCUSSION AND ANALYSIS 2015 ANNUAL REPORT CITY OF EDMONTON PG 51
consolidated financial statements
PG 52 2015 ANNUAL REPORT CITY OF EDMONTON FINANCIAL STATEMENTS

FINANCIAL STATEMENTS 2015 ANNUAL REPORT CITY OF EDMONTON PG 53
management’s responsibility for financial reporting
Management of the City of Edmonton is responsible for the integrity of the accompanying consolidated financial statements and all other information within this Annual Report. The consolidated financial statements have been prepared by management in accordance with Canadian public sector accounting standards.
To assist in meeting its responsibility, management maintains appropriate systems of internal and administrative controls designed to provide reasonable assurance that transactions are appropriately authorized and accurately recorded, that assets are properly accounted for and safeguarded, and that financial information produced is relevant and reliable.
The preparation of the consolidated financial statements necessarily includes some amounts which are based on the best estimates and judgments of management. Financial data elsewhere in the Annual Report is consistent with that of the consolidated financial statements.
Prior to their submission to City Council, the consolidated financial statements have been reviewed and recommended for approval by the Audit Committee. The consolidated financial statements have been audited by the independent firm of KPMG LLP, Chartered Professional Accountants. Their report to the Mayor and City Council, stating the scope of their examination and opinion on the consolidated financial statements, follows.
Linda D.M. Cochrane City Manager
Todd Burge, CPA, CMA Chief Financial Officer & Treasurer General Manager Financial and Corporate Services
April 19, 2016 Edmonton, Canada
PG 54 2015 ANNUAL REPORT CITY OF EDMONTON FINANCIAL STATEMENTS

independent auditors’ report
to his worship the mayor and members of council of the city of edmonton
We have audited the accompanying consolidated financial statements of the City of Edmonton (the City), which comprise the consolidated statement of financial position as at December 31, 2015, the consolidated statements of operations and accumulated surplus, changes in net financial assets, and cash flows for the year then ended, and notes, comprising a summary of significant accounting policies and other explanatory information.
management’s responsibility for the financial statements
Management is responsible for the preparation and fair presentation of these consolidated financial statements in accordance with Canadian public sector accounting standards, and for such internal control as management determines is necessary to enable the preparation of consolidated financial statements that are free from material misstatement, whether due to fraud or error.
auditors’ responsibility
Our responsibility is to express an opinion on these consolidated financial statements based on our audit. We conducted our audit in accordance with Canadian generally accepted auditing standards. Those standards require that we comply with ethical requirements and plan and perform the audit to obtain reasonable assurance about whether the consolidated financial statements are free from material misstatement.
An audit involves performing procedures to obtain audit evidence about the amounts and disclosures in the consolidated financial statements. The procedures selected depend on our judgment, including the assessment of the risks of material misstatement of the consolidated financial statements, whether due to fraud or error. In making those risk assessments, we consider internal control relevant to the entity’s preparation and fair presentation of the consolidated financial statements in order to design audit procedures that are appropriate in the circumstances, but not for the purpose of expressing an opinion on the effectiveness of the entity’s internal control. An audit also includes evaluating the appropriateness of accounting policies used and the reasonableness of accounting estimates made by management, as well as evaluating the overall presentation of the consolidated financial statements.
We believe that the audit evidence we have obtained is sufficient and appropriate to provide a basis for our audit opinion.
opinion
In our opinion, the consolidated financial statements present fairly, in all material respects the consolidated financial position of the City as at December 31, 2015, and the consolidated results of its operations, consolidated changes in its net financial assets, and its consolidated cash flows for the year then ended in accordance with Canadian public sector accounting standards.
Chartered Professional Accountants April 19, 2016 Edmonton, Canada
FINANCIAL STATEMENTS 2015 ANNUAL REPORT CITY OF EDMONTON PG 55
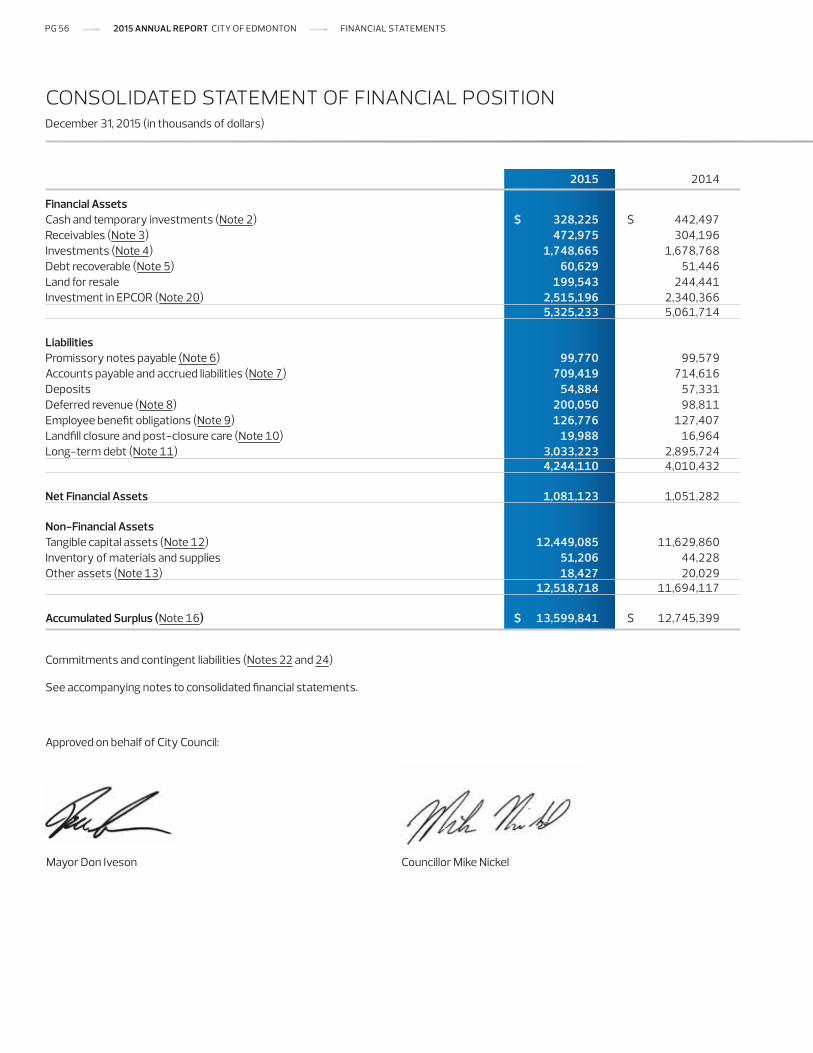
December 31, 2015 (in thousands of dollars)
consolidated statement of financial position
Commitments and contingent liabilities (Notes 22 and 24)
See accompanying notes to consolidated financial statements.
Approved on behalf of City Council:
Councillor Mike NickelMayor Don Iveson
2015 2014 Financial AssetsCash and temporary investments (Note 2) $ 328,225 $ 442,497Receivables (Note 3) 472,975 304,196Investments (Note 4) 1,748,665 1,678,768Debt recoverable (Note 5) 60,629 51,446Land for resale 199,543 244,441Investment in EPCOR (Note 20) 2,515,196 2,340,366 5,325,233 5,061,714
LiabilitiesPromissory notes payable (Note 6) 99,770 99,579Accounts payable and accrued liabilities (Note 7) 709,419 714,616Deposits 54,884 57,331Deferred revenue (Note 8) 200,050 98,811Employee benefit obligations (Note 9) 126,776 127,407Landfill closure and post-closure care (Note 10) 19,988 16,964Long-term debt (Note 11) 3,033,223 2,895,724 4,244,110 4,010,432
Net Financial Assets 1,081,123 1,051,282
Non-Financial AssetsTangible capital assets (Note 12) 12,449,085 11,629,860Inventory of materials and supplies 51,206 44,228Other assets (Note 13) 18,427 20,029 12,518,718 11,694,117
Accumulated Surplus (Note 16) $ 13,599,841 $ 12,745,399
PG 56 2015 ANNUAL REPORT CITY OF EDMONTON FINANCIAL STATEMENTS
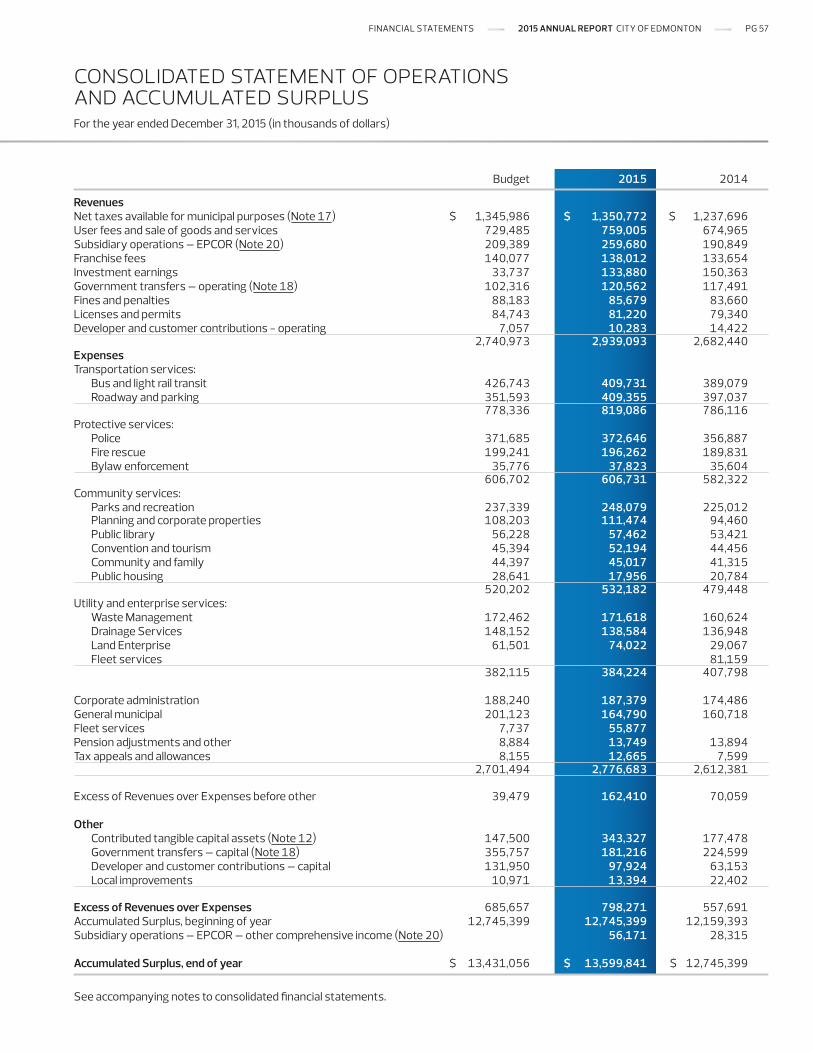
For the year ended December 31, 2015 (in thousands of dollars)
consolidated statement of operations and accumulated surplus
Budget 2015 2014 RevenuesNet taxes available for municipal purposes (Note 17) $ 1,345,986 $ 1,350,772 $ 1,237,696User fees and sale of goods and services 729,485 759,005 674,965Subsidiary operations – EPCOR (Note 20) 209,389 259,680 190,849Franchise fees 140,077 138,012 133,654Investment earnings 33,737 133,880 150,363Government transfers – operating (Note 18) 102,316 120,562 117,491Fines and penalties 88,183 85,679 83,660Licenses and permits 84,743 81,220 79,340Developer and customer contributions - operating 7,057 10,283 14,422 2,740,973 2,939,093 2,682,440Expenses Transportation services: Bus and light rail transit 426,743 409,731 389,079 Roadway and parking 351,593 409,355 397,037 778,336 819,086 786,116Protective services: Police 371,685 372,646 356,887 Fire rescue 199,241 196,262 189,831 Bylaw enforcement 35,776 37,823 35,604 606,702 606,731 582,322Community services: Parks and recreation 237,339 248,079 225,012 Planning and corporate properties 108,203 111,474 94,460 Public library 56,228 57,462 53,421 Convention and tourism 45,394 52,194 44,456 Community and family 44,397 45,017 41,315 Public housing 28,641 17,956 20,784 520,202 532,182 479,448Utility and enterprise services: Waste Management 172,462 171,618 160,624 Drainage Services 148,152 138,584 136,948 Land Enterprise 61,501 74,022 29,067 Fleet services 81,159 382,115 384,224 407,798
Corporate administration 188,240 187,379 174,486General municipal 201,123 164,790 160,718Fleet services 7,737 55,877 Pension adjustments and other 8,884 13,749 13,894Tax appeals and allowances 8,155 12,665 7,599 2,701,494 2,776,683 2,612,381
Excess of Revenues over Expenses before other 39,479 162,410 70,059
Other Contributed tangible capital assets (Note 12) 147,500 343,327 177,478 Government transfers – capital (Note 18) 355,757 181,216 224,599 Developer and customer contributions – capital 131,950 97,924 63,153 Local improvements 10,971 13,394 22,402
Excess of Revenues over Expenses 685,657 798,271 557,691Accumulated Surplus, beginning of year 12,745,399 12,745,399 12,159,393Subsidiary operations – EPCOR – other comprehensive income (Note 20) 56,171 28,315
Accumulated Surplus, end of year $ 13,431,056 $ 13,599,841 $ 12,745,399
See accompanying notes to consolidated financial statements.
FINANCIAL STATEMENTS 2015 ANNUAL REPORT CITY OF EDMONTON PG 57
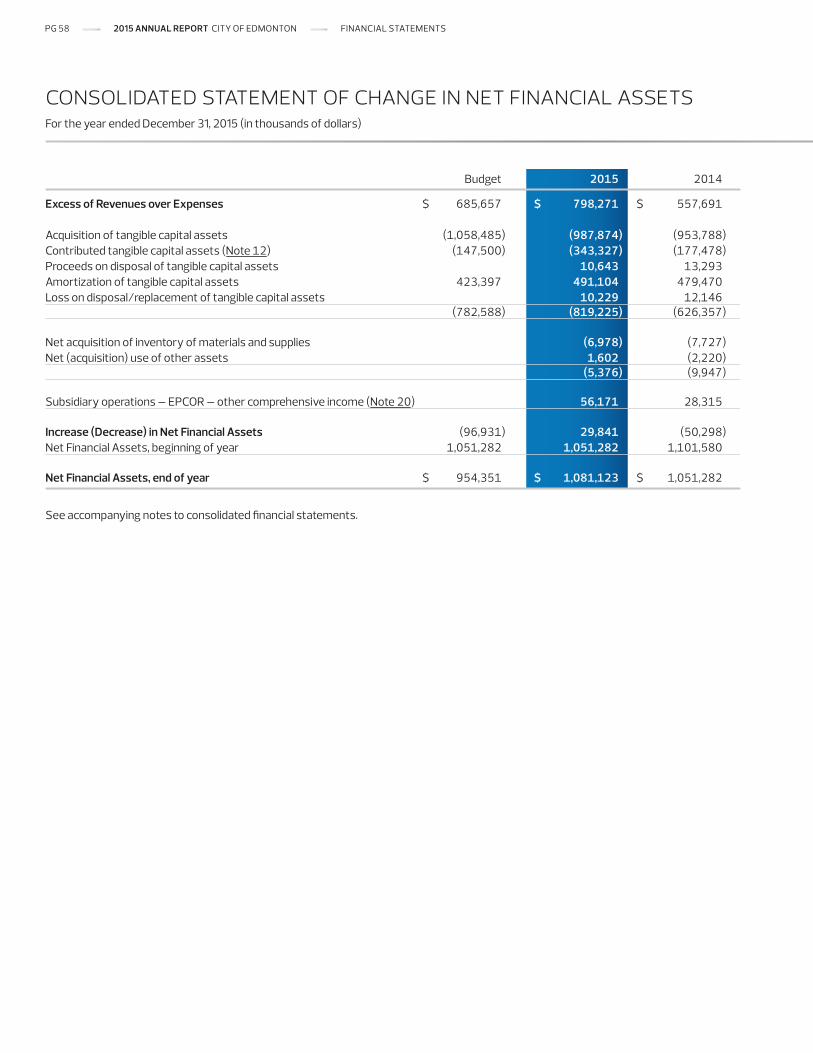
For the year ended December 31, 2015 (in thousands of dollars)
consolidated statement of change in net financial assets
Budget 2015 2014 Excess of Revenues over Expenses $ 685,657 $ 798,271 $ 557,691
Acquisition of tangible capital assets (1,058,485) (987,874) (953,788)Contributed tangible capital assets (Note 12) (147,500) (343,327) (177,478)Proceeds on disposal of tangible capital assets 10,643 13,293Amortization of tangible capital assets 423,397 491,104 479,470Loss on disposal/replacement of tangible capital assets 10,229 12,146 (782,588) (819,225) (626,357)
Net acquisition of inventory of materials and supplies (6,978) (7,727)Net (acquisition) use of other assets 1,602 (2,220) (5,376) (9,947) Subsidiary operations – EPCOR – other comprehensive income (Note 20) 56,171 28,315 Increase (Decrease) in Net Financial Assets (96,931) 29,841 (50,298)Net Financial Assets, beginning of year 1,051,282 1,051,282 1,101,580
Net Financial Assets, end of year $ 954,351 $ 1,081,123 $ 1,051,282
See accompanying notes to consolidated financial statements.
PG 58 2015 ANNUAL REPORT CITY OF EDMONTON FINANCIAL STATEMENTS
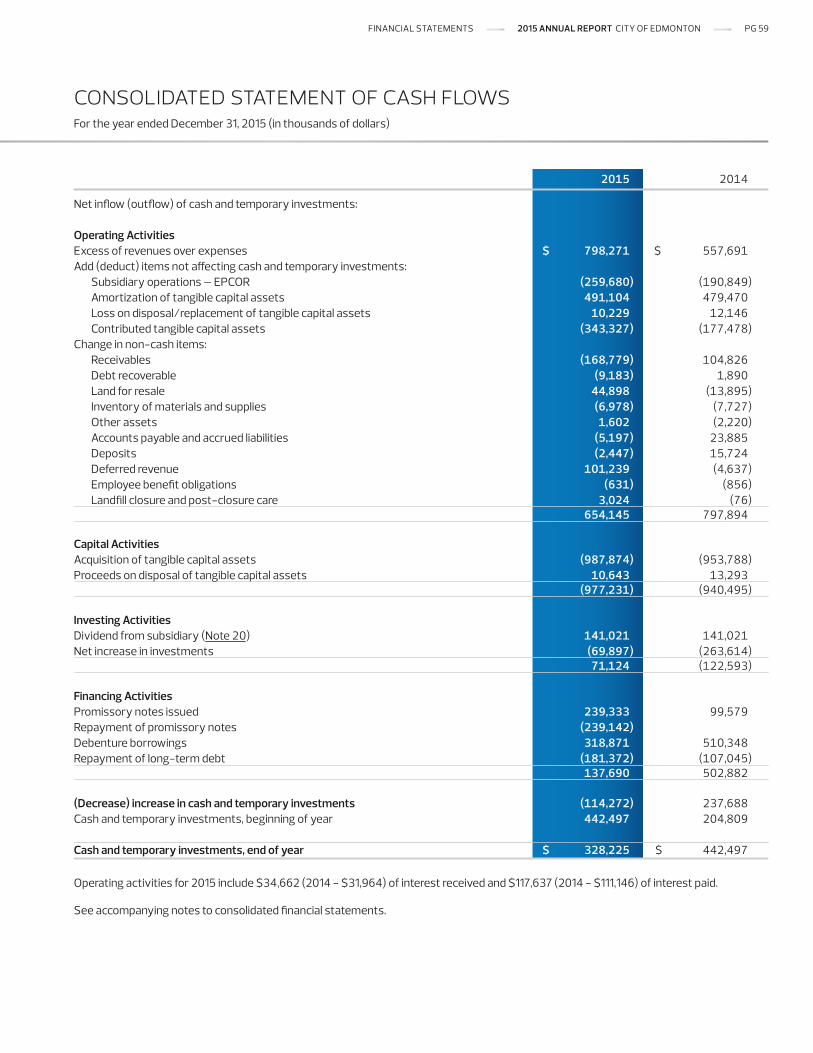
For the year ended December 31, 2015 (in thousands of dollars)
consolidated statement of cash flows
Operating activities for 2015 include $34,662 (2014 - $31,964) of interest received and $117,637 (2014 - $111,146) of interest paid.
See accompanying notes to consolidated financial statements.
2015 2014 Net inflow (outflow) of cash and temporary investments:
Operating ActivitiesExcess of revenues over expenses $ 798,271 $ 557,691Add (deduct) items not affecting cash and temporary investments: Subsidiary operations – EPCOR (259,680) (190,849) Amortization of tangible capital assets 491,104 479,470 Loss on disposal/replacement of tangible capital assets 10,229 12,146 Contributed tangible capital assets (343,327) (177,478)Change in non-cash items: Receivables (168,779) 104,826 Debt recoverable (9,183) 1,890 Land for resale 44,898 (13,895) Inventory of materials and supplies (6,978) (7,727) Other assets 1,602 (2,220) Accounts payable and accrued liabilities (5,197) 23,885 Deposits (2,447) 15,724 Deferred revenue 101,239 (4,637) Employee benefit obligations (631) (856) Landfill closure and post-closure care 3,024 (76) 654,145 797,894 Capital ActivitiesAcquisition of tangible capital assets (987,874) (953,788)Proceeds on disposal of tangible capital assets 10,643 13,293 (977,231) (940,495)
Investing Activities Dividend from subsidiary (Note 20) 141,021 141,021Net increase in investments (69,897) (263,614) 71,124 (122,593)
Financing Activities Promissory notes issued 239,333 99,579Repayment of promissory notes (239,142) Debenture borrowings 318,871 510,348Repayment of long-term debt (181,372) (107,045) 137,690 502,882
(Decrease) increase in cash and temporary investments (114,272) 237,688Cash and temporary investments, beginning of year 442,497 204,809
Cash and temporary investments, end of year $ 328,225 $ 442,497
FINANCIAL STATEMENTS 2015 ANNUAL REPORT CITY OF EDMONTON PG 59
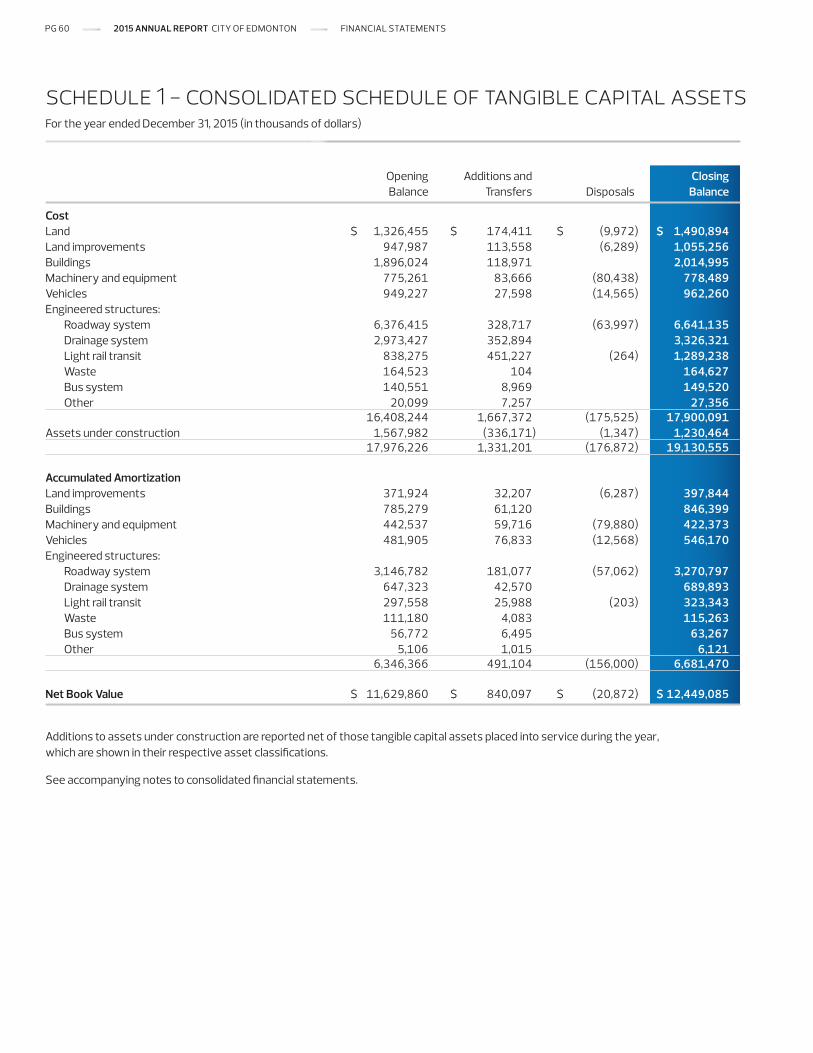
For the year ended December 31, 2015 (in thousands of dollars)
schedule 1 - consolidated schedule of tangible capital assets
Additions to assets under construction are reported net of those tangible capital assets placed into service during the year, which are shown in their respective asset classifications.
See accompanying notes to consolidated financial statements.
Opening Additions and Closing Balance Transfers Disposals Balance CostLand $ 1,326,455 $ 174,411 $ (9,972) $ 1,490,894Land improvements 947,987 113,558 (6,289) 1,055,256Buildings 1,896,024 118,971 2,014,995Machinery and equipment 775,261 83,666 (80,438) 778,489Vehicles 949,227 27,598 (14,565) 962,260Engineered structures: Roadway system 6,376,415 328,717 (63,997) 6,641,135 Drainage system 2,973,427 352,894 3,326,321 Light rail transit 838,275 451,227 (264) 1,289,238 Waste 164,523 104 164,627 Bus system 140,551 8,969 149,520 Other 20,099 7,257 27,356 16,408,244 1,667,372 (175,525) 17,900,091Assets under construction 1,567,982 (336,171) (1,347) 1,230,464 17,976,226 1,331,201 (176,872) 19,130,555 Accumulated AmortizationLand improvements 371,924 32,207 (6,287) 397,844Buildings 785,279 61,120 846,399Machinery and equipment 442,537 59,716 (79,880) 422,373Vehicles 481,905 76,833 (12,568) 546,170Engineered structures: Roadway system 3,146,782 181,077 (57,062) 3,270,797 Drainage system 647,323 42,570 689,893 Light rail transit 297,558 25,988 (203) 323,343 Waste 111,180 4,083 115,263 Bus system 56,772 6,495 63,267 Other 5,106 1,015 6,121 6,346,366 491,104 (156,000) 6,681,470 Net Book Value $ 11,629,860 $ 840,097 $ (20,872) $ 12,449,085
PG 60 2015 ANNUAL REPORT CITY OF EDMONTON FINANCIAL STATEMENTS
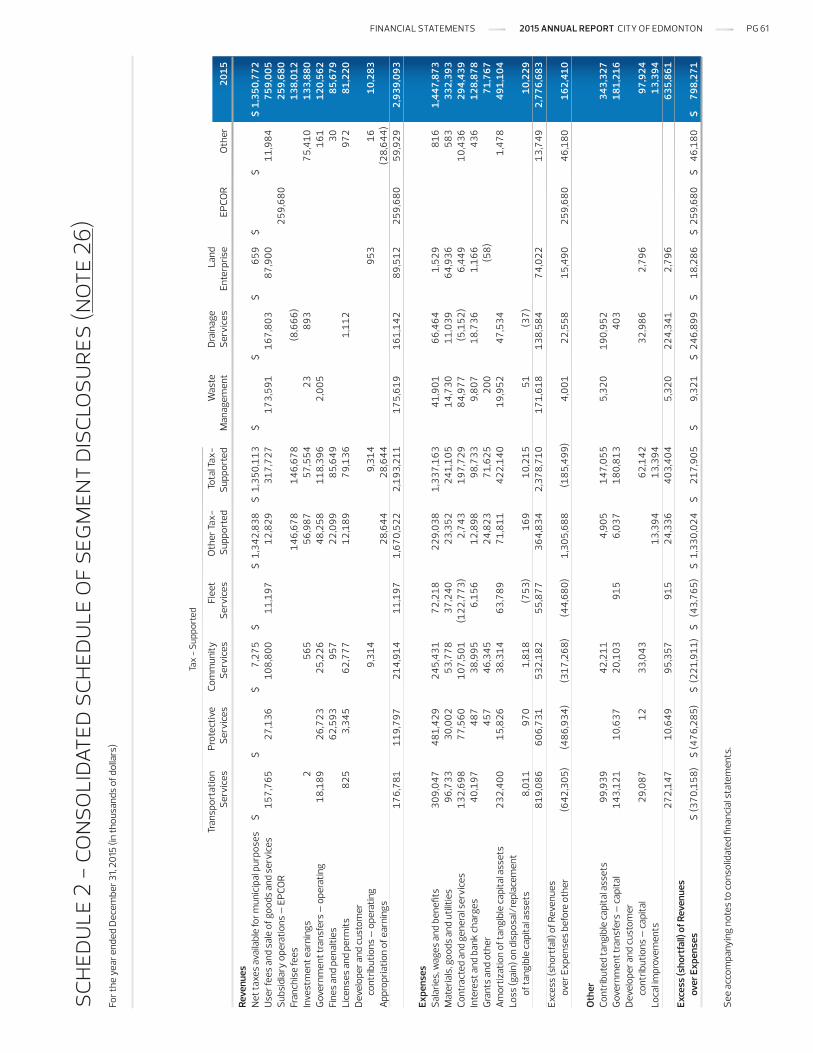
For t
he y
ear e
nded
Dec
embe
r 31,
2015
(in
thou
sand
s of
dol
lars
)
sche
dule
2 -
co
nso
lida
ted
sche
dule
of
segm
ent
disc
losu
res
(not
e 26
)
See
acco
mpa
nyin
g no
tes
to c
onso
lidat
ed fi
nanc
ial s
tate
men
ts.
Tran
spor
tatio
n
Prot
ectiv
e Co
mm
unity
Fl
eet
Oth
er Ta
x-
Tota
l Tax
- W
aste
D
rain
age
Land
Serv
ices
Se
rvic
es
Serv
ices
Se
rvic
es
Supp
orte
d Su
ppor
ted
Man
agem
ent
Serv
ices
En
terp
rise
EP
COR
Oth
er
2015
Reve
nues
Net
taxe
s av
aila
ble
for m
unic
ipal
pur
pose
s $
$
$ 7
,275
$
$ 1
,342
,838
$
1,3
50,1
13
$
$
$
659
$
$
$ 1,
350,
772
Use
r fee
s an
d sa
le o
f goo
ds a
nd s
ervi
ces
15
7,76
5
27,1
36
10
8,80
0
11,1
97
12
,829
317
,727
173,
591
16
7,80
3
87,9
00
11
,984
759,
005
Subs
idia
ry o
pera
tions
– E
PCO
R
259,
680
25
9,68
0Fr
anch
ise
fees
146,
678
14
6,67
8
(8,6
66)
13
8,01
2In
vest
men
t ear
ning
s
2
565
56
,987
57,5
54
23
893
75
,410
133,
880
Gov
ernm
ent t
rans
fers
– o
pera
ting
18,1
89
26
,723
25,2
26
48
,258
118,
396
2,
005
16
1
120,
562
Fine
s an
d pe
nalti
es
62
,593
957
22
,099
85,6
49
30
85,6
79Li
cens
es a
nd p
erm
its
82
5
3,34
5
62,7
77
12
,189
79,1
36
1,
112
97
2
81,2
20D
evel
oper
and
cus
tom
er
co
ntrib
utio
ns –
ope
ratin
g
9,31
4
9,31
4
953
16
10,2
83Ap
prop
riatio
n of
ear
ning
s
28,6
44
28
,644
(28,
644)
17
6,78
1
119,
797
21
4,91
4
11,1
97
1,
670,
522
2,
193,
211
17
5,61
9
161,
142
89
,512
259,
680
59
,929
2
,939
,093
Expe
nses
Sala
ries,
wag
es a
nd b
enefi
ts
30
9,04
7
481,
429
24
5,43
1
72,2
18
22
9,03
8
1,33
7,16
3
41,9
01
66
,464
1,52
9
816
1,4
47,8
73M
ater
ials
, goo
ds a
nd u
tiliti
es
96
,733
30,0
02
53
,778
37,2
40
23
,352
241,
105
14
,730
11,0
39
64
,936
583
33
2,39
3Co
ntra
cted
and
gen
eral
ser
vice
s
132,
698
77
,560
107,
501
(12
2,77
3)
2,
743
19
7,72
9
84,9
77
(5
,152
)
6,44
9
10,4
36
29
4,43
9In
tere
st a
nd b
ank
char
ges
40
,197
487
38
,995
6,15
6
12,8
98
98
,733
9,80
7
18,7
36
1,
166
43
6
128,
878
Gra
nts
and
othe
r
457
46
,345
24,8
23
71
,625
200
(5
8)
71
,767
Amor
tizat
ion
of ta
ngib
le c
apita
l ass
ets
23
2,40
0
15,8
26
38
,314
63,7
89
71
,811
422,
140
19
,952
47,5
34
1,
478
49
1,10
4Lo
ss (g
ain)
on
disp
osal
/rep
lace
men
t
of ta
ngib
le c
apita
l ass
ets
8,
011
97
0
1,8
18
(7
53)
16
9
10,2
15
51
(37)
10,2
29
819,
086
60
6,73
1
532,
182
55
,877
364,
834
2,
378,
710
17
1,61
8
138,
584
74
,022
13,7
49
2,7
76,6
83Ex
cess
(sho
rtfa
ll) o
f Rev
enue
s
over
Exp
ense
s be
fore
oth
er
(64
2,30
5)
(48
6,93
4)
(3
17,2
68)
(4
4,68
0)
1,
305,
688
(1
85,4
99)
4,
001
22
,558
15,4
90
25
9,68
0
46,1
80
16
2,41
0
Oth
erCo
ntrib
uted
tang
ible
cap
ital a
sset
s
99,9
39
42
,211
4,90
5
147,
055
5,
320
19
0,95
2
343,
327
Gov
ernm
ent t
rans
fers
– c
apita
l
143,
121
10
,637
20,1
03
91
5
6,03
7
180,
813
40
3
181,
216
Dev
elop
er a
nd c
usto
mer
cont
ribut
ions
– c
apita
l
29,0
87
12
33,0
43
62
,142
32,9
86
2,
796
97
,924
Loca
l impr
ovem
ents
13,3
94
13
,394
13,3
94
272,
147
10
,649
95,3
57
91
5
24,3
36
40
3,40
4
5,32
0
224,
341
2,
796
63
5,86
1Ex
cess
(sho
rtfa
ll) o
f Rev
enue
s
over
Exp
ense
s $
(370
,158
) $
(476
,285
) $
(221
,911
) $
(43
,765
) $
1,33
0,02
4 $
217,
905
$ 9
,321
$
246,
899
$ 18
,286
$
259,
680
$ 4
6,18
0 $
798,
271
Tax
- Su
ppor
ted
FINANCIAL STATEMENTS 2015 ANNUAL REPORT CITY OF EDMONTON PG 61
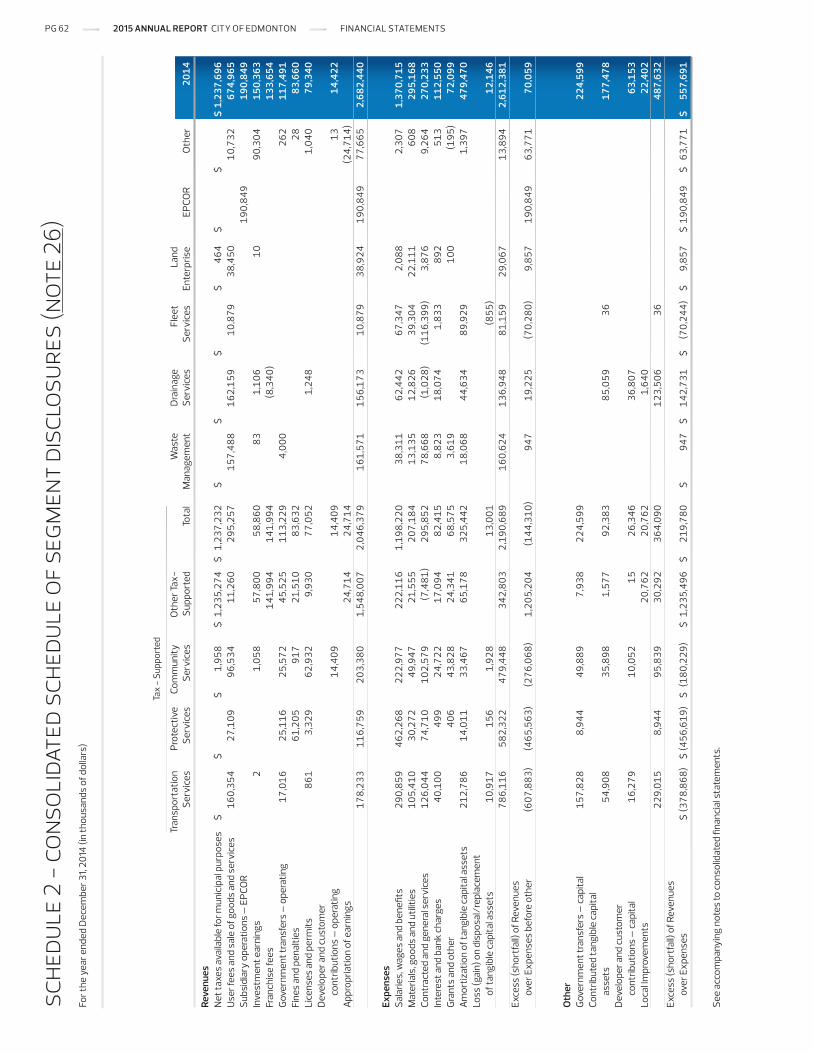
For t
he y
ear e
nded
Dec
embe
r 31,
2014
(in
thou
sand
s of
dol
lars
)
sche
dule
2 -
co
nso
lida
ted
sche
dule
of
segm
ent
disc
losu
res
(not
e 26
)
See
acco
mpa
nyin
g no
tes
to c
onso
lidat
ed fi
nanc
ial s
tate
men
ts.
Tran
spor
tatio
n
Prot
ectiv
e Co
mm
unity
O
ther
Tax-
Was
te
Dra
inag
e Fl
eet
Land
Serv
ices
Se
rvic
es
Serv
ices
Su
ppor
ted
Tota
l M
anag
emen
t Se
rvic
es
Serv
ices
En
terp
rise
EP
COR
Oth
er
2014
Reve
nues
Net
taxe
s av
aila
ble
for m
unic
ipal
pur
pose
s $
$
$ 1
,958
$
1,23
5,27
4 $
1,2
37,2
32
$
$
$
$
464
$
$
$ 1,
237,
696
Use
r fee
s an
d sa
le o
f goo
ds a
nd s
ervi
ces
16
0,35
4
27,1
09
96
,534
11,2
60
29
5,25
7
157,
488
16
2,15
9
10,8
79
38
,450
10,7
32
67
4,96
5Su
bsid
iary
ope
ratio
ns –
EPC
OR
190
,849
190,
849
Inve
stm
ent e
arni
ngs
2
1,
058
57
,800
58,8
60
83
1,10
6
10
90
,304
150,
363
Fran
chis
e fe
es
14
1,99
4
141,
994
(8
,340
)
133,
654
Gov
ernm
ent t
rans
fers
– o
pera
ting
17
,016
25,1
16
25
,572
45,5
25
11
3,22
9
4,00
0
262
11
7,49
1Fi
nes
and
pena
lties
61,2
05
91
7
21,5
10
83
,632
28
83
,660
Lice
nses
and
per
mits
861
3,
329
62
,932
9,93
0
77,0
52
1,
248
1,
040
79
,340
Dev
elop
er a
nd c
usto
mer
co
ntrib
utio
ns –
ope
ratin
g
14,4
09
14
,409
13
14
,422
Appr
opria
tion
of e
arni
ngs
24
,714
24,7
14
(24
,714
)
17
8,23
3
116,
759
20
3,38
0
1,54
8,00
7
2,04
6,37
9
161,
571
15
6,17
3
10,8
79
38
,924
1
90,8
49
77
,665
2
,682
,440
Expe
nses
Sala
ries,
wag
es a
nd b
enefi
ts
29
0,85
9
462,
268
22
2,97
7
222,
116
1,
198,
220
38
,311
62,4
42
67
,347
2,08
8
2,30
7 1
,370
,715
Mat
eria
ls, g
oods
and
util
ities
105,
410
30
,272
49,9
47
21
,555
207,
184
13
,135
12,8
26
39
,304
22,1
11
60
8
295,
168
Cont
ract
ed a
nd g
ener
al s
ervi
ces
12
6,04
4
74,7
10
10
2,57
9
(7,4
81)
29
5,85
2
78,6
68
(1
,028
)
(116
,399
)
3,87
6
9,26
4
270,
233
Inte
rest
and
ban
k ch
arge
s
40,1
00
49
9
24,7
22
17
,094
82,4
15
8,
823
18
,074
1,83
3
892
51
3
112,
550
Gra
nts
and
othe
r
406
43
,828
24,3
41
68
,575
3,61
9
100
(1
95)
72
,099
Amor
tizat
ion
of ta
ngib
le c
apita
l ass
ets
21
2,78
6
14,0
11
33
,467
65,1
78
32
5,44
2
18,0
68
44
,634
89,9
29
1,
397
47
9,47
0Lo
ss (g
ain)
on
disp
osal
/rep
lace
men
t
of ta
ngib
le c
apita
l ass
ets
10
,917
156
1
,928
13,0
01
(8
55)
12
,146
78
6,11
6
582,
322
47
9,44
8
342,
803
2,
190,
689
16
0,62
4
136,
948
81
,159
29,0
67
13
,894
2
,612
,381
Exce
ss (s
hort
fall)
of R
even
ues
ov
er E
xpen
ses
befo
re o
ther
(
607,
883)
(
465,
563)
(276
,068
)
1,20
5,20
4
(144
,310
)
947
19
,225
(70,
280)
9,85
7 1
90,8
49
63
,771
70,0
59
Oth
erG
over
nmen
t tra
nsfe
rs –
cap
ital
15
7,82
8
8,94
4
49,8
89
7,
938
22
4,59
9
224,
599
Cont
ribut
ed ta
ngib
le c
apita
l
asse
ts
54
,908
35,8
98
1,
577
92
,383
85,0
59
36
177,
478
Dev
elop
er a
nd c
usto
mer
cont
ribut
ions
– c
apita
l
16,2
79
10
,052
15
26
,346
36,8
07
63
,153
Loca
l Impr
ovem
ents
20,7
62
20
,762
1,64
0
22,4
02
229,
015
8,
944
95
,839
30,2
92
36
4,09
0
123,
506
36
487,
632
Exce
ss (s
hort
fall)
of R
even
ues
ov
er E
xpen
ses
$ (3
78,8
68)
$ (4
56,6
19)
$ (1
80,2
29)
$ 1,
235,
496
$ 21
9,78
0 $
947
$ 14
2,73
1 $
(70,
244)
$
9,85
7 $
190,
849
$ 6
3,77
1 $
557,
691
Tax
- Su
ppor
ted
PG 62 2015 ANNUAL REPORT CITY OF EDMONTON FINANCIAL STATEMENTS
The consolidated financial statements (the financial statements) of the City are prepared by management in accordance with Canadian public sector accounting standards (PSAS). Significant aspects of the accounting policies adopted by the City are as follows:
a. reporting entity
The financial statements reflect the revenues, expenses, assets, liabilities and accumulated surplus of the reporting entity. The reporting entity is comprised of all organizations and enterprises accountable for the administration of their financial affairs and resources to the City and which are owned or controlled by the City. In addition to general government tax-supported departments, they include the following:
The City of Edmonton Library Board (Edmonton Public Library)
Edmonton Economic Development Corporation
Waste Management (including 2492369 Canada Corporation, operating as Waste RE-solutions Edmonton)
Drainage Services Utility (Sanitary Drainage Services, Stormwater Drainage Services and Drainage Design and Construction)
Land Enterprise (Land Development and Municipal Land Use Property)
Ed Tel Endowment Fund
The City of Edmonton Non-Profit Housing Corporation (Non-Profit Housing Corporation)
Fort Edmonton Management Company
Edmonton Combative Sports Commission
Interdepartmental and inter-organizational transactions are eliminated.
EPCOR Utilities Inc. (EPCOR), a subsidiary corporation of the City, is accounted for on a modified equity basis, consistent with the generally accepted accounting treatment for a government business enterprise (Note 20). Under the modified equity basis, the government business enterprise’s accounting principles are not adjusted to conform with those of the City, and inter-organizational transactions and balances are not eliminated. Other comprehensive income (loss) due to fair value adjustments is reported on the Consolidated Statement of Operations and Accumulated Surplus as an adjustment to Accumulated Surplus.
The financial statements exclude trust assets under administration for the benefit of external parties (Note 25).
b. basis of accounting
The financial statements are prepared using the accrual basis of accounting. Revenues are accounted for in the period in which they are earned and measurable. Funds from external parties and earnings thereon restricted by agreement or legislation are accounted for as deferred revenue until used for the purpose specified.
Expenses are recognized as they are incurred and measurable based upon receipt of the goods and services and/or the legal obligation to pay.
Operating budget information is consistent with amounts approved by City Council in April 2015, with the passing of Bylaw 17103 – 2015 Property Tax and Supplementary Property Tax Bylaw. The budget is reported on an accrual basis, consistent with principles applied in the consolidated financial statements.
Capital budgets reflect the 2015 budget originally approved by Council in December 2014 as a part of the overall 2015-2018 capital budget, plus any carry forward of unspent capital budget from previous years. Capital budget adjustments made as part of the spring and fall supplementary capital budget adjustment process are not reflected.
c. use of estimates
The preparation of financial statements in conformity with PSAS requires management to make estimates and assumptions that affect the reported amounts of assets and liabilities and disclosure of contingent assets and liabilities at the date of the financial statements and the reported amounts of revenues and expenses during the period. Actual results could differ from those estimates.
Administration has used estimates to determine employee benefit obligations, pension obligations relating to City-sponsored pension plans, landfill closure and post-closure care obligations, accrued liabilities including estimates for expropriation of municipal lands and contaminated sites remediation, useful lives of tangible capital assets as well as provisions made for allowances for amounts receivable or any provision for impairment of investment values.
For the year ended December 31, 2015 (in thousands of dollars)
The City of Edmonton (the City) is a municipality in the Province of Alberta, Canada and operates under the provisions of the Municipal Government Act, R.S.A., 2000, c. M-26, as amended (MGA).
notes to consolidated financial statements
1. significant accounting policies
FINANCIAL STATEMENTS 2015 ANNUAL REPORT CITY OF EDMONTON PG 63
d. foreign currency
Monetary items denominated in foreign currency are translated to Canadian dollars at exchange rates in effect at December 31 and non-monetary items are translated at rates of exchange in effect when the assets were acquired or obligations incurred. Revenues and expenses are translated at rates in effect at the time of the transactions or at rates of exchange established by the terms of a forward foreign exchange contract. Gains (losses) on foreign currency translation are included as revenues (expenses).
e. tax revenue
Annually, the City bills and collects property tax revenues for municipal purposes. Tax revenues are based on market value assessments determined in accordance with the MGA and annually established tax rates. Municipal tax rates are set each year by City Council in accordance with legislation and City Council-approved policies to raise the tax revenue required to meet the City’s budget requirements. Tax revenues are recorded at the time tax billings are issued. Property assessments are subject to tax appeal. A provision has been recorded in accounts payable and accrued liabilities for potential losses on assessment appeals outstanding at December 31. Expenses related to tax appeals and allowances are separately disclosed in the Consolidated Statement of Operations and Accumulated Surplus.
The City also bills and collects education tax on behalf of the Province of Alberta (the “Province”). Education tax rates are established by the Province each year in order to fund the cost of education on a Province-wide basis. Education taxes collected are remitted to the Province and the Edmonton Catholic Separate School District and are excluded from revenues and expenses in the Consolidated Statement of Operations and Accumulated Surplus (Note 17). Education taxes collected as part of the incremental property taxes within a community revitalization levy (CRL) are retained to offset development costs in the area over the life of the CRL.
f. government transfers
Government transfers are the transfer of monetary assets or tangible capital assets from other orders of government that are not the result of an exchange transaction and for which there is no expectation of repayment or direct financial return to the transferor in the future. The City receives government transfers from the Federal and Provincial governments to fund operating and
capital expenditures. These transfers to the City are recognized as revenues when the transfers are authorized and all the eligibility criteria, if any, have been met, except when and to the extent that the transfer gives rise to an obligation that meets the definition of a liability for the recipient. Prior to that time, any amounts received, along with restricted interest thereon are recorded as deferred revenue.
Authorized transfers from the City to other organizations or individuals are recorded as an expense when the transfer has been authorized and the eligibility criteria, if any, have been met by the recipient. The majority of transfers made by the City are in the form of grants or subsidies.
g. local improvements
When a service or improvement is deemed to benefit a specific area more than the municipality as a whole, the project may be classified as a local improvement under the MGA, to be paid in whole or in part by a tax imposed on the benefiting property owners. The property owner’s share of the improvement is recognized as revenue, and established as a receivable, in the period that the project expenditures are completed.
h. land for resale
Land for resale is recorded at the lower of cost and net realizable value. Cost includes amounts for land acquisition and improvements to prepare the land for sale or servicing.
i. investments
Fixed income investments are recorded at amortized cost. Purchase premiums and discounts are amortized on the net present value basis over the terms of the issues. Investments in common and preferred shares and pooled funds are recorded at cost. Where there has been a loss in value that is other than a temporary decline, the respective investment is written down to recognize the loss. Any net undistributed realized losses in multi-unit investment trusts managed by the City are recorded in the year incurred.
j. debt recoverable
Debt recoverable consists of amounts that are recoverable under loans made to non-profit organizations, relating to the City’s outstanding long-term debt. These debt recoverable amounts are recorded at a value equivalent to the offsetting outstanding long-term debt balances as at December 31.
For the year ended December 31, 2015 (in thousands of dollars)
notes to consolidated financial statements
PG 64 2015 ANNUAL REPORT CITY OF EDMONTON FINANCIAL STATEMENTS
k. non-financial assets
Non-financial assets are not available to discharge liabilities and are held for use in the provision of services. They have useful lives extending beyond the current year and are not intended for sale in the normal course of operations. Non-financial assets are comprised of tangible capital assets, inventory of materials and supplies and other assets.
i. Tangible Capital Assets
Tangible capital assets are recorded at cost which includes all amounts that are directly attributable to acquisition, construction, development or betterment of the asset. Interest charges during construction are not capitalized. The cost, less residual value of the tangible capital assets, is amortized on a straight-line basis over the following estimated useful lives of the assets:
Land improvements 20 to 50 years Buildings 10 to 60 years Machinery and equipment 3 to 50 years Vehicles 9 to 35 years Engineered structures 7 to 100 years
One half of the annual amortization is charged in the year of acquisition and in the year of disposal. Assets under construction are not amortized until the asset is available for productive use.
ii. Contributed Tangible Capital Assets
Tangible capital assets acquired as contributions are recorded at their fair value on the date received. Equivalent amounts are recorded as contributed tangible capital assets on the Consolidated Statement of Operations and Accumulated Surplus.
iii. Leases
Leases are classified as capital or operating leases. Leases which transfer substantially all benefits and risks to the City incidental to ownership of property are accounted for as capital leases. Assets under capital lease are included within the respective asset classifications. All other leases are accounted for as operating leases and the related lease payments are charged to expenses as incurred.
iv. Land Under Roads
Land under roads that is acquired other than by a purchase agreement is valued at a nominal amount.
v. Inventory of Materials and Supplies
Inventory of materials and supplies is valued at the lower of average cost and replacement cost.
vi. Cultural, Historical and Works of Art
The City manages and controls various works of art and non-operational historical cultural assets including buildings, artifacts, paintings and sculptures located at City sites and public display areas. These assets are not recorded as tangible capital assets and are not amortized. Costs for public art are expensed in the period they are incurred.
l. liability for contaminated sites
Contaminated sites are a result of contamination being introduced into air, soil, water or sediment of a chemical, organic or radioactive material or live organism that exceeds an environmental standard. The City recognizes a liability for remediation of contaminated sites when the following criteria have been met:
an environmental standard exists,
there is evidence that contamination exceeds an environmental standard,
the City is directly responsible or accepts responsibility for the contamination,
it is expected that future economic benefits will be given up and,
a reasonable estimate of the amount can be made.
Sites that are currently in productive use are only considered contaminated sites if an unexpected event results in remediation. In cases where the City’s responsibility is not determinable, a contingent liability may be disclosed.
The liability reflects the City’s best estimate, as of December 31, of the amount required to remediate non-productive sites to the current minimum standard of use prior to contamination. Where possible, provisions for remediation are based on environmental assessments completed on a site; for those sites where an assessment has not been completed, estimates of the remediation are completed using information available for the site and by extrapolating from the cost to clean up similar sites. The liability is recorded net of any estimated recoveries from third parties. The City will measure the liability using present value techniques when cash flows are expected to occur over extended future periods.
For the year ended December 31, 2015 (in thousands of dollars)
notes to consolidated financial statements
FINANCIAL STATEMENTS 2015 ANNUAL REPORT CITY OF EDMONTON PG 65
m. employee benefit obligations
The costs of post-employment benefits, compensated absences and termination benefits are recorded as an expense when the event that gives rise to the obligation occurs.
City employees participate in multi-employer pension plans that are administered by third parties. Obligations related to plan deficiencies are not recorded for these multi-employer pension plans as the City’s share is not determinable. Contributions to multi-employer plans for current and past service are recorded as expenses in the year in which they become due.
Costs related to City-sponsored registered and non-registered defined benefit pension plans are recognized when earned by plan members. Plan obligations are actuarially determined using the projected benefit method prorated on service, applying management’s best estimates of expected retirement ages of employees, salary and benefit escalation, plan investment performance and discount rates.
Actuarial gains and losses for active plans are amortized on a straight-line basis over the expected average remaining service life of the related employee group. Adjustments arising from prior service costs relating to plan amendments and changes in the valuation allowance are recognized in the period in which the adjustment occurs. The City records the actuarially determined net fund asset or liability for City-sponsored registered pension plans. For jointly sponsored plans, the City records its proportionate share of that asset or liability.
n. reserves for future expenditures
Certain amounts, as approved by City Council, are designated within accumulated surplus as reserves for future operating and capital expenditures.
o. equity in tangible capital assets
Equity in tangible capital assets is included within accumulated surplus. It represents the investment in tangible capital assets, after deducting the portion financed by long-term debt.
p. future accounting standard pronouncements
The following summarizes upcoming changes to PSAS. In 2016, the City will continue to assess the impact and prepare for the adoption of these standards. While the timing of standard adoption can vary, certain standards must be adopted concurrently. The requirements in PS1201, Financial Statement Presentation, PS3450, Financial Instruments, PS2601, Foreign Currency Translation and PS3041, Portfolio Investments must be implemented at the same time. PS2200, Related Party Disclosures and PS3420, Inter-Entity Transactions also require concurrent adoption.
i. Introduction to Public Sector Accounting Standards
The Public Sector Accounting (PSA) Handbook was previously written primarily to address the financial reporting needs of governments in Canada. With the broadened scope of the PSA Handbook to include government organizations that previously reported under Part V of the CPA Handbook, it was necessary to update the introduction to clarify the applicability of the PSA Handbook to various public sector entities. The new introduction is applicable for fiscal years beginning on or after January 1, 2017.
ii. Assets
PS3210, Assets provides additional guidance on the definition of assets and new disclosure requirements for those assets not recognized in the government’s financial statements. This standard is applicable for fiscal years beginning on or after April 1, 2017.
iii. Contingent Assets
PS3320, Contingent Assets establishes standards on the reporting and disclosure of possible assets that may arise from existing conditions or situations involving uncertainty. This standard is applicable for fiscal years beginning on or after April 1, 2017.
iv. Contractual Rights
PS3380, Contractual Rights establishes standards on the reporting and disclosure of a government’s rights to economic resources that may arise from contracts or agreements that will result in both an asset and revenue in the future. This standard is applicable for fiscal years beginning on or after April 1, 2017.
For the year ended December 31, 2015 (in thousands of dollars)
notes to consolidated financial statements
PG 66 2015 ANNUAL REPORT CITY OF EDMONTON FINANCIAL STATEMENTS
v. Inter-entity Transactions
PS3420, Inter-Entity Transactions specifically addresses the reporting of transactions between entities controlled by a government and that comprise the government’s reporting entity from both a provider and recipient perspective. This standard is applicable for fiscal years beginning on or after April 1, 2017.
vi. Related Party Disclosures
PS2200, Related Party Disclosures requires sufficient information be disclosed about the terms and conditions on which transactions between related parties are conducted and the relationship underlying them. The disclosure provides information necessary to assess the effect that the related party relationships have had, or, if not recognized, may have had on the entity’s financial position and financial performance. This standard is applicable for fiscal years beginning on or after April 1, 2017.
vii. Restructuring Transactions
PS3430, Restructuring Transactions establishes standards on how to account for and report restructuring transactions by both transferors and recipients of assets and/or liabilities, together with related program or operating responsibilities. This standard is applicable for fiscal years beginning on or after April 1, 2018.
viii. Financial Statement Presentation
PS1201, Financial Statement Presentation, requires a new statement of re-measurement gains and losses separate from the statement of operations. Included in this new statement are the unrealized gains and losses arising from the re-measurement of financial instruments and items denominated in foreign currencies, as well as the government’s proportionate share of other comprehensive income that arises when a government includes the results of government business enterprises and partnerships. This standard is applicable for fiscal years beginning on or after April 1, 2019.
ix. Financial Instruments
PS3450, Financial Instruments establishes recognition, measurement, and disclosure requirements for derivative and non-derivative financial instruments. The standard requires fair value measurement of derivatives and equity instruments; all other financial instruments can be measured at cost/amortized cost or fair value at the election of the government. Unrealized gains and losses are presented in a new statement of re-measurement gains and losses. There is the requirement to disclose the nature and extent of risks arising from financial instruments and clarification is given for the de-recognition of financial liabilities. This standard is applicable for fiscal years beginning on or after April 1, 2019.
x. Foreign Currency Translation
PS2601, Foreign Currency Translation, requires that monetary assets and liabilities denominated in a foreign currency and non-monetary items included in the fair value category, denominated in a foreign currency, be adjusted to reflect the exchange rates in effect at the financial statement date. Unrealized gains and losses are to be presented in the new statement of re-measurement gains and losses. This standard is applicable for fiscal years beginning on or after April 1, 2019.
xi. Portfolio Investments
PS3041, Portfolio Investments has removed the distinction between temporary and portfolio investments. This section was amended to conform to PS3450, Financial Instruments, and now includes pooled investments in its scope. Upon adoption of PS3450 and PS3041, PS3030, Temporary Investments will no longer apply. This standard is applicable for fiscal years beginning on or after April 1, 2019.
For the year ended December 31, 2015 (in thousands of dollars)
notes to consolidated financial statements
FINANCIAL STATEMENTS 2015 ANNUAL REPORT CITY OF EDMONTON PG 67
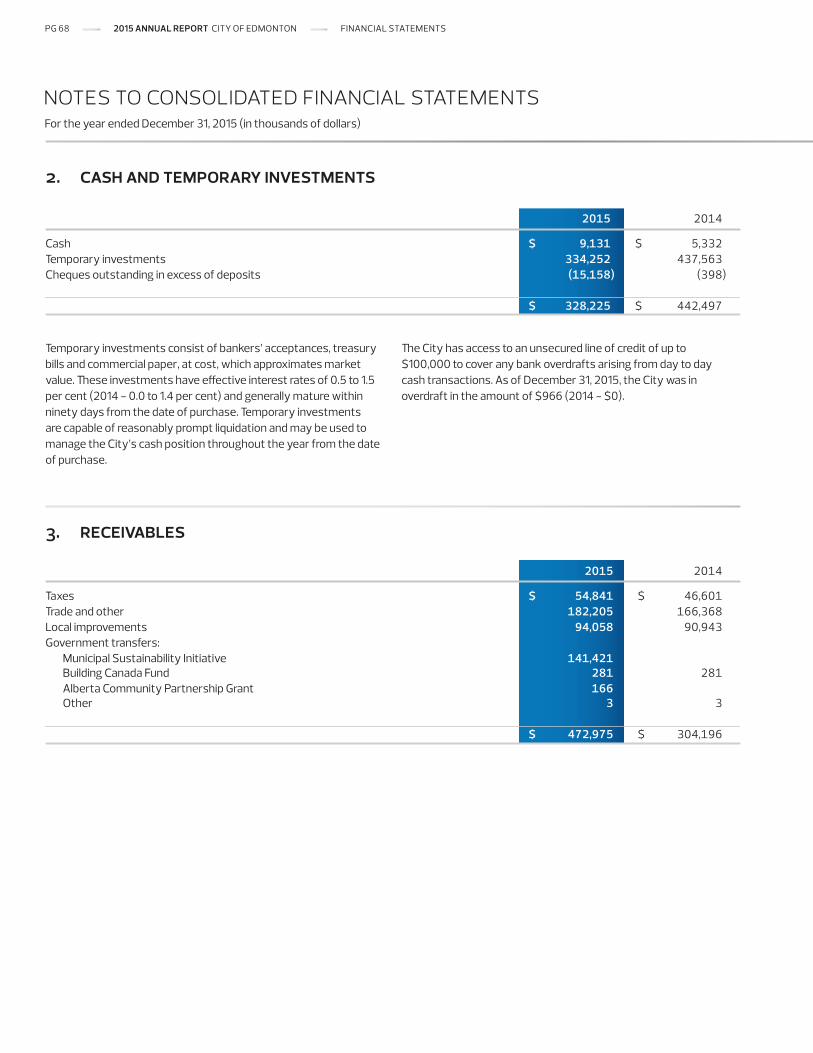
Temporary investments consist of bankers’ acceptances, treasury bills and commercial paper, at cost, which approximates market value. These investments have effective interest rates of 0.5 to 1.5 per cent (2014 - 0.0 to 1.4 per cent) and generally mature within ninety days from the date of purchase. Temporary investments are capable of reasonably prompt liquidation and may be used to manage the City’s cash position throughout the year from the date of purchase.
2. cash and temporary investments
For the year ended December 31, 2015 (in thousands of dollars)
notes to consolidated financial statements
2015 2014 Cash $ 9,131 $ 5,332Temporary investments 334,252 437,563Cheques outstanding in excess of deposits (15,158) (398)
$ 328,225 $ 442,497
3. receivables
2015 2014 Taxes $ 54,841 $ 46,601Trade and other 182,205 166,368Local improvements 94,058 90,943Government transfers: Municipal Sustainability Initiative 141,421 Building Canada Fund 281 281 Alberta Community Partnership Grant 166 Other 3 3
$ 472,975 $ 304,196
The City has access to an unsecured line of credit of up to $100,000 to cover any bank overdrafts arising from day to day cash transactions. As of December 31, 2015, the City was in overdraft in the amount of $966 (2014 - $0).
PG 68 2015 ANNUAL REPORT CITY OF EDMONTON FINANCIAL STATEMENTS
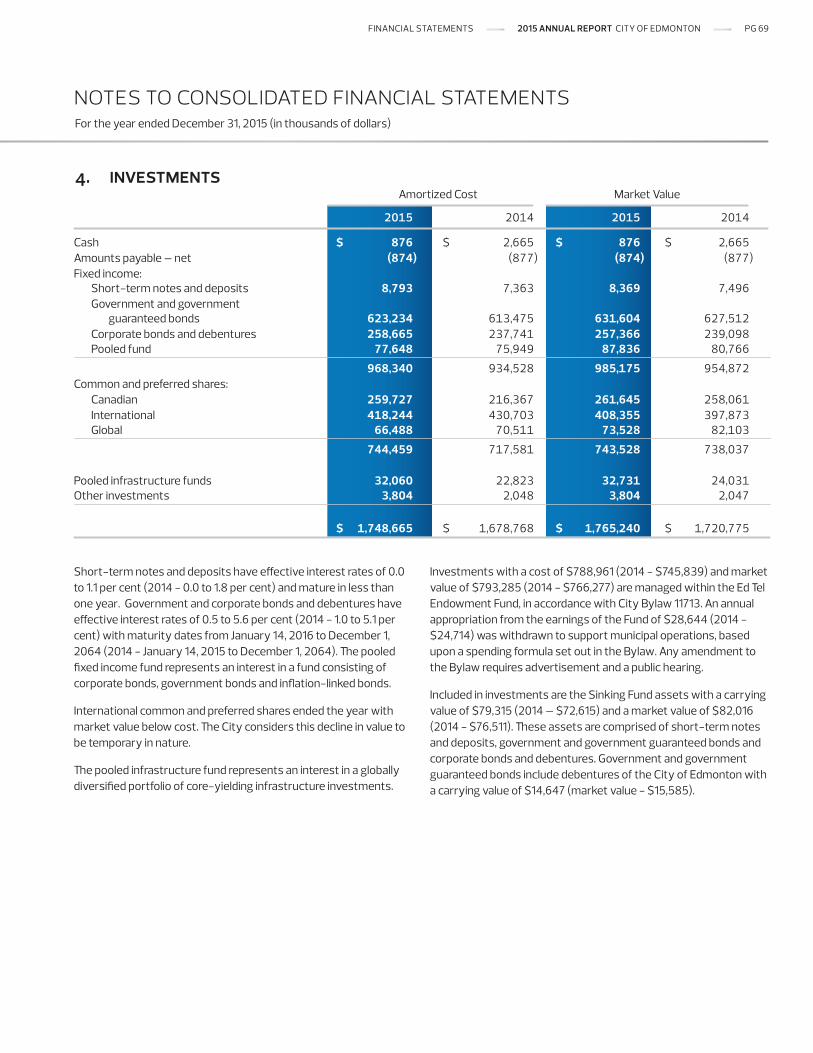
Short-term notes and deposits have effective interest rates of 0.0 to 1.1 per cent (2014 - 0.0 to 1.8 per cent) and mature in less than one year. Government and corporate bonds and debentures have effective interest rates of 0.5 to 5.6 per cent (2014 - 1.0 to 5.1 per cent) with maturity dates from January 14, 2016 to December 1, 2064 (2014 - January 14, 2015 to December 1, 2064). The pooled fixed income fund represents an interest in a fund consisting of corporate bonds, government bonds and inflation-linked bonds.
International common and preferred shares ended the year with market value below cost. The City considers this decline in value to be temporary in nature.
The pooled infrastructure fund represents an interest in a globally diversified portfolio of core-yielding infrastructure investments.
Investments with a cost of $788,961 (2014 - $745,839) and market value of $793,285 (2014 - $766,277) are managed within the Ed Tel Endowment Fund, in accordance with City Bylaw 11713. An annual appropriation from the earnings of the Fund of $28,644 (2014 - $24,714) was withdrawn to support municipal operations, based upon a spending formula set out in the Bylaw. Any amendment to the Bylaw requires advertisement and a public hearing.
Included in investments are the Sinking Fund assets with a carrying value of $79,315 (2014 – $72,615) and a market value of $82,016 (2014 - $76,511). These assets are comprised of short-term notes and deposits, government and government guaranteed bonds and corporate bonds and debentures. Government and government guaranteed bonds include debentures of the City of Edmonton with a carrying value of $14,647 (market value - $15,585).
For the year ended December 31, 2015 (in thousands of dollars)
notes to consolidated financial statements
4. investments
2015 2015 2014 2015 2014 Cash $ $ 876 $ 2,665 $ 876 $ 2,665Amounts payable – net (874) (877) (874) (877)Fixed income: Short-term notes and deposits 8,793 7,363 8,369 7,496 Government and government
guaranteed bonds 623,234 613,475 631,604 627,512 Corporate bonds and debentures 258,665 237,741 257,366 239,098 Pooled fund 77,648 75,949 87,836 80,766
968,340 934,528 985,175 954,872Common and preferred shares: Canadian 259,727 216,367 261,645 258,061 International 418,244 430,703 408,355 397,873 Global 66,488 70,511 73,528 82,103
744,459 717,581 743,528 738,037 Pooled infrastructure funds 32,060 22,823 32,731 24,031Other investments 3,804 2,048 3,804 2,047
$ 1,748,665 $ 1,678,768 $ $ 1,765,240 $ 1,720,775
Market Value Amortized Cost
FINANCIAL STATEMENTS 2015 ANNUAL REPORT CITY OF EDMONTON PG 69
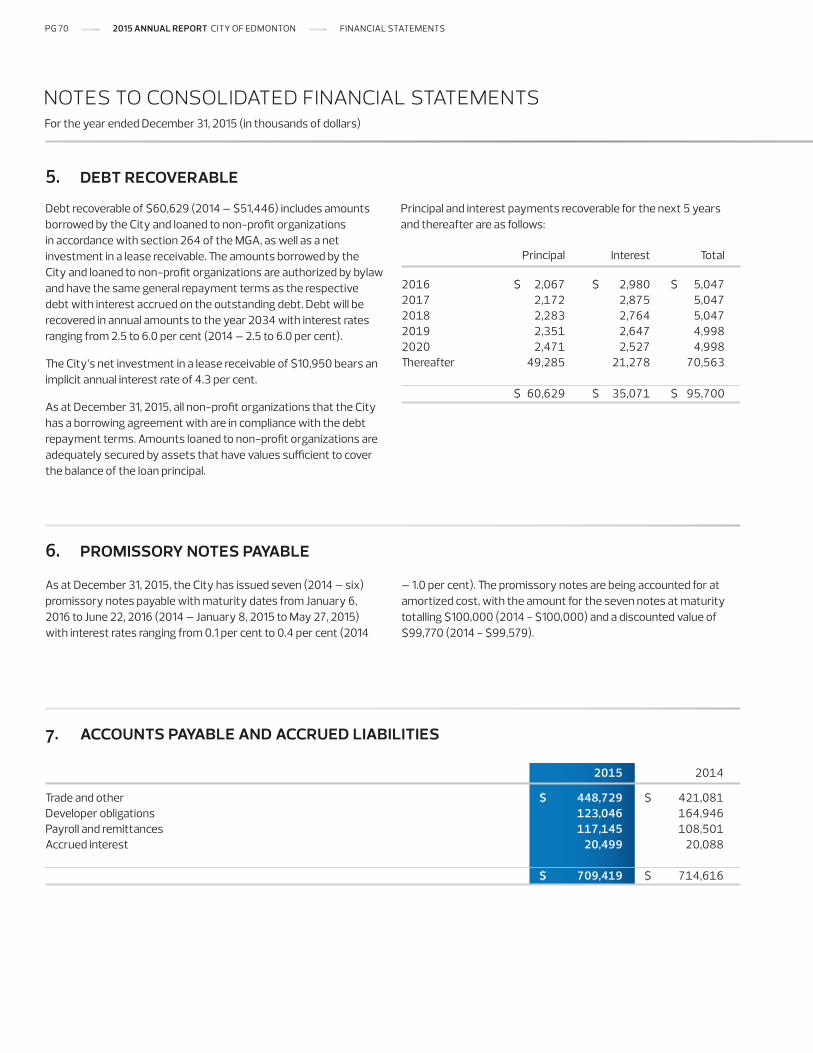
Debt recoverable of $60,629 (2014 – $51,446) includes amounts borrowed by the City and loaned to non-profit organizations in accordance with section 264 of the MGA, as well as a net investment in a lease receivable. The amounts borrowed by the City and loaned to non-profit organizations are authorized by bylaw and have the same general repayment terms as the respective debt with interest accrued on the outstanding debt. Debt will be recovered in annual amounts to the year 2034 with interest rates ranging from 2.5 to 6.0 per cent (2014 – 2.5 to 6.0 per cent).
The City’s net investment in a lease receivable of $10,950 bears an implicit annual interest rate of 4.3 per cent.
As at December 31, 2015, all non-profit organizations that the City has a borrowing agreement with are in compliance with the debt repayment terms. Amounts loaned to non-profit organizations are adequately secured by assets that have values sufficient to cover the balance of the loan principal.
Principal and interest payments recoverable for the next 5 years and thereafter are as follows:
As at December 31, 2015, the City has issued seven (2014 – six) promissory notes payable with maturity dates from January 6, 2016 to June 22, 2016 (2014 – January 8, 2015 to May 27, 2015) with interest rates ranging from 0.1 per cent to 0.4 per cent (2014
7. accounts payable and accrued liabilities
5. debt recoverable
6. promissory notes payable
– 1.0 per cent). The promissory notes are being accounted for at amortized cost, with the amount for the seven notes at maturity totalling $100,000 (2014 - $100,000) and a discounted value of $99,770 (2014 - $99,579).
For the year ended December 31, 2015 (in thousands of dollars)
Principal Interest Total 2016 $ 2,067 $ 2,980 $ 5,0472017 2,172 2,875 5,0472018 2,283 2,764 5,0472019 2,351 2,647 4,9982020 2,471 2,527 4,998Thereafter 49,285 21,278 70,563
$ 60,629 $ 35,071 $ 95,700
2015 2014 Trade and other $ 448,729 $ 421,081Developer obligations 123,046 164,946Payroll and remittances 117,145 108,501Accrued interest 20,499 20,088
$ 709,419 $ 714,616
notes to consolidated financial statements
PG 70 2015 ANNUAL REPORT CITY OF EDMONTON FINANCIAL STATEMENTS
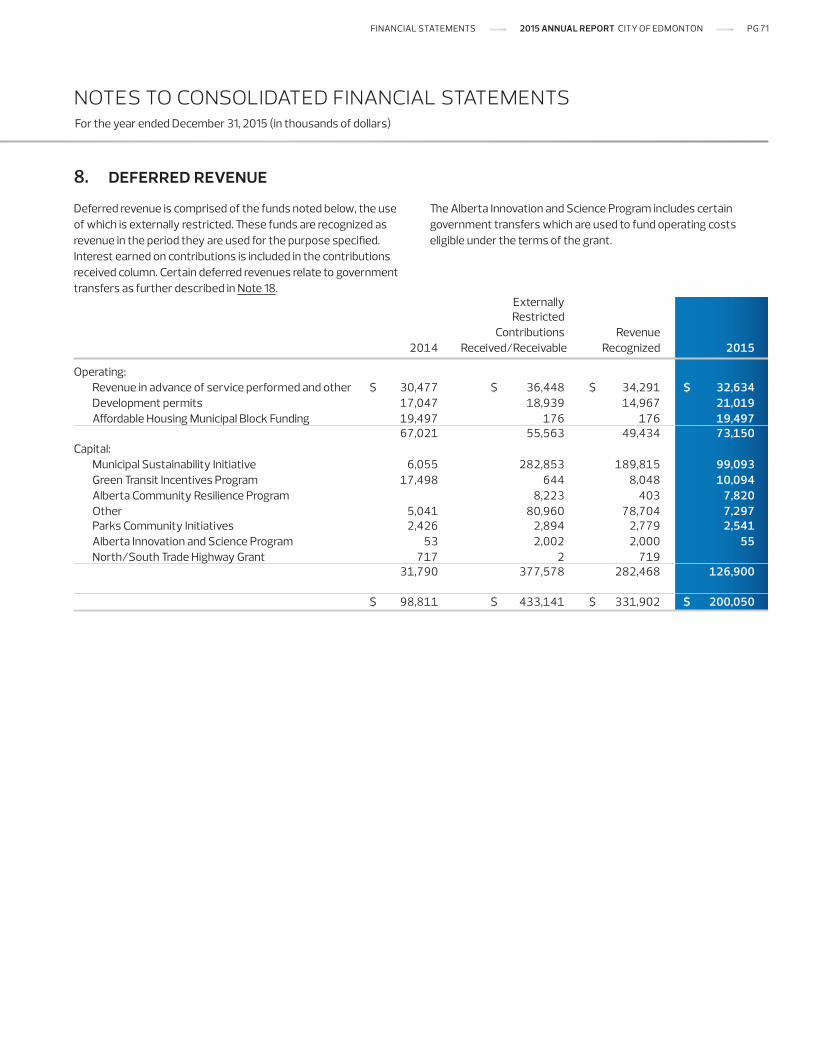
8. deferred revenue
Deferred revenue is comprised of the funds noted below, the use of which is externally restricted. These funds are recognized as revenue in the period they are used for the purpose specified. Interest earned on contributions is included in the contributions received column. Certain deferred revenues relate to government transfers as further described in Note 18.
The Alberta Innovation and Science Program includes certain government transfers which are used to fund operating costs eligible under the terms of the grant.
For the year ended December 31, 2015 (in thousands of dollars)
Externally Restricted Contributions Revenue 2014 Received/Receivable Recognized 2015 Operating: Revenue in advance of service performed and other $ 30,477 $ 36,448 $ 34,291 $ 32,634 Development permits 17,047 18,939 14,967 21,019 Affordable Housing Municipal Block Funding 19,497 176 176 19,497 67,021 55,563 49,434 73,150Capital: Municipal Sustainability Initiative 6,055 282,853 189,815 99,093 Green Transit Incentives Program 17,498 644 8,048 10,094 Alberta Community Resilience Program 8,223 403 7,820 Other 5,041 80,960 78,704 7,297 Parks Community Initiatives 2,426 2,894 2,779 2,541 Alberta Innovation and Science Program 53 2,002 2,000 55 North/South Trade Highway Grant 717 2 719 31,790 377,578 282,468 126,900
$ 98,811 $ 433,141 $ 331,902 $ 200,050
notes to consolidated financial statements
FINANCIAL STATEMENTS 2015 ANNUAL REPORT CITY OF EDMONTON PG 71

For the year ended December 31, 2015 (in thousands of dollars)
9. employee benefit obligations
Post-employment benefits represent the City’s cost, including the continuation of benefits for employees on long-term disability, and the City’s share of pensioners’ eligible medical, dental and other obligations.
In order to measure the post-employment obligation, an actuarial valuation was completed by Aon Hewitt as at December 31, 2015 regarding the continuation of benefit coverage while eligible employees are on long-term disability. The discount rate used in the valuation is 2.3 per cent (2014 – 2.5 per cent). The accrued benefit obligation as at December 31, 2015 is $18,705 (2014 - $18,372). The change is comprised of current service cost of $4,198 (2014 - $4,733), interest cost of $526 (2014 - $509), actuarial gain of $1,330 (2014 – $1,056) and benefits paid during the year of $3,061 (2014 - $2,934).
Eligible post-employment medical and dental obligations are estimated based on a five year average of pensioners’ claim costs in excess of contributions until the pensioners reach age 65. Eligible medical obligations for 2015 were $1,567 (2014 - $1,822). Eligible dental obligations for 2015 were $294 (2014 - $266). Other post-employment benefits were $948 (2014 - $1,010).
The income replacement plan was a disability plan partially funded by employees, which was discontinued in April 1991. The outstanding obligation will be paid to employees in accordance with the terms and conditions of the plan. The obligation is based on an actuarial valuation as at December 31, 2015, completed by Aon Hewitt.
The City sponsors major medical, dental and other employee benefit plans, which are funded through employee and/or employer contributions. Premium contributions, interest earnings, payments for benefit entitlements and administrative costs are applied to each of the respective plans.
A Group Life Insurance Plan is provided by the City, funded equally by employer and employees. The Plan is administered by Great West Life.
All permanent employees are entitled to a health care spending account providing reimbursement up to established limits for eligible expenses not covered under the Supplementary Health Care and Dental Plans. An estimate has been included in 2015 expenses of amounts not used in the current year that are eligible to be carried forward under the terms of the plan.
A Supplementary Management Retirement Plan for designated management employees was implemented effective for service beginning January 1, 2003. The accrued benefit liability for total current and past service costs of $4,447 (2014 - $3,917) has been based upon an actuarial valuation completed by Aon Hewitt as at December 31, 2015. Unamortized net losses of $1,711 (2014 - $1,680) will be amortized over the eight (2014 – seven) year average remaining service period of active plan participants.
Other employee benefit obligations for 2015 include $302 (2014 – $357) for the Fire Chief and Deputy Fire Chiefs’ Supplementary Pension Plan liability (Note 21c).
2015 2014 Accrued vacation $ 71,001 $ 68,867Post-employment benefits 21,514 21,470Banked overtime 12,970 12,434Major medical and dental plans 7,367 7,196Supplementary Management Retirement Plan 4,447 3,917Income replacement plan 4,346 5,406Health care spending 3,917 4,190Other 922 949Group Life Insurance Plan 292 2,978
$ 126,776 $ 127,407
notes to consolidated financial statements
PG 72 2015 ANNUAL REPORT CITY OF EDMONTON FINANCIAL STATEMENTS
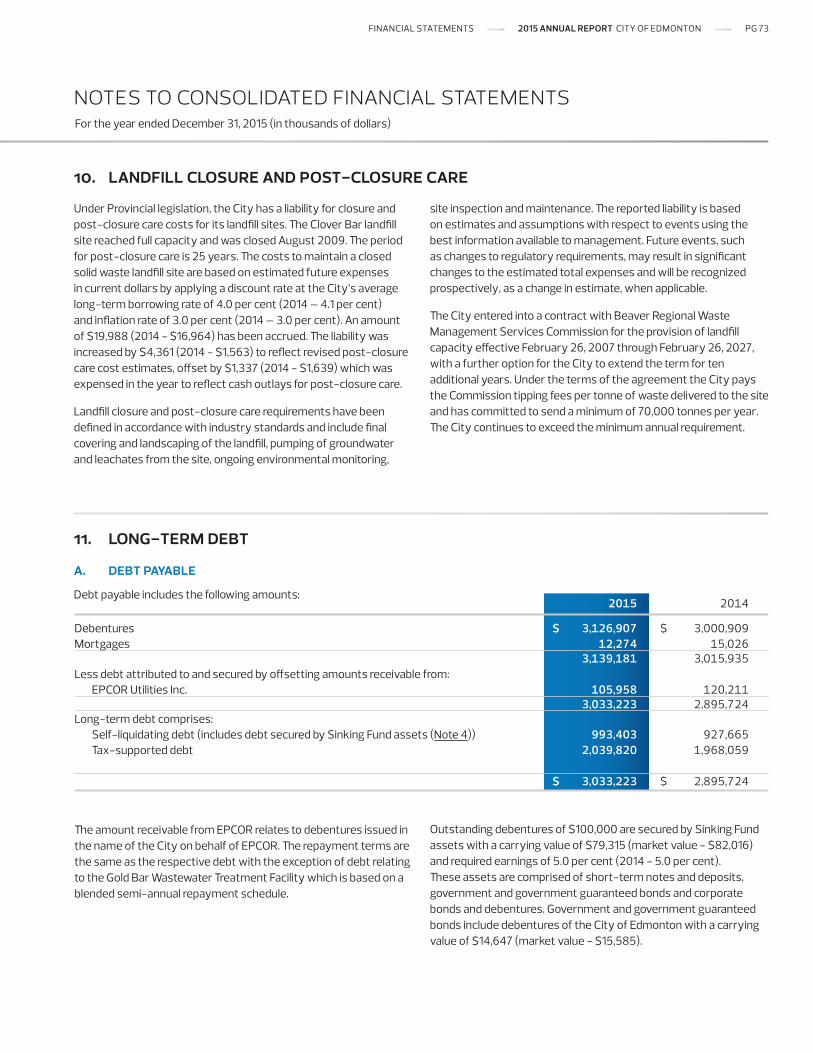
For the year ended December 31, 2015 (in thousands of dollars)
10. landfill closure and post-closure care
11. long-term debt
Under Provincial legislation, the City has a liability for closure and post-closure care costs for its landfill sites. The Clover Bar landfill site reached full capacity and was closed August 2009. The period for post-closure care is 25 years. The costs to maintain a closed solid waste landfill site are based on estimated future expenses in current dollars by applying a discount rate at the City’s average long-term borrowing rate of 4.0 per cent (2014 – 4.1 per cent) and inflation rate of 3.0 per cent (2014 – 3.0 per cent). An amount of $19,988 (2014 - $16,964) has been accrued. The liability was increased by $4,361 (2014 - $1,563) to reflect revised post-closure care cost estimates, offset by $1,337 (2014 - $1,639) which was expensed in the year to reflect cash outlays for post-closure care.
Landfill closure and post-closure care requirements have been defined in accordance with industry standards and include final covering and landscaping of the landfill, pumping of groundwater and leachates from the site, ongoing environmental monitoring,
site inspection and maintenance. The reported liability is based on estimates and assumptions with respect to events using the best information available to management. Future events, such as changes to regulatory requirements, may result in significant changes to the estimated total expenses and will be recognized prospectively, as a change in estimate, when applicable.
The City entered into a contract with Beaver Regional Waste Management Services Commission for the provision of landfill capacity effective February 26, 2007 through February 26, 2027, with a further option for the City to extend the term for ten additional years. Under the terms of the agreement the City pays the Commission tipping fees per tonne of waste delivered to the site and has committed to send a minimum of 70,000 tonnes per year. The City continues to exceed the minimum annual requirement.
The amount receivable from EPCOR relates to debentures issued in the name of the City on behalf of EPCOR. The repayment terms are the same as the respective debt with the exception of debt relating to the Gold Bar Wastewater Treatment Facility which is based on a blended semi-annual repayment schedule.
a. debt payable
Debt payable includes the following amounts: 2015 2014 Debentures $ 3,126,907 $ 3,000,909Mortgages 12,274 15,026 3,139,181 3,015,935Less debt attributed to and secured by offsetting amounts receivable from: EPCOR Utilities Inc. 105,958 120,211 3,033,223 2,895,724Long-term debt comprises: Self-liquidating debt (includes debt secured by Sinking Fund assets (Note 4)) 993,403 927,665 Tax-supported debt 2,039,820 1,968,059 $ $ $ 3,033,223 $ 2,895,724
Outstanding debentures of $100,000 are secured by Sinking Fund assets with a carrying value of $79,315 (market value - $82,016) and required earnings of 5.0 per cent (2014 - 5.0 per cent). These assets are comprised of short-term notes and deposits, government and government guaranteed bonds and corporate bonds and debentures. Government and government guaranteed bonds include debentures of the City of Edmonton with a carrying value of $14,647 (market value - $15,585).
notes to consolidated financial statements
FINANCIAL STATEMENTS 2015 ANNUAL REPORT CITY OF EDMONTON PG 73
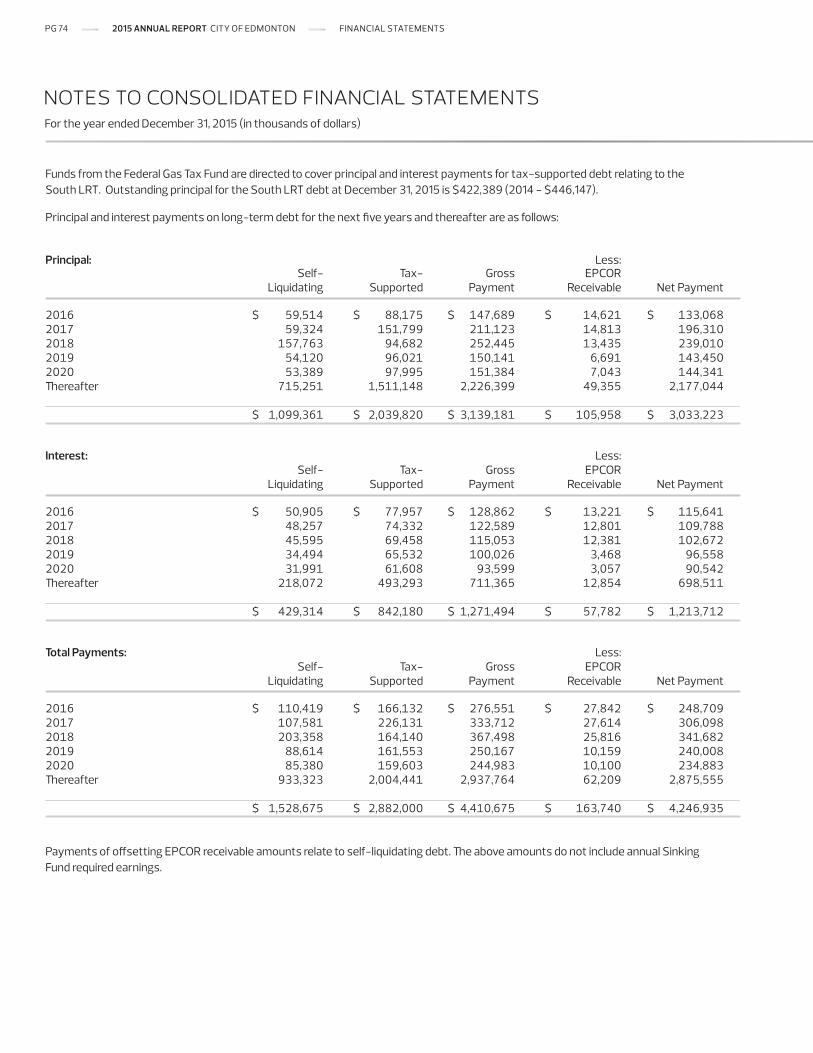
For the year ended December 31, 2015 (in thousands of dollars)
Funds from the Federal Gas Tax Fund are directed to cover principal and interest payments for tax-supported debt relating to the South LRT. Outstanding principal for the South LRT debt at December 31, 2015 is $422,389 (2014 - $446,147).
Principal and interest payments on long-term debt for the next five years and thereafter are as follows:
Payments of offsetting EPCOR receivable amounts relate to self-liquidating debt. The above amounts do not include annual Sinking Fund required earnings.
Principal: Less: Self- Tax- Gross EPCOR Liquidating Supported Payment Receivable Net Payment 2016 $ 59,514 $ 88,175 $ 147,689 $ 14,621 $ 133,068 2017 59,324 151,799 211,123 14,813 196,310 2018 157,763 94,682 252,445 13,435 239,010 2019 54,120 96,021 150,141 6,691 143,450 2020 53,389 97,995 151,384 7,043 144,341 Thereafter 715,251 1,511,148 2,226,399 49,355 2,177,044 $ 1,099,361 $ 2,039,820 $ 3,139,181 $ 105,958 $ 3,033,223
Interest: Less: Self- Tax- Gross EPCOR Liquidating Supported Payment Receivable Net Payment
2016 $ 50,905 $ 77,957 $ 128,862 $ 13,221 $ 115,641 2017 48,257 74,332 122,589 12,801 109,788 2018 45,595 69,458 115,053 12,381 102,672 2019 34,494 65,532 100,026 3,468 96,558 2020 31,991 61,608 93,599 3,057 90,542 Thereafter 218,072 493,293 711,365 12,854 698,511 $ 429,314 $ 842,180 $ 1,271,494 $ 57,782 $ 1,213,712
Total Payments: Less: Self- Tax- Gross EPCOR Liquidating Supported Payment Receivable Net Payment
2016 $ 110,419 $ 166,132 $ 276,551 $ 27,842 $ 248,709 2017 107,581 226,131 333,712 27,614 306,098 2018 203,358 164,140 367,498 25,816 341,682 2019 88,614 161,553 250,167 10,159 240,008 2020 85,380 159,603 244,983 10,100 234,883 Thereafter 933,323 2,004,441 2,937,764 62,209 2,875,555 $ 1,528,675 $ 2,882,000 $ 4,410,675 $ 163,740 $ 4,246,935
notes to consolidated financial statements
PG 74 2015 ANNUAL REPORT CITY OF EDMONTON FINANCIAL STATEMENTS
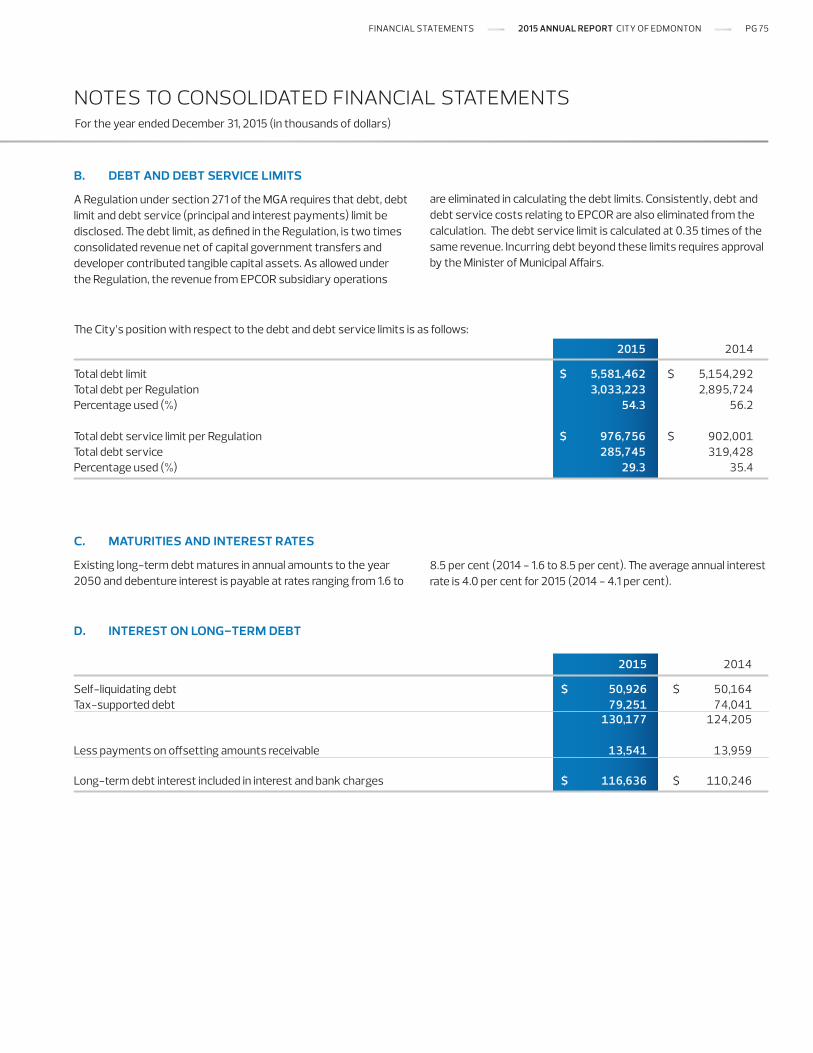
For the year ended December 31, 2015 (in thousands of dollars)
b. debt and debt service limits
A Regulation under section 271 of the MGA requires that debt, debt limit and debt service (principal and interest payments) limit be disclosed. The debt limit, as defined in the Regulation, is two times consolidated revenue net of capital government transfers and developer contributed tangible capital assets. As allowed under the Regulation, the revenue from EPCOR subsidiary operations
are eliminated in calculating the debt limits. Consistently, debt and debt service costs relating to EPCOR are also eliminated from the calculation. The debt service limit is calculated at 0.35 times of the same revenue. Incurring debt beyond these limits requires approval by the Minister of Municipal Affairs.
2015 2014 Total debt limit $ 5,581,462 $ 5,154,292Total debt per Regulation 3,033,223 2,895,724Percentage used (%) 54.3 56.2
Total debt service limit per Regulation $ 976,756 $ 902,001Total debt service 285,745 319,428Percentage used (%) 29.3 35.4
c. maturities and interest rates
Existing long-term debt matures in annual amounts to the year 2050 and debenture interest is payable at rates ranging from 1.6 to
2015 2014 Self-liquidating debt $ 50,926 $ 50,164Tax-supported debt 79,251 74,041 130,177 124,205
Less payments on offsetting amounts receivable 13,541 13,959
Long-term debt interest included in interest and bank charges $ 116,636 $ 110,246
d. interest on long-term debt
notes to consolidated financial statements
The City’s position with respect to the debt and debt service limits is as follows:
8.5 per cent (2014 - 1.6 to 8.5 per cent). The average annual interest rate is 4.0 per cent for 2015 (2014 - 4.1 per cent).
FINANCIAL STATEMENTS 2015 ANNUAL REPORT CITY OF EDMONTON PG 75

For the year ended December 31, 2015 (in thousands of dollars)
13. other assets
2015 2014 Prepaid expenses – operational $ 14,544 $ 13,958Benefit plan asset 3,883 6,071
$ 18,427 $ 20,029
14. equity in tangible capital assets
2015 2014 Tangible capital assets (Schedule 1) $ 19,130,555 $ 17,976,226Accumulated amortization (Schedule 1) (6,681,470) (6,346,366)Long-term debt (Note 11) (3,033,223) (2,895,724)Debt secured by Sinking Fund assets 79,315 72,615Long-term debt for land redevelopment 41,860 26,881Debt recoverable (Note 5) 60,629 51,446
$ 9,597,666 $ 8,885,078
notes to consolidated financial statements
12. tangible capital assets
2015 2014 Land $ 1,490,894 $ 1,326,455Land improvements 657,412 576,063Buildings 1,168,596 1,110,745Machinery and equipment 356,116 332,724Vehicles 416,090 467,322Engineered structures: Roadway system 3,370,338 3,229,633 Drainage system 2,636,428 2,326,104 Light rail transit 965,895 540,717 Waste 49,364 53,343 Bus system 86,253 83,779 Other 21,235 14,993 11,218,621 10,061,878
Assets under construction 1,230,464 1,567,982
$ $ 12,449,085 $ 11,629,860
Net Book Value
For additional information, see the Consolidated Schedule of Tangible Capital Assets (Schedule 1).
A total of $343,327 in land, land improvements, and engineered structures were contributed to the City in 2015 (2014 - $177,478) and were recorded at their fair value at the time received.
PG 76 2015 ANNUAL REPORT CITY OF EDMONTON FINANCIAL STATEMENTS
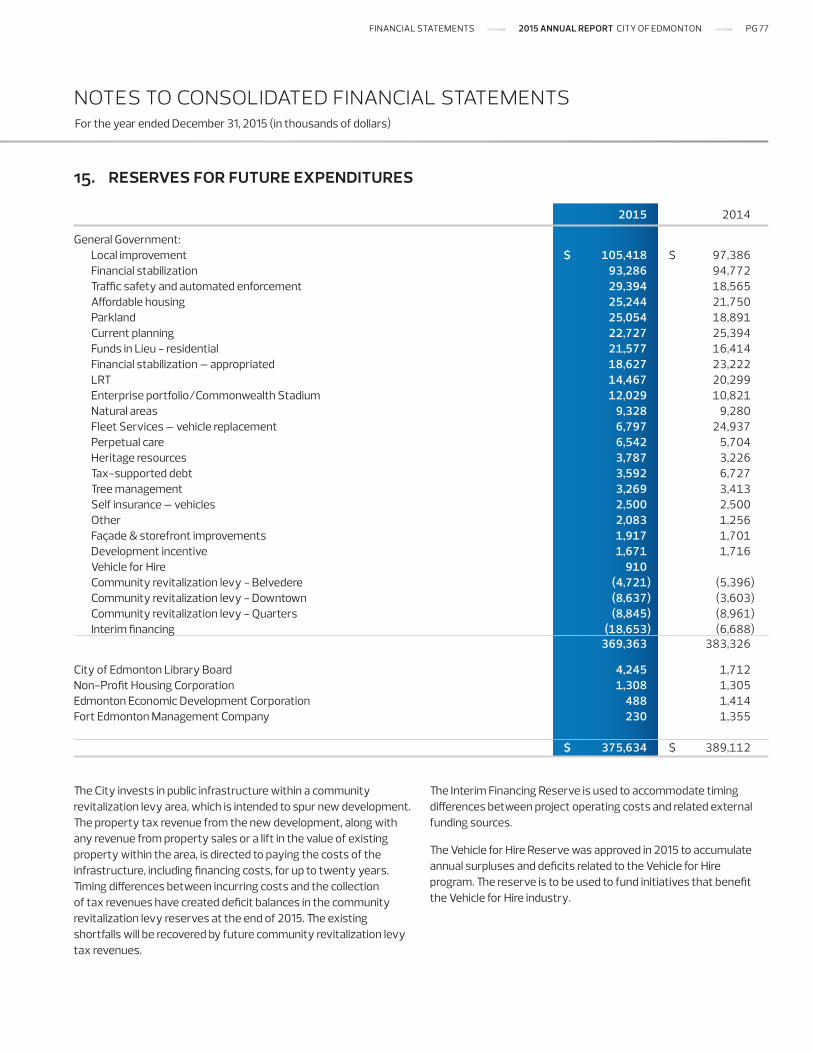
For the year ended December 31, 2015 (in thousands of dollars)
notes to consolidated financial statements
15. reserves for future expenditures
The City invests in public infrastructure within a community revitalization levy area, which is intended to spur new development. The property tax revenue from the new development, along with any revenue from property sales or a lift in the value of existing property within the area, is directed to paying the costs of the infrastructure, including financing costs, for up to twenty years. Timing differences between incurring costs and the collection of tax revenues have created deficit balances in the community revitalization levy reserves at the end of 2015. The existing shortfalls will be recovered by future community revitalization levy tax revenues.
The Interim Financing Reserve is used to accommodate timing differences between project operating costs and related external funding sources.
The Vehicle for Hire Reserve was approved in 2015 to accumulate annual surpluses and deficits related to the Vehicle for Hire program. The reserve is to be used to fund initiatives that benefit the Vehicle for Hire industry.
2015 2014 General Government: Local improvement $ 105,418 $ 97,386 Financial stabilization 93,286 94,772 Traffic safety and automated enforcement 29,394 18,565 Affordable housing 25,244 21,750 Parkland 25,054 18,891 Current planning 22,727 25,394 Funds in Lieu - residential 21,577 16,414 Financial stabilization – appropriated 18,627 23,222 LRT 14,467 20,299 Enterprise portfolio/Commonwealth Stadium 12,029 10,821 Natural areas 9,328 9,280 Fleet Services – vehicle replacement 6,797 24,937 Perpetual care 6,542 5,704 Heritage resources 3,787 3,226 Tax-supported debt 3,592 6,727 Tree management 3,269 3,413 Self insurance – vehicles 2,500 2,500 Other 2,083 1,256 Façade & storefront improvements 1,917 1,701 Development incentive 1,671 1,716 Vehicle for Hire 910 Community revitalization levy - Belvedere (4,721) (5,396) Community revitalization levy - Downtown (8,637) (3,603) Community revitalization levy - Quarters (8,845) (8,961) Interim financing (18,653) (6,688) 369,363 383,326
City of Edmonton Library Board 4,245 1,712Non-Profit Housing Corporation 1,308 1,305Edmonton Economic Development Corporation 488 1,414Fort Edmonton Management Company 230 1,355
$ $ 375,634 $ 389,112
FINANCIAL STATEMENTS 2015 ANNUAL REPORT CITY OF EDMONTON PG 77
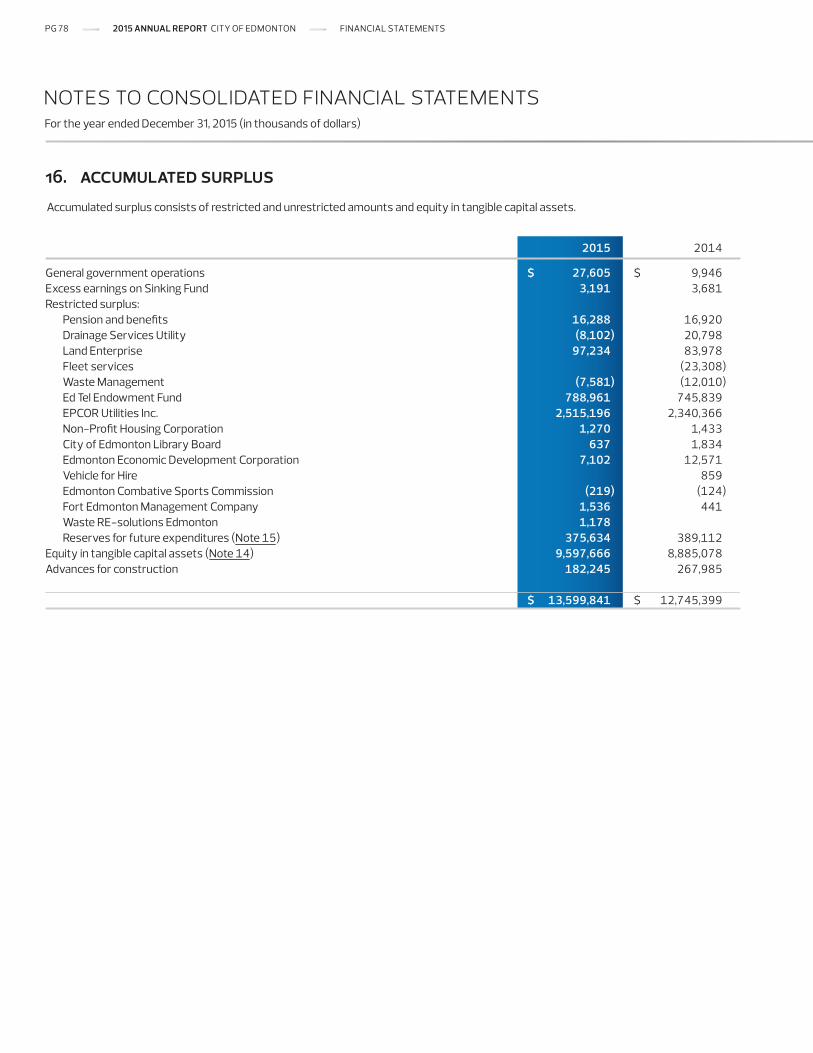
For the year ended December 31, 2015 (in thousands of dollars)
16. accumulated surplusAccumulated surplus consists of restricted and unrestricted amounts and equity in tangible capital assets.
2015 2014 General government operations $ 27,605 $ 9,946Excess earnings on Sinking Fund 3,191 3,681Restricted surplus: Pension and benefits 16,288 16,920 Drainage Services Utility (8,102) 20,798 Land Enterprise 97,234 83,978 Fleet services (23,308) Waste Management (7,581) (12,010) Ed Tel Endowment Fund 788,961 745,839 EPCOR Utilities Inc. 2,515,196 2,340,366 Non-Profit Housing Corporation 1,270 1,433 City of Edmonton Library Board 637 1,834 Edmonton Economic Development Corporation 7,102 12,571 Vehicle for Hire 859 Edmonton Combative Sports Commission (219) (124) Fort Edmonton Management Company 1,536 441 Waste RE-solutions Edmonton 1,178 Reserves for future expenditures (Note 15) 375,634 389,112Equity in tangible capital assets (Note 14) 9,597,666 8,885,078Advances for construction 182,245 267,985
$ 13,599,841 $ 12,745,399
notes to consolidated financial statements
PG 78 2015 ANNUAL REPORT CITY OF EDMONTON FINANCIAL STATEMENTS
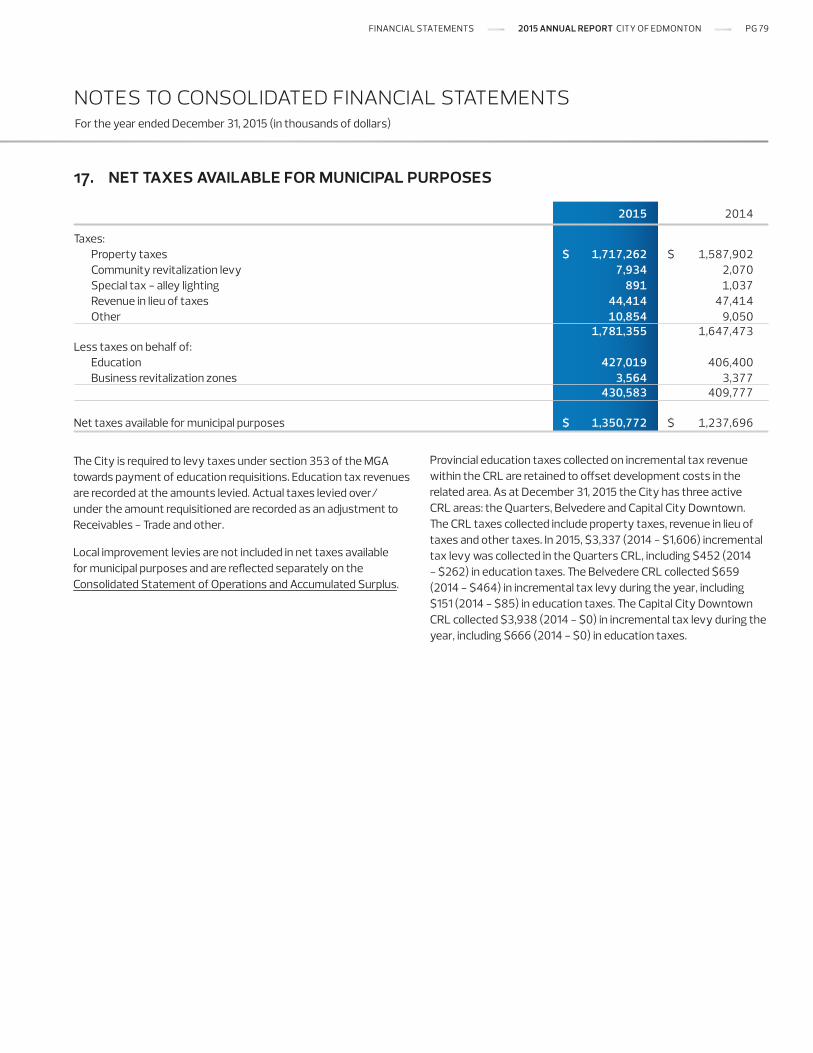
For the year ended December 31, 2015 (in thousands of dollars)
17. net taxes available for municipal purposes
The City is required to levy taxes under section 353 of the MGA towards payment of education requisitions. Education tax revenues are recorded at the amounts levied. Actual taxes levied over/under the amount requisitioned are recorded as an adjustment to Receivables - Trade and other.
Local improvement levies are not included in net taxes available for municipal purposes and are reflected separately on the Consolidated Statement of Operations and Accumulated Surplus.
Provincial education taxes collected on incremental tax revenue within the CRL are retained to offset development costs in the related area. As at December 31, 2015 the City has three active CRL areas: the Quarters, Belvedere and Capital City Downtown. The CRL taxes collected include property taxes, revenue in lieu of taxes and other taxes. In 2015, $3,337 (2014 - $1,606) incremental tax levy was collected in the Quarters CRL, including $452 (2014 - $262) in education taxes. The Belvedere CRL collected $659 (2014 - $464) in incremental tax levy during the year, including $151 (2014 - $85) in education taxes. The Capital City Downtown CRL collected $3,938 (2014 - $0) in incremental tax levy during the year, including $666 (2014 - $0) in education taxes.
2015 2014 Taxes: Property taxes $ 1,717,262 $ 1,587,902 Community revitalization levy 7,934 2,070 Special tax - alley lighting 891 1,037 Revenue in lieu of taxes 44,414 47,414 Other 10,854 9,050 1,781,355 1,647,473Less taxes on behalf of: Education 427,019 406,400 Business revitalization zones 3,564 3,377 430,583 409,777 Net taxes available for municipal purposes $ 1,350,772 $ 1,237,696
notes to consolidated financial statements
FINANCIAL STATEMENTS 2015 ANNUAL REPORT CITY OF EDMONTON PG 79
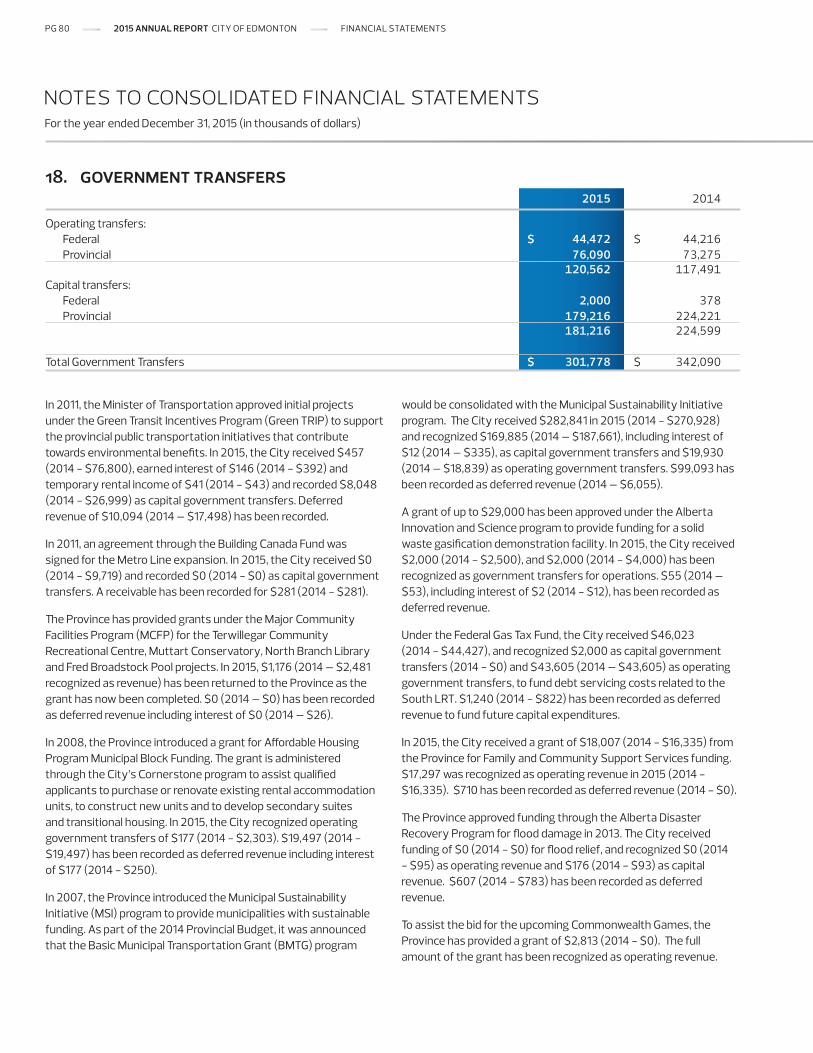
18. government transfers
In 2011, the Minister of Transportation approved initial projects under the Green Transit Incentives Program (Green TRIP) to support the provincial public transportation initiatives that contribute towards environmental benefits. In 2015, the City received $457 (2014 - $76,800), earned interest of $146 (2014 - $392) and temporary rental income of $41 (2014 - $43) and recorded $8,048 (2014 - $26,999) as capital government transfers. Deferred revenue of $10,094 (2014 – $17,498) has been recorded.
In 2011, an agreement through the Building Canada Fund was signed for the Metro Line expansion. In 2015, the City received $0 (2014 - $9,719) and recorded $0 (2014 - $0) as capital government transfers. A receivable has been recorded for $281 (2014 - $281).
The Province has provided grants under the Major Community Facilities Program (MCFP) for the Terwillegar Community Recreational Centre, Muttart Conservatory, North Branch Library and Fred Broadstock Pool projects. In 2015, $1,176 (2014 – $2,481 recognized as revenue) has been returned to the Province as the grant has now been completed. $0 (2014 – $0) has been recorded as deferred revenue including interest of $0 (2014 – $26).
In 2008, the Province introduced a grant for Affordable Housing Program Municipal Block Funding. The grant is administered through the City’s Cornerstone program to assist qualified applicants to purchase or renovate existing rental accommodation units, to construct new units and to develop secondary suites and transitional housing. In 2015, the City recognized operating government transfers of $177 (2014 - $2,303). $19,497 (2014 - $19,497) has been recorded as deferred revenue including interest of $177 (2014 - $250).
In 2007, the Province introduced the Municipal Sustainability Initiative (MSI) program to provide municipalities with sustainable funding. As part of the 2014 Provincial Budget, it was announced that the Basic Municipal Transportation Grant (BMTG) program
would be consolidated with the Municipal Sustainability Initiative program. The City received $282,841 in 2015 (2014 - $270,928) and recognized $169,885 (2014 – $187,661), including interest of $12 (2014 – $335), as capital government transfers and $19,930 (2014 – $18,839) as operating government transfers. $99,093 has been recorded as deferred revenue (2014 – $6,055).
A grant of up to $29,000 has been approved under the Alberta Innovation and Science program to provide funding for a solid waste gasification demonstration facility. In 2015, the City received $2,000 (2014 - $2,500), and $2,000 (2014 - $4,000) has been recognized as government transfers for operations. $55 (2014 – $53), including interest of $2 (2014 - $12), has been recorded as deferred revenue.
Under the Federal Gas Tax Fund, the City received $46,023 (2014 - $44,427), and recognized $2,000 as capital government transfers (2014 - $0) and $43,605 (2014 – $43,605) as operating government transfers, to fund debt servicing costs related to the South LRT. $1,240 (2014 - $822) has been recorded as deferred revenue to fund future capital expenditures.
In 2015, the City received a grant of $18,007 (2014 - $16,335) from the Province for Family and Community Support Services funding. $17,297 was recognized as operating revenue in 2015 (2014 - $16,335). $710 has been recorded as deferred revenue (2014 - $0).
The Province approved funding through the Alberta Disaster Recovery Program for flood damage in 2013. The City received funding of $0 (2014 - $0) for flood relief, and recognized $0 (2014 - $95) as operating revenue and $176 (2014 - $93) as capital revenue. $607 (2014 - $783) has been recorded as deferred revenue.
To assist the bid for the upcoming Commonwealth Games, the Province has provided a grant of $2,813 (2014 - $0). The full amount of the grant has been recognized as operating revenue.
For the year ended December 31, 2015 (in thousands of dollars)
2015 2014 Operating transfers: Federal $ 44,472 $ 44,216 Provincial 76,090 73,275 120,562 117,491Capital transfers: Federal 2,000 378 Provincial 179,216 224,221 181,216 224,599
Total Government Transfers $ 301,778 $ 342,090
notes to consolidated financial statements
PG 80 2015 ANNUAL REPORT CITY OF EDMONTON FINANCIAL STATEMENTS
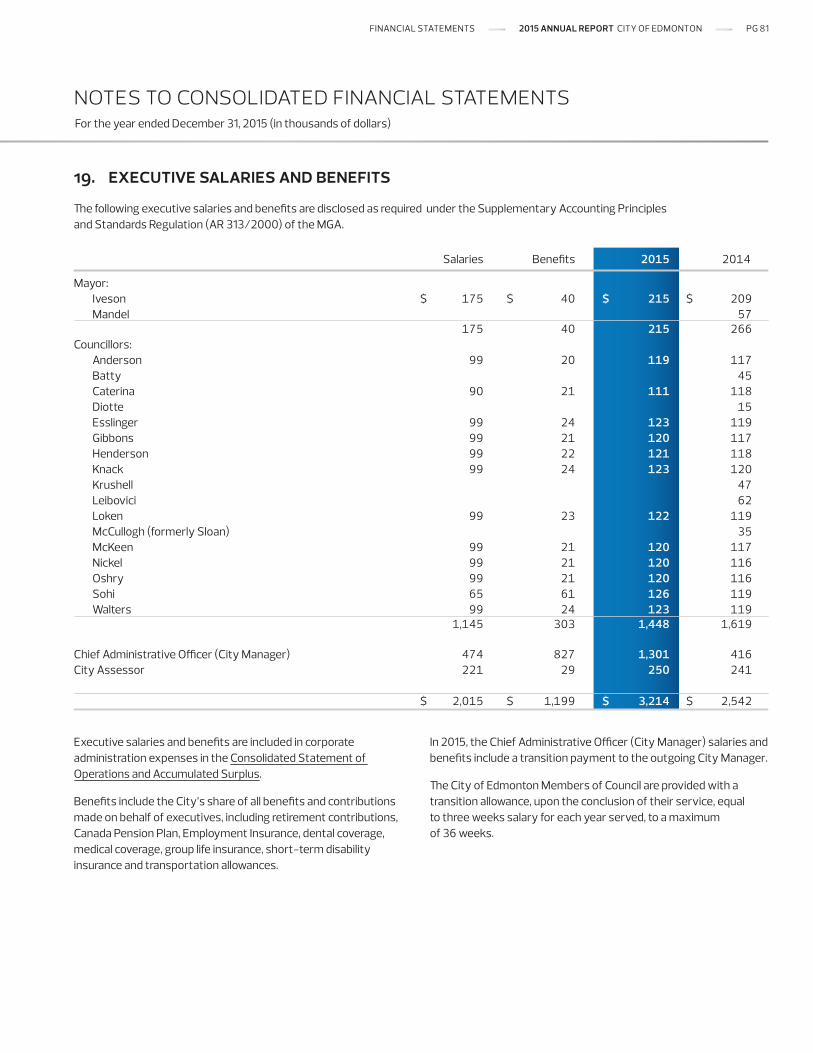
19. executive salaries and benefits
The following executive salaries and benefits are disclosed as required under the Supplementary Accounting Principles and Standards Regulation (AR 313/2000) of the MGA.
Executive salaries and benefits are included in corporate administration expenses in the Consolidated Statement of Operations and Accumulated Surplus.
Benefits include the City’s share of all benefits and contributions made on behalf of executives, including retirement contributions, Canada Pension Plan, Employment Insurance, dental coverage, medical coverage, group life insurance, short-term disability insurance and transportation allowances.
In 2015, the Chief Administrative Officer (City Manager) salaries and benefits include a transition payment to the outgoing City Manager.
The City of Edmonton Members of Council are provided with a transition allowance, upon the conclusion of their service, equal to three weeks salary for each year served, to a maximum of 36 weeks.
For the year ended December 31, 2015 (in thousands of dollars)
Salaries Benefits 2015 2014 Mayor: Iveson $ 175 $ 40 $ 215 $ 209 Mandel 57 175 40 215 266Councillors: Anderson 99 20 119 117 Batty 45 Caterina 90 21 111 118 Diotte 15 Esslinger 99 24 123 119 Gibbons 99 21 120 117 Henderson 99 22 121 118 Knack 99 24 123 120 Krushell 47 Leibovici 62 Loken 99 23 122 119 McCullogh (formerly Sloan) 35 McKeen 99 21 120 117 Nickel 99 21 120 116 Oshry 99 21 120 116 Sohi 65 61 126 119 Walters 99 24 123 119 1,145 303 1,448 1,619 Chief Administrative Officer (City Manager) 474 827 1,301 416City Assessor 221 29 250 241
$ 2,015 $ 1,199 $ 3,214 $ 2,542
notes to consolidated financial statements
FINANCIAL STATEMENTS 2015 ANNUAL REPORT CITY OF EDMONTON PG 81
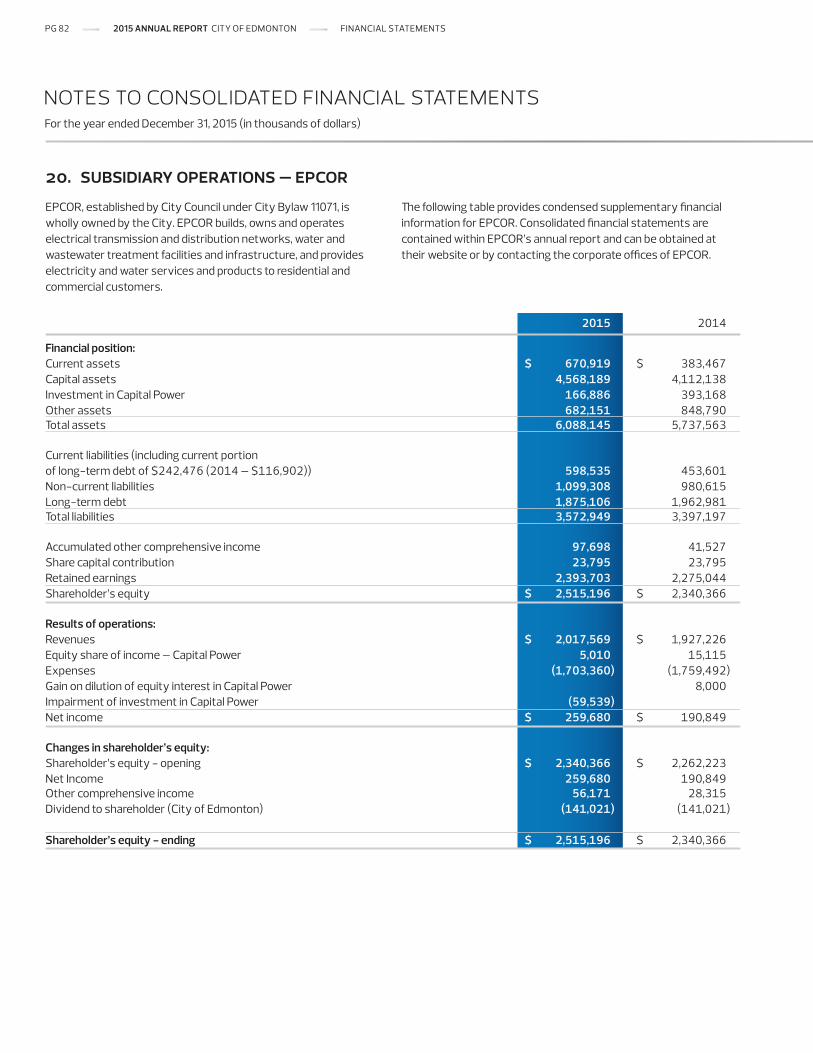
For the year ended December 31, 2015 (in thousands of dollars)
20. subsidiary operations – epcorEPCOR, established by City Council under City Bylaw 11071, is wholly owned by the City. EPCOR builds, owns and operates electrical transmission and distribution networks, water and wastewater treatment facilities and infrastructure, and provides electricity and water services and products to residential and commercial customers.
The following table provides condensed supplementary financial information for EPCOR. Consolidated financial statements are contained within EPCOR’s annual report and can be obtained at their website or by contacting the corporate offices of EPCOR.
2015 2014 Financial position:Current assets $ 670,919 $ 383,467Capital assets 4,568,189 4,112,138Investment in Capital Power 166,886 393,168Other assets 682,151 848,790Total assets 6,088,145 5,737,563
Current liabilities (including current portionof long-term debt of $242,476 (2014 – $116,902)) 598,535 453,601Non-current liabilities 1,099,308 980,615Long-term debt 1,875,106 1,962,981Total liabilities 3,572,949 3,397,197
Accumulated other comprehensive income 97,698 41,527Share capital contribution 23,795 23,795Retained earnings 2,393,703 2,275,044Shareholder’s equity $ 2,515,196 $ 2,340,366
Results of operations:Revenues $ 2,017,569 $ 1,927,226Equity share of income – Capital Power 5,010 15,115Expenses (1,703,360) (1,759,492)Gain on dilution of equity interest in Capital Power 8,000Impairment of investment in Capital Power (59,539) Net income $ 259,680 $ 190,849 Changes in shareholder’s equity:Shareholder’s equity - opening $ 2,340,366 $ 2,262,223Net Income 259,680 190,849 Other comprehensive income 56,171 28,315Dividend to shareholder (City of Edmonton) (141,021) (141,021)
Shareholder’s equity - ending $ 2,515,196 $ 2,340,366
notes to consolidated financial statements
PG 82 2015 ANNUAL REPORT CITY OF EDMONTON FINANCIAL STATEMENTS
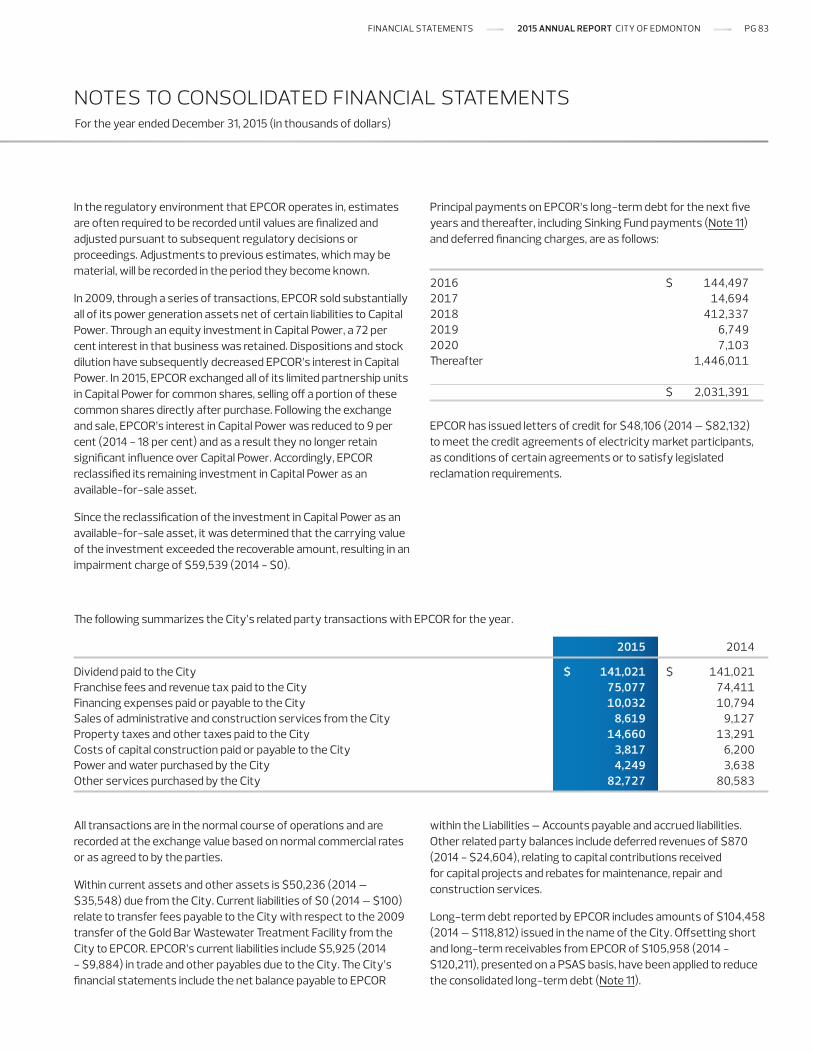
For the year ended December 31, 2015 (in thousands of dollars)
EPCOR has issued letters of credit for $48,106 (2014 – $82,132) to meet the credit agreements of electricity market participants, as conditions of certain agreements or to satisfy legislated reclamation requirements.
In the regulatory environment that EPCOR operates in, estimates are often required to be recorded until values are finalized and adjusted pursuant to subsequent regulatory decisions or proceedings. Adjustments to previous estimates, which may be material, will be recorded in the period they become known.
In 2009, through a series of transactions, EPCOR sold substantially all of its power generation assets net of certain liabilities to Capital Power. Through an equity investment in Capital Power, a 72 per cent interest in that business was retained. Dispositions and stock dilution have subsequently decreased EPCOR’s interest in Capital Power. In 2015, EPCOR exchanged all of its limited partnership units in Capital Power for common shares, selling off a portion of these common shares directly after purchase. Following the exchange and sale, EPCOR’s interest in Capital Power was reduced to 9 per cent (2014 - 18 per cent) and as a result they no longer retain significant influence over Capital Power. Accordingly, EPCOR reclassified its remaining investment in Capital Power as an available-for-sale asset.
Since the reclassification of the investment in Capital Power as an available-for-sale asset, it was determined that the carrying value of the investment exceeded the recoverable amount, resulting in an impairment charge of $59,539 (2014 - $0).
Principal payments on EPCOR’s long-term debt for the next five years and thereafter, including Sinking Fund payments (Note 11) and deferred financing charges, are as follows:
2016 $ 144,4972017 14,6942018 412,3372019 6,7492020 7,103Thereafter 1,446,011 $ 2,031,391
notes to consolidated financial statements
All transactions are in the normal course of operations and are recorded at the exchange value based on normal commercial rates or as agreed to by the parties.
Within current assets and other assets is $50,236 (2014 – $35,548) due from the City. Current liabilities of $0 (2014 – $100) relate to transfer fees payable to the City with respect to the 2009 transfer of the Gold Bar Wastewater Treatment Facility from the City to EPCOR. EPCOR’s current liabilities include $5,925 (2014 - $9,884) in trade and other payables due to the City. The City’s financial statements include the net balance payable to EPCOR
within the Liabilities – Accounts payable and accrued liabilities. Other related party balances include deferred revenues of $870 (2014 - $24,604), relating to capital contributions received for capital projects and rebates for maintenance, repair and construction services.
Long-term debt reported by EPCOR includes amounts of $104,458 (2014 – $118,812) issued in the name of the City. Offsetting short and long-term receivables from EPCOR of $105,958 (2014 - $120,211), presented on a PSAS basis, have been applied to reduce the consolidated long-term debt (Note 11).
2015 2014 Dividend paid to the City $ 141,021 $ 141,021Franchise fees and revenue tax paid to the City 75,077 74,411Financing expenses paid or payable to the City 10,032 10,794Sales of administrative and construction services from the City 8,619 9,127Property taxes and other taxes paid to the City 14,660 13,291Costs of capital construction paid or payable to the City 3,817 6,200Power and water purchased by the City 4,249 3,638Other services purchased by the City 82,727 80,583
The following summarizes the City’s related party transactions with EPCOR for the year.
FINANCIAL STATEMENTS 2015 ANNUAL REPORT CITY OF EDMONTON PG 83
For the year ended December 31, 2015 (in thousands of dollars)
21. pension and long-term disability plans
a. local authorities pension plan
All employees of the City, with the exception of police officers, are members of the Local Authorities Pension Plan (LAPP), which is one of the multi-employer plans covered by the Public Sector Pension Plans Act of Alberta.
The City is required to make current service contributions to the Plan of 11.39 per cent of pensionable payroll up to the yearly maximum pensionable earnings (YMPE) and 15.84 per cent thereafter. Employees of the City are required to make current service contributions of 10.39 per cent of pensionable salary up to YMPE and 14.84 per cent thereafter. Contributions for current service are recorded as expenses in the year in which they become due.
Total current service contributions by the City to the LAPP in 2015 were $100,777 (2014 – $96,787) and by the employees to the LAPP in 2015 were $92,490 (2014 – $88,648).
The LAPP reported a deficiency for the overall plan as at December 31, 2014 of $2,454,636. Information as at December 31, 2015 was not available at the time of preparing these financial statements.
b. special forces pension plan
Police officers employed by the City are participants in the multi-employer Special Forces Pension Plan (SFPP). The City is required to make current service contributions to the Plan of 10.26 per cent of pensionable payroll. In addition, past service contributions to the Plan of 0.75 per cent of pensionable payroll are required to eliminate an unfunded liability related to service prior to 1992, on or before December 31, 2036. Additional past service contributions of 2.79 per cent of pensionable payroll were implemented July 1, 2010 to eliminate an unfunded liability related to post-1991 service amortized over no more than 15 years. Participants of the SFPP are required to make current service contributions of 9.16 per cent of pensionable salary. As well, past service contributions of 0.75 per cent and 2.79 per cent of pensionable salary are required, consistent with those described for the City. Contributions for current and past service are recorded as expenses in the year in which they become due.
Total current and past service contributions by the City to the SFPP in 2015 were $24,482 (2014 – $23,935) and by the employees to the SFPP in 2015 were $22,632 (2014 – $22,125).
The SFPP reported a deficiency for the plan as at December 31, 2014 of $190,999 comprised of $199,339 for pre-1992 and a surplus of $8,340 relating to post-1991. More recent information was not available at the time of preparing these financial statements.
c. city-sponsored pension plans
The following summarizes plans sponsored by the City. Assets related to the plans are held in trust as disclosed in Note 25.
i. Annuity Plan
The multi-employer Annuity Fund provided lifetime benefits to retired members and beneficiaries only. As of December 4, 2014 there are no longer any beneficiaries of this plan and the fund is closed to new members. The plan is being wound up and surplus funds attributable to the City are not yet known. The surplus fund position is being held in trust by the City until the assets are distributed.
Total benefits paid during the year were $0 (2014 – $6).
ii. Police Supplementary Pension Plan
The Police Supplementary Pension Plan (PSPP) provides benefits supplementary to the LAPP for 15 pensioners and beneficiaries. There are no active police officers enrolled in the PSPP and no further contributions are expected to be made to the Fund.
Total benefits paid during the year were $54 (2014 – $55).
notes to consolidated financial statements
PG 84 2015 ANNUAL REPORT CITY OF EDMONTON FINANCIAL STATEMENTS
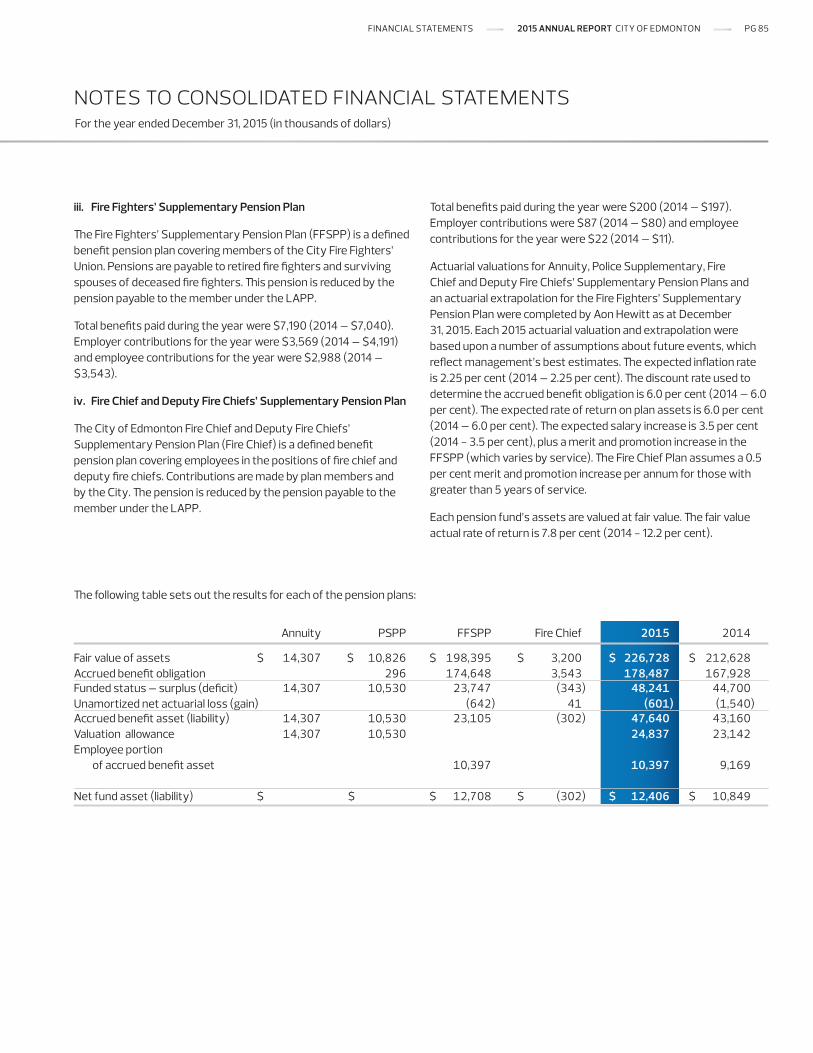
iii. Fire Fighters’ Supplementary Pension Plan
The Fire Fighters’ Supplementary Pension Plan (FFSPP) is a defined benefit pension plan covering members of the City Fire Fighters’ Union. Pensions are payable to retired fire fighters and surviving spouses of deceased fire fighters. This pension is reduced by the pension payable to the member under the LAPP.
Total benefits paid during the year were $7,190 (2014 – $7,040). Employer contributions for the year were $3,569 (2014 – $4,191) and employee contributions for the year were $2,988 (2014 – $3,543).
iv. Fire Chief and Deputy Fire Chiefs’ Supplementary Pension Plan
The City of Edmonton Fire Chief and Deputy Fire Chiefs’ Supplementary Pension Plan (Fire Chief) is a defined benefit pension plan covering employees in the positions of fire chief and deputy fire chiefs. Contributions are made by plan members and by the City. The pension is reduced by the pension payable to the member under the LAPP.
Total benefits paid during the year were $200 (2014 – $197). Employer contributions were $87 (2014 – $80) and employee contributions for the year were $22 (2014 – $11).
Actuarial valuations for Annuity, Police Supplementary, Fire Chief and Deputy Fire Chiefs’ Supplementary Pension Plans and an actuarial extrapolation for the Fire Fighters’ Supplementary Pension Plan were completed by Aon Hewitt as at December 31, 2015. Each 2015 actuarial valuation and extrapolation were based upon a number of assumptions about future events, which reflect management’s best estimates. The expected inflation rate is 2.25 per cent (2014 – 2.25 per cent). The discount rate used to determine the accrued benefit obligation is 6.0 per cent (2014 – 6.0 per cent). The expected rate of return on plan assets is 6.0 per cent (2014 – 6.0 per cent). The expected salary increase is 3.5 per cent (2014 - 3.5 per cent), plus a merit and promotion increase in the FFSPP (which varies by service). The Fire Chief Plan assumes a 0.5 per cent merit and promotion increase per annum for those with greater than 5 years of service.
Each pension fund’s assets are valued at fair value. The fair value actual rate of return is 7.8 per cent (2014 - 12.2 per cent).
For the year ended December 31, 2015 (in thousands of dollars)
notes to consolidated financial statements
Annuity PSPP FFSPP Fire Chief 2015 2014 Fair value of assets $ 14,307 $ 10,826 $ 198,395 $ 3,200 $ 226,728 $ 212,628Accrued benefit obligation 296 174,648 3,543 178,487 167,928Funded status – surplus (deficit) 14,307 10,530 23,747 (343) 48,241 44,700Unamortized net actuarial loss (gain) (642) 41 (601) (1,540)Accrued benefit asset (liability) 14,307 10,530 23,105 (302) 47,640 43,160Valuation allowance 14,307 10,530 24,837 23,142Employee portion of accrued benefit asset 10,397 10,397 9,169 Net fund asset (liability) $ $ $ 12,708 $ (302) $ 12,406 $ 10,849
The following table sets out the results for each of the pension plans:
FINANCIAL STATEMENTS 2015 ANNUAL REPORT CITY OF EDMONTON PG 85
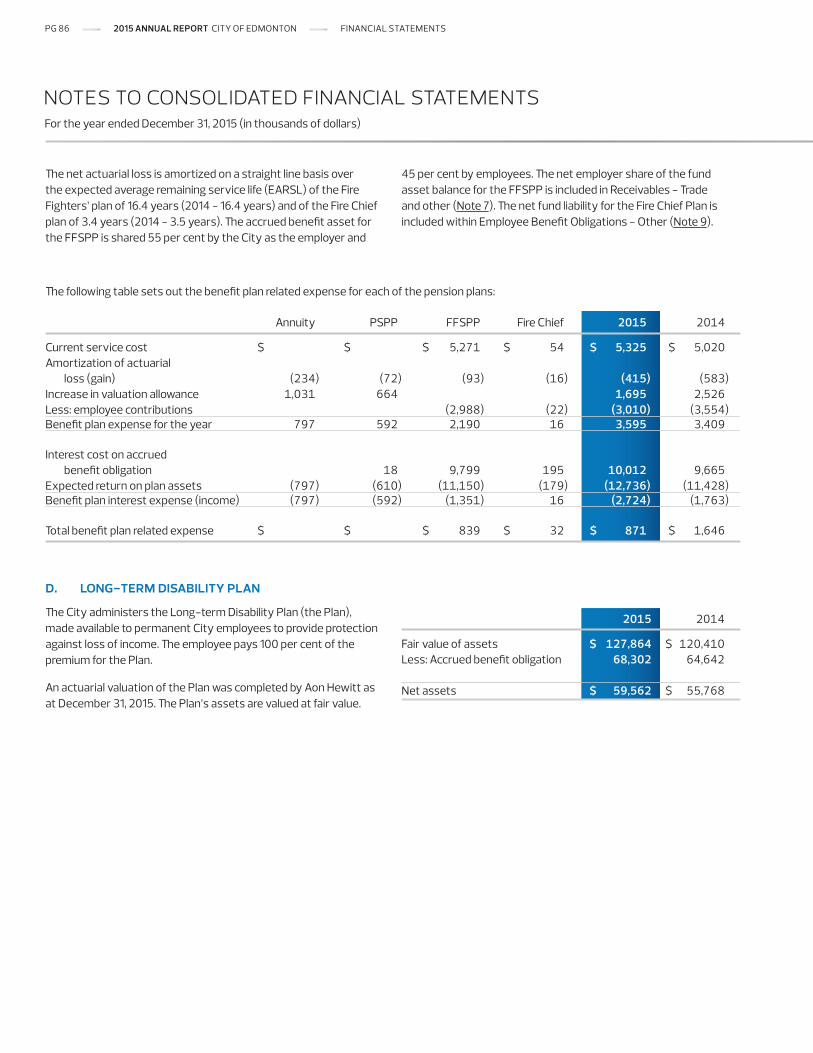
For the year ended December 31, 2015 (in thousands of dollars)
d. long-term disability plan
The City administers the Long-term Disability Plan (the Plan), made available to permanent City employees to provide protection against loss of income. The employee pays 100 per cent of the premium for the Plan.
An actuarial valuation of the Plan was completed by Aon Hewitt as at December 31, 2015. The Plan’s assets are valued at fair value.
The net actuarial loss is amortized on a straight line basis over the expected average remaining service life (EARSL) of the Fire Fighters’ plan of 16.4 years (2014 - 16.4 years) and of the Fire Chief plan of 3.4 years (2014 - 3.5 years). The accrued benefit asset for the FFSPP is shared 55 per cent by the City as the employer and
45 per cent by employees. The net employer share of the fund asset balance for the FFSPP is included in Receivables - Trade and other (Note 7). The net fund liability for the Fire Chief Plan is included within Employee Benefit Obligations - Other (Note 9).
Annuity PSPP FFSPP Fire Chief 2015 2014 Current service cost $ $ $ 5,271 $ 54 $ 5,325 $ 5,020Amortization of actuarial loss (gain) (234) (72) (93) (16) (415) (583)Increase in valuation allowance 1,031 664 1,695 2,526Less: employee contributions (2,988) (22) (3,010) (3,554)Benefit plan expense for the year 797 592 2,190 16 3,595 3,409
Interest cost on accrued benefit obligation 18 9,799 195 10,012 9,665Expected return on plan assets (797) (610) (11,150) (179) (12,736) (11,428)Benefit plan interest expense (income) (797) (592) (1,351) 16 (2,724) (1,763) Total benefit plan related expense $ $ $ 839 $ 32 $ 871 $ 1,646
2015 2014 Fair value of assets $ 127,864 $ 120,410Less: Accrued benefit obligation 68,302 64,642
Net assets $ 59,562 $ 55,768
notes to consolidated financial statements
The following table sets out the benefit plan related expense for each of the pension plans:
PG 86 2015 ANNUAL REPORT CITY OF EDMONTON FINANCIAL STATEMENTS
For the year ended December 31, 2015 (in thousands of dollars)
22. commitments
a. lease commitments
The City has entered into a number of operating lease agreements, mainly for facilities and equipment. Lease commitments over the next five years and thereafter are as follows:
2016 $ 18,3682017 24,1962018 21,7032019 19,0752020 16,784Thereafter 261,314 $ 361,440
23. liability for contaminated sites
As of December 31, 2015, the liability for contaminated sites includes sites associated with former City operations, sites acquired through tax forfeiture, historical acquisition of properties, and former unofficial waste disposal sites from early in the City’s history. The nature of contamination includes chemicals, heavy metals, salt and other organic and inorganic contaminants. The sources of contamination include underground fuel storage tanks, fuel handling, vehicle storage and maintenance, metal
manufacturing, stockyards, and the leaching of materials deposited in unauthorized landfills. The City has recognized a liability of $2,657 for remediation of contaminated sites and has reported this liability in Accounts payable and accrued liabilities (Note 7, Trade and other) in the Consolidated Statement of Financial Position.
24. contingent liabilities
a. The City is the defendant in various lawsuits as at December 31, 2015. Where the occurrence of future events is considered likely to result in a loss with respect to an existing condition, and the amount of loss can be reasonably estimated, amounts have been included within accrued liabilities. Where the resulting losses, if any, cannot be determined or the occurrence of future events is unknown, amounts have not been recorded, and the City’s Administration believes there will be no material adverse effect on the financial position of the City.
b. The City continues to review environmental objectives and liabilities for its activities and properties as well as any potential reclamation obligations. There may be contaminated sites that the City has identified that have the potential to result in remediation obligations. A liability has not been recorded for these sites because either the likelihood of the City becoming responsible for the site is not determinable, the amount of the liability cannot be estimated, or both.
b. contractual obligations
To mitigate the risk of fluctuations in fuel prices the City has entered into swap transactions to purchase 21.4 million litres of heating oil for monthly periods from January 2016 through December 2016. The contracts have settlement dates ranging from February 5, 2016 through January 9, 2017 at prices from $0.52 to $0.68 per litre, or $13,121.
In February 2016 the City entered into a Public-Private Partnership Agreement for the design, construction, operation and maintenance of stage 1 of the Valley Line LRT from Mill Woods to Downtown. The construction period runs from 2016-2020. The total commitment for construction over the life of the contract is $1,456,495. The operating and maintenance period runs from 2021-2050. The total commitment for the service level payments and maintenance payments to be made during the operating period is based on current estimated ridership levels and inflation. The service level payments are estimated to be $830,000 and maintenance payments are estimated to be $250,000.
notes to consolidated financial statements
FINANCIAL STATEMENTS 2015 ANNUAL REPORT CITY OF EDMONTON PG 87
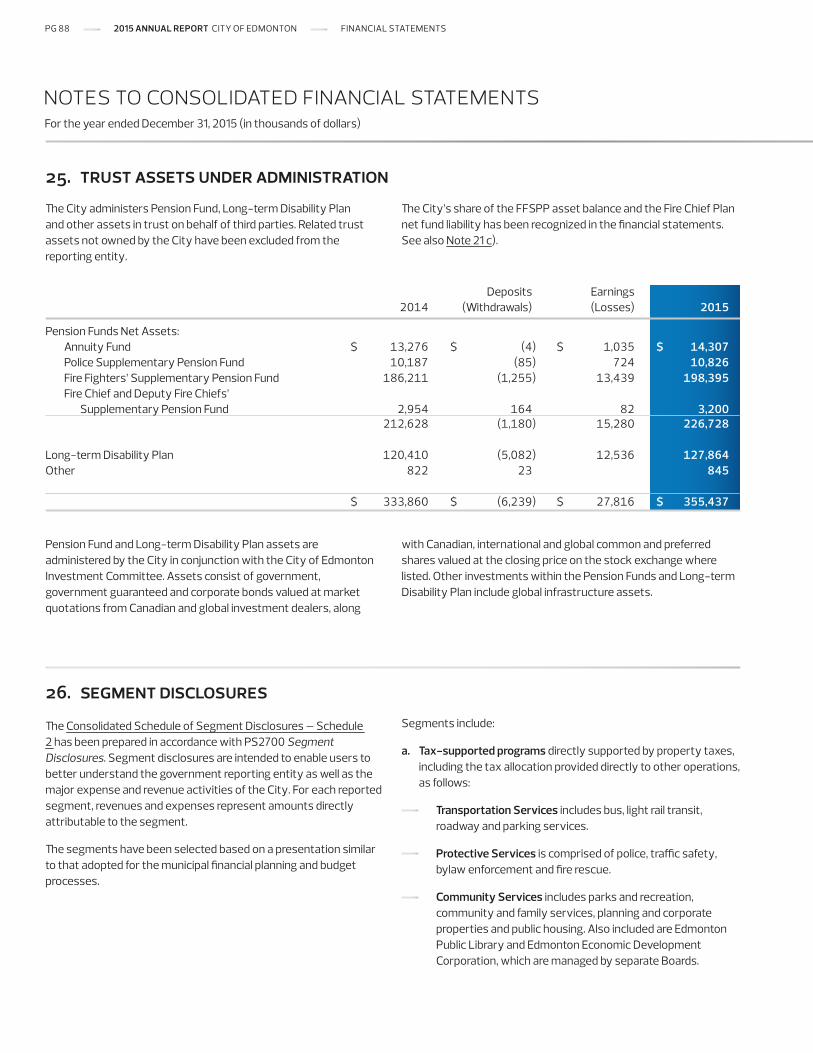
25. trust assets under administration
The City administers Pension Fund, Long-term Disability Plan and other assets in trust on behalf of third parties. Related trust assets not owned by the City have been excluded from the reporting entity.
The City’s share of the FFSPP asset balance and the Fire Chief Plan net fund liability has been recognized in the financial statements. See also Note 21 c).
For the year ended December 31, 2015 (in thousands of dollars)
Pension Fund and Long-term Disability Plan assets are administered by the City in conjunction with the City of Edmonton Investment Committee. Assets consist of government, government guaranteed and corporate bonds valued at market quotations from Canadian and global investment dealers, along
with Canadian, international and global common and preferred shares valued at the closing price on the stock exchange where listed. Other investments within the Pension Funds and Long-term Disability Plan include global infrastructure assets.
26. segment disclosures
The Consolidated Schedule of Segment Disclosures – Schedule 2 has been prepared in accordance with PS2700 Segment Disclosures. Segment disclosures are intended to enable users to better understand the government reporting entity as well as the major expense and revenue activities of the City. For each reported segment, revenues and expenses represent amounts directly attributable to the segment.
The segments have been selected based on a presentation similar to that adopted for the municipal financial planning and budget processes.
Segments include:
a. Tax-supported programs directly supported by property taxes, including the tax allocation provided directly to other operations, as follows:
Transportation Services includes bus, light rail transit, roadway and parking services.
Protective Services is comprised of police, traffic safety, bylaw enforcement and fire rescue.
Community Services includes parks and recreation, community and family services, planning and corporate properties and public housing. Also included are Edmonton Public Library and Edmonton Economic Development Corporation, which are managed by separate Boards.
Deposits Earnings 2014 (Withdrawals) (Losses) 2015 Pension Funds Net Assets: Annuity Fund $ 13,276 $ (4) $ 1,035 $ 14,307 Police Supplementary Pension Fund 10,187 (85) 724 10,826 Fire Fighters’ Supplementary Pension Fund 186,211 (1,255) 13,439 198,395 Fire Chief and Deputy Fire Chiefs’ Supplementary Pension Fund 2,954 164 82 3,200 212,628 (1,180) 15,280 226,728
Long-term Disability Plan 120,410 (5,082) 12,536 127,864Other 822 23 845
$ 333,860 $ (6,239) $ 27,816 $ 355,437
notes to consolidated financial statements
PG 88 2015 ANNUAL REPORT CITY OF EDMONTON FINANCIAL STATEMENTS
For the year ended December 31, 2015 (in thousands of dollars)
28. comparative informationCertain comparative information has been reclassified to conform with the financial statement presentation adopted for the current year.
27. change in accounting policy
In June 2010, the Public Sector Accounting Board issued PS3260 Liability for Contaminated Sites accounting standard effective for fiscal years beginning on or after April 1, 2014. Section PS3260 establishes standards on how to account for and report a liability associated with the remediation of contaminated sites. On January 1, 2015, the City adopted PS3260 on a prospective basis.
The adoption of this standard resulted in an increase of $855 in Accounts payable and accrued liabilities on the Consolidated Statement of Financial Position and $855 was reported as a Contracted and general services expense for Land Enterprise in the Consolidated Statement of Operations and Accumulated Surplus and Schedule 2 – Consolidated Statement of Segment Disclosures.
Fleet Services provides vehicle and equipment procurement, maintenance, fleet engineering, fabrication services, fuel management and fleet administration to other City departments, and external customers, including EPCOR. The area operates under a full cost recovery model by directly charging other City departments for the provision of fleet services. Fleet Services transitioned from an enterprise operation to a tax-supported operation effective January 1, 2015.
Other Tax-Supported consists of corporate administration, general municipal services, tax appeals and allowances and excess (deficiency) in Sinking Fund earnings. Revenues that are not directly attributed to another tax-supported segment are also recorded within this other tax-supported segment.
b. Waste Management delivers customer-focused services consisting of collection, processing and disposal of residential and non-residential waste and recyclables, as well as community relation services in support of waste management programs. Also included is Waste RE-solutions Edmonton.
c. Drainage Services includes the Sanitary Drainage Utility (collection and transmission of wastewater) as well as the Stormwater Drainage Utility (collection and transmission of storm water) and design and construction activities. The utilities operate under a full cost recovery model to support operating requirements and address long-term capital requirements.
d. Land Enterprise is comprised of land development and municipal use property activities. Land development includes the City’s role as a land developer in the areas of acquisition, development and land sales activities. Municipal use property involves the acquisition of land for municipal purposes and the disposal of land deemed surplus to municipal needs. Land Enterprise is intended to be operated on a self-sustaining basis.
e. EPCOR is a wholly owned subsidiary of the City of Edmonton, accounted for on a modified equity basis as a government business enterprise. Note 20 to these financial statements provides condensed financial information for EPCOR.
f. Other includes the Ed Tel Endowment Fund, the Non-Profit Housing Corporation, Vehicle for Hire, the Combative Sports Commission, Fort Edmonton Management Company and other pension adjustments. The Ed Tel Endowment Fund is an investment fund created in 1995 with the proceeds from the sale of the municipal telephone company. The proceeds from the sale were invested and provide an annual dividend to support tax-supported programs based on conditions set out in Bylaw 11713. Non-Profit Housing was established by the City in 1977 for the purpose of providing non-profit housing for citizens.
The accounting policies used in the segment disclosures are consistent with those followed in the preparation of the financial statements (Note 1).
notes to consolidated financial statements
FINANCIAL STATEMENTS 2015 ANNUAL REPORT CITY OF EDMONTON PG 89
statistical review
PG 90 2015 ANNUAL REPORT CITY OF EDMONTON STATISTICAL REVIEW
STATISTICAL REVIEW 2015 ANNUAL REPORT CITY OF EDMONTON PG 91
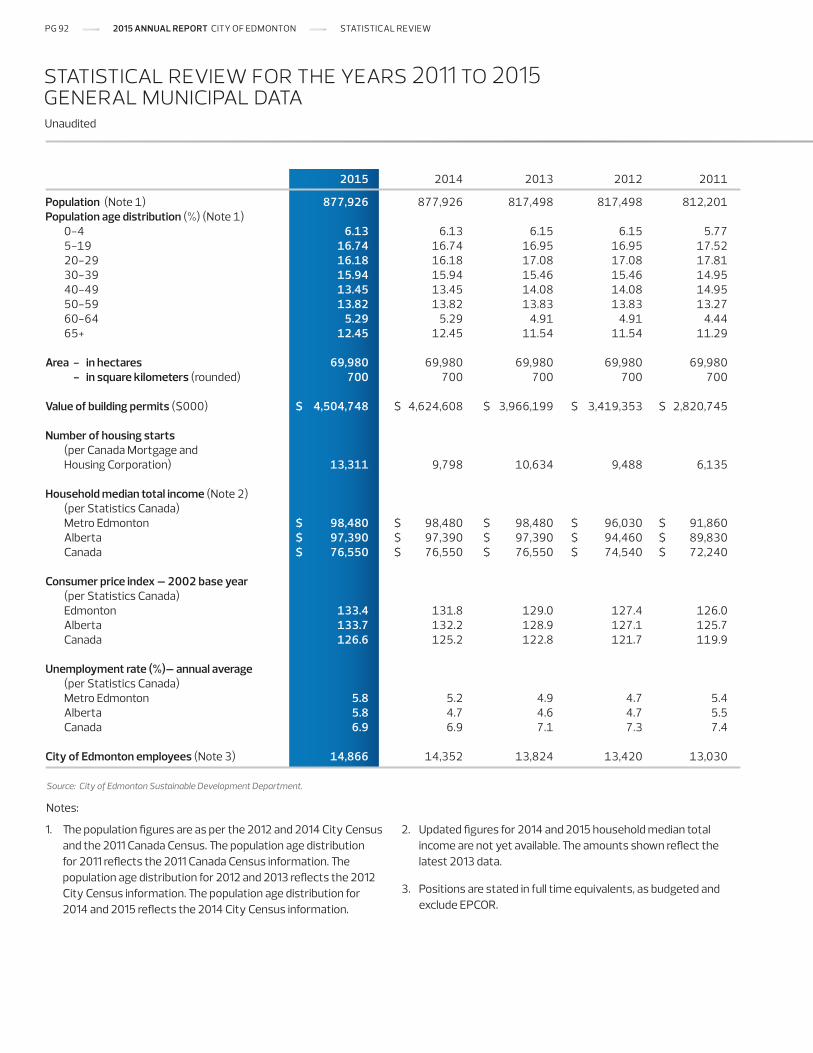
2015 2014 2013 2012 2011 Population (Note 1) 877,926 877,926 817,498 817,498 812,201Population age distribution (%) (Note 1) 0-4 6.13 6.13 6.15 6.15 5.77 5-19 16.74 16.74 16.95 16.95 17.52 20-29 16.18 16.18 17.08 17.08 17.81 30-39 15.94 15.94 15.46 15.46 14.95 40-49 13.45 13.45 14.08 14.08 14.95 50-59 13.82 13.82 13.83 13.83 13.27 60-64 5.29 5.29 4.91 4.91 4.44 65+ 12.45 12.45 11.54 11.54 11.29
Area - in hectares 69,980 69,980 69,980 69,980 69,980 - in square kilometers (rounded) 700 700 700 700 700 Value of building permits ($000) $ 4,504,748 $ 4,624,608 $ 3,966,199 $ 3,419,353 $ 2,820,745 Number of housing starts (per Canada Mortgage and Housing Corporation) 13,311 9,798 10,634 9,488 6,135 Household median total income (Note 2) (per Statistics Canada) Metro Edmonton $ 98,480 $ 98,480 $ 98,480 $ 96,030 $ 91,860 Alberta $ 97,390 $ 97,390 $ 97,390 $ 94,460 $ 89,830 Canada $ 76,550 $ 76,550 $ 76,550 $ 74,540 $ 72,240 Consumer price index – 2002 base year (per Statistics Canada) Edmonton 133.4 131.8 129.0 127.4 126.0 Alberta 133.7 132.2 128.9 127.1 125.7 Canada 126.6 125.2 122.8 121.7 119.9 Unemployment rate (%)– annual average (per Statistics Canada) Metro Edmonton 5.8 5.2 4.9 4.7 5.4 Alberta 5.8 4.7 4.6 4.7 5.5 Canada 6.9 6.9 7.1 7.3 7.4
City of Edmonton employees (Note 3) 14,866 14,352 13,824 13,420 13,030
Unaudited
statistical review for the years 2011 to 2015 general municipal data
Source: City of Edmonton Sustainable Development Department.
Notes:
1. The population figures are as per the 2012 and 2014 City Census and the 2011 Canada Census. The population age distribution for 2011 reflects the 2011 Canada Census information. The population age distribution for 2012 and 2013 reflects the 2012 City Census information. The population age distribution for 2014 and 2015 reflects the 2014 City Census information.
2. Updated figures for 2014 and 2015 household median total income are not yet available. The amounts shown reflect the latest 2013 data.
3. Positions are stated in full time equivalents, as budgeted and exclude EPCOR.
PG 92 2015 ANNUAL REPORT CITY OF EDMONTON STATISTICAL REVIEW
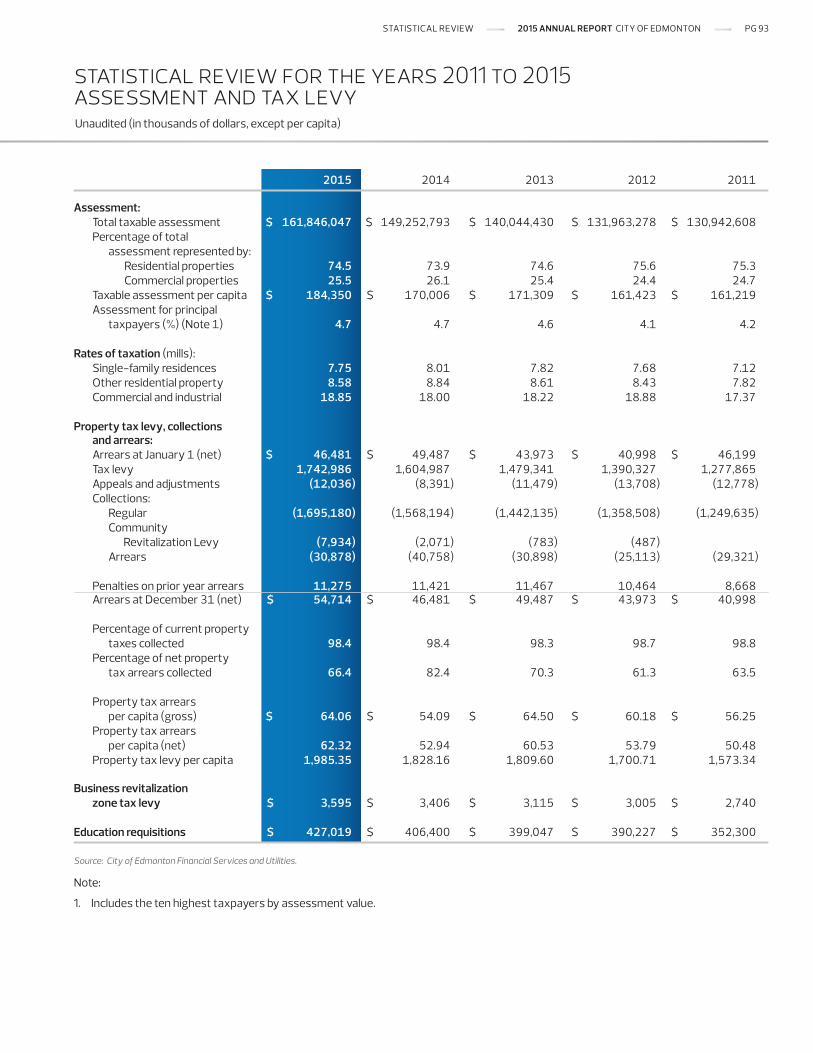
2015 2014 2013 2012 2011 Assessment: Total taxable assessment $ 161,846,047 $ 149,252,793 $ 140,044,430 $ 131,963,278 $ 130,942,608 Percentage of total assessment represented by: Residential properties 74.5 73.9 74.6 75.6 75.3 Commercial properties 25.5 26.1 25.4 24.4 24.7 Taxable assessment per capita $ 184,350 $ 170,006 $ 171,309 $ 161,423 $ 161,219 Assessment for principal taxpayers (%) (Note 1) 4.7 4.7 4.6 4.1 4.2 Rates of taxation (mills): Single-family residences 7.75 8.01 7.82 7.68 7.12 Other residential property 8.58 8.84 8.61 8.43 7.82 Commercial and industrial 18.85 18.00 18.22 18.88 17.37 Property tax levy, collections and arrears: Arrears at January 1 (net) $ 46,481 $ 49,487 $ 43,973 $ 40,998 $ 46,199 Tax levy 1,742,986 1,604,987 1,479,341 1,390,327 1,277,865 Appeals and adjustments (12,036) (8,391) (11,479) (13,708) (12,778) Collections: Regular (1,695,180) (1,568,194) (1,442,135) (1,358,508) (1,249,635) Community Revitalization Levy (7,934) (2,071) (783) (487) Arrears (30,878) (40,758) (30,898) (25,113) (29,321) Penalties on prior year arrears 11,275 11,421 11,467 10,464 8,668 Arrears at December 31 (net) $ 54,714 $ 46,481 $ 49,487 $ 43,973 $ 40,998 Percentage of current property taxes collected 98.4 98.4 98.3 98.7 98.8 Percentage of net property tax arrears collected 66.4 82.4 70.3 61.3 63.5 Property tax arrears per capita (gross) $ 64.06 $ 54.09 $ 64.50 $ 60.18 $ 56.25 Property tax arrears per capita (net) 62.32 52.94 60.53 53.79 50.48 Property tax levy per capita 1,985.35 1,828.16 1,809.60 1,700.71 1,573.34 Business revitalization zone tax levy $ 3,595 $ 3,406 $ 3,115 $ 3,005 $ 2,740
Education requisitions $ 427,019 $ 406,400 $ 399,047 $ 390,227 $ 352,300
Unaudited (in thousands of dollars, except per capita)
statistical review for the years 2011 to 2015 assessment and tax levy
Source: City of Edmonton Financial Services and Utilities.
Note:
1. Includes the ten highest taxpayers by assessment value.
STATISTICAL REVIEW 2015 ANNUAL REPORT CITY OF EDMONTON PG 93
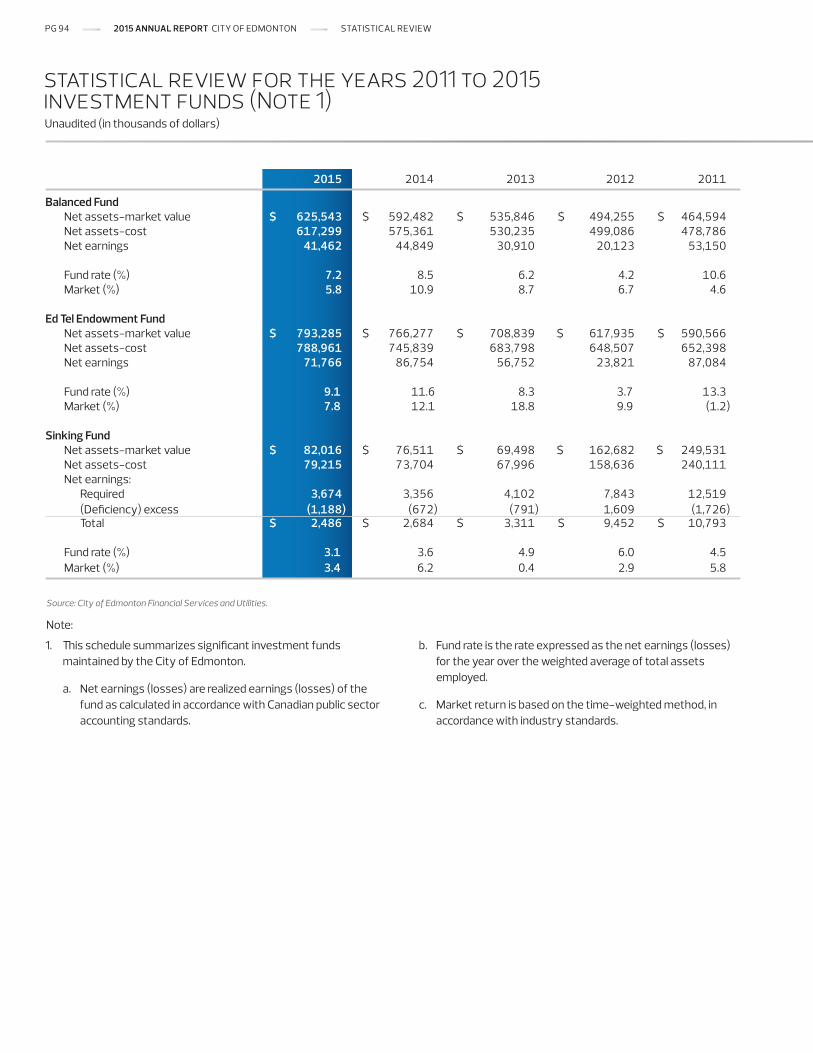
2015 2014 2013 2012 2011 Balanced Fund Net assets-market value $ 625,543 $ 592,482 $ 535,846 $ 494,255 $ 464,594 Net assets-cost 617,299 575,361 530,235 499,086 478,786 Net earnings 41,462 44,849 30,910 20,123 53,150 Fund rate (%) 7.2 8.5 6.2 4.2 10.6 Market (%) 5.8 10.9 8.7 6.7 4.6 Ed Tel Endowment Fund Net assets-market value $ 793,285 $ 766,277 $ 708,839 $ 617,935 $ 590,566 Net assets-cost 788,961 745,839 683,798 648,507 652,398 Net earnings 71,766 86,754 56,752 23,821 87,084 Fund rate (%) 9.1 11.6 8.3 3.7 13.3 Market (%) 7.8 12.1 18.8 9.9 (1.2) Sinking Fund Net assets-market value $ 82,016 $ 76,511 $ 69,498 $ 162,682 $ 249,531 Net assets-cost 79,215 73,704 67,996 158,636 240,111 Net earnings: Required 3,674 3,356 4,102 7,843 12,519 (Deficiency) excess (1,188) (672) (791) 1,609 (1,726) Total $ 2,486 $ 2,684 $ 3,311 $ 9,452 $ 10,793 Fund rate (%) 3.1 3.6 4.9 6.0 4.5 Market (%) 3.4 6.2 0.4 2.9 5.8
Unaudited (in thousands of dollars)
statistical review for the years 2011 to 2015 investment funds (Note 1)
Source: City of Edmonton Financial Services and Utilities.
Note:
1. This schedule summarizes significant investment funds maintained by the City of Edmonton.
a. Net earnings (losses) are realized earnings (losses) of the fund as calculated in accordance with Canadian public sector accounting standards.
b. Fund rate is the rate expressed as the net earnings (losses) for the year over the weighted average of total assets employed.
c. Market return is based on the time-weighted method, in accordance with industry standards.
PG 94 2015 ANNUAL REPORT CITY OF EDMONTON STATISTICAL REVIEW
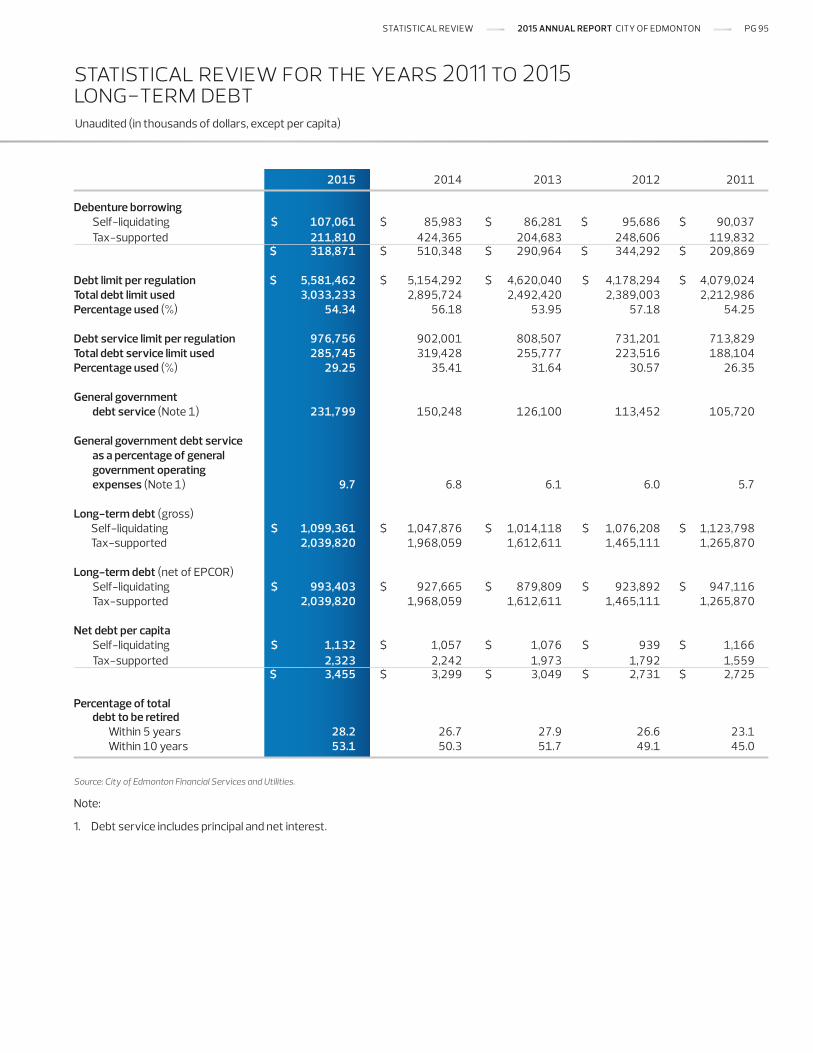
2015 2014 2013 2012 2011 Debenture borrowing Self-liquidating $ 107,061 $ 85,983 $ 86,281 $ 95,686 $ 90,037 Tax-supported 211,810 424,365 204,683 248,606 119,832 $ 318,871 $ 510,348 $ 290,964 $ 344,292 $ 209,869 Debt limit per regulation $ 5,581,462 $ 5,154,292 $ 4,620,040 $ 4,178,294 $ 4,079,024 Total debt limit used 3,033,233 2,895,724 2,492,420 2,389,003 2,212,986 Percentage used (%) 54.34 56.18 53.95 57.18 54.25 Debt service limit per regulation 976,756 902,001 808,507 731,201 713,829 Total debt service limit used 285,745 319,428 255,777 223,516 188,104 Percentage used (%) 29.25 35.41 31.64 30.57 26.35 General government debt service (Note 1) 231,799 150,248 126,100 113,452 105,720 General government debt service as a percentage of general government operating expenses (Note 1) 9.7 6.8 6.1 6.0 5.7 Long-term debt (gross) Self-liquidating $ 1,099,361 $ 1,047,876 $ 1,014,118 $ 1,076,208 $ 1,123,798 Tax-supported 2,039,820 1,968,059 1,612,611 1,465,111 1,265,870 Long-term debt (net of EPCOR) Self-liquidating $ 993,403 $ 927,665 $ 879,809 $ 923,892 $ 947,116 Tax-supported 2,039,820 1,968,059 1,612,611 1,465,111 1,265,870 Net debt per capita Self-liquidating $ 1,132 $ 1,057 $ 1,076 $ 939 $ 1,166 Tax-supported 2,323 2,242 1,973 1,792 1,559 $ 3,455 $ 3,299 $ 3,049 $ 2,731 $ 2,725 Percentage of total debt to be retired Within 5 years 28.2 26.7 27.9 26.6 23.1 Within 10 years 53.1 50.3 51.7 49.1 45.0
Unaudited (in thousands of dollars, except per capita)
statistical review for the years 2011 to 2015 long-term debt
Source: City of Edmonton Financial Services and Utilities.
Note:
1. Debt service includes principal and net interest.
STATISTICAL REVIEW 2015 ANNUAL REPORT CITY OF EDMONTON PG 95
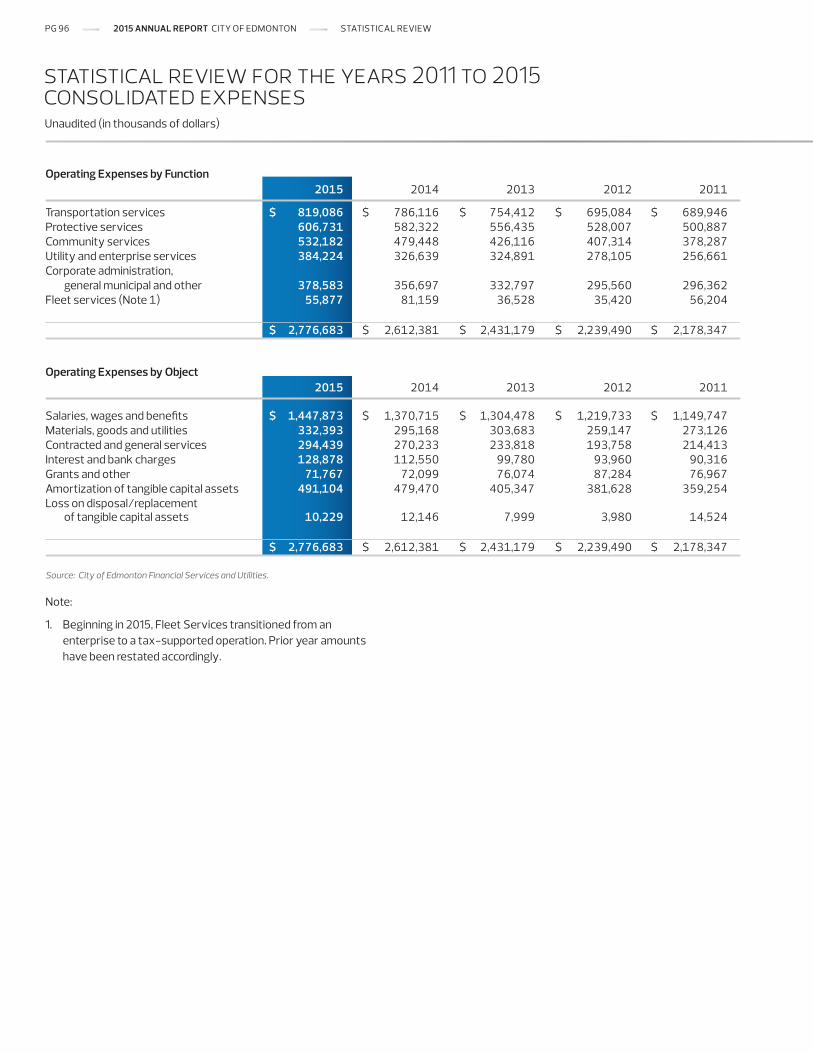
Operating Expenses by Function 2015 2014 2013 2012 2011 Transportation services $ 819,086 $ 786,116 $ 754,412 $ 695,084 $ 689,946 Protective services 606,731 582,322 556,435 528,007 500,887 Community services 532,182 479,448 426,116 407,314 378,287 Utility and enterprise services 384,224 326,639 324,891 278,105 256,661 Corporate administration, general municipal and other 378,583 356,697 332,797 295,560 296,362 Fleet services (Note 1) 55,877 81,159 36,528 35,420 56,204 $ 2,776,683 $ 2,612,381 $ 2,431,179 $ 2,239,490 $ 2,178,347 Operating Expenses by Object 2015 2014 2013 2012 2011 Salaries, wages and benefits $ 1,447,873 $ 1,370,715 $ 1,304,478 $ 1,219,733 $ 1,149,747 Materials, goods and utilities 332,393 295,168 303,683 259,147 273,126 Contracted and general services 294,439 270,233 233,818 193,758 214,413 Interest and bank charges 128,878 112,550 99,780 93,960 90,316 Grants and other 71,767 72,099 76,074 87,284 76,967 Amortization of tangible capital assets 491,104 479,470 405,347 381,628 359,254 Loss on disposal/replacement of tangible capital assets 10,229 12,146 7,999 3,980 14,524 $ 2,776,683 $ 2,612,381 $ 2,431,179 $ 2,239,490 $ 2,178,347
Unaudited (in thousands of dollars)
statistical review for the years 2011 to 2015 consolidated expenses
Source: City of Edmonton Financial Services and Utilities.
Note:
1. Beginning in 2015, Fleet Services transitioned from an enterprise to a tax-supported operation. Prior year amounts have been restated accordingly.
PG 96 2015 ANNUAL REPORT CITY OF EDMONTON STATISTICAL REVIEW
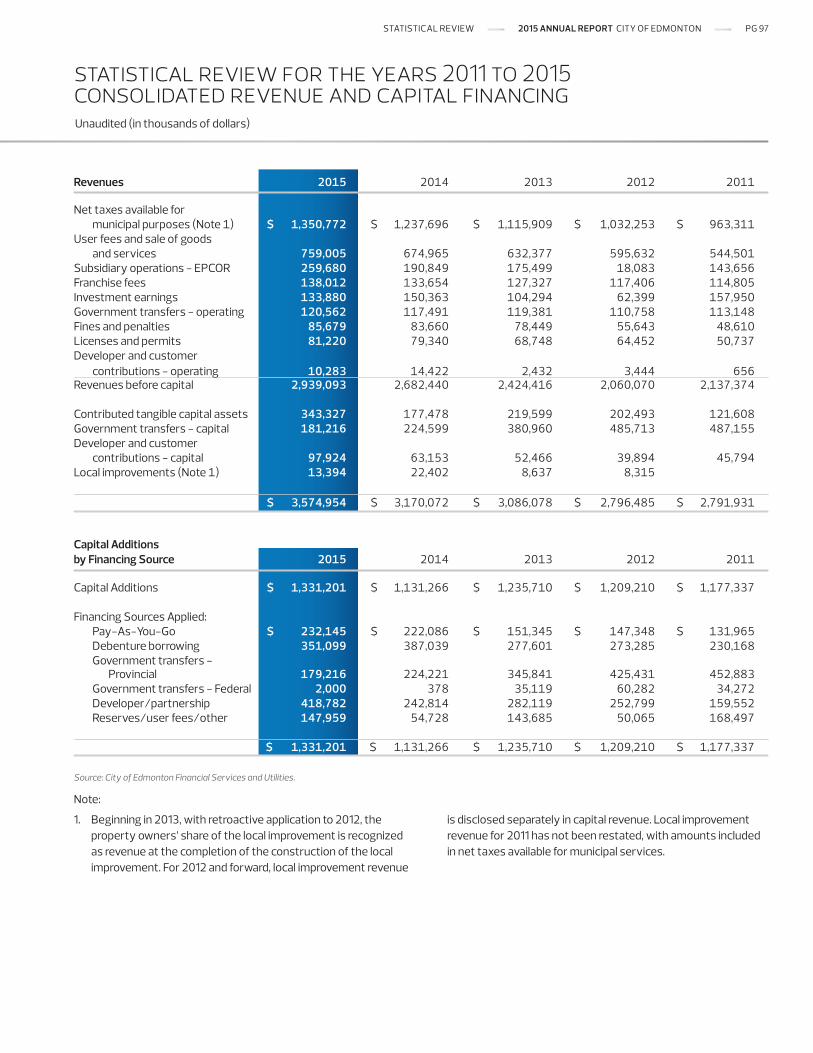
Revenues 2015 2014 2013 2012 2011 Net taxes available for municipal purposes (Note 1) $ 1,350,772 $ 1,237,696 $ 1,115,909 $ 1,032,253 $ 963,311 User fees and sale of goods and services 759,005 674,965 632,377 595,632 544,501 Subsidiary operations - EPCOR 259,680 190,849 175,499 18,083 143,656 Franchise fees 138,012 133,654 127,327 117,406 114,805 Investment earnings 133,880 150,363 104,294 62,399 157,950 Government transfers - operating 120,562 117,491 119,381 110,758 113,148 Fines and penalties 85,679 83,660 78,449 55,643 48,610 Licenses and permits 81,220 79,340 68,748 64,452 50,737 Developer and customer contributions - operating 10,283 14,422 2,432 3,444 656 Revenues before capital 2,939,093 2,682,440 2,424,416 2,060,070 2,137,374 Contributed tangible capital assets 343,327 177,478 219,599 202,493 121,608 Government transfers - capital 181,216 224,599 380,960 485,713 487,155 Developer and customer contributions - capital 97,924 63,153 52,466 39,894 45,794 Local improvements (Note 1) 13,394 22,402 8,637 8,315
$ 3,574,954 $ 3,170,072 $ 3,086,078 $ 2,796,485 $ 2,791,931 Capital Additions by Financing Source 2015 2014 2013 2012 2011 Capital Additions $ 1,331,201 $ 1,131,266 $ 1,235,710 $ 1,209,210 $ 1,177,337 Financing Sources Applied: Pay-As-You-Go $ 232,145 $ 222,086 $ 151,345 $ 147,348 $ 131,965 Debenture borrowing 351,099 387,039 277,601 273,285 230,168 Government transfers - Provincial 179,216 224,221 345,841 425,431 452,883 Government transfers - Federal 2,000 378 35,119 60,282 34,272 Developer/partnership 418,782 242,814 282,119 252,799 159,552 Reserves/user fees/other 147,959 54,728 143,685 50,065 168,497 $ 1,331,201 $ 1,131,266 $ 1,235,710 $ 1,209,210 $ 1,177,337
Unaudited (in thousands of dollars)
statistical review for the years 2011 to 2015 consolidated revenue and capital financing
Source: City of Edmonton Financial Services and Utilities.
Note:
1. Beginning in 2013, with retroactive application to 2012, the property owners’ share of the local improvement is recognized as revenue at the completion of the construction of the local improvement. For 2012 and forward, local improvement revenue
is disclosed separately in capital revenue. Local improvement revenue for 2011 has not been restated, with amounts included in net taxes available for municipal services.
STATISTICAL REVIEW 2015 ANNUAL REPORT CITY OF EDMONTON PG 97
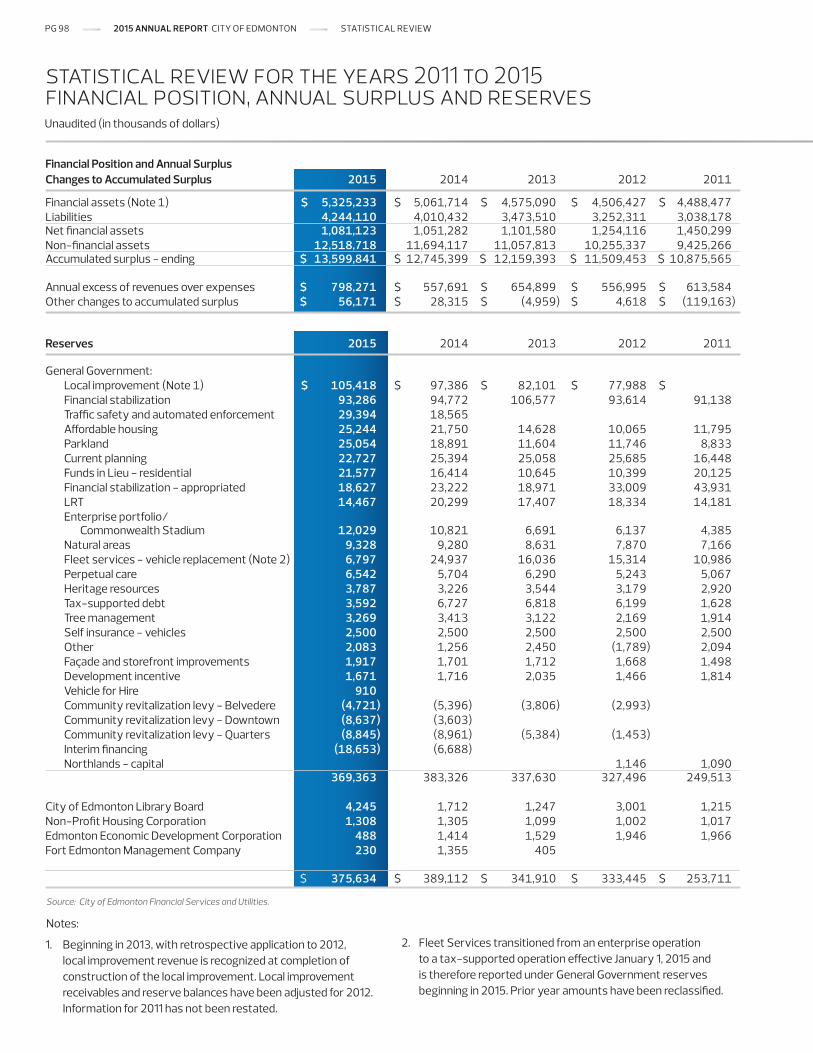
Financial Position and Annual Surplus Changes to Accumulated Surplus 2015 2014 2013 2012 2011 Financial assets (Note 1) $ 5,325,233 $ 5,061,714 $ 4,575,090 $ 4,506,427 $ 4,488,477 Liabilities 4,244,110 4,010,432 3,473,510 3,252,311 3,038,178Net financial assets 1,081,123 1,051,282 1,101,580 1,254,116 1,450,299Non-financial assets 12,518,718 11,694,117 11,057,813 10,255,337 9,425,266Accumulated surplus - ending $ 13,599,841 $ 12,745,399 $ 12,159,393 $ 11,509,453 $ 10,875,565 Annual excess of revenues over expenses $ 798,271 $ 557,691 $ 654,899 $ 556,995 $ 613,584 Other changes to accumulated surplus $ 56,171 $ 28,315 $ (4,959) $ 4,618 $ (119,163) Reserves 2015 2014 2013 2012 2011 General Government: Local improvement (Note 1) $ 105,418 $ 97,386 $ 82,101 $ 77,988 $ Financial stabilization 93,286 94,772 106,577 93,614 91,138 Traffic safety and automated enforcement 29,394 18,565 Affordable housing 25,244 21,750 14,628 10,065 11,795 Parkland 25,054 18,891 11,604 11,746 8,833 Current planning 22,727 25,394 25,058 25,685 16,448 Funds in Lieu - residential 21,577 16,414 10,645 10,399 20,125 Financial stabilization - appropriated 18,627 23,222 18,971 33,009 43,931 LRT 14,467 20,299 17,407 18,334 14,181 Enterprise portfolio/ Commonwealth Stadium 12,029 10,821 6,691 6,137 4,385 Natural areas 9,328 9,280 8,631 7,870 7,166 Fleet services - vehicle replacement (Note 2) 6,797 24,937 16,036 15,314 10,986 Perpetual care 6,542 5,704 6,290 5,243 5,067 Heritage resources 3,787 3,226 3,544 3,179 2,920 Tax-supported debt 3,592 6,727 6,818 6,199 1,628 Tree management 3,269 3,413 3,122 2,169 1,914 Self insurance - vehicles 2,500 2,500 2,500 2,500 2,500 Other 2,083 1,256 2,450 (1,789) 2,094 Façade and storefront improvements 1,917 1,701 1,712 1,668 1,498 Development incentive 1,671 1,716 2,035 1,466 1,814 Vehicle for Hire 910 Community revitalization levy - Belvedere (4,721) (5,396) (3,806) (2,993) Community revitalization levy - Downtown (8,637) (3,603) Community revitalization levy - Quarters (8,845) (8,961) (5,384) (1,453) Interim financing (18,653) (6,688) Northlands - capital 1,146 1,090 369,363 383,326 337,630 327,496 249,513 City of Edmonton Library Board 4,245 1,712 1,247 3,001 1,215 Non-Profit Housing Corporation 1,308 1,305 1,099 1,002 1,017 Edmonton Economic Development Corporation 488 1,414 1,529 1,946 1,966Fort Edmonton Management Company 230 1,355 405
$ 375,634 $ 389,112 $ 341,910 $ 333,445 $ 253,711
Unaudited (in thousands of dollars)
statistical review for the years 2011 to 2015 financial position, annual surplus and reserves
Source: City of Edmonton Financial Services and Utilities.
Notes:
1. Beginning in 2013, with retrospective application to 2012, local improvement revenue is recognized at completion of construction of the local improvement. Local improvement receivables and reserve balances have been adjusted for 2012. Information for 2011 has not been restated.
2. Fleet Services transitioned from an enterprise operation to a tax-supported operation effective January 1, 2015 and is therefore reported under General Government reserves beginning in 2015. Prior year amounts have been reclassified.
PG 98 2015 ANNUAL REPORT CITY OF EDMONTON STATISTICAL REVIEW
Further information regarding the Related Boards and Authorities can be obtained from the following sources:
related boards and authorities
edmonton economic development corporation
3rd Floor, World Trade Centre Edmonton 9990 Jasper Avenue NW Edmonton, Alberta T5J 1P7 Phone: 780-424-9191 Fax: 780-917-7668 E-mail: [email protected] Web: www.eedc.ca Chair: Barry Travers President and CEO: Brad Ferguson
edmonton police commission
Suite 1803 Scotia Place, Tower 2 10060 Jasper Avenue NW Edmonton, Alberta T5J 3R8 Phone: 780-414-7510 Fax: 780-414-7511 E-mail: [email protected] Web: www.edmontonpolicecommission.com Chair: Cathy Palmer Chief of Police: Rod Knecht
the city of edmonton non-profit housing corporation
12520 Fort Road NW Edmonton, Alberta T5B 4H8 Phone: 780-474-5706 Fax: 780-474-8175 E-mail: [email protected] Web: www.myhomeed.ca Chair: Ann Henry Executive Director: W.C. (Bill) Bell
epcor utilities inc.
2000, 10423-101 Street NW Edmonton, Alberta T5H 0E8 Phone: 780-412-3414 Fax: 780-412-3192 E-mail: [email protected] Web: www.epcor.com Chair: Hugh Bolton President and CEO: Stuart Lee
edmonton public library
7 Sir Winston Churchill Square NW Edmonton, Alberta T5J 2V4 Phone: 780-496-7000 Fax: 780-496-7097 Web: www.epl.ca Chair: Ellen Calabrese-Amrhein CEO: Pilar Martinez
waste re-solutions edmonton
9803-102A Avenue NW Edmonton, Alberta T5J 3A3 E-mail: [email protected] Web: www.waste-resolutions.com Chair: Robert Seidel President: Gary Klassen
fort edmonton management company
Fort Edmonton Park 7000-143 Street NW P.O. Box 2359 Edmonton, Alberta T5J 2R7 Phone: 780-496-7381 Fax: 780-496-8797 E-mail: [email protected] Web: www.fortedmontonpark.ca Chair: Douglas Goss Executive Director: Bill Demchuk
STATISTICAL REVIEW 2015 ANNUAL REPORT CITY OF EDMONTON PG 99

For more information about the City of Edmonton, visit:
www.edmonton.ca or call 311
If you have inquiries about the 2015 Annual Report, direct them by mail or phone at:
The City of Edmonton, Financial Services and Utilities 5th Floor, Chancery Hall, 3 Sir Winston Churchill Square NW Edmonton, AB, Canada T5J 2C3
Phone: 780-496-4944