Embed Size (px)
Citation preview
Classification and quantification of the
key stakeholders
Alan MatthewsTrinity College Dublin
Presentation to Joint UCD/DAFF/Teagasc initiative“Driving a sustainable agri-food sector: the new roadmap for
education, research and innovation”Dublin, 29 November 2007
Feedback to: [email protected]
• Identification of stakeholders
• The agricultural context
• Future trends for main stakeholders
• Some implications for research and education system
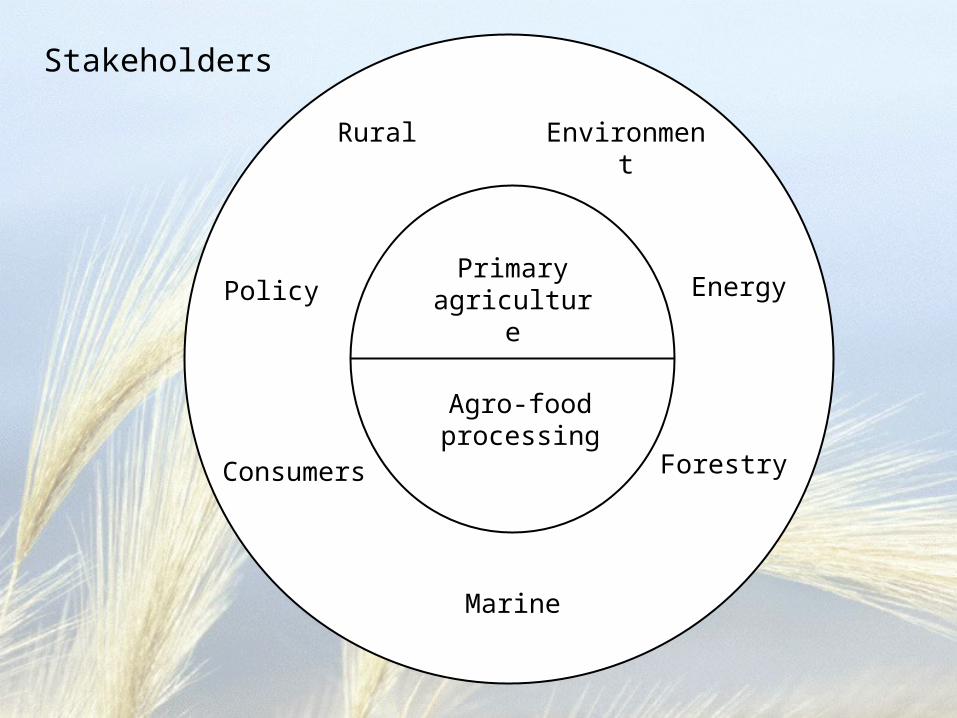
Primary agriculture
Agro-food processing
Environment
Energy
Forestry
Marine
Consumers
Policy
Rural
Stakeholders
40.0
50.0
60.0
70.0
80.0
90.0
100.0
110.0
1973
1975
1977
1979
1981
1983
1985
1987
1989
1991
1993
1995
1997
1999
2001
2003
2005
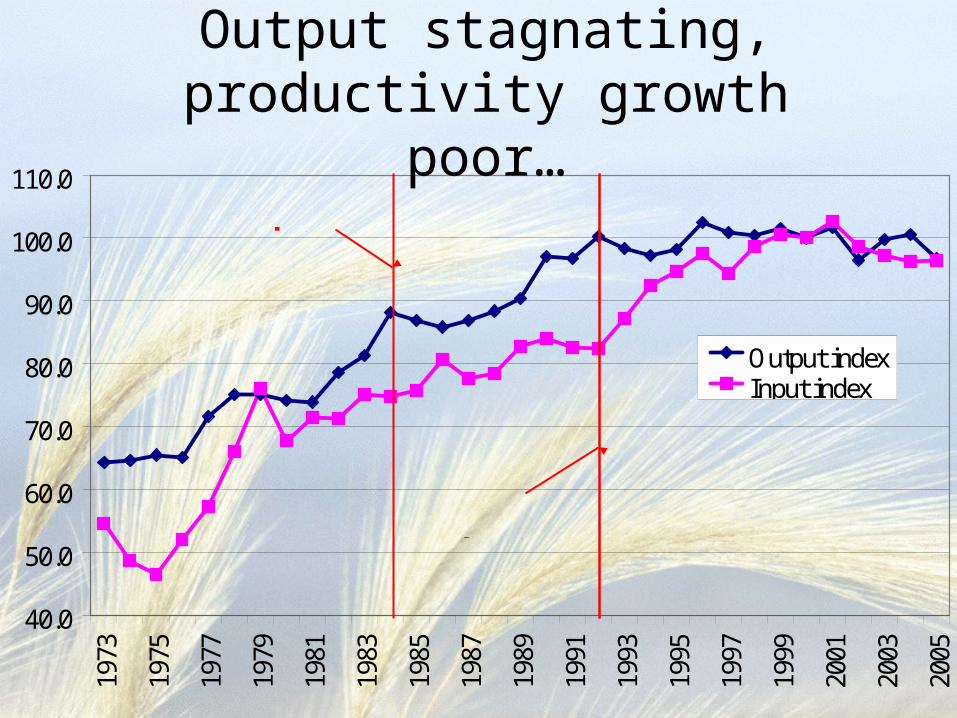
Output indexInput index
MacSharry reform
Milk quota
Output stagnating, productivity growth poor…
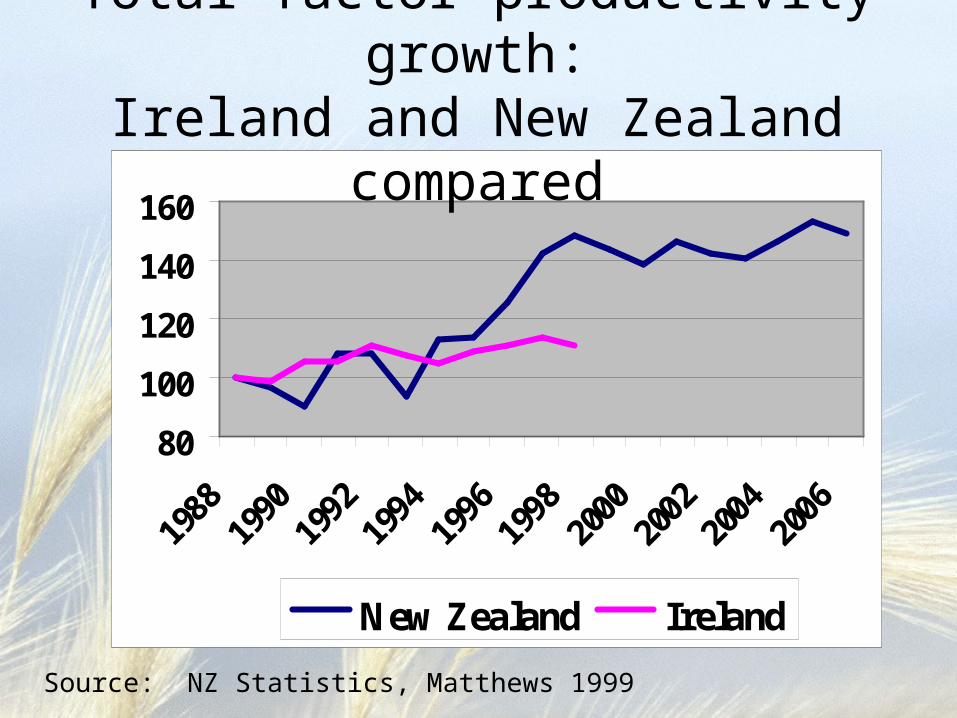
80
100
120
140
160
1988
1990
1992
1994
1996
1998
2000
2002
2004
2006
New Zealand Ireland
Total factor productivity growth:Ireland and New Zealand compared
Source: NZ Statistics, Matthews 1999
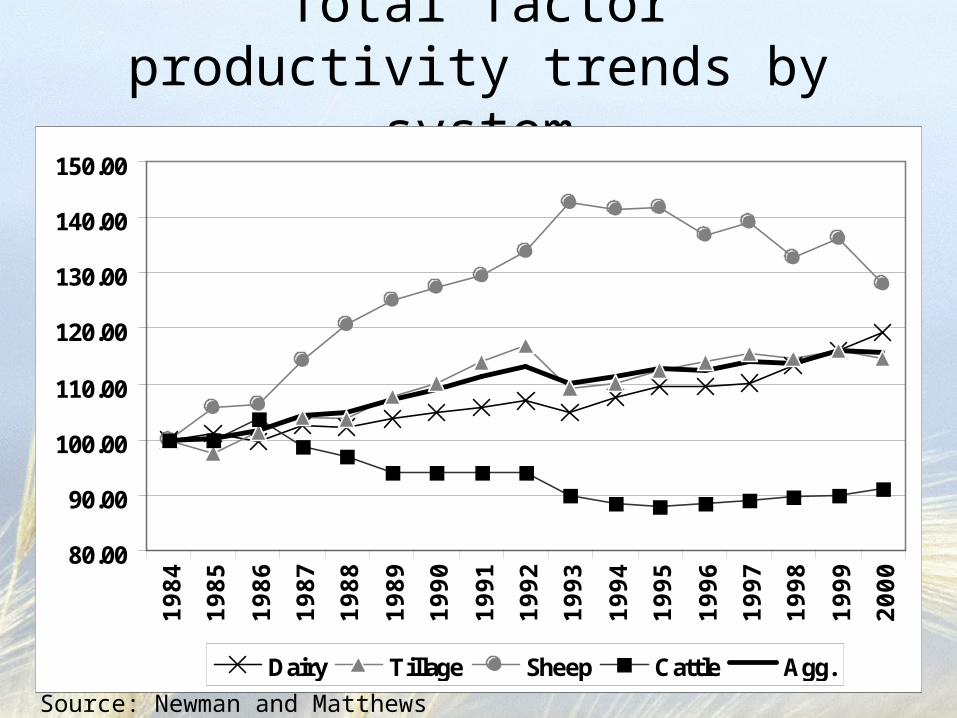
Total factor productivity trends by system
80.00
90.00
100.00
110.00
120.00
130.00
140.00
150.0019
84
1985
1986
1987
1988
1989
1990
1991
1992
1993
1994
1995
1996
1997
1998
1999
2000
Dairy Tillage Sheep Cattle Agg.
Source: Newman and Matthews
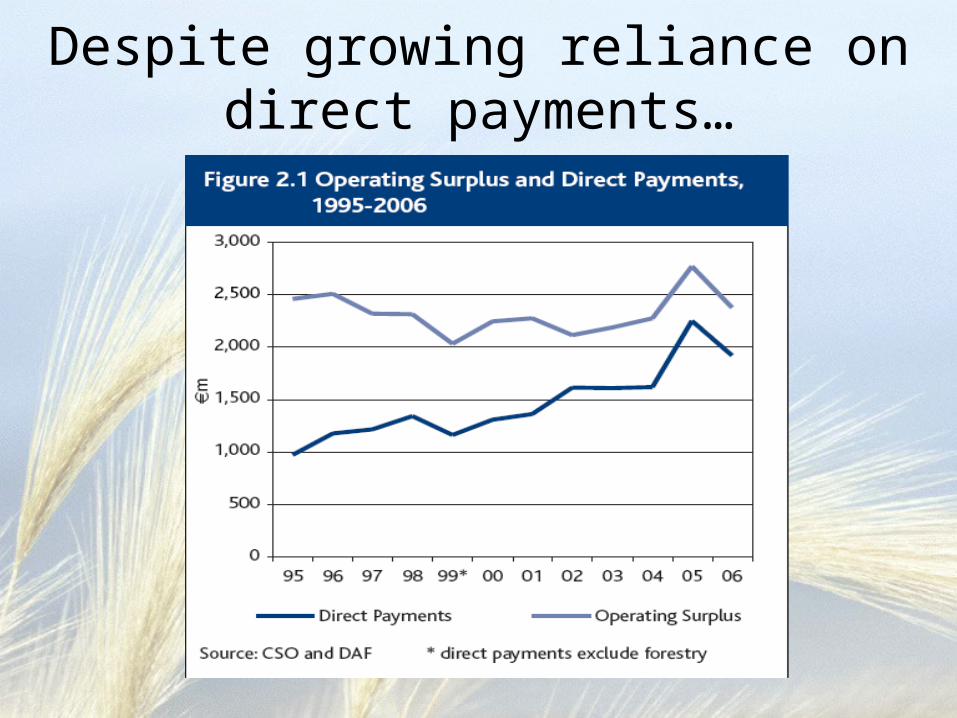
Despite growing reliance on direct payments…
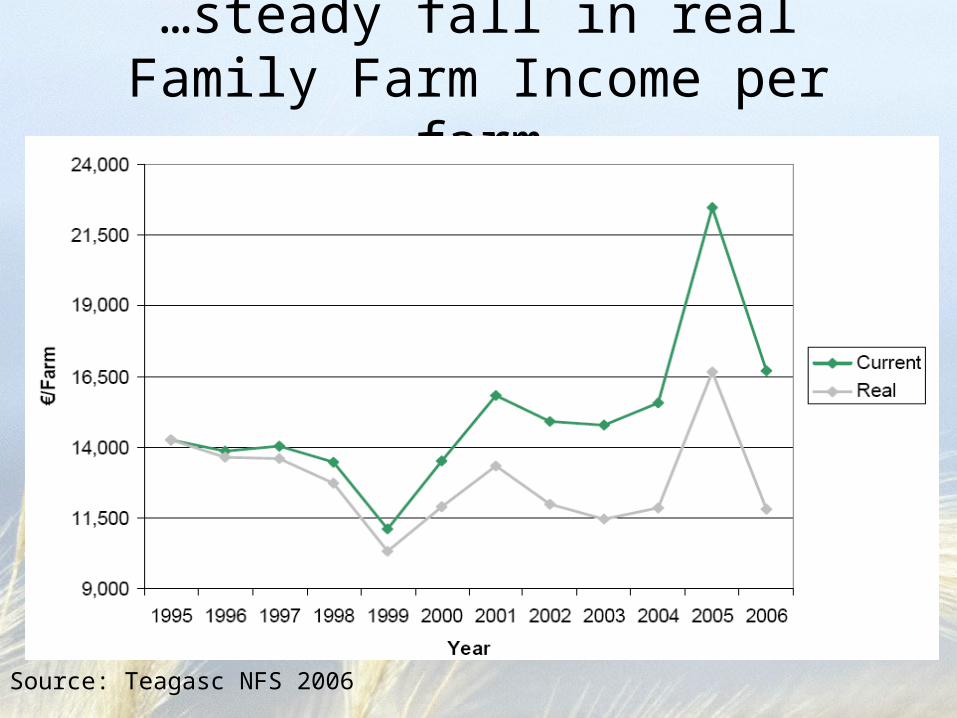
Source: Teagasc NFS 2006
…steady fall in real Family Farm Income per farm
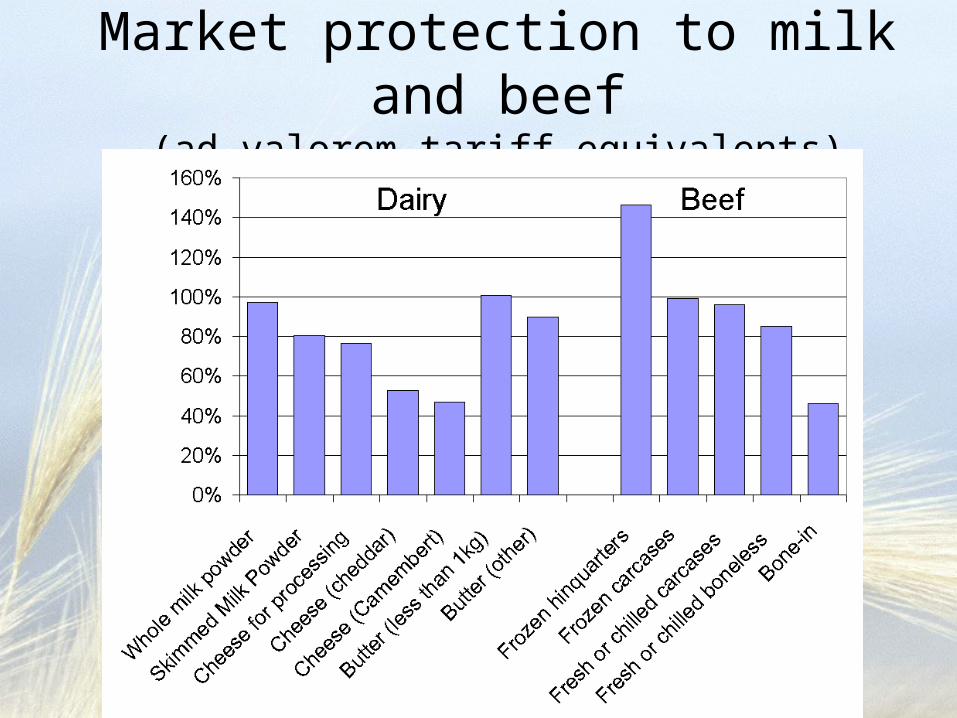
Market protection to milk and beef(ad valorem tariff equivalents)
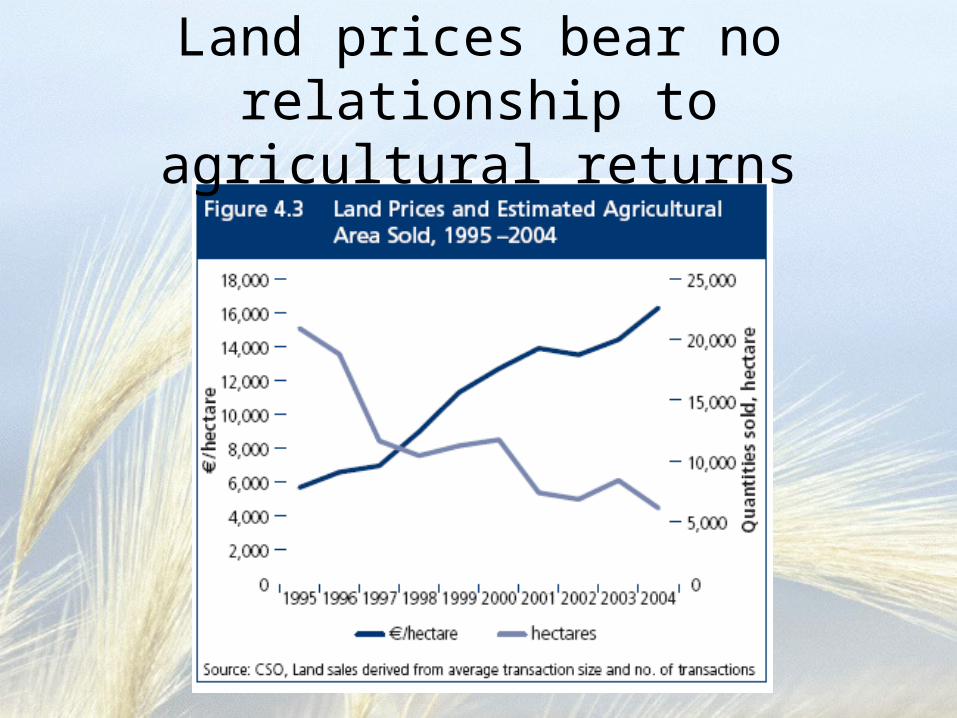
Land prices bear no relationship to agricultural returns
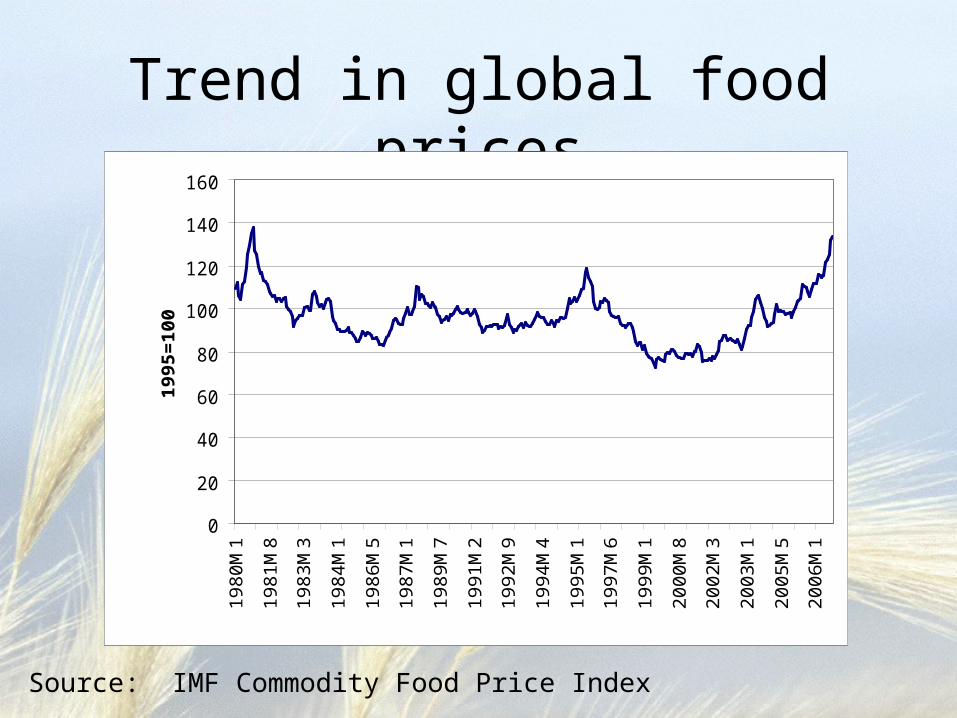
Trend in global food prices
0
20
40
60
80
100
120
140
160
19
80
M1
19
81
M8
19
83
M3
19
84
M1
19
86
M5
19
87
M1
19
89
M7
19
91
M2
19
92
M9
19
94
M4
19
95
M1
19
97
M6
19
99
M1
20
00
M8
20
02
M3
20
03
M1
20
05
M5
20
06
M1
19
95
=1
00
Source: IMF Commodity Food Price Index
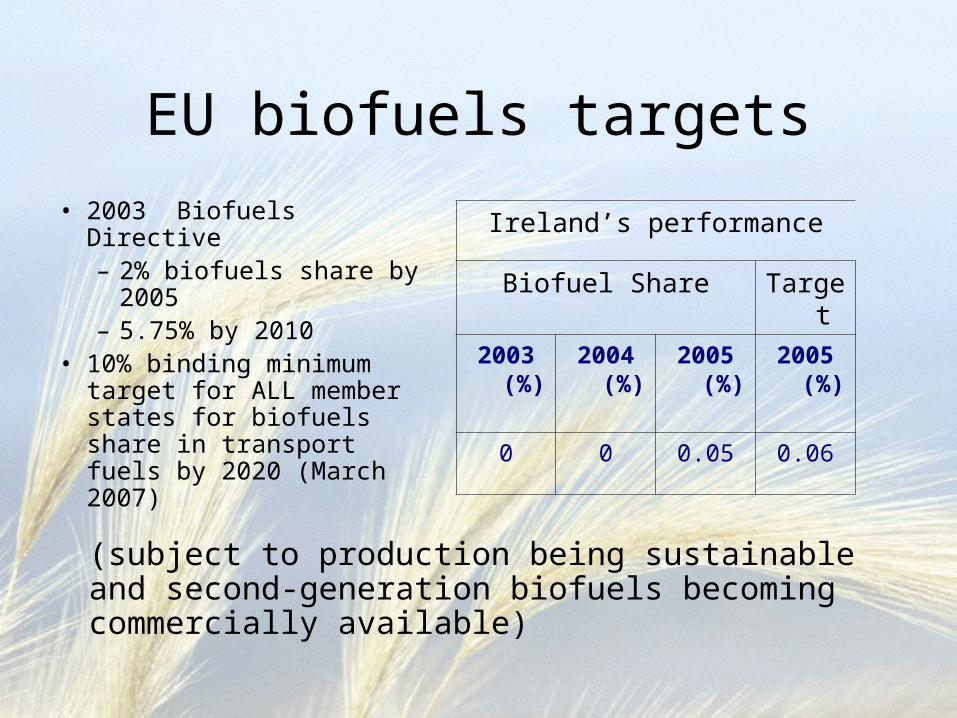
EU biofuels targets
• 2003 Biofuels Directive– 2% biofuels share by
2005– 5.75% by 2010
• 10% binding minimum target for ALL member states for biofuels share in transport fuels by 2020 (March 2007)
Ireland’s performance
Biofuel Share Target
2003 (%)
2004 (%)
2005 (%)
2005 (%)
0 0 0.05 0.06
(subject to production being sustainable and second-generation biofuels becoming commercially available)
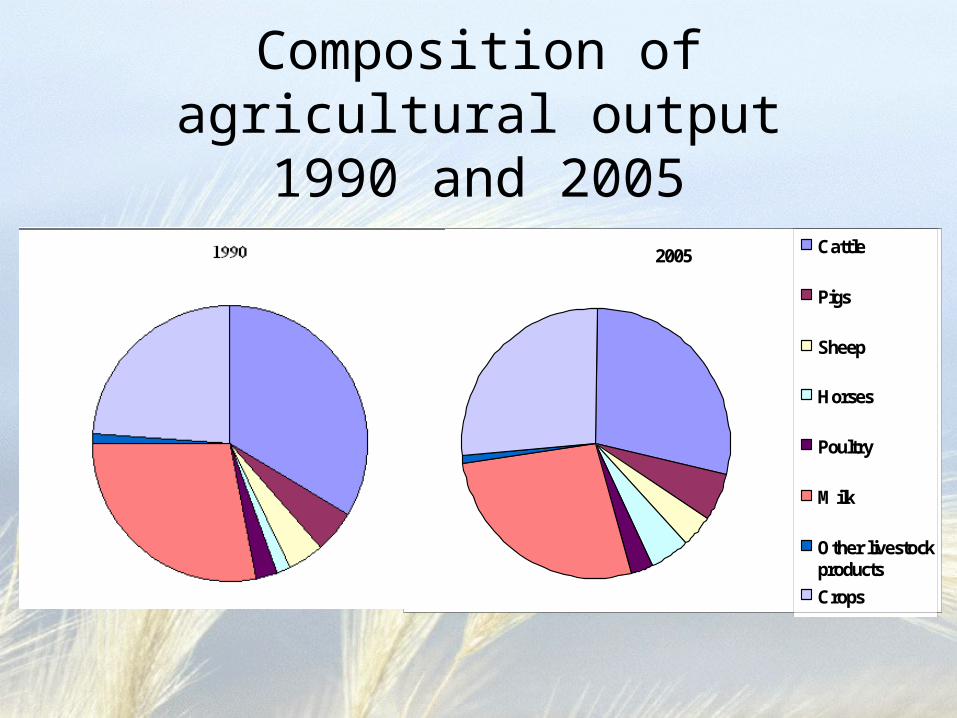
Composition of agricultural output1990 and 2005
2005 Cattle
Pigs
Sheep
Horses
Poultry
Milk
Other livestockproducts
Crops
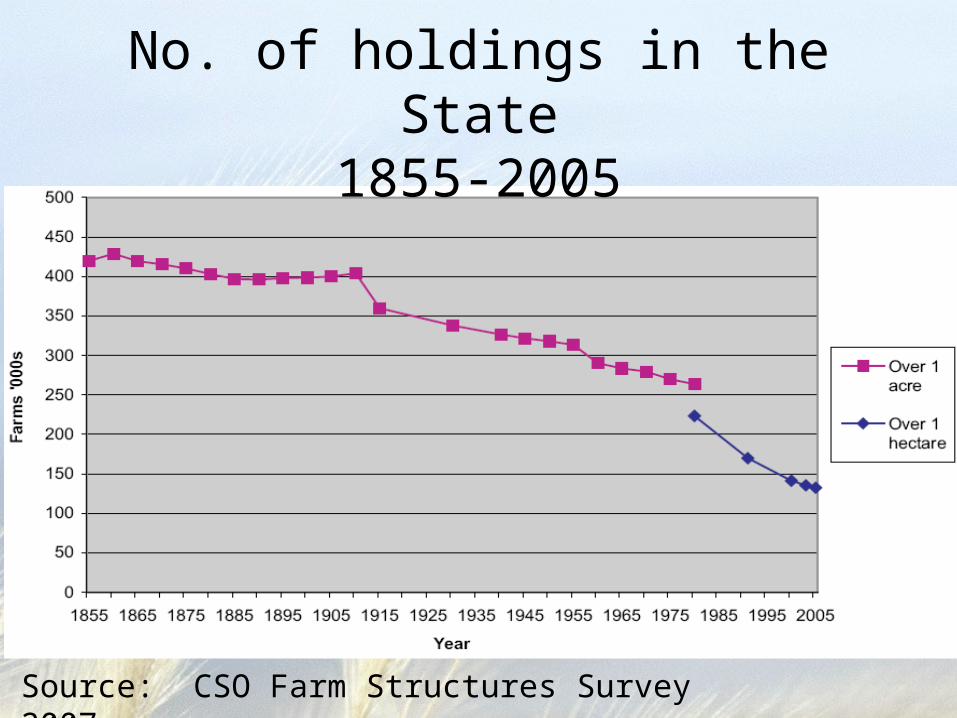
No. of holdings in the State1855-2005
Source: CSO Farm Structures Survey 2007
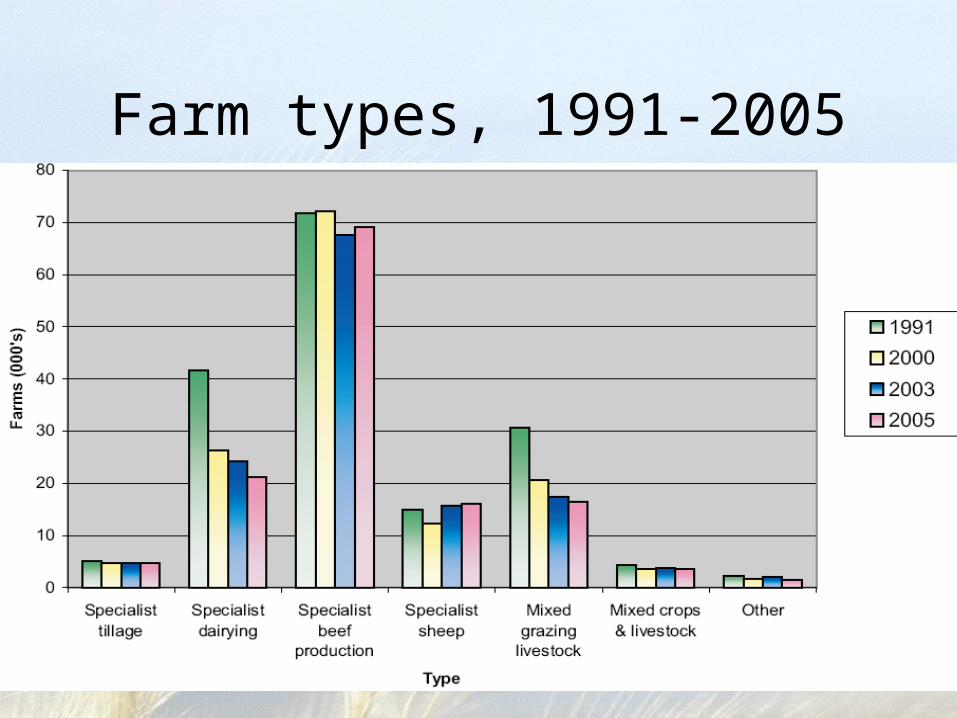
Farm types, 1991-2005
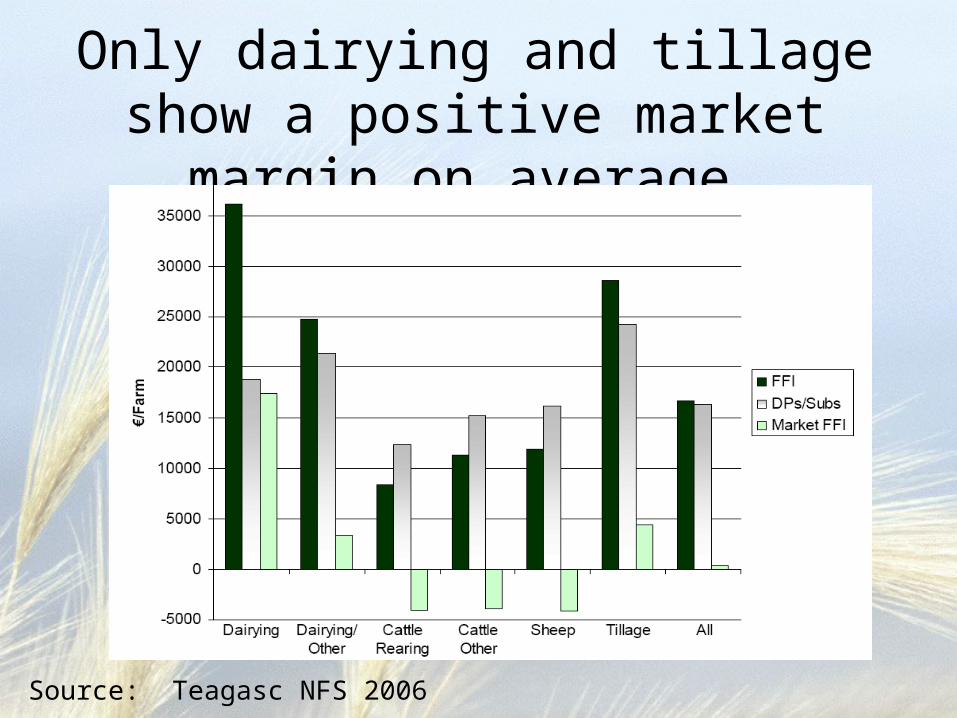
Only dairying and tillage show a positive market margin on average…
Source: Teagasc NFS 2006
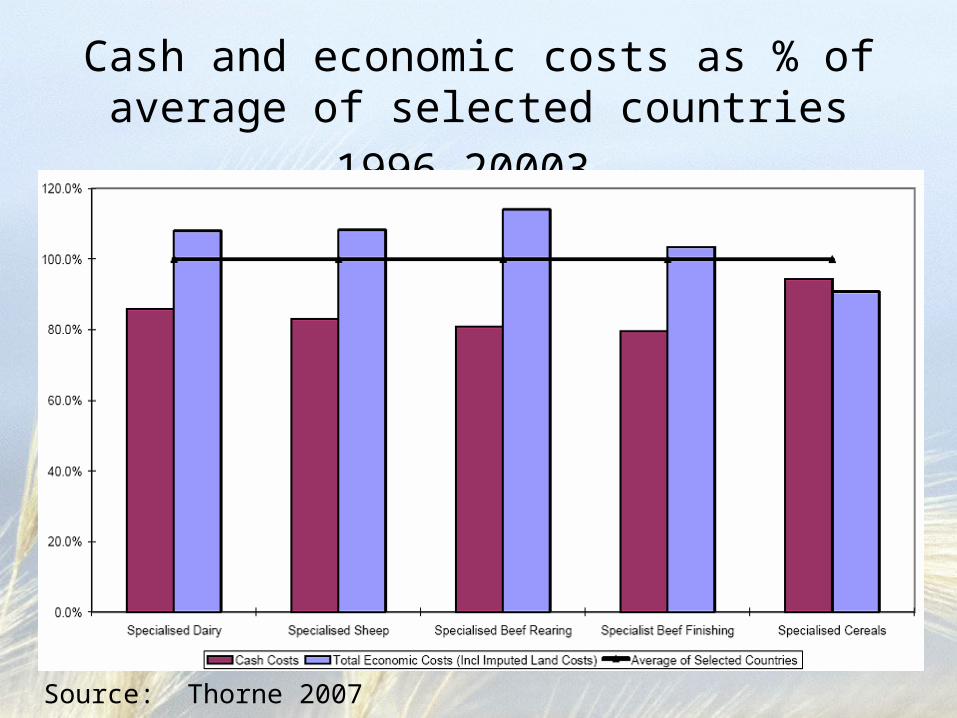
Source: Thorne 2007
Cash and economic costs as % of
average of selected countries 1996-20003
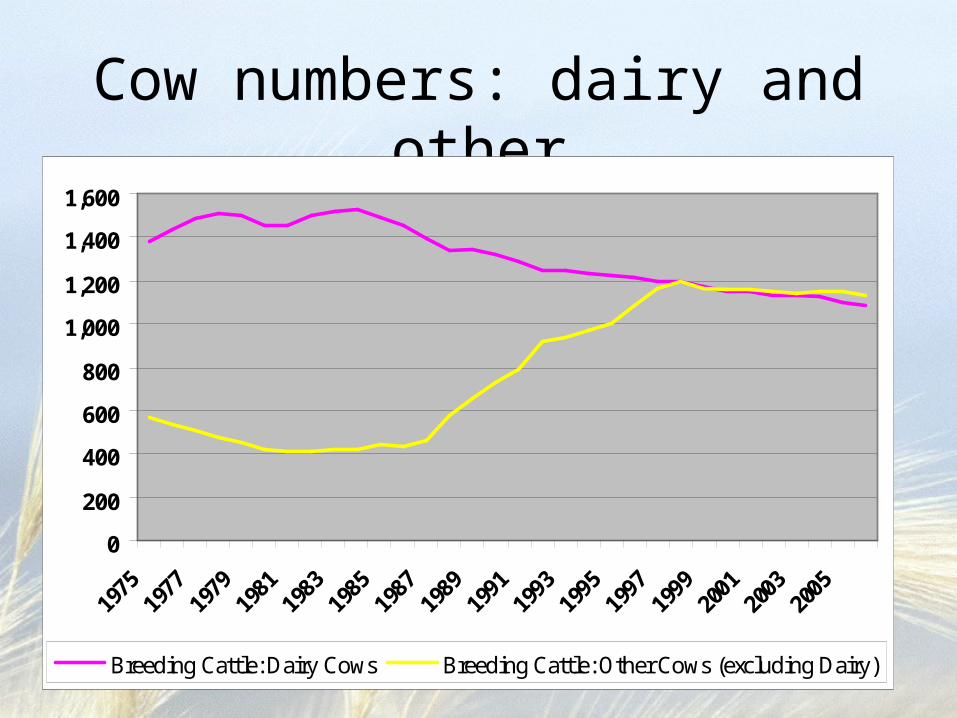
Cow numbers: dairy and other
0
200
400
600
800
1,000
1,200
1,400
1,600
1975
1977
1979
1981
1983
1985
1987
1989
1991
1993
1995
1997
1999
2001
2003
2005
Breeding Cattle: Dairy Cows Breeding Cattle: Other Cows (excluding Dairy)
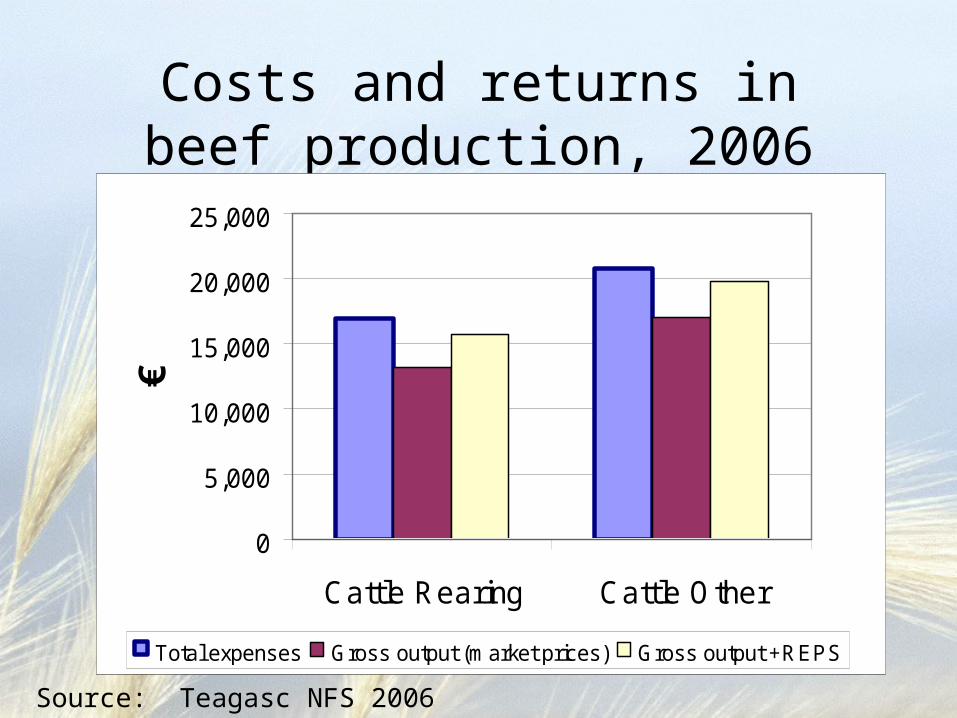
Costs and returns in beef production, 2006
0
5,000
10,000
15,000
20,000
25,000
Cattle Rearing Cattle Other
€
Total expenses Gross output (market prices) Gross output +REPS
Source: Teagasc NFS 2006
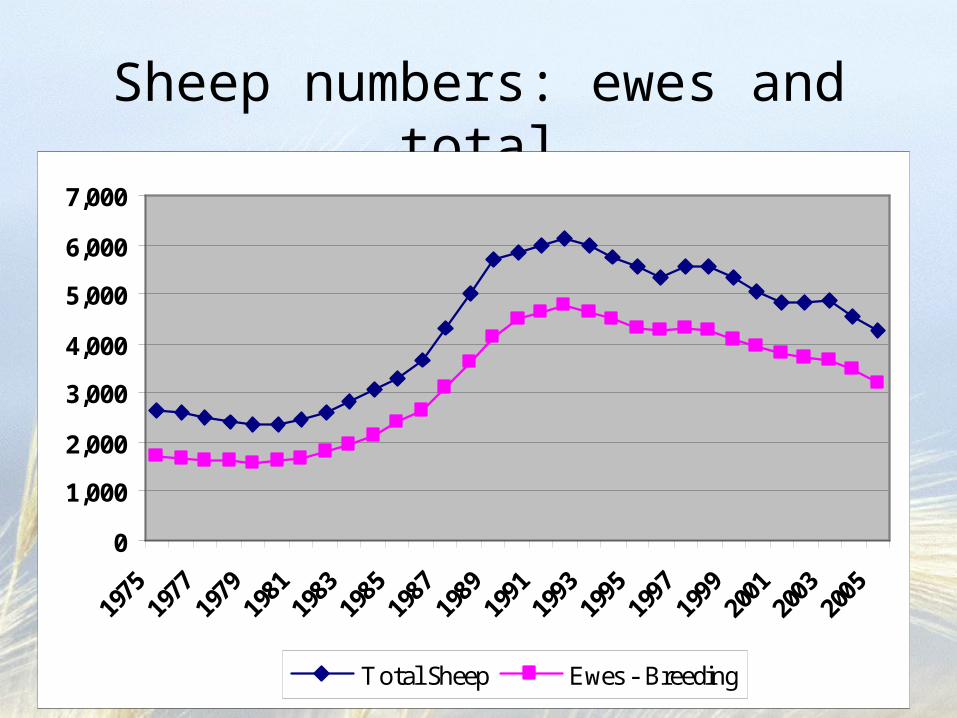
Sheep numbers: ewes and total
0
1,000
2,000
3,000
4,000
5,000
6,000
7,000
1975
1977
1979
1981
1983
1985
1987
1989
1991
1993
1995
1997
1999
2001
2003
2005
Total Sheep Ewes - Breeding
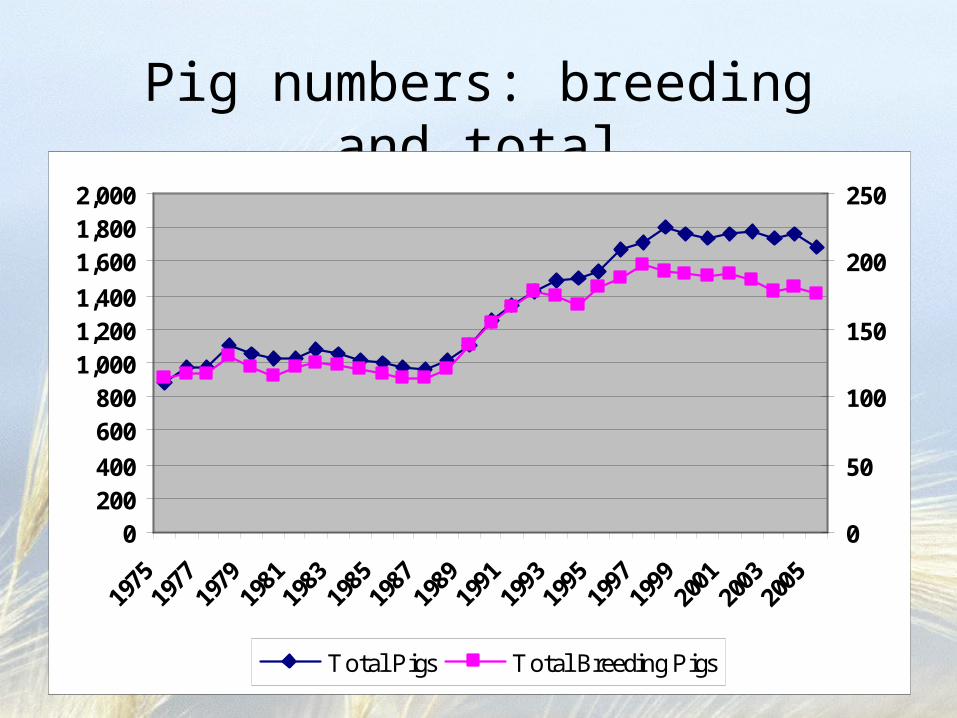
Pig numbers: breeding and total
0200400
600800
1,0001,2001,400
1,6001,8002,000
1975
1977
1979
1981
1983
1985
1987
1989
1991
1993
1995
1997
1999
2001
2003
2005
0
50
100
150
200
250
Total Pigs Total Breeding Pigs
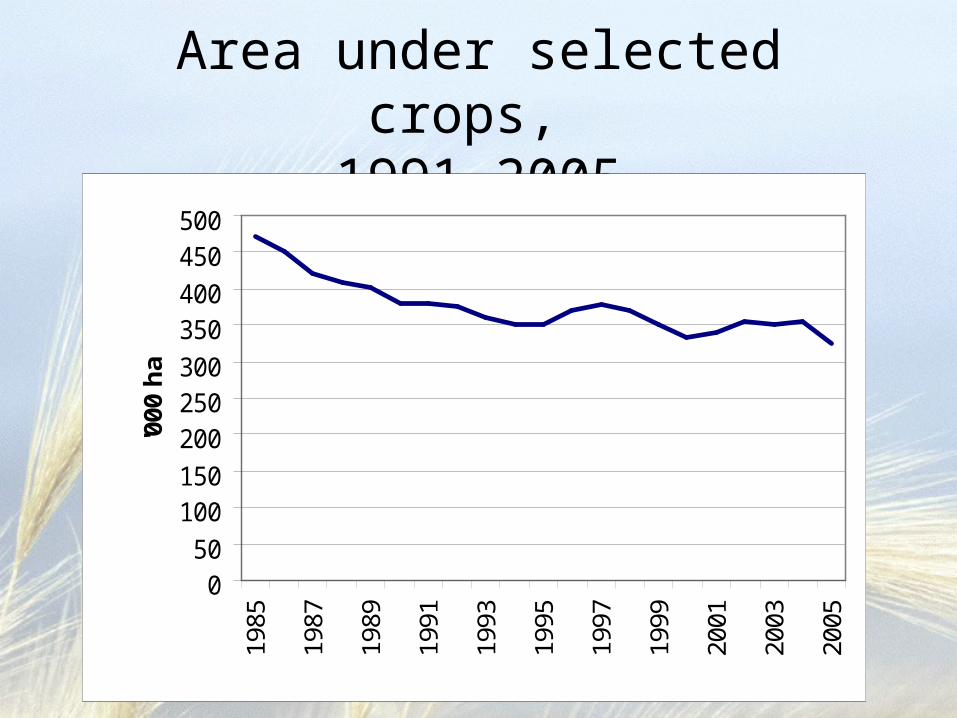
Area under selected crops, 1991-2005
050
100150
200250300
350400
450500
1985
1987
1989
1991
1993
1995
1997
1999
2001
2003
2005
'000
ha
Other stakeholders• Agri-food industry
• Forestry
• Rural
• Bioenergy
• Consumers
• Environment
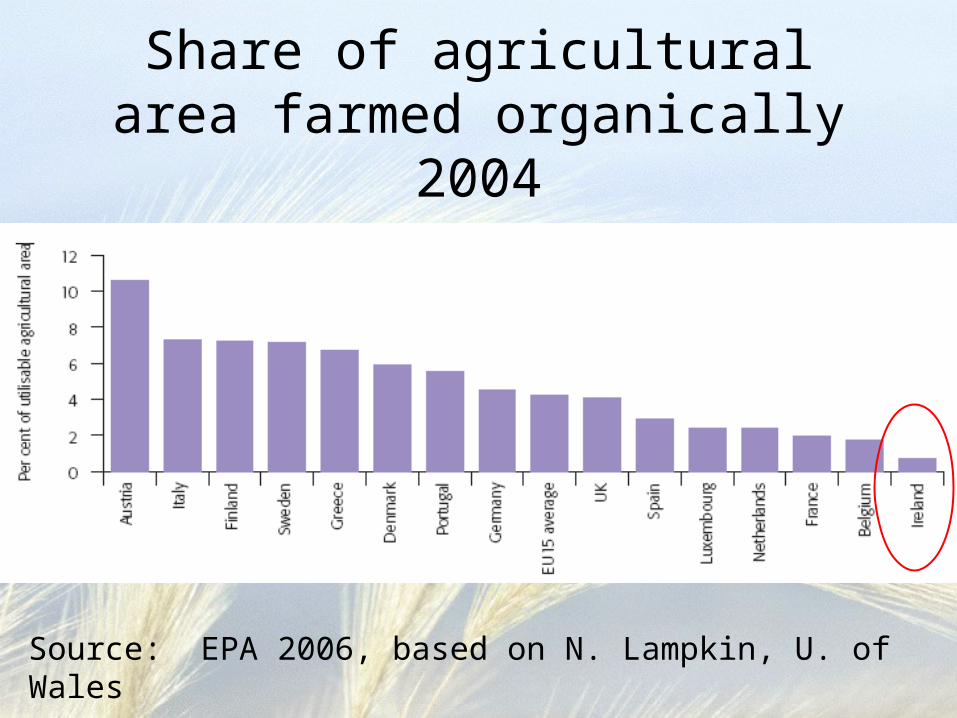
Share of agricultural area farmed organically 2004
Source: EPA 2006, based on N. Lampkin, U. of Wales
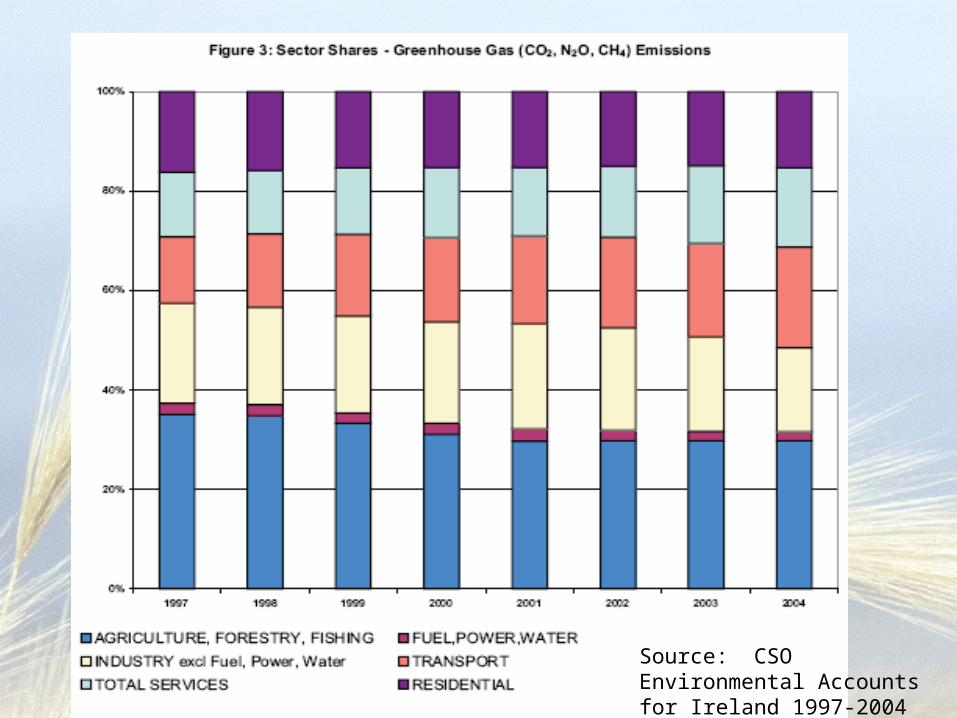
Source: CSO Environmental Accounts for Ireland 1997-2004
Implications for research and education
• Importance of agreeing long term strategic objectives to inform research/education
• High rates of return to public investment in agri-food R&D
• Importance of certainty in research funding– core vs competitive grants– own initiative vs demand driven research– economies of scale at fourth level