Embed Size (px)
Citation preview
at SciVerse ScienceDirect
Hearing Research 289 (2012) 13e26
Contents lists available
Hearing Research
journal homepage: www.elsevier .com/locate/heares
Research paper
Classification of unit types in the anteroventral cochlear nucleusof laboratory mice
Matthew J. Roos a, Bradford J. May b,*
aDepartment of Neuroscience, The Johns Hopkins University School of Medicine, Baltimore, MD, USAbDepartment of Otolaryngology e Head and Neck Surgery, The Johns Hopkins University School of Medicine, 720 Rutland Avenue, 521 Taylor Building, Baltimore, MD 21205, USA
a r t i c l e i n f o
Article history:Received 12 January 2012Received in revised form16 April 2012Accepted 23 April 2012Available online 2 May 2012
* Corresponding author. Tel.: þ1 410 614 1878; fax:E-mail address: [email protected] (B.J. May).
0378-5955/$ e see front matter � 2012 Elsevier B.V.doi:10.1016/j.heares.2012.04.019
a b s t r a c t
This report introduces a system for the objective physiological classification of single-unit activity in theanteroventral cochlear nucleus (AVCN) of anesthetized CBA/129 and CBA/CaJ mice. As in previous studies,the decision criteria are based on the temporal properties of responses to short tone bursts that arevisualized in the form of peri-stimulus time histograms (PSTHs). Individual unit types are defined by thestatistical distribution of quantifiable metrics that relate to the onset latency, regularity, and adaptationof sound-driven discharge rates. Variations of these properties reflect the unique synaptic organizationsand intrinsic membrane properties that dictate the selective tuning of sound coding in the AVCN. Whenthese metrics are applied to the mouse AVCN, responses to best frequency (BF) tones reproduce themajor PSTH patterns that have been previously demonstrated in other mammalian species. Theconsistency of response types in two genetically diverse strains of laboratory mice suggests that thepresent classification system is appropriate for additional strains with normal peripheral function. Thegeneral agreement of present findings to established classifications validates laboratory mice as anadequate model for general principles of mammalian sound coding. Nevertheless, important differencesare noted for the reliability of specialized endbulb transmission within the AVCN, suggesting less securetemporal coding in this high-frequency species.
� 2012 Elsevier B.V. All rights reserved.
1. Introduction
The interface between the auditory periphery and anteroventralcochlear nucleus (AVCN) has been a rich source of informationregarding the basic mechanisms of sound coding (Blackburn andSachs, 1990), auditory development (Feng et al., 2010; Harriset al., 2005; Limb and Ryugo, 2000), and deafness (Lee et al.,2003; Youssoufian et al., 2008). From the perspective of computa-tional neuroscience, the AVCN is an ideal model system because therelatively homogeneous projections of the auditory nerve divergeinto parallel processing pathways with unique coding attributes(Young et al., 1988b). The selective sound representations of theAVCN are dictated by variations in synaptic transmission thatinclude the size, number and site of auditory nerve inputs, theintrinsic membrane properties of the target neuron, and a localmodulatory circuitry (Trussel, 2002).
Predictive relationships between structural diversity and func-tional specialization are well defined in the AVCN where neurons
þ1 410 955 1299.
All rights reserved.
with shared cellular morphologies occupy regionalized topogra-phies that can be probed with electrophysiological techniques(Cant and Morest, 1984). Major structure/function relationshipshave been further confirmed by the histological reconstruction ofphysiologically characterized neurons (Rhode et al., 1983; Smithand Rhode, 1989). This detailed functional anatomy makes itpossible to relate the underlyingmechanisms of deafness and otherauditory processing disorders to changes in the sound codingattributes of specific cellular populations (Cai, 2007; May et al.,2011).
From the perspective of biophysical mechanisms, the mostgeneral AVCN response type is associated with cells that displaya multipolar or stellate morphology (Cant and Morest, 1979b). Theneurons have elongated dendritic fields that are contacted bynumerous bouton synapses from the auditory nerve. When a multi-polar cell is depolarized, it emits regularly timed action potentialsthat conform to the basic Hodgkin-Huxley model of neuralmembranes (Banks and Sachs, 1991; Lai et al., 1994). Peri-stimulustime histograms (PSTHs) manifest this regularity as a multi-modalchopped appearance (Fig. 1C and D, 2e4). Consequently, the physi-ological counterpart of the multipolar cell has been designated thechopper unit (Palmer et al., 2003; Pfeiffer, 1966).
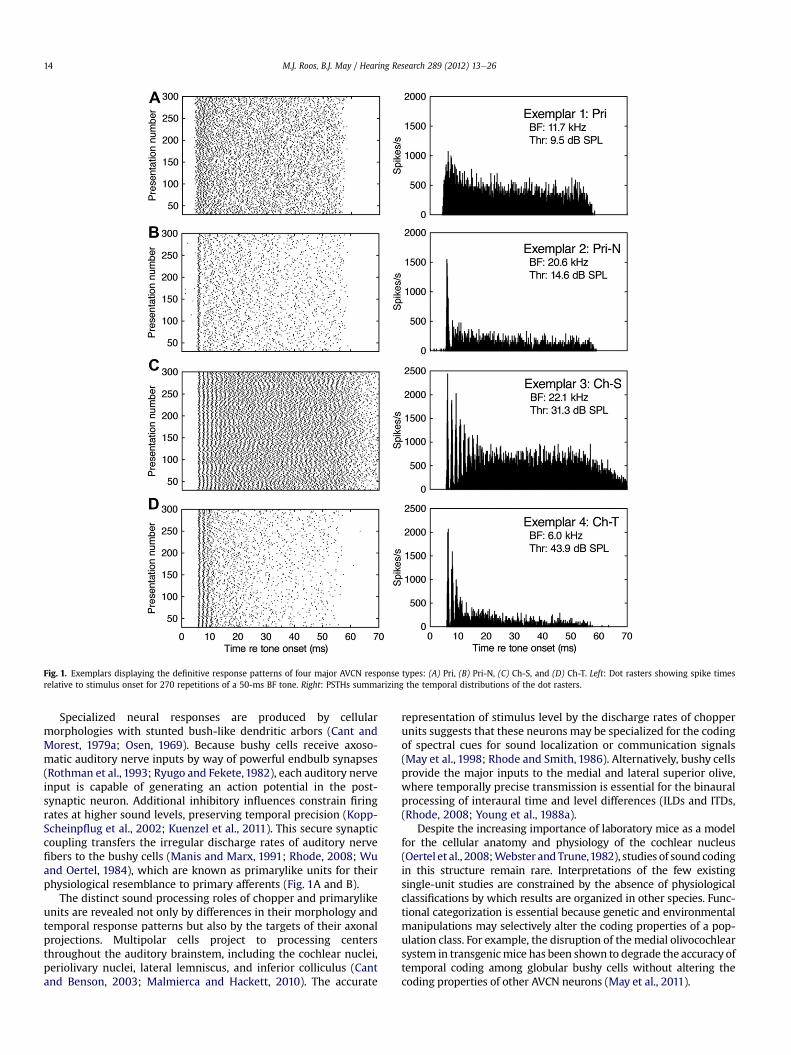
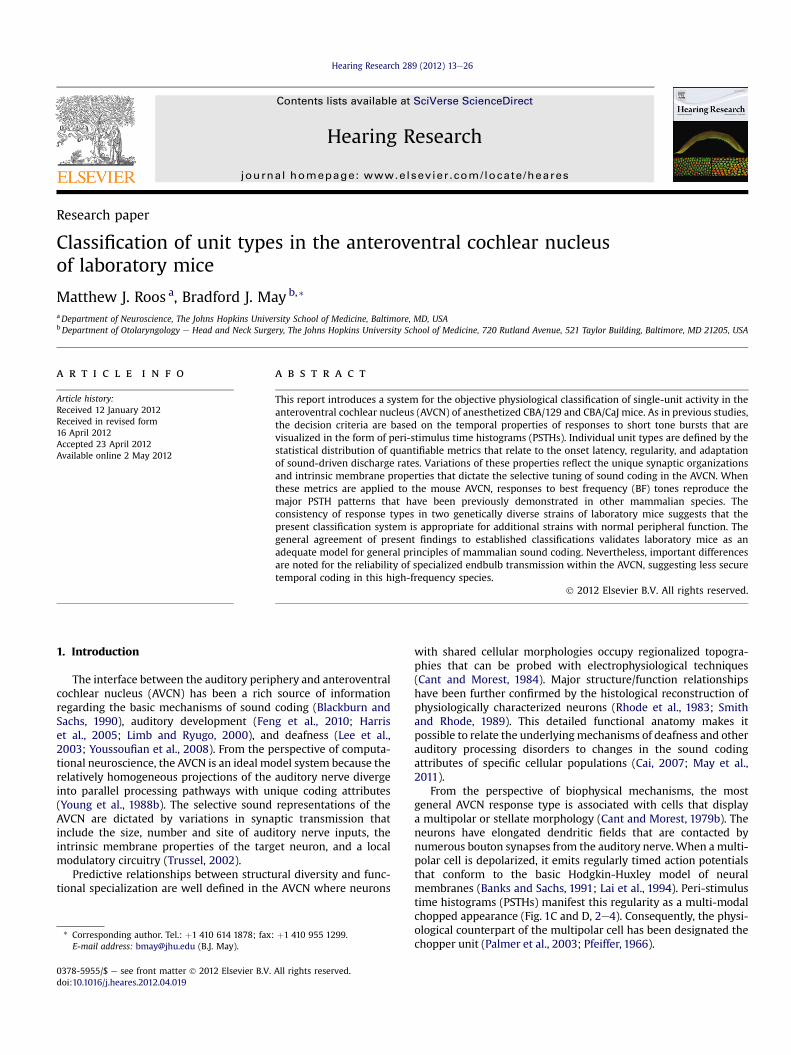
Fig. 1. Exemplars displaying the definitive response patterns of four major AVCN response types: (A) Pri, (B) Pri-N, (C) Ch-S, and (D) Ch-T. Left: Dot rasters showing spike timesrelative to stimulus onset for 270 repetitions of a 50-ms BF tone. Right: PSTHs summarizing the temporal distributions of the dot rasters.
M.J. Roos, B.J. May / Hearing Research 289 (2012) 13e2614
Specialized neural responses are produced by cellularmorphologies with stunted bush-like dendritic arbors (Cant andMorest, 1979a; Osen, 1969). Because bushy cells receive axoso-matic auditory nerve inputs by way of powerful endbulb synapses(Rothman et al., 1993; Ryugo and Fekete,1982), each auditory nerveinput is capable of generating an action potential in the post-synaptic neuron. Additional inhibitory influences constrain firingrates at higher sound levels, preserving temporal precision (Kopp-Scheinpflug et al., 2002; Kuenzel et al., 2011). This secure synapticcoupling transfers the irregular discharge rates of auditory nervefibers to the bushy cells (Manis and Marx, 1991; Rhode, 2008; Wuand Oertel, 1984), which are known as primarylike units for theirphysiological resemblance to primary afferents (Fig. 1A and B).
The distinct sound processing roles of chopper and primarylikeunits are revealed not only by differences in their morphology andtemporal response patterns but also by the targets of their axonalprojections. Multipolar cells project to processing centersthroughout the auditory brainstem, including the cochlear nuclei,periolivary nuclei, lateral lemniscus, and inferior colliculus (Cantand Benson, 2003; Malmierca and Hackett, 2010). The accurate
representation of stimulus level by the discharge rates of chopperunits suggests that these neurons may be specialized for the codingof spectral cues for sound localization or communication signals(May et al., 1998; Rhode and Smith, 1986). Alternatively, bushy cellsprovide the major inputs to the medial and lateral superior olive,where temporally precise transmission is essential for the binauralprocessing of interaural time and level differences (ILDs and ITDs,(Rhode, 2008; Young et al., 1988a).
Despite the increasing importance of laboratory mice as a modelfor the cellular anatomy and physiology of the cochlear nucleus(Oertel et al., 2008;Webster andTrune,1982), studies of sound codingin this structure remain rare. Interpretations of the few existingsingle-unit studies are constrained by the absence of physiologicalclassifications by which results are organized in other species. Func-tional categorization is essential because genetic and environmentalmanipulations may selectively alter the coding properties of a pop-ulation class. For example, the disruption of themedial olivocochlearsystem in transgenicmice has been shown to degrade the accuracy oftemporal coding among globular bushy cells without altering thecoding properties of other AVCN neurons (May et al., 2011).
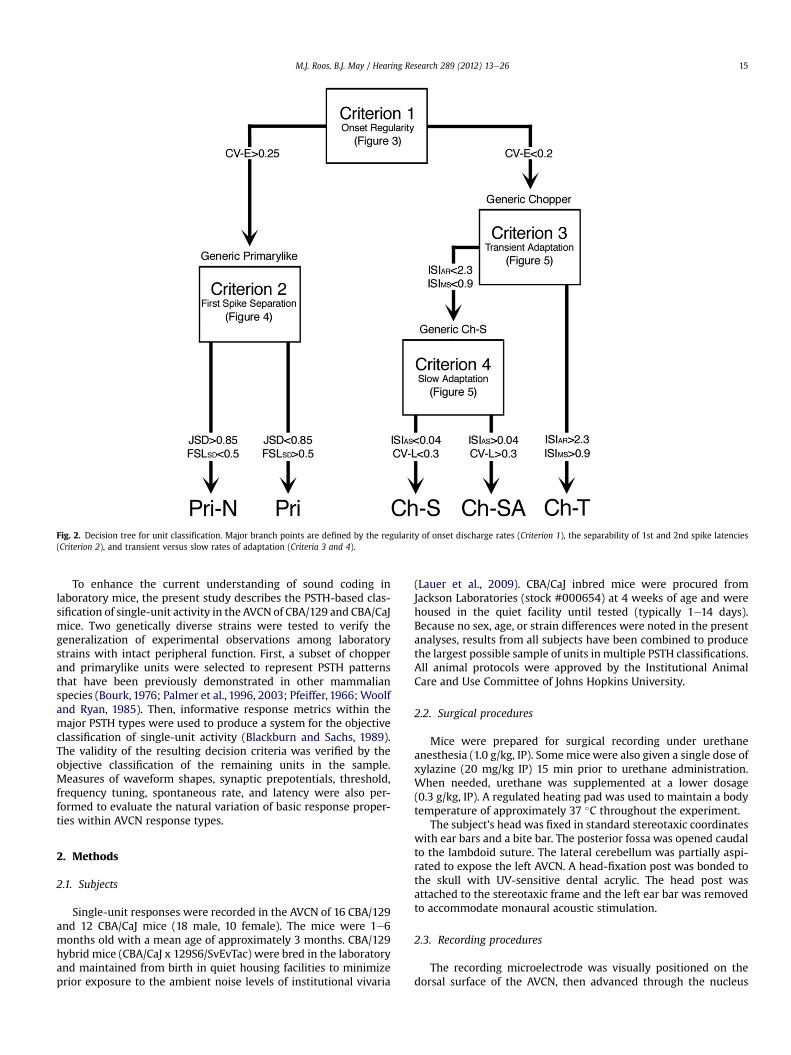
Fig. 2. Decision tree for unit classification. Major branch points are defined by the regularity of onset discharge rates (Criterion 1), the separability of 1st and 2nd spike latencies(Criterion 2), and transient versus slow rates of adaptation (Criteria 3 and 4).
M.J. Roos, B.J. May / Hearing Research 289 (2012) 13e26 15
To enhance the current understanding of sound coding inlaboratory mice, the present study describes the PSTH-based clas-sification of single-unit activity in the AVCN of CBA/129 and CBA/CaJmice. Two genetically diverse strains were tested to verify thegeneralization of experimental observations among laboratorystrains with intact peripheral function. First, a subset of chopperand primarylike units were selected to represent PSTH patternsthat have been previously demonstrated in other mammalianspecies (Bourk, 1976; Palmer et al., 1996, 2003; Pfeiffer, 1966; Woolfand Ryan, 1985). Then, informative response metrics within themajor PSTH types were used to produce a system for the objectiveclassification of single-unit activity (Blackburn and Sachs, 1989).The validity of the resulting decision criteria was verified by theobjective classification of the remaining units in the sample.Measures of waveform shapes, synaptic prepotentials, threshold,frequency tuning, spontaneous rate, and latency were also per-formed to evaluate the natural variation of basic response proper-ties within AVCN response types.
2. Methods
2.1. Subjects
Single-unit responses were recorded in the AVCN of 16 CBA/129and 12 CBA/CaJ mice (18 male, 10 female). The mice were 1e6months old with a mean age of approximately 3 months. CBA/129hybrid mice (CBA/CaJ x 129S6/SvEvTac) were bred in the laboratoryand maintained from birth in quiet housing facilities to minimizeprior exposure to the ambient noise levels of institutional vivaria
(Lauer et al., 2009). CBA/CaJ inbred mice were procured fromJackson Laboratories (stock #000654) at 4 weeks of age and werehoused in the quiet facility until tested (typically 1e14 days).Because no sex, age, or strain differences were noted in the presentanalyses, results from all subjects have been combined to producethe largest possible sample of units in multiple PSTH classifications.All animal protocols were approved by the Institutional AnimalCare and Use Committee of Johns Hopkins University.
2.2. Surgical procedures
Mice were prepared for surgical recording under urethaneanesthesia (1.0 g/kg, IP). Some mice were also given a single dose ofxylazine (20 mg/kg IP) 15 min prior to urethane administration.When needed, urethane was supplemented at a lower dosage(0.3 g/kg, IP). A regulated heating pad was used to maintain a bodytemperature of approximately 37 �C throughout the experiment.
The subject’s head was fixed in standard stereotaxic coordinateswith ear bars and a bite bar. The posterior fossa was opened caudalto the lambdoid suture. The lateral cerebellum was partially aspi-rated to expose the left AVCN. A head-fixation post was bonded tothe skull with UV-sensitive dental acrylic. The head post wasattached to the stereotaxic frame and the left ear bar was removedto accommodate monaural acoustic stimulation.
2.3. Recording procedures
The recording microelectrode was visually positioned on thedorsal surface of the AVCN, then advanced through the nucleus
Fig. 3. Criterion 1 of the decision tree. Units were assigned to generic primarylike (Pri)or chopper (Ch) categories based on an analysis of regularity. A and B: The CV scores ofthe four exemplars in Fig. 1 illustrate differences in the regularity of primarylike andchopper units. Classificationwas based on CV-E scores at stimulus onset (left inset). Thegray-filled area delineates the ambiguous zone between the two response types. C:Histograms comparing the distribution of CV-E scores for Pri and Ch exemplars.Remaining units were categorized as generic chopper or primarylike responses if theirCV-E scores coincided with either exemplar distribution. Units with ambiguous scoreswere not further categorized (NFC). Numerical labels show the location of the fourexemplars in A and B.
M.J. Roos, B.J. May / Hearing Research 289 (2012) 13e2616
with a hydraulic micropositioner. The range of the recording trackwas maximized by orienting the microelectrode at an angle of 25�
in the sagittal plane, so that the electrode passed through the longaxis of the nucleus along a dorsal-caudal to ventral-rostraltrajectory.
Extracellular recordings were made using glass micropipetteswith impedances near 1 MU. The electrodes had tip diameters of1.5e2.0 mm and were filled with 3 M NaCl. The electrode signal wasbandpass filtered (10e5000 Hz) and amplified (3000e15000�). ASchmitt trigger was used to record the timing of action potentialsrelative to stimulus onsets with 10-ms resolution. Some recordings
were made with 5-MU tungsten electrodes (A-M Systems), butmicropipettes tended to yield a larger number of well-isolated unitsin each preparation. Comparisons of PSTH shapes and classificationcriteria betweenmicroelectrode types did not reveal any significantdifferences. Minimum first spike latency was used to separateprimarylike units from auditory nerve fibers (Liberman, 1993;Spirou et al., 2005). Other response types were easily distinguishedfrom auditory nerve fibers by their unique PSTH shapes.
2.4. Acoustic stimuli
Acoustic stimuli were presented in free-field to minimizesurgical manipulations of the outer ear and to avoid issues ofclosed-field calibration at high frequencies (Pearce et al., 2001).Experiments were conducted inside a double-walled sound-attenuating chamber to control ambient sound levels (IndustrialAcoustic Company). The single loudspeaker (Tannoy, SatelliteArena-BL) was positioned approximately 36 cm from the mouse’shead at a spatial orientation of 45� azimuth, 0� elevation in thehemifield of the unoccluded left ear. All stimuli were synthesized inMATLAB and generated with multifunction digital processors(Tucker-Davis Technologies, RX6). Sound levels were controlledwith programmable attenuators (Tucker-Davis Technologies, PA5)and a power amplifier (Crown D-45). Acoustic calibrations wereperformed by recording the output of the loudspeaker at thelocation of the subject’s head with a ¼ inch free-field condensermicrophone (Bruel & Kjær, type 4939). Calibrations werecompleted prior to electrophysiological experiments withouta mouse in the testing apparatus. The free-field frequency responseof the loudspeaker varied by �10 dB across the range of sampledneurons (6e50 kHz).
Neurons with sound-driven activity were isolated by presentingshort bursts of tone or noise as the electrode advanced through theAVCN. The BFs and thresholds of well-isolated units were deter-mined by manually sweeping the frequency and level of tonebursts.
Peri-stimulus time histograms (PSTHs) provided the essentialresponse metrics for unit classification (Fig. 1). PSTHs werecollected by presenting 300 repetitions of BF tone bursts. The toneswere 50ms in duration (5-ms rise/fall times) andwere presented ata rate of 4 bursts/s. The level of the tones was 30 dB relative to theunit’s threshold. To mitigate adaptation effects, responses to thefirst 30 repetitions were not included in the analysis of PSTHs. Theremaining spike activity was sorted into 0.1-ms bins relative tostimulus onset.
Rate-level functions (RALVs) provided a precise estimate of thestimulus levels that were unambiguously represented by changesin sound-driven discharge rates. RALVs were collected by pre-senting a 100-dB range of BF tone levels in ascending steps of 1 dB.The tones were 200 ms in duration (10-ms rise/fall times) andrepeated at a rate of 1 tone burst/s. Absolute stimulus levels wereadjusted for each unit to sample the complete dynamic range ofsound-driven activity. Typically, the lowest level was approxi-mately 10 dB below the BF threshold.
Frequency response maps (FRMs) revealed the combined effectsof frequency and level on the unit’s excitatory/inhibitory responsepatterns. FRMs were constructed by presenting a sequence of tonebursts that began at BF and expanded outwardly in frequency stepsof 0.04 octaves. A typical sequence included 100 tones spanning 4octaves. The process was repeated at multiple levels across thedynamic range of on-BF responses, as indicated by RALVs. If the unitwas held at the completion of these measures, additional charac-terizations were performed (e.g., temporal modulation functions,random spectral shapes), somewhat limiting the yield of units fromeach 2e3 h recording session.
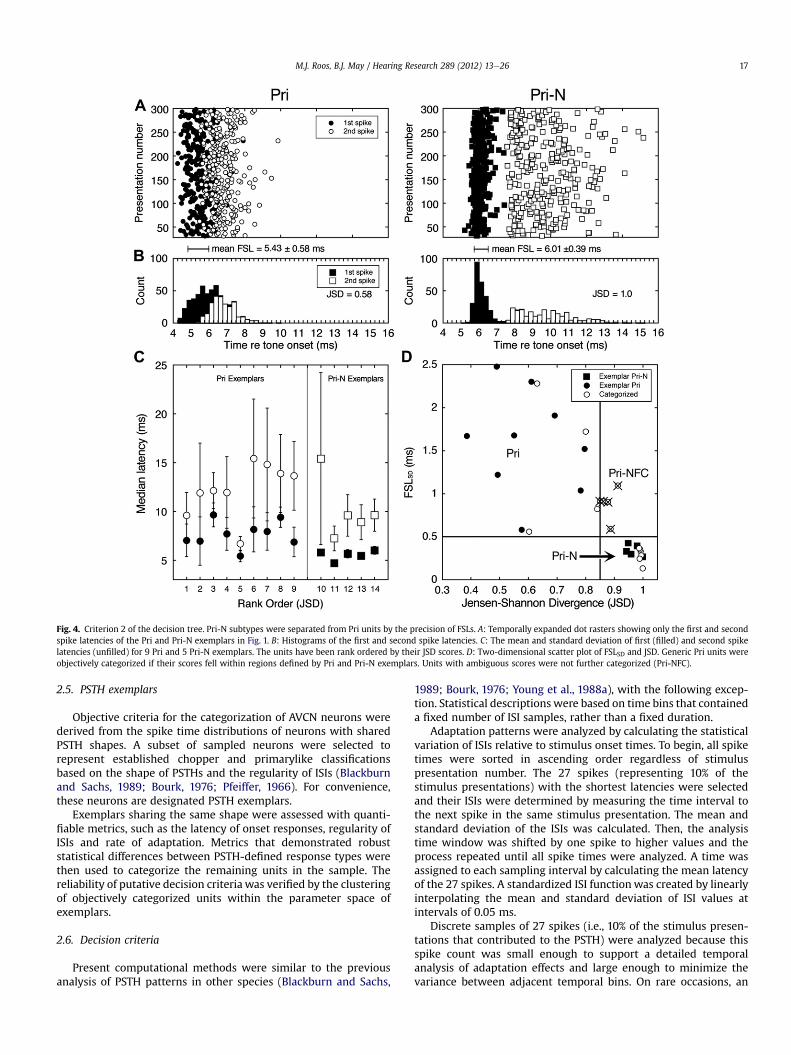
Fig. 4. Criterion 2 of the decision tree. Pri-N subtypes were separated from Pri units by the precision of FSLs. A: Temporally expanded dot rasters showing only the first and secondspike latencies of the Pri and Pri-N exemplars in Fig. 1. B: Histograms of the first and second spike latencies. C: The mean and standard deviation of first (filled) and second spikelatencies (unfilled) for 9 Pri and 5 Pri-N exemplars. The units have been rank ordered by their JSD scores. D: Two-dimensional scatter plot of FSLSD and JSD. Generic Pri units wereobjectively categorized if their scores fell within regions defined by Pri and Pri-N exemplars. Units with ambiguous scores were not further categorized (Pri-NFC).
M.J. Roos, B.J. May / Hearing Research 289 (2012) 13e26 17
2.5. PSTH exemplars
Objective criteria for the categorization of AVCN neurons werederived from the spike time distributions of neurons with sharedPSTH shapes. A subset of sampled neurons were selected torepresent established chopper and primarylike classificationsbased on the shape of PSTHs and the regularity of ISIs (Blackburnand Sachs, 1989; Bourk, 1976; Pfeiffer, 1966). For convenience,these neurons are designated PSTH exemplars.
Exemplars sharing the same shape were assessed with quanti-fiable metrics, such as the latency of onset responses, regularity ofISIs and rate of adaptation. Metrics that demonstrated robuststatistical differences between PSTH-defined response types werethen used to categorize the remaining units in the sample. Thereliability of putative decision criteria was verified by the clusteringof objectively categorized units within the parameter space ofexemplars.
2.6. Decision criteria
Present computational methods were similar to the previousanalysis of PSTH patterns in other species (Blackburn and Sachs,
1989; Bourk, 1976; Young et al., 1988a), with the following excep-tion. Statistical descriptions were based on time bins that containeda fixed number of ISI samples, rather than a fixed duration.
Adaptation patterns were analyzed by calculating the statisticalvariation of ISIs relative to stimulus onset times. To begin, all spiketimes were sorted in ascending order regardless of stimuluspresentation number. The 27 spikes (representing 10% of thestimulus presentations) with the shortest latencies were selectedand their ISIs were determined by measuring the time interval tothe next spike in the same stimulus presentation. The mean andstandard deviation of the ISIs was calculated. Then, the analysistime window was shifted by one spike to higher values and theprocess repeated until all spike times were analyzed. A time wasassigned to each sampling interval by calculating the mean latencyof the 27 spikes. A standardized ISI functionwas created by linearlyinterpolating the mean and standard deviation of ISI values atintervals of 0.05 ms.
Discrete samples of 27 spikes (i.e., 10% of the stimulus presen-tations that contributed to the PSTH) were analyzed because thisspike count was small enough to support a detailed temporalanalysis of adaptation effects and large enough to minimize thevariance between adjacent temporal bins. On rare occasions, an
M.J. Roos, B.J. May / Hearing Research 289 (2012) 13e2618
individual ISI value deviated from the mean of the 27 spikes bymore than three standard deviations, presumably indicating a falsetrigger or a missed spike. These outliers were removed, and ISIstatistics were recalculated from the remaining values.
2.7. Regularity at stimulus onset
The coefficient of variation (CV) was used to perform the initialseparation of generic primarylike and chopper units. This metricwas derived from the ratio of the standard deviation to the mean ofISI values (Young et al., 1988a). Chopper units with regularly timedISIs were expected to generate smaller standard deviations, andtherefore lower CV scores than irregular primarylike units.
CV scores cannot be applied arbitrarily to ISI functions becausetransient and slowly adapting chopper units (Ch-Tand Ch-SA) showincreased irregularity later in the stimulus. For this reason, genericprimarylike and chopper units were identified by their CV scores atthe onset of sound-driven activity. The early CV (CV-E) statistic wasdefined as the median of CV scores within �0.1 ms of a unit’smedian first spike latency (FSLmedian, as defined below). Quantifi-able decision criteria were subsequently established by analyzingthe statistical distribution of CV-E scores among primarylike andchopper exemplars.
2.8. Onset precision
The initial onset spikes of generic primarylike units wereanalyzed in terms of their latency, variability, and temporalseparability. The minimum first spike latency (FSLmin) reflects theeffective synaptic delay of its auditory nerve inputs. Becauseneurons within the major PSTH types receive different forms ofsynaptic contact from the auditory periphery, the latency ofsound-driven activity is an alternative method for verifying theassumed anatomical basis of physiological classifications. Incomparison to chopper units, primarylike units show relativelyshort latencies because they receive powerful axosomatic inputsfrom the auditory nerve (Rhode et al., 1983; Ryugo and Sento,1991). Among generic primarylike (Pri) units, primarylike-with-notch (Pri-N) units are expected to display the shortest FSLminbecause they receive a greater number of inputs from the auditorynerve (Rhode, 2008).
The FSLmin of sound-driven activity is not necessarily indicatedby the timing of the first spike after stimulus onset because spon-taneous spikes may occur prior to stimulated spikes. To avoid thisambiguity, FSLmin was defined as the minimum time interval afterstimulus onset that elicited a statistically significant rate increaseabove the probability of spontaneous activity. This metric wasestimated by comparing the number of spikes in a stimulus-onwindow (stimulated and spontaneous spikes) and a stimulus-offwindow (spontaneous spikes). The stimulus-on window began atstimulus onset and was adjusted in duration so that the number ofstimulus-on spikes exceeded the expected number of spikes ina stimulus-off window of equal duration, under the assumptionthat the neuronwas a Poisson process firing at its spontaneous rate(p < 0.0001, (Chase and Young, 2007). Spontaneous activity wassampled during the final 100 ms of the inter-stimulus interval toavoid adaptation effects. When a unit did not exhibit spontaneousactivity, a sound-driven response was verified by adjusting theduration of the stimulus-on window until at least five spikes werecaptured.
Relative to generic primarylike units, the highly convergentinputs of Pri-N units are expected to produce more precisely timedonset responses. The median and standard deviation of first spikelatencies (FSLmedian, FSLSD) were derived from the PSTH by selectingspike times that met the following criteria. The spikes must have
preceded FSLmin by no more than 0.5 ms or followed FSLmin by nomore than 10 ms.
The precise FSLmedian of Pri-N neurons imposes an absoluterefractory period that delays the second spike. As a result, thehigh onset rates of the PSTH are followed by a brief period ofinactivity (i.e., notch). The separability of first and second spikelatencies was quantified with the Jensen-Shannon Divergence(JSD) statistic, which was computed in MATLAB with the KLDIVfunction. This variant of Kullback-Leibler Divergence indicatesthe dissimilarity of two probability distributions with finitevalues that range from 0 to 1 (Antolin et al., 2009). A JSD of0 indicates identical distributions; a value of 1 indicates twonon-overlapping distributions. The prominent notch in the onsetresponses of Pri-N units is expected to produce JSD scores thatapproach 1.
The calculation of JSD takes the general form:
JSD�F; S
� ¼ 12DðFjjMÞ þ 1
2DðSjjMÞ
DðFjjM� ¼X
i
F�i�log
FðiÞMðiÞ
DðSjjM� ¼X
i
S�i�log
SðiÞMðiÞ
M ¼ 12�F þ S
�
where F and S are the temporal probability distributions for firstand second spikes (computed with bins of 0.2 ms), and i is the binindex. M is the midpoint distribution of F and S. D is the Kullback-Leibler Divergence for a discrete random variable.
2.9. Non-linear adaptation
Measures of non-linear (transient) adaptation were designed toquantify rapid changes in sound-driven rates during the initial10e15 ms of sound-driven activity. Ch-S units were expected tomaintain high driven rates during this time interval, while Ch-Tunits were expected to exhibit a sharp rate decrease.
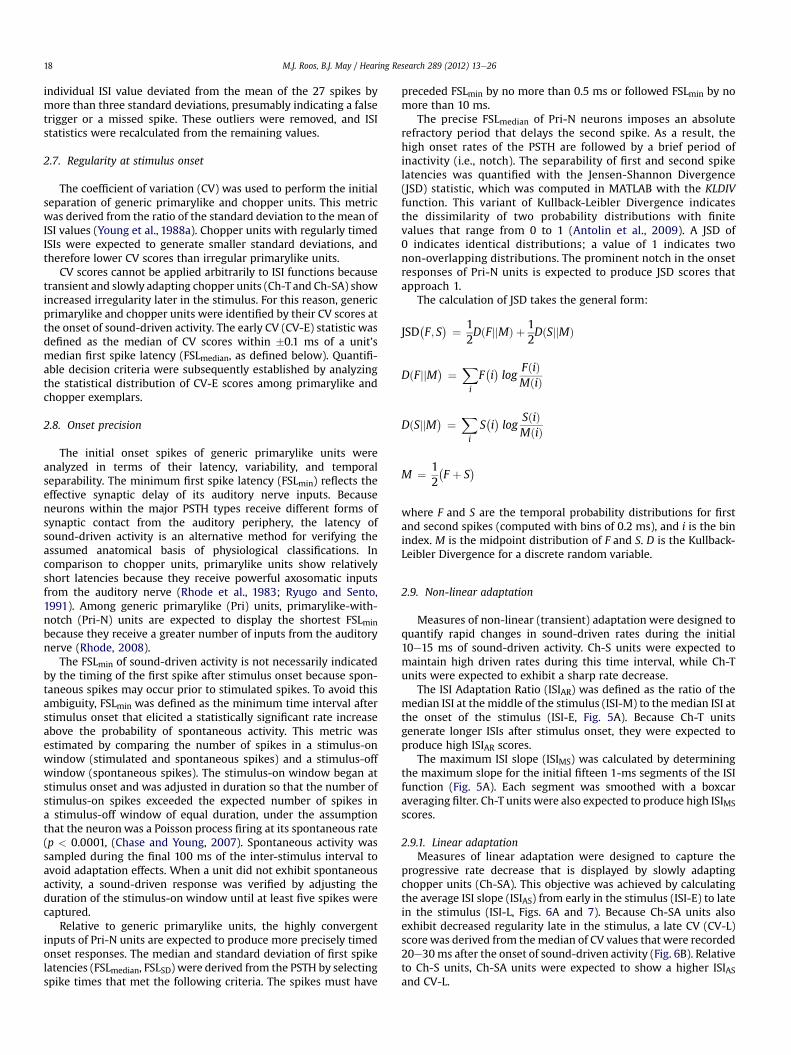
The ISI Adaptation Ratio (ISIAR) was defined as the ratio of themedian ISI at the middle of the stimulus (ISI-M) to the median ISI atthe onset of the stimulus (ISI-E, Fig. 5A). Because Ch-T unitsgenerate longer ISIs after stimulus onset, they were expected toproduce high ISIAR scores.
The maximum ISI slope (ISIMS) was calculated by determiningthe maximum slope for the initial fifteen 1-ms segments of the ISIfunction (Fig. 5A). Each segment was smoothed with a boxcaraveraging filter. Ch-T units were also expected to produce high ISIMSscores.
2.9.1. Linear adaptationMeasures of linear adaptation were designed to capture the
progressive rate decrease that is displayed by slowly adaptingchopper units (Ch-SA). This objective was achieved by calculatingthe average ISI slope (ISIAS) from early in the stimulus (ISI-E) to latein the stimulus (ISI-L, Figs. 6A and 7). Because Ch-SA units alsoexhibit decreased regularity late in the stimulus, a late CV (CV-L)score was derived from themedian of CV values that were recorded20e30ms after the onset of sound-driven activity (Fig. 6B). Relativeto Ch-S units, Ch-SA units were expected to show a higher ISIASand CV-L.
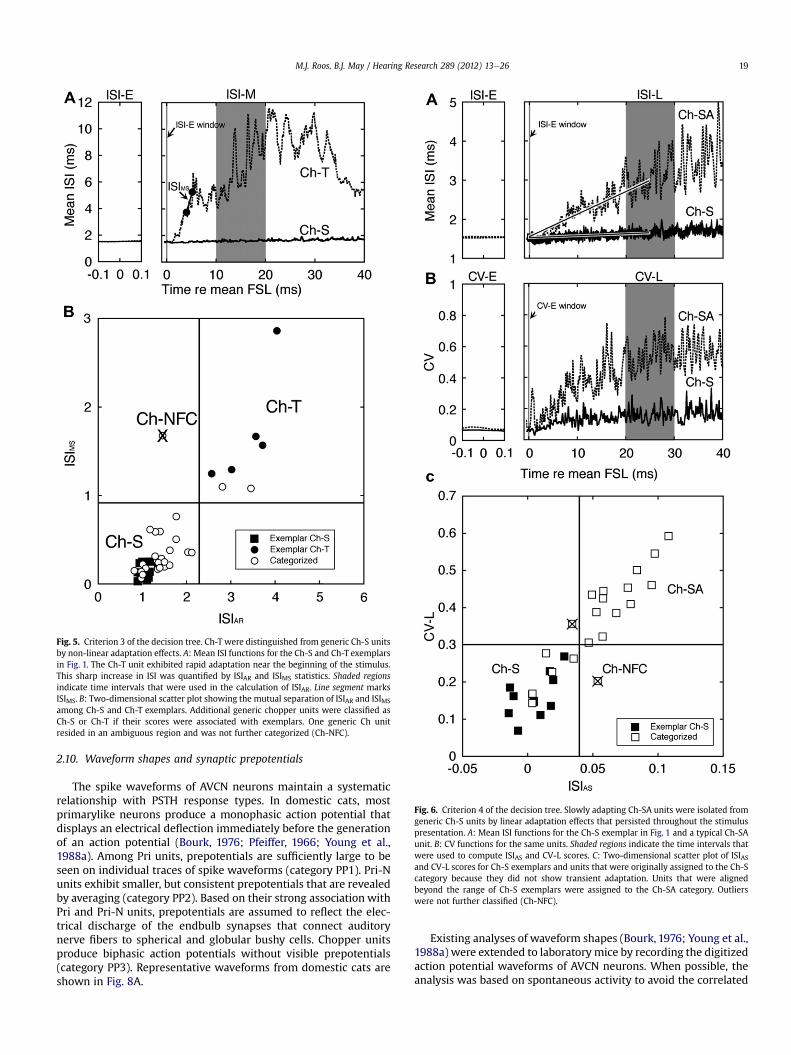
Fig. 6. Criterion 4 of the decision tree. Slowly adapting Ch-SA units were isolated fromgeneric Ch-S units by linear adaptation effects that persisted throughout the stimuluspresentation. A: Mean ISI functions for the Ch-S exemplar in Fig. 1 and a typical Ch-SAunit. B: CV functions for the same units. Shaded regions indicate the time intervals thatwere used to compute ISIAS and CV-L scores. C: Two-dimensional scatter plot of ISIASand CV-L scores for Ch-S exemplars and units that were originally assigned to the Ch-Scategory because they did not show transient adaptation. Units that were alignedbeyond the range of Ch-S exemplars were assigned to the Ch-SA category. Outlierswere not further classified (Ch-NFC).
Fig. 5. Criterion 3 of the decision tree. Ch-T were distinguished from generic Ch-S unitsby non-linear adaptation effects. A: Mean ISI functions for the Ch-S and Ch-T exemplarsin Fig. 1. The Ch-T unit exhibited rapid adaptation near the beginning of the stimulus.This sharp increase in ISI was quantified by ISIAR and ISIMS statistics. Shaded regionsindicate time intervals that were used in the calculation of ISIAR. Line segment marksISIMS. B: Two-dimensional scatter plot showing the mutual separation of ISIAR and ISIMS
among Ch-S and Ch-T exemplars. Additional generic chopper units were classified asCh-S or Ch-T if their scores were associated with exemplars. One generic Ch unitresided in an ambiguous region and was not further categorized (Ch-NFC).
M.J. Roos, B.J. May / Hearing Research 289 (2012) 13e26 19
2.10. Waveform shapes and synaptic prepotentials
The spike waveforms of AVCN neurons maintain a systematicrelationship with PSTH response types. In domestic cats, mostprimarylike neurons produce a monophasic action potential thatdisplays an electrical deflection immediately before the generationof an action potential (Bourk, 1976; Pfeiffer, 1966; Young et al.,1988a). Among Pri units, prepotentials are sufficiently large to beseen on individual traces of spike waveforms (category PP1). Pri-Nunits exhibit smaller, but consistent prepotentials that are revealedby averaging (category PP2). Based on their strong association withPri and Pri-N units, prepotentials are assumed to reflect the elec-trical discharge of the endbulb synapses that connect auditorynerve fibers to spherical and globular bushy cells. Chopper unitsproduce biphasic action potentials without visible prepotentials(category PP3). Representative waveforms from domestic cats areshown in Fig. 8A.
Existing analyses of waveform shapes (Bourk, 1976; Young et al.,1988a) were extended to laboratory mice by recording the digitizedaction potential waveforms of AVCN neurons. When possible, theanalysis was based on spontaneous activity to avoid the correlated
Fig. 7. Objectively categorized units displaying the same response patterns as the Pri, Pri-N, Ch-S, and Ch-T exemplars in Fig. 1. Plotting conventions are described in that figure.
M.J. Roos, B.J. May / Hearing Research 289 (2012) 13e2620
electrical interference of nearby neurons. Action potentials wereelicited from units without spontaneous activity by presentingnear-threshold BF tones. The resulting waveforms were sampled ata rate of 500 MS/s and averaged over 64 consecutive spike acqui-sitions (Tektronix 1000B digital storage oscilloscope). Prepotentialswere identified by a positive deflection in the average waveformthat preceded the action potential by less than 0.5 ms.
2.11. BF threshold, excitatory bandwidth, and spontaneous rate
The BF threshold was defined as the minimum sound level thatelicited a sound-driven response. Threshold estimates were derivedfrom statistical comparisons of spike rates during the stimulus onand stimulus-off intervals of RALVs. Stimulus-on (driven) rateswere sampled during a 200-ms window that was synchronizedwith stimulus onset. Stimulus-off (spontaneous) rates weresampled during the final 400 ms of the 800-ms inter-stimulusintervals. As an additional control for adaptation effects,stimulus-off rates were only sampled from the initial 20 stimuluspresentations of the RALV (i.e., the lowest presentation levels).
A 50% confidence interval (CI) was calculated under theassumption that the neuron was a Poisson process firing at itsspontaneous rate (MATLAB, poissfit function, (Cai, 2007). Thresholdwas defined as the lowest of five consecutive levels wherestimulus-on rates exceeded the 50% CI. The probability that fivesub-threshold levels would produce a stimulus-on rate exceedingthe stimulus-off rate is 0.255 (p ¼ 0.001).
The bandwidth of frequency tuning was characterized with Q10values thatwerederived fromFRMs.Byconvention,Q10 is the ratioofBF to excitatory bandwidth 10 dB above the BF threshold. Excitatorybandwidth was defined for this calculation as the range of consec-utive frequencies where stimulus-on rates exceeded stimulus-offrates, using the same statistical test that was applied during thedetermination of BF thresholds. Because threshold was determinedby the off-line analysis of RALVs, frequency sequences usually werenot obtained at exactly 10 dB re threshold. In these instances,responses were linearly interpolated from the closest surroundinglevels in the FRM. Similarly, sound-driven rates were interpolatedbetween the 0.04-octave frequency steps to increase the resolutionof frequency sampling near the edge of excitatory cutoffs.
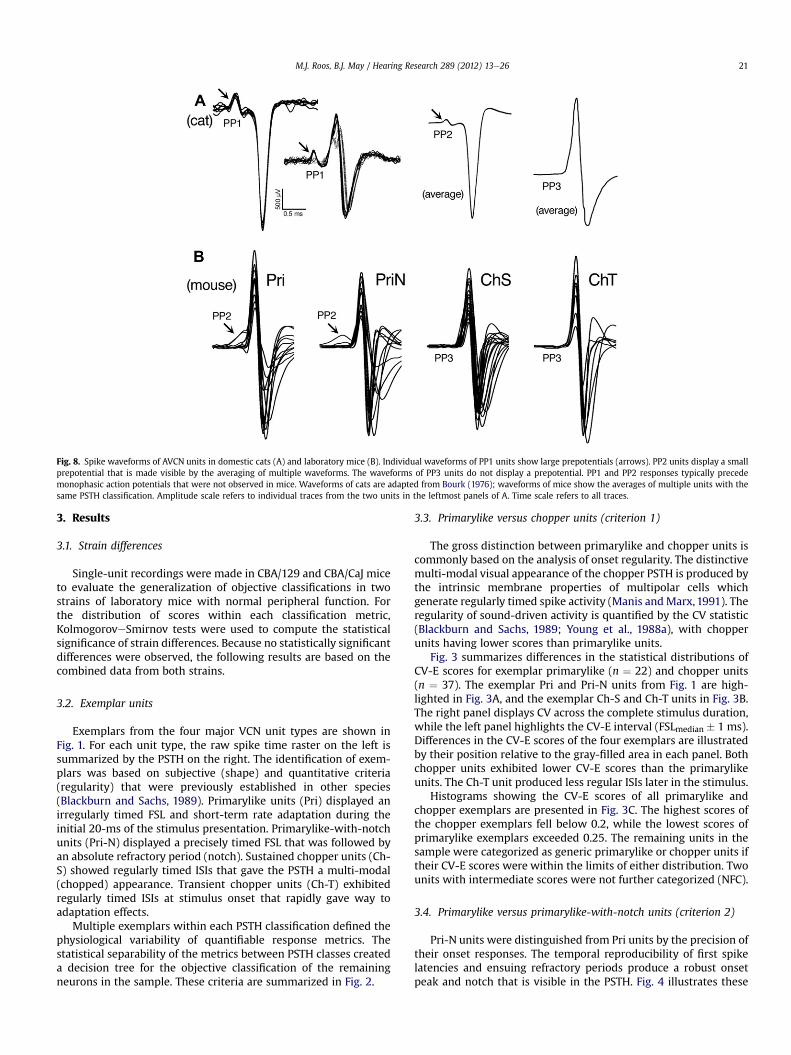
Fig. 8. Spike waveforms of AVCN units in domestic cats (A) and laboratory mice (B). Individual waveforms of PP1 units show large prepotentials (arrows). PP2 units display a smallprepotential that is made visible by the averaging of multiple waveforms. The waveforms of PP3 units do not display a prepotential. PP1 and PP2 responses typically precedemonophasic action potentials that were not observed in mice. Waveforms of cats are adapted from Bourk (1976); waveforms of mice show the averages of multiple units with thesame PSTH classification. Amplitude scale refers to individual traces from the two units in the leftmost panels of A. Time scale refers to all traces.
M.J. Roos, B.J. May / Hearing Research 289 (2012) 13e26 21
3. Results
3.1. Strain differences
Single-unit recordings were made in CBA/129 and CBA/CaJ miceto evaluate the generalization of objective classifications in twostrains of laboratory mice with normal peripheral function. Forthe distribution of scores within each classification metric,KolmogoroveSmirnov tests were used to compute the statisticalsignificance of strain differences. Because no statistically significantdifferences were observed, the following results are based on thecombined data from both strains.
3.2. Exemplar units
Exemplars from the four major VCN unit types are shown inFig. 1. For each unit type, the raw spike time raster on the left issummarized by the PSTH on the right. The identification of exem-plars was based on subjective (shape) and quantitative criteria(regularity) that were previously established in other species(Blackburn and Sachs, 1989). Primarylike units (Pri) displayed anirregularly timed FSL and short-term rate adaptation during theinitial 20-ms of the stimulus presentation. Primarylike-with-notchunits (Pri-N) displayed a precisely timed FSL that was followed byan absolute refractory period (notch). Sustained chopper units (Ch-S) showed regularly timed ISIs that gave the PSTH a multi-modal(chopped) appearance. Transient chopper units (Ch-T) exhibitedregularly timed ISIs at stimulus onset that rapidly gave way toadaptation effects.
Multiple exemplars within each PSTH classification defined thephysiological variability of quantifiable response metrics. Thestatistical separability of the metrics between PSTH classes createda decision tree for the objective classification of the remainingneurons in the sample. These criteria are summarized in Fig. 2.
3.3. Primarylike versus chopper units (criterion 1)
The gross distinction between primarylike and chopper units iscommonly based on the analysis of onset regularity. The distinctivemulti-modal visual appearance of the chopper PSTH is produced bythe intrinsic membrane properties of multipolar cells whichgenerate regularly timed spike activity (Manis andMarx,1991). Theregularity of sound-driven activity is quantified by the CV statistic(Blackburn and Sachs, 1989; Young et al., 1988a), with chopperunits having lower scores than primarylike units.
Fig. 3 summarizes differences in the statistical distributions ofCV-E scores for exemplar primarylike (n ¼ 22) and chopper units(n ¼ 37). The exemplar Pri and Pri-N units from Fig. 1 are high-lighted in Fig. 3A, and the exemplar Ch-S and Ch-T units in Fig. 3B.The right panel displays CV across the complete stimulus duration,while the left panel highlights the CV-E interval (FSLmedian � 1 ms).Differences in the CV-E scores of the four exemplars are illustratedby their position relative to the gray-filled area in each panel. Bothchopper units exhibited lower CV-E scores than the primarylikeunits. The Ch-T unit produced less regular ISIs later in the stimulus.
Histograms showing the CV-E scores of all primarylike andchopper exemplars are presented in Fig. 3C. The highest scores ofthe chopper exemplars fell below 0.2, while the lowest scores ofprimarylike exemplars exceeded 0.25. The remaining units in thesample were categorized as generic primarylike or chopper units iftheir CV-E scores were within the limits of either distribution. Twounits with intermediate scores were not further categorized (NFC).
3.4. Primarylike versus primarylike-with-notch units (criterion 2)
Pri-N units were distinguished from Pri units by the precision oftheir onset responses. The temporal reproducibility of first spikelatencies and ensuing refractory periods produce a robust onsetpeak and notch that is visible in the PSTH. Fig. 4 illustrates these
M.J. Roos, B.J. May / Hearing Research 289 (2012) 13e2622
features for the Pri and Pri-N exemplars in Fig. 1A and B. The timescale of the spike time rasters in Fig. 4A have been expanded toshow only the first and second spikes of each stimulus presenta-tion. The statistical distributions of the spike times are summarizedby the histograms in Fig. 4B.
The mean and standard deviation of first and second spikelatencies are presented for 9 Pri and 5 Pri-N exemplars in Fig. 4C.The units are rank ordered by the statistical separation of first andsecond spike latencies, as quantified by JSD scores. Units with themost separable spike latencies are shown on the right. First andsecond spike latencies were highly variable for the population of Priexemplars, which resulted in substantial overlap between the twodistributions. Second spike latencies also were variable for the Pri-N exemplars, but the precision of first spike latencies maintaineda clear separation between the distributions.
Themathematical separability of first and second spike latencieswas quantified with JSD and FSLSD statistics. When exemplars areplotted along these two dimensions in Fig. 4D, Pri-N units cluster ina region of low FSLSD (precision) and high JSD (separability). Priunits disperse over a greater range of parameter space, but remainspatially segregated from Pri-N units.
Categorization of generic primarylike units was based on howwell their FSLSD and JSD scores co-localized with Pri or Pri-Nexemplars. Ten units met the criteria for Pri (n ¼ 4) or Pri-N clas-sification (n ¼ 6). Five units displayed ambiguous scores and werenot further categorized (NFC).
3.5. Sustained versus transient choppers (criterion 3)
Chopper units were separated into sustained (Ch-S) and tran-sient (Ch-T) subtypes based on the temporal properties of their ISIfunctions (Blackburn and Sachs, 1989, 1992). Fig. 5A contrasts theISI functions of the Ch-S and Ch-T exemplars in Fig. 1C and D. TheCh-S exemplar produced consistently short ISIs throughout thestimulus presentation because it maintained a high sound-drivenrate. The Ch-T exemplar produced ISIs that lengthened abruptlytoward the beginning of the stimulus because sound-driven ratesrapidly adapted. Median “chopping” frequencies were higheramong Ch-T units (726 Hz) than among Ch-S units (325 Hz) prior toadaptation, but both classifications produced a number of unitswith frequencies exceeding 500 Hz. Discharge rates of thismagnitude were uncommon among primarylike units.
The transient adaptation effects of Ch-T exemplars werequantified with the ISIAR and ISIMS statistics. Methods for thecalculation of these metrics are related to ISI functions in Fig. 5A.Two-dimensional plots of the metrics are illustrated with 12 Ch-Sand 5 Ch-T exemplars in Fig. 5B. All of the Ch-S exemplarsproduced ISIAR scores that were less than 1.5. Their ISIMS scoreswere less than 0.5. By contrast, the steep increase in ISI among Ch-T exemplars produced ISIAR scores that were greater than 2.5 andISIMS scores that were greater than 1. Out of 23 generic chopperunits, 20 produced scores that clustered near the Ch-S exemplars.The remaining units were categorized as Ch-T (n ¼ 2) or NFC(n ¼ 1).
3.6. Sustained versus slowly adapting choppers (criterion 4)
Blackburn and Sachs (Blackburn and Sachs, 1992) identifieda third chopper subtype with slowly adapting sound-driven rates(Ch-SA). Ch-SA exemplars display a linear increase in ISI (Fig. 6A)and decreased regularity toward the end of the stimulus (Fig. 6B)that differs from the rapid non-linear adaptation effects of Ch-Tunits (Fig. 5A). These slowly developing response patterns werequantified with the average slope of the ISI function (ISIAS) and thelate CV score (CV-L).
Two-dimensional plots of the ISIAS and CV-L scores of 12 Ch-Sexemplars are shown in Fig. 6C. These non-adapting unitsproduced ISIAS scores that were less than 0.04 and CV-L scores thatwere less than 0.3. Generic chopper units that did not show tran-sient adaptation patterns appear to be distributed alonga continuum without a clear categorical boundary. Therefore, thedecision criteria for Ch-SA classification was determined by themost extreme scores of the Ch-S exemplars. This approach yielded5 Ch-S, 13 Ch-SA and 2 NFC assignments.
3.7. Verification of the decision tree
The accuracy of objective classification was verified by exam-ining the PSTH shapes of categorized units. The examples in Fig. 7Aand B were assigned to the Pri and Pri-N categories by applyingcriteria 1 and 2 of the decision tree. The examples in Fig. 7C and Dwere assigned to the Ch-S and Ch-T categories by criteria 1, 3, and 4.For each case, the categorized units reproduced the major visualand objective criteria of the exemplar units in Fig. 1.
3.8. Waveform shapes and synaptic prepotentials
The action potential waveforms of domestic cats and laboratorymice are compared in Fig. 8A and B, respectively. As illustrated inthe figure, striking differences in the waveform shapes of chopperand primarylike units have been noted in cats (Young et al., 1988a).Most Pri neurons produce monophasic action potentials that arepreceded by discrete prepotentials (category PP1). Biphasic PP1responses and monophasic PP2 responses are less commonlyobserved (Bourk, 1976). Most Pri-N neurons produce monophasicPP2 responses, although larger PP1 prepotentials also are encoun-tered. Chopper units produce biphasic action potentials withoutprepotentials (category PP3).
In the case of ChS and ChT units, the action potential waveformsof laboratory mice shared the biphasic, PP3 properties that havebeen previously described in cats. Multiple examples from the twoPSTH response types are presented in the right columns of Fig. 8B.Each trace shows the averaged waveform of a different unit. Posi-tive peaks have been aligned in time to enhance the visibility ofindividual waveforms. Variations in amplitude reflect unit isola-tion, signal amplification, and electrode position at the time ofrecording.
One of the most striking physiological differences in the AVCNresponses of mice and cats was the action potential shapes of Priand Pri-N units. Examples of averaged waveforms from mice arepresented in the left columns of Fig. 8B. Units in both PSTH clas-sifications produced biphasic action potentials. PP1 prepotentialswere never observed. PP2 prepotentials were uncommon. Theinitial positive deflections that were assumed to indicate PP2responses tended to be smaller in magnitude, less discrete in time,and typically merged with the initial positive peak of the biphasicaction potential. These observations suggest that the synapticinputs of the auditory nerve to bushy cells are less secure in labo-ratory mice than in domestic cats.
3.9. Basic response properties of physiologically categorized units
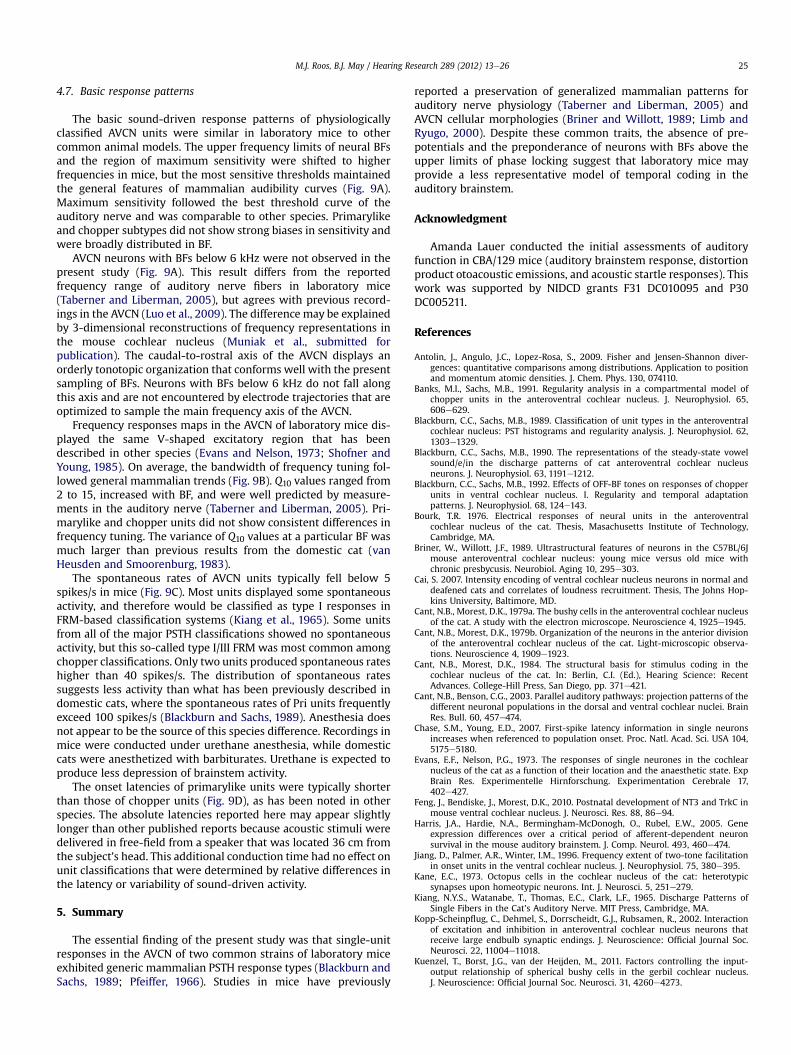
Additional tests characterized the basic response properties ofall physiologically categorized units. BF thresholds are plotted inrelation to frequency and unit type in Fig. 9A. For comparison, thebest threshold curve of auditory nerve fibers is also shown for CBA/CaJ and C57BL/6 mice (Taberner and Liberman, 2005). The bestthresholds of AVCN neurons and auditory nerve fibers matchclosely across a wide range of frequencies, with the most sensitivethresholds falling between 10 and 20 kHz. The major PSTH
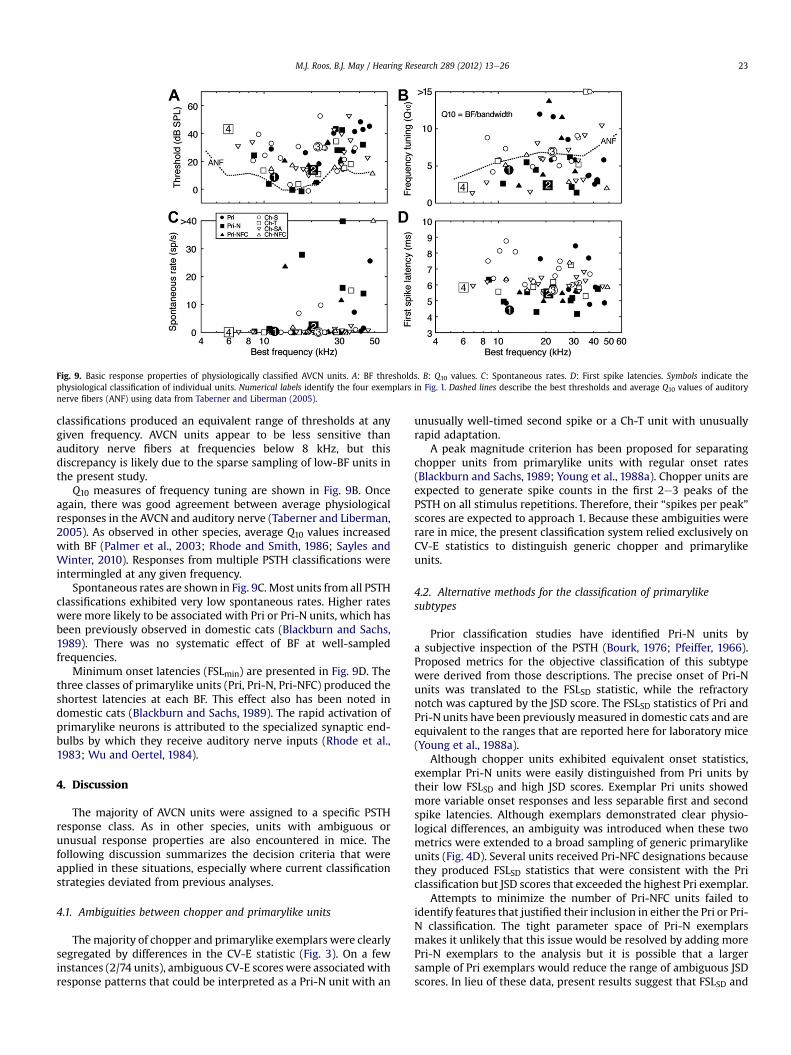
Fig. 9. Basic response properties of physiologically classified AVCN units. A: BF thresholds. B: Q10 values. C: Spontaneous rates. D: First spike latencies. Symbols indicate thephysiological classification of individual units. Numerical labels identify the four exemplars in Fig. 1. Dashed lines describe the best thresholds and average Q10 values of auditorynerve fibers (ANF) using data from Taberner and Liberman (2005).
M.J. Roos, B.J. May / Hearing Research 289 (2012) 13e26 23
classifications produced an equivalent range of thresholds at anygiven frequency. AVCN units appear to be less sensitive thanauditory nerve fibers at frequencies below 8 kHz, but thisdiscrepancy is likely due to the sparse sampling of low-BF units inthe present study.
Q10 measures of frequency tuning are shown in Fig. 9B. Onceagain, there was good agreement between average physiologicalresponses in the AVCN and auditory nerve (Taberner and Liberman,2005). As observed in other species, average Q10 values increasedwith BF (Palmer et al., 2003; Rhode and Smith, 1986; Sayles andWinter, 2010). Responses from multiple PSTH classifications wereintermingled at any given frequency.
Spontaneous rates are shown in Fig. 9C. Most units from all PSTHclassifications exhibited very low spontaneous rates. Higher rateswere more likely to be associated with Pri or Pri-N units, which hasbeen previously observed in domestic cats (Blackburn and Sachs,1989). There was no systematic effect of BF at well-sampledfrequencies.
Minimum onset latencies (FSLmin) are presented in Fig. 9D. Thethree classes of primarylike units (Pri, Pri-N, Pri-NFC) produced theshortest latencies at each BF. This effect also has been noted indomestic cats (Blackburn and Sachs, 1989). The rapid activation ofprimarylike neurons is attributed to the specialized synaptic end-bulbs by which they receive auditory nerve inputs (Rhode et al.,1983; Wu and Oertel, 1984).
4. Discussion
The majority of AVCN units were assigned to a specific PSTHresponse class. As in other species, units with ambiguous orunusual response properties are also encountered in mice. Thefollowing discussion summarizes the decision criteria that wereapplied in these situations, especially where current classificationstrategies deviated from previous analyses.
4.1. Ambiguities between chopper and primarylike units
Themajority of chopper and primarylike exemplars were clearlysegregated by differences in the CV-E statistic (Fig. 3). On a fewinstances (2/74 units), ambiguous CV-E scores were associated withresponse patterns that could be interpreted as a Pri-N unit with an
unusually well-timed second spike or a Ch-T unit with unusuallyrapid adaptation.
A peak magnitude criterion has been proposed for separatingchopper units from primarylike units with regular onset rates(Blackburn and Sachs, 1989; Young et al., 1988a). Chopper units areexpected to generate spike counts in the first 2e3 peaks of thePSTH on all stimulus repetitions. Therefore, their “spikes per peak”scores are expected to approach 1. Because these ambiguities wererare in mice, the present classification system relied exclusively onCV-E statistics to distinguish generic chopper and primarylikeunits.
4.2. Alternative methods for the classification of primarylikesubtypes
Prior classification studies have identified Pri-N units bya subjective inspection of the PSTH (Bourk, 1976; Pfeiffer, 1966).Proposed metrics for the objective classification of this subtypewere derived from those descriptions. The precise onset of Pri-Nunits was translated to the FSLSD statistic, while the refractorynotch was captured by the JSD score. The FSLSD statistics of Pri andPri-N units have been previouslymeasured in domestic cats and areequivalent to the ranges that are reported here for laboratory mice(Young et al., 1988a).
Although chopper units exhibited equivalent onset statistics,exemplar Pri-N units were easily distinguished from Pri units bytheir low FSLSD and high JSD scores. Exemplar Pri units showedmore variable onset responses and less separable first and secondspike latencies. Although exemplars demonstrated clear physio-logical differences, an ambiguity was introduced when these twometrics were extended to a broad sampling of generic primarylikeunits (Fig. 4D). Several units received Pri-NFC designations becausethey produced FSLSD statistics that were consistent with the Priclassification but JSD scores that exceeded the highest Pri exemplar.
Attempts to minimize the number of Pri-NFC units failed toidentify features that justified their inclusion in either the Pri or Pri-N classification. The tight parameter space of Pri-N exemplarsmakes it unlikely that this issue would be resolved by adding morePri-N exemplars to the analysis but it is possible that a largersample of Pri exemplars would reduce the range of ambiguous JSDscores. In lieu of these data, present results suggest that FSLSD and
M.J. Roos, B.J. May / Hearing Research 289 (2012) 13e2624
JSD scores are a continuous not a categorical property of single-unitresponses in the AVCN.
When recording in the AVCN, care must be taken to distinguishbetween Pri units and their auditory nerve inputs. To avoid thispotential artifact, the present recordings were made using metalelectrodes ormicropipetteswith relatively large tips (w1.5e2.0 mm)and low impedances (1 MU). Recordings from small diameterauditory nerve fibers are typically made using micropipettes withfine tips and high impedances (10e30 MU, (Kiang et al., 1965).Scatter plots of first spike latency do not indicate Pri units withshorter latencies than Pri-N units (Fig. 9D), which would suggesterroneously classified auditory nerve fibers.
4.3. Alternative methods for the classification of chopper subtypes
Blackburn and Sachs (1989, 1992) characterized the adaptationpatterns of chopper units by a decrease in regularity and increase inISI that occurred late in the stimulus presentation. The presentclassification system incorporated a similar approach. Rapidlyadapting chopper units were assigned to the Ch-T classification bytheir high ISIAR and ISIMS scores (Fig. 5C). Both metrics produceda clear separation between Ch-T units and other chopper subtypes.The adaptation patterns of laboratory mice were more categoricallydistinct than those previously described in domestic cats.
Slowlyadaptingchopperswereassigned to theCh-SAclassificationby high ISIAS and CV-L scores (Fig. 6C). Examination of the resultingdistributions, however, suggests that the categorization of linearadaptation is notwell justified by the quantitative analysis of ISIAS andCV-L scores. Instead, Ch-S and Ch-SA units fall along a continuum ofincreasing adaptation. Ch-S and Ch-SA designations have beenmaintained in the present classification system to allow directcomparisons with the descriptions of Blackburn and Sachs (1989,1992).Nevertheless, the functional importanceof rate adaptationmaybe better understood byemphasizing the shared characteristics of Ch-S and Ch-SA units, and not their enforced categorization.
4.4. Onset units
Onset units emit a precisely timed onset spike following by littleor no activity (Blackburn and Sachs, 1989; Pfeiffer, 1966). They arebroadly tuned, have a wide dynamic range, and often producea sustained response when stimulated with broadband noise(Smith and Rhode, 1989). Onset units were rarely observed in ourstudy of the AVCN. The scarcity of this response pattern is mostlikely due to sampling bias. Onset responses are more common inthe posterior VCN (Kane, 1973; Osen, 1969). The present classifi-cation system was directed to the anterior subdivision and wasdesigned for units that exhibited sustained responses to BF tones.
Classification ambiguities may arise between the rapidlyadapting responses of Ch-T units and the prolonged onsetresponses of onset chopper (onset-C) units. While these unit typesshow unique intracellular responses (Paolini and Clark, 1999),extracellular recordings display considerable overlap in physio-logical properties such as threshold and near-threshold frequencytuning (Jiang et al., 1996). The present study distinguished Ch-Tunits from onset-C units by their relatively high sustained sound-driven rates (PSTH) and restricted dynamic range (RALV).
Onset (onset-L) units sustain low levels of sound-driven activityand therefore may be confused with primarylike units (Rhode et al.,1983). Blackburn and Sachs (1989) designated ambiguous primary-like/onset units as onset responses if the PSTH displayed preciseonset spikes and sustained firing rates below 100 spikes/sec. Thiscriterionwasmet by 2 out of 11 Pri-Nunits in the present sample. Allof the units were assigned to the Pri-N classification. Additionalcriteria based on sustained firing rate, response bandwidth, or
dynamic rangemaybeused todiscriminate the twounit types,whennecessary (Palmer et al., 1996; Winter and Palmer, 1995).
4.5. Unusual units
Chopper (Ch-L) units with low onset rates have been describedin domestic cats (Bourk,1976). Because only a small number of Ch-Lunits (4/274 chopper units) were observed by Blackburn and Sachs(1989), they were regarded as “unusual units.” Units with thesecharacteristics were more common in mice (7/41 chopper units). Innearly all cases, theymet the criteria for classification as Ch-S units.
While most chopper units produce an ISI function that is flat(Ch-S) or adapting (Ch-SA, Ch-T), Blackburn and Sachs (1989)reported a few unusual chopper units with decreasing ISI func-tions (negative ISIAS). In the present analysis, negative ISIAS scoresremained near 0 (Fig. 6C). No clear dichotomy was observed amongthese units and they were all assigned the Ch-S classification.
Blackburn and Sachs (1989) identified primarylike units withunusually long first spike latencies. Three of these responses aresuggested by outliers in Fig. 9D. Given the comparatively smallnumber of primarylike units in the present sample, long latency Priunits may be more common in laboratory mice than in domesticcats. Chopper units with equivalent BFs produced similar latencies,so it is likely that these responses were driven by direct inputs fromthe auditory nerve.
4.6. Action potential waveforms
A detailed analysis of action potential waveforms is problematicfor extracellular recordings because the size, shape, and polarity ofthe electrical signal is influenced by variations in the physicalrelationship of the electrode to a propagating current source.Nevertheless, gross waveform features were remarkably consistentfor well-isolated AVCN neurons in laboratory mice (Fig. 8B).Chopper and primarylike units produced biphasic action potentials.Chopper units never displayed prepotentials. Primarylike unitsnever displayed clear PP1 responses. The rare instances of poten-tials that may represent PP2 responses showed poor temporaldefinition and close proximity to action potentials, which arecharacteristics that are more consistent with EPSPs (Kuenzel et al.,2011). These results suggest that laboratory mice and domestic catsshare similar near-field electrical properties for chopper units butexhibit notable differences in their primarylike responses.
Bourk (1976) reported prepotentials for all Pri units in cats. Themajority of units showed large PP1 responses (66%). Pri-N unitsshowed high percentages of both PP1 (34%) and PP2 responses(55%). His descriptions were replicated by Blackburn and Sachs(1989), who examined individual digitized spike waveforms forthe presence of PP1 responses (53% Pri, 58% Pri-N). Monophasicaction potentials have been linked to primarylike responses by bothBourk (1976) and Young et al. (Young et al., 1988a).
Endbulbs are present on the spherical bushy cells of laboratorymice (Limb and Ryugo, 2000), but appear to be smaller in size andmore sparsely branched than the endbulbs of cats (Ryugo andFekete, 1982). This less robust morphological expression mayexplain the missing prepotentials and less polarized action poten-tials of primarylike units in mice. Laboratory rats, a rodent specieswith more sensitive low-frequency hearing, produce primarylikeresponses with prepotentials under identical recording conditions(Roos, 2012). It is intriguing to speculate that the evolutionarypremium for secure endbulb transmission may be less importantfor prey species with a strong bias toward high-frequency hearing.In mice, the functional consequences of this biological variationmanifest as reduced temporal fidelity and poor sound localization(Lauer et al., 2011; May et al., 2011).
M.J. Roos, B.J. May / Hearing Research 289 (2012) 13e26 25
4.7. Basic response patterns
The basic sound-driven response patterns of physiologicallyclassified AVCN units were similar in laboratory mice to othercommon animal models. The upper frequency limits of neural BFsand the region of maximum sensitivity were shifted to higherfrequencies in mice, but the most sensitive thresholds maintainedthe general features of mammalian audibility curves (Fig. 9A).Maximum sensitivity followed the best threshold curve of theauditory nerve and was comparable to other species. Primarylikeand chopper subtypes did not show strong biases in sensitivity andwere broadly distributed in BF.
AVCN neurons with BFs below 6 kHz were not observed in thepresent study (Fig. 9A). This result differs from the reportedfrequency range of auditory nerve fibers in laboratory mice(Taberner and Liberman, 2005), but agrees with previous record-ings in the AVCN (Luo et al., 2009). The difference may be explainedby 3-dimensional reconstructions of frequency representations inthe mouse cochlear nucleus (Muniak et al., submitted forpublication). The caudal-to-rostral axis of the AVCN displays anorderly tonotopic organization that conforms well with the presentsampling of BFs. Neurons with BFs below 6 kHz do not fall alongthis axis and are not encountered by electrode trajectories that areoptimized to sample the main frequency axis of the AVCN.
Frequency responses maps in the AVCN of laboratory mice dis-played the same V-shaped excitatory region that has beendescribed in other species (Evans and Nelson, 1973; Shofner andYoung, 1985). On average, the bandwidth of frequency tuning fol-lowed general mammalian trends (Fig. 9B). Q10 values ranged from2 to 15, increased with BF, and were well predicted by measure-ments in the auditory nerve (Taberner and Liberman, 2005). Pri-marylike and chopper units did not show consistent differences infrequency tuning. The variance of Q10 values at a particular BF wasmuch larger than previous results from the domestic cat (vanHeusden and Smoorenburg, 1983).
The spontaneous rates of AVCN units typically fell below 5spikes/s in mice (Fig. 9C). Most units displayed some spontaneousactivity, and therefore would be classified as type I responses inFRM-based classification systems (Kiang et al., 1965). Some unitsfrom all of the major PSTH classifications showed no spontaneousactivity, but this so-called type I/III FRM was most common amongchopper classifications. Only two units produced spontaneous rateshigher than 40 spikes/s. The distribution of spontaneous ratessuggests less activity than what has been previously described indomestic cats, where the spontaneous rates of Pri units frequentlyexceed 100 spikes/s (Blackburn and Sachs, 1989). Anesthesia doesnot appear to be the source of this species difference. Recordings inmice were conducted under urethane anesthesia, while domesticcats were anesthetized with barbiturates. Urethane is expected toproduce less depression of brainstem activity.
The onset latencies of primarylike units were typically shorterthan those of chopper units (Fig. 9D), as has been noted in otherspecies. The absolute latencies reported here may appear slightlylonger than other published reports because acoustic stimuli weredelivered in free-field from a speaker that was located 36 cm fromthe subject’s head. This additional conduction time had no effect onunit classifications that were determined by relative differences inthe latency or variability of sound-driven activity.
5. Summary
The essential finding of the present study was that single-unitresponses in the AVCN of two common strains of laboratory miceexhibited generic mammalian PSTH response types (Blackburn andSachs, 1989; Pfeiffer, 1966). Studies in mice have previously
reported a preservation of generalized mammalian patterns forauditory nerve physiology (Taberner and Liberman, 2005) andAVCN cellular morphologies (Briner and Willott, 1989; Limb andRyugo, 2000). Despite these common traits, the absence of pre-potentials and the preponderance of neurons with BFs above theupper limits of phase locking suggest that laboratory mice mayprovide a less representative model of temporal coding in theauditory brainstem.
Acknowledgment
Amanda Lauer conducted the initial assessments of auditoryfunction in CBA/129 mice (auditory brainstem response, distortionproduct otoacoustic emissions, and acoustic startle responses). Thiswork was supported by NIDCD grants F31 DC010095 and P30DC005211.
References
Antolin, J., Angulo, J.C., Lopez-Rosa, S., 2009. Fisher and Jensen-Shannon diver-gences: quantitative comparisons among distributions. Application to positionand momentum atomic densities. J. Chem. Phys. 130, 074110.
Banks, M.I., Sachs, M.B., 1991. Regularity analysis in a compartmental model ofchopper units in the anteroventral cochlear nucleus. J. Neurophysiol. 65,606e629.
Blackburn, C.C., Sachs, M.B., 1989. Classification of unit types in the anteroventralcochlear nucleus: PST histograms and regularity analysis. J. Neurophysiol. 62,1303e1329.
Blackburn, C.C., Sachs, M.B., 1990. The representations of the steady-state vowelsound/e/in the discharge patterns of cat anteroventral cochlear nucleusneurons. J. Neurophysiol. 63, 1191e1212.
Blackburn, C.C., Sachs, M.B., 1992. Effects of OFF-BF tones on responses of chopperunits in ventral cochlear nucleus. I. Regularity and temporal adaptationpatterns. J. Neurophysiol. 68, 124e143.
Bourk, T.R. 1976. Electrical responses of neural units in the anteroventralcochlear nucleus of the cat. Thesis, Masachusetts Institute of Technology,Cambridge, MA.
Briner, W., Willott, J.F., 1989. Ultrastructural features of neurons in the C57BL/6Jmouse anteroventral cochlear nucleus: young mice versus old mice withchronic presbycusis. Neurobiol. Aging 10, 295e303.
Cai, S. 2007. Intensity encoding of ventral cochlear nucleus neurons in normal anddeafened cats and correlates of loudness recruitment. Thesis, The Johns Hop-kins University, Baltimore, MD.
Cant, N.B., Morest, D.K., 1979a. The bushy cells in the anteroventral cochlear nucleusof the cat. A study with the electron microscope. Neuroscience 4, 1925e1945.
Cant, N.B., Morest, D.K., 1979b. Organization of the neurons in the anterior divisionof the anteroventral cochlear nucleus of the cat. Light-microscopic observa-tions. Neuroscience 4, 1909e1923.
Cant, N.B., Morest, D.K., 1984. The structural basis for stimulus coding in thecochlear nucleus of the cat. In: Berlin, C.I. (Ed.), Hearing Science: RecentAdvances. College-Hill Press, San Diego, pp. 371e421.
Cant, N.B., Benson, C.G., 2003. Parallel auditory pathways: projection patterns of thedifferent neuronal populations in the dorsal and ventral cochlear nuclei. BrainRes. Bull. 60, 457e474.
Chase, S.M., Young, E.D., 2007. First-spike latency information in single neuronsincreases when referenced to population onset. Proc. Natl. Acad. Sci. USA 104,5175e5180.
Evans, E.F., Nelson, P.G., 1973. The responses of single neurones in the cochlearnucleus of the cat as a function of their location and the anaesthetic state. ExpBrain Res. Experimentelle Hirnforschung. Experimentation Cerebrale 17,402e427.
Feng, J., Bendiske, J., Morest, D.K., 2010. Postnatal development of NT3 and TrkC inmouse ventral cochlear nucleus. J. Neurosci. Res. 88, 86e94.
Harris, J.A., Hardie, N.A., Bermingham-McDonogh, O., Rubel, E.W., 2005. Geneexpression differences over a critical period of afferent-dependent neuronsurvival in the mouse auditory brainstem. J. Comp. Neurol. 493, 460e474.
Jiang, D., Palmer, A.R., Winter, I.M., 1996. Frequency extent of two-tone facilitationin onset units in the ventral cochlear nucleus. J. Neurophysiol. 75, 380e395.
Kane, E.C., 1973. Octopus cells in the cochlear nucleus of the cat: heterotypicsynapses upon homeotypic neurons. Int. J. Neurosci. 5, 251e279.
Kiang, N.Y.S., Watanabe, T., Thomas, E.C., Clark, L.F., 1965. Discharge Patterns ofSingle Fibers in the Cat’s Auditory Nerve. MIT Press, Cambridge, MA.
Kopp-Scheinpflug, C., Dehmel, S., Dorrscheidt, G.J., Rubsamen, R., 2002. Interactionof excitation and inhibition in anteroventral cochlear nucleus neurons thatreceive large endbulb synaptic endings. J. Neuroscience: Official Journal Soc.Neurosci. 22, 11004e11018.
Kuenzel, T., Borst, J.G., van der Heijden, M., 2011. Factors controlling the input-output relationship of spherical bushy cells in the gerbil cochlear nucleus.J. Neuroscience: Official Journal Soc. Neurosci. 31, 4260e4273.
M.J. Roos, B.J. May / Hearing Research 289 (2012) 13e2626
Lai, Y.C., Winslow, R.L., Sachs, M.B., 1994. A model of selective processing ofauditory-nerve inputs by stellate cells of the antero-ventral cochlear nucleus.J. Comput. Neurosci. 1, 167e194.
Lauer, A.M., Slee, S.J., May, B.J., 2011. Acoustic basis of directional acuity in labora-tory mice. J. Assoc. Res. Otolaryngol. JARO 12, 633e645.
Lauer, A.M., May, B.J., Hao, Z.J., Watson, J., 2009. Analysis of environmental soundlevels in modern rodent housing rooms. Lab. Anim. (NY) 38, 154e160.
Lee, D.J., Cahill, H.B., Ryugo, D.K., 2003. Effects of congenital deafness in the cochlearnuclei of Shaker-2 mice: an ultrastructural analysis of synapse morphology inthe endbulbs of Held. J. Neurocytol 32, 229e243.
Liberman, M.C., 1993. Central projections of auditory nerve fibers of differingspontaneous rate, II: Posteroventral and dorsal cochlear nuclei. J. ComparativeNeurology 327, 17e36.
Limb, C.J., Ryugo, D.K., 2000. Development of primary axosomatic endings in theanteroventral cochlear nucleus of mice. J. Assoc. Res. Otolaryngol. 1, 103e119.
Luo, F., Wang, Q., Farid, N., Liu, X., Yan, J., 2009. Three-dimensionaltonotopic organization of the C57 mouse cochlear nucleus. Hear Res. 257,75e82.
Malmierca, M.S., Hackett, T.A., 2010. Structural organization of the ascendingauditory pathway. In: Rees, A., Palmer, A.R. (Eds.), The Oxford Handbook ofAuditory Science: The Auditory Brain. Oxford University Press, Oxford, pp. 9e41.
Manis, P.B., Marx, S.O., 1991. Outward currents in isolated ventral cochlear nucleusneurons. J. Neurosci. 11, 2865e2880.
May, B.J., Prell, G.S., Sachs, M.B., 1998. Vowel representations in the ventral cochlearnucleus of the cat: effects of level, background noise, and behavioral state.J. Neurophysiol. 79, 1755e1767.
May, B.J., Lauer, A.M., Roos, M.J., 2011. Impairments of the medial olivocochlearsystem increase the risk of noise-induced auditory neuropathy in laboratorymice. Otol Neurotol. 32, 1568e1578.
Muniak, M.A., Rivas, A., Montey, K.L., May, B.J., Francis, H.W., Ryugo, D.K. A 3-dimensional model of frequency representation in the cochlear nucleus of theCBA/J mouse. J Comp Neurol submitted for publication.
Oertel, D., Shatadal, S., Cao, X.J., 2008. In the ventral cochlear nucleus Kv1.1 andsubunits of HCN1 are colocalized at surfaces of neurons that have low-voltage-activated and hyperpolarization-activated conductances. Neuroscience 154,77e86.
Osen, K.K., 1969. Cytoarchitecture of the cochlear nuclei in the cat. J. Comp. Neurol.136, 453e484.
Palmer, A.R., Jiang, D., Marshall, D.H., 1996. Responses of ventral cochlear nucleusonset and chopper units as a function of signal bandwidth. J. Neurophysiol. 75,780e794.
Palmer, A.R., Wallace, M.N., Arnott, R.H., Shackleton, T.M., 2003. Morphology ofphysiologically characterised ventral cochlear nucleus stellate cells. Exp. BrainRes. 153, 418e426.
Paolini, A.G., Clark, G.M., 1999. Intracellular responses of onset chopper neurons inthe ventral cochlear nucleus to tones: evidence for dual-component processing.J. Neurophysiol. 81, 2347e2359.
Pearce, M., Richter, C.P., Cheatham, M.A., 2001. A reconsideration of sound cali-bration in the mouse. J. Neurosci. Methods 106, 57e67.
Pfeiffer, R.R., 1966. Classification of response patterns of spike discharges for units inthe cochlear nucleus: tone-burst stimulation. Exp. Brain Res. 1, 220e235.
Rhode, W.S., 2008. Response patterns to sound associated with labeled globular/bushy cells in cat. Neuroscience 154, 87e98.
Rhode, W.S., Smith, P.H., 1986. Encoding timing and intensity in the ventral cochlearnucleus of the cat. J. Neurophysiol. 56, 261e286.
Rhode, W.S., Oertel, D., Smith, P.H., 1983. Physiological response properties of cellslabeled intracellularly with horseradish peroxidase in cat ventral cochlearnucleus. J. Comp. Neurol. 213, 448e463.
Roos, M.J. 2012. The Role of Inhibition in Spectral and Temporal Coding in theVentral Cochlear Nucleus. Thesis, Johns Hopkins University, Baltimore, MD.
Rothman, J.S., Young, E.D., Manis, P.B., 1993. Convergence of auditory nerve fibersonto bushy cells in the ventral cochlear nucleus: implications of a computa-tional model. J. Neurophysiol. 70, 2562e2583.
Ryugo, D.K., Fekete, D.M., 1982. Morphology of primary axosomatic endings in theanteroventral cochlear nucleus of the cat: a study of the endbulbs of Held.J. Comp. Neurol. 210, 239e257.
Ryugo, D.K., Sento, S., 1991. Synaptic connections of the auditory nerve in cats:relationship between endbulbs of held and spherical bushy cells. J. Comp.Neurol. 305, 35e48.
Sayles, M., Winter, I.M., 2010. Equivalent-rectangular bandwidth of single units inthe anaesthetized guinea-pig ventral cochlear nucleus. Hear Res. 262, 26e33.
Shofner, W.P., Young, E.D., 1985. Excitatory/inhibitory response types in the cochlearnucleus: relationships to discharge patterns and responses to electrical stim-ulation of the auditory nerve. J. Neurophysiology 54, 917e939.
Smith, P.H., Rhode, W.S., 1989. Structural and functional properties distinguish twotypes of multipolar cells in the ventral cochlear nucleus. J. Comp. Neurol. 282,595e616.
Spirou, G.A., Rager, J., Manis, P.B., 2005. Convergence of auditory-nerve fiberprojections onto globular bushy cells. Neuroscience 136, 843e863.
Taberner, A.M., Liberman, M.C., 2005. Response properties of single auditory nervefibers in the mouse. J. Neurophysiol. 93, 557e569.
Trussel, L.O., 2002. Cellular mechanisms for information coding in auditory brain-stem nuclei. In: Oertel, D., Fay, R.R., Popper, A.N. (Eds.), Integrative Functions inthe Mammalian Auditory Pathway. Springer, New York, pp. 72e98.
van Heusden, E., Smoorenburg, G.F., 1983. Responses from AVCN units in the catbefore and after inducement of an acute noise trauma. Hear Res. 11, 295e326.
Webster, D.B., Trune, D.R., 1982. Cochlear nuclear complex of mice. Am. J. Anat. 163,103e130.
Winter, I.M., Palmer, A.R., 1995. Level dependence of cochlear nucleus onset unitresponses and facilitation by second tones or broadband noise. J. Neurophysiol.73, 141e159.
Woolf, N.K., Ryan, A.F., 1985. Ontogeny of neural discharge patterns in the ventralcochlear nucleus of the mongolian gerbil. Brain Res. 349, 131e147.
Wu, S.H., Oertel, D., 1984. Intracellular injection with horseradish peroxidase ofphysiologically characterized stellate and bushy cells in slices of mouse ante-roventral cochlear nucleus. J. Neurosci. 4, 1577e1588.
Young, E.D., Robert, J.M., Shofner, W.P., 1988a. Regularity and latency of units inventral cochlear nucleus: implications for unit classification and generation ofresponse properties. J. Neurophysiol. 60, 1e29.
Young, E.D., Shofner, W.P., White, J.A., Robert, J.-M., Voight, H.F., 1988b. Responseproperties of cochlear nucleus neurons in relationship to physiological mech-anisms. In: Edelman, G.M., Gall, W.E., Cowen, W.M. (Eds.), Auditory Function:Neurobiological Bases of Hearing. Wiley, New York, pp. 277e312.
Youssoufian, M., Couchman, K., Shivdasani, M.N., Paolini, A.G., Walmsley, B., 2008.Maturation of auditory brainstem projections and calyces in the congenitallydeaf (dn/dn) mouse. J. Comp. Neurol. 506, 442e451.