Embed Size (px)
Citation preview

Clicking on Heaven’s Door: The Effect of
Immigrant Legalization on Crime∗
Paolo Pinotti
Bocconi University
October 2014
Abstract
We estimate the effect of legalization on the crime rate of immigrants by exploiting the
Italian policy framework as an ideal regression discontinuity design: fixed quotas of res-
idence permits are available each year, applications must be submitted electronically on
specific “Click Days”, and they are processed on a first-come, first-served basis until the
available quotas are exhausted. By matching data on applicants – including the timing
of applications in milliseconds – with restricted-use criminal records for the year before
and after Click Days, we show that obtaining legal status reduces the probability of being
reported for having committed a serious crime by 0.6 percentage points on average, on
a baseline crime rate of 1 percent. This effect is driven by applicants that are allegedly
employed by other immigrants as domestic workers (but are most likely unemployed) who
exhibit the highest crime rate in the year before Click Days as well as the greatest re-
duction in crime after obtaining legal status. By contrast, applicants sponsored by firms
exhibit a very low crime rate both before and after Click Days. We conclude that undoc-
umented immigrants confronting worse labor market opportunities are at a higher risk of
committing crimes, while they are also more responsive to legalization.
keywords: legal status, crime, regression discontinuity design
JEL codes: J61, K37, K42
∗Contacts: Paolo Pinotti, Bocconi University and BAFFI Centre, Via Roentgen 1, 20136 Milan, Italy. E-mail: [email protected]. I would like to thank Alberto Abadie, Jerome Adda, Josh Angrist, TitoBoeri, Christian Dustmann, Ray Fisman, Andrea Ichino, Eliana La Ferrara, Steve Machin, Magne Mogstad,Nicola Pavoni, Nicola Persico, Luigi Pistaferri, Imran Rasul, and the seminar participants at the NBER Sum-mer Institute 2014 (joint Labor Studies and Crime session), UCLA, University of Stockholm, GothenburgUniversity, America Latina Crime and Policy Network (AL CAPONE) in Sao Paulo, HEC Lausanne, Euro-pean University Institute, UCL-NHH Crime Conference, IFS Workshop on Advances in Policy Evaluation fortheir useful comments. The “Dipartimento Liberta civili e Immigrazione” (Immigration Department) and the“Direzione Centrale della Polizia Criminale” (Criminal Police Department) of the Italian Ministry of Interiorkindly provided the data on residence permits and crime. The financial assistance from the Fondazione RodolfoDebenedetti is gratefully acknowledged.
1
1 Introduction
Recent estimates place the number of undocumented immigrants in the United States at 11.5
million, up from 8.5 million in 2000 and close to exceeding the number of legal permanent
residents (Hoefer et al., 2012a, Hoefer et al., 2012b). The share of illegals is also high in several
European countries, such as Italy, Greece, Portugal, and Spain.1
Both in the US and in Europe, illegal immigrants cannot officially be employed or start a new
economic activity. Such immigrants can work only in the informal economy and thus receive
considerably lower earnings than legal immigrants (Kossoudji and Cobb-Clark, 2002, Kaushal,
2006, Amuedo-Dorantes et al., 2007, Accetturo and Infante, 2010, and Lozano and Sorensen,
2011). According to the Becker-Ehrlich model of crime, a lower income from legitimate activities
means a lower opportunity cost of – and thus a higher propensity to participate in – illicit
activities.
As a matter of fact, the presence of large illegal populations raises crime concerns in desti-
nation countries. According to an annual survey conducted in North American and European
countries, approximately two-thirds of the people interviewed were concerned that illegal im-
migrants increase crime, whereas only one-third holds similar concerns about legal immigrants
(Transatlantic Trends, 2009). Moving from perceptions to criminal statistics, illegals constitute
between 20% and 30% of all immigrants in Italy, but they represent 80% of those arrested for
serious crimes (Italian Ministry of Interior, 2007).
However, these figures may reflect the different composition of the two groups, as opposed to
the (causal) effect of legal status. In particular, illegal immigrants in all countries are typically
young, single males and are less educated than legal immigrants (Cohn and Passel, 2009, Caponi
and Plesca, 2013, and Mastrobuoni and Pinotti, 2014). More generally, the two groups could
differ along other (possibly unobserved) dimensions that are relevant to criminal behavior. For
instance, individuals who are less risk-averse or those who have a higher propensity to violate
laws would be more likely to reside illegally in the country and to commit crimes. It is thus
difficult to identify the causal effect of legal status on the number of crimes committed by
immigrants in the destination country.
The institutional framework in Italy provides an ideal Regression Discontinuity (RD) design
1The Italian case is discussed in detail in the rest of the paper, and estimates for the other European countriesare provided by the EU-funded project “Clandestino” (www.irregular-migration.net).
2
that allows this effect to be estimated separately from the selection into legal status. The
primary method of acquiring legal status in Italy is through work-related residence permits
sponsored by the immigrant’s (prospective) employer. Fixed quotas of permits are available
each year for different groups of applicants defined by the type of employer and occupation,
nationality, and Italian province, for a total of 1751 (potential) groups. Applications must
be submitted online by employers starting on a few “Click Days” of the year, which vary by
category of applicant, and they are processed on a first-come, first-served basis within each
group until the exhaustion of the available quota of permits. The rationing of quotas and the
frequency of applications during the first hours of Click Days are such that several thousand
applicants are denied legal status every year simply because their employers applied a few
minutes (or seconds) after the cutoff time.2
In this paper, we match all male immigrants sponsored on Click Days 2007 – including
the timing of the application in milliseconds – with restricted-use data on all male foreigners
reported by the police for having committed a serious crime in Italy and compare the crime
rates in the year before and the year after Click Days between those who applied shortly before
and shortly after the cutoff. For most groups of applicants, this cutoff occurred fewer than
30 minutes after the start of the Click Day. Most importantly, the exact timing of the cutoff
for each group was unknown ex-ante, as it depended on the timing of all applications as well
as on how many applications were rejected for being inaccurate, false, or incomplete. These
complexities provide a compelling argument for the fundamental identification assumption that
immigrants applying within a narrow bandwidth of the cutoff were unable to precisely determine
the assignment to either side of it. Indeed, density and balance tests cannot reject the hypothesis
that residence permits are as good as randomly assigned across immigrants who applied shortly
before or shortly after the cutoff. In particular, the crime rate in the year before Click Days is
equal to 1 percent in both groups (i.e., 1 in 100 individuals reported for serious crimes).
Turning to the year after Click Days, controlling parametrically for a smooth polynomial
in the timing of application the crime rate declined by 0.3 percentage points for immigrants
who applied before the cutoff whereas no significant change was observed for other applicants.
Since the difference in the probability of obtaining legal status between these two groups is
2Although applications are materially sent by employers, in what follows we use for convenience the term“applicant” to denote the immigrant sponsored in the application and the term “sponsor” to denote the em-ployer.
3
about 50 percentage points, the two-stage-least-squares (2SLS) estimated effect of legal status
is a 0.6 percentage-point decrease in the crime rate of legalized applicants (the magnitude is
larger when restricting non-parametrically to a narrow bandwidth of the cutoff time).
To gain some insights into the mechanisms behind the relationship between legal status and
crime, we parse the data by the type of applicant, offense, and sponsor. The average effect
across all applicants is driven by a reduction in the number of economically-motivated crimes
committed by applicants sponsored by other immigrants as domestic workers (e.g., housekeep-
ers, elder care givers, and so on), whereas the effect is zero for firm-sponsored employees. In
the next section, we preliminarily show that the former category of applicants likely includes
a significant number of individuals that would not qualify for a residence permit – male im-
migrants are typically not employed as domestic workers – but are nevertheless sponsored
through fictitious job offers. Such individuals exhibit a higher crime rate before the Click Days
(almost 2 percent, twice the average across all applicants), which however declines significantly
in the event of obtaining legal status (-1.3 percentage points). Instead, the crime rate for
firm-sponsored employees, whose applications are generally backed by real job offers, is very
low both before and after Click Days (0.6 percent). Based on these findings, we conclude that
immigrants in the latter group experience a higher opportunity cost of crime due to the fact
they are already (unofficially) employed in the sponsor firm before Click Days. At the opposite,
male immigrants sponsored by other immigrants as domestic workers in most cases have neither
a job nor a real job offer, so their opportunity cost of committing a crime is very low before
the Click Days. At the same time, they seem more responsive to legalization, possibly because
legal status partly addresses detachment from the labor market. In particular, obtaining legal
status opens up the possibility of searching for a job in the official sector. This can be partic-
ularly important for individuals at the margin between pursuing licit or illicit activities, who
are probably over-represented among applicants with worse labor market opportunities.
The empirical results are extremely stable under a variety of specifications of both paramet-
ric and non-parametric regressions. In particular, the coefficient of interest is largely unaffected
when varying the degree of the polynomial in the running variable (i.e., the timing of appli-
cation) between 0 and 6, when varying the bandwidth around the cutoff time between 1 and
30 minutes, and when including a full set of fixed effects for groups of applicants competing
4
for different quotas of permits. This last result suggests that the estimated coefficient of legal
status is not biased by heterogeneity in the baseline crime rate between groups; based on a
placebo exercise in which we permute the cutoff times across groups, we can also exclude that
such an estimate is driven to a significant extent by small sample bias within groups. Finally,
additional evidence allows us to exclude that the negative coefficient of legal status is explained
by differences in the under-reporting of crimes committed by legal and illegal immigrants. If
anything, the strategic misreporting of identity, which should be easier for illegal immigrants
that do not hold official documents, should entail an opposite bias.
This paper contributes to the growing body of evidence regarding the effect of immigration
on crime.3 Earlier work by Butcher and Piehl (1998) shows no evidence that immigration
affected crime across US counties during the 1980s, whereas Spenkuch (2014) reaches a different
conclusion for subsequent periods. Borjas et al. (2010) also find that immigration increases
crime, although only indirectly (by raising the crime rate of native black males).
As for other countries, Bianchi et al. (2012) show that the causal effect across Italian
provinces is not significantly different from zero, while Alonso-Borrego et al. (2012) obtain
an opposite result across Spanish provinces. Finally, Bell et al. (2013) distinguish between the
effect of two large immigrant waves in the UK, namely, asylum seekers and the post-2004 inflow
from EU accession countries. Interestingly, only the former group, which was characterized by
limited economic opportunities in the official labor markets, caused a significant increase in
(property) crime. This last result suggests that average estimates across geographical areas
may mask a significant degree of heterogeneity in the effect of different groups of immigrants.
Indeed, the propensity to commit crimes should differ across immigrants depending on indi-
vidual characteristics, such as age, gender, and education, in the same manner as for natives.
However, immigrants differ with respect to another important factor: legal status.
Previous evidence on the effects of legal status is primarily based on the 1986 Immigration
Reform and Control Act (IRCA), which granted legal resident status to long-time illegal immi-
grants in the US. Using the distance from the ports of entry and 1960 immigrants’ enclaves as
instruments for the presence of IRCA applicants, Baker (2013) shows that higher legalization
rates caused a reduction in crime across US counties. At the same time, the IRCA enforced
stronger control over the hiring of illegal immigrants, creating obstacles to the employment of
3Bell and Machin (2013) provide a survey of this literature.
5
those who were not legalized. Freedman et al. (2013) focus on the implications of these addi-
tional IRCA provisions and document an increase in the felony charges filed against Hispanic
residents of San Antonio, Texas, after the expiration of the amnesty deadline. With regard to
other countries, in a previous paper with Giovanni Mastrobuoni (2014), we exploit variation in
legal status across pardoned prison inmates in Italy after the EU expansion of January 2007.
We find that after the EU accession, recidivism declined markedly – from 5.8% to 2.3% over
a six-month period – among inmates from the new EU member countries, whereas no change
occurred in a control group of inmates from EU-candidate member countries.
Relative to these previous studies, the present analysis takes advantage of a clean quasi-
experimental design. Under the assumption of no manipulation of the assignment variable,
in fact, the RD approach ensures greater internal consistency than other quasi-experimental
methods, comparable (at least locally) to that of randomized controlled trials (Lee, 2008).
With regard to the external validity of our estimates, the present paper examines the effect of
changes in legal status that are routinely induced by migration policy, as opposed to exceptional
events such as one-time amnesties or the EU expansion. Indeed, the institutional framework
considered here is not specific to the Italian context, as immigration policy in many destination
countries (e.g., Austria, Canada, and Spain) is based on analogous quota systems. At the
same time, the institutional details of Italian migration policy allow us to estimate the policy
effect separately for groups of immigrants characterized by different employment opportunities.
This heterogeneity allows for a better understanding of the channels through which legal status
affects criminal behavior.
This paper is organized as follows. The next section describes Italian migration policy, the
characteristics of different groups of applicants, and the functioning of Click Days. Section 3
discusses the empirical strategy and the data. Section 4 presents the main results. Finally,
Section 5 concludes the paper with some policy implications as well as some caveats of our
analysis.
2 Institutional framework
Italian migration policy, as designed by Laws 40/1998 and 189/2002, links legal residence to
(official) employment in the country. Each year, the central government establishes the total
6
number of residence permits available during the following year through the so-called Flows
Decree (“Decreto Flussi”). Almost all permits are reserved for employees sponsored by Italian
native citizens or legal foreign residents willing to hire immigrant workers before they enter
Italy.4 Each applicant can be sponsored only by one employer and only for a specific job.
However, the matching of vacancies with foreign workers living abroad is extremely difficult
(if not impossible), so most immigrants enter Italy illegally, begin working unofficially, and wait
for their employers to sponsor them at the following Flows Decree. During this period, they are
subject to removal by immigration authorities, although such risk is relatively low. Due to the
cost of enforcing deportations, most immigrants apprehended by the police for being illegally
present in Italy receive just an injunction to leave the country.
Indeed, the rise in the number of official foreign residents in Italy over the last two decades
(from 600,000 at the beginning of the 1990s to 4.5 million in 2011) parallels that of unofficial
immigrants. Although no official estimates have been produced, the number of applications
for amnesty presented during the frequent legalization episodes provides a lower bound for
the size of the illegal immigrant population. The number of applications grew from 100,000
to 250,000 between 1986 and the 1990s, reaching a peak of 700,000 in 2002. Combining this
information with data on the number of removals actually enforced by the Italian police during
the period 2004-2007, Dustmann et al. (2010) estimate the risk of deportation (conditional on
being illegally present in Italy) to be approximately 5 percent.
In the event of obtaining a residence permit, immigrants start to work (officially) for their
sponsor employers and are allowed to reside in Italy for that purpose. They are not allowed,
on the other hand, to travel or reside in other European countries (or, for that matter, in any
other country). In this respect, immigrants acquiring legal status through a residence permit
differ from new EU-member citizens, who enjoy free mobility within the European Union (see
Mastrobuoni and Pinotti, 2014).
Importantly, successful applicants have full access to the official labor market in Italy, mean-
ing that they are not stacked with the sponsor employer: they can search for other jobs, start
a new business, and so on. If they remain unemployed, they have six months to find another
occupation, after which period they become illegal and should leave the country. Again, most
of these individuals would remain unofficially in Italy upon the expiration of the permit.
4Special permits are allowed for students as well as for the spouses and children of permit-holders.
7
As for employers, their main incentive in sponsoring applicants on Click Days is avoiding
future sanctions, although such sanctions were very mild in 2007.5 To encourage exit from
informality, Click Day applications were never used to track illegal immigrants or their sponsor
employers, despite of the fact that a number of anomalies and irregularities frequently emerge,
particularly in relation to male immigrants allegedly employed as domestic workers. Before
turning to such anomalies, we describe the quota system governing the allocation of permits
across different groups of applicants.
2.1 The quota system
Immigrants can be sponsored for two main types of permits: type-A permits for domestic
workers employed by individuals and families as housekeepers, caregivers, and babysitters,
and type-B permits, for non-domestic workers employed by firms. The latter type of permits
is further distinguished into B1 and B2 for workers employed in the construction or non-
construction sectors, respectively. Specific national quotas without distinction by type of permit
are reserved for immigrants coming from 14 “privileged” countries that subscribe to bilateral
agreements to control illegal migration.
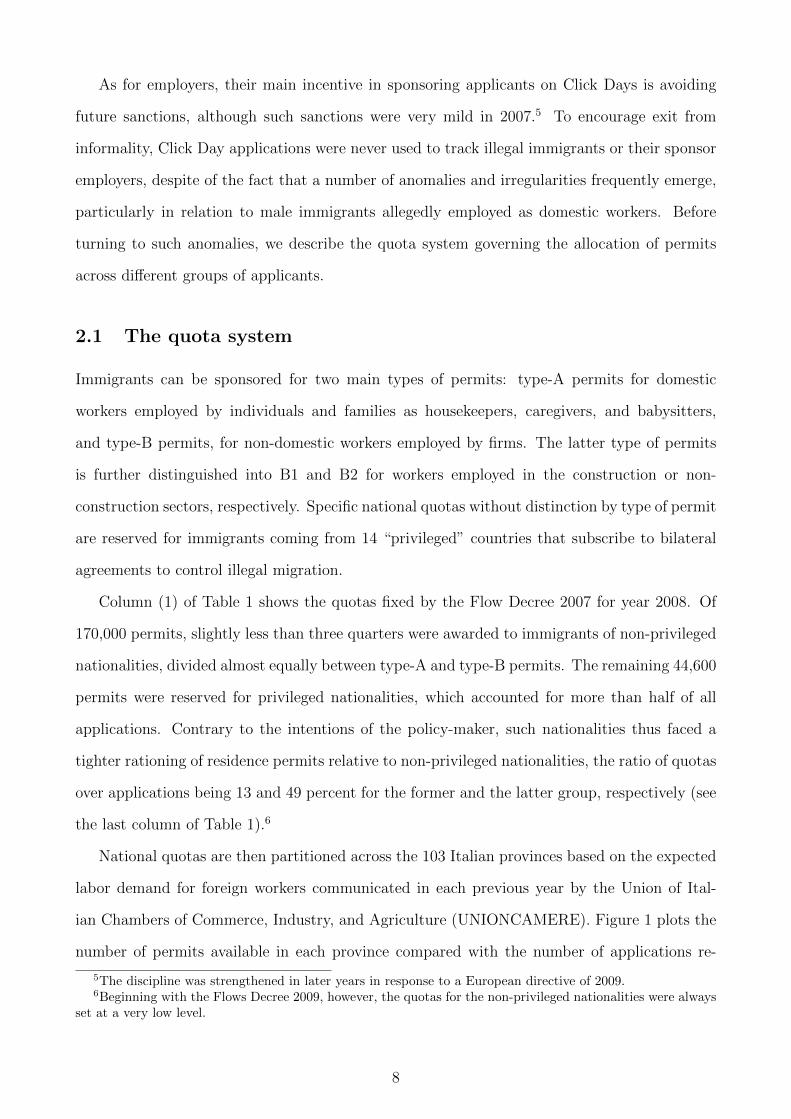
Column (1) of Table 1 shows the quotas fixed by the Flow Decree 2007 for year 2008. Of
170,000 permits, slightly less than three quarters were awarded to immigrants of non-privileged
nationalities, divided almost equally between type-A and type-B permits. The remaining 44,600
permits were reserved for privileged nationalities, which accounted for more than half of all
applications. Contrary to the intentions of the policy-maker, such nationalities thus faced a
tighter rationing of residence permits relative to non-privileged nationalities, the ratio of quotas
over applications being 13 and 49 percent for the former and the latter group, respectively (see
the last column of Table 1).6
National quotas are then partitioned across the 103 Italian provinces based on the expected
labor demand for foreign workers communicated in each previous year by the Union of Ital-
ian Chambers of Commerce, Industry, and Agriculture (UNIONCAMERE). Figure 1 plots the
number of permits available in each province compared with the number of applications re-
5The discipline was strengthened in later years in response to a European directive of 2009.6Beginning with the Flows Decree 2009, however, the quotas for the non-privileged nationalities were always
set at a very low level.
8
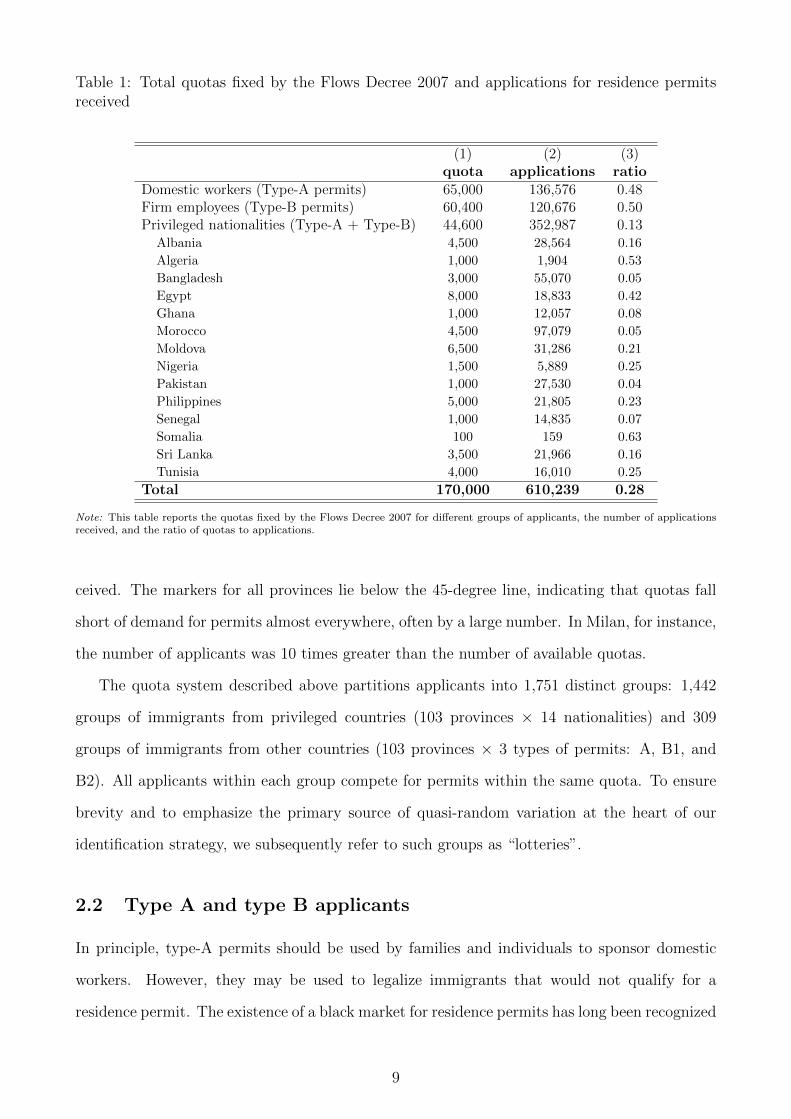
Table 1: Total quotas fixed by the Flows Decree 2007 and applications for residence permitsreceived
(1) (2) (3)quota applications ratio
Domestic workers (Type-A permits) 65,000 136,576 0.48Firm employees (Type-B permits) 60,400 120,676 0.50Privileged nationalities (Type-A + Type-B) 44,600 352,987 0.13
Albania 4,500 28,564 0.16
Algeria 1,000 1,904 0.53
Bangladesh 3,000 55,070 0.05
Egypt 8,000 18,833 0.42
Ghana 1,000 12,057 0.08
Morocco 4,500 97,079 0.05
Moldova 6,500 31,286 0.21
Nigeria 1,500 5,889 0.25
Pakistan 1,000 27,530 0.04
Philippines 5,000 21,805 0.23
Senegal 1,000 14,835 0.07
Somalia 100 159 0.63
Sri Lanka 3,500 21,966 0.16
Tunisia 4,000 16,010 0.25
Total 170,000 610,239 0.28
Note: This table reports the quotas fixed by the Flows Decree 2007 for different groups of applicants, the number of applicationsreceived, and the ratio of quotas to applications.
ceived. The markers for all provinces lie below the 45-degree line, indicating that quotas fall
short of demand for permits almost everywhere, often by a large number. In Milan, for instance,
the number of applicants was 10 times greater than the number of available quotas.
The quota system described above partitions applicants into 1,751 distinct groups: 1,442
groups of immigrants from privileged countries (103 provinces × 14 nationalities) and 309
groups of immigrants from other countries (103 provinces × 3 types of permits: A, B1, and
B2). All applicants within each group compete for permits within the same quota. To ensure
brevity and to emphasize the primary source of quasi-random variation at the heart of our
identification strategy, we subsequently refer to such groups as “lotteries”.
2.2 Type A and type B applicants
In principle, type-A permits should be used by families and individuals to sponsor domestic
workers. However, they may be used to legalize immigrants that would not qualify for a
residence permit. The existence of a black market for residence permits has long been recognized
9
Figure 1: Quotas fixed by the Flows Decree 2007 and applications for residence permits receivedacross Italian provinces
TOVC
NOCNAT
ALAOIM SV
GE
SP
VA CO
SO MIBG
BS
PVCR MNTN
VRVI
BL TVVEPDROUD GO
TS PCPR
REMO
BOFE RA
FC
PUANMC
APMSLUPT
FI
LI PI
ARSIGR PGTR
VTRI RMLTFR CEBN NAAV SA
AQTEPECHCB
FGBATABRLEPZMT CSCZ RC
TP PA MEAGCLEN CT
RG
SRSSNUCA
PN
IS
ORBI
LCLO
RN
POKRVV
VB
45°
0.0
1.0
2.0
3.0
4qu
otas
ove
r pr
ovin
ce p
opul
atio
n
0 .01 .02 .03 .04applications over province population
Note: This graph plots the quotas for residence permits allocated to each province by the Flows Decree 2007 and the number ofapplications received, both divided by province population. The size of markers is proportional to the total province population;the 45-degree line is also included in the graph.
in Italy as well as in many other countries (see Sciortino, 1991, and Wasem, 2008, for an
exhaustive account of the Italian and the US cases, respectively). Immigrants that are illegally
present in Italy but did not receive a job offer may find individuals or organizations willing to
sponsor them against the payment of a few thousand euros. In such cases, the sponsor would
pretend to hire the immigrant as a domestic worker in order to avoid a number of administrative
procedures and controls that are imposed on firm employees (e.g., labor and health inspections).
In fact, the only prerequisite for sponsoring a domestic worker is declaring a minimum of 800
euros per month – a very low threshold, indeed.
There is extensive anecdotal evidence of this type of fraud. In 2010, the Corriere della Sera
– a leading Italian newspaper – noticed “The Strange Case of Chinese Housekeepers. Where
do they work, who hired them, who ever saw them in Italy? Yet, the final data on Click Days
uncover 33,000 domestic workers from the People’s Republic (...) An anomalous figure indeed:
twice as much the number of Ukrainians, who usually work in this occupation (...) A contract
as housekeeper is the only way to enter in Italy, it is easier to obtain through family and
friends” (March 11, 2011). As for the sponsors, “One Out of Three Chinese People Wants the
Housekeeper. The Flows Decree 2010 speaks Chinese. According to the data, 1-in-3 Chinese
people – including the under-age! – applied to hire (and, thus, to legalize) a housekeeper”
10
(February 16, 2011). Similar anomalies are routinely reported by the Italian press after every
Click Day.7
To go beyond anecdotal evidence, we compare the incidence and characteristics of type-A
applicants in the Click Day files with the results of the ISMU survey of immigrants in the
Italian region of Lombardy. The ISMU survey has been conducted yearly since 2001 by the
NGO “Iniziative e Studi sulla Multietnicita” on cross-sections of about 9,000 individuals per
year, including both legal and illegal immigrants. The sampling of illegal immigrants is based
on social networks around a number of “aggregation centers,” such as train stations, shops, and
telephone centers. Sampling weights are provided in order to make the survey representative
of the whole foreign population in Lombardy (Blangiardo, 2008).8
According to ISMU, in 2007, the share of domestic workers among the employed, male
immigrants in the region of Lombardy was only 2.4 percent, increasing to 4.1 percent when
expanding this figure to include illegal immigrants; see the first two rows of Table 2. Compared
with these figures, the incidence of type-A applicants on Click Days in the same year is clearly
abnormal, amounting to 40.9 percent of all male applicants; see the second row of the table.
The difference is not explained by the fact that the ISMU survey covers just Lombardy, as it
even increases when we consider only Click Day applications from the same region (the last
row of the table).9
Figure 2 provides a more detailed comparison by nationality. For the number of type-A
applications to be consistent with the observed patterns of employment in domestic services,
the plots should be close to the 45-degree line. However, this is clearly not the case. The
anomalies in Click Day applications are particularly evident for males, whose employment in
domestic services is traditionally limited to immigrants from Philippines and Sri Lanka, whereas
males of all nationalities are sponsored as domestic workers on Click Days (see the left graph
in the figure).
Finally, male immigrants sponsored in type-A application permits are also anomalous in
7Baker (2013) discusses similar evidence for applications by agricultural workers in the United States at thetime of the IRCA.
8Lombardy is located in the northwest of Italy, and it is the largest of 20 regions in terms of both populationand GDP – approximately 16% and 21% of the total, respectively – and the second-richest one in terms of GDPper capita. The region hosts more than 1 million (legal) immigrants, or one-fourth of all immigrants present inItaly. More information on the ISMU survey is available from the website of the Foundation, www.ismu.org.
9The incidence of type-A applications among female applicants at Click Days is also abnormal; see the lastcolumn of Table 2.
11
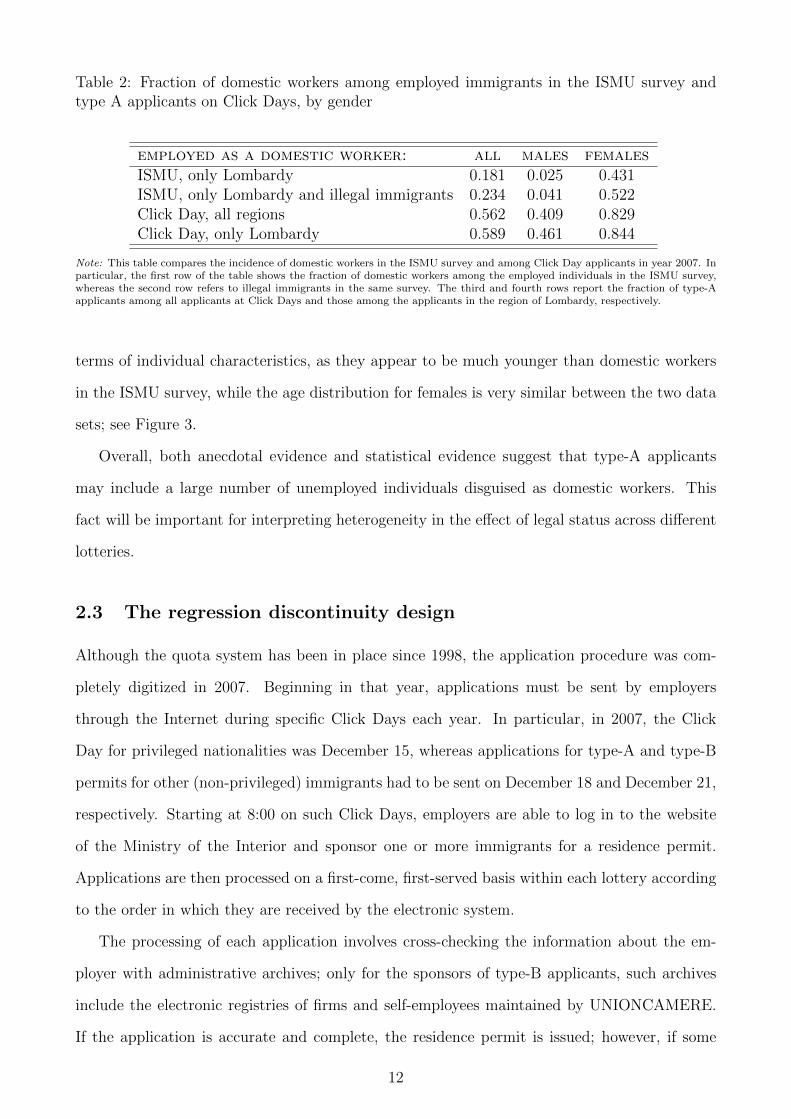
Table 2: Fraction of domestic workers among employed immigrants in the ISMU survey andtype A applicants on Click Days, by gender
employed as a domestic worker: all males femalesISMU, only Lombardy 0.181 0.025 0.431ISMU, only Lombardy and illegal immigrants 0.234 0.041 0.522Click Day, all regions 0.562 0.409 0.829Click Day, only Lombardy 0.589 0.461 0.844
Note: This table compares the incidence of domestic workers in the ISMU survey and among Click Day applicants in year 2007. Inparticular, the first row of the table shows the fraction of domestic workers among the employed individuals in the ISMU survey,whereas the second row refers to illegal immigrants in the same survey. The third and fourth rows report the fraction of type-Aapplicants among all applicants at Click Days and those among the applicants in the region of Lombardy, respectively.
terms of individual characteristics, as they appear to be much younger than domestic workers
in the ISMU survey, while the age distribution for females is very similar between the two data
sets; see Figure 3.
Overall, both anecdotal evidence and statistical evidence suggest that type-A applicants
may include a large number of unemployed individuals disguised as domestic workers. This
fact will be important for interpreting heterogeneity in the effect of legal status across different
lotteries.
2.3 The regression discontinuity design
Although the quota system has been in place since 1998, the application procedure was com-
pletely digitized in 2007. Beginning in that year, applications must be sent by employers
through the Internet during specific Click Days each year. In particular, in 2007, the Click
Day for privileged nationalities was December 15, whereas applications for type-A and type-B
permits for other (non-privileged) immigrants had to be sent on December 18 and December 21,
respectively. Starting at 8:00 on such Click Days, employers are able to log in to the website
of the Ministry of the Interior and sponsor one or more immigrants for a residence permit.
Applications are then processed on a first-come, first-served basis within each lottery according
to the order in which they are received by the electronic system.
The processing of each application involves cross-checking the information about the em-
ployer with administrative archives; only for the sponsors of type-B applicants, such archives
include the electronic registries of firms and self-employees maintained by UNIONCAMERE.
If the application is accurate and complete, the residence permit is issued; however, if some
12
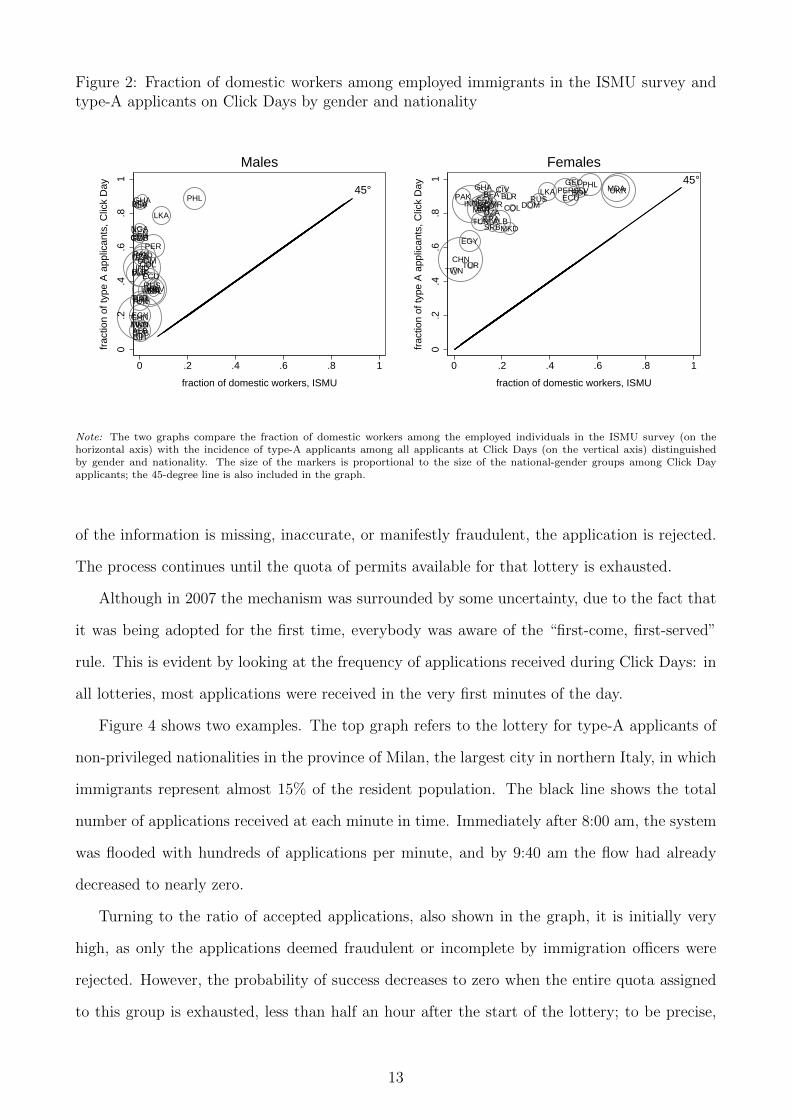
Figure 2: Fraction of domestic workers among employed immigrants in the ISMU survey andtype-A applicants on Click Days by gender and nationality
ALB
BFA
BGD
BIH
BLR
BOLBRA
CHN
CIV
CMR
COLDOMDZA
ECU
EGY
GEO
GHA
IND
LKA
MAR
MDA
MKD
NGA
PAKPER
PHL
RUS
SEN
SLV
SRB
TUNTUR
TWN
UKR
45°
0.2
.4.6
.81
frac
tion
of ty
pe A
app
lican
ts, C
lick
Day
0 .2 .4 .6 .8 1
fraction of domestic workers, ISMU
Males
ALB
BFABGDBIH
BLR BOL
BRA
CHN
CIV
CMR COLDOMDZA
ECU
EGY
GEOGHA
IND
LKA
MAR
MDA
MKD
NGAPAK
PERPHL
RUSSENSLV
SRBTUN
TURTWN
UKR45°
0.2
.4.6
.81
frac
tion
of ty
pe A
app
lican
ts, C
lick
Day
0 .2 .4 .6 .8 1
fraction of domestic workers, ISMU
Females
Note: The two graphs compare the fraction of domestic workers among the employed individuals in the ISMU survey (on thehorizontal axis) with the incidence of type-A applicants among all applicants at Click Days (on the vertical axis) distinguishedby gender and nationality. The size of the markers is proportional to the size of the national-gender groups among Click Dayapplicants; the 45-degree line is also included in the graph.
of the information is missing, inaccurate, or manifestly fraudulent, the application is rejected.
The process continues until the quota of permits available for that lottery is exhausted.
Although in 2007 the mechanism was surrounded by some uncertainty, due to the fact that
it was being adopted for the first time, everybody was aware of the “first-come, first-served”
rule. This is evident by looking at the frequency of applications received during Click Days: in
all lotteries, most applications were received in the very first minutes of the day.
Figure 4 shows two examples. The top graph refers to the lottery for type-A applicants of
non-privileged nationalities in the province of Milan, the largest city in northern Italy, in which
immigrants represent almost 15% of the resident population. The black line shows the total
number of applications received at each minute in time. Immediately after 8:00 am, the system
was flooded with hundreds of applications per minute, and by 9:40 am the flow had already
decreased to nearly zero.
Turning to the ratio of accepted applications, also shown in the graph, it is initially very
high, as only the applications deemed fraudulent or incomplete by immigration officers were
rejected. However, the probability of success decreases to zero when the entire quota assigned
to this group is exhausted, less than half an hour after the start of the lottery; to be precise,
13
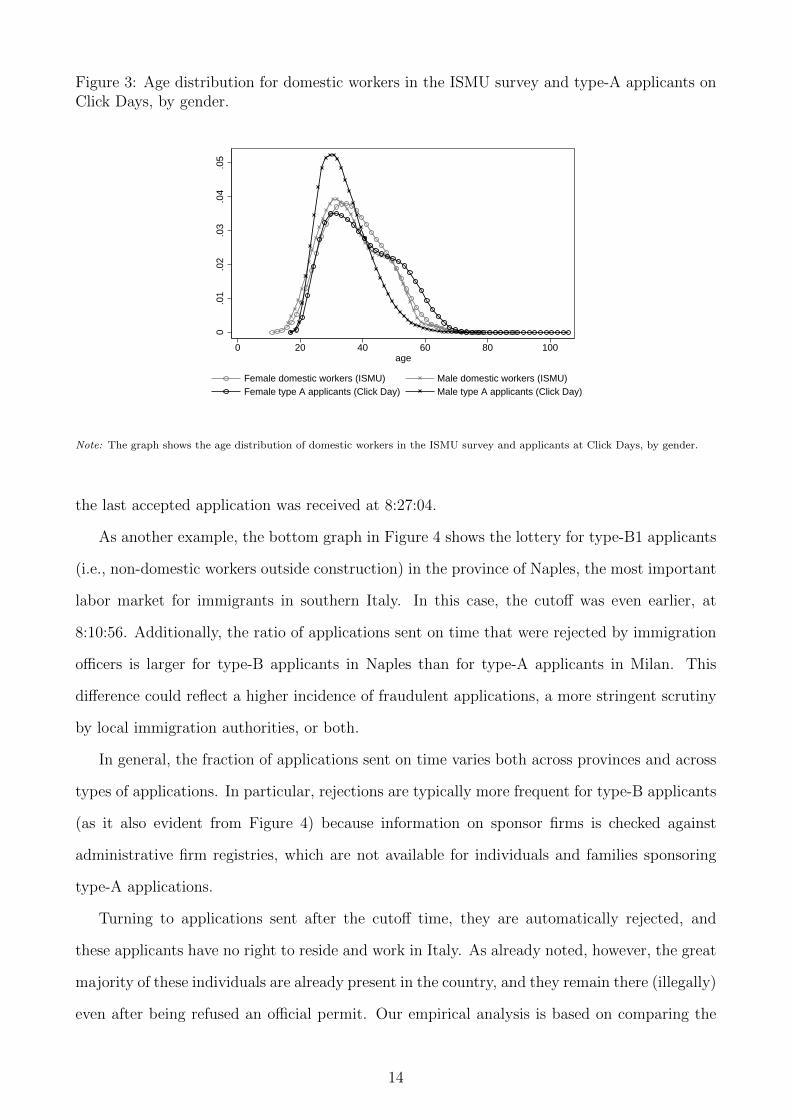
Figure 3: Age distribution for domestic workers in the ISMU survey and type-A applicants onClick Days, by gender.
0.0
1.0
2.0
3.0
4.0
5
0 20 40 60 80 100age
Female domestic workers (ISMU) Male domestic workers (ISMU)Female type A applicants (Click Day) Male type A applicants (Click Day)
Note: The graph shows the age distribution of domestic workers in the ISMU survey and applicants at Click Days, by gender.
the last accepted application was received at 8:27:04.
As another example, the bottom graph in Figure 4 shows the lottery for type-B1 applicants
(i.e., non-domestic workers outside construction) in the province of Naples, the most important
labor market for immigrants in southern Italy. In this case, the cutoff was even earlier, at
8:10:56. Additionally, the ratio of applications sent on time that were rejected by immigration
officers is larger for type-B applicants in Naples than for type-A applicants in Milan. This
difference could reflect a higher incidence of fraudulent applications, a more stringent scrutiny
by local immigration authorities, or both.
In general, the fraction of applications sent on time varies both across provinces and across
types of applications. In particular, rejections are typically more frequent for type-B applicants
(as it also evident from Figure 4) because information on sponsor firms is checked against
administrative firm registries, which are not available for individuals and families sponsoring
type-A applications.
Turning to applications sent after the cutoff time, they are automatically rejected, and
these applicants have no right to reside and work in Italy. As already noted, however, the great
majority of these individuals are already present in the country, and they remain there (illegally)
even after being refused an official permit. Our empirical analysis is based on comparing the
14
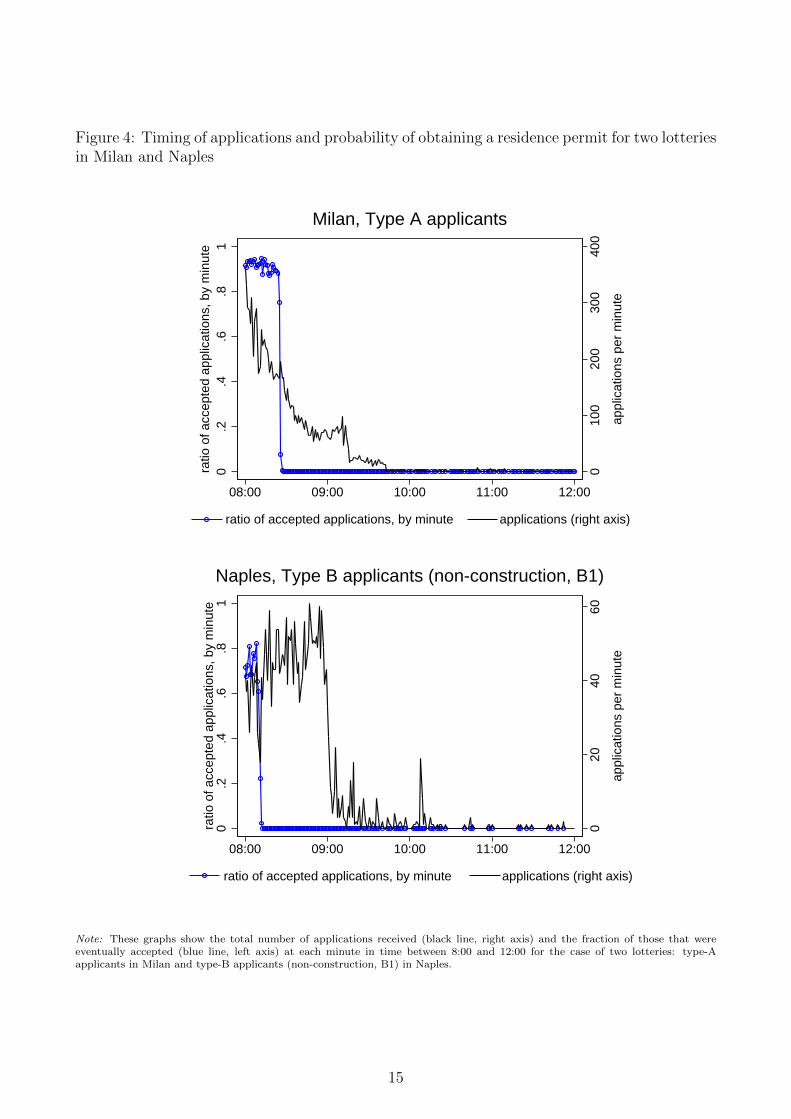
Figure 4: Timing of applications and probability of obtaining a residence permit for two lotteriesin Milan and Naples
010
020
030
040
0
appl
icat
ions
per
min
ute
0.2
.4.6
.81
ratio
of a
ccep
ted
appl
icat
ions
, by
min
ute
10:00 12:0008:00 09:00 11:00
ratio of accepted applications, by minute applications (right axis)
Milan, Type A applicants
020
4060
appl
icat
ions
per
min
ute
0.2
.4.6
.81
ratio
of a
ccep
ted
appl
icat
ions
, by
min
ute
10:00 12:0008:00 09:00 11:00
ratio of accepted applications, by minute applications (right axis)
Naples, Type B applicants (non-construction, B1)
Note: These graphs show the total number of applications received (black line, right axis) and the fraction of those that wereeventually accepted (blue line, left axis) at each minute in time between 8:00 and 12:00 for the case of two lotteries: type-Aapplicants in Milan and type-B applicants (non-construction, B1) in Naples.
15
criminal records of immigrants whose applications were received just before and just after the
cutoff. These individuals should be similar in all respects except legal status, so any difference
in criminal activity over the following period can be attributed to the causal effect legal status
(as opposed to selection bias).
3 Empirical strategy and data
This section presents the methods and data employed to estimate the regression discontinuity
design described in the previous section. It also discusses potential sources of measurement
error and their implications for estimating bias.
3.1 The policy effect
Let L be an indicator variable equal to 1 for applicants that eventually obtain legal status
(L = 0 otherwise) and C = 1 for those who subsequently commit a crime in the destination
country (C = 0 otherwise). Following Rubin (1974), the observed difference in crime rates
between applicants who obtain and do not obtain legal status can be expressed in terms of
“potential outcomes” when residing in the country legally and illegally, C1 and C0 respectively:
E(C|L = 1)− E(C|L = 0) = E(C1 − C0|L = 1)︸ ︷︷ ︸τ
+ [E(C0|L = 1)− E(C0|L = 0)]︸ ︷︷ ︸ε
. (1)
The first term on the right-hand side, τ ≡ E(C1 − C0|L = 1), is the causal effect of legal
status on the crime rate in the destination country across legalized immigrants. The parameter
τ depends both on the change in criminal behavior conditional on not being expelled and
the change in the probability of expulsion. In the absence of information on expulsions (or,
for that matter, mobility across the border), it is impossible to separately identify these two
components. However, that the overall effect τ is of primary interest from a policy perspective,
as it reveals the sign and magnitude of the effect of legalization on the number of crimes per
applicant committed in the destination country.
The main threat to empirically identifying τ is the selection bias ε ≡ [E(C0|L = 1)− E(C0|L = 0)],
which summarizes the effect of other determinants of criminal behavior that are potentially
16
correlated with legal status – for instance, labor market ability and risk aversion. However, dif-
ferences along these other dimensions should tend to zero when we restrict to applicants within
a narrow bandwidth (and, yet, on opposite sides) of the cutoff time. Following Hahn et al.
(2001), let T be the timing of applications, with T = 0 at the cutoff. Under the assumption
that both τ and ε vary continuously with T at T = 0, the average causal effect for T → 0 is
identified bylimt→0−
E(C|T = t)− limt→0+
E(C|T = t)
limt→0−
E(L|T = t)− limt→0+
E(L|T = t), (2)
i.e., the ratio between the “reduced form” effect of applying on time on the probability of
committing crimes over the “first stage” effect on the probability of obtaining legal status.
3.2 Estimation
The ratio (2) can be estimated using both parametric and non-parametric Wald-type estimators.
In the former case, one can estimate the effect of L on C by two-stage least squares (2SLS)
using Z ≡ 1 {T ≤ 0} as an instrument for L, and including on the right-hand side a J-th
order polynomial in T and its interaction with Z (Lee and Lemieux, 2010). Specifically, the
reduced-form and first-stage estimating equations are
C = θ0 + βZ +J∑j=1
θjTj +
J∑j=1
ϑjTj · Z + ε (3)
L = π0 + αZ +J∑j=1
πjTj +
J∑j=1
$jTj · Z + ν, (4)
where ε and ν are error terms summarizing the effect of other omitted factors. After controlling
for any smooth trend in T , the coefficients β and α capture the extent of any discontinuity in
C and L, respectively, at the cutoff, and their ratio provides an estimate for (2). Following
Gelman and Imbens (2014), we focus on a quadratic polynomial in T in the main specification,
although we explore the sensitivity of the results to using any polynomial degree between 0 and
6.
Alternatively, non-parametric estimators restrict the sample to applicants within an arbi-
trarily small bandwidth of the cutoff T = 0, applying kernel weights and conditioning on the
running variable to eliminate residual differences between accepted and rejected applicants.
17
Following Hahn et al. (2001), the reduced-form and first-stage local kernel regressions are
minβ,γ′
∑iK(Tih
)(Yi − βZ − γ0 − γ1Ti − γ2Ti · Zi)2 (5)
minα,δ′
∑iK(Tih
)(Li − αZ − δ0 − δ1Ti − δ2Ti · Zi)2 , (6)
where i = 1, 2, ..., N denote the individuals in the sample, and K(Tih
)is a triangular kernel
attaching positive weights only to observations within a bandwidth h around the cutoff. In this
case, the properties of the estimator depend crucially on the choice of h: larger bandwidths
increase asymptotic bias as a result of extrapolation away from the cutoff, whereas smaller
bandwidths reduce bias at the cost of greater asymptotic variance. We will explore the sensi-
tivity of the results to alternative criteria for choosing the bandwidth, namely, the theory-based
rules of Imbens and Kalyanaraman (2012) and Cattaneo et al. (2014) as well as a battery of
heuristic bandwidths.
3.3 Data and measurement issues
To implement the empirical strategy described above, we merged the applications presented on
the Click Days in 2007 with the criminal records of all offenders reported by the police in the
following year. Specifically, the Italian Ministry of Interior provided us with the administrative
records of all applications processed by immigration officers. We obtained records on 403,741
applications of a total of approximately 610,000 (because the quotas of available permits totaled
170,000, the last 200,000 applications were not even considered). To avoid extrapolation bias
in the global polynomial regressions, we restrict the sample to applications received within a
one-hour symmetric time window around the cutoff, which leaves us with a total of 186,608
observations; limiting ourselves to males, the final sample includes 110,337 applicants.10
Each record includes the country of origin and age of the applicant, the type of permit
sponsored in the application, the province in which it was presented, the timing in millisecond,
and the outcome (i.e., whether the applicant eventually obtained a residence permit). Columns
(1) to (3) of Table 3 report the average characteristics of applicants who obtained and did
not obtain the permit, respectively, as well as the difference between the two groups. Both
10As it is typically the case, the crime rate of females is very close to zero (at least as far as serious crimesare concerned).
18
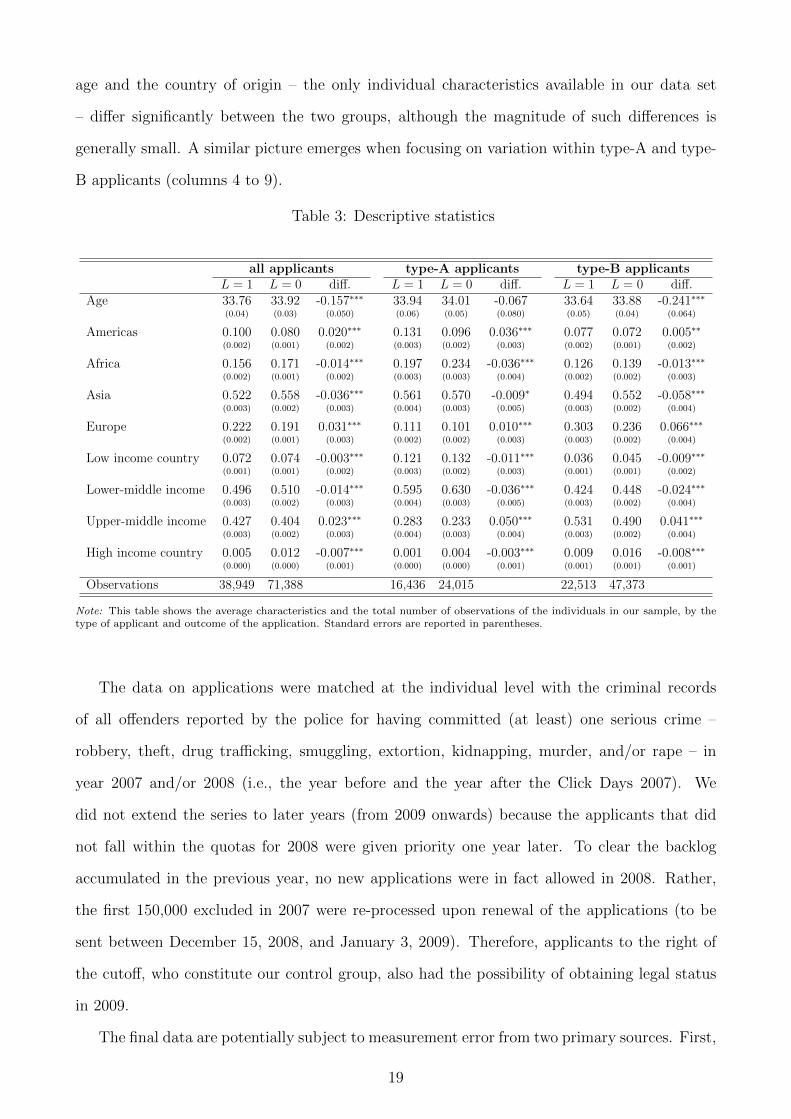
age and the country of origin – the only individual characteristics available in our data set
– differ significantly between the two groups, although the magnitude of such differences is
generally small. A similar picture emerges when focusing on variation within type-A and type-
B applicants (columns 4 to 9).
Table 3: Descriptive statistics
all applicants type-A applicants type-B applicantsL = 1 L = 0 diff. L = 1 L = 0 diff. L = 1 L = 0 diff.
Age 33.76 33.92 -0.157∗∗∗ 33.94 34.01 -0.067 33.64 33.88 -0.241∗∗∗
(0.04) (0.03) (0.050) (0.06) (0.05) (0.080) (0.05) (0.04) (0.064)
Americas 0.100 0.080 0.020∗∗∗ 0.131 0.096 0.036∗∗∗ 0.077 0.072 0.005∗∗
(0.002) (0.001) (0.002) (0.003) (0.002) (0.003) (0.002) (0.001) (0.002)
Africa 0.156 0.171 -0.014∗∗∗ 0.197 0.234 -0.036∗∗∗ 0.126 0.139 -0.013∗∗∗
(0.002) (0.001) (0.002) (0.003) (0.003) (0.004) (0.002) (0.002) (0.003)
Asia 0.522 0.558 -0.036∗∗∗ 0.561 0.570 -0.009∗ 0.494 0.552 -0.058∗∗∗
(0.003) (0.002) (0.003) (0.004) (0.003) (0.005) (0.003) (0.002) (0.004)
Europe 0.222 0.191 0.031∗∗∗ 0.111 0.101 0.010∗∗∗ 0.303 0.236 0.066∗∗∗
(0.002) (0.001) (0.003) (0.002) (0.002) (0.003) (0.003) (0.002) (0.004)
Low income country 0.072 0.074 -0.003∗∗∗ 0.121 0.132 -0.011∗∗∗ 0.036 0.045 -0.009∗∗∗
(0.001) (0.001) (0.002) (0.003) (0.002) (0.003) (0.001) (0.001) (0.002)
Lower-middle income 0.496 0.510 -0.014∗∗∗ 0.595 0.630 -0.036∗∗∗ 0.424 0.448 -0.024∗∗∗
(0.003) (0.002) (0.003) (0.004) (0.003) (0.005) (0.003) (0.002) (0.004)
Upper-middle income 0.427 0.404 0.023∗∗∗ 0.283 0.233 0.050∗∗∗ 0.531 0.490 0.041∗∗∗
(0.003) (0.002) (0.003) (0.004) (0.003) (0.004) (0.003) (0.002) (0.004)
High income country 0.005 0.012 -0.007∗∗∗ 0.001 0.004 -0.003∗∗∗ 0.009 0.016 -0.008∗∗∗
(0.000) (0.000) (0.001) (0.000) (0.000) (0.001) (0.001) (0.001) (0.001)
Observations 38,949 71,388 16,436 24,015 22,513 47,373
Note: This table shows the average characteristics and the total number of observations of the individuals in our sample, by thetype of applicant and outcome of the application. Standard errors are reported in parentheses.
The data on applications were matched at the individual level with the criminal records
of all offenders reported by the police for having committed (at least) one serious crime –
robbery, theft, drug trafficking, smuggling, extortion, kidnapping, murder, and/or rape – in
year 2007 and/or 2008 (i.e., the year before and the year after the Click Days 2007). We
did not extend the series to later years (from 2009 onwards) because the applicants that did
not fall within the quotas for 2008 were given priority one year later. To clear the backlog
accumulated in the previous year, no new applications were in fact allowed in 2008. Rather,
the first 150,000 excluded in 2007 were re-processed upon renewal of the applications (to be
sent between December 15, 2008, and January 3, 2009). Therefore, applicants to the right of
the cutoff, who constitute our control group, also had the possibility of obtaining legal status
in 2009.
The final data are potentially subject to measurement error from two primary sources. First,
19
reported crimes always underestimate the true number of committed crimes (MacDonald, 2002).
Second, errors can arise in the matching between Click Day applications and criminal records.
In particular, because the two archives were matched by name, surname, nationality, and year
of birth, any mistake in the coding of these variables in either of the two archives (or both) could
generate Type-I errors, namely, whenever an applicant has been reported for having committed
a crime but the algorithm fails to detect the match, or Type-II errors, namely, whenever an
applicant was never reported but the algorithm still finds a match.
To measure the implications of such errors for estimating bias, let C = 1 for immigrants
reported by the police (C = 0 otherwise). If the probability of being reported conditional on
having committed a crime is the same for legal and illegal immigrants, E(C|C = 1) = µ ≤ 1,
then the differences in reported crimes would have the same sign and would provide a lower
bound for the magnitude of differences in the actual crime rates between the two groups:
E(C|L = 1)− E(C|L = 0) = µ [E(C|L = 1)− E(C|L = 0)] .
This is the case when the extent of under-reporting is symmetric between legal and illegal
immigrants. The use of police charges (as opposed to incarceration rates) eliminates distortions
resulting from the differing treatment of suspected offenders by the judicial system (e.g., only
legal immigrants can ask for alternative measures to incarceration, such as home detention).
Moreover, violations of migration law do not constitute a serious crime, so differences in the
observed crime rates between legal and illegal immigrants do not depend on the fact that the
latter can be reported for being illegally present in the country.
Turning to the match between applications and criminal records, errors that occur at random
would also bias the estimated effect of legal status toward zero. However, individuals who are
arrested by the police may intentionally misreport their identity to maintain a clean criminal
record for their true identity or to avoid the application of aggravating circumstances (if they are
recidivists). Clearly, illegal immigrants have a better probability of hiding their true identities,
as they do not carry official documents. Indeed, this phenomenon is well known in Italy. For
instance, Barbagli (2008) reports the case of an illegal immigrant who was arrested in Bologna
and who subsequently confessed to have used 15 aliases in previous years (see Table A1 in the
Web Appendix).
20
For all of these reasons, the matched data set would overestimate the crime rate of legal
immigrants relative to that of illegal immigrants, E(C|C = 1, L = 1) > E(C|C = 1, L = 0),
thus biasing the estimates toward finding a positive effect of legal status on crime:
E(C|L = 1)− E(C|L = 0) = E(C|C,L = 1)E(C|L = 1)− E(C|C,L = 0)E(C|L = 0)
> E(C|L = 1)− E(C|L = 0)
In summary, we can interpret a negative estimated effect of legal status as a lower bound
(in terms of magnitude) of the true effect, whereas a positive estimate could reflect either
measurement error or a positive effect of legal status or both. Therefore, our empirical strategy
only allows us to reject the null hypothesis of no effect of legal status against the alternative of
a negative effect but not of a positive effect.
3.4 Implementation
The information reported on each application (specifically, the country of origin, the province
of destination, and the type of permit) allows us to identify the lottery in which each applicant
participated. In particular, Click Days in 2007 generated 1,580 out of 1,751 potential lotteries
(see Section 2.1) because 68 lotteries received no applications and because the 103 provincial
lotteries for Sri Lankan immigrants were corrupted by a computer bug.11
The largest lotteries were those for type-A applicants of non-privileged nationalities in
Rome and Milan, with 9,974 and 12,207 (processed) applications, respectively; meanwhile,
dozens of lotteries for privileged nationalities in smaller provinces received only one or a few
applications. The mean and median number of applications processed across all lotteries are
246 and 57, respectively, and there were 311 lotteries receiving fewer than 10 applications.
Following common practice in RD studies (see, for instance, Fredriksson et al., 2013 and Dahl
et al., 2014), we pool the observations from all lotteries and include lottery-fixed effects to
prevent heterogeneity in the baseline crime rate across lotteries (the intercept of the regression)
from biasing the estimate of the effect of legal status (the slope parameter).12 We will also
11Specifically, the system blocked most applications from Sri Lankan immigrants due to theunusual length of their names. The issue was brought up also in Sri Lankan news, seehttp://www.lankanewspapers.com/news/2007/12/22962.html. Notice that the article also makes reference tothe black market for illegal permits, discussed in Section 2.2 above.
12This particular form of omitted variable bias is sometimes called the “Yule-Simpson Paradox,” see e.g.,
21
perform a permutation exercise to exclude the possibility that our estimates average a small
sample bias across lotteries.
The running variable is the delay of each application relative to its lottery’s cutoff. In con-
trast to most RD designs in which treatment assignment depends on a predetermined threshold
rule, the cutoff in this case is unknown ex-ante, depending on the realized timing and outcome
of all applications submitted in the same lottery. On the one hand, this feature reinforces the
fundamental identifying assumption that applications are as good as randomly assigned near
the cutoff; on the other, it raises the issue of how to define this cutoff.
When the probability of obtaining a residence permit immediately drops to zero, as in Figure
4, the cutoff would coincide with the timing of the last accepted application. This situation
actually occurs for most lotteries. In a few cases, however, the acceptance rate falls to a low but
still positive level for several minutes. The lottery for B1 permits in the province of Bergamo
(a city near Milan) provides an example. The probability of acceptance declines from 70% to
5% at approximately 8:22 am, but it reaches zero only a few minutes later (see Figure 5). This
situation occurs because when an application has been rejected because of missing, inaccurate,
or false information or when the applicant did not collect the permit that had been authorized,
the ordering in which the next applicants were re-contacted sometimes subverted the initial
ordering.
As long as the subversion results from idiosyncratic implementation errors, it would not
cause any systematic bias in the comparison of immigrants obtaining or not obtaining a resi-
dence permit (in fact, it could make an even stronger case for random treatment assignment).
Moreover, even non-random subversions – for instance, because of voluntarily manipulation by
the immigration officials – can be easily accommodated in the fuzzy RD design, as the Wald-
type estimators in (3)-(4) and (5)-(6) exploit the variation in legal status that depends only
on the initial ordering of applications near the cutoff (as opposed to later subversions of such
ordering).
The only complication that arises when the discontinuity is fuzzy on both sides is that the
timing of the last accepted application may no longer be an adequate measure of the cutoff, as
the probability of obtaining legal status could have already changed several minutes earlier (as
in Figure 5). Confronted with the same problem (i.e., estimating an unknown cutoff point in
Chen et al. (2009).
22
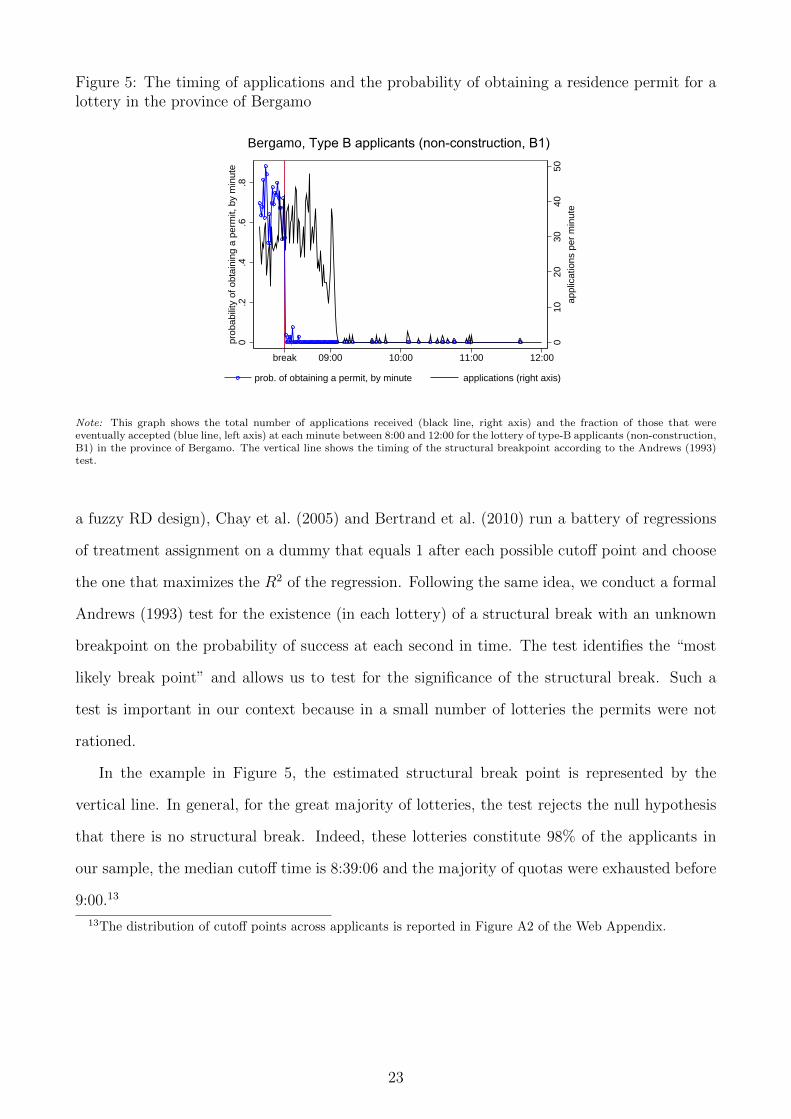
Figure 5: The timing of applications and the probability of obtaining a residence permit for alottery in the province of Bergamo
010
2030
4050
appl
icat
ions
per
min
ute
0.2
.4.6
.8pr
obab
ility
of o
btai
ning
a p
erm
it, b
y m
inut
e
10:00 12:0009:00 11:00break
prob. of obtaining a permit, by minute applications (right axis)
Bergamo, Type B applicants (non-construction, B1)
Note: This graph shows the total number of applications received (black line, right axis) and the fraction of those that wereeventually accepted (blue line, left axis) at each minute between 8:00 and 12:00 for the lottery of type-B applicants (non-construction,B1) in the province of Bergamo. The vertical line shows the timing of the structural breakpoint according to the Andrews (1993)test.
a fuzzy RD design), Chay et al. (2005) and Bertrand et al. (2010) run a battery of regressions
of treatment assignment on a dummy that equals 1 after each possible cutoff point and choose
the one that maximizes the R2 of the regression. Following the same idea, we conduct a formal
Andrews (1993) test for the existence (in each lottery) of a structural break with an unknown
breakpoint on the probability of success at each second in time. The test identifies the “most
likely break point” and allows us to test for the significance of the structural break. Such a
test is important in our context because in a small number of lotteries the permits were not
rationed.
In the example in Figure 5, the estimated structural break point is represented by the
vertical line. In general, for the great majority of lotteries, the test rejects the null hypothesis
that there is no structural break. Indeed, these lotteries constitute 98% of the applicants in
our sample, the median cutoff time is 8:39:06 and the majority of quotas were exhausted before
9:00.13
13The distribution of cutoff points across applicants is reported in Figure A2 of the Web Appendix.
23
4 Results
The RD approach allows for a graphical representation of treatment effects that is both intuitive
and transparent. We thus begin with this analysis and then move to parametric and non-
parametric regression methods.
4.1 Baseline estimates
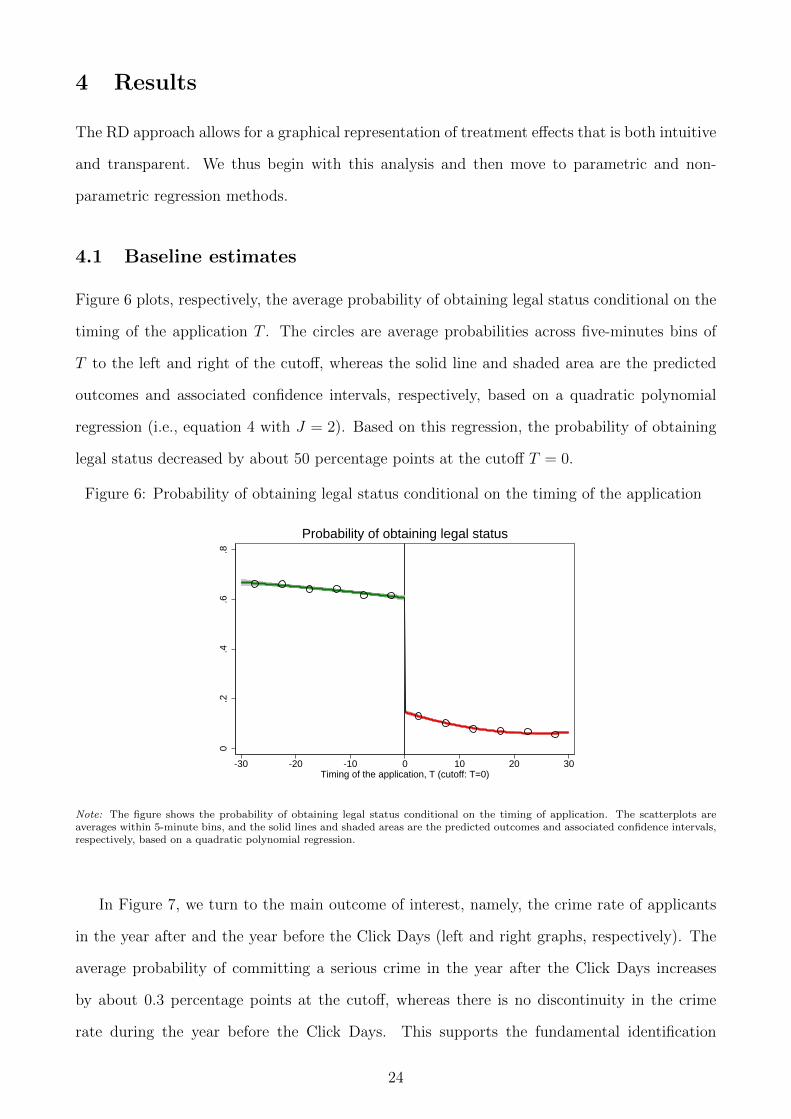
Figure 6 plots, respectively, the average probability of obtaining legal status conditional on the
timing of the application T . The circles are average probabilities across five-minutes bins of
T to the left and right of the cutoff, whereas the solid line and shaded area are the predicted
outcomes and associated confidence intervals, respectively, based on a quadratic polynomial
regression (i.e., equation 4 with J = 2). Based on this regression, the probability of obtaining
legal status decreased by about 50 percentage points at the cutoff T = 0.
Figure 6: Probability of obtaining legal status conditional on the timing of the application
0.2
.4.6
.8
-30 -20 -10 0 10 20 30Timing of the application, T (cutoff: T=0)
Probability of obtaining legal status
Note: The figure shows the probability of obtaining legal status conditional on the timing of application. The scatterplots areaverages within 5-minute bins, and the solid lines and shaded areas are the predicted outcomes and associated confidence intervals,respectively, based on a quadratic polynomial regression.
In Figure 7, we turn to the main outcome of interest, namely, the crime rate of applicants
in the year after and the year before the Click Days (left and right graphs, respectively). The
average probability of committing a serious crime in the year after the Click Days increases
by about 0.3 percentage points at the cutoff, whereas there is no discontinuity in the crime
rate during the year before the Click Days. This supports the fundamental identification
24
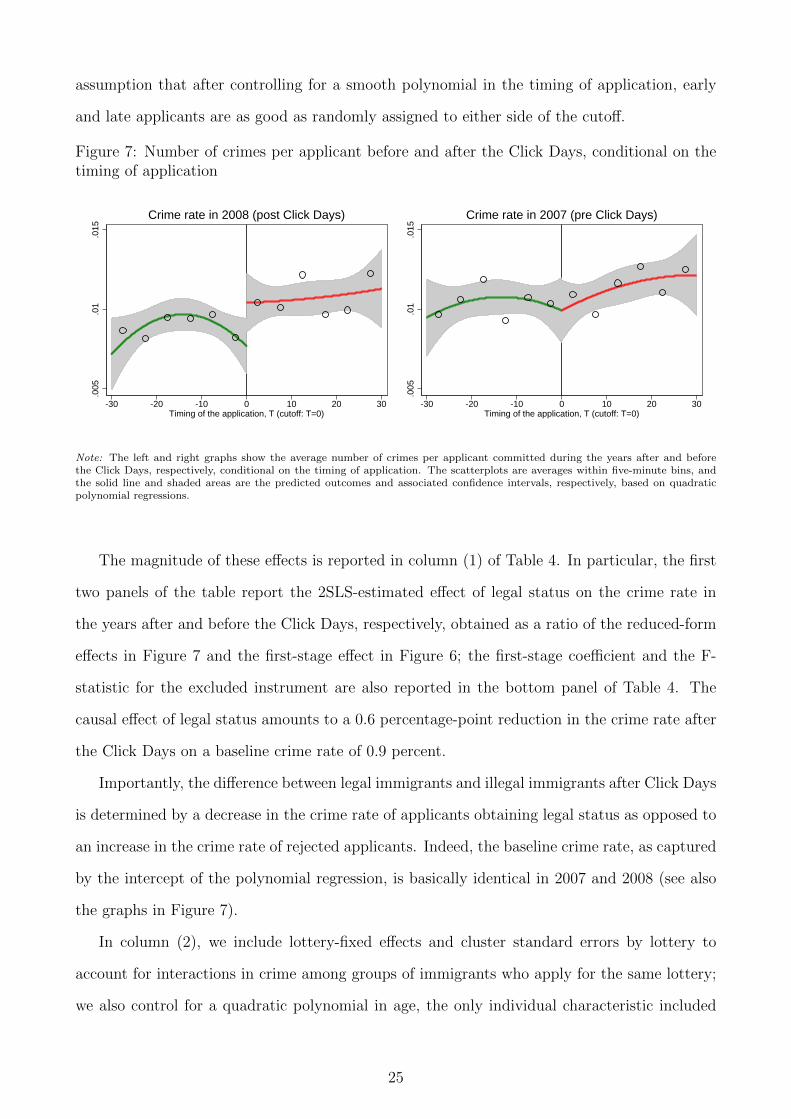
assumption that after controlling for a smooth polynomial in the timing of application, early
and late applicants are as good as randomly assigned to either side of the cutoff.
Figure 7: Number of crimes per applicant before and after the Click Days, conditional on thetiming of application
.005
.01
.015
-30 -20 -10 0 10 20 30Timing of the application, T (cutoff: T=0)
Crime rate in 2008 (post Click Days)
.005
.01
.015
-30 -20 -10 0 10 20 30Timing of the application, T (cutoff: T=0)
Crime rate in 2007 (pre Click Days)
Note: The left and right graphs show the average number of crimes per applicant committed during the years after and beforethe Click Days, respectively, conditional on the timing of application. The scatterplots are averages within five-minute bins, andthe solid line and shaded areas are the predicted outcomes and associated confidence intervals, respectively, based on quadraticpolynomial regressions.
The magnitude of these effects is reported in column (1) of Table 4. In particular, the first
two panels of the table report the 2SLS-estimated effect of legal status on the crime rate in
the years after and before the Click Days, respectively, obtained as a ratio of the reduced-form
effects in Figure 7 and the first-stage effect in Figure 6; the first-stage coefficient and the F-
statistic for the excluded instrument are also reported in the bottom panel of Table 4. The
causal effect of legal status amounts to a 0.6 percentage-point reduction in the crime rate after
the Click Days on a baseline crime rate of 0.9 percent.
Importantly, the difference between legal immigrants and illegal immigrants after Click Days
is determined by a decrease in the crime rate of applicants obtaining legal status as opposed to
an increase in the crime rate of rejected applicants. Indeed, the baseline crime rate, as captured
by the intercept of the polynomial regression, is basically identical in 2007 and 2008 (see also
the graphs in Figure 7).
In column (2), we include lottery-fixed effects and cluster standard errors by lottery to
account for interactions in crime among groups of immigrants who apply for the same lottery;
we also control for a quadratic polynomial in age, the only individual characteristic included
25
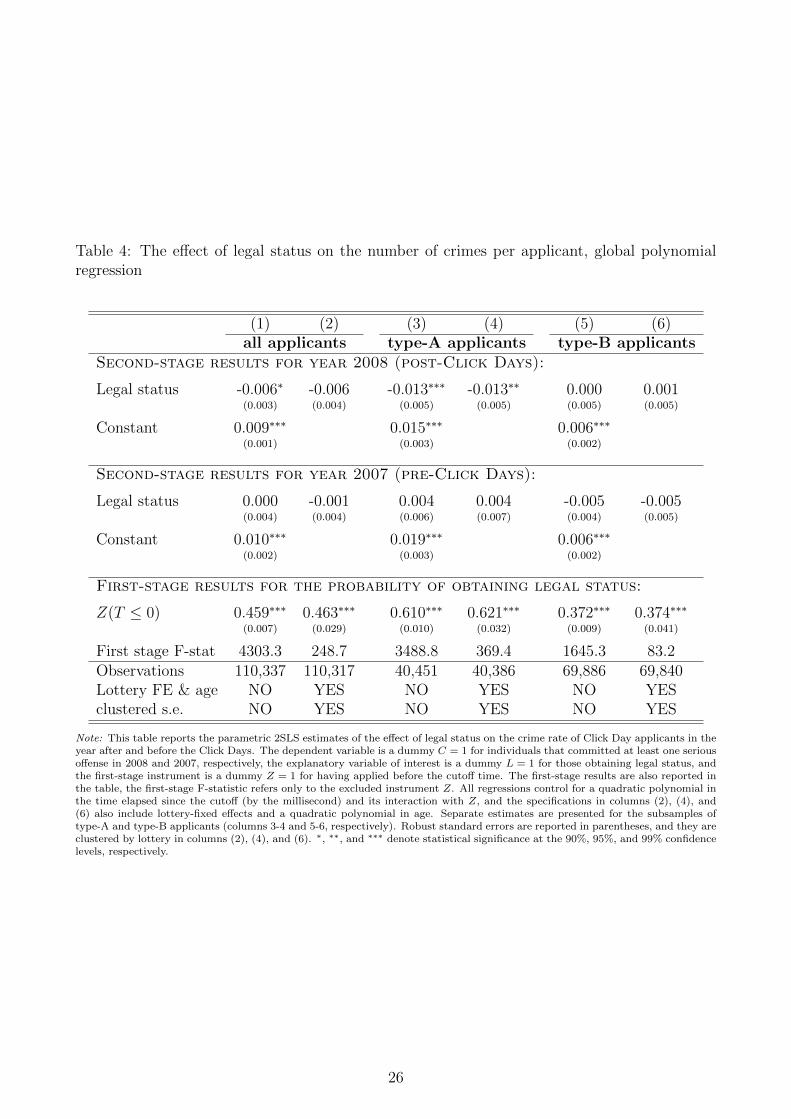
Table 4: The effect of legal status on the number of crimes per applicant, global polynomialregression
(1) (2) (3) (4) (5) (6)all applicants type-A applicants type-B applicants
Second-stage results for year 2008 (post-Click Days):
Legal status -0.006∗ -0.006 -0.013∗∗∗ -0.013∗∗ 0.000 0.001(0.003) (0.004) (0.005) (0.005) (0.005) (0.005)
Constant 0.009∗∗∗ 0.015∗∗∗ 0.006∗∗∗
(0.001) (0.003) (0.002)
Second-stage results for year 2007 (pre-Click Days):
Legal status 0.000 -0.001 0.004 0.004 -0.005 -0.005(0.004) (0.004) (0.006) (0.007) (0.004) (0.005)
Constant 0.010∗∗∗ 0.019∗∗∗ 0.006∗∗∗
(0.002) (0.003) (0.002)
First-stage results for the probability of obtaining legal status:
Z(T ≤ 0) 0.459∗∗∗ 0.463∗∗∗ 0.610∗∗∗ 0.621∗∗∗ 0.372∗∗∗ 0.374∗∗∗
(0.007) (0.029) (0.010) (0.032) (0.009) (0.041)
First stage F-stat 4303.3 248.7 3488.8 369.4 1645.3 83.2Observations 110,337 110,317 40,451 40,386 69,886 69,840Lottery FE & age NO YES NO YES NO YESclustered s.e. NO YES NO YES NO YES
Note: This table reports the parametric 2SLS estimates of the effect of legal status on the crime rate of Click Day applicants in theyear after and before the Click Days. The dependent variable is a dummy C = 1 for individuals that committed at least one seriousoffense in 2008 and 2007, respectively, the explanatory variable of interest is a dummy L = 1 for those obtaining legal status, andthe first-stage instrument is a dummy Z = 1 for having applied before the cutoff time. The first-stage results are also reported inthe table, the first-stage F-statistic refers only to the excluded instrument Z. All regressions control for a quadratic polynomial inthe time elapsed since the cutoff (by the millisecond) and its interaction with Z, and the specifications in columns (2), (4), and(6) also include lottery-fixed effects and a quadratic polynomial in age. Separate estimates are presented for the subsamples oftype-A and type-B applicants (columns 3-4 and 5-6, respectively). Robust standard errors are reported in parentheses, and they areclustered by lottery in columns (2), (4), and (6). ∗, ∗∗, and ∗∗∗ denote statistical significance at the 90%, 95%, and 99% confidencelevels, respectively.
26
in the our data.14 Controlling for lottery-fixed effects is particularly important to exclude the
possibility that our results are driven by aggregation bias across lotteries (see Section 3.4). Such
a possibility does not appear to be a concern, however, as the estimated coefficient of legal
status remains identical to the specification without fixed effects, only becoming marginally
non-significant when clustering standard errors (p-value equal to 0.110).
Figure 8: Number of crimes per applicant by the type of applicant, conditional on the timingof application
0.0
05.0
1.0
15.0
2.0
25
-30 -20 -10 0 10 20 30Timing of the application, T (cutoff: T=0)
Type A permits, 2008 (post Click Day)
0.0
05.0
1.0
15.0
2.0
25
-30 -20 -10 0 10 20 30Timing of the application, T (cutoff: T=0)
Type A permits, 2007 (pre Click Day)
0.0
05.0
1.0
15.0
2.0
25
-30 -20 -10 0 10 20 30Timing of the application, T (cutoff: T=0)
Type B permits, 2008 (post Click Day)
0.0
05.0
1.0
15.0
2.0
25
-30 -20 -10 0 10 20 30Timing of the application, T (cutoff: T=0)
Type B permits, 2007 (pre Click Day)
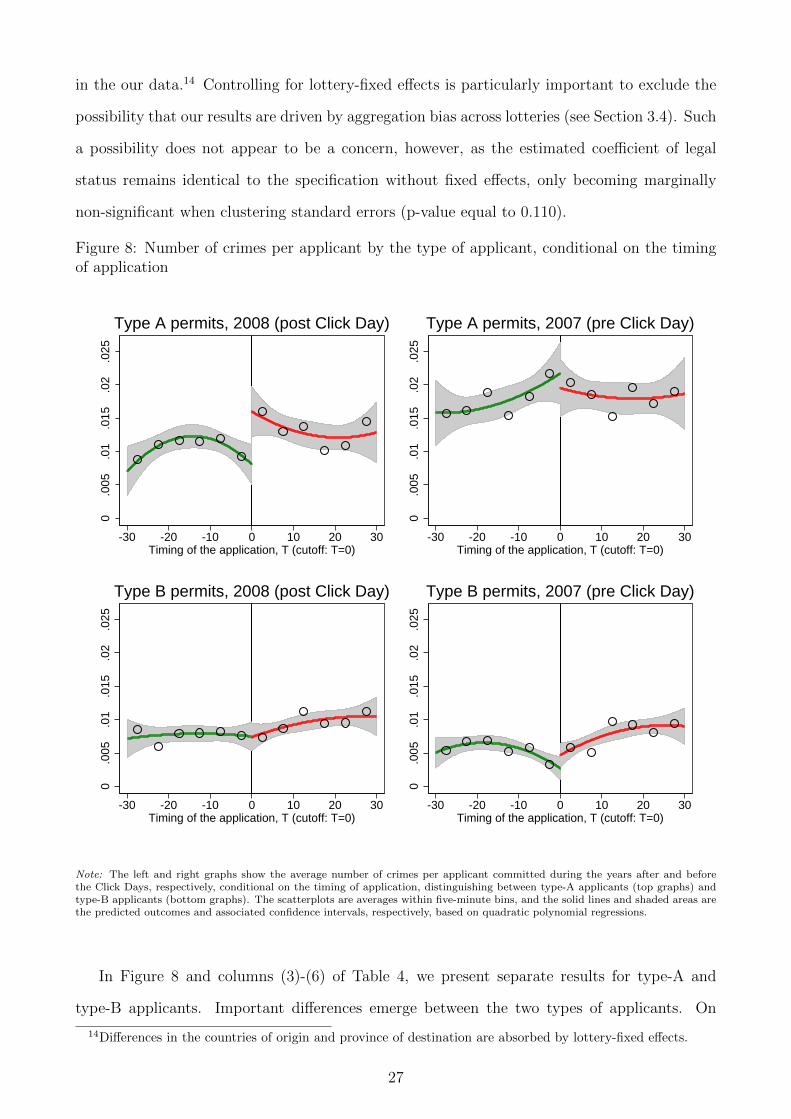
Note: The left and right graphs show the average number of crimes per applicant committed during the years after and beforethe Click Days, respectively, conditional on the timing of application, distinguishing between type-A applicants (top graphs) andtype-B applicants (bottom graphs). The scatterplots are averages within five-minute bins, and the solid lines and shaded areas arethe predicted outcomes and associated confidence intervals, respectively, based on quadratic polynomial regressions.
In Figure 8 and columns (3)-(6) of Table 4, we present separate results for type-A and
type-B applicants. Important differences emerge between the two types of applicants. On
14Differences in the countries of origin and province of destination are absorbed by lottery-fixed effects.
27
the one hand, type-A applicants exhibit both a higher crime rate before the Click Days (1.9
percent) and a greater decline in the event of obtaining legal status (-1.3 percentage points).
By contrast, type-B applicants are characterized by a lower crime rate before the Click Days
(0.6 percent), which is not affected by legal status.
The stability of coefficients when including lottery-fixed effects and the balance in crime rates
before the Click Days seem to exclude that differences between legal and illegal immigrants after
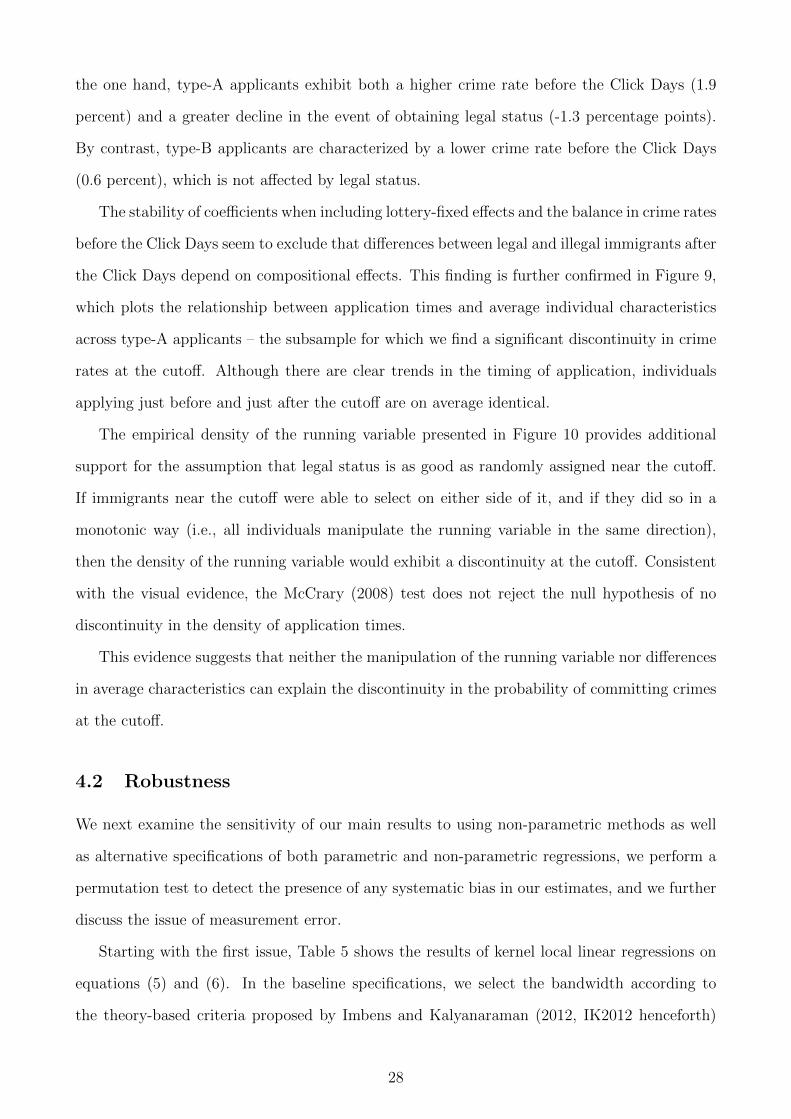
the Click Days depend on compositional effects. This finding is further confirmed in Figure 9,
which plots the relationship between application times and average individual characteristics
across type-A applicants – the subsample for which we find a significant discontinuity in crime
rates at the cutoff. Although there are clear trends in the timing of application, individuals
applying just before and just after the cutoff are on average identical.
The empirical density of the running variable presented in Figure 10 provides additional
support for the assumption that legal status is as good as randomly assigned near the cutoff.
If immigrants near the cutoff were able to select on either side of it, and if they did so in a
monotonic way (i.e., all individuals manipulate the running variable in the same direction),
then the density of the running variable would exhibit a discontinuity at the cutoff. Consistent
with the visual evidence, the McCrary (2008) test does not reject the null hypothesis of no
discontinuity in the density of application times.
This evidence suggests that neither the manipulation of the running variable nor differences
in average characteristics can explain the discontinuity in the probability of committing crimes
at the cutoff.
4.2 Robustness
We next examine the sensitivity of our main results to using non-parametric methods as well
as alternative specifications of both parametric and non-parametric regressions, we perform a
permutation test to detect the presence of any systematic bias in our estimates, and we further
discuss the issue of measurement error.
Starting with the first issue, Table 5 shows the results of kernel local linear regressions on
equations (5) and (6). In the baseline specifications, we select the bandwidth according to
the theory-based criteria proposed by Imbens and Kalyanaraman (2012, IK2012 henceforth)
28
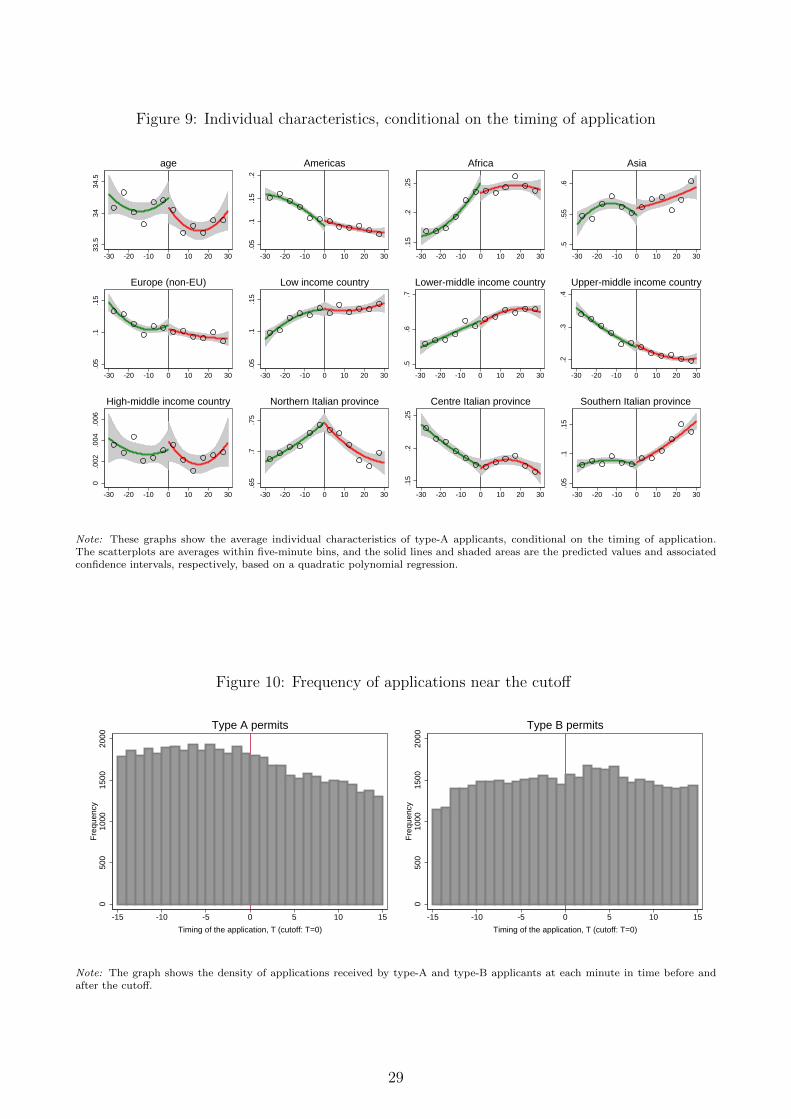
Figure 9: Individual characteristics, conditional on the timing of application
33.5
3434
.5
-30 -20 -10 0 10 20 30
age
.05
.1.1
5.2
-30 -20 -10 0 10 20 30
Americas
.15
.2.2
5
-30 -20 -10 0 10 20 30
Africa
.5.5
5.6
-30 -20 -10 0 10 20 30
Asia
.05
.1.1
5
-30 -20 -10 0 10 20 30
Europe (non-EU)
.05
.1.1
5
-30 -20 -10 0 10 20 30
Low income country
.5.6
.7
-30 -20 -10 0 10 20 30
Lower-middle income country
.2.3
.4
-30 -20 -10 0 10 20 30
Upper-middle income country
0.0
02.0
04.0
06
-30 -20 -10 0 10 20 30
High-middle income country
.65
.7.7
5
-30 -20 -10 0 10 20 30
Northern Italian province.1
5.2
.25
-30 -20 -10 0 10 20 30
Centre Italian province
.05
.1.1
5
-30 -20 -10 0 10 20 30
Southern Italian province
Note: These graphs show the average individual characteristics of type-A applicants, conditional on the timing of application.The scatterplots are averages within five-minute bins, and the solid lines and shaded areas are the predicted values and associatedconfidence intervals, respectively, based on a quadratic polynomial regression.
Figure 10: Frequency of applications near the cutoff
050
010
0015
0020
00F
requ
ency
-15 -10 -5 0 5 10 15
Timing of the application, T (cutoff: T=0)
Type A permits
050
010
0015
0020
00F
requ
ency
-15 -10 -5 0 5 10 15
Timing of the application, T (cutoff: T=0)
Type B permits
Note: The graph shows the density of applications received by type-A and type-B applicants at each minute in time before andafter the cutoff.
29
and Cattaneo et al. (2014, CCT2014 henceforth). The criterion used in each specification,
the size of the bandwidth, and the number of observations included within the bandwidth
are reported in the table. The size of the bandwidth remains very similar when applying
different criteria – between six and one half and nine and one half minutes when considering
the total sample of applicants, including between 30 and 40 thousand observations. The average
coefficient estimated across this sample varies between -0.8 and -1.2 percentage points, larger
in magnitude than in the global polynomial regression and statistically significant at the 95%
confidence level (columns 1 and 2).
When distinguishing between different groups of applicants, the crime rate declines signifi-
cantly for type-A applicants obtaining legal status (columns 3 and 4), and the magnitude of the
effect – between 1.3 and 1.5 percentage points – is virtually identical to the estimate obtained
using parametric methods (Table 4). The absence of any effect on the crime rate of type-B
applicants is also confirmed (columns 5 and 6). Finally, the crime rate before the Click Days
is always balanced between applicants to the left and to the right of the cutoff inside each
bandwidth; see the bottom panel of the table.
The consistency of the estimates in Tables 4 and 5 requires, respectively, that controlling
parametrically for a flexible polynomial in T or restricting the sample nonparametrically to
observations in a neighborhood of the cutoff removes the effect of other factors that vary
(smoothly) around the cutoff. Both methods involve a trade-off between bias and efficiency: in
general, higher-order polynomials and smaller bandwidths reduce the bias at the cost of greater
asymptotic variance.
To examine the sensitivity of our results to different choices regarding these trade-offs, the
graphs in Figure 11 plot the estimated coefficient of legal status and the associated confidence
intervals for different specifications of parametric and non-parametric regressions. In particular,
the first two graphs plot the results for type-A and type-B applicants, respectively, of the global
polynomial regression when varying the order of the polynomial, J , between 0 and 6; the last
two graphs plot the results of local kernel regressions for each possible bandwidth between 1 and
30 minutes (the IK2012 and CCT2014 bandwidths are also indicated on the horizontal axis).
The estimates are remarkably similar when adopting different specifications of parametric and
non-parametric methods.
30
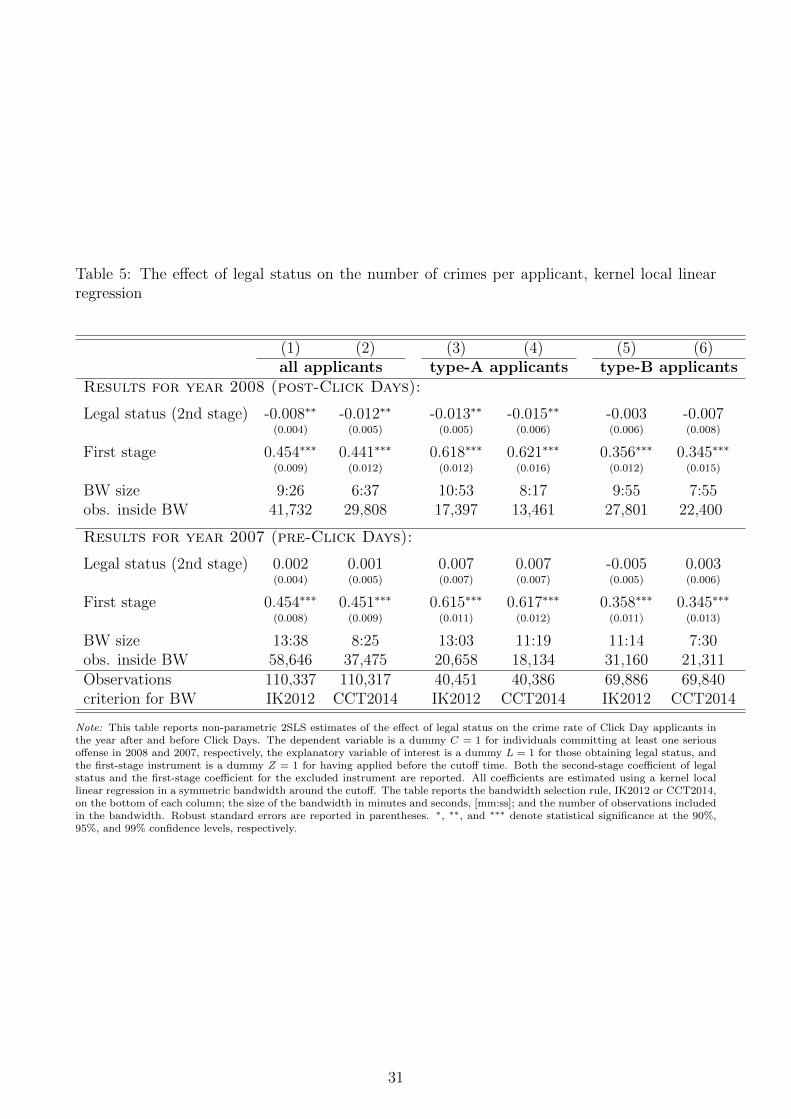
Table 5: The effect of legal status on the number of crimes per applicant, kernel local linearregression
(1) (2) (3) (4) (5) (6)all applicants type-A applicants type-B applicants
Results for year 2008 (post-Click Days):
Legal status (2nd stage) -0.008∗∗ -0.012∗∗ -0.013∗∗ -0.015∗∗ -0.003 -0.007(0.004) (0.005) (0.005) (0.006) (0.006) (0.008)
First stage 0.454∗∗∗ 0.441∗∗∗ 0.618∗∗∗ 0.621∗∗∗ 0.356∗∗∗ 0.345∗∗∗
(0.009) (0.012) (0.012) (0.016) (0.012) (0.015)
BW size 9:26 6:37 10:53 8:17 9:55 7:55obs. inside BW 41,732 29,808 17,397 13,461 27,801 22,400
Results for year 2007 (pre-Click Days):
Legal status (2nd stage) 0.002 0.001 0.007 0.007 -0.005 0.003(0.004) (0.005) (0.007) (0.007) (0.005) (0.006)
First stage 0.454∗∗∗ 0.451∗∗∗ 0.615∗∗∗ 0.617∗∗∗ 0.358∗∗∗ 0.345∗∗∗
(0.008) (0.009) (0.011) (0.012) (0.011) (0.013)
BW size 13:38 8:25 13:03 11:19 11:14 7:30obs. inside BW 58,646 37,475 20,658 18,134 31,160 21,311Observations 110,337 110,317 40,451 40,386 69,886 69,840criterion for BW IK2012 CCT2014 IK2012 CCT2014 IK2012 CCT2014
Note: This table reports non-parametric 2SLS estimates of the effect of legal status on the crime rate of Click Day applicants inthe year after and before Click Days. The dependent variable is a dummy C = 1 for individuals committing at least one seriousoffense in 2008 and 2007, respectively, the explanatory variable of interest is a dummy L = 1 for those obtaining legal status, andthe first-stage instrument is a dummy Z = 1 for having applied before the cutoff time. Both the second-stage coefficient of legalstatus and the first-stage coefficient for the excluded instrument are reported. All coefficients are estimated using a kernel locallinear regression in a symmetric bandwidth around the cutoff. The table reports the bandwidth selection rule, IK2012 or CCT2014,on the bottom of each column; the size of the bandwidth in minutes and seconds, [mm:ss]; and the number of observations includedin the bandwidth. Robust standard errors are reported in parentheses. ∗, ∗∗, and ∗∗∗ denote statistical significance at the 90%,95%, and 99% confidence levels, respectively.
31
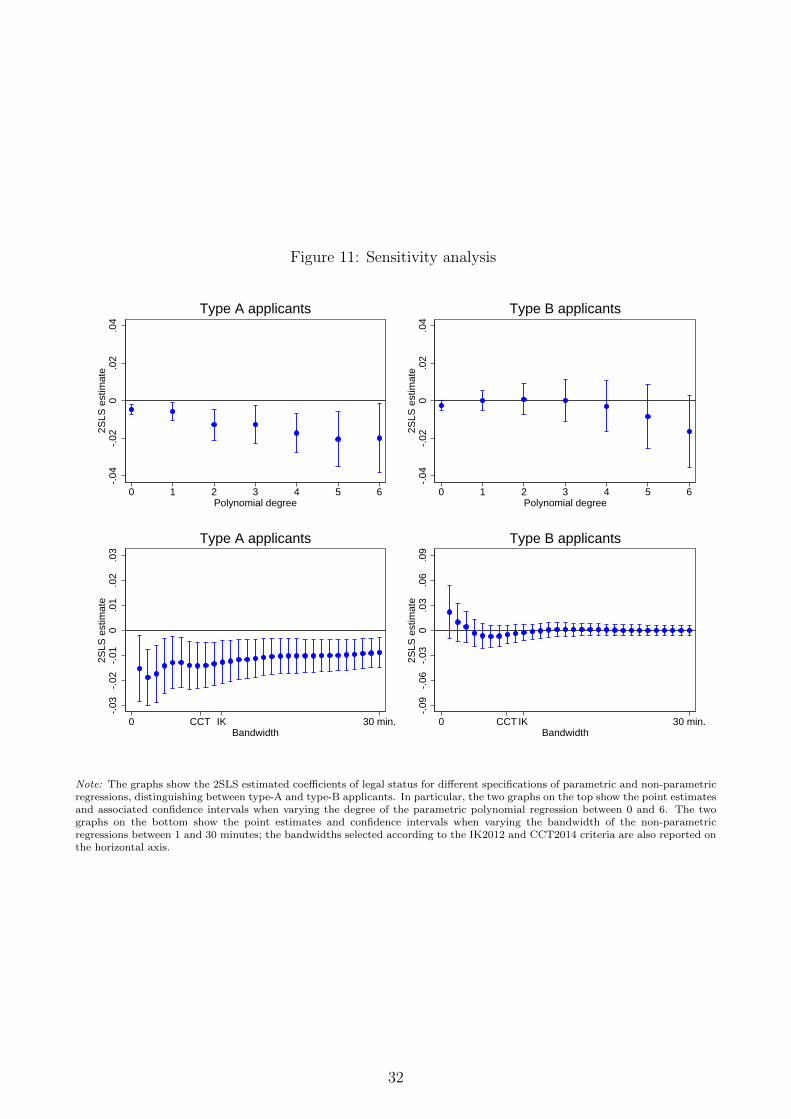
Figure 11: Sensitivity analysis
-.04
-.02
0.0
2.0
42S
LS e
stim
ate
0 1 2 3 4 5 6Polynomial degree
Type A applicants
-.04
-.02
0.0
2.0
42S
LS e
stim
ate
0 1 2 3 4 5 6Polynomial degree
Type B applicants
-.03
-.02
-.01
0.0
1.0
2.0
32S
LS e
stim
ate
0 IKCCT 30 min.Bandwidth
Type A applicants
-.09
-.06
-.03
0.0
3.0
6.0
92S
LS e
stim
ate
0 IKCCT 30 min.Bandwidth
Type B applicants
Note: The graphs show the 2SLS estimated coefficients of legal status for different specifications of parametric and non-parametricregressions, distinguishing between type-A and type-B applicants. In particular, the two graphs on the top show the point estimatesand associated confidence intervals when varying the degree of the parametric polynomial regression between 0 and 6. The twographs on the bottom show the point estimates and confidence intervals when varying the bandwidth of the non-parametricregressions between 1 and 30 minutes; the bandwidths selected according to the IK2012 and CCT2014 criteria are also reported onthe horizontal axis.
32
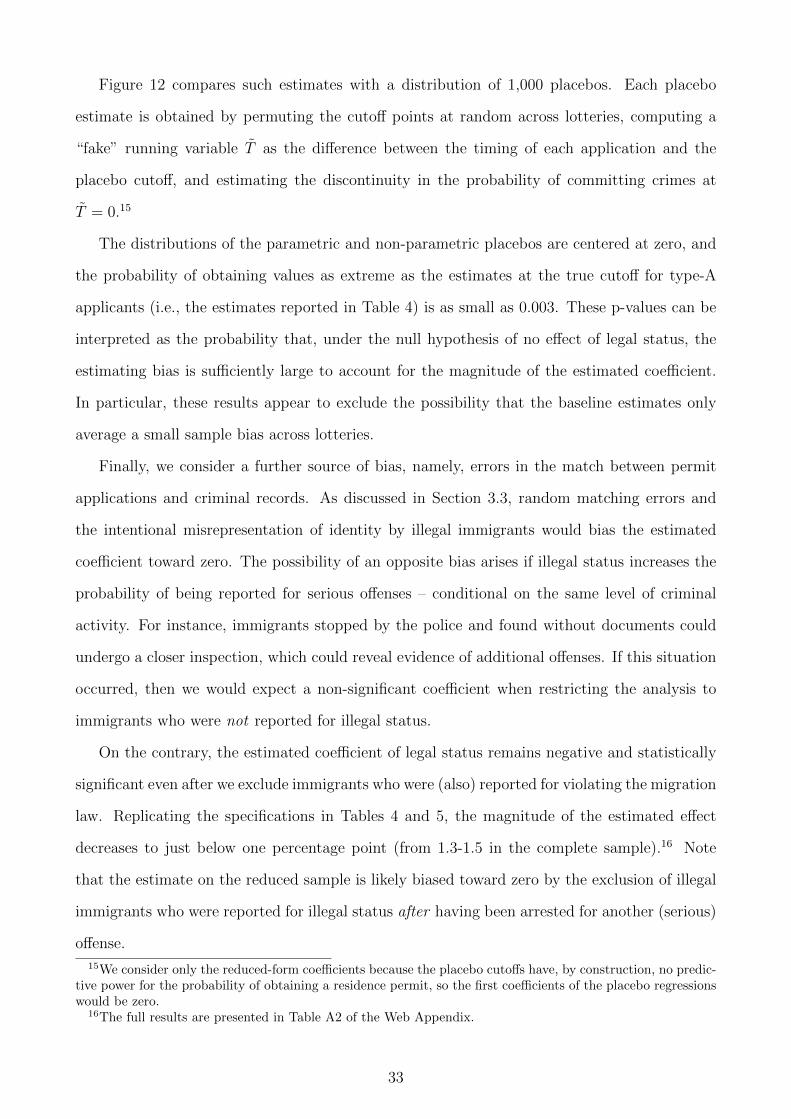
Figure 12 compares such estimates with a distribution of 1,000 placebos. Each placebo
estimate is obtained by permuting the cutoff points at random across lotteries, computing a
“fake” running variable T as the difference between the timing of each application and the
placebo cutoff, and estimating the discontinuity in the probability of committing crimes at
T = 0.15
The distributions of the parametric and non-parametric placebos are centered at zero, and
the probability of obtaining values as extreme as the estimates at the true cutoff for type-A
applicants (i.e., the estimates reported in Table 4) is as small as 0.003. These p-values can be
interpreted as the probability that, under the null hypothesis of no effect of legal status, the
estimating bias is sufficiently large to account for the magnitude of the estimated coefficient.
In particular, these results appear to exclude the possibility that the baseline estimates only
average a small sample bias across lotteries.
Finally, we consider a further source of bias, namely, errors in the match between permit
applications and criminal records. As discussed in Section 3.3, random matching errors and
the intentional misrepresentation of identity by illegal immigrants would bias the estimated
coefficient toward zero. The possibility of an opposite bias arises if illegal status increases the
probability of being reported for serious offenses – conditional on the same level of criminal
activity. For instance, immigrants stopped by the police and found without documents could
undergo a closer inspection, which could reveal evidence of additional offenses. If this situation
occurred, then we would expect a non-significant coefficient when restricting the analysis to
immigrants who were not reported for illegal status.
On the contrary, the estimated coefficient of legal status remains negative and statistically
significant even after we exclude immigrants who were (also) reported for violating the migration
law. Replicating the specifications in Tables 4 and 5, the magnitude of the estimated effect
decreases to just below one percentage point (from 1.3-1.5 in the complete sample).16 Note
that the estimate on the reduced sample is likely biased toward zero by the exclusion of illegal
immigrants who were reported for illegal status after having been arrested for another (serious)
offense.
15We consider only the reduced-form coefficients because the placebo cutoffs have, by construction, no predic-tive power for the probability of obtaining a residence permit, so the first coefficients of the placebo regressionswould be zero.
16The full results are presented in Table A2 of the Web Appendix.
33
Figure 12: Reduced-form effect of legal status on the number of crimes per applicant, placeboestimates
050
100
-.01 -.005 0 .005 .01
Prob(placebo<actual)=.003
Non-parametric, type A applicants
050
100
150
200
-.01 -.005 0 .005 .01
Prob(placebo<actual)=.129
Non-parametric, type B applicants
050
100
150
-.01 -.005 0 .005 .01
Prob(placebo<actual)=.003
Parametric, type A applicants
050
100
150
200
250
-.01 -.005 0 .005 .01
Prob(placebo<actual)=.636
Parametric, type B applicants
Note: The graphs show the distribution of the reduced-form estimates obtained for 1,000 random permutations of the cutoff pointsacross lotteries using parametric and non-parametric methods and distinguishing between type-A and type-B applicants. Thevertical lines represent the estimates obtained at the true cutoff point (i.e., the estimates reported in Tables 4 and 5). The fractionof placebo estimates lower than the actual estimate is also reported at the bottom of each graph.
34
4.3 Channels
Two main conclusions can be drawn from the results obtained so far. First, legal status de-
creased the crime rate of immigrants between 2007 and 2008. Second, the average coefficient
hides an extreme heterogeneity by the type of applicant. In particular, the effect is high in
magnitude (between -1.3 and -1.5 percentage points) and very precisely estimated for type-A
applicants, whereas there is no effect on the crime rate of type-B applicants. All estimates
are extremely stable when using different methods and specifications. As discussed in Section
2.2, the former type of applicants are characterized by worse labor market opportunities, with
a large number of them being actually unemployed, whereas the latter are likely employed,
although unofficially, by sponsor firms before the Click Days.
A potential explanation for the absence of any effect on the crime rate of type-B applicants
is thus that they have a very high opportunity cost of crime also when illegal (i.e., before the
Click Days). This cost would include the salary paid by the firm as well as the possibility of
re-applying in the future in case the application in 2007 was not successful. By contrast, type-
A applicants confront meager employment opportunities before the Click Days. At the same
time, our results suggest that legal status may trigger a significant change in the behavior of
such individuals, for instance because improved opportunities following the concession of legal
status could induce immigrants that were previously detached from the labor market to return
to searching for a job. Put differently, the group of type-A applicants may include a larger
number of individuals at the margin between pursuing a criminal career and entering the labor
market.
To investigate further the importance of labor market opportunities, we exploit additional
heterogeneity in the effect of legal status by the type of offense and sponsor.17 Starting with
the former dimension of heterogeneity, if legal status affects criminal behavior by changing the
relative returns on legitimate activities and, moreover, violent crimes depend to a lesser extent
on economic considerations, we should expect that the average effect is driven by economi-
cally motivated crimes (Machin and Meghir, 2004). This is exactly the picture that emerges
from Table 6. Distinguishing between economically motivated crimes (thefts, robberies, drug-
17The estimates reported in this section are obtained for the same parametric specification as in Table 4. Asit was the case for the baseline estimates, the results obtained by non-parametric methods are very similar andare available upon request.
35
Table 6: The effect of legal status on economic and violent crimes
(1) (2) (3) (4) (5) (6)all applicants type-A applicants type-B applicantsecon viol econ viol econ viol
Second-stage results for year 2008 (post Click-Day):
Legal status -0.005 -0.002 -0.009∗∗ -0.002 -0.000 -0.001(0.003) (0.001) (0.004) (0.002) (0.004) (0.002)
Second-stage results for year 2007 (pre Click-Day):
Legal status 0.000 -0.002 0.004 -0.003 -0.004 -0.001(0.004) (0.003) (0.007) (0.003) (0.004) (0.004)
Observations 110,337 110,317 40,451 40,386 69,886 69,840
Note: This table reports parametric 2SLS estimates of the effect of legal status on the crime rate of Click Day applicants in theyear after and before Click Days, distinguishing between economically motivated offenses (columns 1, 3, and 5) and violent crimes(columns 2, 4, and 6). The dependent variable is a dummy C = 1 for individuals committing at least one serious offense in 2008and 2007, respectively. The explanatory variable of interest is a dummy L = 1 for those obtaining legal status, and the first-stageinstrument is a dummy Z = 1 for having applied before the cutoff time. The first-stage results are available in Table 4, so they arenot reported here. All regressions control for a quadratic polynomial in the time elapsed since the cutoff (by the millisecond) andits interaction with Z, lottery-fixed effects, and a quadratic polynomial in age. Separate estimates are presented for the subsamplesof type-A and type-B applicants (columns 3-4 and 5-6, respectively). Robust standard errors clustered by lottery are reported inparentheses. ∗, ∗∗, and ∗∗∗ denote statistical significance at the 90%, 95%, and 99% confidence levels, respectively.
trafficking, extortion, and smuggling) and purely violent crimes (murders and sex offenses),
legal status significantly affects only the former type of offenses.18 This last result is consistent
with previous evidence in Baker (2013), Freedman et al. (2013), and Mastrobuoni and Pinotti
(2014).
Turning to the second dimension of heterogeneity, in Table 7, we distinguish between im-
migrants sponsored by foreign and native employers, respectively. As discussed in Section 2.2,
fictitious job offers aimed at legalizing unemployed immigrants who otherwise would not qualify
for a residence permit typically come through type-A applications sponsored by other foreign
immigrants. Consistent with this interpretation, the type-A applicants sponsored by foreign
employers exhibit a higher baseline crime rate than both type-A applicants sponsored by a
native employer and type-B applicants sponsored by any employer. The effect of legal status is
also higher within the sub-sample of type-A applicants sponsored by other immigrants. Indeed,
the negative coefficient estimated across type-A applicants is entirely driven by this sub-sample
of individuals – approximately 23.5 thousand of a total of 40.5 thousand type-A applicants.
18We excluded two types of crime – kidnappings and illegal carrying of arms – that cannot be exclusivelyclassified as either economically motivated or violent.
36
Table 7: The effect of legal status on crimes committed by applicants sponsored by foreign andnative sponsors
(1) (2) (3) (4) (5) (6) (7) (8)type-A applicants type-B applicants
foreign sponsor native sponsors foreign sponsor native sponsorsSecond-stage results for year 2008 (post-Click Day):Legal status -0.017*** -0.015** -0.007 -0.008 -0.002 -0.003 0.001 0.002
(0.006) (0.007) (0.006) (0.007) (0.005) (0.006) (0.008) (0.008)
Constant 0.024*** 0.007** 0.004* 0.010***(0.004) (0.003) (0.002) (0.003)
Second-stage results for year 2007 (pre-Click Day):Legal status -0.002 -0.001 0.015 0.013 0.001 0.000 -0.011* -0.011*
(0.008) (0.008) (0.010) (0.010) (0.004) (0.004) (0.006) (0.006)
Constant 0.026*** 0.008** 0.002 0.009***(0.004) (0.004) (0.002) (0.003)
First-stage results for the probability of obtaining legal status:Z(T ≤ 0) 0.658*** 0.667*** 0.539*** 0.549*** 0.387*** 0.382*** 0.360*** 0.365***
(0.013) (0.032) (0.017) (0.041) (0.014) (0.046) (0.012) (0.041)
First stage F-stat 2601.9 2930.6 999.8 1104.2 785.7 807.4 857.25 918.77Observations 23,483 23,390 16,968 16,859 30,518 30,441 39,368 39,308Lottery FE & age NO YES NO YES NO YES NO YESclustered s.e. NO YES NO YES NO YES NO YES
Note: This table reports parametric 2SLS estimates of the effect of legal status on the crime rate of Click Day applicants in theyear after and before Click Days, distinguishing between type-A and type-B applicants and between foreign and native sponsors.The dependent variable is a dummy C = 1 for individuals that committed at least one serious offense in 2008 and 2007. Theexplanatory variable of interest is a dummy L = 1 for those obtaining legal status, and the first-stage instrument is a dummy Z = 1for having applied before the cutoff time. First-stage results are also reported in the table, and the first-stage F-statistic refersonly to the excluded instrument Z. All regressions control for a quadratic polynomial in the time elapsed since the cutoff (by themillisecond) and its interaction with Z, and the specifications in columns (2), (4), (6), and (8) also include lottery-fixed effects anda quadratic polynomial in age. Robust standard errors are reported in parentheses, and they are clustered by lottery in columns(2), (4), (6), and (8). ∗, ∗∗, and ∗∗∗ denote statistical significance at the 90%, 95%, and 99% confidence levels, respectively.
37
5 Conclusions
Illegality imposes a heavy toll on foreign immigrants in terms of poorer employment opportu-
nities, lower incomes, and lower access to social services, all of which lower the opportunity
cost of engaging in crime, thus increasing the number of crimes committed by immigrants. In
principle, such an effect could be offset by an opposite one: since a fraction of illegal immi-
grants that are expelled no longer commit crimes in the destination country, the halting of
expulsions could increase the crime rate of legalized immigrants. Therefore, the overall change
in crime would remain ambiguous (whereas the crime rate conditional on not being expelled
unambiguously decreases).
The results of the present paper suggest that the former effect prevailed among immigrants
applying for a residence permit in Italy, leading to a reduction in their crime rate during the year
following legalization, although we cannot estimate the two effects separately because we cannot
observe the mobility of immigrants across the border (because of expulsion or other reasons).
Notice that the same limitation applies to empirical studies of crime in general, as the crime
rate is typically measured by the number of crimes committed in a given period (e.g., one year)
over the beginning-of-period stock of potential offenders (e.g., the population in a given area).
Insofar as there is population mobility across areas during the period of interest, the estimated
effect of any crime determinant captures the combined effect on the stock of potential offenders
and on the crime probability of those who did not change location. Although this problem is
admittedly more relevant for immigrants, we should stress that obtaining a residence permit in
Italy does not allow for free mobility in the rest of the European Union – or, for that matter,
in any other country – so there is no reason to expect greater mobility across the border by
legalized immigrants.19
Most important, the overall effect of legalization on crime in the destination country is
arguably the relevant parameter from a policy perspective, as opposed to the (unobserved)
change in criminal behavior conditional on not being expelled. The latter parameter would,
in fact, over-estimate the reduction in crime achieved through legalization. In the end, when
weighing the advantages and disadvantages of legalization policies, we wish to know the change
in the number of crimes caused by the concession of legal status to the potential pool of
19If anything, the opposite might be true, as some immigrants could decide to leave the country upon havingthe application rejected.
38
applicants; our estimates specifically identify this parameter.
Indeed, we believe that our results can inform the current debate on immigration policy.
Immigration amnesty is near the top of the agenda in the United States as well as in many
other countries due to the large presence of illegal immigrants. The present paper highlights a
potentially important payoff of amnesty programs, namely, a reduction in the number of crimes
committed by legalized immigrants in a destination country. The heterogeneity in the effect
across different types of applicants also sheds light on which groups would be most responsive
to legalization, i.e., those with worse employment opportunities when illegal.
Of course, these conclusions are subject to a number of caveats. First of all, the results
obtained for Italy cannot be immediately generalized to countries characterized by a very dif-
ferent institutional context. In particular, illegal immigrants in the United States confront a
higher risk of being expelled from the country conditional upon committing an offense, which
may lower their propensity to engage in crime. Indeed, Butcher and Piehl (2007) argue that
selective deportations are the main reason why immigrants exhibit lower incarceration rates
than natives in the United States, contrary to trends in most other countries. Indeed, other
European countries seem to exhibit similar trends as Italy, as immigrants are generally char-
acterized by a high crime rate relative to natives, limited access to employment opportunities,
and a very low risk of expulsion.
Second, even within Italy, the results of our analysis cannot be generalized to the whole
population of immigrants, as in principle, some of them may decide not to apply for a residence
permit. In practice, however, the number of applications received on Click Days is very close to
the estimated number of immigrants illegally present in the Italian territory. For instance, the
“high-quality” estimate of the illegal population provided by the Clandestino Project for 2006
was 650 thousand, just above the 610 thousand applications for residence permits received the
following year (see Clandestino Project, 2009, and Table 1). Moreover, those actually applying
for legal status may be the most interesting population from a policy perspective, as legalization
programs typically presume the initiative and active involvement of to-be-legalized immigrants
as well as their employers.
Third, in light of previous evidence on the effects of legal status, we emphasize the role of
improvements in employment opportunities and wages as a likely driver of changes in criminal
39
behavior by newly legalized immigrants. In principle, legal status could affect the opportunity
cost of crime through other channels, notably, the access to social welfare. In practice, however,
illegal immigrants in Italy have access (with the same conditions as legal residents) to essential
services such as basic healthcare and schooling; at the same time, no universal income support
scheme exists in Italy (not even for legal residents). For both reasons, legal status should have
rather limited effects on this additional dimension.
Finally, each legalization episode potentially generates expectations of further amnesties in
the future and thus increases migration pressures at the border. Although previous studies
have not found clear evidence of such effects following amnesty programs in the United States
(Donato et al., 1992; Orrenius and Zavodny, 2003), a complete evaluation of legalization policies
would need to take this possibility into account; we leave this issue to further research.
References
Accetturo, A. and L. Infante (2010). Immigrant earnings in the italian labour market. Giornale
degli Economisti 69 (1), 1–28.
Alonso-Borrego, C., N. Garoupa, and P. Vazquez (2012). Does immigration cause crime?
evidence from spain. American law and economics review 14 (1), 165–191.
Amuedo-Dorantes, C., C. Bansak, and S. Raphael (2007). Gender differences in the labor
market: Impact of irca. American Economic Review 97 (2), 412–416.
Andrews, D. W. K. (1993). Tests for parameter instability and structural change with unknown
change point. Econometrica 61 (4), 821–856.
Baker, S. (2013). Effects of immigrant legalization on crime: The 1986 immigration reform and
control act. Unpublished manuscript, Stanford University.
Barbagli, M. (2008). Immigrazione e sicurezza in Italia. Il mulino.
Becker, G. S. (1968). Crime and punishment: An economic approach. The Journal of Political
Economy 76 (2), pp. 169–217.
Bell, B. and S. Machin (2013). Crime and immigration: What do we know? In P. Cook,
S. Machin, O. Marie, and G. Mastrobuoni (Eds.), Lessons from the Economics of Crime:
What Reduces Offending? MIT Press.
Bell, B., S. Machin, and F. Fasani (2013). Crime and immigration: Evidence from large
immigrant waves. Review of Economics and Statistics 95 (4), 1278–1290.
40
Bertrand, M., R. Hanna, and S. Mullainathan (2010). Affirmative action in education: Evidence
from engineering college admissions in india. Journal of Public Economics 94 (1), 16–29.
Bianchi, M., P. Buonanno, and P. Pinotti (2012). Do immigrants cause crime? Journal of the
European Economic Association 10 (6), 1318–1347.
Borjas, G. J., J. Grogger, and G. H. Hanson (2010). Immigration and the economic status of
african-american men. Economica 77 (306), 255–282.
Butcher, K. F. and A. M. Piehl (1998). Cross-city evidence on the relationship between immi-
gration and crime. Journal of Policy Analysis and Management 17 (3), 457–493.
Butcher, K. F. and A. M. Piehl (2007). Why are immigrants’ incarceration rates so low?
evidence on selective immigration, deterrence, and deportation. NBER Working Papers
13229, National Bureau of Economic Research, Inc.
Caponi, V. and M. Plesca (2013). Empirical Characteristics of Legal and Illegal Immigrants in
the U.S. IZA Discussion Papers 7304, Institute for the Study of Labor (IZA).
Cattaneo, M., S. Calonico, and R. Titiunik (2014). Robust nonparametric confidence intervals
for regression-discontinuity designs. Unpublished manuscript, University of Michigan.
Chay, K. Y., P. J. McEwan, and M. Urquiola (2005). The central role of noise in evaluating
interventions that use test scores to rank schools. American Economic Review 95 (4), 1237–
1258.
Chen, A., T. Bengtsson, and T. K. Ho (2009). A regression paradox for linear models: Sufficient
conditions and relation to simpsons paradox. The American Statistician 63 (3).
Clandestino Project (2009). Stocks of irregular migrants: Estimates for italy. Technical report,
CLANDESTINO Technical Report.
Cohn, J. and J. Passel (2009). A portrait of unauthorized immigrants in the united states. Pew
hispanic center.
Dahl, G. B., K. V. Lken, and M. Mogstad (2014). Peer Effects in Program Participation.
American Economic Review (forthcoming).
Donato, K. M., J. Durand, and D. S. Massey (1992). Stemming the tide? assessing the deterrent
effects of the immigration reform and control act. Demography 29 (2), 139–157.
Dustmann, C., F. Fasani, and B. Speciale (2010). Illegal migration and consumption behavior
of immigrant households. Technical report, Centre for Research and Analysis of Migration
(CREAM).
Ehrlich, I. (1973). Participation in illegitimate activities: A theoretical and empirical investi-
gation. The Journal of Political Economy 81 (3), pp. 521–565.
41
Fredriksson, P., B. ckert, and H. Oosterbeek (2013). Long-Term Effects of Class Size. The
Quarterly Journal of Economics 128 (1), 249–285.
Freedman, M., E. Owens, and S. Bohn (2013). Immigration, employment opportunities, and
criminal behavior. Unpublished manuscript, Cornell University.
Gelman, A. and G. Imbens (2014). Why high-order polynomials should not be used in regression
discontinuity designs. Technical report, National Bureau of Economic Research.
Hahn, J., P. Todd, and W. Van der Klaauw (2001). Identification and estimation of treatment
effects with a regression-discontinuity design. Econometrica 69 (1), 201–209.
Hoefer, M., N. Rytina, and B. C. Baker (2012a). Estimates of the legal permanent resident
population in 2011. Population estimates, Office of Immigration Statistics, Department of
Homeland Security.
Hoefer, M., N. Rytina, and B. C. Baker (2012b). Estimates of the unauthorized immigrant
population residing in the united states: January 2011. Population estimates, Office of
Immigration Statistics, Department of Homeland Security.
Imbens, G. and K. Kalyanaraman (2012). Optimal bandwidth choice for the regression discon-
tinuity estimator. The Review of Economic Studies 79 (3), 933–959.
Italian Ministry of Interior (2007). Rapporto sulla criminalita in italia. analisi, prevenzione,
contrasto. Technical report.
Kaushal, N. (2006). Amnesty programs and the labor market outcomes of undocumented
workers. Journal of Human Resources 41 (3), 631–647.
Kossoudji, S. A. and D. A. Cobb-Clark (2002). Coming out of the shadows: Learning about
legal status and wages from the legalized population. Journal of Labor Economics 20 (3),
598–628.
Lee, D. S. (2008). Randomized experiments from non-random selection in us house elections.
Journal of Econometrics 142 (2), 675–697.
Lee, D. S. and T. Lemieux (2010). Regression discontinuity designs in economics. The Journal
of Economic Literature 48 (2), 281–355.
Lozano, F. A. and T. A. Sorensen (2011). The Labor Market Value to Legal Status. IZA
Discussion Papers 5492, Institute for the Study of Labor (IZA).
MacDonald, Z. (2002). Official crime statistics: Their use and interpretation. The Economic
Journal 112 (477), F85–F106.
Machin, S. and C. Meghir (2004). Crime and economic incentives. Journal of Human Re-
sources 39 (4), 958–979.
42
Mastrobuoni, G. and P. Pinotti (2014). Legal status and the criminal activity of immigrants.
American Economic Journal: Applied Economics, forthcoming .
McCrary, J. (2008). Manipulation of the running variable in the regression discontinuity design:
A density test. Journal of Econometrics 142 (2), 698–714.
Orrenius, P. M. and M. Zavodny (2003). Do amnesty programs reduce undocumented immi-
gration? evidence from irca. Demography 40 (3), 437–450.
Rubin, D. B. (1974). Estimating causal effects of treatments in randomized and nonrandomized
studies. Journal of Educational Psychology 66 (5), 688 – 701.
Sciortino, G. (1991). Immigration into europe and public policy: do stops really work? Journal
of Ethnic and Migration Studies 18 (1), 89–99.
Spenkuch, J. L. (2014). Understanding the impact of immigration on crime. American Law
and Economics Review 16 (1), 177–219.
Transatlantic Trends (2009). Immigration survey. German Marshall Fund, Com-
pagnia di San Paolo, Barrow Cadbury Trust, and Fundacin BBVA. available at
http://trends.gmfus.org/immigration.
Wasem, R. E. (2008). Immigration fraud: Policies, investigations, and issues. Congressional
Research Service, Library of Congress .
43
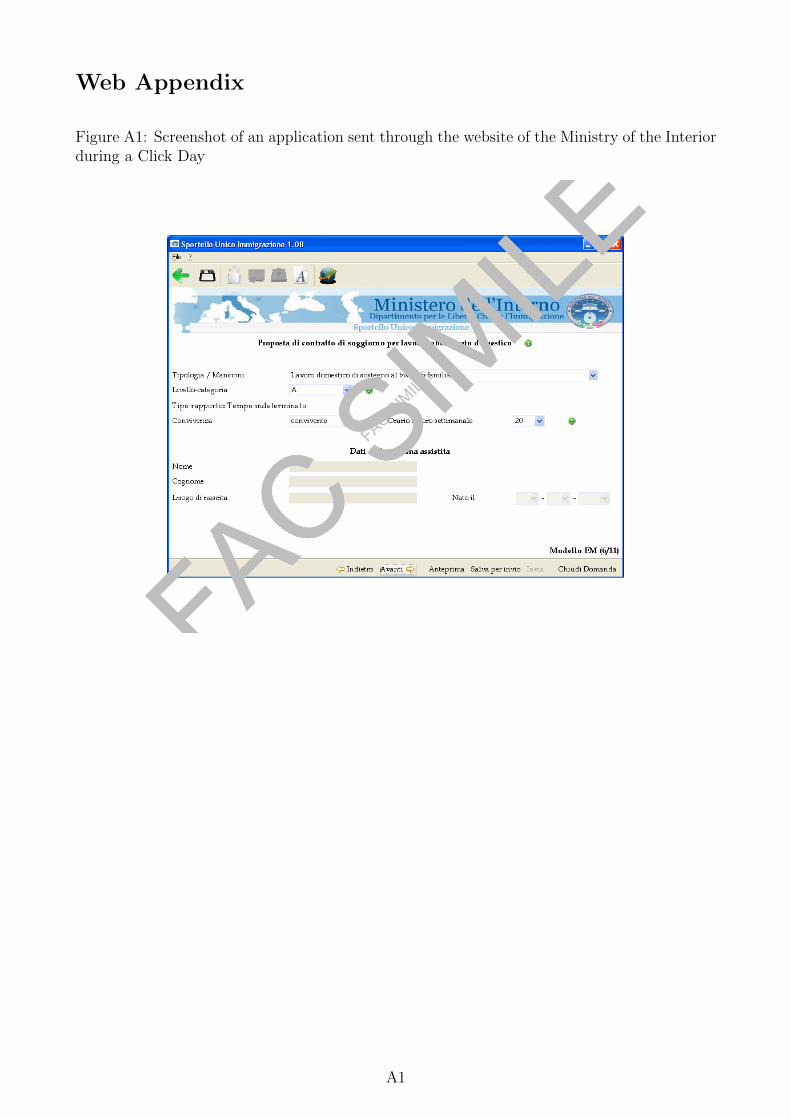
Web Appendix
Figure A1: Screenshot of an application sent through the website of the Ministry of the Interiorduring a Click Day
FAC SIM
ILE
FAC SIM
ILEFAC S
IMILE
FAC SIM
ILE
A1
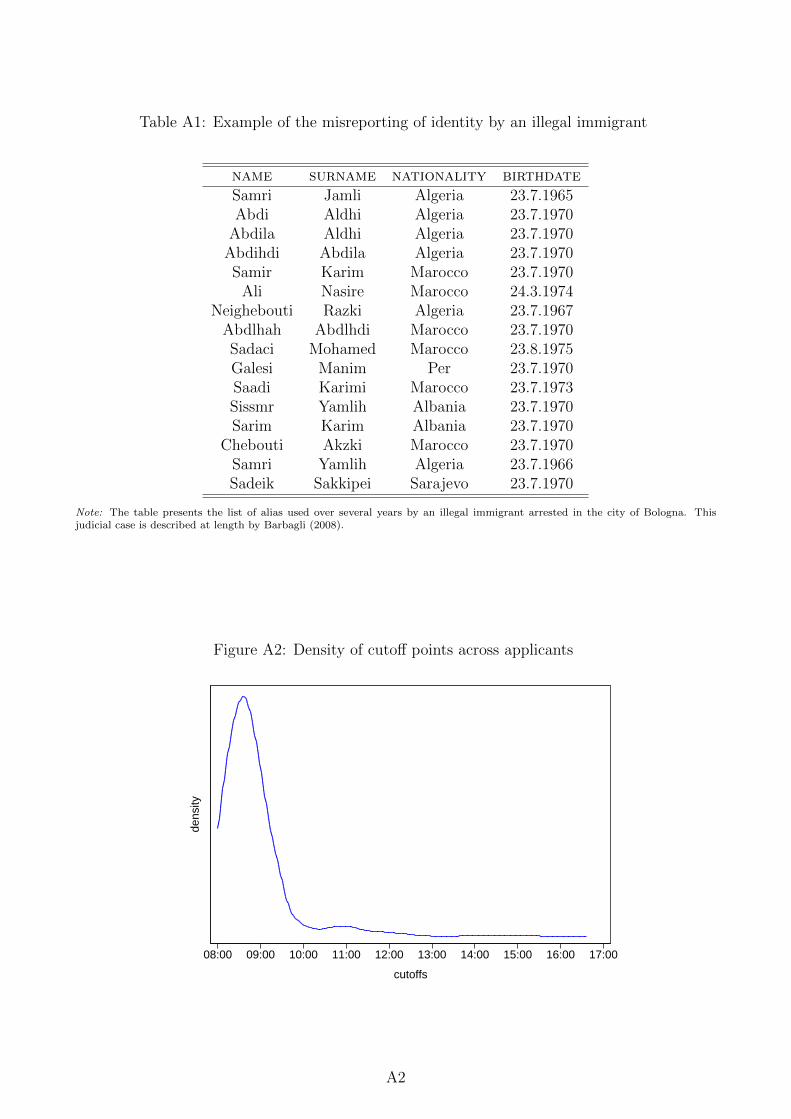
Table A1: Example of the misreporting of identity by an illegal immigrant
name surname nationality birthdateSamri Jamli Algeria 23.7.1965Abdi Aldhi Algeria 23.7.1970
Abdila Aldhi Algeria 23.7.1970Abdihdi Abdila Algeria 23.7.1970Samir Karim Marocco 23.7.1970
Ali Nasire Marocco 24.3.1974Neighebouti Razki Algeria 23.7.1967
Abdlhah Abdlhdi Marocco 23.7.1970Sadaci Mohamed Marocco 23.8.1975Galesi Manim Per 23.7.1970Saadi Karimi Marocco 23.7.1973Sissmr Yamlih Albania 23.7.1970Sarim Karim Albania 23.7.1970
Chebouti Akzki Marocco 23.7.1970Samri Yamlih Algeria 23.7.1966Sadeik Sakkipei Sarajevo 23.7.1970
Note: The table presents the list of alias used over several years by an illegal immigrant arrested in the city of Bologna. Thisjudicial case is described at length by Barbagli (2008).
Figure A2: Density of cutoff points across applicants
dens
ity
08:00 09:00 10:00 11:00 12:00 13:00 14:00 15:00 16:00 17:00
cutoffs
A2
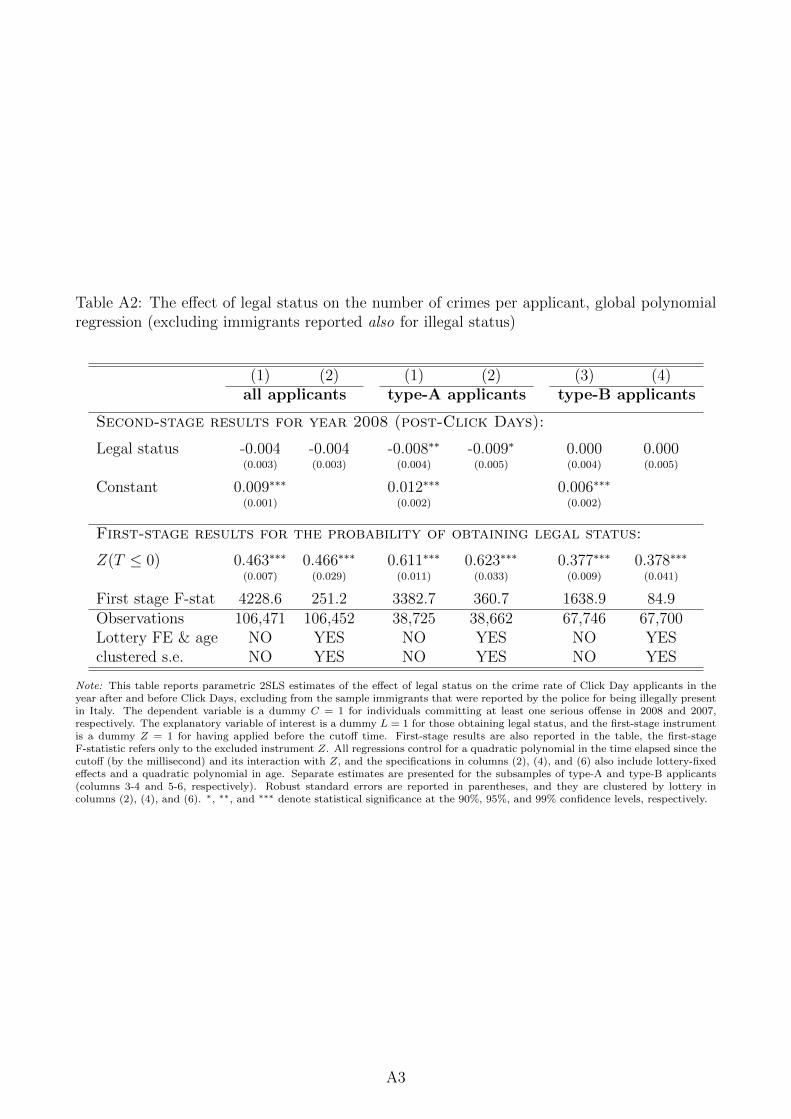
Table A2: The effect of legal status on the number of crimes per applicant, global polynomialregression (excluding immigrants reported also for illegal status)
(1) (2) (1) (2) (3) (4)all applicants type-A applicants type-B applicants
Second-stage results for year 2008 (post-Click Days):
Legal status -0.004 -0.004 -0.008∗∗ -0.009∗ 0.000 0.000(0.003) (0.003) (0.004) (0.005) (0.004) (0.005)
Constant 0.009∗∗∗ 0.012∗∗∗ 0.006∗∗∗
(0.001) (0.002) (0.002)
First-stage results for the probability of obtaining legal status:
Z(T ≤ 0) 0.463∗∗∗ 0.466∗∗∗ 0.611∗∗∗ 0.623∗∗∗ 0.377∗∗∗ 0.378∗∗∗
(0.007) (0.029) (0.011) (0.033) (0.009) (0.041)
First stage F-stat 4228.6 251.2 3382.7 360.7 1638.9 84.9Observations 106,471 106,452 38,725 38,662 67,746 67,700Lottery FE & age NO YES NO YES NO YESclustered s.e. NO YES NO YES NO YES
Note: This table reports parametric 2SLS estimates of the effect of legal status on the crime rate of Click Day applicants in theyear after and before Click Days, excluding from the sample immigrants that were reported by the police for being illegally presentin Italy. The dependent variable is a dummy C = 1 for individuals committing at least one serious offense in 2008 and 2007,respectively. The explanatory variable of interest is a dummy L = 1 for those obtaining legal status, and the first-stage instrumentis a dummy Z = 1 for having applied before the cutoff time. First-stage results are also reported in the table, the first-stageF-statistic refers only to the excluded instrument Z. All regressions control for a quadratic polynomial in the time elapsed since thecutoff (by the millisecond) and its interaction with Z, and the specifications in columns (2), (4), and (6) also include lottery-fixedeffects and a quadratic polynomial in age. Separate estimates are presented for the subsamples of type-A and type-B applicants(columns 3-4 and 5-6, respectively). Robust standard errors are reported in parentheses, and they are clustered by lottery incolumns (2), (4), and (6). ∗, ∗∗, and ∗∗∗ denote statistical significance at the 90%, 95%, and 99% confidence levels, respectively.
A3