Embed Size (px)
Citation preview
Chapter 2: Climate and Air Quality of Dutchess County
The Natural Resource Inventory of Dutchess County, NY 1
Chapter 2:
Climate and Air Quality of Dutchess County, NY _____________________________________________________________________________________
Jase Bernhardt, Victoria Kelly, Allison Chatrchyan, and Art DeGaetano1 Written October 2008. Revised October 2010.
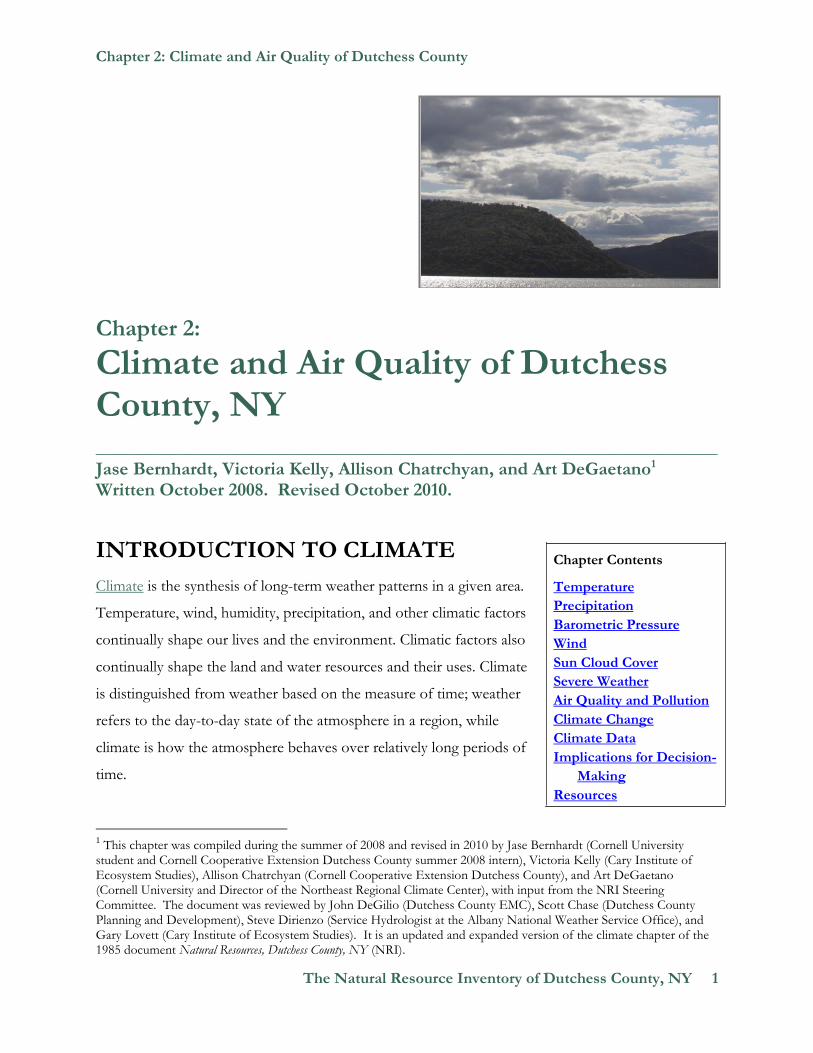
INTRODUCTION TO CLIMATE
Climate is the synthesis of long-term weather patterns in a given area.
Temperature, wind, humidity, precipitation, and other climatic factors
continually shape our lives and the environment. Climatic factors also
continually shape the land and water resources and their uses. Climate
is distinguished from weather based on the measure of time; weather
refers to the day-to-day state of the atmosphere in a region, while
climate is how the atmosphere behaves over relatively long periods of
time.
1 This chapter was compiled during the summer of 2008 and revised in 2010 by Jase Bernhardt (Cornell University
student and Cornell Cooperative Extension Dutchess County summer 2008 intern), Victoria Kelly (Cary Institute of Ecosystem Studies), Allison Chatrchyan (Cornell Cooperative Extension Dutchess County), and Art DeGaetano (Cornell University and Director of the Northeast Regional Climate Center), with input from the NRI Steering Committee. The document was reviewed by John DeGilio (Dutchess County EMC), Scott Chase (Dutchess County Planning and Development), Steve Dirienzo (Service Hydrologist at the Albany National Weather Service Office), and Gary Lovett (Cary Institute of Ecosystem Studies). It is an updated and expanded version of the climate chapter of the 1985 document Natural Resources, Dutchess County, NY (NRI).
Chapter Contents
Temperature
Precipitation
Barometric Pressure
Wind
Sun Cloud Cover
Severe Weather
Air Quality and Pollution
Climate Change
Climate Data
Implications for Decision-
Making
Resources
Chapter 2: Climate and Air Quality of Dutchess County
2 The Natural Resource Inventory of Dutchess County, NY
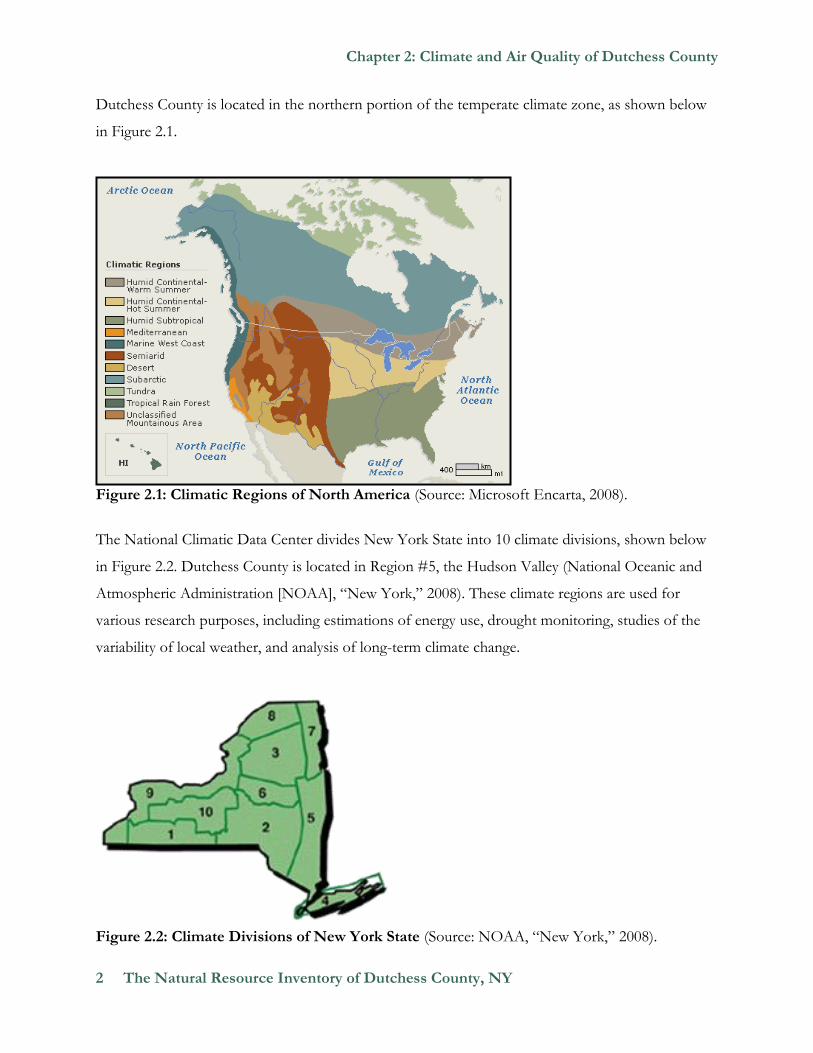
Dutchess County is located in the northern portion of the temperate climate zone, as shown below
in Figure 2.1.
Figure 2.1: Climatic Regions of North America (Source: Microsoft Encarta, 2008).
The National Climatic Data Center divides New York State into 10 climate divisions, shown below
in Figure 2.2. Dutchess County is located in Region #5, the Hudson Valley (National Oceanic and
Atmospheric Administration [NOAA], “New York,” 2008). These climate regions are used for
various research purposes, including estimations of energy use, drought monitoring, studies of the
variability of local weather, and analysis of long-term climate change.
Figure 2.2: Climate Divisions of New York State (Source: NOAA, “New York,” 2008).
Chapter 2: Climate and Air Quality of Dutchess County
The Natural Resource Inventory of Dutchess County, NY 3
Specifically, Dutchess County’s climate is humid continental, and is characterized by strong seasonal
contrasts and highly variable weather. Major storm systems, which move through the continental
United States or up the nearby Atlantic Coast, have a significant impact on the weather, especially
during the fall, winter, and spring months. These systems provide ample precipitation for the region,
supplemented by tropical, maritime air masses during parts of the summer. Polar air masses from
Canada move southeast into the area and strongly influence winters (New York State Climatologist,
2008).
The relatively close proximity of Dutchess County to the Atlantic Ocean can have a moderating
influence on the climate. The large-scale atmospheric circulation normally dominates the flow
pattern near the surface. However, in the absence of strong circulation, the Atlantic can have a
considerable effect on the local weather patterns, leading to relatively milder winter days and cooler
days in the summer. In addition, the area generally has a slightly longer freeze-free season than
places at similar latitudes farther inland, due to this moderating influence from the ocean.
Moderate temperatures and sufficient precipitation make Dutchess County an excellent location for
farming, while seasonal variations help to attract tourists and recreational users. The county's
relatively hot summers and cold winters result in substantial heating and cooling costs for homes
and businesses.
TEMPERATURE
Temperature is a measure of the internal energy that a substance contains (NOAA, “NWS
Glossary,” 2008). The county’s mean annual temperatures for the meteorological winter (December,
January, and February) and meteorological summer (June, July, and August) are 27.3 and 69.5
degrees Fahrenheit, respectively. The highest and lowest temperatures ever reported at
Poughkeepsie were 107 degrees in July 1966 and 21 degrees below zero in February 1897. The mean
annual temperature of Poughkeepsie (48.8 degrees) and six major cities within 150 miles of Dutchess
County are shown below (Figure 2.3), based on 30-year data from 1971-2000 (Northeast Regional
Climate Center [NRCC], 2008).

Chapter 2: Climate and Air Quality of Dutchess County
4 The Natural Resource Inventory of Dutchess County, NY
Figure 2.3: Mean Annual Temperature of Poughkeepsie and Nearby Cities (Source: NRCC, “CLIMOD System,” 2008).
Temperatures at any one place in Dutchess County normally exceed 90 degrees Fahrenheit between
5 and 15 times during the summer. It is uncommon for air temperature to reach triple digits,
occurring in Poughkeepsie roughly once every five years (NRCC, “CLIMOD System,” 2008).
However, hot temperatures combined with high summer humidity can lead to days that feel much
hotter. The heat index is the combination of the dew point temperature (the amount of moisture in
the air) and the air temperature, and measures how hot it actually feels (NOAA, “NWS Glossary,”
2008). Nearly every summer in the county features one or more hot spells with high temperatures
and high humidity leading to extremely uncomfortable conditions. On average, temperatures fall
below zero degrees 5 to 10 times during the winter, primarily in January and February. During
milder winters, temperatures may not drop into negative territory.
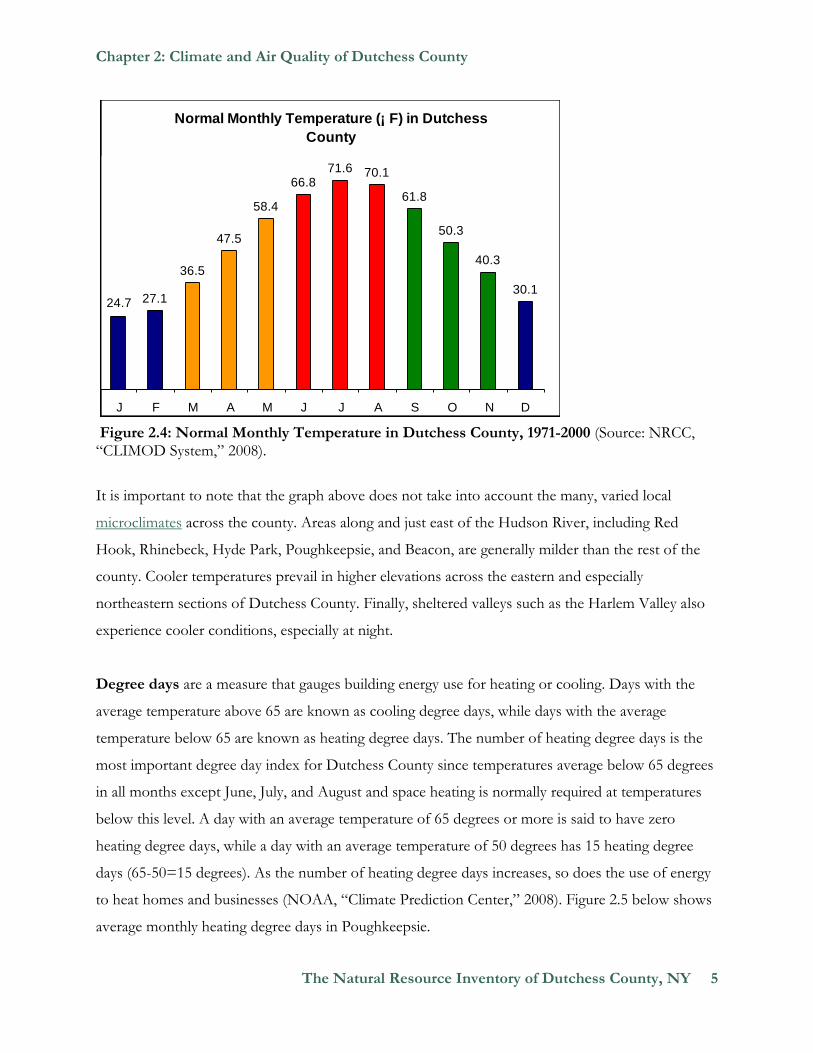
Figure 2.4 below shows the mean monthly temperatures in Dutchess County. The numbers are
based on the average data collected at the three principal reporting stations in the county; Glenham,
Millbrook, and Poughkeepsie/ Dutchess County Airport. The monthly temperature at each
individual station, as well as the coordinates and elevation of all stations in Dutchess County, can be
found later in this chapter.
Chapter 2: Climate and Air Quality of Dutchess County
The Natural Resource Inventory of Dutchess County, NY 5
Figure 2.4: Normal Monthly Temperature in Dutchess County, 1971-2000 (Source: NRCC, “CLIMOD System,” 2008).
It is important to note that the graph above does not take into account the many, varied local
microclimates across the county. Areas along and just east of the Hudson River, including Red
Hook, Rhinebeck, Hyde Park, Poughkeepsie, and Beacon, are generally milder than the rest of the
county. Cooler temperatures prevail in higher elevations across the eastern and especially
northeastern sections of Dutchess County. Finally, sheltered valleys such as the Harlem Valley also
experience cooler conditions, especially at night.
Degree days are a measure that gauges building energy use for heating or cooling. Days with the
average temperature above 65 are known as cooling degree days, while days with the average
temperature below 65 are known as heating degree days. The number of heating degree days is the
most important degree day index for Dutchess County since temperatures average below 65 degrees
in all months except June, July, and August and space heating is normally required at temperatures
below this level. A day with an average temperature of 65 degrees or more is said to have zero
heating degree days, while a day with an average temperature of 50 degrees has 15 heating degree
days (65-50=15 degrees). As the number of heating degree days increases, so does the use of energy
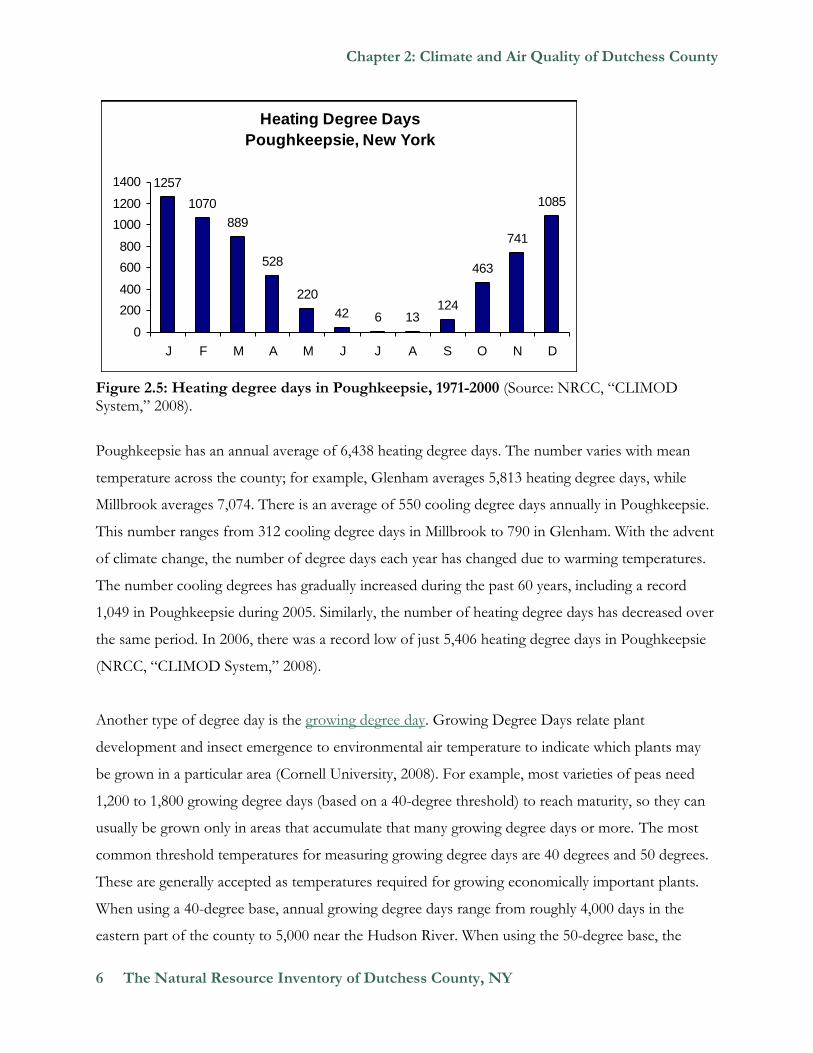
to heat homes and businesses (NOAA, “Climate Prediction Center,” 2008). Figure 2.5 below shows
average monthly heating degree days in Poughkeepsie.
Normal Monthly Temperature (¡ F) in Dutchess
County
27.1
36.5
47.5
58.4
66.871.6 70.1
61.8
50.3
40.3
30.124.7
J F M A M J J A S O N D
Chapter 2: Climate and Air Quality of Dutchess County
6 The Natural Resource Inventory of Dutchess County, NY
Figure 2.5: Heating degree days in Poughkeepsie, 1971-2000 (Source: NRCC, “CLIMOD System,” 2008).
Poughkeepsie has an annual average of 6,438 heating degree days. The number varies with mean
temperature across the county; for example, Glenham averages 5,813 heating degree days, while
Millbrook averages 7,074. There is an average of 550 cooling degree days annually in Poughkeepsie.
This number ranges from 312 cooling degree days in Millbrook to 790 in Glenham. With the advent
of climate change, the number of degree days each year has changed due to warming temperatures.
The number cooling degrees has gradually increased during the past 60 years, including a record
1,049 in Poughkeepsie during 2005. Similarly, the number of heating degree days has decreased over
the same period. In 2006, there was a record low of just 5,406 heating degree days in Poughkeepsie
(NRCC, “CLIMOD System,” 2008).
Another type of degree day is the growing degree day. Growing Degree Days relate plant
development and insect emergence to environmental air temperature to indicate which plants may
be grown in a particular area (Cornell University, 2008). For example, most varieties of peas need
1,200 to 1,800 growing degree days (based on a 40-degree threshold) to reach maturity, so they can
usually be grown only in areas that accumulate that many growing degree days or more. The most
common threshold temperatures for measuring growing degree days are 40 degrees and 50 degrees.
These are generally accepted as temperatures required for growing economically important plants.
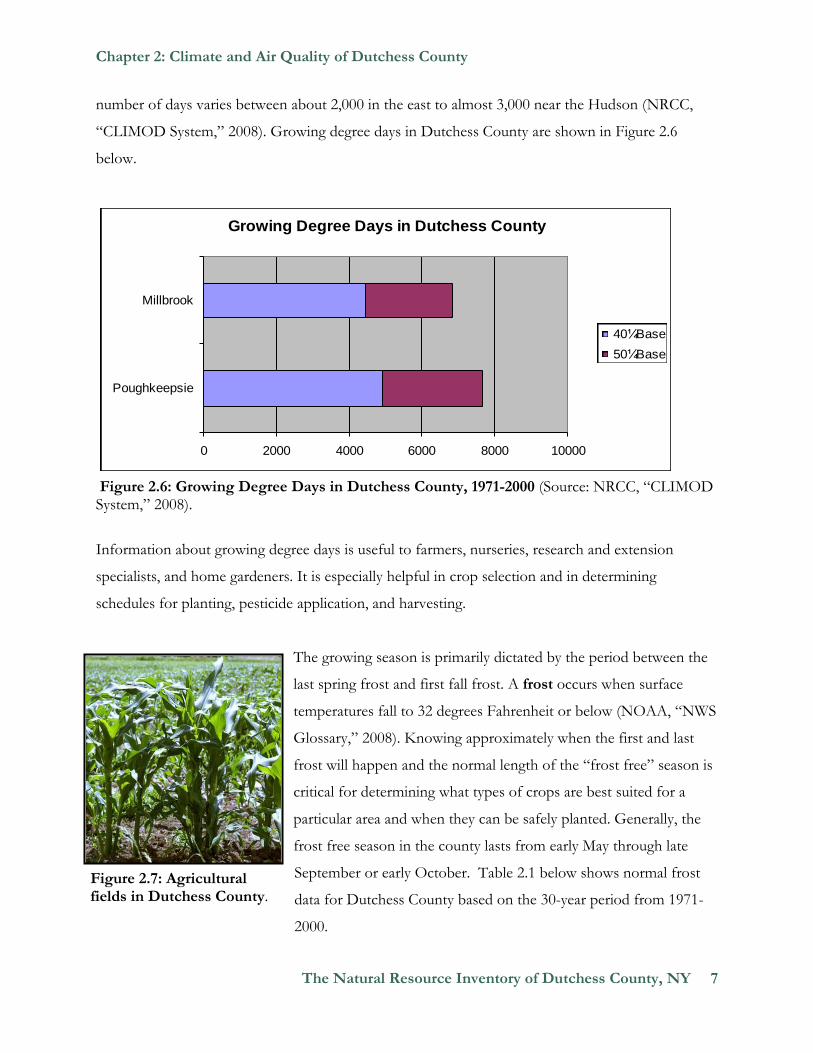
When using a 40-degree base, annual growing degree days range from roughly 4,000 days in the
eastern part of the county to 5,000 near the Hudson River. When using the 50-degree base, the
Heating Degree Days
Poughkeepsie, New York
1257
1070
889
528
220
42 6 13124
463
741
1085
0
200
400
600
800
1000
1200
1400
J F M A M J J A S O N D
Chapter 2: Climate and Air Quality of Dutchess County
The Natural Resource Inventory of Dutchess County, NY 7
number of days varies between about 2,000 in the east to almost 3,000 near the Hudson (NRCC,
“CLIMOD System,” 2008). Growing degree days in Dutchess County are shown in Figure 2.6
below.
Figure 2.6: Growing Degree Days in Dutchess County, 1971-2000 (Source: NRCC, “CLIMOD System,” 2008).
Information about growing degree days is useful to farmers, nurseries, research and extension
specialists, and home gardeners. It is especially helpful in crop selection and in determining
schedules for planting, pesticide application, and harvesting.
The growing season is primarily dictated by the period between the
last spring frost and first fall frost. A frost occurs when surface
temperatures fall to 32 degrees Fahrenheit or below (NOAA, “NWS
Glossary,” 2008). Knowing approximately when the first and last
frost will happen and the normal length of the “frost free” season is
critical for determining what types of crops are best suited for a
particular area and when they can be safely planted. Generally, the
frost free season in the county lasts from early May through late
September or early October. Table 2.1 below shows normal frost
data for Dutchess County based on the 30-year period from 1971-
2000.
Growing Degree Days in Dutchess County
0 2000 4000 6000 8000 10000
Poughkeepsie
Millbrook
40¼ Base
50¼ Base
Figure 2.7: Agricultural fields in Dutchess County.
Chapter 2: Climate and Air Quality of Dutchess County
8 The Natural Resource Inventory of Dutchess County, NY
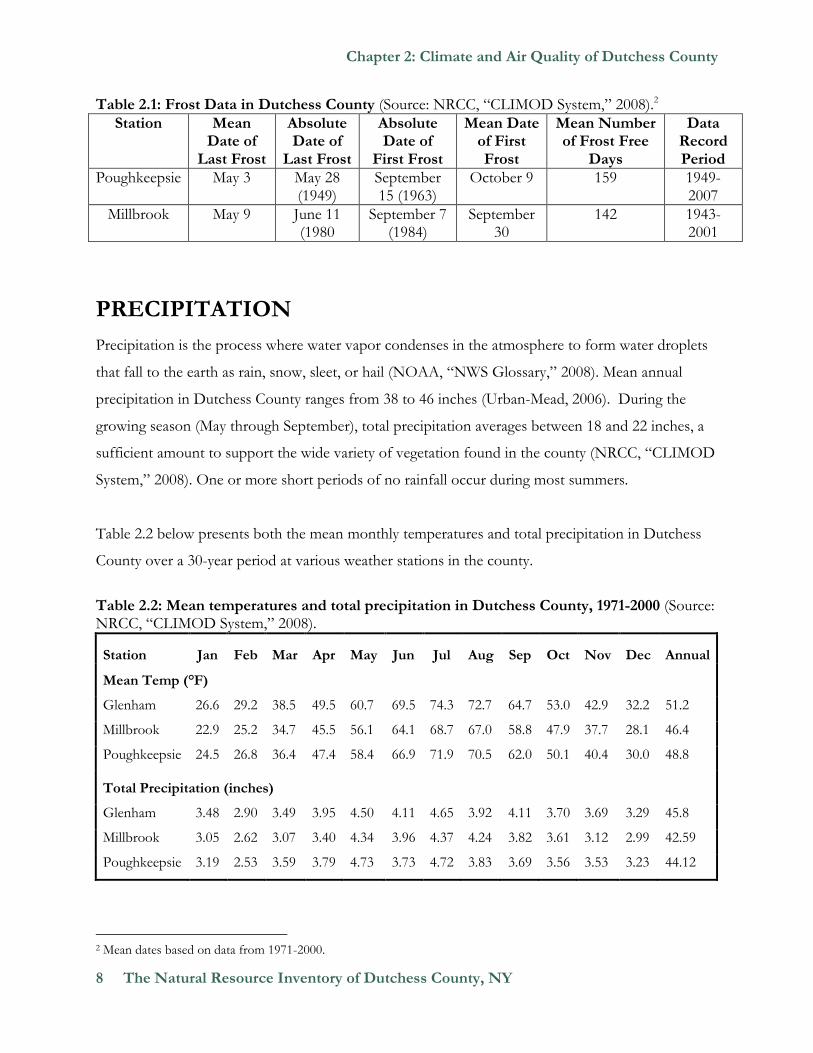
Table 2.1: Frost Data in Dutchess County (Source: NRCC, “CLIMOD System,” 2008).2
Station Mean Date of
Last Frost
Absolute Date of
Last Frost
Absolute Date of
First Frost
Mean Date of First Frost
Mean Number of Frost Free
Days
Data Record Period
Poughkeepsie May 3 May 28 (1949)
September 15 (1963)
October 9 159 1949-2007
Millbrook May 9 June 11 (1980
September 7 (1984)
September 30
142 1943-2001
PRECIPITATION
Precipitation is the process where water vapor condenses in the atmosphere to form water droplets
that fall to the earth as rain, snow, sleet, or hail (NOAA, “NWS Glossary,” 2008). Mean annual
precipitation in Dutchess County ranges from 38 to 46 inches (Urban-Mead, 2006). During the
growing season (May through September), total precipitation averages between 18 and 22 inches, a
sufficient amount to support the wide variety of vegetation found in the county (NRCC, “CLIMOD
System,” 2008). One or more short periods of no rainfall occur during most summers.
Table 2.2 below presents both the mean monthly temperatures and total precipitation in Dutchess
County over a 30-year period at various weather stations in the county.
Table 2.2: Mean temperatures and total precipitation in Dutchess County, 1971-2000 (Source: NRCC, “CLIMOD System,” 2008).
Station Jan Feb Mar Apr May Jun Jul Aug Sep Oct Nov Dec Annual
Mean Temp (°F)
Glenham 26.6 29.2 38.5 49.5 60.7 69.5 74.3 72.7 64.7 53.0 42.9 32.2 51.2
Millbrook 22.9 25.2 34.7 45.5 56.1 64.1 68.7 67.0 58.8 47.9 37.7 28.1 46.4
Poughkeepsie 24.5 26.8 36.4 47.4 58.4 66.9 71.9 70.5 62.0 50.1 40.4 30.0 48.8
Total Precipitation (inches)
Glenham 3.48 2.90 3.49 3.95 4.50 4.11 4.65 3.92 4.11 3.70 3.69 3.29 45.8
Millbrook 3.05 2.62 3.07 3.40 4.34 3.96 4.37 4.24 3.82 3.61 3.12 2.99 42.59
Poughkeepsie 3.19 2.53 3.59 3.79 4.73 3.73 4.72 3.83 3.69 3.56 3.53 3.23 44.12
2 Mean dates based on data from 1971-2000.
Chapter 2: Climate and Air Quality of Dutchess County
The Natural Resource Inventory of Dutchess County, NY 9
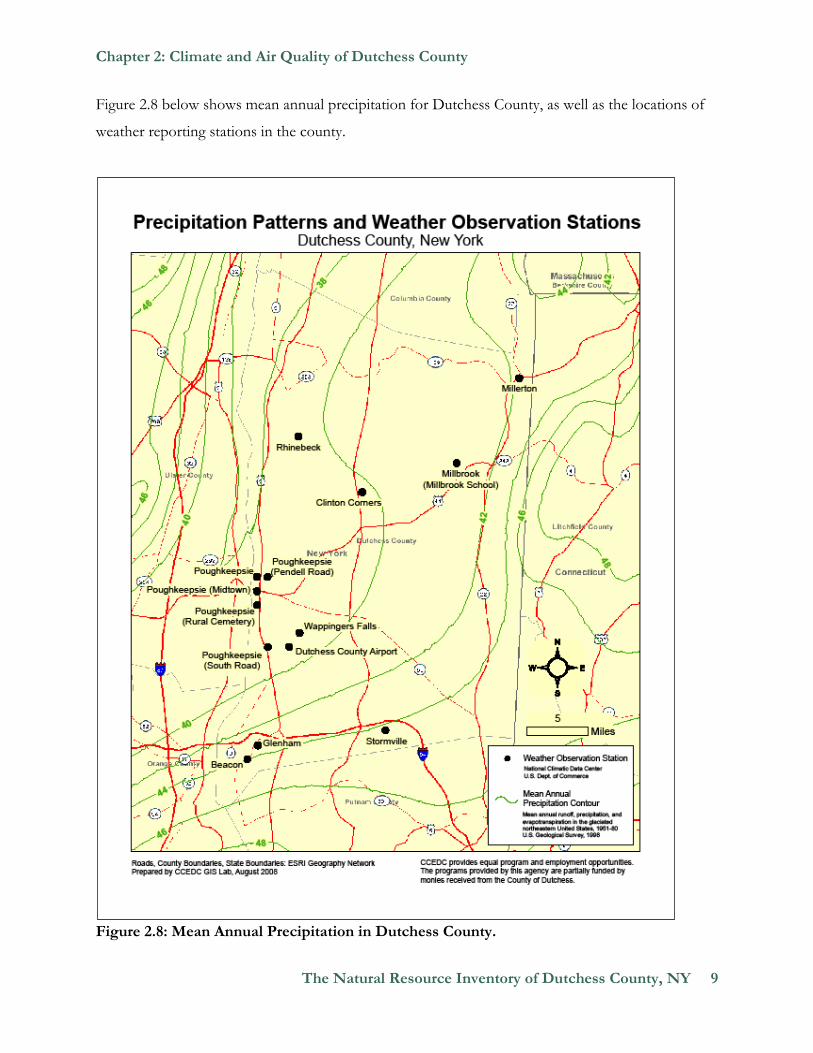
Figure 2.8 below shows mean annual precipitation for Dutchess County, as well as the locations of
weather reporting stations in the county.
Figure 2.8: Mean Annual Precipitation in Dutchess County.
Chapter 2: Climate and Air Quality of Dutchess County
10 The Natural Resource Inventory of Dutchess County, NY
The significant differences in precipitation between various parts of the county can primarily be
attributed to the topographical profile of the region. The eastern half of Dutchess County receives
the most rain due to its higher elevation on the uphill slopes of the Taconic Mountains. As the
prevailing northerly and westerly winds reach this area, air is forced upward. As the air rises, it
expands and cools. The cooler air cannot hold as much moisture, so the relative humidity increases,
leading to the formation of clouds and precipitation. During large storms, total rain or snow will
often be greater in these areas due to this effect. The Hudson Highlands have a similar impact on
the extreme southern portions of the county. The opposite effect causes lower precipitation in
northwestern Dutchess County. As air is transported over the Catskill Mountains, it sinks on the
down sloping side of the mountains. Sinking air warms and loses moisture, which lowers relative
humidity and leads to dry conditions. A rain or snow “shadow” can often be observed in these areas
during major storms, resulting in considerably less precipitation.
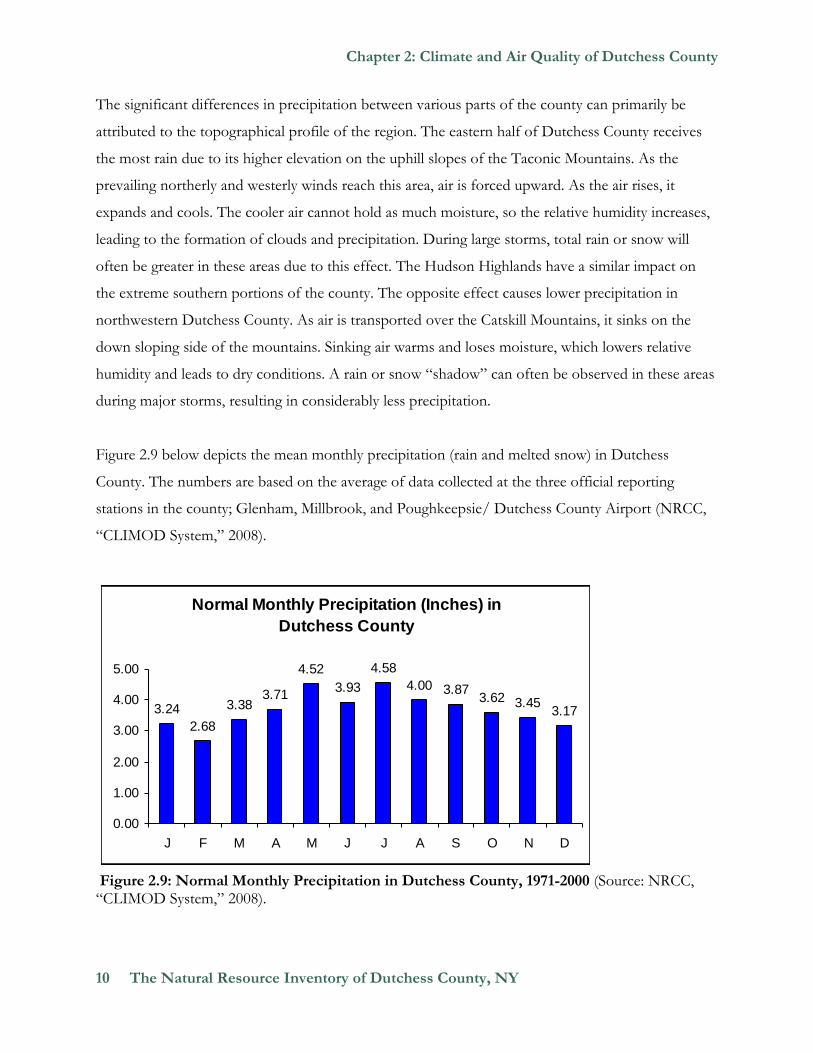
Figure 2.9 below depicts the mean monthly precipitation (rain and melted snow) in Dutchess
County. The numbers are based on the average of data collected at the three official reporting
stations in the county; Glenham, Millbrook, and Poughkeepsie/ Dutchess County Airport (NRCC,
“CLIMOD System,” 2008).
Figure 2.9: Normal Monthly Precipitation in Dutchess County, 1971-2000 (Source: NRCC, “CLIMOD System,” 2008).
Normal Monthly Precipitation (Inches) in
Dutchess County
3.24
2.68
3.383.71
4.52
3.93
4.58
4.00 3.873.62 3.45
3.17
0.00
1.00
2.00
3.00
4.00
5.00
J F M A M J J A S O N D
Chapter 2: Climate and Air Quality of Dutchess County
The Natural Resource Inventory of Dutchess County, NY 11
Much of the precipitation in the northeastern United States comes from the Gulf of Mexico and the
Atlantic Ocean, and is transported by major atmospheric storm systems. These systems develop less
frequently during the summer, but local convective activity in the form of thunderstorms produces
significant amounts of summer rain. Local topographic variations also influence precipitation.
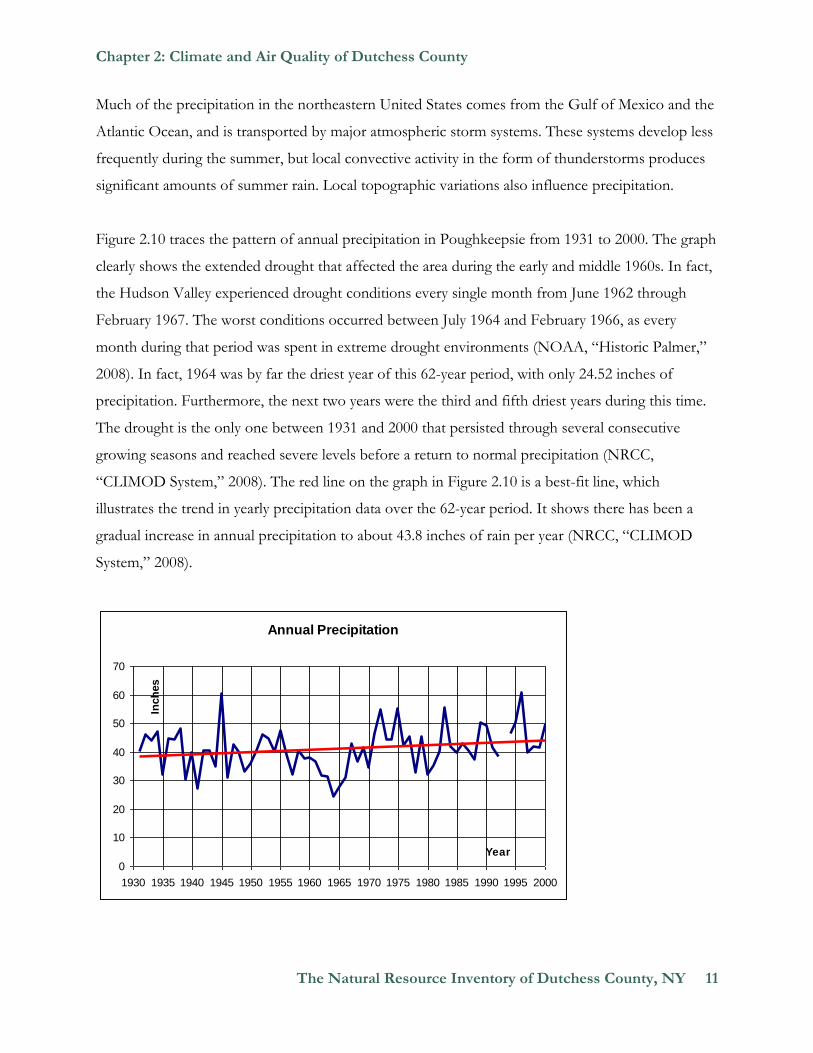
Figure 2.10 traces the pattern of annual precipitation in Poughkeepsie from 1931 to 2000. The graph
clearly shows the extended drought that affected the area during the early and middle 1960s. In fact,
the Hudson Valley experienced drought conditions every single month from June 1962 through
February 1967. The worst conditions occurred between July 1964 and February 1966, as every
month during that period was spent in extreme drought environments (NOAA, “Historic Palmer,”
2008). In fact, 1964 was by far the driest year of this 62-year period, with only 24.52 inches of
precipitation. Furthermore, the next two years were the third and fifth driest years during this time.
The drought is the only one between 1931 and 2000 that persisted through several consecutive
growing seasons and reached severe levels before a return to normal precipitation (NRCC,
“CLIMOD System,” 2008). The red line on the graph in Figure 2.10 is a best-fit line, which
illustrates the trend in yearly precipitation data over the 62-year period. It shows there has been a
gradual increase in annual precipitation to about 43.8 inches of rain per year (NRCC, “CLIMOD
System,” 2008).
Annual Precipitation
0
10
20
30
40
50
60
70
1930 1935 1940 1945 1950 1955 1960 1965 1970 1975 1980 1985 1990 1995 2000
Year
Inch
es
Chapter 2: Climate and Air Quality of Dutchess County
12 The Natural Resource Inventory of Dutchess County, NY
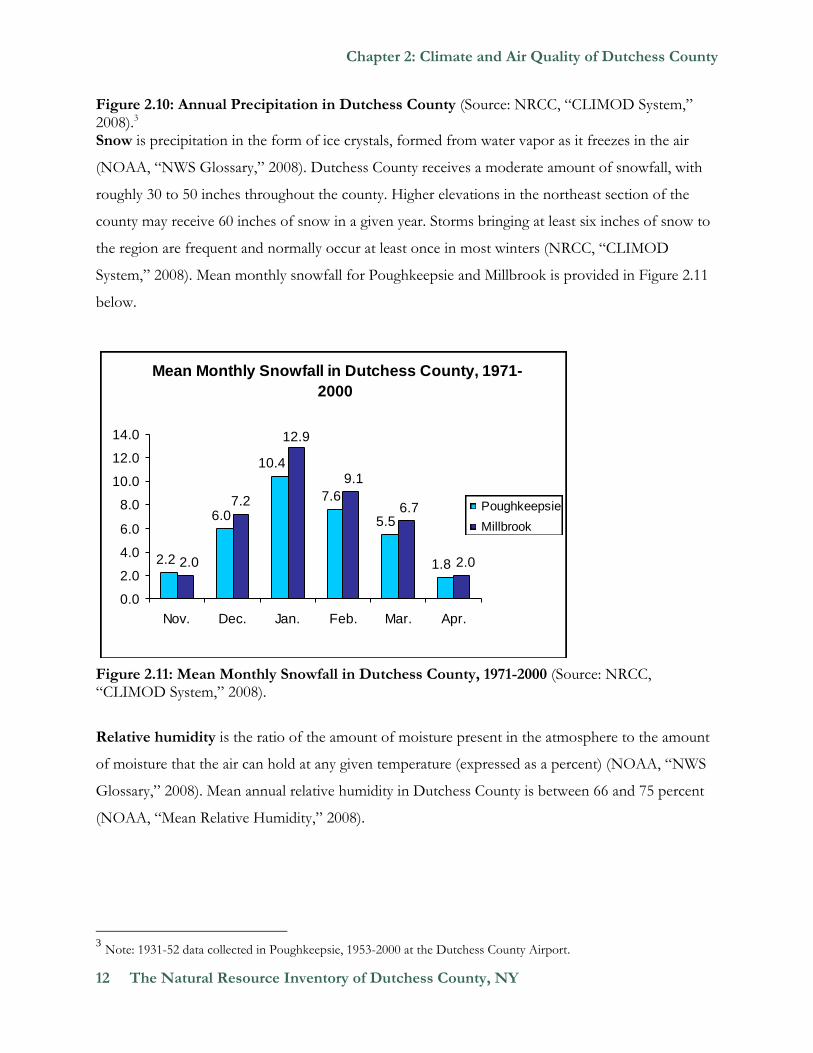
Figure 2.10: Annual Precipitation in Dutchess County (Source: NRCC, “CLIMOD System,” 2008).3 Snow is precipitation in the form of ice crystals, formed from water vapor as it freezes in the air
(NOAA, “NWS Glossary,” 2008). Dutchess County receives a moderate amount of snowfall, with
roughly 30 to 50 inches throughout the county. Higher elevations in the northeast section of the
county may receive 60 inches of snow in a given year. Storms bringing at least six inches of snow to
the region are frequent and normally occur at least once in most winters (NRCC, “CLIMOD
System,” 2008). Mean monthly snowfall for Poughkeepsie and Millbrook is provided in Figure 2.11
below.
Figure 2.11: Mean Monthly Snowfall in Dutchess County, 1971-2000 (Source: NRCC, “CLIMOD System,” 2008).
Relative humidity is the ratio of the amount of moisture present in the atmosphere to the amount
of moisture that the air can hold at any given temperature (expressed as a percent) (NOAA, “NWS
Glossary,” 2008). Mean annual relative humidity in Dutchess County is between 66 and 75 percent
(NOAA, “Mean Relative Humidity,” 2008).
3 Note: 1931-52 data collected in Poughkeepsie, 1953-2000 at the Dutchess County Airport.
Mean Monthly Snowfall in Dutchess County, 1971-
2000
7.2
1.8
5.5
7.6
10.4
6.0
2.2 2.0
6.7
12.9
9.1
2.0
0.0
2.0
4.0
6.0
8.0
10.0
12.0
14.0
Nov. Dec. Jan. Feb. Mar. Apr.
Poughkeepsie
Millbrook
Chapter 2: Climate and Air Quality of Dutchess County
The Natural Resource Inventory of Dutchess County, NY 13
BAROMETRIC PRESSURE
Pressure is the exertion of force upon a surface by a fluid in contact with it. Atmospheric pressure
refers to the pressure the atmosphere exerts on the Earth’s surface (NOAA, “NWS Glossary,”
2008). Surface barometric pressure measurements are usually converted to mean sea level pressure,
which standardizes the observation so that pressure can be measured on the same scale regardless of
altitude. This conversion is done to make pressure readings a useful weather and climate tool.
Otherwise, barometric pressure readings at a high elevation location such as Denver, Colorado
would always be lower than the readings at locations near or at sea level. The mean annual pressure
in Dutchess County is about 1017 millibars, or 30.04 inches of mercury (NOAA, “Annual Mean Sea
Level Pressure,” 2008). The lowest pressure in the county normally occurs during violent weather
such as severe thunderstorms and coastal storms. The highest pressure is observed when large high-
pressure areas move over the region, bringing fair weather and low humidity. Differences in pressure
cause winds in the atmosphere and the sharper the change in pressure is over a given distance, the
stronger the winds will be.
WIND
Wind is the horizontal motion of air past a given point. It is caused by differences in air pressure and
can also be affected by heating differences of the air and the physical profile of the earth’s surface
(NOAA, “NWS Glossary,” 2008). Northerly and westerly winds dominate Dutchess County at an
average annual velocity of 5.4 miles per hour (MPH). Winds are usually strongest during the winter
and early spring, averaging 6-7 MPH. During the summer months, winds are weaker, on the order of
4-4.5 MPH, and have more of a southerly component (NRCC, “Wind Summary for Dutchess
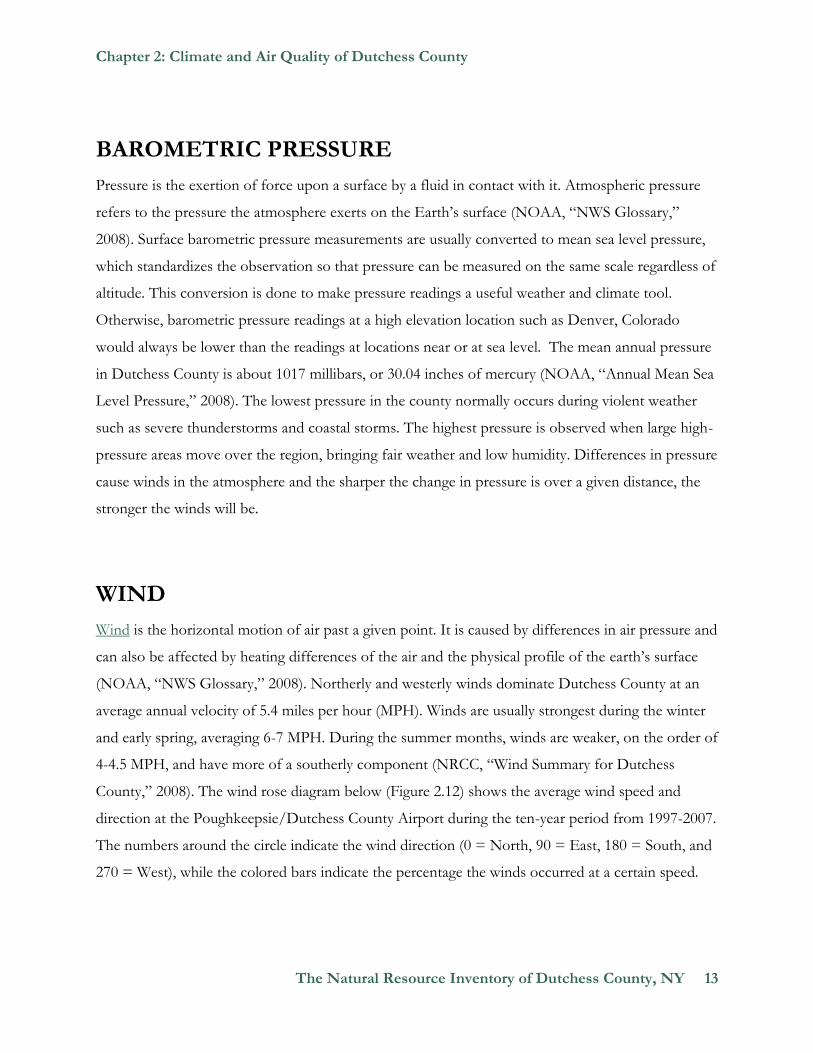
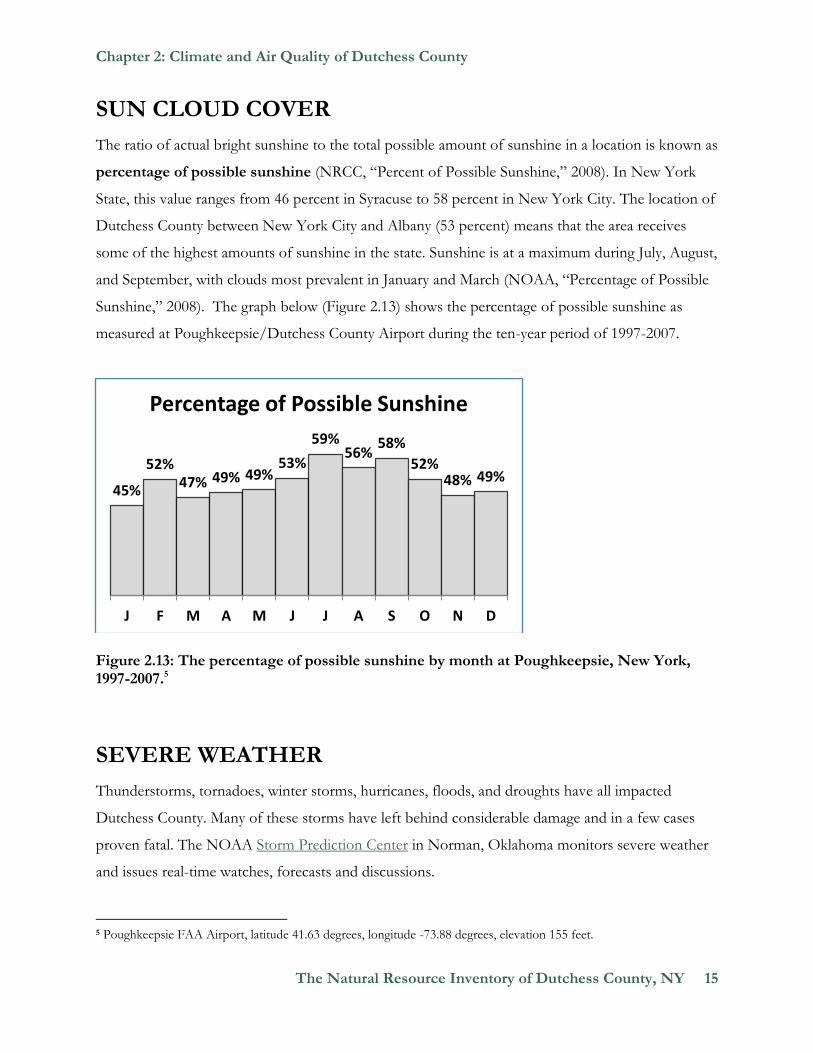
County,” 2008). The wind rose diagram below (Figure 2.12) shows the average wind speed and
direction at the Poughkeepsie/Dutchess County Airport during the ten-year period from 1997-2007.
The numbers around the circle indicate the wind direction (0 = North, 90 = East, 180 = South, and
270 = West), while the colored bars indicate the percentage the winds occurred at a certain speed.
Chapter 2: Climate and Air Quality of Dutchess County
14 The Natural Resource Inventory of Dutchess County, NY
Figure 2.12: Wind Rose for Poughkeepsie, New York, 1997-2007.4
Under normal atmospheric conditions, winds are strongest during the day and weaken as the sun
sets and daytime heating is lost. Severe winds are rare in Dutchess County. Most high wind events
are caused by localized, quick-moving severe thunderstorms. Longer, more widespread wind events
occur occasionally and are due to larger mid-latitude cyclones such as nor’easters.
The strongest and most frequent winds generally come from the west because Dutchess County is
located in the westerly wind belt, which can be found at the middle latitudes of the earth. The
westerlies are just one of the components of global circulation patterns.
4 V. Kelly. Wind Rose created from data from the Poughkeepsie FAA Airport, latitude 41.63 degrees, longitude -73.88 degrees, elevation 155 feet.
0
45
90
135
180
225
270
315
22.5
67.5
112.5
157.5202.5
247.5
292.5
337.5
0% 4% 8% 12% 16%2% 6% 10% 14%
Wind Speeds (mph)
>2 - 5
>5 - 10
>10 - 15
>15
Chapter 2: Climate and Air Quality of Dutchess County
The Natural Resource Inventory of Dutchess County, NY 15
SUN CLOUD COVER
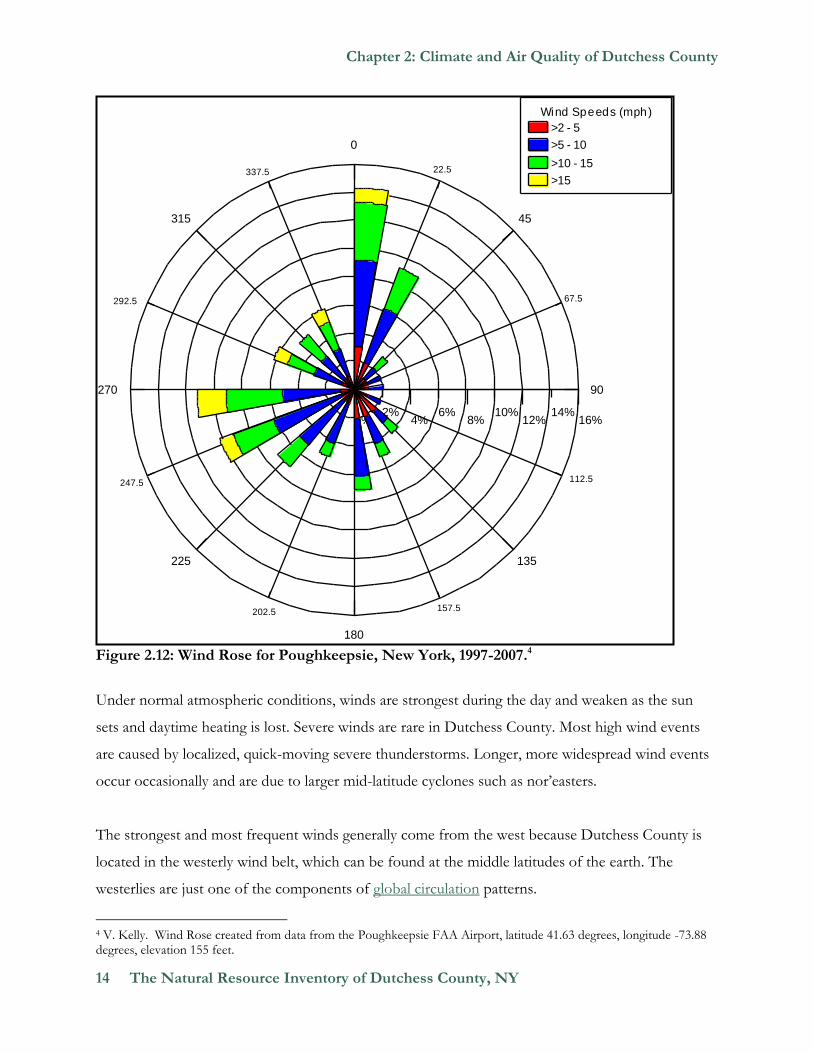
The ratio of actual bright sunshine to the total possible amount of sunshine in a location is known as
percentage of possible sunshine (NRCC, “Percent of Possible Sunshine,” 2008). In New York
State, this value ranges from 46 percent in Syracuse to 58 percent in New York City. The location of
Dutchess County between New York City and Albany (53 percent) means that the area receives
some of the highest amounts of sunshine in the state. Sunshine is at a maximum during July, August,
and September, with clouds most prevalent in January and March (NOAA, “Percentage of Possible
Sunshine,” 2008). The graph below (Figure 2.13) shows the percentage of possible sunshine as
measured at Poughkeepsie/Dutchess County Airport during the ten-year period of 1997-2007.
Figure 2.13: The percentage of possible sunshine by month at Poughkeepsie, New York, 1997-2007.5
SEVERE WEATHER
Thunderstorms, tornadoes, winter storms, hurricanes, floods, and droughts have all impacted
Dutchess County. Many of these storms have left behind considerable damage and in a few cases
proven fatal. The NOAA Storm Prediction Center in Norman, Oklahoma monitors severe weather
and issues real-time watches, forecasts and discussions.
5 Poughkeepsie FAA Airport, latitude 41.63 degrees, longitude -73.88 degrees, elevation 155 feet.
45%
52% 47% 49% 49%
53%
59% 56%
58%
52% 48% 49%
J F M A M J J A S O N D
Percentage of Possible Sunshine
Chapter 2: Climate and Air Quality of Dutchess County
16 The Natural Resource Inventory of Dutchess County, NY
Thunderstorms are relatively common in Dutchess County, primarily during the fall, spring and
summer. Thunderstorms can be accompanied by lightning, hail, torrential rains, violent winds, and
tornadoes. The time of greatest occurrence for severe thunderstorms is during the late spring and
summer. The National Weather Service defines a thunderstorm as severe if it produces at least one
of the following: 1) winds of at least 58 miles per hour, 2) hail at least ¾ inch in diameter, or 3) a
tornado. The National Weather Service issues a severe thunderstorm warning if severe
thunderstorms are imminent or occurring. Additionally, a severe thunderstorm watch is issued
when severe weather is possible but not yet occurring (The Weather Channel, 2008). Between 1955
and 2007 there were 71 large hail (at least ¾ inch diameter) events in Dutchess County, or about one
to two per year (NOAA, “NCDC Storm Events,” 2008). Thunderstorms are also capable of
producing urban and small stream flooding, uprooting trees, widespread power outages, and damage
to structures.
A tornado is a rotating column of air with a circulation reaching the ground (NOAA, “NWS
Glossary,” 2008). The intensity of tornadoes is measured by the Fujita Scale, with an F0 being the
weakest and F5 the strongest. An update to the old Fujita Scale, the Enhanced Fujita Scale, was
implemented in 2007. Tornadoes are rare but not unheard of in New York State. A total of 11
tornadoes have been reported in Dutchess County since 1950 (NOAA, “NCDC Storm Events,”
2008). All of the tornadoes have been either an F0 or Fl on the Fujita Scale, causing light to
moderate damage with winds of up to 112 miles per hour (NOAA, “Storm Prediction Center,”
2008). The National Weather Service issues a tornado warning if Doppler radar indicates the
presence of a tornado or if a spotter has sighted one. Additionally, a tornado watch is issued if
conditions are favorable for the development of tornadoes (Florida Division of Emergency
Management, 2008).
A variety of winter storms can affect Dutchess County. Heavy snowstorms bringing several inches
of snow are common. True blizzard conditions in the area are extremely rare since they require
strong winds of at least 35 miles per hour and extreme blowing and drifting of the snow (NOAA,
“NWS Glossary,” 2008). Storms occurring with mixed precipitation often wreak havoc on Dutchess
County. Rain, snow, sleet, and freezing rain may all occur as part of the same storm system.
Freezing rain, rain that freezes on contact with the ground (NOAA, “NWS Glossary,” 2008), is
especially problematic, as it can lead to icy roads as well as downed trees and power lines, which may
Chapter 2: Climate and Air Quality of Dutchess County
The Natural Resource Inventory of Dutchess County, NY 17
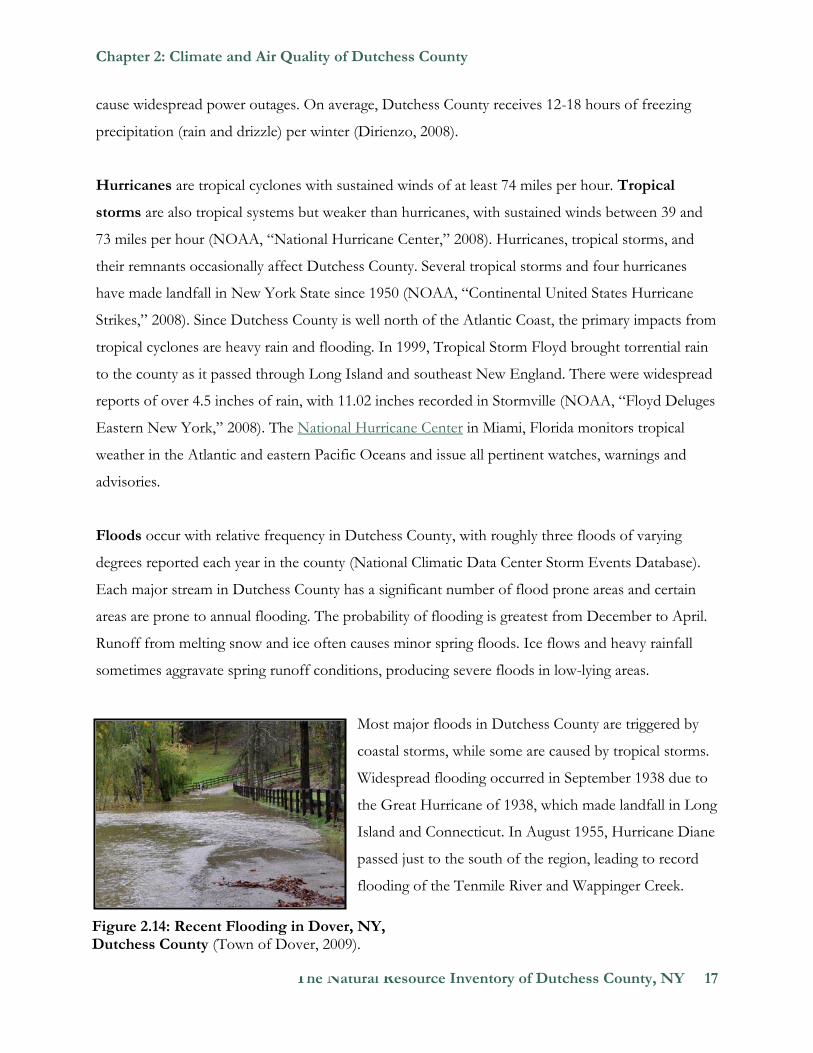
Figure 2.14: Recent Flooding in Dover, NY, Dutchess County (Town of Dover, 2009).
cause widespread power outages. On average, Dutchess County receives 12-18 hours of freezing
precipitation (rain and drizzle) per winter (Dirienzo, 2008).
Hurricanes are tropical cyclones with sustained winds of at least 74 miles per hour. Tropical
storms are also tropical systems but weaker than hurricanes, with sustained winds between 39 and
73 miles per hour (NOAA, “National Hurricane Center,” 2008). Hurricanes, tropical storms, and
their remnants occasionally affect Dutchess County. Several tropical storms and four hurricanes
have made landfall in New York State since 1950 (NOAA, “Continental United States Hurricane
Strikes,” 2008). Since Dutchess County is well north of the Atlantic Coast, the primary impacts from
tropical cyclones are heavy rain and flooding. In 1999, Tropical Storm Floyd brought torrential rain
to the county as it passed through Long Island and southeast New England. There were widespread
reports of over 4.5 inches of rain, with 11.02 inches recorded in Stormville (NOAA, “Floyd Deluges
Eastern New York,” 2008). The National Hurricane Center in Miami, Florida monitors tropical
weather in the Atlantic and eastern Pacific Oceans and issue all pertinent watches, warnings and
advisories.
Floods occur with relative frequency in Dutchess County, with roughly three floods of varying
degrees reported each year in the county (National Climatic Data Center Storm Events Database).
Each major stream in Dutchess County has a significant number of flood prone areas and certain
areas are prone to annual flooding. The probability of flooding is greatest from December to April.
Runoff from melting snow and ice often causes minor spring floods. Ice flows and heavy rainfall
sometimes aggravate spring runoff conditions, producing severe floods in low-lying areas.
Most major floods in Dutchess County are triggered by
coastal storms, while some are caused by tropical storms.
Widespread flooding occurred in September 1938 due to
the Great Hurricane of 1938, which made landfall in Long
Island and Connecticut. In August 1955, Hurricane Diane
passed just to the south of the region, leading to record
flooding of the Tenmile River and Wappinger Creek.
Chapter 2: Climate and Air Quality of Dutchess County
18 The Natural Resource Inventory of Dutchess County, NY
Severe nor’easters may also produce floods in the county. In April 2007, an area of low pressure
intensified rapidly as it moved from the southern Appalachians to the Long Island coast. The storm
brought two days of heavy precipitation, which brought about extensive flooding of small streams
and creeks in the county. Record flooding occurred on the Wappinger Creek at Wappingers Falls,
which crested at 15.06 feet, 7.06 feet above the flood stage of 8.0 feet. Moderate flooding was also
recorded along the Ten Mile River at Webatuck, which crested at 11.23 feet. The storm produced
three to eight inches of rain throughout the county, including 4.99 inches in Poughkeepsie and 6.83
inches in Rhinebeck (NOAA, “Past Storm Events,” 2008).
Flash flooding is a rapid water level rise in a stream or creek above a predetermined flood level
(NOAA, “NWS Glossary,” 2008). Flash floods can occur any time of year in Dutchess County. On
average, there are about ten days a year when at least one inch of rain falls (NRCC, “CLIMOD
System,” 2008). These days are most common between May and October, and the rain usually
occurs because of strong thunderstorms which can often lead to flash flooding. Rapid snowmelt in
association with strong precipitation events may also lead to flash flooding during the late winter and
early spring.
A drought is a deficiency in moisture that results in adverse effects on people, animals, or
vegetation over a sizeable area (NOAA, “NWS Glossary,” 2008). The county's major drainage basins
have sufficient capacity to sustain some flow even during severe droughts, such as the
aforementioned drought from 1962-1967. For a period of 29 months between May 1964 and
September 1966, the lowest Palmer Drought Severity Index (PDSI) value was -6.66 in November
1964. Serious droughts are rare; brief dry spells are far more common. Dry periods temporarily
place crops under stress and often force restrictions in the recreational uses of forested lands
because of fire hazards. Mandatory or volunteer water restrictions may also be put in place by local
municipalities. Further information about droughts can be found on the Northeast Regional Climate
Center’s Northeast Drought Page.
Chapter 2: Climate and Air Quality of Dutchess County
The Natural Resource Inventory of Dutchess County, NY 19
AIR QUALITY & POLLUTION
The major air pollutants in Dutchess County are ground-level ozone, particulate matter and acid
deposition. Because some of these pollutants are transported across state and county lines, the
federal Clean Air Act was enacted to control these pollutants at the state and federal geographic
scale. It’s important to remember that some pollutants measured in Dutchess County are not
emitted here. Likewise, some pollutants emitted in Dutchess County affect downwind areas outside
of Dutchess County.
Overview of Clean Air Act
The principle statutory authority for controlling air pollution at the Federal and State level is
contained in the Clean Air Act (CAA), which was enacted by Congress and signed into law in 1970.
Although subsequently amended, the core provisions of the 1970 Clean Air Act are still in effect. In
Section 109 of the law, the United States Environmental Protection Agency (EPA) is directed to
establish National Ambient Air Quality Standards (NAAQS) for six specific criteria pollutants:
1. Carbon Monoxide 2. Lead 3. Nitrogen Oxides (NOx) 4. Ozone (or smog) 5. Particulate Matter and 6. Sulfur Dioxide (SO2)
6
For each of the six criteria pollutants, NAAQs are set by EPA at a level designed to protect public
health with an adequate margin of safety (Brownell, 1993). One set of limits, the primary standard,
protects health. Another set of limits, the secondary standard, is intended to prevent environmental
and property damage (United States Environmental Protection Agency, 1993).
Under section 110 of the Clean Air Act, each state is required to submit a “State Implementation
Plan,” commonly known as the “SIP” to the EPA, which details how the state will implement,
6 Although greenhouse gases that contribute to climate change are not yet regulated under the Clean Air Act as of October 2010, they will likely be regulated in the future, due to the US Supreme Court ruling Massachusetts v. EPA, 549 U.S. 497 (2007), in which the Supreme Court found that greenhouse gases are air pollutants covered by the Clean Air Act, and subsequent Endangerment and Cause or Contribute Findings issued by the EPA under Section 202(a) of the Clean Air Act in 2009 (http://www.epa.gov/climatechange/endangerment.html#back).
Chapter 2: Climate and Air Quality of Dutchess County
20 The Natural Resource Inventory of Dutchess County, NY
maintain, and enforce the primary and secondary NAAQS in each air quality control region within
the State (United States Code of Federal Regulations, 2006). As the regulatory authority for New
York State, the NYS Department of Environmental Conservation (DEC), working with local
authorities, drafts the SIPs for submission to the EPA to meet the requirements of the Clean Air
Act in New York State.
Upon passage of the CAA Amendments of 1990, several changes were put in place, including new
designation of areas of the country not meeting the NAAQS for each criteria pollutant, also known
as Areas of Non-Attainment. Under the CAA, a geographic area that meets or does better than the
primary standard is called an Attainment Area; areas that do not meet the primary standard are called
Non-Attainment Areas (United States Environmental Protection Agency, 1993). For areas that are
in Non-Attainment for any one of the six NAAQS for criteria pollutants, Title 1 of the 1990 CAA
Amendments imposes deadlines for meeting the NAAQS that vary with the severity of pollution
problems, and requires states to submit revised SIPs – which require that the states make
“measurable progress” in meeting the NAAQS.
Ozone
One of the most critical criteria pollutants, ground level ozone, is the main harmful component of
smog. It is a highly reactive gas that consists of 3 oxygen atoms. Ozone is not emitted directly, but
is formed through chemical reactions between precursor emissions of Volatile Organic Compounds
(VOC) and Nitrogen Oxides (NOx) in the presence of sunlight. These reactions are stimulated by
sunlight and high temperature, which is why peak ozone levels occur during summer and the
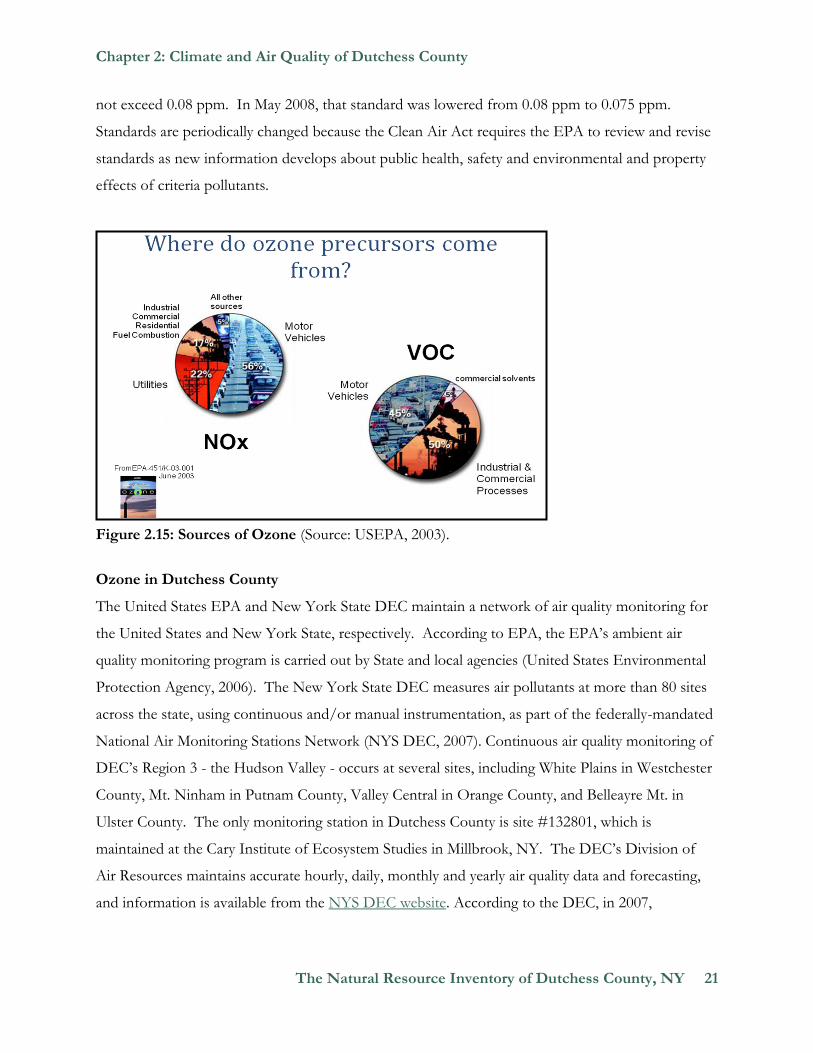
warmest period of the day. The VOC and NOx precursors to ozone are produced by the
combination of pollutants from many sources, including smokestacks, cars, paints and solvents
(Figure 2.15). According to the EPA, when a car burns gasoline, releasing exhaust fumes, or a
painter paints a house, smog-forming pollutants rise into the sky (United States Environmental
Protection Agency, 1993).
The initial NAAQS for ozone was a maximum 1-hour average not to exceed 0.12 parts per million
(ppm) (United States Code of Federal Regulations, 2006). In 1997, the EPA established a new
NAAQS for ozone. To attain this standard, the 3-year average of the fourth-highest daily maximum
8-hour average ozone concentrations measured at each monitor within an area over each year must
Chapter 2: Climate and Air Quality of Dutchess County
The Natural Resource Inventory of Dutchess County, NY 21
not exceed 0.08 ppm. In May 2008, that standard was lowered from 0.08 ppm to 0.075 ppm.
Standards are periodically changed because the Clean Air Act requires the EPA to review and revise
standards as new information develops about public health, safety and environmental and property
effects of criteria pollutants.
Figure 2.15: Sources of Ozone (Source: USEPA, 2003).
Ozone in Dutchess County
The United States EPA and New York State DEC maintain a network of air quality monitoring for
the United States and New York State, respectively. According to EPA, the EPA’s ambient air
quality monitoring program is carried out by State and local agencies (United States Environmental
Protection Agency, 2006). The New York State DEC measures air pollutants at more than 80 sites
across the state, using continuous and/or manual instrumentation, as part of the federally-mandated
National Air Monitoring Stations Network (NYS DEC, 2007). Continuous air quality monitoring of
DEC’s Region 3 - the Hudson Valley - occurs at several sites, including White Plains in Westchester
County, Mt. Ninham in Putnam County, Valley Central in Orange County, and Belleayre Mt. in
Ulster County. The only monitoring station in Dutchess County is site #132801, which is
maintained at the Cary Institute of Ecosystem Studies in Millbrook, NY. The DEC’s Division of
Air Resources maintains accurate hourly, daily, monthly and yearly air quality data and forecasting,
and information is available from the NYS DEC website. According to the DEC, in 2007,
Chapter 2: Climate and Air Quality of Dutchess County
22 The Natural Resource Inventory of Dutchess County, NY
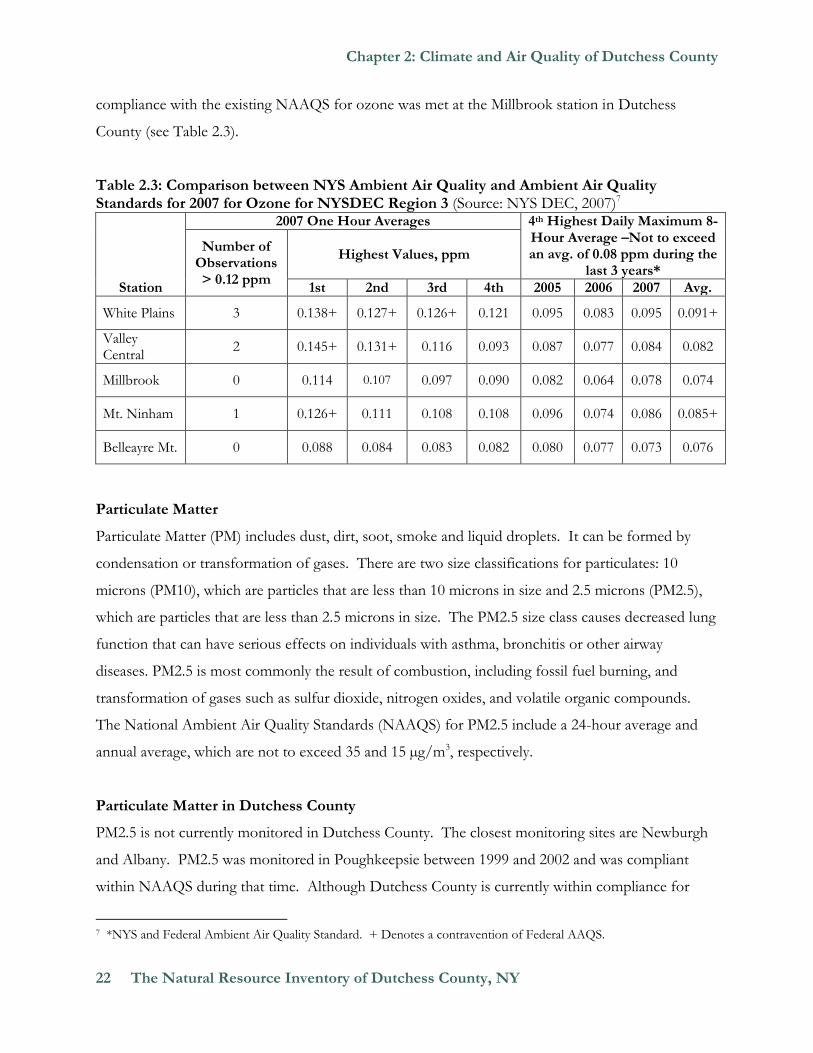
compliance with the existing NAAQS for ozone was met at the Millbrook station in Dutchess
County (see Table 2.3).
Table 2.3: Comparison between NYS Ambient Air Quality and Ambient Air Quality Standards for 2007 for Ozone for NYSDEC Region 3 (Source: NYS DEC, 2007)7
Station
2007 One Hour Averages 4th Highest Daily Maximum 8-Hour Average –Not to exceed an avg. of 0.08 ppm during the
last 3 years*
Number of Observations > 0.12 ppm
Highest Values, ppm
1st 2nd 3rd 4th 2005 2006 2007 Avg.
White Plains 3 0.138+ 0.127+ 0.126+ 0.121 0.095 0.083 0.095 0.091+
Valley Central
2 0.145+ 0.131+ 0.116 0.093 0.087 0.077 0.084 0.082
Millbrook 0 0.114 0.107 0.097 0.090 0.082 0.064 0.078 0.074
Mt. Ninham 1 0.126+ 0.111 0.108 0.108 0.096 0.074 0.086 0.085+
Belleayre Mt. 0 0.088 0.084 0.083 0.082 0.080 0.077 0.073 0.076
Particulate Matter
Particulate Matter (PM) includes dust, dirt, soot, smoke and liquid droplets. It can be formed by
condensation or transformation of gases. There are two size classifications for particulates: 10
microns (PM10), which are particles that are less than 10 microns in size and 2.5 microns (PM2.5),
which are particles that are less than 2.5 microns in size. The PM2.5 size class causes decreased lung
function that can have serious effects on individuals with asthma, bronchitis or other airway
diseases. PM2.5 is most commonly the result of combustion, including fossil fuel burning, and
transformation of gases such as sulfur dioxide, nitrogen oxides, and volatile organic compounds.
The National Ambient Air Quality Standards (NAAQS) for PM2.5 include a 24-hour average and
annual average, which are not to exceed 35 and 15 µg/m3, respectively.
Particulate Matter in Dutchess County
PM2.5 is not currently monitored in Dutchess County. The closest monitoring sites are Newburgh
and Albany. PM2.5 was monitored in Poughkeepsie between 1999 and 2002 and was compliant
within NAAQS during that time. Although Dutchess County is currently within compliance for
7 *NYS and Federal Ambient Air Quality Standard. + Denotes a contravention of Federal AAQS.
Chapter 2: Climate and Air Quality of Dutchess County
The Natural Resource Inventory of Dutchess County, NY 23
PM2.5, development and vehicular travel should be controlled to ensure that it remains in
compliance.
Air Quality Index
The Air Quality Index (AQI) is an index that illustrates the level of each of the criteria pollutants.
For Dutchess County, AQI’s for ozone and PM2.5 are forecast on a daily basis by the NYS DEC.
The AQI was created as an easy way to correlate levels of different pollutants to one scale; the
higher the AQI value, the greater the health concern. When levels of ozone and/or PM2.5 are
forecast to exceed an AQI value of 100, an Air Quality Health Advisory is issued alerting sensitive
groups to take the necessary precautions. AQI alerts are reported via media outlets and weather
forecasting facilities. For real-time air quality data and forecasts for the Hudson Valley visit the NYS
DEC Air Quality Forecast for New York State.
Acid Precipitation
Acid precipitation refers to rain, snow or ice that is more acidic than what is normal for a given area.
In the northeastern United States, normal precipitation pH is about 5.2. The pH scale is a measure
of acidity ranging from 0 to 14, with pH 7 being neutral, pH less than 7 is acidic, and pH greater
than 7 is basic. The pH scale is logarithmic, which means that each pH unit is 10 times that of its
neighbor. So a solution with pH 4 is 10 times more acidity than a solution with pH 5. In Millbrook
in Dutchess County, the average precipitation pH between 1984 and 2007 was 4.31 (Cary Institute
of Ecosystem Studies, 2008).
Acid precipitation most commonly forms from sulfur dioxide (SO2) and oxides of nitrogen (NOx).
Most SO2 is emitted by coal burning power plants while NOx most commonly comes from car
exhaust and other industrial processes as well as coal burning. In the atmosphere, the SO2 and NOx
transform to sulfate (SO42-) and nitrate (NO3
-) which combine with hydrogen ions (H+) to form
sulfuric acid (H2SO4) and nitric acid (HNO3). Acid precipitation is more correctly called acid
deposition. There are 2 forms of acid deposition: wet deposition, which is deposition in the form of
rain, snow or ice, and dry deposition, which is deposition in the form of gases or particles. By far,
most acid deposition falls as wet deposition. H2SO4 is the most important component of acid
deposition although HNO3 is also important. Because the prevailing wind direction for Dutchess
County is southwest, as it is for most of the northeastern US, we are upwind of the midsection of
Chapter 2: Climate and Air Quality of Dutchess County
24 The Natural Resource Inventory of Dutchess County, NY
the country where many coal burning power plants are. Our air and precipitation largely originates
in areas with high emissions of the acid deposition precursor SO2.
Acid deposition and other pollutants harm natural ecosystems and threaten biological diversity.
Acid deposition acidifies soils, lakes and streams and enhances the process that makes toxic mercury
(another pollutant emitted during the burning of coal) available to organisms. Acid deposition also
enhances the mobilization of toxic aluminum from soils to tree roots, increases leaching of sulfate
and nitrate to soils and surface waters and promotes the loss of important buffering nutrients from
soils. In aquatic systems, aluminum can kill fish and other aquatic organisms, reducing fish species
richness. The increased acidity in lakes and other surface waters can reduce ecosystem productivity.
While existing acid precipitation regulations are necessary, they are insufficient to conserve natural
ecosystems and their valuable services (Lovett and Tear, 2008).
Title IV of the 1990 Clean Air Act Amendments (CAAA) mandates requirements for the control of
acid deposition. The CAAA set a goal of reducing annual SO2 emissions by 10 million tons below
1980 levels. To achieve these reductions, the law required a two-phase tightening of the restrictions
placed on the highest emitting fossil fuel-fired power plants. Phase I began in 1995 and Phase II
began in the year 2000. The Act also called for a 2 million ton reduction in NOx emissions by the
year 2000.
Acid Precipitation in Dutchess County
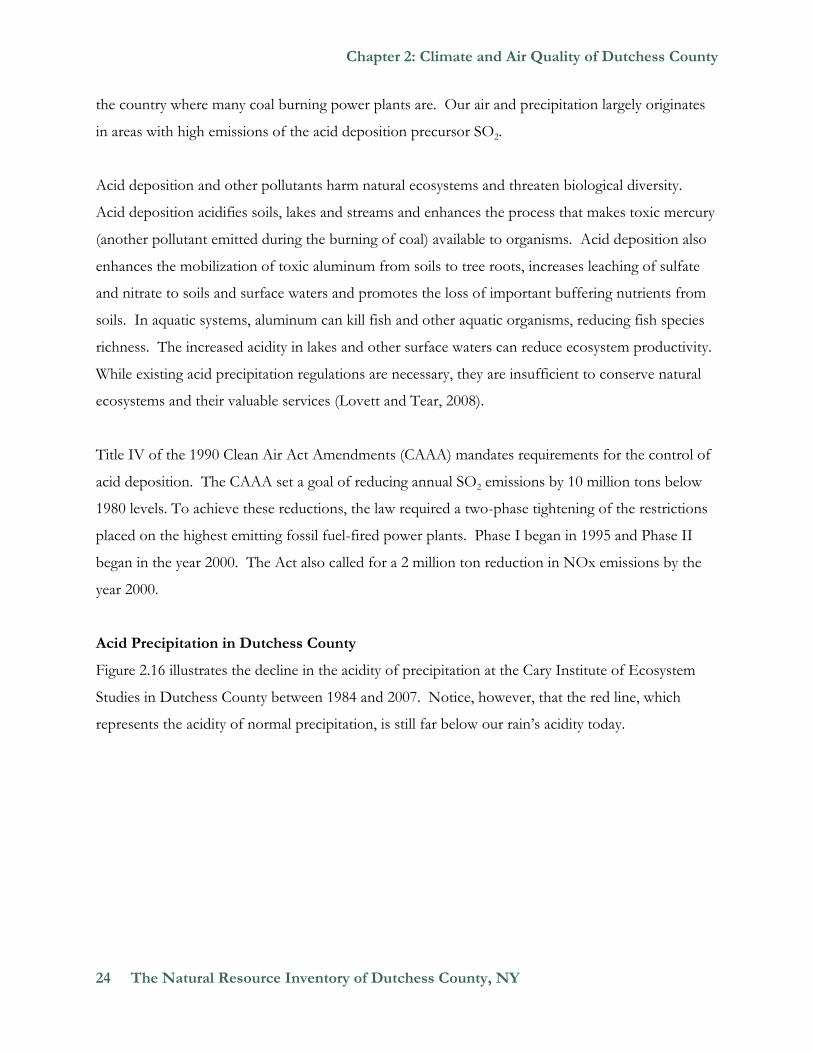
Figure 2.16 illustrates the decline in the acidity of precipitation at the Cary Institute of Ecosystem
Studies in Dutchess County between 1984 and 2007. Notice, however, that the red line, which
represents the acidity of normal precipitation, is still far below our rain’s acidity today.
Chapter 2: Climate and Air Quality of Dutchess County
The Natural Resource Inventory of Dutchess County, NY 25
Figure 2.16: Acid Rain Measurements at the Cary Institute, 1984-2007.
CLIMATE CHANGE
Climate change is defined as any significant change in measures of climate (such as temperature,
precipitation, or wind) lasting for an extended period of time (decades or longer). The global
climate can change because of natural factors (such as changes in the sun's intensity); natural
processes within the climate system; or human activities that change the atmosphere's composition
(such as through the burning of fossil fuels) (EPA, 2010). Until the advent of the industrial
revolution, global climate change occurred over long periods of time and was caused by a variety of
natural factors. However, the International Panel on Climate Change (IPCC), an international body
of scientists working through the United Nations, has concluded that the earth’s climate is changing
much more rapidly than ever before, and this change is very likely caused by the increase in
atmospheric concentrations of greenhouse gases (GHGs) emitted by humans (IPCC, 2007).
The current atmospheric concentration of carbon dioxide is about 385 parts-per-million (ppm), the
highest level in over 700,000 years. Most of this increase is due to the combustion of fossil fuels by
humans (NOAA, “Carbon Dioxide, Methane Rise Sharply,” 2008). Natural carbon dioxide and
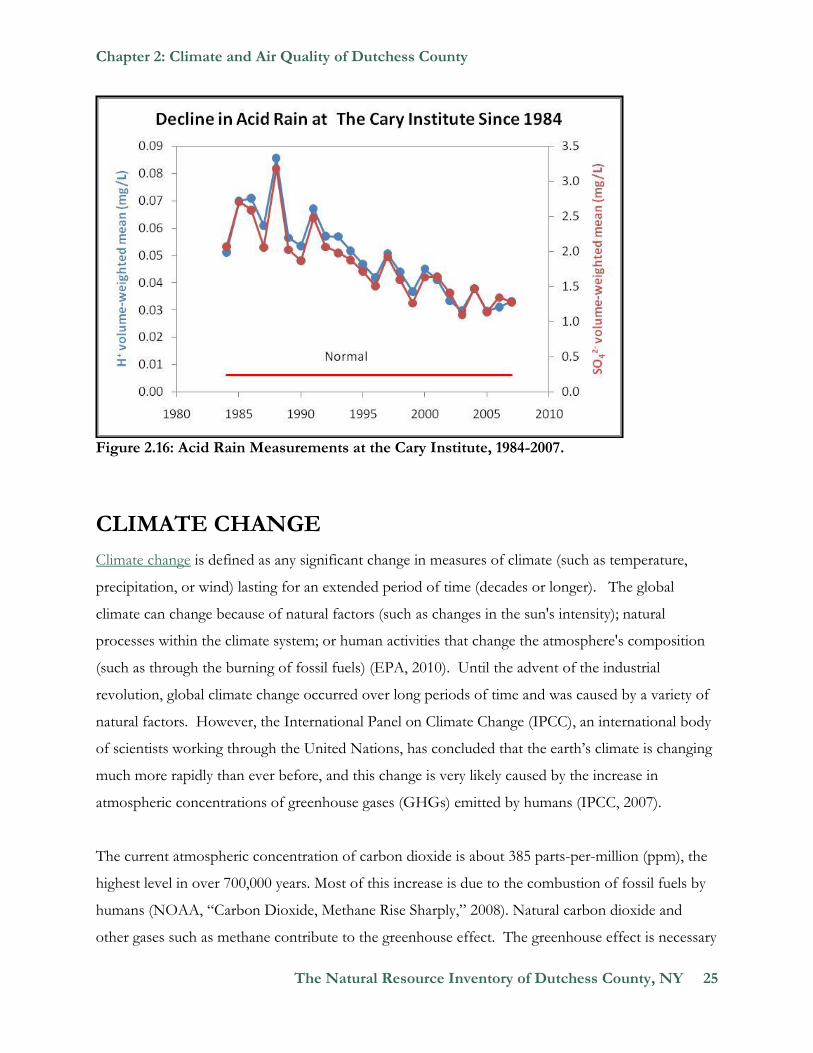
other gases such as methane contribute to the greenhouse effect. The greenhouse effect is necessary
Chapter 2: Climate and Air Quality of Dutchess County
26 The Natural Resource Inventory of Dutchess County, NY
to maintain the earth’s atmosphere at a reasonably mild temperature by allowing solar radiation to
pass through unimpeded, and simultaneously absorbing outgoing radiation. However, the
greenhouse effect is being enhanced as the concentration of GHGs in the atmosphere is increasing
(Pidwirny, 2006).
Figure 2.17: The Greenhouse Effect (Source: US Department of Energy, 2008).
Average global temperatures have risen by 1.3 degrees Fahrenheit over the past century. According
to the National Oceanic and Atmospheric Administration (NOAA), seven of the eight warmest
years on record have occurred since 2001. As a result, the IPCC has concluded that warming of the
Earth’s climate system is now unequivocal (USEPA, FAQs, 2009).
Since 1970, average temperature in the northeastern United States has increased by 2 degrees
Fahrenheit, with winter temperatures rising twice this much (Global Climate Change Impacts, 2009).
This warming has already brought about numerous noticeable changes to the climate of New York
State and Dutchess County, which are detailed below. Estimates of continued climate change in the
future are heavily dependent on the rate of human’s GHG emissions. According to the USEPA, “if
Chapter 2: Climate and Air Quality of Dutchess County
The Natural Resource Inventory of Dutchess County, NY 27
humans continue to emit GHGs at or above the current pace, we will probably see an average global
temperature increase of 3 to 7 degrees Fahrenheit by 2100,” while global temperature increases
would be lower with lower GHG emissions. However, even if humans were to drastically reduce
their GHG emissions, the earth would still warm about 1 degrees Fahrenheit over the next 100
years, due to the long lifetime of many GHGs and the slow cycling of heat from the ocean to the
atmosphere (USEPA, FAQs, 2009).
Changing Temperatures and Seasons in the Northeast and Hudson Valley
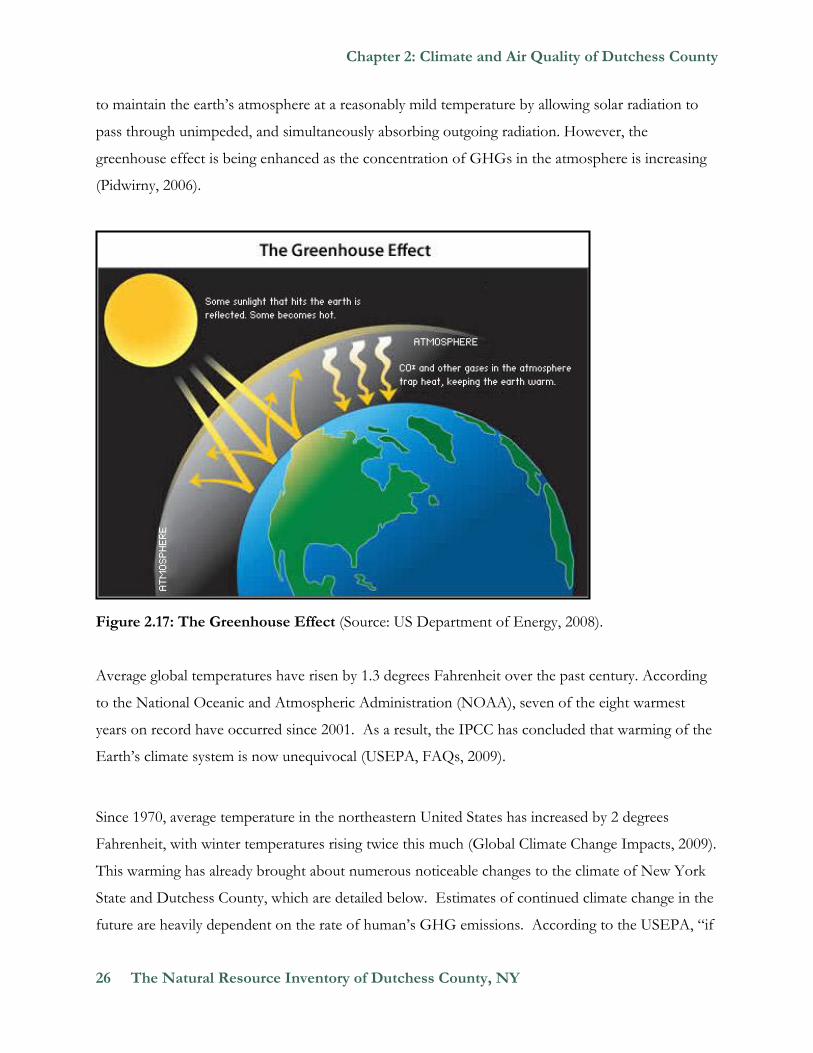
Dutchess County is already experiencing a rise in temperature. The mean annual temperature in
Poughkeepsie has generally increased during the past 55 years, as evidenced by the Figure 2.18
below. There has been an overall increase of about 1.1 degrees Fahrenheit during this time period
(NRCC, “CLIMOD System,” 2008).
Figure 2.18: Mean Annual Temperature in Poughkeepsie, 1950-2007 (Source: NRCC, “CLIMOD System,” 2008).
Mean temperatures are expected to rise an additional 1.5 to 3 degrees Fahrenheit in the Hudson
Valley by 2020, and by 3.0 to 7.5 degrees Fahrenheit by 2050. By the close of the century, mean
temperatures are expected to increase by 4.0 to 8.0 degrees Fahrenheit by 2080, depending on how
much GHGs humans continue to emit (draft New York State ClimAid Report, 2010). Summers
47.0
47.5
48.0
48.5
49.0
49.5
50.0
50.5
51.0
51.5
52.0
1950 1960 1970 1980 1990 2000 2010
Chapter 2: Climate and Air Quality of Dutchess County
28 The Natural Resource Inventory of Dutchess County, NY
are projected to warm slightly more than winters, and the combination of warmer temperatures
and high humidity may cause summer days to feel substantially warmer than at the present-
comparable to the current climate of South Carolina (United State Global Change Research
Program, 2009).
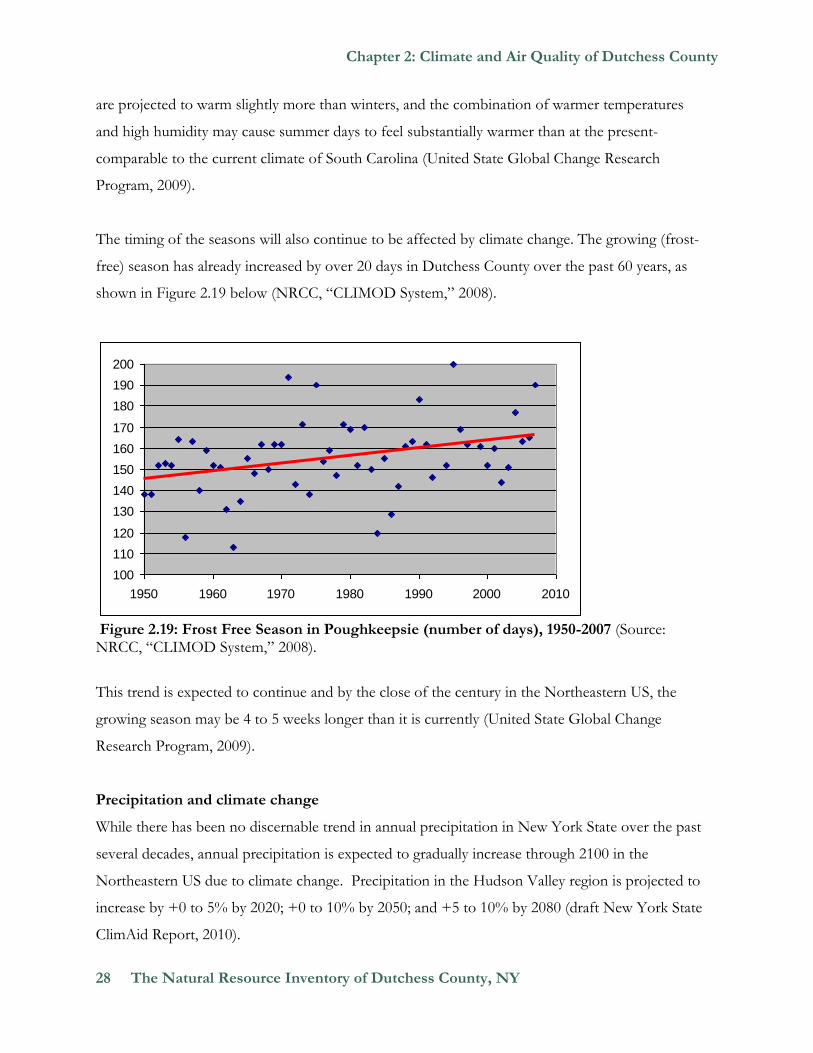
The timing of the seasons will also continue to be affected by climate change. The growing (frost-
free) season has already increased by over 20 days in Dutchess County over the past 60 years, as
shown in Figure 2.19 below (NRCC, “CLIMOD System,” 2008).
Figure 2.19: Frost Free Season in Poughkeepsie (number of days), 1950-2007 (Source: NRCC, “CLIMOD System,” 2008).
This trend is expected to continue and by the close of the century in the Northeastern US, the
growing season may be 4 to 5 weeks longer than it is currently (United State Global Change
Research Program, 2009).
Precipitation and climate change
While there has been no discernable trend in annual precipitation in New York State over the past
several decades, annual precipitation is expected to gradually increase through 2100 in the
Northeastern US due to climate change. Precipitation in the Hudson Valley region is projected to
increase by +0 to 5% by 2020; +0 to 10% by 2050; and +5 to 10% by 2080 (draft New York State
ClimAid Report, 2010).
100
110
120
130
140
150
160
170
180
190
200
1950 1960 1970 1980 1990 2000 2010
Chapter 2: Climate and Air Quality of Dutchess County
The Natural Resource Inventory of Dutchess County, NY 29
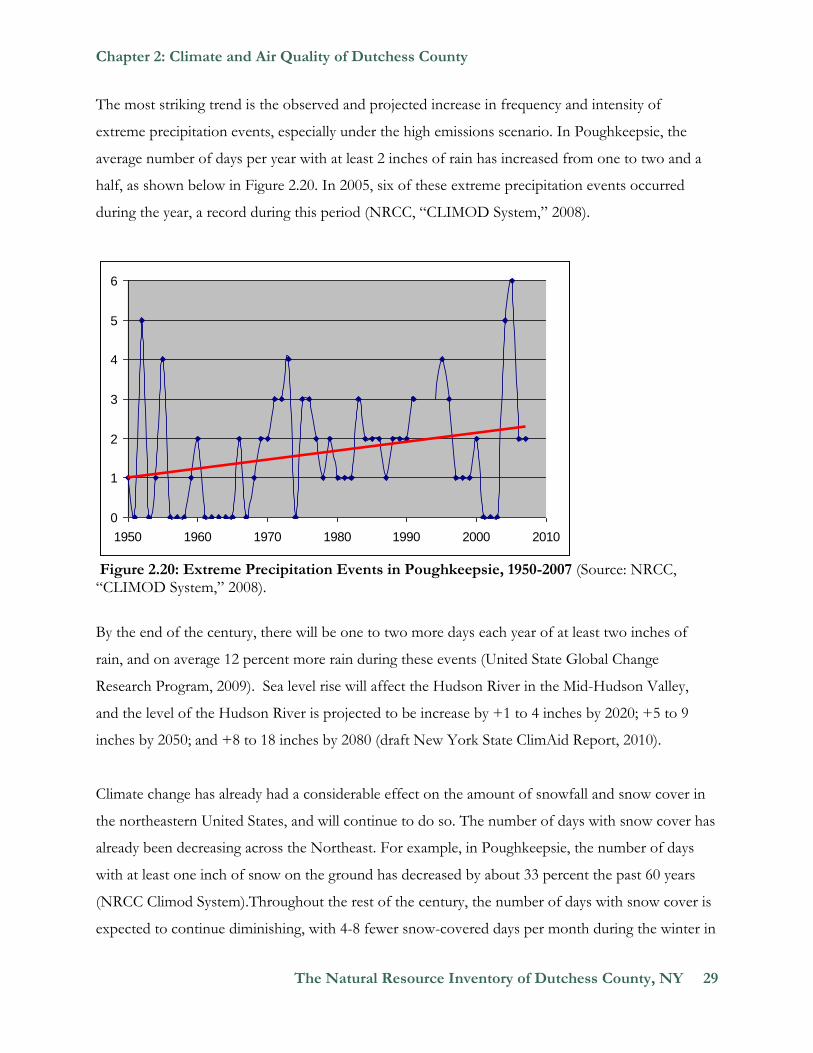
The most striking trend is the observed and projected increase in frequency and intensity of
extreme precipitation events, especially under the high emissions scenario. In Poughkeepsie, the
average number of days per year with at least 2 inches of rain has increased from one to two and a
half, as shown below in Figure 2.20. In 2005, six of these extreme precipitation events occurred
during the year, a record during this period (NRCC, “CLIMOD System,” 2008).
Figure 2.20: Extreme Precipitation Events in Poughkeepsie, 1950-2007 (Source: NRCC, “CLIMOD System,” 2008).
By the end of the century, there will be one to two more days each year of at least two inches of
rain, and on average 12 percent more rain during these events (United State Global Change
Research Program, 2009). Sea level rise will affect the Hudson River in the Mid-Hudson Valley,
and the level of the Hudson River is projected to be increase by +1 to 4 inches by 2020; +5 to 9
inches by 2050; and +8 to 18 inches by 2080 (draft New York State ClimAid Report, 2010).
Climate change has already had a considerable effect on the amount of snowfall and snow cover in
the northeastern United States, and will continue to do so. The number of days with snow cover has
already been decreasing across the Northeast. For example, in Poughkeepsie, the number of days
with at least one inch of snow on the ground has decreased by about 33 percent the past 60 years
(NRCC Climod System).Throughout the rest of the century, the number of days with snow cover is
expected to continue diminishing, with 4-8 fewer snow-covered days per month during the winter in
0
1
2
3
4
5
6
1950 1960 1970 1980 1990 2000 2010
Chapter 2: Climate and Air Quality of Dutchess County
30 The Natural Resource Inventory of Dutchess County, NY
the Northeast. The overall snow season will also shorten, with snowfall arriving later and leaving
earlier. As temperatures rise, the snow that does fall will become “slushier”- wetter, heavier, and
more dense. Furthermore, winter storms which once brought the area just snow will now be more
likely to produce sleet, freezing rain, and rain with less, if any snowfall (United State Global Change
Research Program, 2009).
According to the United State Global Change Research Program, climate change is already affecting
the water resources, agriculture, ecosystems, energy resources, transportation and health in the
northeastern United States. Over the next few decades and to the end of the century, the projected
climate changes for the region include increasing adverse health effects from extreme heat and
declining air quality, especially in urban areas; changes to agricultural production, including dairy,
fruit, and maple syrup, as climates shift; increasing frequency of flooding due to sea-level rise and
heavy downpours; and adverse impacts on winter recreation due to projected reductions in snow
cover (U.S. Global Change Research Program, 2009, Global Climate Change Impacts in the United
States: Northeast Region). While the exact impacts of climate change on Dutchess County are not
entirely certain, recent trends and current research indicates that the climate and therefore the
ecosystems and natural resources of the county will be altered substantially in the future, especially if
humans continue to emit greenhouse gas emissions at the current rate.
CLIMATE DATA
The National Climatic Data Center, located in Asheville, North Carolina, is the world’s largest
active archive of weather data. The NCDC archives 99 percent of all NOAA data, adding 224
gigabytes of new data daily. The center’s stated mission is “to provide access and stewardship to the
Nation's resource of global climate and weather related data and information, and assess and
monitor climate variation and change” (NOAA, “What is NCDC?,” 2008). The NCDC also
manages six regional climate centers that disseminate climate data, research, and applications at a
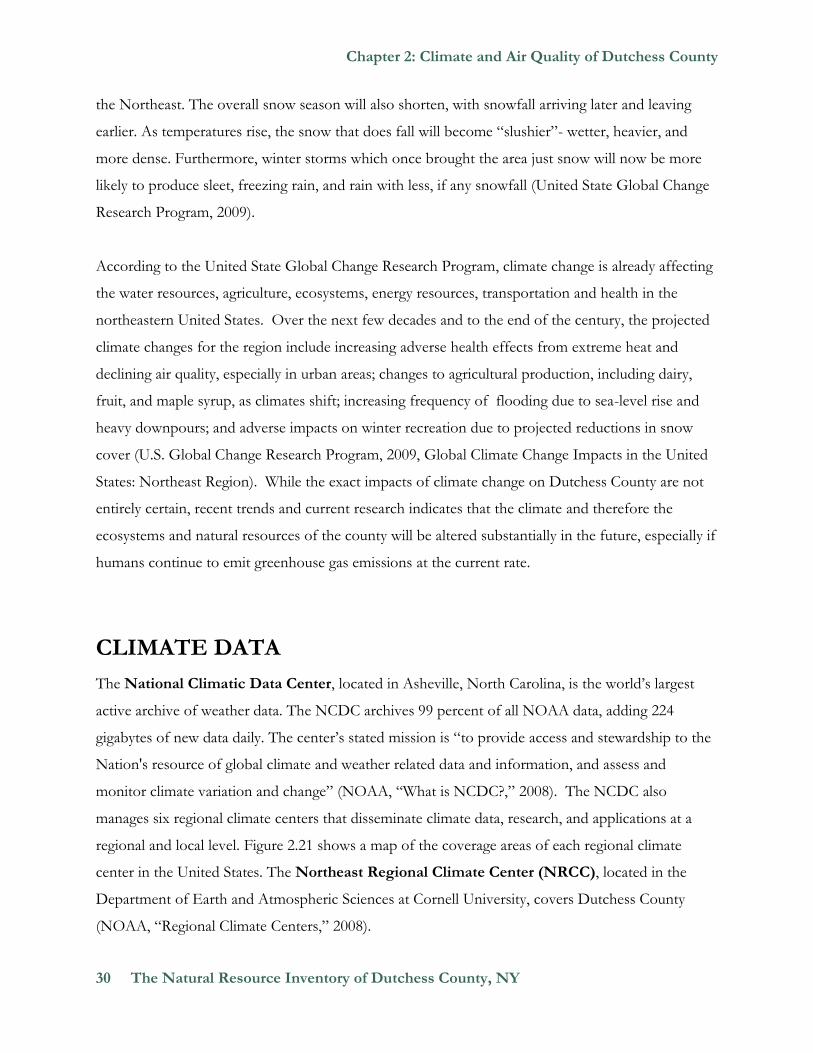
regional and local level. Figure 2.21 shows a map of the coverage areas of each regional climate
center in the United States. The Northeast Regional Climate Center (NRCC), located in the
Department of Earth and Atmospheric Sciences at Cornell University, covers Dutchess County
(NOAA, “Regional Climate Centers,” 2008).
Chapter 2: Climate and Air Quality of Dutchess County
The Natural Resource Inventory of Dutchess County, NY 31
Figure 2.21: NOAA Regional Climate Centers (Source: NOAA, “Regional Climate Centers,” 2008).
The NCDC and the regional climate centers support the American Association of State
Climatologists, an organization composed of state climatologists and the directors of the six regional
climate centers. The New York State Climate Office is also located with the NRCC at Cornell
University.
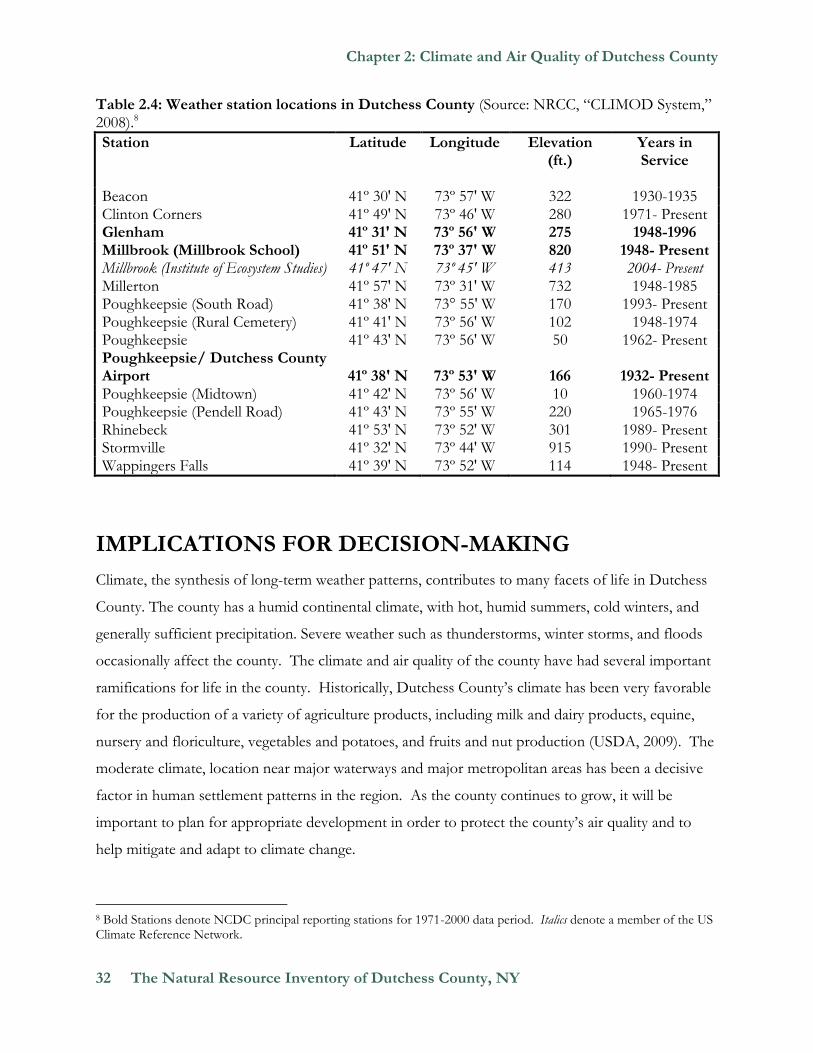
The National Weather Service’s Cooperative Observer Program is a climate observing network of
over 11,000 volunteers throughout the country. Data is used for NWS products and archived at the
National Climatic Data Center (NOAA, “NWS Cooperative Observer Program,” 2008). There have
been 15 cooperative reporting stations in Dutchess County at one time or another. Eight stations
currently operate in the county and are listed in Table 2.4 below.
Chapter 2: Climate and Air Quality of Dutchess County
32 The Natural Resource Inventory of Dutchess County, NY
Table 2.4: Weather station locations in Dutchess County (Source: NRCC, “CLIMOD System,” 2008).8
Station
Latitude
Longitude
Elevation (ft.)
Years in Service
Beacon 41º 30' N 73º 57' W 322 1930-1935 Clinton Corners 41º 49' N 73º 46' W 280 1971- Present Glenham 41º 31' N 73º 56' W 275 1948-1996 Millbrook (Millbrook School) 41º 51' N 73º 37' W 820 1948- Present Millbrook (Institute of Ecosystem Studies) 41º 47' N 73º 45' W 413 2004- Present Millerton 41º 57' N 73º 31' W 732 1948-1985 Poughkeepsie (South Road) 41º 38' N 73° 55' W 170 1993- Present Poughkeepsie (Rural Cemetery) 41º 41' N 73º 56' W 102 1948-1974 Poughkeepsie 41º 43' N 73º 56' W 50 1962- Present Poughkeepsie/ Dutchess County Airport 41º 38' N 73º 53' W 166 1932- Present Poughkeepsie (Midtown) 41º 42' N 73º 56' W 10 1960-1974 Poughkeepsie (Pendell Road) 41º 43' N 73º 55' W 220 1965-1976 Rhinebeck 41º 53' N 73º 52' W 301 1989- Present Stormville 41º 32' N 73º 44' W 915 1990- Present Wappingers Falls 41º 39' N 73º 52' W 114 1948- Present
IMPLICATIONS FOR DECISION-MAKING
Climate, the synthesis of long-term weather patterns, contributes to many facets of life in Dutchess
County. The county has a humid continental climate, with hot, humid summers, cold winters, and
generally sufficient precipitation. Severe weather such as thunderstorms, winter storms, and floods
occasionally affect the county. The climate and air quality of the county have had several important
ramifications for life in the county. Historically, Dutchess County’s climate has been very favorable
for the production of a variety of agriculture products, including milk and dairy products, equine,
nursery and floriculture, vegetables and potatoes, and fruits and nut production (USDA, 2009). The
moderate climate, location near major waterways and major metropolitan areas has been a decisive
factor in human settlement patterns in the region. As the county continues to grow, it will be
important to plan for appropriate development in order to protect the county’s air quality and to
help mitigate and adapt to climate change.
8 Bold Stations denote NCDC principal reporting stations for 1971-2000 data period. Italics denote a member of the US Climate Reference Network.
Chapter 2: Climate and Air Quality of Dutchess County
The Natural Resource Inventory of Dutchess County, NY 33
Air Quality
The air we breathe is a vital resource that we should not take for granted. It is essential for the
health of human life as well as the natural world around us. Without clean air, not only will our own
breathing be compromised, but the health of our forests, fields and all of the animals and plants that
they sustain will be threatened. For this reason, it is essential that we protect this important
resource.
Some pollutants such as ground-level ozone and acid deposition have improved in Dutchess County
in the last several decades. However, the current levels of these pollutants are still a long way from
normal. Additionally, the latest health research indicates that our standards for pollutants such as
ozone and particulate matter have been set too high to adequately protect human health. As a
result, the EPA has adopted lower concentration limits for ground level ozone. The combination of
the new EPA standard for ozone, together with the fact that Dutchess County is grouped regionally
with Putnam and Orange Counties, has resulted in the EPA designation of nonattainment for ozone
for the Dutchess/Putnam/Orange County Area. The take home message is that pollutants such as
ozone and particulate matter can easily become more critical in Dutchess County, especially as the
population in the county grows and development occurs.
Currently ozone, particulate matter and acid deposition are regulated at the federal level. Because
those pollutants, or their precursors, are to a large extent, produced at a regional scale larger than
Dutchess County, indeed larger than the state of New York, they are regulated by the federal
government via the Clean Air Act and its amendments. The precursors to ozone, acid deposition
and some particulate matter are produced in areas upwind from Dutchess County. As a result, we
rely on our state and federal governments to regulate these pollutants in order to keep the air in
Dutchess County clean. It is important to remember, however, that just as there are sources of
pollutants upwind from us, there is an area downwind of us, where the pollutants that we produce
will settle. Therefore, we should not only be concerned about the pollutants that come from our
neighbors upwind, but we should also remember that it is our responsibility to control our own air
pollutant emissions for the sake of our downwind neighbors.
What are the options or tools available at the municipal or county level for the protection of our air
quality? Many pollutants or precursors to pollutants are produced by motor vehicles. Therefore,
Chapter 2: Climate and Air Quality of Dutchess County
34 The Natural Resource Inventory of Dutchess County, NY
reducing our dependence on cars will help protect our air quality, and it is critical to ensure that
there are alternative means of transportation available. Providing and maintaining safe bicycle routes
and adequate public transportation are two ways local governments and agencies can reduce
pollution produced by vehicle exhaust. Volatile Organic Compounds (VOC) are important
precursors to ozone, and one source of VOC is gasoline vapors. Our neighbors in Westchester and
Putnam Counties have required gaskets on all gasoline pumps to prevent the escape of vapors.
Dutchess County should consider the same or similar requirements to reduce ozone formation.
Some municipalities in New York have considered ordinances to restrict emissions from outdoor
wood burning furnaces, which can produce high concentrations of particulates. While
manufacturers of indoor woodstoves are currently required by EPA to certify that stoves for sale in
the United States comply with the EPA particulate emissions guidelines in the Clean Air Act,
outdoor wood burners are not currently regulated at the federal level. Taking steps at the local level
not only ensures cleaner air for Dutchess County, but also for our downwind neighbors.
Local legislation often serves as the impetus for more regional legislative action. For example,
climate change legislation enacted by New York and California may serve as a template for federal
climate change legislation. When local communities take steps to address regional issues, it sends
the message to representatives in higher legislative offices that constituents want action, and more
encompassing legislation often follows. Although local ordinances may seem limited in the short-
term, they can have a more broad effect in the long-term, thus making them worthwhile for regional
as well as local communities.
Climate Change
As detailed above, the climate of New York State and Dutchess County is already changing due to
the affects of global climate change. These observed changes include increased temperature in the
summer, milder temperatures in the winter (with less snow cover and decreased icing over of the
Hudson River, more extreme precipitation events, and a longer growing season). The observed
changes are already affecting facets of life in Dutchess County, whether or not they are broadly
perceptible to the public and municipal officials. For example, there are fewer opportunities now
than in the past for popular winter recreational activities such as skiing, ice yachting and sledding as
winters are warmer and there is less snow and ice cover. Increasingly hot and humid summer
Chapter 2: Climate and Air Quality of Dutchess County
The Natural Resource Inventory of Dutchess County, NY 35
temperatures and increasing “hot spells” above 90 degrees mean that more people are using air
conditioning and installing central air conditioners in their homes.
Dutchess County’s climate will continue to change in the future, and these changes will be more
extreme if human GHG emissions continue unabated or increase into the future. Climate change
will have far-reaching effects on many sectors. New York State and many local governments,
organizations and businesses around New York have already started to reduce their emissions of
GHGs (through climate mitigation, or the actions taken to permanently eliminate or reduce the
long-term risk and hazards of climate change to human life and property) by improving their energy
efficiency in various operations and increasing the use renewable energy.
Business and municipal leaders also need to start planning for climate adaptation, or planning for the
changes to the climate that will occur and taking into account the future risks of climate change
when planning and making decisions. Those involved in agriculture, insurance, transportation and
many other sectors must be cognizant of the latest climate change information and future
projections (Sussman and Freed, 2008). According to the US Global Change Research Program’s
Climate Literacy Guide, reducing our vulnerability to climate change will require changes to our
economy and infrastructure, as well as individual attitudes, societal values, and government policies
to ensure the stability of both human and natural systems (2009).
Communities may want to adopt “win-win” strategies for climate change adaptation. These are
actions that would be beneficial for the community and ecosystem even if the climate does not
change as much as scientists are projecting. These win-win strategies may include:
Adopting a local climate change action plan that describes the policies and measures that the
municipality will enact to reduce greenhouse gas emissions and adapt to climate change. One
example is a program through the New York State Department of Environmental
Conservation, for communities to adopt the New York State Climate Smart Communities
Pledge;
Working on long-term infrastructure planning that takes into account changing climate
models for precipitation, sea level rise and rising temperatures and their possible impacts on
drinking water supplies and water treatment plants, roads and bridges and energy supplies.
Chapter 2: Climate and Air Quality of Dutchess County
36 The Natural Resource Inventory of Dutchess County, NY
Planning to assure a continuous supply of the basic needs that may be affected by climate
change, including a secure regional food system, clean water, and renewable energy.
Establishing and enhancing riparian buffers and protecting wetlands and open space in order
to prepare for possible increased high-intensity storm events;
Working with private forest owners to protect and sustainably manage forested areas;
Including protection of open space, biodiversity, and wetlands/watercourses in
comprehensive plans, zoning and local ordinances, and incorporate smart growth and low
impact development principles into planning decisions;
For more adaptation strategies, see the NYS Open Space Conservation Plan, Climate
Change Adaptation Recommendations, at: see:
http://www.dec.ny.gov/docs/lands_forests_pdf/osp09chapter3a.pdf.
RESOURCES FOR ADDITIONAL INFORMATION
Albany National Weather Service Forecast Office: The office provides weather forecasts,
observations, and climate data for Dutchess County and surrounding locations in Eastern New
York and Western New England. See: http://www.erh.noaa.gov/er/aly/.
Cary Institute of Ecosystem Studies: Provides real-time and summarized climate data from
Millbrook, NY through the Cary IES Environmental Monitoring Program, at:
http://ecostudies.org/emp_daily.html.
ICLEI Local Governments for Sustainability: http://www.icleiusa.org/programs/climate
ICLEI is a membership association that provides tools to local governments committed to
climate protection and sustainability.
Jet Stream: Many of the hyperlinks in this document link to Jet Stream, an online weather
course for the general public from the National Weather Service. The homepage is:
http://www.srh.noaa.gov/jetstream/index.htm.
National Climatic Data Center: Provides climate data free of charge, at:
http://www.ncdc.noaa.gov/oa/mpp/freedata.html.
New York State Department of Environmental Conservation, Climate Smart
Communities Program: http://www.dec.ny.gov/energy/50845.html.
Chapter 2: Climate and Air Quality of Dutchess County
The Natural Resource Inventory of Dutchess County, NY 37
Northeast Climate Data Center, Cornell Dept of Earth and Atmospheric Sciences:
http://www.nrcc.cornell.edu/.
US Environmental Protection Agency: http://www.epa.org includes comprehensive
information on air quality and climate change.
US Global Research Program: http://www.globalchange.gov/. The national and northeast
reports “Global Climate Change Impacts in the United States” present current and future
climate changes in the United States and regions.
REFERENCES
Brownell, F. William. “Clean Air Act.” Environmental Law Handbook: Twelfth Edition. Rockville, MD: Government Institutes, Inc., 1993.
Cary Institute of Ecosystem Studies. “Environmental Monitoring Program.” 2008. Cornell University, Department of Entomology. “Growing Degree Days.” (accessed July 2008). DeGaetano, Art. “Climate Change Projections for the Hudson Valley.” Department of Earth &
Atmospheric Science, Cornell University, 2010. Dirienzo, Stephen. Personal communication. Albany, NY: National Weather Service, July 2008. Florida Division of Emergency Management. “Tornadoes.” Accessed July 29, 2008. Karl, Thomas R., Jerry M. Melillo, and Thomas C. Peterson, Eds. Global Climate Change Impacts in the
United States. San Francisco, CA: Cambridge University Press, 2009. Lovett, G.M., and T.H. Tear. “Threats from Above: Air Pollution Impacts on Ecosystems and
Biological Diversity in the Eastern United States.” The Nature Conservancy and the Cary Institute of Ecosystem Studies, 2008.
Microsoft Encarta Images. “Climatic Regions of North America.” Accessed August, 2008. National Oceanic and Atmospheric Administration (NOAA). “Carbon Dioxide, Methane Rise
Sharply in 2007.” NOAA News, accessed July 24, 2008. National Oceanic and Atmospheric Administration (NOAA). “Annual Mean Sea Level Pressure.”
National Climatic Data Center, accessed August 8, 2008. National Oceanic and Atmospheric Administration (NOAA). “Continental United States Hurricane
Strikes, 1950-2007.” National Climatic Data Center, accessed July 29, 2008.
Chapter 2: Climate and Air Quality of Dutchess County
38 The Natural Resource Inventory of Dutchess County, NY
National Oceanic and Atmospheric Administration (NOAA). “Historic Palmer Drought Indices.”
National Climatic Data Center , accessed July 29, 2008. National Oceanic and Atmospheric Administration (NOAA). “Mean Relative Humidity (Annual).”
National Climatic Data Center , accessed July 28, 2008. National Oceanic and Atmospheric Administration (NOAA). “New York.” National Climatic Data
Center , accessed July 31, 2008. National Oceanic and Atmospheric Administration (NOAA). “Percentage of Possible Sunshine.”
National Climatic Data Center , accessed July 28, 2008. National Oceanic and Atmospheric Administration (NOAA). “Regional Climate Centers.” National
Climatic Data Center , accessed July 31, 2008. National Oceanic and Atmospheric Administration (NOAA). “NCDC Storm Events,” National
Climatic Data Center , accessed July 29, 2008. National Oceanic and Atmospheric Administration (NOAA). “What is NCDC?” National Climatic
Data Center , accessed July 31, 2008. National Oceanic and Atmospheric Administration (NOAA). “Weekly & Monthly Degree Days
Summaries Explanations.” Climate Prediction Center, accessed July 25, 2008. National Oceanic and Atmospheric Administration (NOAA). “Saffir Simpsons Hurricane Scale.”
National Hurricane Center, accessed July 29, 2008. National Oceanic and Atmospheric Administration (NOAA). “Floyd Deluges Eastern New York
and Western New England.” National Weather Service (NWS), accessed July 29, 2008. National Oceanic and Atmospheric Administration (NOAA). “NWS Cooperative Observer
Program.” National Weather Service (NWS), (accessed July 31, 2008). National Oceanic and Atmospheric Administration (NOAA). “NWS Glossary.” National Weather
Service (NWS), accessed August, 2008. National Oceanic and Atmospheric Administration (NOAA). “Past Storm Events.” National
Weather Service (NWS), accessed July 29, 2008. National Oceanic and Atmospheric Administration (NOAA). “Fujita Tornado Damage Scale.”
Storm Prediction Center, accessed July 29, 2008. New York State Climatologist. “The Climate of New York.” Accessed July 25, 2008. New York State Department of Environmental Conservation (NYS DEC). “Ambient Air Quality
Monitoring Program.” Division of Air Resources, Bureau of Air Quality Surveillance, accessed January 2007.
Chapter 2: Climate and Air Quality of Dutchess County
The Natural Resource Inventory of Dutchess County, NY 39
New York State Department of Environmental Conservation (NYS DEC). 2007. New York State
Ambient Air Quality Report for 2007. Accessed July 2008.
Northeast Regional Climate Center (NRCC). “CLIMOD System.” Accessed July 25, 2008. Northeast Regional Climate Center (NRCC). “Northeast Drought Page.” Accessed August 2008. Northeast Regional Climate Center (NRCC). “Percent of Possible Sunshine.” Accessed July 28,
2008. Northeast Regional Climate Center (NRCC). “Wind Summary for Dutchess County Airport.” July
22, 2008. Pidwirny, M. “The Greenhouse Effect,” Fundamentals of Physical Geography, 2nd Edition. (2006) accessed
July 24, 2008. Sussman, Frances and J. Randall Freed. Adapting to Climate Change: A Business Approach. Arlington,
Virginia: Pew Center on Global Climate Change, April 2008. Town of Dover, NY. “Damage from Recent Storms.” Highway Department, accessed July 2009. United Nations Intergovernmental Panel on Climate Change (IPCC). Climate Change 2007: Synthesis
Report, Summary for Policy Makers. Valencia, Spain (2007) 5. United States Code of Federal Regulations (US CFR). 2006. 40 C.F.R 50.9. United States Code of Federal Regulations (US CFR). 2006. 40 C.F.R. 50.10. United States Code of Federal Regulations (US CFR). 2006. 40 C.F.R 81.333. United States Code of Federal Regulations (US CFR). 42 U.S.C. 7410. United States Department of Agriculture (USDA). “Dutchess County Farm Statistics.” National
Agricultural Statistics Service (NASS) (2009), accessed October 5, 2010. United States Department of Energy. “The Greenhouse Effect.” Energy Efficiency and Renewable
Energy, accessed July 2008. United States Environmental Protection Agency (USEPA). “Climate Change Basic Information.”
Accessed October 5, 2010. United States Environmental Protection Agency (USEPA). “Frequently Asked Questions About
Global Warming and Climate Change: Back to Basics.” Office of Air and Radiation, EPA-430-R08-016 (April 2009), accessed 5 October 2010.
Chapter 2: Climate and Air Quality of Dutchess County
40 The Natural Resource Inventory of Dutchess County, NY
United States Environmental Protection Agency (USEPA). “Ambient Air Monitoring Program.” Office of Air and Radiation, accessed January 24, 2007.
United States Environmental Protection Agency (USEPA). April 2007. The Plain English Guide to the
Clean Air Act. Publication No. EPA-456/K-07-001 (April 2007), accessed January 24, 2007. US Global Change Research Program. Climate Literacy Guide. Washington, DC: March 2009. Urban-Mead, Russell B. Dutchess County Aquifer Recharge Rates & Sustainable Septic System Density
Recommendations. The Chazen Companies: Poughkeepsie, New York (2006), 46. The Weather Channel. “Storm Encyclopedia.” Accessed July, 28, 2008.