Embed Size (px)
Citation preview
United Nations. 1994. Disasters around the world--a global and regional view. U.N. World Conference on Natural Disaster Reduction, Yokohama, Japan, May 1994. IDNDR Information Paper No.4.
Vaughan, D. G. 1998. Antarctica: climate change and sea level. Statement prepared by Ice and Climate Division, British Antarctic Survey. (Internet: http://bsweb.nerc-bas.ac.uk/public/icd)
Vellinga, P., and R. Tol. 1993. Climate change: extreme events and society's response. Journal of Reinsurance 1(2):59-72. C. Lilly, ed.
Vinnikov, K. Y., A. Robock, R. J. Stouffer, J. E. Walsh, C. L. Parkinson, D. J. Cavalieri, J. F. B. Mitchell, D. Garrett, and V. F. Zakharov. 1999. Global warming and Northern Hemisphere sea ice extent. Science 286:1934-1937. December 3, 1999.
WASA Group. 1998. Changing waves and storms in the Northern Atlantic? Bulletin of the American Meteorological Society 79(5). May 1998.
Wigley, T. M. L. 1999. The science of climate change, global and U.S. perspectives. National Center for Atmospheric Research, Pew Center on Global Climate Change, June 29, 1999.
Wood, R.A., Keen, A.B., Mitchell, J.F.B. and Gregory, J.M., Changing spatial structure of the thermohaline circulation in response to atmospheric CO2 forcing in a climate model, Nature, Vol. 401 (Issue 6752), 1999, 508 (1)
Zwiers, F. W., and V. V. Kharin. 1998. Changes in the extremes of the climate simulated by CCC GCM2 under CO2-doubling. Journal of Climate 11:2200-2222.
46
Climate Change and Extreme Weather Events
P. Vellinga and W. J. van Verseveld
September 2000
WWF
vrije Universiteit amsterdamInstitute for Enviornmental Studies

Scambos, T.A, Kvaran, G., Fahnestock, M.A., Improving AVVHR resolution through data cumulation for mapping polar ice sheets, Remote Sensing of Environments: an interdisciplinary journal, Vol. 69 (Issue 1), 1999, 56-66 (11)
Simon F.B. Tett, Peter A. Stott, Myles R. Allen, William J. Ingham & John F.B. Mitchell (1999), Causes
Shindell, D. T., R. L. Miller, G. A. Schmidt, and L. Pandalfo. 1999. Simulation of recent northern winter climate trends by greenhouse gas forcing. Nature 399:452-455.
Swiss Re. 1999b. World insurance in 1998. Sigma 7 Swiss Reinsurance Company, Zurich.(Internet: http://www.swissre.com/e/publications/publications/sigmal/sigma9907.html)
Swiss Re. 2000a. Natural catastrophes and man-made disasters in 1999. Sigma Report No. 2/2000. Swiss Re, Zurich.
Tett, S. F. B., P. A. Stott, M. R. Allen, W. J. Ingham, and J. F. B. Mitchell. 1999. Causes of twentieth-century temperature change near the Earth's surface, Nature, Vol. 399, 10 June 1999.
Timmerman, A., J. Oberhuber, A. Bacher, M. Esch, M. Latif, and E. Roeckner. 1999. Increased El Niño frequency in a climate model forced by future greenhouse warming. Nature 398. April 22, 1999.
Tol, R., and P. Vellinga. 1998. Climate change, the enhanced greenhouse effect and the influence of the sun: a statistical analysis. Theroretical and Applied Climatology 61:1-7.
Trenberth, K. E. 1996. Global climate change. From an Abstract of Remarks by Scientists at the National Press Club, Washington, D.C., Climate Analysis Section, Newsletter 1(1). November 3, 1996.
45
Published September 2000 by WWF-World Wide Fund For Nature (Formerly World Wildlife Fund), Gland, Switzerland. WWF continues to be known as World Wildlife Fund in Canada and the US. Any reproduction in full or in part of this publication must mention the title and credit the above-mentioned publisher as the copyright owner. © text 2000 WWF. All rights reserved.
The material and the geographical designations in this report do not imply the expression of any opinion whatsoever on the part of WWF concerning the legal status of any country, territory, or area, or concerning the delimitation of its frontiers or boundaries.
Karl, T. R., and R. W. Knight. 1998. Secular trends of precipitation amount, frequency, and intensity in the USA. Bull. Am. Meteorol. Soc. 79:231-241.
Karl, T. R., R. W. Knight, and N. Plummer. 1995. Trends in high-frequency climate variability in the twentieth century. Nature 377:217-220.
Karl, T. R., N. N. Nicholls, and J. Gregory. 1997. The coming climate: meteorological records and computer models permit insights into some of the broad weather patterns of a warmer world. Scientific American, May 1997. (Internet: http://www.sciam.com/0597issue/0597karl.html)
Khain, A., and I. Ginis. 1991. The mutual response of a moving tropical cyclone and the ocean. Beitr, Phys. Atmosph. 64:125-141.
KNMI. 1999. De toestand van het klimaat in Nederland 1999 (in Dutch). (Internet: http://www.knmi.nl/voorl/nader/klim/klimaatrapportage.html)
Knutson, T. R., and S. Manabe. 1998. Model assessment of decadal variability and trends in the tropical Pacific Ocean. Journal of Climate, September 1998.
Lal, M., S. K. Singh, and A. Kumar. 1999. Global warming and monsoon climate. In: Proceedings of the Workshop on Climate Change and Perspective for Agriculture, November 20-21, 1998. S.K. Sinha, ed. National Academy of Agricultural Sciences, New Delhi.
Lambert S. J., 1995. The effect of enhanced greenhouse warming on winter cyclone frequencies and strengths. Journal of Climate 8:1447-1452.
Lander, M. 1994. An exploratory analysis of the relationship between tropical storm formation in the Western North Pacific and ENSO. Mon. Wea. Rev. 114:1138-1145.
Lettenmaier, D., E. F. Wood, and J. R. Wallis. 1994. Hydroclimatological trends in the continental United States, 1948-88. J. Climate 7:586-607.
Levitus, S., J. I. Antonov, T. P. Boyer, and C. Stephens. 2000. Warming of the world ocean. Science 287, March 24, 2000.
42
Foreword by WWF
Emissions of global warming gases continue to rise as the world burns ever more coal, oil and gas for energy. The risk of destabilising the Earth's climate system is growing every day. Few things can be more pressing for the protection of ecosystems and the well-being of society than avoiding the catastrophic effects of global warming. Time is not on our side.
Damage resulting from extreme weather events already imposes a heavy toll on society that few economies are easily able to absorb. Floods along the Yangtse River in China in 1998 were responsible for 4,000 deaths and economic losses of US $30 billion. In the same year, extreme weather conditions in Florida lead to drought and widespread wildfires caused the loss of 483,000 acres and 356 structures from fires, and resulted in an estimated US $276 million in damages. These kinds of economic impacts have increased dramatically over recent decades. It begs the question, what kinds of calamities might global warming have in store?
While there are various levels of certainty associated with the linkages between climate change and extreme weather events, decision-makers should take each of them into account when calculating the costs of climate change. Changing levels of precipitation, more severe El Niños or tropical cyclones, acute coral bleaching such that corals would not have time to recover, or a stagnation of the Ocean Conveyer Belt and the collapse of the West Antarctic Ice Sheet are risks. Each should have global policy consideration. Governments and businesses that fail to implement prudent climate protection measures must bear part of the responsibility for the consequences of these kinds of catastrophes by either reducing their emissions or paying into a compensation fund.
Industrialised countries must not close their eyes to global warming. With around one-quarter of the world's population, they account for two-thirds of the world's energy-related carbon dioxide emissions. Yet developing nations are expected to suffer the worst impacts of global warming. The dramatic floods in Mozambique that left thousands stranded and the recent bleaching coral reefs around Fiji are characteristic of what we can expect in a warmer world.
Jennifer MorganDirector, WWF Climate Change Campaign
September 2000
Parkinson, C. L., D. J. Cavalieri, P. Gloersen, H. J. Zwally, and J. C. Comiso. 1999. Arctic sea ice extents, areas, and trends, 1978-1996. Journal of Geophysical Research 104(C9):20, 837-20, 856. September 15, 1999.
Parkinson, C. 1992. Spatial patterns of increases and decreases in the length of the sea-ice season in the north polar region, 1979-1986. Journal of Geophysical Research 97(14):388.
Parmesan, C. 1996. Climate change and species range. Nature 382:765-766.
Parmesan, C., Ryrholm, N., Stefanescu C., Hill, J.K., Thomas, C.D., Descimon[num ] H., Huntley, B., Kaila, L., Kullberg, J., Tammaru, T., Tennent, W.J., Thomas, J.A., Warren, M., (1999) Poleward shifts in geographical ranges of butterfly species associated with regional warming, Nature ,Volume 399, Number 6736, Page 579 - 583, 1999
Pielke, R. A., and C. W. Landsea. 1999. La Niña, El Niño, and Atlantic hurricane damages in the United States. Submitted to Bulletin of the American Meteorological Society, 6 April 1999. (Internet: http:\\www.aoml.noaa.gov/hrd/LandSea/lanina/index.html)
Posch, M., P. Tamminen, M. Starr, and P. E. Kauppi. 1995. Climatic warming and carbon storage in boreal soils. RIVM, the Netherlands.
Rahmstorf, S. 1999. Shifting seas in the greenhouse? Nature 399. June 10, 1999.
Rahmstorf, S., and A. Ganopolski. 1999. Long-term global warming scenarios computed with an efficient coupled climate model. Climatic Change 43(2):353-367.
Reuvekamp, A., A. Klein Tank, KNMI, Change, June 1996, p 8-10, 'The Netherlands'
Revelle, C. G., and S. W. Goulter. 1986. South Pacific tropical cyclones and the Southern Oscillation. Mon. Wea. Rev. 114:1138-1145.
Rothrock, D. A., Y. Yu, and G. A. Maykut. Thinning of the arctic sea-ice cover. Geophysical Research Letters 26(23). December 1, 1999.
44
Table of Contents
Foreword by WWF
1. Introduction and summary 1
2. Observed changes in the climate 2
2.1. Temperature 2
2.2. Precipitation 7
2.3. Sea level rise 8
2.4. Snow and ice changes 9
2.5. Circulation patterns 12
Atmospheric circulation
El Niño and the North Atlantic Oscillation
North Atlantic Oscillation
2.6 (Extra)-tropical cyclones 17
2.7. Observed changes in ecosystems 18
2.8. Extreme weather events and damage cost 19
3. Projections of future climate change 22
3.1. Temperature 22
3.2. Precipitation 24
3.3. Sea level rise 26
3.4. Circulation patterns 28
El Niño and the North Atlantic Oscillation
3.5. (Extra)-tropical cyclones 29
3.6. Ecosystems 30
3.7. Societal aspects 31
4. Risks of a destabilisation of global climate 32
4.1. The Ocean Conveyor Belt 32
4.2. Antarctica 33
4.3. Other low-probability, high-impact climate change feedback mechanisms 34
5. Conclusions 36
6. References 38
140
1. Introduction and summary
Following a request from WWF we, as researchers at the Institute for Environmental Studies, have made an assessment of the scientific knowledge concerning climate change and its impacts regarding the weather and weather extremes in particular.
The report of the Intergovernmental Panel on Climate Change of 1995 has been taken as a starting point. Since 1995 many new observations and reports have become available. Much of the information on observations and studies on climate change and its impacts can be found through the Internet. Where possible we have made references, such that the reader can easily verify and review our sources.
This study addresses three main questions:To what extent can the human influence on the climate system presently be measured?What can we expect for the short term and long-term future?To what extent will measures to reduce net greenhouse gas emissions affect the future climate?
We conclude that the effects of emissions of CO2 and other greenhouse gases on the global climate are becoming increasingly visible. This includes changes in temperature, precipitation, sea level rise, atmospheric circulation patterns, and ecosystems. For many areas on Earth these changes are becoming manifest through changes in the frequency and the intensity of extreme weather events. We conclude with reasonable but no absolute confidence that human induced climate change is now affecting the geographic pattern, the frequency, and the intensity of extreme weather events.
The assessment of the most recent literature was carried out by Pier Vellinga and Willem van Verseveld of the Institute for Environmental Studies (IVM) of the Vrije Universiteit in Amsterdam. We thank Fons Baede of the Royal Netherlands Meteorological Institute (KNMI) and Jim Bruce, Chair of the International Advisory Committee UNU Network on Water, Environment and Health and former co-chair of Intergovernmental Panel on Climate Change (IPCC) Working Group 3, for their reviews and comments. However, as authors we carry the sole responsibility for this report.
Fleming, R. A., and J-N. Candau. 1997. Influences of climatic change on some ecological processes of an insect outbreak system in Canada's boreal forests and the implications for biodiversity. Environ. Monitoring & Assessment, 49:235-249.
Francis, D., and H. Hengeveld. 1998. Extreme weather and climate change. ISBN 0-662-268490. Climate and Water Products Division, Atmospheric Environment Service, Ontario, Canada.
Fyfe, J.C, Boer, G.J., Flato, G.M. (1999), Climate studies-the Arctic and Antarctic Oscillations and their projected changes under global warming, Geophysical research Letters, Vol. 26 (Issue 11), 1999, 1601-1604 (4)
Grabherr, G., M. Gottfried, and H. Pauli. 1994. Climate effects on mountains plants. Nature 369(6480), 9 June 1994.
Gray, W. M. 1984. Atlantic seasonal hurricane frequency. Part II: forecasting its variability. Mon. Wea. Rev. 112:1669-1683.
Gregory, J. M., and J. F. B. Mitchell. 1995. Simulation of daily variability of surface temperature and precipitation over Europe in the current 2 x CO2 climates using the UKMO climate model. Quart. J. R. Met. Soc. 121:1451-1476.
Groisman, P. Ya, T. R. Karl, D. R. Easterling, R. W. Knight, P. B. Jamason, K. J. Hennessy, R. Suppiah, Ch. M. Page, J. Wibig, K. Fortuniak, V. N. Razuvaev, A. Douglas, E. Forland, and P.M. Zhai. 1999. Changes in the probability of heavy precipitation: important indicators of climatic change. Climatic Change 42(1):243-283.
Groisman, P. Ya, and D. R. Easterling. 1994. Variability and trends of precipitation and snowfall over the United States and Canada. J. Climate 7:184-205.
Harvey, D. 1994. Potential feedback between climate and methane clathrate. University of Toronto, Department of Geography, Toronto, Ontario, Canada. (Internet: http://harvey.geog.utoronto.ca:8080/harvey/index.html)
Henderson-Sellers, A., H. Zhang, G. Berz, K. Emanuel, W. Gray, C. Landsea, G. Holland, J. Lighthill, S-L. Shieh, P. Webster, and K. McGuffie. 1998. Tropical cyclones and global climate change: a post IPCC assessment. Bulletin of the American Society 79(1), January 1998.
392
2. Observed changes in the climate
The climate and the mean temperature at the Earth's surface depend on the balance between incoming (short wave) solar energy and outgoing energy (infrared radiation) emitted from the Earth's surface. Greenhouse gases trap some of the infrared radiation emitted by the Earth and keep the planet warmer than it would be otherwise. The mean global temperature, about 15oC, would be far below zero without this natural greenhouse effect.
The concentrations of greenhouse gases such as carbon dioxide, methane, nitrous oxide, and CFCs have increased since the pre-industrial age, especially since 1960. Carbon dioxide has increased from 280 ppmv to 360 parts per million by volume (ppmv), methane from 700 to 1720 ppmv, and nitrous oxide from 275 to 310 ppmv. All these increases are clearly caused by human activities connected in large part with burning fossil fuels, land use, and industrial processes. Thus, climate change is largely a result of human activities contributing to an amplified greenhouse effect.
2.1. Temperature
Over the past 130 years, the mean temperature of the Earth's surface has risen between 0.3 and 0.6oC, as reported by IPCC, 1995 (see figure 1). More recent analysis, including the temperature record up to 1999, indicates that the global average temperature has now risen by about 0.6oC over the whole period of record since 1860 (Wigley 1999). A closer look reveals that the majority of this temperature increase occurred during the last few decades, when the global average temperature has risen by about 0.2oC per decade.
Chu, P., and J. Wang. 1997. Tropical cyclone occurrences in the vicinity of Hawaii: are the differences between El Niño and non-El Niño years significant? J. Climate 10:2683-2689.
Corti, S., F. Molten, and T. N. Palmer. 1999. Signature of recent climate change in frequencies of natural atmospheric circulation regimes. Nature 398:799-802.
Cubasch, U., G. Waszkewitz, Hegerl, and J. Perlwitz. 1995b. Regional climate changes as simulated in time slice experiments. MPI Report 153. Clim. Change 31:321-304.
DeAngelo , B. J., J. Harte, D. A. Lashof, and R. S. Saleska. 1997. Terrestrial ecosystems feedbacks to global climate change. In: Annual review of energy and the environment, 1997 ed., vol. 22.
Delcourt, P. A., and H. R. Delcourt. 1998. Paleooecological insights on conservation of biodiversity: a focus on species, ecosystems, and landscapes. Ecological Applications 8:921-934.
Doake, C. S. M., and D. G. Vaughan. 1991. Rapid disintegration of Wordie ice shelf in response to atmospheric warming. Nature 350(6316):328-330.
Epstein, P. R. 1996. Global climate change. From an Abstract of Remarks by Scientists at the National Press Club, Washington, D.C. Newsletter 1(1), Nov. 3, 1996.
Feely, R. A., R. Wanninkhof, T. Takahashi, and P. Tans. 1999. Influence of El Niño on the equatorial Pacific contribution to atmospheric CO2 accumulation. Nature 398. April 15, 1999.
Findlay, B. F., D. W. Gullet, L. Malone, J. Reycraft, W. R. Skinner, L. Vincent, and R. Whitewood. 1994. Canadian national and regional standardized annual precipitation departures. In: Trends '93: A compendium of data on global change, T. A. Boden, D. P. Kaiser, P. J. Sepanski, and F. W. Stoss (eds.). ORN/CDIAC-65, Carbon Dioxide Information Analysis Center, Oak Ridge National Laboratory, Oak Ridge, U.S.A, pp. 800-828.
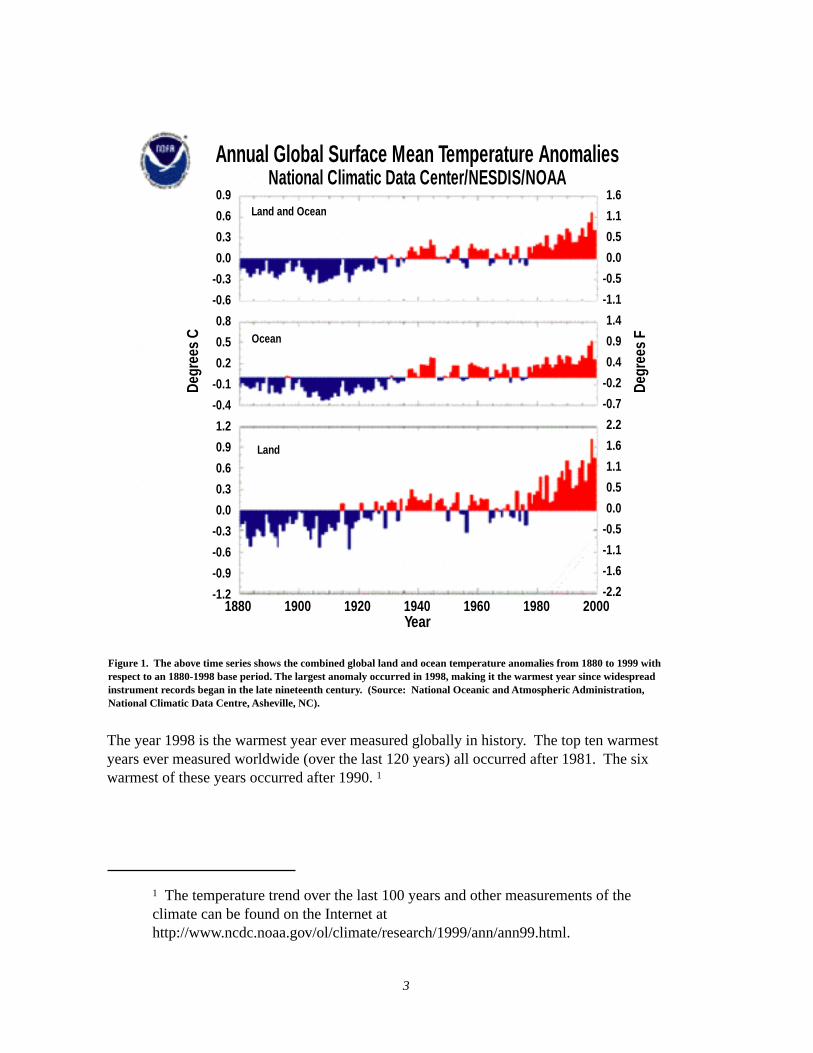
Figure 1. The above time series shows the combined global land and ocean temperature anomalies from 1880 to 1999 with respect to an 1880-1998 base period. The largest anomaly occurred in 1998, making it the warmest year since widespread instrument records began in the late nineteenth century. (Source: National Oceanic and Atmospheric Administration, National Climatic Data Centre, Asheville, NC).
The year 1998 is the warmest year ever measured globally in history. The top ten warmest years ever measured worldwide (over the last 120 years) all occurred after 1981. The six warmest of these years occurred after 1990. 1
1 The temperature trend over the last 100 years and other measurements of the climate can be found on the Internet at http://www.ncdc.noaa.gov/ol/climate/research/1999/ann/ann99.html.
References
Anonymous. 1998. World's glaciers continue to shrink according to new CU-Boulder study. University of Colorado news release, May 26, 1998. (Internet: http://www.colorado.edu/ PublicRelations/NewsReleases/ 1998/Worlds_Glaciers_Continue_To_Sh.html)
Barsugli, J. J., J. S. Whitaker, A. F. Loughe, P. D. Sardeshmukh, and Z. Toth. 1999. The effect of the 1997/98 El Niño on individual large-scale weather events. Bulletin of the American Meteorological Society 80(7) July 1999.
Beersma, J. J., E. Kaas, V. V. Kharin, G. J. Komen, and K. M. Rider. 1997. An analysis of extratropical storms in the North Atlantic region as simulated in a control and 2*CO2 timeslice experiment with a high-resolution atmospheric model. Tellus 48A: 175-196.
Bell, G. D., A. V. Douglas, M. E. Gelman, M. S. Halpert, V. E. Kousky, and C. F. Ropelewski. Climate change assessment 1998. Printed in May 1999 supplement to Bulletin of the American Society 80(5). (Internet: http://www.cpc.ncep.noaa.gov/producys/ assessments/assess_98/index.html)
Boer, G. J., G. Flato, and D. Ramsden. 1998. A transient climate change simulation with greenhouse gas and aerosol forcing: projected climate for the 21st century. Canadian Centre for Climate Modeling and Analysis, Victora B.C., in press.
Broecker, W. S. 1996. Climate implications of abrupt changes in ocean circulation. U.S. Global Change Research Program Second Monday Seminar Series. (Internet: http://www.usgcrp.gov/usgcrp/960123SM.html)
Carnell, R. E., and C. A. Senior. 1998. Changes in mid-latitude variability due to increasing greenhouse gases and sulphate aerosols. Climate Dynamics 14:369-383.
Cavalieri, D. J., P. Gloersen, C. L. Parkinson, J. C. Comiso, and H. J. Zwally. 1997. Observed hemispheric asymmetry in global sea ice changes. Science 278:1104-06.
Chan, J. C. L. 1985. Tropical cyclone activity in the Northwest Pacific in relation to the El Niño/Southern Oscillation phenomenon. Mon. Wea. Rev. 113:599-606.
338
Annual Global Surface Mean Temperature AnomaliesNational Climatic Data Center/NESDIS/NOAA
Land and Ocean
Ocean
Land
1880 1900 1920 1940 1960 1980 2000Year
Degr
ees
C
Degr
ees
F
1.6
1.1
0.5
0.0
-0.5
-1.1
1.4
0.9
0.4
-0.2
-0.7
2.2
1.6
1.1
0.5
0.0
-0.5
-1.1
-1.6
-2.2
0.9
0.6
0.3
0.0
-0.3
-0.6
0.8
0.5
0.2
-0.1
-0.4
1.2
0.9
0.6
0.3
0.0
-0.3
-0.6
-0.9
-1.2
374
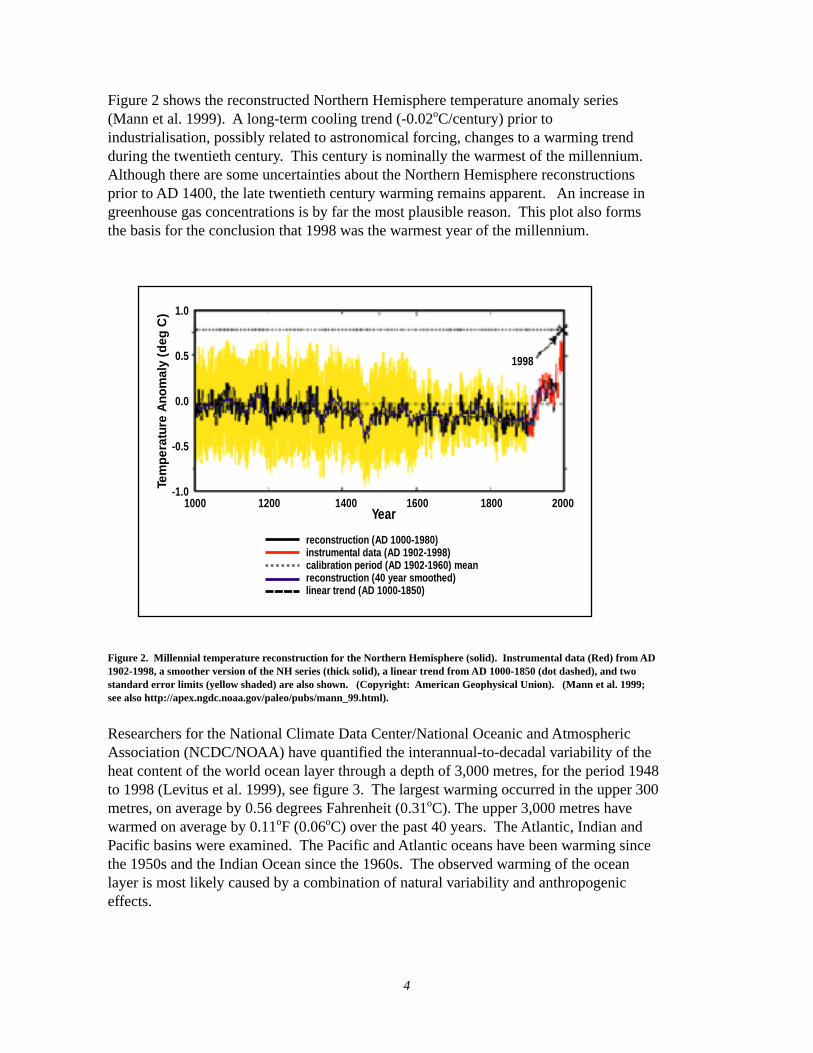
Figure 2 shows the reconstructed Northern Hemisphere temperature anomaly series (Mann et al. 1999). A long-term cooling trend (-0.02oC/century) prior to industrialisation, possibly related to astronomical forcing, changes to a warming trend during the twentieth century. This century is nominally the warmest of the millennium. Although there are some uncertainties about the Northern Hemisphere reconstructions prior to AD 1400, the late twentieth century warming remains apparent. An increase in greenhouse gas concentrations is by far the most plausible reason. This plot also forms the basis for the conclusion that 1998 was the warmest year of the millennium.
Limitation of the net emission of greenhouse gases will reduce the rate of climate change, and thus reduce the expected societal and ecological damage. In view of the distribution issues involved, and in view of the major risks for society, early action regarding greenhouse gas control measures is the only reasonable response to the climate change challenge.
Figure 2. Millennial temperature reconstruction for the Northern Hemisphere (solid). Instrumental data (Red) from AD 1902-1998, a smoother version of the NH series (thick solid), a linear trend from AD 1000-1850 (dot dashed), and two standard error limits (yellow shaded) are also shown. (Copyright: American Geophysical Union). (Mann et al. 1999; see also http://apex.ngdc.noaa.gov/paleo/pubs/mann_99.html).
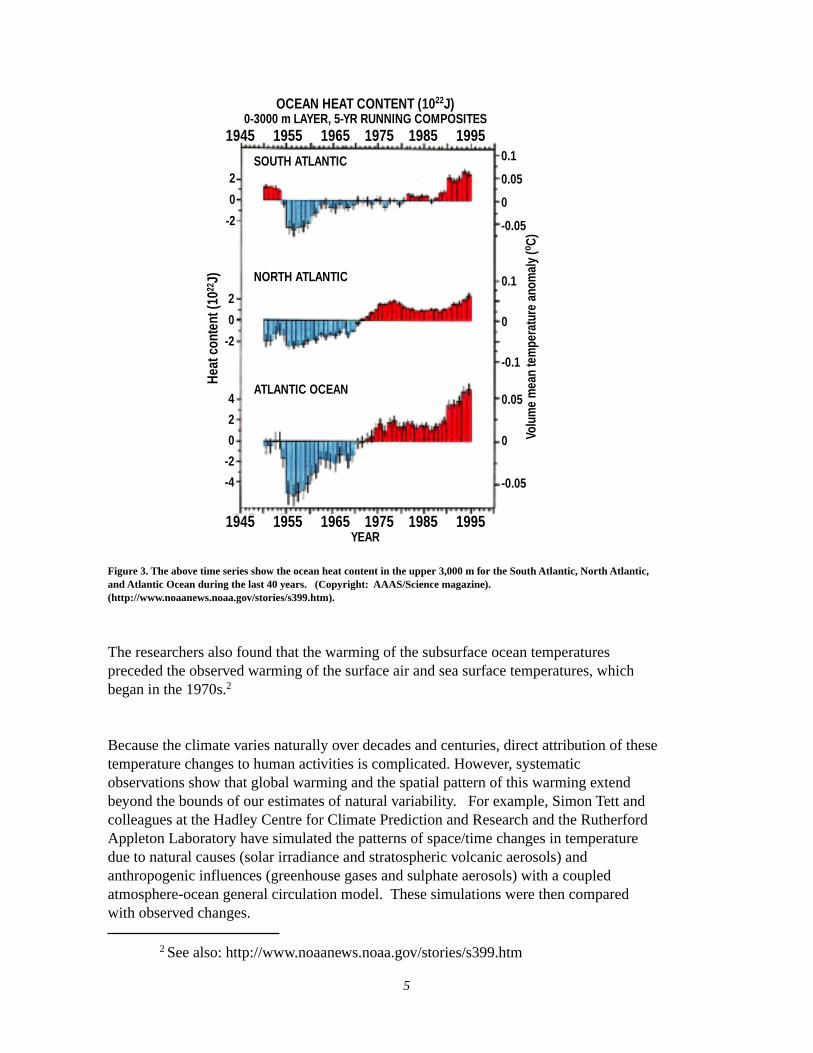
Researchers for the National Climate Data Center/National Oceanic and Atmospheric Association (NCDC/NOAA) have quantified the interannual-to-decadal variability of the heat content of the world ocean layer through a depth of 3,000 metres, for the period 1948 to 1998 (Levitus et al. 1999), see figure 3. The largest warming occurred in the upper 300 metres, on average by 0.56 degrees Fahrenheit (0.31oC). The upper 3,000 metres have warmed on average by 0.11oF (0.06oC) over the past 40 years. The Atlantic, Indian and Pacific basins were examined. The Pacific and Atlantic oceans have been warming since the 1950s and the Indian Ocean since the 1960s. The observed warming of the ocean layer is most likely caused by a combination of natural variability and anthropogenic effects.
Tem
pera
ture
Ano
mal
y (d
eg C
) 1.0
0.5
0.0
-0.5
-1.01000 1200 1400 1600 1800 2000
Year
1998
reconstruction (AD 1000-1980)instrumental data (AD 1902-1998)calibration period (AD 1902-1960) meanreconstruction (40 year smoothed)linear trend (AD 1000-1850)
536
5. Conclusions
On the basis of a systematic analysis of observed changes in average temperature, precipitation patterns and intensity, sea level, snow and ice cover, ocean and atmosphere circulation patterns, and ecosystems behaviour, we conclude with reasonable confidence that we are now experiencing the first effects of the increase of greenhouse gases in the atmosphere. At least part of the observed changes should be attributed to human-induced climate change.
Climate change for any particular location on Earth comes with changes in the nature and frequency of extreme weather events. Changes in the mean must have consequences for the intensity of extremes. Therefore the recently observed series of extreme weather events must have been influenced by the higher average temperatures. This implies that at least part of the damage caused by weather extremes is due to human-induced climate change. We draw this conclusion with reasonable but not absolute confidence, as the observed changes could, with low probability, still be attributed to natural climate variability.
A further rise in the concentrations of greenhouse gases in the atmosphere will lead to further changes in global climate. The consequences now expected are further rise of the mean global temperature, an increase in extreme rainstorms, a substantial rise of sea level and changing ocean/atmosphere circulation patterns with subsequent changing patterns, frequencies, and intensities of extreme weather events. Accurate regional predictions about future changes cannot be made so far.
Some regions may gain from climate change, especially in the north, while other regions will lose. In fact, climate change brings about a global redistribution of the costs and benefits of the weather. The costs will be greater than the benefits, as ecological and societal systems will have difficulty adapting. Moreover, (global) society does not have the instruments and institutions that could help to compensate the losers. Therefore, serious political tensions should be anticipated.
Besides gradual climate change and gradually increasing societal damage, a major additional risk is the possible destabilisation of global climate that could occur as a result of a stagnation of the Ocean Conveyor Belt, the collapse of the Antarctic Ice Sheet, or the release of more greenhouse gases as a result of the warming of the oceans and/or tundra areas. These are "low-probability, high-impact" phenomena of major importance in the debate about climate change and policy measures to limit greenhouse gas emissions.
Figure 3. The above time series show the ocean heat content in the upper 3,000 m for the South Atlantic, North Atlantic, and Atlantic Ocean during the last 40 years. (Copyright: AAAS/Science magazine). (http://www.noaanews.noaa.gov/stories/s399.htm).
The researchers also found that the warming of the subsurface ocean temperatures preceded the observed warming of the surface air and sea surface temperatures, which began in the 1970s.2
Because the climate varies naturally over decades and centuries, direct attribution of these temperature changes to human activities is complicated. However, systematic observations show that global warming and the spatial pattern of this warming extend beyond the bounds of our estimates of natural variability. For example, Simon Tett and colleagues at the Hadley Centre for Climate Prediction and Research and the Rutherford Appleton Laboratory have simulated the patterns of space/time changes in temperature due to natural causes (solar irradiance and stratospheric volcanic aerosols) and anthropogenic influences (greenhouse gases and sulphate aerosols) with a coupled atmosphere-ocean general circulation model. These simulations were then compared with observed changes.
2 See also: http://www.noaanews.noaa.gov/stories/s399.htm
OCEAN HEAT CONTENT (1022J)0-3000 m LAYER, 5-YR RUNNING COMPOSITES
1945 1955 1965 1975 1985 1995
1945 1955 1965 1975 1985 1995
2
0
-2
0.1
0.05
0
-0.05
2
0
-2
4
2
0
-2
-4
0.1
0
-0.1
0.05
0
-0.05
Hea
t con
tent
(1022
J)
Volu
me
mea
n te
mpe
ratu
re a
nom
aly
(o C)
SOUTH ATLANTIC
NORTH ATLANTIC
ATLANTIC OCEAN
YEAR
356
Destabilisation of the global climate has low probability but far-reaching consequences. As climate is a very complex and relatively unknown and unique system, one should take such low-probability, high-impact phenomena into account.
In general, a reduction in the emission of greenhouse gases will lead to a reduction in the rate of climate change and also to a reduction of the risk of a destabilisation of global climate.
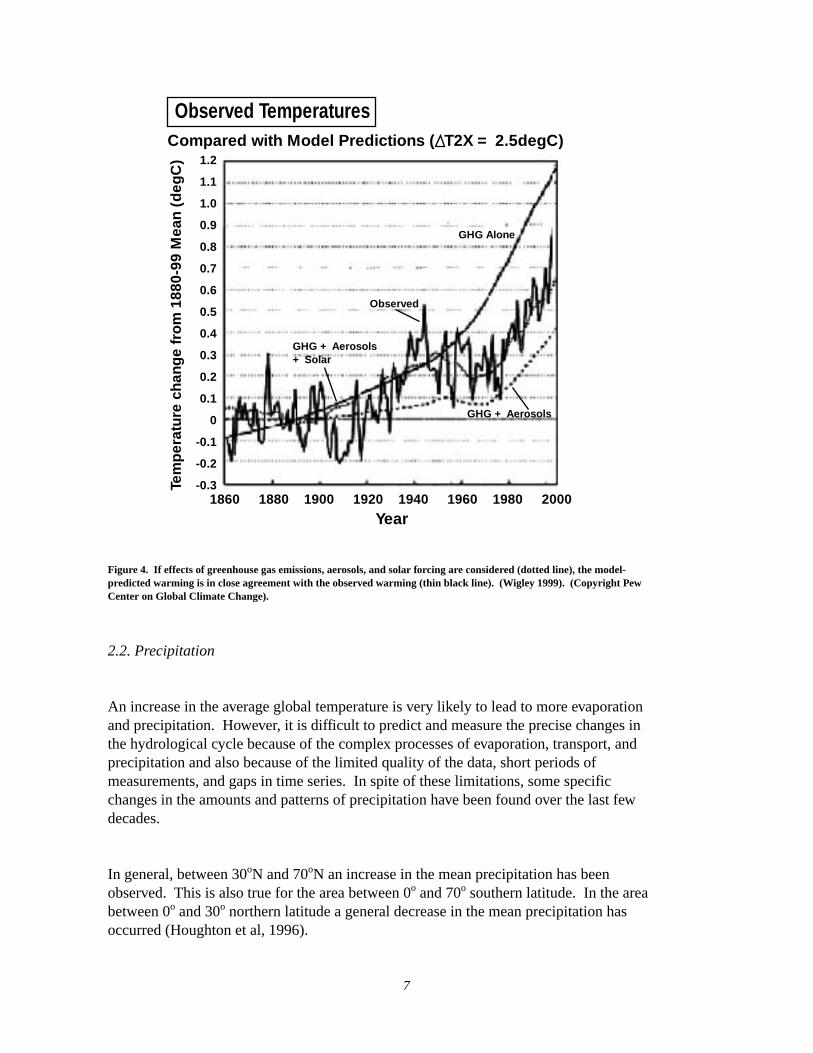
The results of this study indicate that a combination of natural causes, in particular an increase in solar forcing, may have contributed to temperature changes early in the century, but that the warming over the past 50 years must partly be attributed to anthropogenic components in order to explain the overall temperature rise during this period (Tett et al. 1999). This is confirmed through statistical analysis by Tol and Vellinga (1998). Regardless of the way the influence of the sun is included in the statistical model, the accumulation of carbon dioxide and other greenhouse gases in the atmosphere significantly influence the temperature. Tol and Vellinga find that the estimated climate sensitivity is substantially affected only if the observed record of the length of the solar cycle is manipulated beyond physical plausibility.
The various contributions to the rising global average temperature have been modelled by Wigley in The Science of Climate Change (1999). His results confirm the modelling work of the Hadley Centre and the statistical work by Tol and Vellinga (see figure 4). As can be seen in figures 1 and 4, the global mean temperature has rapidly risen since the late 1980s.
The global temperature change is not equally distributed. The largest recent warming is between 40oN and 70oN. In a few areas, such as the North Atlantic Ocean north of 30oN, the temperature has decreased during the last decades (Houghton et al. 1996). In general, the land area warms faster then the oceans due to the much larger heat capacity of the oceans. As a result temperature differences between oceans and land increase, most probably affecting atmospheric circulations.
734
Most climate models indicate modest temperature rises around Antarctica over the next 50 years. Over this time period, increased precipitation will probably more than compensate for increased surface melting. However, after these 50 years with continued temperature rise Antarctica may start to warm enough to have a significant impact on particularly vulnerable parts of the ice sheet.
The interpretations about present and future changes concerning Antarctica are considerably complex and in some cases contradictory.
Still, it is clear that small changes in the West Antarctic Ice Sheet can lead to a sea level rise on the order of metres. With a continued increase of greenhouse gas emissions, the most likely scenario is that the ice sheet will disappear in the ocean over a period of 500-700 years, but there is a very small chance this may happen in the next 100 years. Sea level could then rise abruptly between 4 and 6 metres.
4.3. Other low-probability, high-impact climate change feedback mechanisms
Three other mechanisms with a small chance of occurrence, but with far-reaching consequences are discussed below.
The cool and humid climate of the boreal zone (northern region of Europe and Asia) has created conditions suitable for the accumulation of carbon in soils. About 40 percent of the estimated global carbon reservoir in forests is stored in the boreal zone. Global warming could alter this situation, affecting the stored carbon and leading to a positive feedback. The carbon reservoir is 1.2-1.5 times larger in the boreal soils than in the atmosphere (Posch et al. 1995).
The increase of ocean temperatures as a result of global warming could lead to decreased solubility of carbon dioxide, and thus turn regional sinks into sources of higher carbon dioxide concentrations in the atmosphere.
The potential feedback between climate change and methane clathrate could enhance global warming. Methane clathrate is an ice-like compound in which methane molecules are caged in cavities formed by water molecules. It forms in the oceans in continental slope sediments. It is stable under certain temperature-depth combinations, and most of it is of biological origin. With warming it could move from a stable to an unstable condition, resulting in the release of enormous amounts of enclosed methane. This could lead to a complete destabilisation of present climate. It should be stated that this model is rather speculative, it is based on a number of assumptions that have not been verified (Harvey 1994).
Figure 4. If effects of greenhouse gas emissions, aerosols, and solar forcing are considered (dotted line), the model-predicted warming is in close agreement with the observed warming (thin black line). (Wigley 1999). (Copyright Pew Center on Global Climate Change).
2.2. Precipitation
An increase in the average global temperature is very likely to lead to more evaporation and precipitation. However, it is difficult to predict and measure the precise changes in the hydrological cycle because of the complex processes of evaporation, transport, and precipitation and also because of the limited quality of the data, short periods of measurements, and gaps in time series. In spite of these limitations, some specific changes in the amounts and patterns of precipitation have been found over the last few decades.
In general, between 30oN and 70oN an increase in the mean precipitation has been observed. This is also true for the area between 0o and 70o southern latitude. In the area between 0o and 30o northern latitude a general decrease in the mean precipitation has occurred (Houghton et al, 1996).
Observed TemperaturesCompared with Model Predictions ( T2X = 2.5degC)
Tem
per
atur
e ch
ang
e fr
om
188
0-99
Mea
n (d
egC
) 1.2
1.1
1.0
0.9
0.8
0.7
0.6
0.5
0.4
0.3
0.2
0.1
0
-0.1
-0.2
-0.31860 1880 1900 1920 1940 1960 1980 2000
Year
Observed
GHG + Aerosols+ Solar
GHG + Aerosols
GHG Alone
338
In addition to these global changes, a few regional changes in the mean precipitation have been observed. In North America the annual precipitation has increased (Karl et al. 1993b; Groisman and Easterling 1994). In the northern region of Canada and Alaska a trend of increasing precipitation has been detected during the last 40 years (Groisman and Easterling 1994). Data from the southern part of Canada and the northern region of the United States show an increase of 10 to 15 percent (Findlay et al.1994; Lettenmaier et al. 1994). In general, an increase in precipitation can be found in Northern Europe and a decrease in Southern Europe. The amounts of precipitation in the Sahel, West Africa, in the period from 1960 to 1993 were lower than in the period before 1960 (Houghton et al. 1996).
Several analyses of precipitation observations indicate that rainstorm intensity has increased over the past decades. In the United States for example, 10 percent of the annual precipitation falls during very heavy rainstorms (at least 50 mm per day). At the beginning of this century this was less then 8 percent (Karl et al. 1997). According to Groisman et al. (1999), heavy rainstorms account for a 10 percent change in the mean total precipitation when there is no change in the frequency of precipitation. The mean total precipitation has changed, and for those areas where precipitation has increased heavy precipitation rates should be higher. For example, analyses of precipitation patterns in the USA (Karl and Knight 1998), the former USSR, South Africa, China (Groisman et al. 1999) and India (Lal et al. 1999) show a significant increase in heavy rainstorms.
2.3. Sea level rise
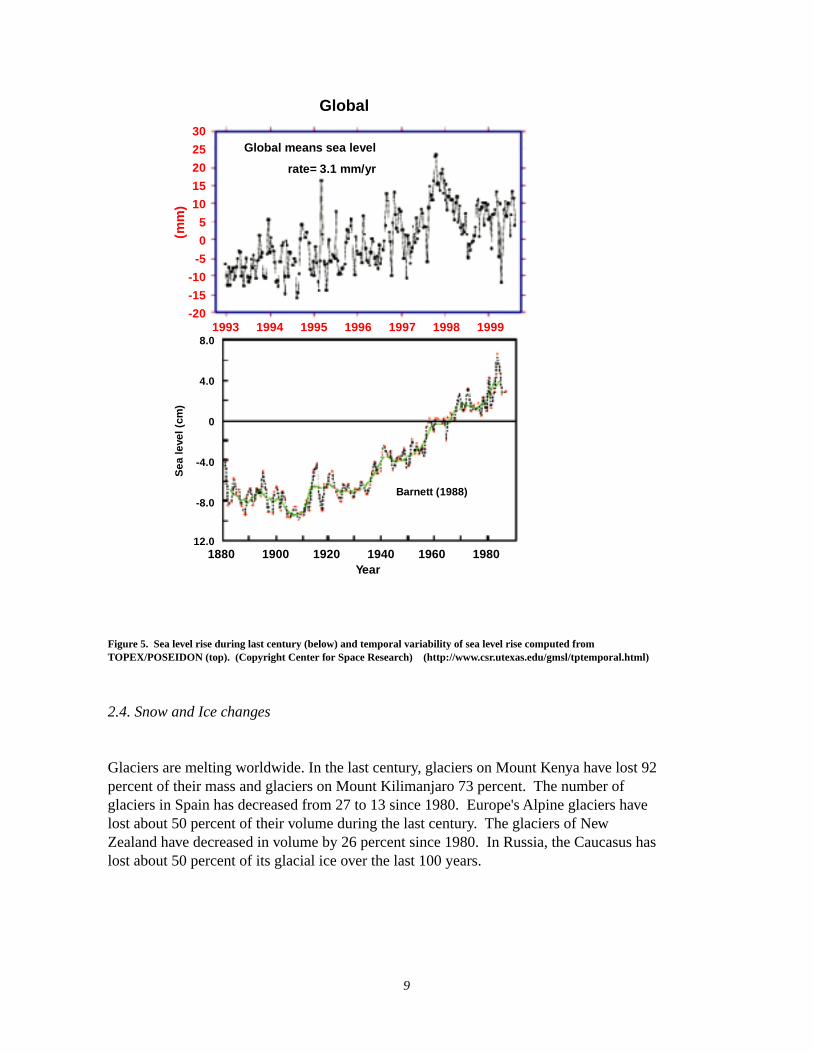
Over the last 100 years, sea level has risen between 10 and 25 centimetres worldwide. While this rise in sea level may be seen as the tail end of a continuous rise since the last ice age, sea level has risen most sharply over the last 50 years (see figure 5). Monitoring of sea level rise is complicated, as the vertical landmass movements are, to some unknown extent, always included in the measurements. However, since 1990, improved methods have been developed to compensate for the vertical landmass movements. At this moment it has been established with high confidence that the volume of ocean water has increased.
It is most likely that the recent increase in the rate of sea level rise is related to the observed increase of the Earth's global temperature and the ocean sea surface temperature. The volume of the ocean surface water layer expands per 0.1oC warming of the surface layer of the oceans, such that the sea level rises about 1 centimetre. Thus, the measured 0.6oC-sea surface temperature increase explains a 6 centimetres sea level rise. The observed melting and retreating of glaciers and ice sheets indicates an additional sea level rise between 2 and 5 centimetres.
Wood and colleagues (1999) present greenhouse warming projections computed with a climate-model, which for the first time gives a realistic simulation of large-scale ocean currents. They show that one of the two main "pumps" driving the formation of North Atlantic Deep Water could stop over a period of a few decades. There are two main convection sites namely in the Greenland and Labrador Seas. The one in the Labrador Sea could have a complete shutdown (Rahmstorf 1999). As stated above, such a shutdown would have dramatic consequences for the population and ecosystems in the Northern Hemisphere, in particular in Europe.
4.2. Antarctica
Another risk with low probability but high impact concerns Antarctica, in particular the West Antarctic Ice Sheet. A sea level rise of 4-6 m is possible if this ice sheet collapses. Current ice shelf breakups in the Antarctic Peninsula are linked to increased mean annual and summertime surface air temperatures, an increase in mean melt season, and thus more extensive regions of ponding, which causes break-up events (Scambos et al. 1999).
Figure 16. On 15 October 1998, an iceberg one-and-a-half times the size of the state of Delaware here "calved" off from the Antarctica's Ronne Ice Shelf.
Weddell Sea
Ronne Ice Shelf
Iceberg
932
4. Risks of a destabilisation of global climate
4.1. The Ocean Conveyor Belt
A major climate risk, quite different from the gradual rise in temperature and sea level, is the possibility of fast, flip-flop changes in climate. Such changes have a low probability and they are inherently difficult to predict, but when they occur they have a major impact on life on Earth.
A stagnation of the Ocean Conveyor Belt is one of such possible fast changes. The Ocean Conveyor Belt is a thermohaline circulation driven by differences in the density of seawater controlled by temperature and salinity. This conveyor belt transports an enormous amount of heat northward, creating a climate in northwestern Europe which is on average 8 degrees Celsius warmer than the mean value at this latitude. In the northern region of the North Atlantic the water cools and sinks, deep water is formed, moves south, and circulates around Antarctica, and then moves northward to the Indian, Pacific, and Atlantic basins. It can take a thousand years for water from the North Atlantic to find its way into the North Pacific. Density differences between seawater determine the 'strength' of the 'conveyor belt' circulation. A change in these density differences as a result of climate change could lead to a 'weakening' or even a stagnation of this ocean current. Stagnation would result in a climate in northwestern Europe such as that of Labrador and Siberia, with more than 6 months of snow cover every year.
The conveyor belt circulation pattern is susceptible to perturbations as a result of injections of excess freshwater (precipitation, melting) into the North Atlantic. Climate models indicate an increase of precipitation at higher latitudes. As a result of such a freshwater injection the conveyor could stop within100 to 300 years from now. The total shutdown of the conveyor will probably take less then 10 years after 100 to 300 years from now. Ice core records indicate that past cessation in the conveyor belt resulted in a drop of 7 degrees Celsius. Ice core records and models suggest that the conveyor circulation eventually reestablished itself, but only after a hundred to a thousand years (Broecker 1996).
Since Broecker's 1996, work, a number of modelling groups have indeed found a decrease in the strength of the conveyor circulation with greenhouse gas forcing, resulting in a cooling of the North Atlantic Ocean. The process is as follows: An increase in precipitation at higher latitudes leads to a decrease in salt concentration in the surface water. Currently, sinking of salt water in the vicinity of Greenland "pulls" warm water to the North Atlantic Ocean with lower salinity (due to the freshwater). This sinking at higher latitudes diminishes and the strength of the conveyor circulation could decrease. In the long term this source of heat for northwestern Europe could be shut off or weaken significantly.
Figure 5. Sea level rise during last century (below) and temporal variability of sea level rise computed from TOPEX/POSEIDON (top). (Copyright Center for Space Research) (http://www.csr.utexas.edu/gmsl/tptemporal.html)
2.4. Snow and Ice changes
Glaciers are melting worldwide. In the last century, glaciers on Mount Kenya have lost 92 percent of their mass and glaciers on Mount Kilimanjaro 73 percent. The number of glaciers in Spain has decreased from 27 to 13 since 1980. Europe's Alpine glaciers have lost about 50 percent of their volume during the last century. The glaciers of New Zealand have decreased in volume by 26 percent since 1980. In Russia, the Caucasus has lost about 50 percent of its glacial ice over the last 100 years.
Global
Global means sea level
rate=3.1 mm/yrS
ea le
vel (
cm)
8.0
4.0
0
-4.0
-8.0
12.01880 1900 1920 1940 1960 1980
1993 1994 1995 1996 1997 1998 1999
Year
Barnett (1988)
30
25
20
15
10
5
0
-5
-10
-15
-20
(mm
)
3110
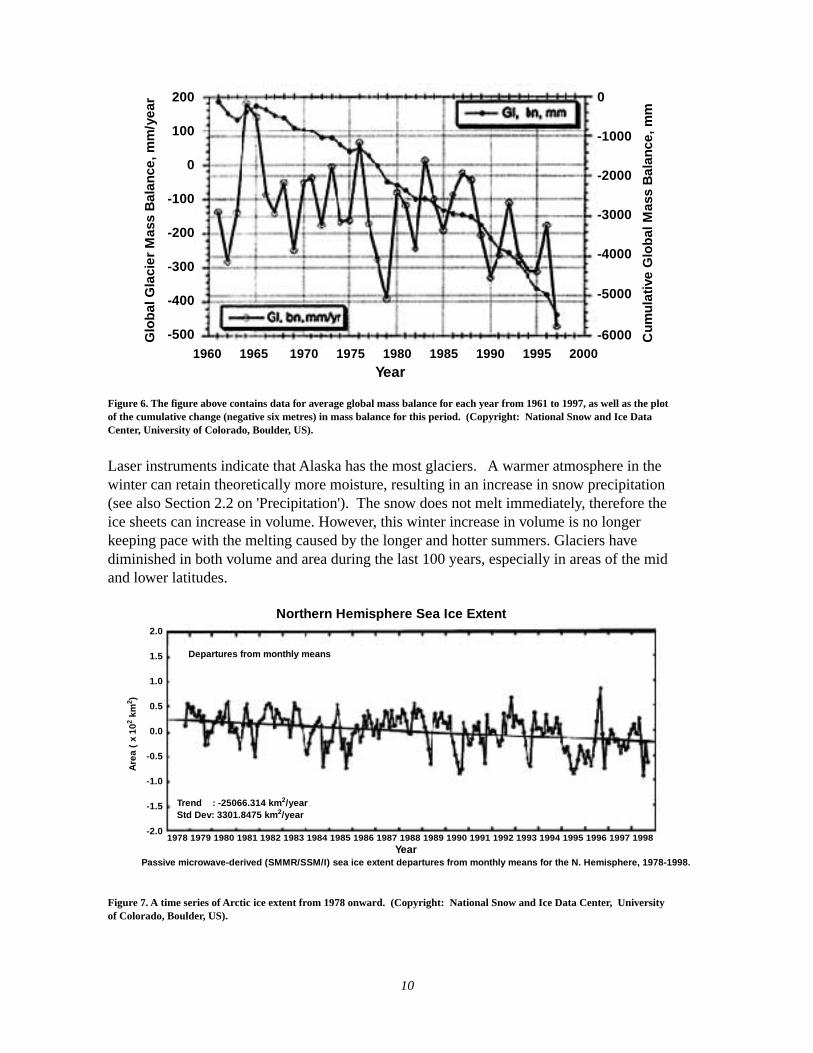
Figure 6. The figure above contains data for average global mass balance for each year from 1961 to 1997, as well as the plot of the cumulative change (negative six metres) in mass balance for this period. (Copyright: National Snow and Ice Data Center, University of Colorado, Boulder, US).
Laser instruments indicate that Alaska has the most glaciers. A warmer atmosphere in the winter can retain theoretically more moisture, resulting in an increase in snow precipitation (see also Section 2.2 on 'Precipitation'). The snow does not melt immediately, therefore the ice sheets can increase in volume. However, this winter increase in volume is no longer keeping pace with the melting caused by the longer and hotter summers. Glaciers have diminished in both volume and area during the last 100 years, especially in areas of the mid and lower latitudes.
3.7. Societal Aspects
The societal impacts of climate change will become manifest through changes in the nature and the frequency of extreme weather events such as flooding, storms, heat waves, and dry spells. It is likely that we are now witnessing the first signals. Historical series of extreme weather events cannot be applied with confidence anymore, and it becomes much more difficult to predict the return period of extreme weather events. As a result economic damage, social disruption, and loss of life are likely to be substantial.
Climate change will also have some benefits, such as higher crop productivity where sufficient moisture is available, expansion of tourism, and lower costs for heating homes. On the other hand, more air-conditioning will be necessary in the summer. Shipping routes connecting the northern continents are presently not accessible but are much shorter than the existing routes. Global warming could make these routes more accessible and thus economically more attractive. The agricultural and forest areas in northern regions could take advantage of higher temperatures and higher carbon dioxide concentrations. However, it will take time to exploit this advantage, because society is not prepared for such a situation. For example, it will be necessary to construct new infrastructures (roads, water-management, and cities). The readiness to invest, to make it possible to exploit these advantages, will strongly depend on the certainty we have about the nature of changes in future climate. This is exactly the problem: the climate will no longer be predictable, at least not at the local level.
Climate change means a global redistribution of costs and benefits of the weather. The costs will be greater than the benefits, as society is not prepared for weather surprises and it takes time to adjust and reap the benefits. In fact climate change is an additional uncertainty in economic development and thus an additional cost factor. And last but not least, (global) society does not have the instruments and institutions that can redistribute or settle the damage. Therefore, climate change is likely to lead to great political tensions. Beyond that there is the risk of a major destabilisation of the global climate. This is the focus of the next chapter.
Figure 7. A time series of Arctic ice extent from 1978 onward. (Copyright: National Snow and Ice Data Center, University of Colorado, Boulder, US).
200
100
0
-100
-200
-300
-400
-500
0
-1000
-2000
-3000
-4000
-5000
-60001960 1965 1970 1975 1980 1985 1990 1995 2000
Year
Cum
ulat
ive
Glo
bal
Mas
s B
alan
ce, m
m
Glo
bal
Gla
cier
Mas
s B
alan
ce, m
m/y
ear
1978 1979 1980 1981 1982 1983 1984 1985 1986 1987 1988 1989 1990 1991 1992 1993 1994 1995 1996 1997 1998
Passive microwave-derived (SMMR/SSM/I) sea ice extent departures from monthly means for the N. Hemisphere, 1978-1998.
Departures from monthly means
Trend : -25066.314 km2/yearStd Dev: 3301.8475 km2/year
2.0
1.5
1.0
0.5
0.0
-0.5
-1.0
-1.5
-2.0
Are
a (
x 10
2 km
2 )
Northern Hemisphere Sea Ice Extent
Year
1130
3.6. Ecosystems
Populations, which are part of an ecosystem, can only survive if the availability of water and the temperature varies within a specific range. Another population will replace the present population if these boundaries are exceeded. For some species the rate of replacement is slow (for example trees), for other species fast. Therefore, climate change will probably imply imbalances and/or disruptions within ecosystems, likely resulting in abrupt changes. Climate change will disturb the function of several ecosystems because interactions between mutually dependent species will be disrupted (finally resulting in tree and plant diseases for example). This is likely to have serious impacts on bio-diversity, agriculture and society ("natural disasters," plant diseases, etc.). In order to indicate the potential consequences of climate change for some unique ecosystems, a few examples are presented below.
The frequency and intensity of coral bleaching will probably increase in the future. The outputs of four GCMs were used to analyse the changes in coral bleaching episodes caused by temperature changes (Hoegh-Guldberg, 1999a). In 20-40 years coral bleaching events could be triggered by seasonal changes in seawater temperature. At this moment coral bleaching events are triggered by El Niño events. The frequency of coral bleaching could reach the point when coral reefs no longer have enough time to recover.
According to Fleming and Candau (1997), climate change will have severe consequences for the Canadian forests- probably more frequent, extreme storms and wind damage, greater stress due to drought, more frequent and severe fires, insect disturbances, and in some areas increased vegetative growth rates.
A warming of 3.0 to 6.4oC (the range of different models caused by doubling CO2 for the area under consideration) could lead to loss of alpine tundra between 44o and 57oN, but separated populations of alpine tundra may persist below climatic tree line in small patches of open habitat (Delcourt and Delcourt 1998).
Global warming will certainly affect the largest continuous mangrove forest system in the world, the Sundarbans in Bangladesh and India. The Sundarbans mangrove system is unique in terms of a high biodiversity (rich fauna and flora) and its economic and environmental values. An increase in temperature and thus salinity may affect certain species. Sea level rise will inundate parts of the Sundarbans, and result in a change of habitat and the dying or migration of certain species. More frequent or severe storms as a result of climate change also may affect the wildlife of the Sundarbans.
Vinnikov et al. show that the Northern Hemisphere sea ice extent has decreased during the past 46 years. The Geophysical Fluid Dynamics Laboratory (GFDL) model and the Hadley Centre model, both forced with greenhouse gases and tropospheric sulfate aerosols, simulate the observed trend in sea ice extent realistically. Consequently, the decrease in sea ice extent can be interpreted as the combination of greenhouse warming and natural variability. The probability that the magnitude of the observed 1953-98 trend (-190.000 km2 per 10 years) in sea ice extent is caused only by natural variability is <0.1 percent according to a long-term control run of the GFDL model. For the observed 1978-98 trend (-370.000 km2 per 10 years) the probability is <2 percent. Others have also reported diminished sea ice cover extent in regions such as the Northern Hemisphere 1978-1995 (Johannessen et al. 1996), the eastern Arctic Ocean and Kara and Barents seas 1979-1986 (Parkinson 1992), and the East Siberian and Laptev seas 1979-1995 (Maslanik et al. 1996). Parkinson et al. (1999) used satellite passive microwave data for November 1978 through December 1996, which reveal an overall decreasing trend (-34.300 ± 3700 km2/yr) in Arctic ice sea extents. Recently, scientists at the Goddard Space Flight Center have combined data from the Scanning Multichannel Microwave Radiometer (SSMR) and the Special Sensor Microwave/Imager (SSM/I), launched by NASA in 1978 and 1987 respectively (see figure 7 and 8).3 Trends estimated from these data suggest a net decrease in Arctic ice extent of about 2.9 percent per decade (Cavalieri et al. 1997).
Rothrock et al. concluded from a comparison of sea ice draft measurements during submarine cruises between the periods 1993 to 1997 and 1958 to 1976 that the sea ice cover has decreased by about 1.3 m in thickness. The decrease is greater in the central and eastern Arctic than in the Beaufort and Chukchi seas.
3Also see: http://gcmd.gsfc.nasa.gov/cgi-bin/md/ for more information.
2912
Human induced climate change does not necessarily alter the nature of the dominant patterns of natural variability, but will probably be projected on these patterns resulting in a change in frequency and/or strength. Although the global coupled atmosphere ocean models have been improved over the last five years, most of the present models remain limited in simulating complex observed natural variability. This is why reaching an overall consensus on the relations between climate change and changing weather variability and extremes is difficult.
3.5. (Extra)-tropical cyclones
Carnell and Senior (1998) find that with increasing greenhouse gases the total number of Northern Hemisphere storms decreases, but there is a tendency toward deeper low centres, thus an increase in the severity of storms. The modelling work and observational analysis of Lambert (1995) supports this. However, another study found a reduction of intensity (Beersma et al. 1997). At this moment, many greenhouse gas forced models suggest a change in the behaviour of cyclones, but there is little agreement yet between the models about the precise changes.
The formation of tropical cyclones depends not only on the sea surface temperature, but also on a number of atmospheric factors. Although several models simulate tropical cyclones with some realism, the scientific understanding of the behaviour of tropical cyclones is insufficient and does not yet allow assessment of future changes. The global number of tropical cyclones could stay constant, but the intensity of the strongest is likely to increase.
ENSO and tropical cyclones are strongly related (section 2.5). Most greenhouse forced models project an increase in El Niño conditions likely interspersed with stronger but shorter La Niña events (section 3.4). The activity of tropical cyclones that are positively influenced by El Niño events will probably increase.
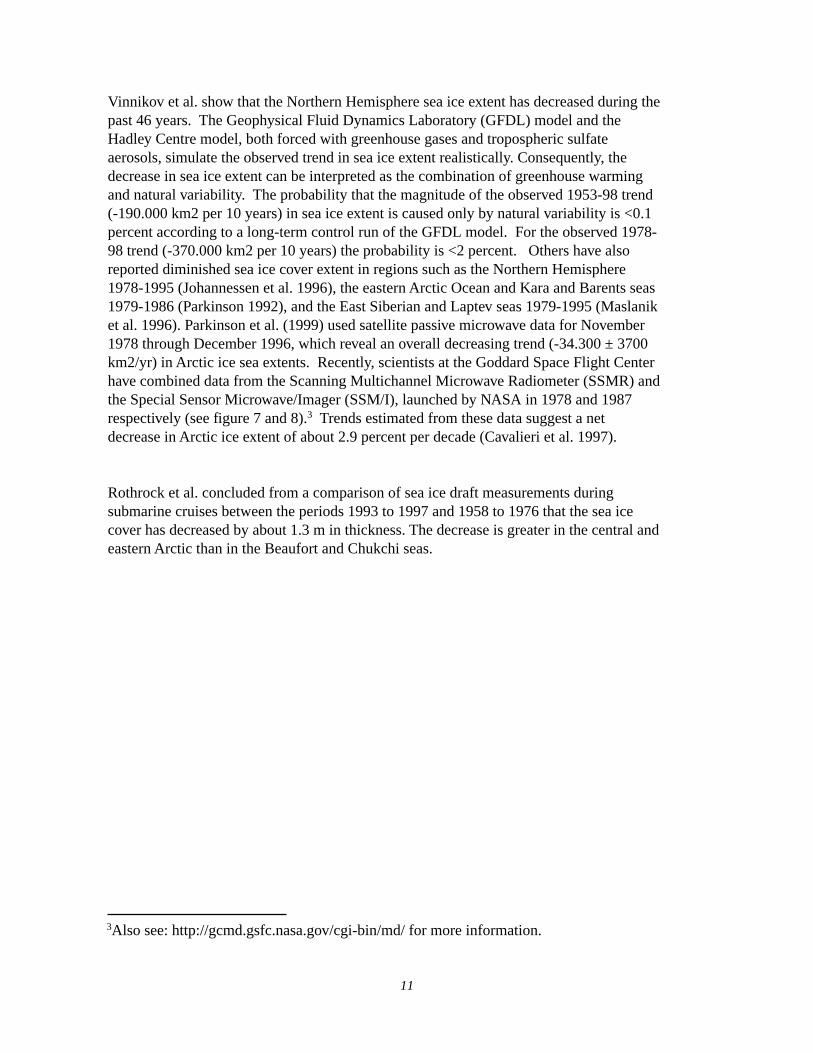
Figure 8. Arctic sea ice trends 1979-1995. (Copyright: National Snow and Ice Data Center, University of Colorado, Boulder, US).
All these recent trends and variations in sea ice cover and thickness are consistent with recorded changes in high-latitude air temperatures, winds, and oceanic conditions.
2.5. Circulation patterns
Atmospheric circulation
Land surfaces absorb less heat than ocean surfaces. This is why the surface temperatures above land respond faster to an increase in radiative forcing than the ocean surfaces. One way or another this temperature difference will affect the atmospheric circulation patterns, the wind speed distribution/frequencies, and the strength and trajectories of high-and low-pressure fields.
1328
3.4. Circulation patterns
El Niño and the North Atlantic Oscillation
Most of the models indicate that the El Niño-Southern Oscillation (ENSO) will intensify under increased greenhouse gas concentrations. Also, the intensity of weather phenomena associated with ENSO would increase. The mean increase of tropical seawater temperatures and the related increase in evaporation could cause enhanced precipitation variability associated with ENSO.
Research since 1996 suggests that El Niño events are likely to become more persistent and/or intense with increasing greenhouse gas concentrations, and be punctuated by strong La Niñas. Meehl, and Washington (1996) have found these results using a coupled Atmosphere Ocean Circulation Model. In addition, Boer et al. (1998) indicate, with models from the Canadian Centre for Climate Modelling and Analysis, an "enhanced warmth in the tropical eastern Pacific, which might be termed 'El Niño like".
Most global climate models, like the above-mentioned models, are too coarse in resolution to fully simulate the behaviour of ENSO in enhanced "greenhouse" warming conditions. However, a new model with a much finer resolution used by Timmerman et al. (1999) from the Max Planck Institute in Hamburg shows more frequent El Niño-like conditions and stronger cold events (La Niñas) in the tropical Pacific Ocean when the model is forced by future greenhouse warming. A number of models show an increase in El Niño conditions, likely interspersed with shorter and stronger La Niñas in a greenhouse gas enhanced world. This in turn means an increase in the frequency of conditions associated with El Niño-like heavy rains and storms interspersed with short dry spells in some regions, and more prolonged droughts punctuated by heavy rain years in other parts of the world.
Paeth et al. (1998) find a significant (at the 95 percent confidence level) increase in the mean North Atlantic Oscillation index when CO2 concentrations quadruple, which results in a more maritime climate (warmer winters). Also, two greenhouse warming forced models at the Max Planck Institute show an increase in the NAO index. On the other hand, a greenhouse forced model at the Hadley Centre in England suggests a decrease in the NAO index (KNMI 1999). Fyfe et al. (1999) show that greenhouse gas forcing gives more positive Arctic Oscillations and thus more positive NAOs.
In fact, an increase in the number of low-pressure areas has been detected in parts of the United States, the east coast of Australia, and the North Atlantic Ocean (Houghton et al. 1996).
Another phenomenon that is likely to be at least partly related to a change in circulation patterns is the relative dryness in North Africa over the last few decades. The Sahel has become much dryer over the last 25 years. This period of desiccation represents the most substantial and sustained change in rainfall within the period of instrumental measurements. This is likely to be related to the change in the Atlantic Ocean seawater surface temperatures. Lower temperatures south of the equator and higher temperatures north of the equator are correlated to a lower rainfall in the Sahel. The changes of the ocean water temperature most probably lead to a change in atmospheric circulation, as a result affecting the amounts of rain falling in the Sahel (Hulme and Kelly.)4
Recently, temperature changes have also been observed in the uppermost parts of the atmosphere. The observations indicate a cooling of the mesosphere, between 50 and 90 kilometres up, at an unprecedented rate - perhaps as much as 1°C per year for the past 30 years, according to Gary Thomas of the University of Colorado, Boulder. In addition, the stratospheric climate (the layer between 15 and 50 kilometres above the Earth's surface) has changed during past decades, especially above the Arctic, according to Hans-Friederich Graf, a senior scientist at the Max Planck Institute for Meteorology in Hamburg. This is qualitatively in line with greenhouse gas theory: greenhouse gases warm the troposphere; the heat produced at the lower levels cannot gradually diffuse upwards and the upper atmosphere cools down, a process known as radiative cooling.
Other processes besides radiative cooling may play a role. Shindell et al. (1999) suggest that a changing temperature gradient between the tropics and the poles may be responsible for the extra stratospheric cooling. The increasing temperature gradient from tropics to poles as a result of climate change increases the strength and speed of a strong winter wind, the polar night jet. This polar night jet in turn may have isolated cold, atmospheric Arctic air from surrounding influences. Changes in the atmospheric circulation caused by the greenhouse effect may enhance radiative cooling. A complementary explanation of the rapid mesosphere cooling
4 Also see: http://www.uea.ac.uk/menu/acad_depts/env/all/resgroup/cserge
2714
is given by Gary Thomas of the University of Colorado. He suggests a planetary scale wave phenomenon to be responsible.5
The conclusion we may draw is that important temperature and circulation changes are likely related to the enhanced greenhouse effect. Still, many of these processes are only partially understood and the data set is too small to draw definite conclusions.
El Niño and the North Atlantic Oscillation
As a result of increased investments in climate change research and atmosphere and ocean circulation analysis, the understanding of natural climate variability at the time scales of seasons, years, and decades has significantly increased. This is especially true for the ENSO (El Niño Southern Oscillation) and the North Atlantic Oscillation phenomena, which can now be simulated by coupled atmosphere-ocean general circulation models.
During non-El Niño years, east to west trade winds above the Pacific push water heated by the tropical sun westward. The surface water becomes progressively warmer because of its longer exposure to solar heating. From time to time the trade winds weaken and the warmer water flows back eastward across the Pacific to South America. This is what is called an El Niño event. El Niño is a natural climate event, occurring once every seven years on average. Widespread droughts and floods occur simultaneously in different parts of the world in association with El Niño.
The occurrence of an El Niño has profound implications for agriculture, forests (burning), precipitation, water resources, human health, and society in general (Trenberth 1996). Barsugli et al. (1999), for example, attributed large-scale weather events like the January 1998 ice storm in the northeastern United States and southeastern Canada, and the February 1998 rains in central and southern California, to the 1997-98 El Niño. There is also some evidence that strong El Niños are followed by increased rainfall in Europe the following Spring (KNMI 1999).
Figure 15. Global mean sea level changes according to different SRES scenarios. The minimum and maximum values are the result of using different sensitivities of 1.5oC and 4.5oC and low and high ice-melt model parameter values (Wigley 1999). (Copyright: Pew Center on Global Climate Change).
Changes in sea level will not be uniform. Regional changes will occur as a result of differences in both warming and ocean circulation changes. The predicted rise is mainly caused by thermal expansion of ocean water; melting of ice sheets and glaciers make a smaller contribution, while the projected increase in snowfall on Greenland and Antarctica has an opposite contribution. In the long term (centuries) this opposite contribution will diminish while the probability of a decrease in ice volume will grow.
Sea level continues to rise over many centuries even after stabilisation of the concentrations of greenhouse gases. This leads to sea level rise projections for 2300 that are a factor 2 to 4 greater than the 2100 projections, resulting in a best estimate sea level rise of 0.5 m to 2.0 m by 2300.
5Also see: http://www.newscientist.com/ns/19990501/contents.html
Central Sea Level Rise Estimates Plus Extremes
for th Preliminary SRES Scenarios
100
90
80
70
60
50
40
30
20
10
0
Sea
Lev
el R
ise
(cm
)
1990 2000 2010 2020 2030 2040 2050 2060 2070 2080 2090 2100
Year
Maximum
Minimum
A1
A2
B2
B1
1526
Figure 14. This graph shows the change in probability of a more than 100 mm yearly maximum 7-day rainfall event when the temperature rises with 2 or 4 degrees Celsius (Reuvekamp A, A. Klein Tank, KNMI, Change, June 1996, p. 8-10). (Copyright: KNMI/RIVM).
3.3. Sea level rise
"Best estimate" parameters values for sea level rise indicate a level which is projected to be 46-58 centimetres higher than today by the year 2100 (Wigley, 1999). These "best estimate" values are based on best estimates for snow and ice melt and climate sensitivity. How the "autonomous" sea level rise is processed in the projections also affects the results of climate models. An overall range in sea level rise between 17 and 99 centimetres by the year 2100 is projected, when the different estimations for melting, sea water expansion, and climate sensitivities are taken into account (see figure 15).
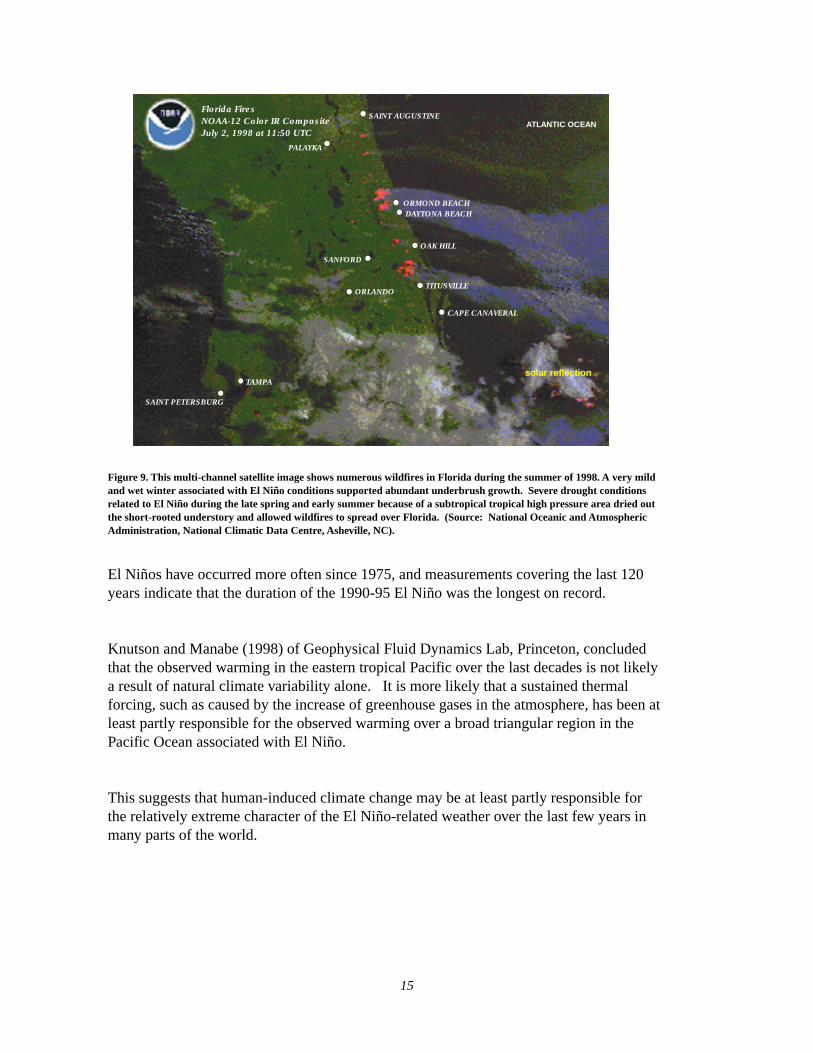
Figure 9. This multi-channel satellite image shows numerous wildfires in Florida during the summer of 1998. A very mild and wet winter associated with El Niño conditions supported abundant underbrush growth. Severe drought conditions related to El Niño during the late spring and early summer because of a subtropical tropical high pressure area dried out the short-rooted understory and allowed wildfires to spread over Florida. (Source: National Oceanic and Atmospheric Administration, National Climatic Data Centre, Asheville, NC).
El Niños have occurred more often since 1975, and measurements covering the last 120 years indicate that the duration of the 1990-95 El Niño was the longest on record.
Knutson and Manabe (1998) of Geophysical Fluid Dynamics Lab, Princeton, concluded that the observed warming in the eastern tropical Pacific over the last decades is not likely a result of natural climate variability alone. It is more likely that a sustained thermal forcing, such as caused by the increase of greenhouse gases in the atmosphere, has been at least partly responsible for the observed warming over a broad triangular region in the Pacific Ocean associated with El Niño.
This suggests that human-induced climate change may be at least partly responsible for the relatively extreme character of the El Niño-related weather over the last few years in many parts of the world.
Florida FiresNOAA-12 Color IR CompositeJuly 2, 1998 at 11:50 UTC
PALAYKA
SAINT AUGUSTINEATLANTIC OCEAN
SANFORD
ORLANDO
SAINT PETERSBURG
TAMPA
ORMOND BEACHDAYTONA BEACH
OAK HILL
TITUSVILLE
CAPE CANAVERAL
solar reflection
Trend of extreme winter rainfall in awarmer climate (example: Netherlands)
160
140
120
100
80
60
40
20
Year
ly m
axim
um 7
-day
rai
nfal
l (m
m)
Probability
50 20 10 5 3 2 (%p.a.)
2 3 4 5 10 20 30 40 50 (years)
Return period
100 mm threshold
Source: A. Reuvekamp, A. Klein Tank, KNMI,Change 30, p. 8-10, June 1996
+4oC
+44%
+22%
factor 3
factor 8
+2oC
2516
North Atlantic Oscillation
The dominant pattern of wintertime atmospheric circulation variability over the North Atlantic is known as the North Atlantic Oscillation (NAO). This pattern is driven by a pressure difference between Iceland, a low-pressure area and a high-pressure area near the Azores. Positive values of the NAO index indicate stronger-than-average westerlies over the middle latitudes related to pressure anomalies in the above-mentioned regions. This positive phase is associated with warmer winters over Western Europe and colder winters over the northwest Atlantic. The NAO index has increased over the past 30 years with few exceptions, and since 1980 the NAO has tended to remain highly positive. This phenomenon is responsible for the exceptionally high mean temperature and the many particularly heavy rainstorms hitting Northwest Europe in the last 10 years.
However, one cannot relate any specific extreme weather event directly to climate change. In statistical terms, an annual precipitation with a chance of occurrence of 1 in 1000 per year is also possible within the range of a "constant" climate.
The Royal Netherlands Meteorological Institute suggests that global warming-induced changes in sea surface temperature and related changes in oceanic and atmospheric circulation patterns may be partly responsible for the observed persistently positive NAO index and the related warm and wet winters. But this cannot be proven because the measurement period is too short and the models still produce contradictory results (KNMI 1999). Although the KNMI is prudent in their conclusions, Corti et al. (1999) indicate that the observed warming of the Earth's surface does trigger changes in the frequency distribution of existing modes of climate variability like the observed NAO phenomenon. The Arctic Oscillation (AO) is an extension of NAO to all longitudes. The variability of AO and NAO is highly correlated. The NASA Goddard Institute for Space Studies General Circulation Model (GCM) found that much of the increase in surface winds and continental surface temperatures of the Northern Hemisphere are the result of the enhanced greenhouse effect. The comparison of various models indicates that the surface changes are largely driven by the effect of greenhouse gases on the stratosphere (Shindell et al. 1999).6
Various investigators (Cubasch et al. 1995b; Gregory and Mitchell 1995) project a shift in the distribution of daily precipitation amounts toward heavier rainstorms simultaneous with an increase in the number of dry days in some areas. The number of dry days may also increase where the mean precipitation decreases. This is why there may be an increase in the length of dry spells. For instance, the probability of a dry spell of 30 days in southern Europe is projected to increase by a factor of 2 to 5 for a doubling of the greenhouse gas concentrations, while the mean precipitation would decrease by only 22 percent (Houghton et al. 1996).
The future changes of precipitation in Europe include more precipitation (between +1 and +4 percent/decade) during the winter season in most of Europe. For the summer a marked difference in precipitation amount between northern and southern Europe is projected. Southern Europe is expected to become dryer (up to -5 percent/decade) while northern Europe is expected to become wetter (up to +2 percent/decade) during the summer.
Zwiers and Kharin (1998) concluded from their modelling experiments that precipitation extremes increase more than the mean. The mean increase of precipitation is approximately 4 percent while, for example, a 20-year extreme precipitation event return value would increase with 11 percent.
Precipitation intensity (rainfall amount per unit time) is expected to increase when the temperature rises (see figure 14). Whether it will rain somewhere depends on the relative humidity: the ratio between the concentration of water vapour and the saturation value. When the relative humidity reaches 100 percent, the water vapour condenses and precipitation is possible. According to computer-models the distribution of the relative humidity will hardly change when the climate changes. What will change when the temperature increases is the absolute humidity, the concentration of water vapour in the air, at the moment when the saturation value is reached (maximum water vapour concentration increases 6 percent for one degree Celsius temperature increase). A hotter climate may not cause changes in the frequency of the precipitation events (related to the number when the relative humidity reaches 100 percent), but certainly it will cause an increase in the amount of precipitation per event (related to the amount of water in the air at the point of saturation).
6 Also see: http://www.giss.nasa.gov/research/intro/shindell.04/index.html
1724
The temperature increase above landmasses in the Northern Hemisphere is expected to be about two times greater than the global mean increase which means 2.5 to 8oC temperature rise as best estimation for these landmasses, whereas the increase in the Southern Hemisphere, dominated by oceans, is expected to be lower than the global mean (IPCC 1995). As the landmasses cover only a minor part of the Earth, the warming in these areas deviates much more from the global average warming than the oceans of the Southern Hemisphere.
An increase in the mean temperature will also lead to a substantial increase in the probability of very warm summers see figure 13. This figure shows an example for the UK: a temperature increase of 1.6oC will increase the probability of a so-called hot summer from 1.3/100 per year to 33.3/100 per year in the UK.
Figure 13. A small change in the mean summer temperature in Central England (1.6oC) would cause a substantial increase in the probability of a very warm summer. The left curve is based on a 300 years weather record, the right curve shows the distribution of average summer temperatures for a temperature increase of 1.6oC. In this case the probability of a so-called hot summer in the UK would increase from 1.3/100 per year to 33.3/100 per year. (Source: Fig. 2.4 in CCIRG (1996) Review of the potential effects of climate change in the United Kingdom, Climate Change Impacts Review Group. HMSO, London, 247pp.).
3.2. Precipitation
Nearly all models project that an increase in precipitation intensity will come with increasing greenhouse gas concentrations. Generally warmer temperatures will lead to a more vigorous hydrological cycle (Houghton et al. 1996). The global mean precipitation will increase by 4 to 20 percent. However, the differences on a regional scale are substantial.
2.6. (Extra)-tropical cyclones
With global climate change, a possible change in the occurrence and behaviour of tropical and extra-tropical cyclones may be expected. A few very severe cyclones, like Andrew, Mitch, and Floyd, have occurred during the last 10 years. However, series of severe cyclones have happened before, so a direct relation with climate change may not exist. Reliable records of tropical cyclone activities show substantial multidecadal regional variability and there is no clear evidence of a long-term trend in the global activity of tropical cyclones (Henderson-Sellers et al. 1998). Similarly, the WASA (Waves and Storms in the North Atlantic) Group concludes that part of the variability of the storm and wave climate in most of the northeast Atlantic and in the North Sea is related to the North Atlantic Oscillation and not to global climate change (WASA Group 1998). However, if the NAO regime is related to sea surface temperature as explained in the previous section, then part of the relatively extreme wave and storm regime is of course related to global climate change and the enhanced greenhouse effect after all. Also, tropical sea surface temperature anomalies near Indonesia, related to El Niño, could influence NAO (KNMI 1999). If human induced climate is indeed responsible for the behaviour of the ENSO phenomenon, then the change in the NAO regime is indirectly linked to the enhanced greenhouse effect.
The influence of El Niño on tropical cyclone activity is more clear. For example, El Niño events increase tropical cyclone activity in some basins (like the central North Pacific near Hawaii, the South Pacific, and the Northwest Pacific between 160oE and the Dateline (Chan 1985; Chu and Wang 1997; Lander 1994), and decrease it in other basins like the Atlantic, the Northwest Pacific west of 160oE, and the Australian region (Nicholls 1979; Revelle and Goulter 1986; Gray 1984).
La Niña events bring opposite conditions. Pielke and Landsea (1999) found a relationship between the ENSO cycle and U.S. hurricane losses. The probability of the occurrence of more than US $1 billion in damages is 0.77 in La Niña years 0.32 in El Niño years and 0.48 in neutral years. Pacific sea temperatures and Atlantic hurricane damages are strongly related. As at least part of the observed temperature rise can be attributed to the enhanced greenhouse effect, we conclude that the changes in tropical cyclone activity are at least partly the result of human-induced climate change.
The overall causal relationship may be that the increase in greenhouse gas concentrations in the atmosphere causes a rise in sea surface temperatures. As mentioned before, climate change induced changes in sea surface temperature and related changes in oceanic and atmospheric circulation patterns may be partly responsible for the observed persistently positive NAO index and the related warm and wet winters. The intensity of ocean and atmospheric circulation
Increasing Probabilities of ExtremesExample: Summer Temperatures in Central England
Source: Climate Change Impacts UK 1996
1695
1816
1975
1983
1995
1826
1976
16.9 17.316.214.412.6 15.3oC
1961-90T = 15.3oC
2050sT = 16.9oC
3o 1o
T = 1.6oC
factor 25}p = 33.3%p = 1.3%
2318
phenomena such as El Niño increases with rising sea surface temperatures. In turn, the severity of weather extremes in many parts of the world correlates positively with the strength of the El Niño phenomenon. This is a hypothesis, but a plausible one. It is difficult to fully test the hypothesis as the record of measurements is too short and the various modelling groups do not yet produce fully identical results when it comes to the simulation of the global circulation phenomena under conditions with increased radiative forcing.
2.7. Observed changes in ecosystems
Coral reefs represent a mutually life-sustaining association between algae and coral. Coral reef bleaching, caused by abnormally high seawater temperatures, is a reduction in the density of algae or algal pigments. Coral reef bleaching episodes were observed in 1980, 1982, 1987, 1992, 1994, and 1998 in the Great Barrier Reef near Australia and many other places in the world. Coral bleaching events worldwide have become more frequent since the 1980s and the IPCC concluded that the observed increase is consistent with measured seawater temperature increases.
Research shows that the population of cod in the North Sea is negatively affected by a decline in the production of young cod. According to O'Brien et al., this decline is not only related to overfishing but to significantly warmer seawater temperatures over the past 10 years (O'Brien, C.M. et al. 2000). Overfishing in combination with higher temperatures endangers the long-term sustainability of cod in the North Sea.
Insects, which are especially sensitive to changes in temperature and precipitation, may be some of the best indicators of climate change. Several researchers have found evidence of poleward shifts of various butterfly species in North America and Europe (Parmesan 1996; 1999).
Alpine plants have migrated to higher areas in the central Pals of Austria and the east of Switzerland, according to researchers at the University of Vienna. Local observations indicate a temperature increase of 0.7oC during the last 90 years (Grabherr et al. 1994).
These studies point in the direction of ongoing change; however, a definitive attribution to the enhanced greenhouse effect is still disputed. The studies illustrate that ecosystems are very sensitive to changes in temperature.
Figure 12. This graph shows modelled temperature change when different emission scenarios are considered. The minimum and maximum values are the result of using different sensitivities of 1.5oC and 4.5oC (Wigley 1999). (Copyright: Pew Center on Global Climate Change).
Carbon dioxide Global Global
Concentration Temperature Sea-level rise
(ppmv) (ºC) (cm)
2050s 2080s 2050s 2080s 2050s 2080s B1-low 479 532 0.9 1.2 13 19 B2-mid 492 561 1.5 2.0 36 53 A1-mid 555 646 1.8 2.3 39 58 A2-high 559 721 2.6 3.9 68 104
Table 1. Global changes caused by the different emission scenarios. Aerosols are not taken into account (Source: Hulme et al. 1999).
Central Temperature Estimates Plus Extremes
for the Preliminary SRES Scenarios
4.5
4
3.5
3
2.5
2
1.5
1
0.5
0
Tem
per
atur
e C
han
ge
(deg
C)
1990 2000 2010 2020 2030 2040 2050 2060 2070 2080 2090 2100
Year
Minimum
Maximum
A2
A1 B2
B1
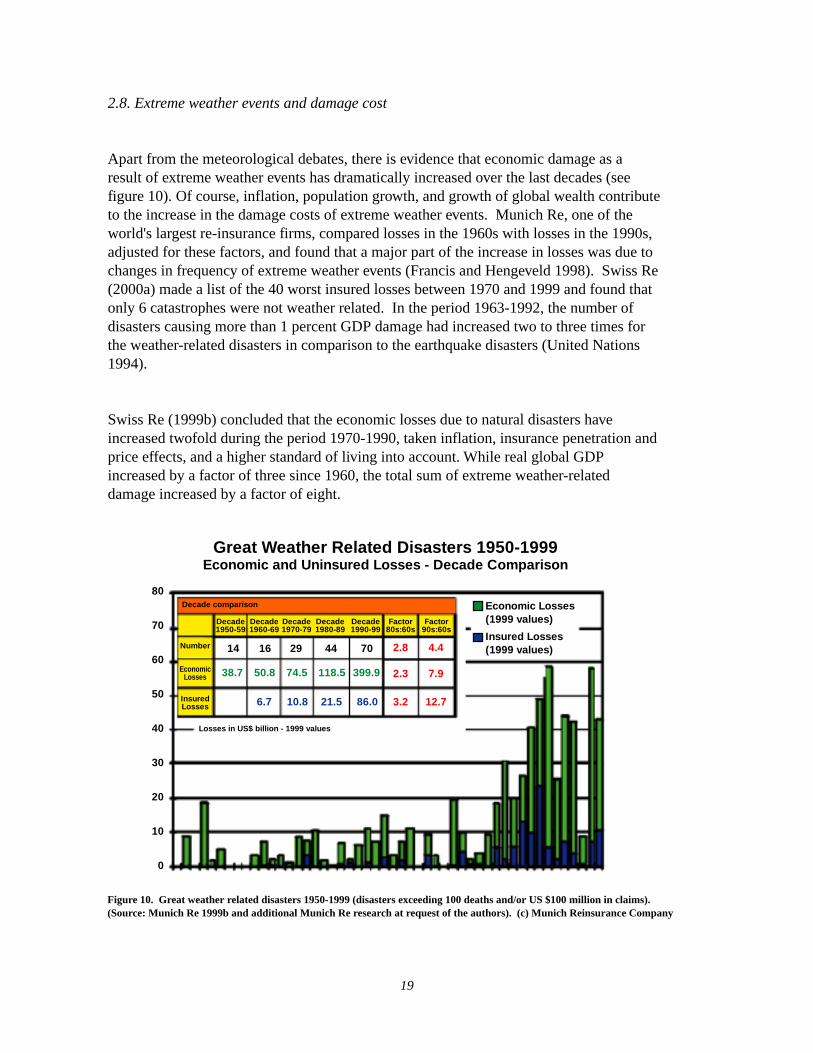
1922
3. Projections of future climate change
The climate response to an increase in greenhouse gases and sulphate aerosols has been compared with the observed patterns of temperature change by many different research groups. Such studies show a clear similarity between the observed changes and the model calculations. This is why the IPCC concluded "the balance of evidence suggests a discernible human influence on global climate" (IPCC 1995). In other words, it is very likely that the enhanced greenhouse effect already contributes to the observed changes in the global climate.
The quality of model simulations of current and past climate, and also of shorter prediction periods like El Niño, has increased over the last few years. As a result, the confidence in predictions of future climate change is also increasing. According to Le Treut and McAvaney there are still substantial disagreements in the amplitude of changes in the air temperature, water vapor, and clouds, and in details of their distribution between models forced by a doubling of atmospheric concentrations of CO2. 8 Thus, it will remain difficult to predict the climate at the regional or local scale. This is because natural climate variability can either amplify or weaken the effects of human-induced climate change. Prediction on a regional scale is difficult because of the complexity of the climate system. Nevertheless, a few statements with considerable certainty can be made regarding temperature, precipitation, sea level rise, atmospheric circulation, cyclones, and certain ecosystems. The major findings based on an assessment of the most recent literature are presented below. The possibility of relatively unpredictable rapid changes in the climate will also be discussed.
3.1. Temperature
With ongoing increases in greenhouse gas concentrations in the atmosphere, the global average temperature is expected to rise between 1.3oC and 4.0oC by the year 2100, dependent on the chosen scenario, according to climate models using the most recent emission scenarios (see figure 12 and table 1). These preliminary scenarios were developed for an IPCC Special Report on Emission Scenarios (SRES) because the IS92 scenarios, developed in 1992, have some well-recognised limitations (Wigley 1999). The most marked difference between SRES scenarios and IS92 scenarios are the lower SO2 emissions in the SRES scenarios. Four different "marker" scenarios have been developed, and they are called B1, B2, A1, and A2 (Wigley 1999).
2.8. Extreme weather events and damage cost
Apart from the meteorological debates, there is evidence that economic damage as a result of extreme weather events has dramatically increased over the last decades (see figure 10). Of course, inflation, population growth, and growth of global wealth contribute to the increase in the damage costs of extreme weather events. Munich Re, one of the world's largest re-insurance firms, compared losses in the 1960s with losses in the 1990s, adjusted for these factors, and found that a major part of the increase in losses was due to changes in frequency of extreme weather events (Francis and Hengeveld 1998). Swiss Re (2000a) made a list of the 40 worst insured losses between 1970 and 1999 and found that only 6 catastrophes were not weather related. In the period 1963-1992, the number of disasters causing more than 1 percent GDP damage had increased two to three times for the weather-related disasters in comparison to the earthquake disasters (United Nations 1994).
Swiss Re (1999b) concluded that the economic losses due to natural disasters have increased twofold during the period 1970-1990, taken inflation, insurance penetration and price effects, and a higher standard of living into account. While real global GDP increased by a factor of three since 1960, the total sum of extreme weather-related damage increased by a factor of eight.
8 See: www.bom.gov.au/bmrc/clch/bma/wgcm_1.html
Figure 10. Great weather related disasters 1950-1999 (disasters exceeding 100 deaths and/or US $100 million in claims).(Source: Munich Re 1999b and additional Munich Re research at request of the authors). (c) Munich Reinsurance Company
Great Weather Related Disasters 1950-1999Economic and Uninsured Losses - Decade Comparison
Decade comparison
Decade1950-59
Decade1960-69
Decade1970-79
Decade1980-89
Decade1990-99
Factor80s:60s
Factor90s:60s
Number
EconomicLosses
InsuredLosses
Losses in US$ billion - 1999 values
14 16 29 44 70
38.7 50.8 74.5 118.5 399.9
6.7 10.8 21.5 86.0 3.2 12.7
2.3 7.9
2.8 4.4
Economic Losses(1999 values)
Insured Losses(1999 values)
80
70
60
50
40
30
20
10
0
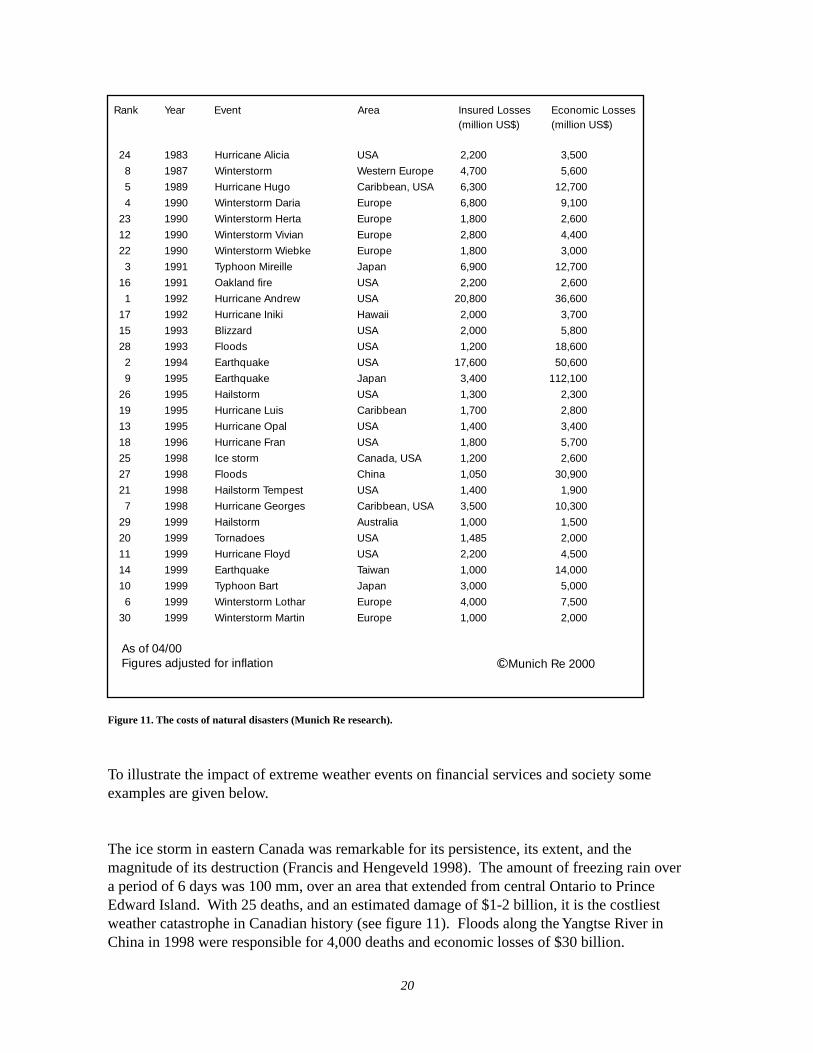
2120
Figure 11. The costs of natural disasters (Munich Re research).
To illustrate the impact of extreme weather events on financial services and society some examples are given below.
The ice storm in eastern Canada was remarkable for its persistence, its extent, and the magnitude of its destruction (Francis and Hengeveld 1998). The amount of freezing rain over a period of 6 days was 100 mm, over an area that extended from central Ontario to Prince Edward Island. With 25 deaths, and an estimated damage of $1-2 billion, it is the costliest weather catastrophe in Canadian history (see figure 11). Floods along the Yangtse River in China in 1998 were responsible for 4,000 deaths and economic losses of $30 billion.
The floods were caused primarily by unusually heavy summer rains, but human management of the watershed influences the impact of rainfall.7
During April-June 1998, extreme dryness affected much of the South-Central and Southeastern United States. Louisiana and Florida experienced only 150 mm of rainfall, which beat the previous record low in 1895. The dryness was accompanied by record heat in Texas, Louisiana, Arkansas, and Florida (two-four degrees above normal). One consequence of these extreme weather conditions was, for example for Florida widespread wildfires in Florida. By July 5, 483,000 acres and 356 structures had been consumed by fire, resulting in an estimated $276 million in damages (Bell et al. 1999).
7 Also see: http://www.ncdc.noaa.gov/ol/reports/chinaflooding/chinaflooding.htm#sites
24
8
5
4
23
12
22
3
16
1
17
15
28
2
9
26
19
13
18
25
27
21
7
29
20
11
14
10
6
30
1983
1987
1989
1990
1990
1990
1990
1991
1991
1992
1992
1993
1993
1994
1995
1995
1995
1995
1996
1998
1998
1998
1998
1999
1999
1999
1999
1999
1999
1999
Hurricane Alicia
Winterstorm
Hurricane Hugo
Winterstorm Daria
Winterstorm Herta
Winterstorm Vivian
Winterstorm Wiebke
Typhoon Mireille
Oakland fire
Hurricane Andrew
Hurricane Iniki
Blizzard
Floods
Earthquake
Earthquake
Hailstorm
Hurricane Luis
Hurricane Opal
Hurricane Fran
Ice storm
Floods
Hailstorm Tempest
Hurricane Georges
Hailstorm
Tornadoes
Hurricane Floyd
Earthquake
Typhoon Bart
Winterstorm Lothar
Winterstorm Martin
USA
Western Europe
Caribbean, USA
Europe
Europe
Europe
Europe
Japan
USA
USA
Hawaii
USA�
USA
USA
Japan
USA
Caribbean
USA
USA
Canada, USA
China
USA
Caribbean, USA�
Australia
USA
USA�
Taiwan
Japan
Europe
Europe
3,500
5,600
12,700
9,100
2,600
4,400
3,000
12,700
2,600
36,600
3,700
5,800
18,600
50,600
112,100
2,300
2,800
3,400
5,700
2,600
30,900
1,900
10,300
1,500
2,000
4,500
14,000
5,000
7,500
2,000
2,200
4,700
6,300
6,800
1,800
2,800
1,800
6,900
2,200
20,800
2,000
2,000
1,200
17,600
3,400
1,300
1,700
1,400
1,800
1,200
1,050
1,400
3,500
1,000
1,485
2,200
1,000
3,000
4,000
1,000
As of 04/00Figures adjusted for inflation c Munich Re 2000
Rank Year Event Area Insured Losses(million US$)
Economic Losses(million US$)
1922
3. Projections of future climate change
The climate response to an increase in greenhouse gases and sulphate aerosols has been compared with the observed patterns of temperature change by many different research groups. Such studies show a clear similarity between the observed changes and the model calculations. This is why the IPCC concluded "the balance of evidence suggests a discernible human influence on global climate" (IPCC 1995). In other words, it is very likely that the enhanced greenhouse effect already contributes to the observed changes in the global climate.
The quality of model simulations of current and past climate, and also of shorter prediction periods like El Niño, has increased over the last few years. As a result, the confidence in predictions of future climate change is also increasing. According to Le Treut and McAvaney there are still substantial disagreements in the amplitude of changes in the air temperature, water vapor, and clouds, and in details of their distribution between models forced by a doubling of atmospheric concentrations of CO2. 8 Thus, it will remain difficult to predict the climate at the regional or local scale. This is because natural climate variability can either amplify or weaken the effects of human-induced climate change. Prediction on a regional scale is difficult because of the complexity of the climate system. Nevertheless, a few statements with considerable certainty can be made regarding temperature, precipitation, sea level rise, atmospheric circulation, cyclones, and certain ecosystems. The major findings based on an assessment of the most recent literature are presented below. The possibility of relatively unpredictable rapid changes in the climate will also be discussed.
3.1. Temperature
With ongoing increases in greenhouse gas concentrations in the atmosphere, the global average temperature is expected to rise between 1.3oC and 4.0oC by the year 2100, dependent on the chosen scenario, according to climate models using the most recent emission scenarios (see figure 12 and table 1). These preliminary scenarios were developed for an IPCC Special Report on Emission Scenarios (SRES) because the IS92 scenarios, developed in 1992, have some well-recognised limitations (Wigley 1999). The most marked difference between SRES scenarios and IS92 scenarios are the lower SO2 emissions in the SRES scenarios. Four different "marker" scenarios have been developed, and they are called B1, B2, A1, and A2 (Wigley 1999).
2.8. Extreme weather events and damage cost
Apart from the meteorological debates, there is evidence that economic damage as a result of extreme weather events has dramatically increased over the last decades (see figure 10). Of course, inflation, population growth, and growth of global wealth contribute to the increase in the damage costs of extreme weather events. Munich Re, one of the world's largest re-insurance firms, compared losses in the 1960s with losses in the 1990s, adjusted for these factors, and found that a major part of the increase in losses was due to changes in frequency of extreme weather events (Francis and Hengeveld 1998). Swiss Re (2000a) made a list of the 40 worst insured losses between 1970 and 1999 and found that only 6 catastrophes were not weather related. In the period 1963-1992, the number of disasters causing more than 1 percent GDP damage had increased two to three times for the weather-related disasters in comparison to the earthquake disasters (United Nations 1994).
Swiss Re (1999b) concluded that the economic losses due to natural disasters have increased twofold during the period 1970-1990, taken inflation, insurance penetration and price effects, and a higher standard of living into account. While real global GDP increased by a factor of three since 1960, the total sum of extreme weather-related damage increased by a factor of eight.
8 See: www.bom.gov.au/bmrc/clch/bma/wgcm_1.html
Figure 10. Great weather related disasters 1950-1999 (disasters exceeding 100 deaths and/or US $100 million in claims).(Source: Munich Re 1999b and additional Munich Re research at request of the authors). (c) Munich Reinsurance Company
Great Weather Related Disasters 1950-1999Economic and Uninsured Losses - Decade Comparison
Decade comparison
Decade1950-59
Decade1960-69
Decade1970-79
Decade1980-89
Decade1990-99
Factor80s:60s
Factor90s:60s
Number
EconomicLosses
InsuredLosses
Losses in US$ billion - 1999 values
14 16 29 44 70
38.7 50.8 74.5 118.5 399.9
6.7 10.8 21.5 86.0 3.2 12.7
2.3 7.9
2.8 4.4
Economic Losses(1999 values)
Insured Losses(1999 values)
80
70
60
50
40
30
20
10
0
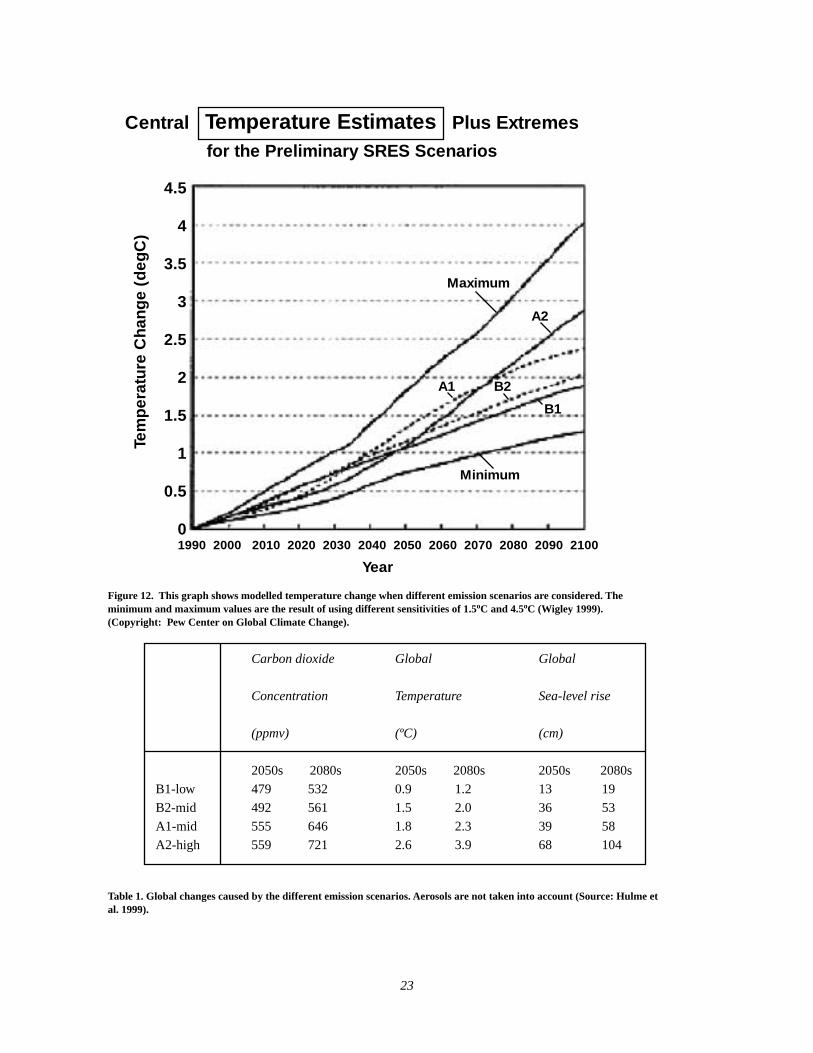
2318
phenomena such as El Niño increases with rising sea surface temperatures. In turn, the severity of weather extremes in many parts of the world correlates positively with the strength of the El Niño phenomenon. This is a hypothesis, but a plausible one. It is difficult to fully test the hypothesis as the record of measurements is too short and the various modelling groups do not yet produce fully identical results when it comes to the simulation of the global circulation phenomena under conditions with increased radiative forcing.
2.7. Observed changes in ecosystems
Coral reefs represent a mutually life-sustaining association between algae and coral. Coral reef bleaching, caused by abnormally high seawater temperatures, is a reduction in the density of algae or algal pigments. Coral reef bleaching episodes were observed in 1980, 1982, 1987, 1992, 1994, and 1998 in the Great Barrier Reef near Australia and many other places in the world. Coral bleaching events worldwide have become more frequent since the 1980s and the IPCC concluded that the observed increase is consistent with measured seawater temperature increases.
Research shows that the population of cod in the North Sea is negatively affected by a decline in the production of young cod. According to O'Brien et al., this decline is not only related to overfishing but to significantly warmer seawater temperatures over the past 10 years (O'Brien, C.M. et al. 2000). Overfishing in combination with higher temperatures endangers the long-term sustainability of cod in the North Sea.
Insects, which are especially sensitive to changes in temperature and precipitation, may be some of the best indicators of climate change. Several researchers have found evidence of poleward shifts of various butterfly species in North America and Europe (Parmesan 1996; 1999).
Alpine plants have migrated to higher areas in the central Pals of Austria and the east of Switzerland, according to researchers at the University of Vienna. Local observations indicate a temperature increase of 0.7oC during the last 90 years (Grabherr et al. 1994).
These studies point in the direction of ongoing change; however, a definitive attribution to the enhanced greenhouse effect is still disputed. The studies illustrate that ecosystems are very sensitive to changes in temperature.
Figure 12. This graph shows modelled temperature change when different emission scenarios are considered. The minimum and maximum values are the result of using different sensitivities of 1.5oC and 4.5oC (Wigley 1999). (Copyright: Pew Center on Global Climate Change).
Carbon dioxide Global Global
Concentration Temperature Sea-level rise
(ppmv) (ºC) (cm)
2050s 2080s 2050s 2080s 2050s 2080s B1-low 479 532 0.9 1.2 13 19 B2-mid 492 561 1.5 2.0 36 53 A1-mid 555 646 1.8 2.3 39 58 A2-high 559 721 2.6 3.9 68 104
Table 1. Global changes caused by the different emission scenarios. Aerosols are not taken into account (Source: Hulme et al. 1999).
Central Temperature Estimates Plus Extremes
for the Preliminary SRES Scenarios
4.5
4
3.5
3
2.5
2
1.5
1
0.5
0
Tem
per
atur
e C
han
ge
(deg
C)
1990 2000 2010 2020 2030 2040 2050 2060 2070 2080 2090 2100
Year
Minimum
Maximum
A2
A1 B2
B1
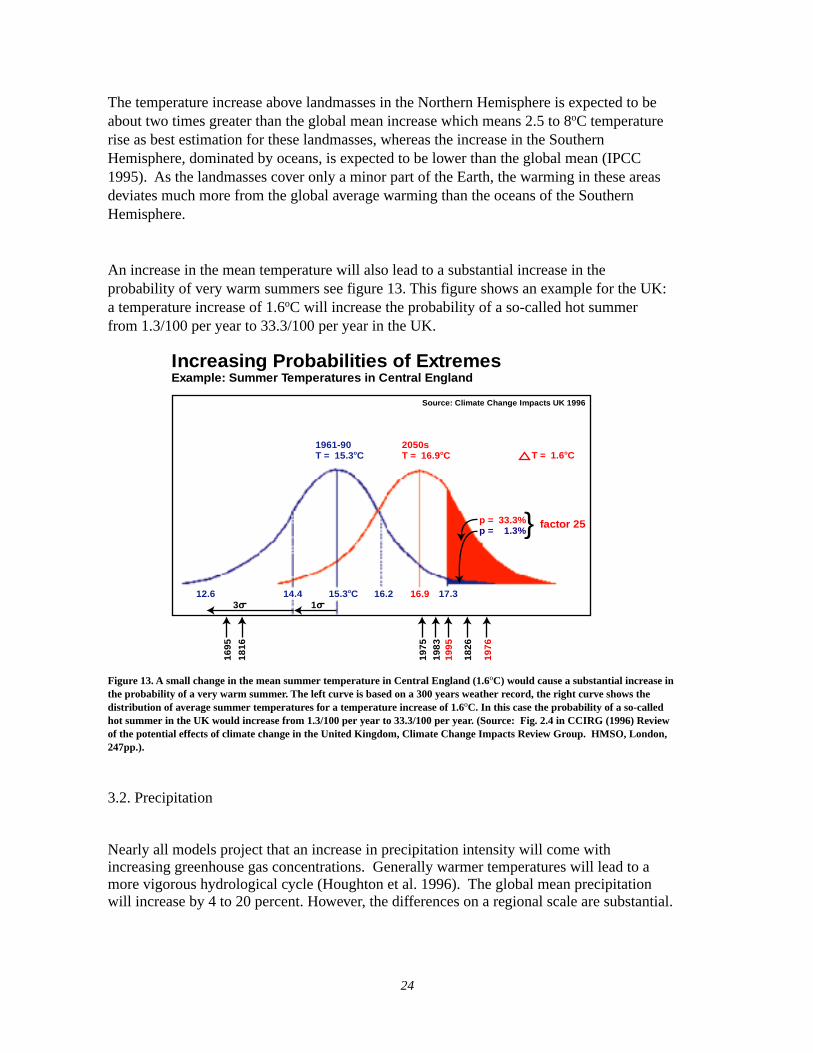
1724
The temperature increase above landmasses in the Northern Hemisphere is expected to be about two times greater than the global mean increase which means 2.5 to 8oC temperature rise as best estimation for these landmasses, whereas the increase in the Southern Hemisphere, dominated by oceans, is expected to be lower than the global mean (IPCC 1995). As the landmasses cover only a minor part of the Earth, the warming in these areas deviates much more from the global average warming than the oceans of the Southern Hemisphere.
An increase in the mean temperature will also lead to a substantial increase in the probability of very warm summers see figure 13. This figure shows an example for the UK: a temperature increase of 1.6oC will increase the probability of a so-called hot summer from 1.3/100 per year to 33.3/100 per year in the UK.
Figure 13. A small change in the mean summer temperature in Central England (1.6oC) would cause a substantial increase in the probability of a very warm summer. The left curve is based on a 300 years weather record, the right curve shows the distribution of average summer temperatures for a temperature increase of 1.6oC. In this case the probability of a so-called hot summer in the UK would increase from 1.3/100 per year to 33.3/100 per year. (Source: Fig. 2.4 in CCIRG (1996) Review of the potential effects of climate change in the United Kingdom, Climate Change Impacts Review Group. HMSO, London, 247pp.).
3.2. Precipitation
Nearly all models project that an increase in precipitation intensity will come with increasing greenhouse gas concentrations. Generally warmer temperatures will lead to a more vigorous hydrological cycle (Houghton et al. 1996). The global mean precipitation will increase by 4 to 20 percent. However, the differences on a regional scale are substantial.
2.6. (Extra)-tropical cyclones
With global climate change, a possible change in the occurrence and behaviour of tropical and extra-tropical cyclones may be expected. A few very severe cyclones, like Andrew, Mitch, and Floyd, have occurred during the last 10 years. However, series of severe cyclones have happened before, so a direct relation with climate change may not exist. Reliable records of tropical cyclone activities show substantial multidecadal regional variability and there is no clear evidence of a long-term trend in the global activity of tropical cyclones (Henderson-Sellers et al. 1998). Similarly, the WASA (Waves and Storms in the North Atlantic) Group concludes that part of the variability of the storm and wave climate in most of the northeast Atlantic and in the North Sea is related to the North Atlantic Oscillation and not to global climate change (WASA Group 1998). However, if the NAO regime is related to sea surface temperature as explained in the previous section, then part of the relatively extreme wave and storm regime is of course related to global climate change and the enhanced greenhouse effect after all. Also, tropical sea surface temperature anomalies near Indonesia, related to El Niño, could influence NAO (KNMI 1999). If human induced climate is indeed responsible for the behaviour of the ENSO phenomenon, then the change in the NAO regime is indirectly linked to the enhanced greenhouse effect.
The influence of El Niño on tropical cyclone activity is more clear. For example, El Niño events increase tropical cyclone activity in some basins (like the central North Pacific near Hawaii, the South Pacific, and the Northwest Pacific between 160oE and the Dateline (Chan 1985; Chu and Wang 1997; Lander 1994), and decrease it in other basins like the Atlantic, the Northwest Pacific west of 160oE, and the Australian region (Nicholls 1979; Revelle and Goulter 1986; Gray 1984).
La Niña events bring opposite conditions. Pielke and Landsea (1999) found a relationship between the ENSO cycle and U.S. hurricane losses. The probability of the occurrence of more than US $1 billion in damages is 0.77 in La Niña years 0.32 in El Niño years and 0.48 in neutral years. Pacific sea temperatures and Atlantic hurricane damages are strongly related. As at least part of the observed temperature rise can be attributed to the enhanced greenhouse effect, we conclude that the changes in tropical cyclone activity are at least partly the result of human-induced climate change.
The overall causal relationship may be that the increase in greenhouse gas concentrations in the atmosphere causes a rise in sea surface temperatures. As mentioned before, climate change induced changes in sea surface temperature and related changes in oceanic and atmospheric circulation patterns may be partly responsible for the observed persistently positive NAO index and the related warm and wet winters. The intensity of ocean and atmospheric circulation
Increasing Probabilities of ExtremesExample: Summer Temperatures in Central England
Source: Climate Change Impacts UK 1996
1695
1816
1975
1983
1995
1826
1976
16.9 17.316.214.412.6 15.3oC
1961-90T = 15.3oC
2050sT = 16.9oC
3o 1o
T = 1.6oC
factor 25}p = 33.3%p = 1.3%
2516
North Atlantic Oscillation
The dominant pattern of wintertime atmospheric circulation variability over the North Atlantic is known as the North Atlantic Oscillation (NAO). This pattern is driven by a pressure difference between Iceland, a low-pressure area and a high-pressure area near the Azores. Positive values of the NAO index indicate stronger-than-average westerlies over the middle latitudes related to pressure anomalies in the above-mentioned regions. This positive phase is associated with warmer winters over Western Europe and colder winters over the northwest Atlantic. The NAO index has increased over the past 30 years with few exceptions, and since 1980 the NAO has tended to remain highly positive. This phenomenon is responsible for the exceptionally high mean temperature and the many particularly heavy rainstorms hitting Northwest Europe in the last 10 years.
However, one cannot relate any specific extreme weather event directly to climate change. In statistical terms, an annual precipitation with a chance of occurrence of 1 in 1000 per year is also possible within the range of a "constant" climate.
The Royal Netherlands Meteorological Institute suggests that global warming-induced changes in sea surface temperature and related changes in oceanic and atmospheric circulation patterns may be partly responsible for the observed persistently positive NAO index and the related warm and wet winters. But this cannot be proven because the measurement period is too short and the models still produce contradictory results (KNMI 1999). Although the KNMI is prudent in their conclusions, Corti et al. (1999) indicate that the observed warming of the Earth's surface does trigger changes in the frequency distribution of existing modes of climate variability like the observed NAO phenomenon. The Arctic Oscillation (AO) is an extension of NAO to all longitudes. The variability of AO and NAO is highly correlated. The NASA Goddard Institute for Space Studies General Circulation Model (GCM) found that much of the increase in surface winds and continental surface temperatures of the Northern Hemisphere are the result of the enhanced greenhouse effect. The comparison of various models indicates that the surface changes are largely driven by the effect of greenhouse gases on the stratosphere (Shindell et al. 1999).6
Various investigators (Cubasch et al. 1995b; Gregory and Mitchell 1995) project a shift in the distribution of daily precipitation amounts toward heavier rainstorms simultaneous with an increase in the number of dry days in some areas. The number of dry days may also increase where the mean precipitation decreases. This is why there may be an increase in the length of dry spells. For instance, the probability of a dry spell of 30 days in southern Europe is projected to increase by a factor of 2 to 5 for a doubling of the greenhouse gas concentrations, while the mean precipitation would decrease by only 22 percent (Houghton et al. 1996).
The future changes of precipitation in Europe include more precipitation (between +1 and +4 percent/decade) during the winter season in most of Europe. For the summer a marked difference in precipitation amount between northern and southern Europe is projected. Southern Europe is expected to become dryer (up to -5 percent/decade) while northern Europe is expected to become wetter (up to +2 percent/decade) during the summer.
Zwiers and Kharin (1998) concluded from their modelling experiments that precipitation extremes increase more than the mean. The mean increase of precipitation is approximately 4 percent while, for example, a 20-year extreme precipitation event return value would increase with 11 percent.
Precipitation intensity (rainfall amount per unit time) is expected to increase when the temperature rises (see figure 14). Whether it will rain somewhere depends on the relative humidity: the ratio between the concentration of water vapour and the saturation value. When the relative humidity reaches 100 percent, the water vapour condenses and precipitation is possible. According to computer-models the distribution of the relative humidity will hardly change when the climate changes. What will change when the temperature increases is the absolute humidity, the concentration of water vapour in the air, at the moment when the saturation value is reached (maximum water vapour concentration increases 6 percent for one degree Celsius temperature increase). A hotter climate may not cause changes in the frequency of the precipitation events (related to the number when the relative humidity reaches 100 percent), but certainly it will cause an increase in the amount of precipitation per event (related to the amount of water in the air at the point of saturation).
6 Also see: http://www.giss.nasa.gov/research/intro/shindell.04/index.html
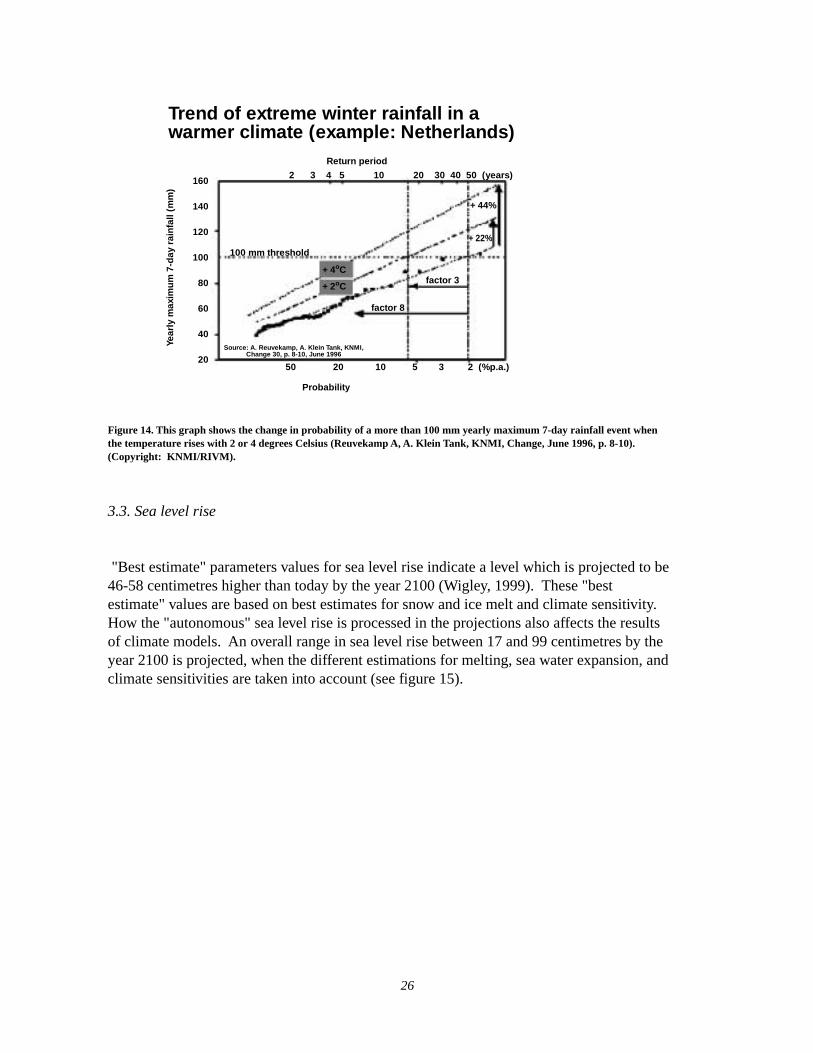
1526
Figure 14. This graph shows the change in probability of a more than 100 mm yearly maximum 7-day rainfall event when the temperature rises with 2 or 4 degrees Celsius (Reuvekamp A, A. Klein Tank, KNMI, Change, June 1996, p. 8-10). (Copyright: KNMI/RIVM).
3.3. Sea level rise
"Best estimate" parameters values for sea level rise indicate a level which is projected to be 46-58 centimetres higher than today by the year 2100 (Wigley, 1999). These "best estimate" values are based on best estimates for snow and ice melt and climate sensitivity. How the "autonomous" sea level rise is processed in the projections also affects the results of climate models. An overall range in sea level rise between 17 and 99 centimetres by the year 2100 is projected, when the different estimations for melting, sea water expansion, and climate sensitivities are taken into account (see figure 15).
Figure 9. This multi-channel satellite image shows numerous wildfires in Florida during the summer of 1998. A very mild and wet winter associated with El Niño conditions supported abundant underbrush growth. Severe drought conditions related to El Niño during the late spring and early summer because of a subtropical tropical high pressure area dried out the short-rooted understory and allowed wildfires to spread over Florida. (Source: National Oceanic and Atmospheric Administration, National Climatic Data Centre, Asheville, NC).
El Niños have occurred more often since 1975, and measurements covering the last 120 years indicate that the duration of the 1990-95 El Niño was the longest on record.
Knutson and Manabe (1998) of Geophysical Fluid Dynamics Lab, Princeton, concluded that the observed warming in the eastern tropical Pacific over the last decades is not likely a result of natural climate variability alone. It is more likely that a sustained thermal forcing, such as caused by the increase of greenhouse gases in the atmosphere, has been at least partly responsible for the observed warming over a broad triangular region in the Pacific Ocean associated with El Niño.
This suggests that human-induced climate change may be at least partly responsible for the relatively extreme character of the El Niño-related weather over the last few years in many parts of the world.
Florida FiresNOAA-12 Color IR CompositeJuly 2, 1998 at 11:50 UTC
PALAYKA
SAINT AUGUSTINEATLANTIC OCEAN
SANFORD
ORLANDO
SAINT PETERSBURG
TAMPA
ORMOND BEACHDAYTONA BEACH
OAK HILL
TITUSVILLE
CAPE CANAVERAL
solar reflection
Trend of extreme winter rainfall in awarmer climate (example: Netherlands)
160
140
120
100
80
60
40
20
Year
ly m
axim
um 7
-day
rai
nfal
l (m
m)
Probability
50 20 10 5 3 2 (%p.a.)
2 3 4 5 10 20 30 40 50 (years)
Return period
100 mm threshold
Source: A. Reuvekamp, A. Klein Tank, KNMI,Change 30, p. 8-10, June 1996
+4oC
+44%
+22%
factor 3
factor 8
+2oC
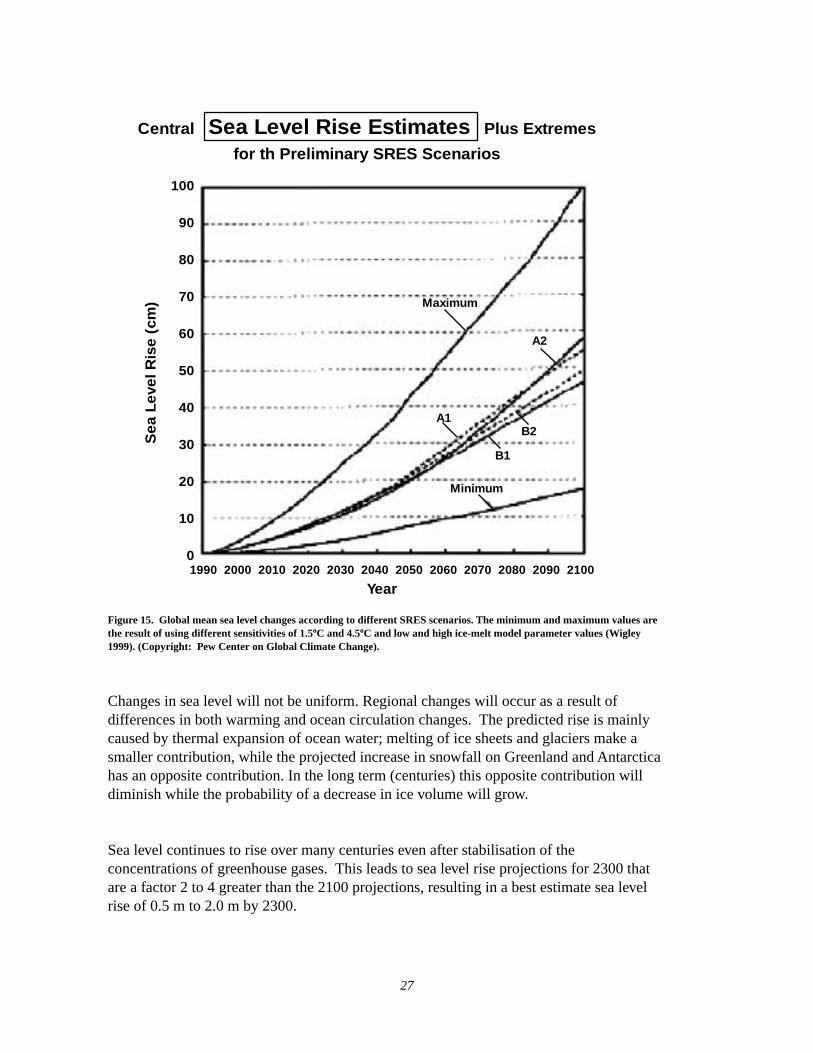
2714
is given by Gary Thomas of the University of Colorado. He suggests a planetary scale wave phenomenon to be responsible.5
The conclusion we may draw is that important temperature and circulation changes are likely related to the enhanced greenhouse effect. Still, many of these processes are only partially understood and the data set is too small to draw definite conclusions.
El Niño and the North Atlantic Oscillation
As a result of increased investments in climate change research and atmosphere and ocean circulation analysis, the understanding of natural climate variability at the time scales of seasons, years, and decades has significantly increased. This is especially true for the ENSO (El Niño Southern Oscillation) and the North Atlantic Oscillation phenomena, which can now be simulated by coupled atmosphere-ocean general circulation models.
During non-El Niño years, east to west trade winds above the Pacific push water heated by the tropical sun westward. The surface water becomes progressively warmer because of its longer exposure to solar heating. From time to time the trade winds weaken and the warmer water flows back eastward across the Pacific to South America. This is what is called an El Niño event. El Niño is a natural climate event, occurring once every seven years on average. Widespread droughts and floods occur simultaneously in different parts of the world in association with El Niño.
The occurrence of an El Niño has profound implications for agriculture, forests (burning), precipitation, water resources, human health, and society in general (Trenberth 1996). Barsugli et al. (1999), for example, attributed large-scale weather events like the January 1998 ice storm in the northeastern United States and southeastern Canada, and the February 1998 rains in central and southern California, to the 1997-98 El Niño. There is also some evidence that strong El Niños are followed by increased rainfall in Europe the following Spring (KNMI 1999).
Figure 15. Global mean sea level changes according to different SRES scenarios. The minimum and maximum values are the result of using different sensitivities of 1.5oC and 4.5oC and low and high ice-melt model parameter values (Wigley 1999). (Copyright: Pew Center on Global Climate Change).
Changes in sea level will not be uniform. Regional changes will occur as a result of differences in both warming and ocean circulation changes. The predicted rise is mainly caused by thermal expansion of ocean water; melting of ice sheets and glaciers make a smaller contribution, while the projected increase in snowfall on Greenland and Antarctica has an opposite contribution. In the long term (centuries) this opposite contribution will diminish while the probability of a decrease in ice volume will grow.
Sea level continues to rise over many centuries even after stabilisation of the concentrations of greenhouse gases. This leads to sea level rise projections for 2300 that are a factor 2 to 4 greater than the 2100 projections, resulting in a best estimate sea level rise of 0.5 m to 2.0 m by 2300.
5Also see: http://www.newscientist.com/ns/19990501/contents.html
Central Sea Level Rise Estimates Plus Extremes
for th Preliminary SRES Scenarios
100
90
80
70
60
50
40
30
20
10
0
Sea
Lev
el R
ise
(cm
)
1990 2000 2010 2020 2030 2040 2050 2060 2070 2080 2090 2100
Year
Maximum
Minimum
A1
A2
B2
B1
1328
3.4. Circulation patterns
El Niño and the North Atlantic Oscillation
Most of the models indicate that the El Niño-Southern Oscillation (ENSO) will intensify under increased greenhouse gas concentrations. Also, the intensity of weather phenomena associated with ENSO would increase. The mean increase of tropical seawater temperatures and the related increase in evaporation could cause enhanced precipitation variability associated with ENSO.
Research since 1996 suggests that El Niño events are likely to become more persistent and/or intense with increasing greenhouse gas concentrations, and be punctuated by strong La Niñas. Meehl, and Washington (1996) have found these results using a coupled Atmosphere Ocean Circulation Model. In addition, Boer et al. (1998) indicate, with models from the Canadian Centre for Climate Modelling and Analysis, an "enhanced warmth in the tropical eastern Pacific, which might be termed 'El Niño like".
Most global climate models, like the above-mentioned models, are too coarse in resolution to fully simulate the behaviour of ENSO in enhanced "greenhouse" warming conditions. However, a new model with a much finer resolution used by Timmerman et al. (1999) from the Max Planck Institute in Hamburg shows more frequent El Niño-like conditions and stronger cold events (La Niñas) in the tropical Pacific Ocean when the model is forced by future greenhouse warming. A number of models show an increase in El Niño conditions, likely interspersed with shorter and stronger La Niñas in a greenhouse gas enhanced world. This in turn means an increase in the frequency of conditions associated with El Niño-like heavy rains and storms interspersed with short dry spells in some regions, and more prolonged droughts punctuated by heavy rain years in other parts of the world.
Paeth et al. (1998) find a significant (at the 95 percent confidence level) increase in the mean North Atlantic Oscillation index when CO2 concentrations quadruple, which results in a more maritime climate (warmer winters). Also, two greenhouse warming forced models at the Max Planck Institute show an increase in the NAO index. On the other hand, a greenhouse forced model at the Hadley Centre in England suggests a decrease in the NAO index (KNMI 1999). Fyfe et al. (1999) show that greenhouse gas forcing gives more positive Arctic Oscillations and thus more positive NAOs.
In fact, an increase in the number of low-pressure areas has been detected in parts of the United States, the east coast of Australia, and the North Atlantic Ocean (Houghton et al. 1996).
Another phenomenon that is likely to be at least partly related to a change in circulation patterns is the relative dryness in North Africa over the last few decades. The Sahel has become much dryer over the last 25 years. This period of desiccation represents the most substantial and sustained change in rainfall within the period of instrumental measurements. This is likely to be related to the change in the Atlantic Ocean seawater surface temperatures. Lower temperatures south of the equator and higher temperatures north of the equator are correlated to a lower rainfall in the Sahel. The changes of the ocean water temperature most probably lead to a change in atmospheric circulation, as a result affecting the amounts of rain falling in the Sahel (Hulme and Kelly.)4
Recently, temperature changes have also been observed in the uppermost parts of the atmosphere. The observations indicate a cooling of the mesosphere, between 50 and 90 kilometres up, at an unprecedented rate - perhaps as much as 1°C per year for the past 30 years, according to Gary Thomas of the University of Colorado, Boulder. In addition, the stratospheric climate (the layer between 15 and 50 kilometres above the Earth's surface) has changed during past decades, especially above the Arctic, according to Hans-Friederich Graf, a senior scientist at the Max Planck Institute for Meteorology in Hamburg. This is qualitatively in line with greenhouse gas theory: greenhouse gases warm the troposphere; the heat produced at the lower levels cannot gradually diffuse upwards and the upper atmosphere cools down, a process known as radiative cooling.
Other processes besides radiative cooling may play a role. Shindell et al. (1999) suggest that a changing temperature gradient between the tropics and the poles may be responsible for the extra stratospheric cooling. The increasing temperature gradient from tropics to poles as a result of climate change increases the strength and speed of a strong winter wind, the polar night jet. This polar night jet in turn may have isolated cold, atmospheric Arctic air from surrounding influences. Changes in the atmospheric circulation caused by the greenhouse effect may enhance radiative cooling. A complementary explanation of the rapid mesosphere cooling
4 Also see: http://www.uea.ac.uk/menu/acad_depts/env/all/resgroup/cserge
2912
Human induced climate change does not necessarily alter the nature of the dominant patterns of natural variability, but will probably be projected on these patterns resulting in a change in frequency and/or strength. Although the global coupled atmosphere ocean models have been improved over the last five years, most of the present models remain limited in simulating complex observed natural variability. This is why reaching an overall consensus on the relations between climate change and changing weather variability and extremes is difficult.
3.5. (Extra)-tropical cyclones
Carnell and Senior (1998) find that with increasing greenhouse gases the total number of Northern Hemisphere storms decreases, but there is a tendency toward deeper low centres, thus an increase in the severity of storms. The modelling work and observational analysis of Lambert (1995) supports this. However, another study found a reduction of intensity (Beersma et al. 1997). At this moment, many greenhouse gas forced models suggest a change in the behaviour of cyclones, but there is little agreement yet between the models about the precise changes.
The formation of tropical cyclones depends not only on the sea surface temperature, but also on a number of atmospheric factors. Although several models simulate tropical cyclones with some realism, the scientific understanding of the behaviour of tropical cyclones is insufficient and does not yet allow assessment of future changes. The global number of tropical cyclones could stay constant, but the intensity of the strongest is likely to increase.
ENSO and tropical cyclones are strongly related (section 2.5). Most greenhouse forced models project an increase in El Niño conditions likely interspersed with stronger but shorter La Niña events (section 3.4). The activity of tropical cyclones that are positively influenced by El Niño events will probably increase.
Figure 8. Arctic sea ice trends 1979-1995. (Copyright: National Snow and Ice Data Center, University of Colorado, Boulder, US).
All these recent trends and variations in sea ice cover and thickness are consistent with recorded changes in high-latitude air temperatures, winds, and oceanic conditions.
2.5. Circulation patterns
Atmospheric circulation
Land surfaces absorb less heat than ocean surfaces. This is why the surface temperatures above land respond faster to an increase in radiative forcing than the ocean surfaces. One way or another this temperature difference will affect the atmospheric circulation patterns, the wind speed distribution/frequencies, and the strength and trajectories of high-and low-pressure fields.
1130
3.6. Ecosystems
Populations, which are part of an ecosystem, can only survive if the availability of water and the temperature varies within a specific range. Another population will replace the present population if these boundaries are exceeded. For some species the rate of replacement is slow (for example trees), for other species fast. Therefore, climate change will probably imply imbalances and/or disruptions within ecosystems, likely resulting in abrupt changes. Climate change will disturb the function of several ecosystems because interactions between mutually dependent species will be disrupted (finally resulting in tree and plant diseases for example). This is likely to have serious impacts on bio-diversity, agriculture and society ("natural disasters," plant diseases, etc.). In order to indicate the potential consequences of climate change for some unique ecosystems, a few examples are presented below.
The frequency and intensity of coral bleaching will probably increase in the future. The outputs of four GCMs were used to analyse the changes in coral bleaching episodes caused by temperature changes (Hoegh-Guldberg, 1999a). In 20-40 years coral bleaching events could be triggered by seasonal changes in seawater temperature. At this moment coral bleaching events are triggered by El Niño events. The frequency of coral bleaching could reach the point when coral reefs no longer have enough time to recover.
According to Fleming and Candau (1997), climate change will have severe consequences for the Canadian forests- probably more frequent, extreme storms and wind damage, greater stress due to drought, more frequent and severe fires, insect disturbances, and in some areas increased vegetative growth rates.
A warming of 3.0 to 6.4oC (the range of different models caused by doubling CO2 for the area under consideration) could lead to loss of alpine tundra between 44o and 57oN, but separated populations of alpine tundra may persist below climatic tree line in small patches of open habitat (Delcourt and Delcourt 1998).
Global warming will certainly affect the largest continuous mangrove forest system in the world, the Sundarbans in Bangladesh and India. The Sundarbans mangrove system is unique in terms of a high biodiversity (rich fauna and flora) and its economic and environmental values. An increase in temperature and thus salinity may affect certain species. Sea level rise will inundate parts of the Sundarbans, and result in a change of habitat and the dying or migration of certain species. More frequent or severe storms as a result of climate change also may affect the wildlife of the Sundarbans.
Vinnikov et al. show that the Northern Hemisphere sea ice extent has decreased during the past 46 years. The Geophysical Fluid Dynamics Laboratory (GFDL) model and the Hadley Centre model, both forced with greenhouse gases and tropospheric sulfate aerosols, simulate the observed trend in sea ice extent realistically. Consequently, the decrease in sea ice extent can be interpreted as the combination of greenhouse warming and natural variability. The probability that the magnitude of the observed 1953-98 trend (-190.000 km2 per 10 years) in sea ice extent is caused only by natural variability is <0.1 percent according to a long-term control run of the GFDL model. For the observed 1978-98 trend (-370.000 km2 per 10 years) the probability is <2 percent. Others have also reported diminished sea ice cover extent in regions such as the Northern Hemisphere 1978-1995 (Johannessen et al. 1996), the eastern Arctic Ocean and Kara and Barents seas 1979-1986 (Parkinson 1992), and the East Siberian and Laptev seas 1979-1995 (Maslanik et al. 1996). Parkinson et al. (1999) used satellite passive microwave data for November 1978 through December 1996, which reveal an overall decreasing trend (-34.300 ± 3700 km2/yr) in Arctic ice sea extents. Recently, scientists at the Goddard Space Flight Center have combined data from the Scanning Multichannel Microwave Radiometer (SSMR) and the Special Sensor Microwave/Imager (SSM/I), launched by NASA in 1978 and 1987 respectively (see figure 7 and 8).3 Trends estimated from these data suggest a net decrease in Arctic ice extent of about 2.9 percent per decade (Cavalieri et al. 1997).
Rothrock et al. concluded from a comparison of sea ice draft measurements during submarine cruises between the periods 1993 to 1997 and 1958 to 1976 that the sea ice cover has decreased by about 1.3 m in thickness. The decrease is greater in the central and eastern Arctic than in the Beaufort and Chukchi seas.
3Also see: http://gcmd.gsfc.nasa.gov/cgi-bin/md/ for more information.
3110
Figure 6. The figure above contains data for average global mass balance for each year from 1961 to 1997, as well as the plot of the cumulative change (negative six metres) in mass balance for this period. (Copyright: National Snow and Ice Data Center, University of Colorado, Boulder, US).
Laser instruments indicate that Alaska has the most glaciers. A warmer atmosphere in the winter can retain theoretically more moisture, resulting in an increase in snow precipitation (see also Section 2.2 on 'Precipitation'). The snow does not melt immediately, therefore the ice sheets can increase in volume. However, this winter increase in volume is no longer keeping pace with the melting caused by the longer and hotter summers. Glaciers have diminished in both volume and area during the last 100 years, especially in areas of the mid and lower latitudes.
3.7. Societal Aspects
The societal impacts of climate change will become manifest through changes in the nature and the frequency of extreme weather events such as flooding, storms, heat waves, and dry spells. It is likely that we are now witnessing the first signals. Historical series of extreme weather events cannot be applied with confidence anymore, and it becomes much more difficult to predict the return period of extreme weather events. As a result economic damage, social disruption, and loss of life are likely to be substantial.
Climate change will also have some benefits, such as higher crop productivity where sufficient moisture is available, expansion of tourism, and lower costs for heating homes. On the other hand, more air-conditioning will be necessary in the summer. Shipping routes connecting the northern continents are presently not accessible but are much shorter than the existing routes. Global warming could make these routes more accessible and thus economically more attractive. The agricultural and forest areas in northern regions could take advantage of higher temperatures and higher carbon dioxide concentrations. However, it will take time to exploit this advantage, because society is not prepared for such a situation. For example, it will be necessary to construct new infrastructures (roads, water-management, and cities). The readiness to invest, to make it possible to exploit these advantages, will strongly depend on the certainty we have about the nature of changes in future climate. This is exactly the problem: the climate will no longer be predictable, at least not at the local level.
Climate change means a global redistribution of costs and benefits of the weather. The costs will be greater than the benefits, as society is not prepared for weather surprises and it takes time to adjust and reap the benefits. In fact climate change is an additional uncertainty in economic development and thus an additional cost factor. And last but not least, (global) society does not have the instruments and institutions that can redistribute or settle the damage. Therefore, climate change is likely to lead to great political tensions. Beyond that there is the risk of a major destabilisation of the global climate. This is the focus of the next chapter.
Figure 7. A time series of Arctic ice extent from 1978 onward. (Copyright: National Snow and Ice Data Center, University of Colorado, Boulder, US).
200
100
0
-100
-200
-300
-400
-500
0
-1000
-2000
-3000
-4000
-5000
-60001960 1965 1970 1975 1980 1985 1990 1995 2000
Year
Cum
ulat
ive
Glo
bal
Mas
s B
alan
ce, m
m
Glo
bal
Gla
cier
Mas
s B
alan
ce, m
m/y
ear
1978 1979 1980 1981 1982 1983 1984 1985 1986 1987 1988 1989 1990 1991 1992 1993 1994 1995 1996 1997 1998
Passive microwave-derived (SMMR/SSM/I) sea ice extent departures from monthly means for the N. Hemisphere, 1978-1998.
Departures from monthly means
Trend : -25066.314 km2/yearStd Dev: 3301.8475 km2/year
2.0
1.5
1.0
0.5
0.0
-0.5
-1.0
-1.5
-2.0
Are
a (
x 10
2 km
2 )
Northern Hemisphere Sea Ice Extent
Year
932
4. Risks of a destabilisation of global climate
4.1. The Ocean Conveyor Belt
A major climate risk, quite different from the gradual rise in temperature and sea level, is the possibility of fast, flip-flop changes in climate. Such changes have a low probability and they are inherently difficult to predict, but when they occur they have a major impact on life on Earth.
A stagnation of the Ocean Conveyor Belt is one of such possible fast changes. The Ocean Conveyor Belt is a thermohaline circulation driven by differences in the density of seawater controlled by temperature and salinity. This conveyor belt transports an enormous amount of heat northward, creating a climate in northwestern Europe which is on average 8 degrees Celsius warmer than the mean value at this latitude. In the northern region of the North Atlantic the water cools and sinks, deep water is formed, moves south, and circulates around Antarctica, and then moves northward to the Indian, Pacific, and Atlantic basins. It can take a thousand years for water from the North Atlantic to find its way into the North Pacific. Density differences between seawater determine the 'strength' of the 'conveyor belt' circulation. A change in these density differences as a result of climate change could lead to a 'weakening' or even a stagnation of this ocean current. Stagnation would result in a climate in northwestern Europe such as that of Labrador and Siberia, with more than 6 months of snow cover every year.
The conveyor belt circulation pattern is susceptible to perturbations as a result of injections of excess freshwater (precipitation, melting) into the North Atlantic. Climate models indicate an increase of precipitation at higher latitudes. As a result of such a freshwater injection the conveyor could stop within100 to 300 years from now. The total shutdown of the conveyor will probably take less then 10 years after 100 to 300 years from now. Ice core records indicate that past cessation in the conveyor belt resulted in a drop of 7 degrees Celsius. Ice core records and models suggest that the conveyor circulation eventually reestablished itself, but only after a hundred to a thousand years (Broecker 1996).
Since Broecker's 1996, work, a number of modelling groups have indeed found a decrease in the strength of the conveyor circulation with greenhouse gas forcing, resulting in a cooling of the North Atlantic Ocean. The process is as follows: An increase in precipitation at higher latitudes leads to a decrease in salt concentration in the surface water. Currently, sinking of salt water in the vicinity of Greenland "pulls" warm water to the North Atlantic Ocean with lower salinity (due to the freshwater). This sinking at higher latitudes diminishes and the strength of the conveyor circulation could decrease. In the long term this source of heat for northwestern Europe could be shut off or weaken significantly.
Figure 5. Sea level rise during last century (below) and temporal variability of sea level rise computed from TOPEX/POSEIDON (top). (Copyright Center for Space Research) (http://www.csr.utexas.edu/gmsl/tptemporal.html)
2.4. Snow and Ice changes
Glaciers are melting worldwide. In the last century, glaciers on Mount Kenya have lost 92 percent of their mass and glaciers on Mount Kilimanjaro 73 percent. The number of glaciers in Spain has decreased from 27 to 13 since 1980. Europe's Alpine glaciers have lost about 50 percent of their volume during the last century. The glaciers of New Zealand have decreased in volume by 26 percent since 1980. In Russia, the Caucasus has lost about 50 percent of its glacial ice over the last 100 years.
Global
Global means sea level
rate=3.1 mm/yr
Sea
leve
l (cm
)
8.0
4.0
0
-4.0
-8.0
12.01880 1900 1920 1940 1960 1980
1993 1994 1995 1996 1997 1998 1999
Year
Barnett (1988)
30
25
20
15
10
5
0
-5
-10
-15
-20
(mm
)
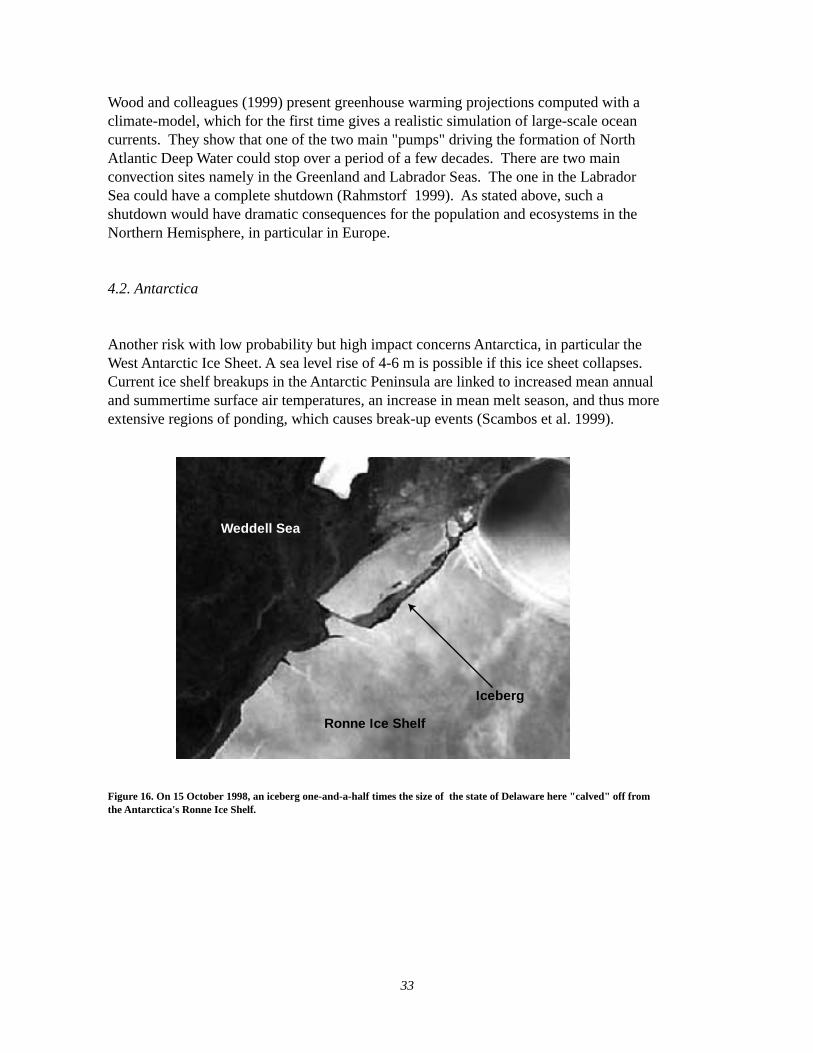
338
In addition to these global changes, a few regional changes in the mean precipitation have been observed. In North America the annual precipitation has increased (Karl et al. 1993b; Groisman and Easterling 1994). In the northern region of Canada and Alaska a trend of increasing precipitation has been detected during the last 40 years (Groisman and Easterling 1994). Data from the southern part of Canada and the northern region of the United States show an increase of 10 to 15 percent (Findlay et al.1994; Lettenmaier et al. 1994). In general, an increase in precipitation can be found in Northern Europe and a decrease in Southern Europe. The amounts of precipitation in the Sahel, West Africa, in the period from 1960 to 1993 were lower than in the period before 1960 (Houghton et al. 1996).
Several analyses of precipitation observations indicate that rainstorm intensity has increased over the past decades. In the United States for example, 10 percent of the annual precipitation falls during very heavy rainstorms (at least 50 mm per day). At the beginning of this century this was less then 8 percent (Karl et al. 1997). According to Groisman et al. (1999), heavy rainstorms account for a 10 percent change in the mean total precipitation when there is no change in the frequency of precipitation. The mean total precipitation has changed, and for those areas where precipitation has increased heavy precipitation rates should be higher. For example, analyses of precipitation patterns in the USA (Karl and Knight 1998), the former USSR, South Africa, China (Groisman et al. 1999) and India (Lal et al. 1999) show a significant increase in heavy rainstorms.
2.3. Sea level rise
Over the last 100 years, sea level has risen between 10 and 25 centimetres worldwide. While this rise in sea level may be seen as the tail end of a continuous rise since the last ice age, sea level has risen most sharply over the last 50 years (see figure 5). Monitoring of sea level rise is complicated, as the vertical landmass movements are, to some unknown extent, always included in the measurements. However, since 1990, improved methods have been developed to compensate for the vertical landmass movements. At this moment it has been established with high confidence that the volume of ocean water has increased.
It is most likely that the recent increase in the rate of sea level rise is related to the observed increase of the Earth's global temperature and the ocean sea surface temperature. The volume of the ocean surface water layer expands per 0.1oC warming of the surface layer of the oceans, such that the sea level rises about 1 centimetre. Thus, the measured 0.6oC-sea surface temperature increase explains a 6 centimetres sea level rise. The observed melting and retreating of glaciers and ice sheets indicates an additional sea level rise between 2 and 5 centimetres.
Wood and colleagues (1999) present greenhouse warming projections computed with a climate-model, which for the first time gives a realistic simulation of large-scale ocean currents. They show that one of the two main "pumps" driving the formation of North Atlantic Deep Water could stop over a period of a few decades. There are two main convection sites namely in the Greenland and Labrador Seas. The one in the Labrador Sea could have a complete shutdown (Rahmstorf 1999). As stated above, such a shutdown would have dramatic consequences for the population and ecosystems in the Northern Hemisphere, in particular in Europe.
4.2. Antarctica
Another risk with low probability but high impact concerns Antarctica, in particular the West Antarctic Ice Sheet. A sea level rise of 4-6 m is possible if this ice sheet collapses. Current ice shelf breakups in the Antarctic Peninsula are linked to increased mean annual and summertime surface air temperatures, an increase in mean melt season, and thus more extensive regions of ponding, which causes break-up events (Scambos et al. 1999).
Figure 16. On 15 October 1998, an iceberg one-and-a-half times the size of the state of Delaware here "calved" off from the Antarctica's Ronne Ice Shelf.
Weddell Sea
Ronne Ice Shelf
Iceberg
734
Most climate models indicate modest temperature rises around Antarctica over the next 50 years. Over this time period, increased precipitation will probably more than compensate for increased surface melting. However, after these 50 years with continued temperature rise Antarctica may start to warm enough to have a significant impact on particularly vulnerable parts of the ice sheet.
The interpretations about present and future changes concerning Antarctica are considerably complex and in some cases contradictory.
Still, it is clear that small changes in the West Antarctic Ice Sheet can lead to a sea level rise on the order of metres. With a continued increase of greenhouse gas emissions, the most likely scenario is that the ice sheet will disappear in the ocean over a period of 500-700 years, but there is a very small chance this may happen in the next 100 years. Sea level could then rise abruptly between 4 and 6 metres.
4.3. Other low-probability, high-impact climate change feedback mechanisms
Three other mechanisms with a small chance of occurrence, but with far-reaching consequences are discussed below.
The cool and humid climate of the boreal zone (northern region of Europe and Asia) has created conditions suitable for the accumulation of carbon in soils. About 40 percent of the estimated global carbon reservoir in forests is stored in the boreal zone. Global warming could alter this situation, affecting the stored carbon and leading to a positive feedback. The carbon reservoir is 1.2-1.5 times larger in the boreal soils than in the atmosphere (Posch et al. 1995).
The increase of ocean temperatures as a result of global warming could lead to decreased solubility of carbon dioxide, and thus turn regional sinks into sources of higher carbon dioxide concentrations in the atmosphere.
The potential feedback between climate change and methane clathrate could enhance global warming. Methane clathrate is an ice-like compound in which methane molecules are caged in cavities formed by water molecules. It forms in the oceans in continental slope sediments. It is stable under certain temperature-depth combinations, and most of it is of biological origin. With warming it could move from a stable to an unstable condition, resulting in the release of enormous amounts of enclosed methane. This could lead to a complete destabilisation of present climate. It should be stated that this model is rather speculative, it is based on a number of assumptions that have not been verified (Harvey 1994).
Figure 4. If effects of greenhouse gas emissions, aerosols, and solar forcing are considered (dotted line), the model-predicted warming is in close agreement with the observed warming (thin black line). (Wigley 1999). (Copyright Pew Center on Global Climate Change).
2.2. Precipitation
An increase in the average global temperature is very likely to lead to more evaporation and precipitation. However, it is difficult to predict and measure the precise changes in the hydrological cycle because of the complex processes of evaporation, transport, and precipitation and also because of the limited quality of the data, short periods of measurements, and gaps in time series. In spite of these limitations, some specific changes in the amounts and patterns of precipitation have been found over the last few decades.
In general, between 30oN and 70oN an increase in the mean precipitation has been observed. This is also true for the area between 0o and 70o southern latitude. In the area between 0o and 30o northern latitude a general decrease in the mean precipitation has occurred (Houghton et al, 1996).
Observed TemperaturesCompared with Model Predictions ( T2X = 2.5degC)
Tem
per
atur
e ch
ang
e fr
om
188
0-99
Mea
n (d
egC
) 1.2
1.1
1.0
0.9
0.8
0.7
0.6
0.5
0.4
0.3
0.2
0.1
0
-0.1
-0.2
-0.31860 1880 1900 1920 1940 1960 1980 2000
Year
Observed
GHG + Aerosols+ Solar
GHG + Aerosols
GHG Alone
356
Destabilisation of the global climate has low probability but far-reaching consequences. As climate is a very complex and relatively unknown and unique system, one should take such low-probability, high-impact phenomena into account.
In general, a reduction in the emission of greenhouse gases will lead to a reduction in the rate of climate change and also to a reduction of the risk of a destabilisation of global climate.
The results of this study indicate that a combination of natural causes, in particular an increase in solar forcing, may have contributed to temperature changes early in the century, but that the warming over the past 50 years must partly be attributed to anthropogenic components in order to explain the overall temperature rise during this period (Tett et al. 1999). This is confirmed through statistical analysis by Tol and Vellinga (1998). Regardless of the way the influence of the sun is included in the statistical model, the accumulation of carbon dioxide and other greenhouse gases in the atmosphere significantly influence the temperature. Tol and Vellinga find that the estimated climate sensitivity is substantially affected only if the observed record of the length of the solar cycle is manipulated beyond physical plausibility.
The various contributions to the rising global average temperature have been modelled by Wigley in The Science of Climate Change (1999). His results confirm the modelling work of the Hadley Centre and the statistical work by Tol and Vellinga (see figure 4). As can be seen in figures 1 and 4, the global mean temperature has rapidly risen since the late 1980s.
The global temperature change is not equally distributed. The largest recent warming is between 40oN and 70oN. In a few areas, such as the North Atlantic Ocean north of 30oN, the temperature has decreased during the last decades (Houghton et al. 1996). In general, the land area warms faster then the oceans due to the much larger heat capacity of the oceans. As a result temperature differences between oceans and land increase, most probably affecting atmospheric circulations.
536
5. Conclusions
On the basis of a systematic analysis of observed changes in average temperature, precipitation patterns and intensity, sea level, snow and ice cover, ocean and atmosphere circulation patterns, and ecosystems behaviour, we conclude with reasonable confidence that we are now experiencing the first effects of the increase of greenhouse gases in the atmosphere. At least part of the observed changes should be attributed to human-induced climate change.
Climate change for any particular location on Earth comes with changes in the nature and frequency of extreme weather events. Changes in the mean must have consequences for the intensity of extremes. Therefore the recently observed series of extreme weather events must have been influenced by the higher average temperatures. This implies that at least part of the damage caused by weather extremes is due to human-induced climate change. We draw this conclusion with reasonable but not absolute confidence, as the observed changes could, with low probability, still be attributed to natural climate variability.
A further rise in the concentrations of greenhouse gases in the atmosphere will lead to further changes in global climate. The consequences now expected are further rise of the mean global temperature, an increase in extreme rainstorms, a substantial rise of sea level and changing ocean/atmosphere circulation patterns with subsequent changing patterns, frequencies, and intensities of extreme weather events. Accurate regional predictions about future changes cannot be made so far.
Some regions may gain from climate change, especially in the north, while other regions will lose. In fact, climate change brings about a global redistribution of the costs and benefits of the weather. The costs will be greater than the benefits, as ecological and societal systems will have difficulty adapting. Moreover, (global) society does not have the instruments and institutions that could help to compensate the losers. Therefore, serious political tensions should be anticipated.
Besides gradual climate change and gradually increasing societal damage, a major additional risk is the possible destabilisation of global climate that could occur as a result of a stagnation of the Ocean Conveyor Belt, the collapse of the Antarctic Ice Sheet, or the release of more greenhouse gases as a result of the warming of the oceans and/or tundra areas. These are "low-probability, high-impact" phenomena of major importance in the debate about climate change and policy measures to limit greenhouse gas emissions.
Figure 3. The above time series show the ocean heat content in the upper 3,000 m for the South Atlantic, North Atlantic, and Atlantic Ocean during the last 40 years. (Copyright: AAAS/Science magazine). (http://www.noaanews.noaa.gov/stories/s399.htm).
The researchers also found that the warming of the subsurface ocean temperatures preceded the observed warming of the surface air and sea surface temperatures, which began in the 1970s.2
Because the climate varies naturally over decades and centuries, direct attribution of these temperature changes to human activities is complicated. However, systematic observations show that global warming and the spatial pattern of this warming extend beyond the bounds of our estimates of natural variability. For example, Simon Tett and colleagues at the Hadley Centre for Climate Prediction and Research and the Rutherford Appleton Laboratory have simulated the patterns of space/time changes in temperature due to natural causes (solar irradiance and stratospheric volcanic aerosols) and anthropogenic influences (greenhouse gases and sulphate aerosols) with a coupled atmosphere-ocean general circulation model. These simulations were then compared with observed changes.
2 See also: http://www.noaanews.noaa.gov/stories/s399.htm
OCEAN HEAT CONTENT (1022J)0-3000 m LAYER, 5-YR RUNNING COMPOSITES
1945 1955 1965 1975 1985 1995
1945 1955 1965 1975 1985 1995
2
0
-2
0.1
0.05
0
-0.05
2
0
-2
4
2
0
-2
-4
0.1
0
-0.1
0.05
0
-0.05
Hea
t con
tent
(1022
J)
Volu
me
mea
n te
mpe
ratu
re a
nom
aly
(o C)
SOUTH ATLANTIC
NORTH ATLANTIC
ATLANTIC OCEAN
YEAR

374
Figure 2 shows the reconstructed Northern Hemisphere temperature anomaly series (Mann et al. 1999). A long-term cooling trend (-0.02oC/century) prior to industrialisation, possibly related to astronomical forcing, changes to a warming trend during the twentieth century. This century is nominally the warmest of the millennium. Although there are some uncertainties about the Northern Hemisphere reconstructions prior to AD 1400, the late twentieth century warming remains apparent. An increase in greenhouse gas concentrations is by far the most plausible reason. This plot also forms the basis for the conclusion that 1998 was the warmest year of the millennium.
Limitation of the net emission of greenhouse gases will reduce the rate of climate change, and thus reduce the expected societal and ecological damage. In view of the distribution issues involved, and in view of the major risks for society, early action regarding greenhouse gas control measures is the only reasonable response to the climate change challenge.
Figure 2. Millennial temperature reconstruction for the Northern Hemisphere (solid). Instrumental data (Red) from AD 1902-1998, a smoother version of the NH series (thick solid), a linear trend from AD 1000-1850 (dot dashed), and two standard error limits (yellow shaded) are also shown. (Copyright: American Geophysical Union). (Mann et al. 1999; see also http://apex.ngdc.noaa.gov/paleo/pubs/mann_99.html).
Researchers for the National Climate Data Center/National Oceanic and Atmospheric Association (NCDC/NOAA) have quantified the interannual-to-decadal variability of the heat content of the world ocean layer through a depth of 3,000 metres, for the period 1948 to 1998 (Levitus et al. 1999), see figure 3. The largest warming occurred in the upper 300 metres, on average by 0.56 degrees Fahrenheit (0.31oC). The upper 3,000 metres have warmed on average by 0.11oF (0.06oC) over the past 40 years. The Atlantic, Indian and Pacific basins were examined. The Pacific and Atlantic oceans have been warming since the 1950s and the Indian Ocean since the 1960s. The observed warming of the ocean layer is most likely caused by a combination of natural variability and anthropogenic effects.
Tem
pera
ture
Ano
mal
y (d
eg C
) 1.0
0.5
0.0
-0.5
-1.01000 1200 1400 1600 1800 2000
Year
1998
reconstruction (AD 1000-1980)instrumental data (AD 1902-1998)calibration period (AD 1902-1960) meanreconstruction (40 year smoothed)linear trend (AD 1000-1850)
Figure 1. The above time series shows the combined global land and ocean temperature anomalies from 1880 to 1999 with respect to an 1880-1998 base period. The largest anomaly occurred in 1998, making it the warmest year since widespread instrument records began in the late nineteenth century. (Source: National Oceanic and Atmospheric Administration, National Climatic Data Centre, Asheville, NC).
The year 1998 is the warmest year ever measured globally in history. The top ten warmest years ever measured worldwide (over the last 120 years) all occurred after 1981. The six warmest of these years occurred after 1990. 1
1 The temperature trend over the last 100 years and other measurements of the climate can be found on the Internet at http://www.ncdc.noaa.gov/ol/climate/research/1999/ann/ann99.html.
References
Anonymous. 1998. World's glaciers continue to shrink according to new CU-Boulder study. University of Colorado news release, May 26, 1998. (Internet: http://www.colorado.edu/ PublicRelations/NewsReleases/ 1998/Worlds_Glaciers_Continue_To_Sh.html)
Barsugli, J. J., J. S. Whitaker, A. F. Loughe, P. D. Sardeshmukh, and Z. Toth. 1999. The effect of the 1997/98 El Niño on individual large-scale weather events. Bulletin of the American Meteorological Society 80(7) July 1999.
Beersma, J. J., E. Kaas, V. V. Kharin, G. J. Komen, and K. M. Rider. 1997. An analysis of extratropical storms in the North Atlantic region as simulated in a control and 2*CO2 timeslice experiment with a high-resolution atmospheric model. Tellus 48A: 175-196.
Bell, G. D., A. V. Douglas, M. E. Gelman, M. S. Halpert, V. E. Kousky, and C. F. Ropelewski. Climate change assessment 1998. Printed in May 1999 supplement to Bulletin of the American Society 80(5). (Internet: http://www.cpc.ncep.noaa.gov/producys/ assessments/assess_98/index.html)
Boer, G. J., G. Flato, and D. Ramsden. 1998. A transient climate change simulation with greenhouse gas and aerosol forcing: projected climate for the 21st century. Canadian Centre for Climate Modeling and Analysis, Victora B.C., in press.
Broecker, W. S. 1996. Climate implications of abrupt changes in ocean circulation. U.S. Global Change Research Program Second Monday Seminar Series. (Internet: http://www.usgcrp.gov/usgcrp/960123SM.html)
Carnell, R. E., and C. A. Senior. 1998. Changes in mid-latitude variability due to increasing greenhouse gases and sulphate aerosols. Climate Dynamics 14:369-383.
Cavalieri, D. J., P. Gloersen, C. L. Parkinson, J. C. Comiso, and H. J. Zwally. 1997. Observed hemispheric asymmetry in global sea ice changes. Science 278:1104-06.
Chan, J. C. L. 1985. Tropical cyclone activity in the Northwest Pacific in relation to the El Niño/Southern Oscillation phenomenon. Mon. Wea. Rev. 113:599-606.
338
Annual Global Surface Mean Temperature AnomaliesNational Climatic Data Center/NESDIS/NOAA
Land and Ocean
Ocean
Land
1880 1900 1920 1940 1960 1980 2000Year
Degr
ees
C
Degr
ees
F
1.6
1.1
0.5
0.0
-0.5
-1.1
1.4
0.9
0.4
-0.2
-0.7
2.2
1.6
1.1
0.5
0.0
-0.5
-1.1
-1.6
-2.2
0.9
0.6
0.3
0.0
-0.3
-0.6
0.8
0.5
0.2
-0.1
-0.4
1.2
0.9
0.6
0.3
0.0
-0.3
-0.6
-0.9
-1.2
392
2. Observed changes in the climate
The climate and the mean temperature at the Earth's surface depend on the balance between incoming (short wave) solar energy and outgoing energy (infrared radiation) emitted from the Earth's surface. Greenhouse gases trap some of the infrared radiation emitted by the Earth and keep the planet warmer than it would be otherwise. The mean global temperature, about 15oC, would be far below zero without this natural greenhouse effect.
The concentrations of greenhouse gases such as carbon dioxide, methane, nitrous oxide, and CFCs have increased since the pre-industrial age, especially since 1960. Carbon dioxide has increased from 280 ppmv to 360 parts per million by volume (ppmv), methane from 700 to 1720 ppmv, and nitrous oxide from 275 to 310 ppmv. All these increases are clearly caused by human activities connected in large part with burning fossil fuels, land use, and industrial processes. Thus, climate change is largely a result of human activities contributing to an amplified greenhouse effect.
2.1. Temperature
Over the past 130 years, the mean temperature of the Earth's surface has risen between 0.3 and 0.6oC, as reported by IPCC, 1995 (see figure 1). More recent analysis, including the temperature record up to 1999, indicates that the global average temperature has now risen by about 0.6oC over the whole period of record since 1860 (Wigley 1999). A closer look reveals that the majority of this temperature increase occurred during the last few decades, when the global average temperature has risen by about 0.2oC per decade.
Chu, P., and J. Wang. 1997. Tropical cyclone occurrences in the vicinity of Hawaii: are the differences between El Niño and non-El Niño years significant? J. Climate 10:2683-2689.
Corti, S., F. Molten, and T. N. Palmer. 1999. Signature of recent climate change in frequencies of natural atmospheric circulation regimes. Nature 398:799-802.
Cubasch, U., G. Waszkewitz, Hegerl, and J. Perlwitz. 1995b. Regional climate changes as simulated in time slice experiments. MPI Report 153. Clim. Change 31:321-304.
DeAngelo , B. J., J. Harte, D. A. Lashof, and R. S. Saleska. 1997. Terrestrial ecosystems feedbacks to global climate change. In: Annual review of energy and the environment, 1997 ed., vol. 22.
Delcourt, P. A., and H. R. Delcourt. 1998. Paleooecological insights on conservation of biodiversity: a focus on species, ecosystems, and landscapes. Ecological Applications 8:921-934.
Doake, C. S. M., and D. G. Vaughan. 1991. Rapid disintegration of Wordie ice shelf in response to atmospheric warming. Nature 350(6316):328-330.
Epstein, P. R. 1996. Global climate change. From an Abstract of Remarks by Scientists at the National Press Club, Washington, D.C. Newsletter 1(1), Nov. 3, 1996.
Feely, R. A., R. Wanninkhof, T. Takahashi, and P. Tans. 1999. Influence of El Niño on the equatorial Pacific contribution to atmospheric CO2 accumulation. Nature 398. April 15, 1999.
Findlay, B. F., D. W. Gullet, L. Malone, J. Reycraft, W. R. Skinner, L. Vincent, and R. Whitewood. 1994. Canadian national and regional standardized annual precipitation departures. In: Trends '93: A compendium of data on global change, T. A. Boden, D. P. Kaiser, P. J. Sepanski, and F. W. Stoss (eds.). ORN/CDIAC-65, Carbon Dioxide Information Analysis Center, Oak Ridge National Laboratory, Oak Ridge, U.S.A, pp. 800-828.
140
1. Introduction and summary
Following a request from WWF we, as researchers at the Institute for Environmental Studies, have made an assessment of the scientific knowledge concerning climate change and its impacts regarding the weather and weather extremes in particular.
The report of the Intergovernmental Panel on Climate Change of 1995 has been taken as a starting point. Since 1995 many new observations and reports have become available. Much of the information on observations and studies on climate change and its impacts can be found through the Internet. Where possible we have made references, such that the reader can easily verify and review our sources.
This study addresses three main questions:To what extent can the human influence on the climate system presently be measured?What can we expect for the short term and long-term future?To what extent will measures to reduce net greenhouse gas emissions affect the future climate?
We conclude that the effects of emissions of CO2 and other greenhouse gases on the global climate are becoming increasingly visible. This includes changes in temperature, precipitation, sea level rise, atmospheric circulation patterns, and ecosystems. For many areas on Earth these changes are becoming manifest through changes in the frequency and the intensity of extreme weather events. We conclude with reasonable but no absolute confidence that human induced climate change is now affecting the geographic pattern, the frequency, and the intensity of extreme weather events.
The assessment of the most recent literature was carried out by Pier Vellinga and Willem van Verseveld of the Institute for Environmental Studies (IVM) of the Vrije Universiteit in Amsterdam. We thank Fons Baede of the Royal Netherlands Meteorological Institute (KNMI) and Jim Bruce, Chair of the International Advisory Committee UNU Network on Water, Environment and Health and former co-chair of Intergovernmental Panel on Climate Change (IPCC) Working Group 3, for their reviews and comments. However, as authors we carry the sole responsibility for this report.
Fleming, R. A., and J-N. Candau. 1997. Influences of climatic change on some ecological processes of an insect outbreak system in Canada's boreal forests and the implications for biodiversity. Environ. Monitoring & Assessment, 49:235-249.
Francis, D., and H. Hengeveld. 1998. Extreme weather and climate change. ISBN 0-662-268490. Climate and Water Products Division, Atmospheric Environment Service, Ontario, Canada.
Fyfe, J.C, Boer, G.J., Flato, G.M. (1999), Climate studies-the Arctic and Antarctic Oscillations and their projected changes under global warming, Geophysical research Letters, Vol. 26 (Issue 11), 1999, 1601-1604 (4)
Grabherr, G., M. Gottfried, and H. Pauli. 1994. Climate effects on mountains plants. Nature 369(6480), 9 June 1994.
Gray, W. M. 1984. Atlantic seasonal hurricane frequency. Part II: forecasting its variability. Mon. Wea. Rev. 112:1669-1683.
Gregory, J. M., and J. F. B. Mitchell. 1995. Simulation of daily variability of surface temperature and precipitation over Europe in the current 2 x CO2 climates using the UKMO climate model. Quart. J. R. Met. Soc. 121:1451-1476.
Groisman, P. Ya, T. R. Karl, D. R. Easterling, R. W. Knight, P. B. Jamason, K. J. Hennessy, R. Suppiah, Ch. M. Page, J. Wibig, K. Fortuniak, V. N. Razuvaev, A. Douglas, E. Forland, and P.M. Zhai. 1999. Changes in the probability of heavy precipitation: important indicators of climatic change. Climatic Change 42(1):243-283.
Groisman, P. Ya, and D. R. Easterling. 1994. Variability and trends of precipitation and snowfall over the United States and Canada. J. Climate 7:184-205.
Harvey, D. 1994. Potential feedback between climate and methane clathrate. University of Toronto, Department of Geography, Toronto, Ontario, Canada. (Internet: http://harvey.geog.utoronto.ca:8080/harvey/index.html)
Henderson-Sellers, A., H. Zhang, G. Berz, K. Emanuel, W. Gray, C. Landsea, G. Holland, J. Lighthill, S-L. Shieh, P. Webster, and K. McGuffie. 1998. Tropical cyclones and global climate change: a post IPCC assessment. Bulletin of the American Society 79(1), January 1998.
41
Hindmarsh, R. C. A. 1993. Qualitative dynamics of marine ice sheets. NATO ASI Series I 12, pp. 68-69.
Hoegh-Guldberg, O. 1999a. Climate change coral bleaching and the future of the world's coral reefs. Greenpeace, Sydney, Australia.
Houghton, J. T., L. G. Meira Filho, B. A. Callander, N. Harris, A. Kattenberg, and K. Maskell. 1996. Climate change 1995, the science of climate change, contribution of working group 1 to the Second Assesment Report of the Intergovernmental Panel on Climate Change. Published for the Intergovernmental Panel on Climate Change. IPCC, 1995. (See also IPCC, 1995, Cambridge University Press)
Hulme, M., and M. Kelly. 1993. Climate change, desertification and desiccation, with particular emphasis on the African Sahel. Climatic Research Unit, School of Environmental Sciences, University of East Anglia, Norwich, United Kingdom, GEC93-17, p. 37. (Internet:http://www.uea.ac.uk/menu/acad_depts/env/all/resgroup/cserge/)
Hulme, M., Sheard, N., Markham, A. (1999) Global Climate Change Scenarios, Climatic Research Unit, Norwich, UK, 2pp.
IPCC. 1995. Climate change 1995: the science of climate change. Cambridge University Press. (See also Houghton et al., 1995)
Johannessen, O. M., M. W. Miles, and E. Bjorgo. 1996. Global sea-ice monitoring from microwave satellites. Proc. 1996 IGARSS, 932-934.
Karl, T. R., P. Y. Groisman, R. W. Knight, and R. R. Heim, Jr. 1993b. Recent variations of snowcover and snowfall in North America and their relation to precipitation and temperature variations. J. Climate 7:1144-1163.
Karl, T. R., R. W. Knight, D. R. Easterling, and R. G. Quayle. 1995. Trends in U.S. climate during the twentieth century. Consequences 1:2-12.
Karl, T. R., and R. W. Knight. 1998. Secular trends of precipitation amount, frequency, and intensity in the USA. Bull. Am. Meteorol. Soc. 79:231-241.
Karl, T. R., R. W. Knight, and N. Plummer. 1995. Trends in high-frequency climate variability in the twentieth century. Nature 377:217-220.
Karl, T. R., N. N. Nicholls, and J. Gregory. 1997. The coming climate: meteorological records and computer models permit insights into some of the broad weather patterns of a warmer world. Scientific American, May 1997. (Internet: http://www.sciam.com/0597issue/0597karl.html)
Khain, A., and I. Ginis. 1991. The mutual response of a moving tropical cyclone and the ocean. Beitr, Phys. Atmosph. 64:125-141.
KNMI. 1999. De toestand van het klimaat in Nederland 1999 (in Dutch). (Internet: http://www.knmi.nl/voorl/nader/klim/klimaatrapportage.html)
Knutson, T. R., and S. Manabe. 1998. Model assessment of decadal variability and trends in the tropical Pacific Ocean. Journal of Climate, September 1998.
Lal, M., S. K. Singh, and A. Kumar. 1999. Global warming and monsoon climate. In: Proceedings of the Workshop on Climate Change and Perspective for Agriculture, November 20-21, 1998. S.K. Sinha, ed. National Academy of Agricultural Sciences, New Delhi.
Lambert S. J., 1995. The effect of enhanced greenhouse warming on winter cyclone frequencies and strengths. Journal of Climate 8:1447-1452.
Lander, M. 1994. An exploratory analysis of the relationship between tropical storm formation in the Western North Pacific and ENSO. Mon. Wea. Rev. 114:1138-1145.
Lettenmaier, D., E. F. Wood, and J. R. Wallis. 1994. Hydroclimatological trends in the continental United States, 1948-88. J. Climate 7:586-607.
Levitus, S., J. I. Antonov, T. P. Boyer, and C. Stephens. 2000. Warming of the world ocean. Science 287, March 24, 2000.
42
Foreword by WWF
Emissions of global warming gases continue to rise as the world burns ever more coal, oil and gas for energy. The risk of destabilising the Earth's climate system is growing every day. Few things can be more pressing for the protection of ecosystems and the well-being of society than avoiding the catastrophic effects of global warming. Time is not on our side.
Damage resulting from extreme weather events already imposes a heavy toll on society that few economies are easily able to absorb. Floods along the Yangtse River in China in 1998 were responsible for 4,000 deaths and economic losses of US $30 billion. In the same year, extreme weather conditions in Florida lead to drought and widespread wildfires caused the loss of 483,000 acres and 356 structures from fires, and resulted in an estimated US $276 million in damages. These kinds of economic impacts have increased dramatically over recent decades. It begs the question, what kinds of calamities might global warming have in store?
While there are various levels of certainty associated with the linkages between climate change and extreme weather events, decision-makers should take each of them into account when calculating the costs of climate change. Changing levels of precipitation, more severe El Niños or tropical cyclones, acute coral bleaching such that corals would not have time to recover, or a stagnation of the Ocean Conveyer Belt and the collapse of the West Antarctic Ice Sheet are risks. Each should have global policy consideration. Governments and businesses that fail to implement prudent climate protection measures must bear part of the responsibility for the consequences of these kinds of catastrophes by either reducing their emissions or paying into a compensation fund.
Industrialised countries must not close their eyes to global warming. With around one-quarter of the world's population, they account for two-thirds of the world's energy-related carbon dioxide emissions. Yet developing nations are expected to suffer the worst impacts of global warming. The dramatic floods in Mozambique that left thousands stranded and the recent bleaching coral reefs around Fiji are characteristic of what we can expect in a warmer world.
Jennifer MorganDirector, WWF Climate Change Campaign
September 2000
Mann, M. E., B. S. Bradley, and M. K. Hughes. 1999. Northern Hemisphere temperatures during the past millennium: inferences, uncertainties, and limitations. Geophysical Research Letters 26(6):759-762.
Maslanik, J. A., M. C. Serreze, and R. B. Barry. 1996. Recent decreases in Arctic summer ice cover and linkages to atmospheric anomalies. Geophysical Research Letters 23:1677-1680.
Meehl, G. A. and W. M. Washington. 1996. El Niño-like climate change in a model with increased atmospheric CO2 concentrations. Nature 382.
Münich Re (1999) Topics - Annual Review of Natural Catastrophes 1990. Münich Re, Münich.
Münich Re (1999) Topics 2000: Natural Catastrophes - The Current Position Münich Reinsurance Group Geoscience Research Group. Münich, Germany, Report 2895-m-e.
Münich Re (2000) M R Natural Catastrophes Service: Significant Natural Disasters in 1999.
Nicholls, N. 1997. A possible method for predicting seasonal tropical cyclone activity in the Australian region. Mon. Wea. Rev. 107:1221-1224.
NOAA Internet site: http://www.ncdc.noaa.gov/o1/climate/research/1998/ann/ann98.html
O' Brien, C. M., C. J. Fox, B. Planque, and J. Casey. 2000. Fisheries: climate variability and North Sea cod. Nature 404:142. March 9, 2000.
Paeth, H., Hense, A., Glowienka-Hense, A., Voss, S., Cubasch, U., (1999) The North Atlantic Oscillation as an indicator for greenhouse-gas induced regional climate change, Climate Dynamics: observational, theoretical and computational research on the climate system, Vol. 15 (Issue 12), 1999, 953
43
Parkinson, C. L., D. J. Cavalieri, P. Gloersen, H. J. Zwally, and J. C. Comiso. 1999. Arctic sea ice extents, areas, and trends, 1978-1996. Journal of Geophysical Research 104(C9):20, 837-20, 856. September 15, 1999.
Parkinson, C. 1992. Spatial patterns of increases and decreases in the length of the sea-ice season in the north polar region, 1979-1986. Journal of Geophysical Research 97(14):388.
Parmesan, C. 1996. Climate change and species range. Nature 382:765-766.
Parmesan, C., Ryrholm, N., Stefanescu C., Hill, J.K., Thomas, C.D., Descimon[num ] H., Huntley, B., Kaila, L., Kullberg, J., Tammaru, T., Tennent, W.J., Thomas, J.A., Warren, M., (1999) Poleward shifts in geographical ranges of butterfly species associated with regional warming, Nature ,Volume 399, Number 6736, Page 579 - 583, 1999
Pielke, R. A., and C. W. Landsea. 1999. La Niña, El Niño, and Atlantic hurricane damages in the United States. Submitted to Bulletin of the American Meteorological Society, 6 April 1999. (Internet: http:\\www.aoml.noaa.gov/hrd/LandSea/lanina/index.html)
Posch, M., P. Tamminen, M. Starr, and P. E. Kauppi. 1995. Climatic warming and carbon storage in boreal soils. RIVM, the Netherlands.
Rahmstorf, S. 1999. Shifting seas in the greenhouse? Nature 399. June 10, 1999.
Rahmstorf, S., and A. Ganopolski. 1999. Long-term global warming scenarios computed with an efficient coupled climate model. Climatic Change 43(2):353-367.
Reuvekamp, A., A. Klein Tank, KNMI, Change, June 1996, p 8-10, 'The Netherlands'
Revelle, C. G., and S. W. Goulter. 1986. South Pacific tropical cyclones and the Southern Oscillation. Mon. Wea. Rev. 114:1138-1145.
Rothrock, D. A., Y. Yu, and G. A. Maykut. Thinning of the arctic sea-ice cover. Geophysical Research Letters 26(23). December 1, 1999.
44
Table of Contents
Foreword by WWF
1. Introduction and summary 1
2. Observed changes in the climate 2
2.1. Temperature 2
2.2. Precipitation 7
2.3. Sea level rise 8
2.4. Snow and ice changes 9
2.5. Circulation patterns 12
Atmospheric circulation
El Niño and the North Atlantic Oscillation
North Atlantic Oscillation
2.6 (Extra)-tropical cyclones 17
2.7. Observed changes in ecosystems 18
2.8. Extreme weather events and damage cost 19
3. Projections of future climate change 22
3.1. Temperature 22
3.2. Precipitation 24
3.3. Sea level rise 26
3.4. Circulation patterns 28
El Niño and the North Atlantic Oscillation
3.5. (Extra)-tropical cyclones 29
3.6. Ecosystems 30
3.7. Societal aspects 31
4. Risks of a destabilisation of global climate 32
4.1. The Ocean Conveyor Belt 32
4.2. Antarctica 33
4.3. Other low-probability, high-impact climate change feedback mechanisms 34
5. Conclusions 36
6. References 38
Scambos, T.A, Kvaran, G., Fahnestock, M.A., Improving AVVHR resolution through data cumulation for mapping polar ice sheets, Remote Sensing of Environments: an interdisciplinary journal, Vol. 69 (Issue 1), 1999, 56-66 (11)
Simon F.B. Tett, Peter A. Stott, Myles R. Allen, William J. Ingham & John F.B. Mitchell (1999), Causes
Shindell, D. T., R. L. Miller, G. A. Schmidt, and L. Pandalfo. 1999. Simulation of recent northern winter climate trends by greenhouse gas forcing. Nature 399:452-455.
Swiss Re. 1999b. World insurance in 1998. Sigma 7 Swiss Reinsurance Company, Zurich.(Internet: http://www.swissre.com/e/publications/publications/sigmal/sigma9907.html)
Swiss Re. 2000a. Natural catastrophes and man-made disasters in 1999. Sigma Report No. 2/2000. Swiss Re, Zurich.
Tett, S. F. B., P. A. Stott, M. R. Allen, W. J. Ingham, and J. F. B. Mitchell. 1999. Causes of twentieth-century temperature change near the Earth's surface, Nature, Vol. 399, 10 June 1999.
Timmerman, A., J. Oberhuber, A. Bacher, M. Esch, M. Latif, and E. Roeckner. 1999. Increased El Niño frequency in a climate model forced by future greenhouse warming. Nature 398. April 22, 1999.
Tol, R., and P. Vellinga. 1998. Climate change, the enhanced greenhouse effect and the influence of the sun: a statistical analysis. Theroretical and Applied Climatology 61:1-7.
Trenberth, K. E. 1996. Global climate change. From an Abstract of Remarks by Scientists at the National Press Club, Washington, D.C., Climate Analysis Section, Newsletter 1(1). November 3, 1996.
45
Published September 2000 by WWF-World Wide Fund For Nature (Formerly World Wildlife Fund), Gland, Switzerland. WWF continues to be known as World Wildlife Fund in Canada and the US. Any reproduction in full or in part of this publication must mention the title and credit the above-mentioned publisher as the copyright owner. © text 2000 WWF. All rights reserved.
The material and the geographical designations in this report do not imply the expression of any opinion whatsoever on the part of WWF concerning the legal status of any country, territory, or area, or concerning the delimitation of its frontiers or boundaries.
United Nations. 1994. Disasters around the world--a global and regional view. U.N. World Conference on Natural Disaster Reduction, Yokohama, Japan, May 1994. IDNDR Information Paper No.4.
Vaughan, D. G. 1998. Antarctica: climate change and sea level. Statement prepared by Ice and Climate Division, British Antarctic Survey. (Internet: http://bsweb.nerc-bas.ac.uk/public/icd)
Vellinga, P., and R. Tol. 1993. Climate change: extreme events and society's response. Journal of Reinsurance 1(2):59-72. C. Lilly, ed.
Vinnikov, K. Y., A. Robock, R. J. Stouffer, J. E. Walsh, C. L. Parkinson, D. J. Cavalieri, J. F. B. Mitchell, D. Garrett, and V. F. Zakharov. 1999. Global warming and Northern Hemisphere sea ice extent. Science 286:1934-1937. December 3, 1999.
WASA Group. 1998. Changing waves and storms in the Northern Atlantic? Bulletin of the American Meteorological Society 79(5). May 1998.
Wigley, T. M. L. 1999. The science of climate change, global and U.S. perspectives. National Center for Atmospheric Research, Pew Center on Global Climate Change, June 29, 1999.
Wood, R.A., Keen, A.B., Mitchell, J.F.B. and Gregory, J.M., Changing spatial structure of the thermohaline circulation in response to atmospheric CO2 forcing in a climate model, Nature, Vol. 401 (Issue 6752), 1999, 508 (1)
Zwiers, F. W., and V. V. Kharin. 1998. Changes in the extremes of the climate simulated by CCC GCM2 under CO2-doubling. Journal of Climate 11:2200-2222.
46
Climate Change and Extreme Weather Events
P. Vellinga and W. J. van Verseveld
September 2000
WWF
vrije Universiteit amsterdamInstitute for Enviornmental Studies