Embed Size (px)
Citation preview
Journal of Marine Systems 105–108 (2012) 175–186
Contents lists available at SciVerse ScienceDirect
Journal of Marine Systems
j ourna l homepage: www.e lsev ie r .com/ locate / jmarsys
Climate change and the Baltic Sea action plan: Model simulations on the future of thewestern Baltic Sea
René Friedland ⁎, Thomas Neumann, Gerald SchernewskiBaltic Sea Research Institute Warnemünde, Seestraße 15, 18119 Rostock, Germany
⁎ Corresponding author.E-mail address: [email protected]
0924-7963/$ – see front matter © 2012 Elsevier B.V. Allhttp://dx.doi.org/10.1016/j.jmarsys.2012.08.002
a b s t r a c t
a r t i c l e i n f oArticle history:Received 7 July 2011Received in revised form 7 August 2012Accepted 14 August 2012Available online 25 August 2012
Keywords:Climate ChangeBaltic Sea Action PlanSimulationNutrient reduction scenarioWater Framework Directive
In this study we apply the model ERGOM to simulate the consequences of Climate Change as well as the combina-tion of Climate Changewith nutrient load reductions according to the Baltic Sea Action Plan (BSAP) on the Baltic Seaecosystem.According to the simulations, Climate Changewill cause an increase of thewater temperature up to 3 K and a salin-ity decrease of 1.5 PSU until 2100. However, the implementation of the BSAPwill havemuch stronger effects on theecosystem. Themodel suggests that the western Baltic Sea will shift from a nitrogen (N) towards a phosphorus (P)limited system. As a consequence, N-fixation will strongly decrease. The same applies to nutrient-concentrations inwinter, denitrification aswell as detritus and chlorophyll concentrations in summer. The availability ofN in summer,the Secchi depth and the oxygen saturation will increase. Our simulations suggest that the full implementation ofthe BSAPwill cause imbalances in the Baltic Sea over decades before a new system statewill be reached. Our resultsindicate that the Secchi depth alone is not a suitable indicator for the state of eutrophication. Concerning theWaterFrameworkDirective (WFD), Climate Changemight alter gradients and concentrations, e.g. of salinity, and in returnthis might require a re-definition of theWFD typology or a spatial shift of the surface water types, e.g. in Germany.The western Baltic Sea is strongly controlled by regional nutrient loads. Climate Change has only a limited effect onloads in the western Baltic. A re-definition of reference conditions and a good status because of Climate Changeseems not necessary.
© 2012 Elsevier B.V. All rights reserved.
1. Introduction
The Baltic Sea is a semi-enclosed and shallowmarginal seawith limit-ed water exchange with the ocean. Its salinity is controlled by the fresh-water budget and the water exchange with the North Sea (Feistel et al.,2008). Due to the positive freshwater budget, an estuarine like circulationdevelops which results in a permanent pycnocline that hampers an ex-change between bottom and surface water. Consequently, suboxic oreven anoxic conditions frequently occur in regions below the permanentpycnocline.
A dense population in the catchment area, intensive land use and therestrictedwater exchange resulted in an eutrophication ofmanymarineecosystems (Smith and Schindler, 2009). This has become awidespreadenvironmental problem, it includes increasing phytoplankton biomass,lower water transparency, stronger and more frequent cyanobacteriablooms and less oxygen in the bottomwater (Conley, 2012). Tomitigatethese problems various measures have been taken, regulations havebeen set up and public awareness has been raised to the eutrophicationproblem. But in a changing world it becomes more evident that envi-ronmental problems cannot be solved only as a reaction to the prob-lems, moreover the expected changes have to be taken into account.
(R. Friedland).
rights reserved.
The most serious impacts to global ecosystems are expected due toClimate Change (Philippart et al., 2011). However, due to the BalticSea's hydrographyeutrophicationwill be an evenmore important threatfor the ecosystem (HELCOM, 2009). Consequently, both, the expectedClimate Change and the nutrient supply to the Baltic Sea, have to be con-sidered for an evaluation of the probable future developments.
While Climate Change can only be treated on a global scale, eutrophi-cation has more regional and local aspects. The Helsinki Commission(HELCOM) has the task to protect the marine environment of the BalticSea and the Baltic Sea Action Plan (BSAP) is the tool for reaching theoverall aim of a good environmental status. In the BSAP (HELCOMMinisterial Meeting, 2007) the following ecological objectives for theBaltic Sea are defined: (a) concentrations of nutrients close to naturallevels, (b) clear water, (c) natural level of algal blooms, (d) natural dis-tribution and occurrence of plants and animals and (e) natural oxygenlevels. Excessive nitrogen and phosphorus loads originating fromland-based sources are regarded as the main causes of the eutrophica-tion of the Baltic Sea (HELCOM, 2009). About 75% of the nitrogen loadand at least 95% of the phosphorus load enter the Baltic Sea via riversor as direct waterborne discharges (HELCOM, 2009). About 25% of thenitrogen loads result from atmospheric deposition. Therefore, the BSAPsuggests a reduction of waterborne nutrient loads from 736,720 t N/a(36,310 t P/a) in the years 1997–2003 to 601,720 t N/a (21,060 t P/a)in 2021. This is a load reduction of 18% for N and 42% for P. The BSAP
176 R. Friedland et al. / Journal of Marine Systems 105–108 (2012) 175–186
admits that Climate Change will have a significant impact on the BalticSea, but does not deal with it explicitly. For an overall discussion of theBSAP and the feasibility of its aims see Backer et al. (2010) and Voss etal. (2011).
The nutrient load reductions according to the BSAP (HELCOMMinisterial Meeting, 2007) have been estimated on the basis of modelsimulations (Savchuk and Wulff, 2007). The used model (MARE-NEST)was a so-called inversemodel, which evaluates the loads fromprescribedenvironmental and water quality targets. Hakanson and Bryhn (2008)compared the MARE-NEST-model with the here used ERGOM, anddiscussed the reduction aims and their costs. However, so far ClimateChange effects have not been taken into account for the estimation ofthe allowable nutrient loads. Only Meier et al. (2012) made a transientsimulation for the 21st century and showed which water quality couldbe achieved with the BSAP load reductions. Furthermore Meier et al.(2011c) included both Climate Change and nutrient input changes witha time-slice approach, but in return with more ensemble members, bythis they could better estimate the uncertainties. Depending on theGCM they showed that the nutrient input reduction could be evenedout by Climate Change effects, what was also pointed out by Dokuliland Teubner (2011).
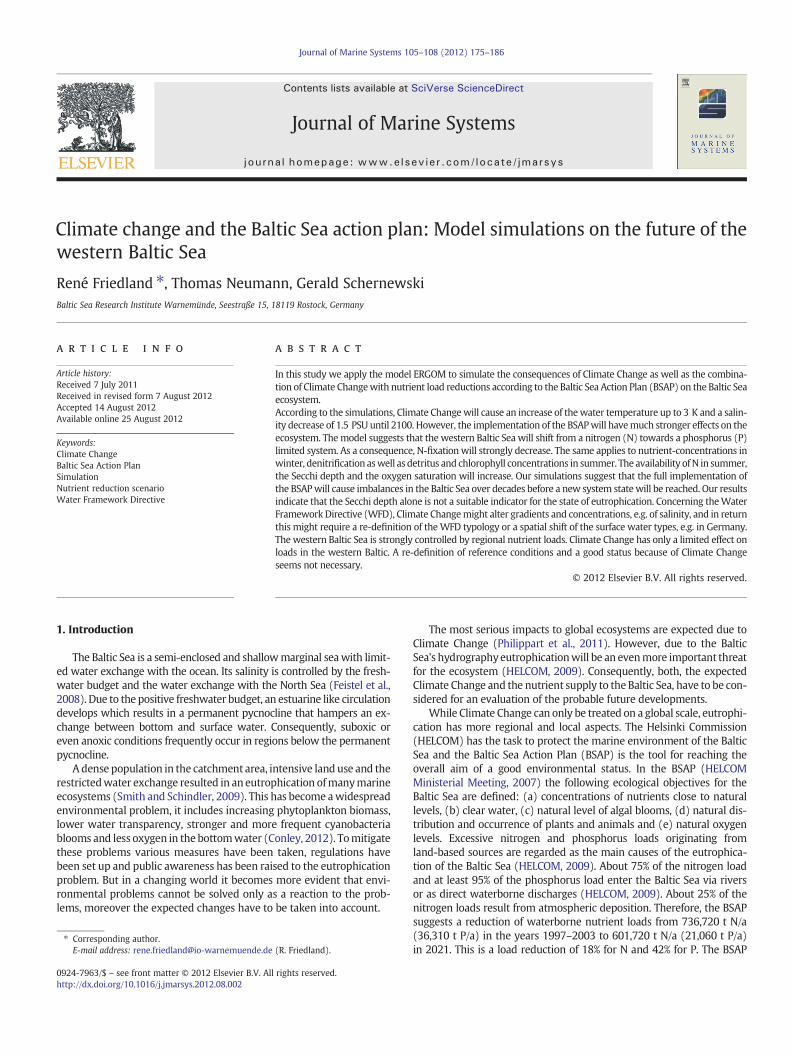
Thewestern Baltic Sea is a highly dynamic system (Siegel et al., 2005),influenced by the mainly wind-driven exchange with the more salineNorth Sea through the narrow Danish Streets and the less saline BalticProper (Feistel et al., 2008). As a consequence a salinity gradient fromwest to east occurs with the Darß Sill as a barrier for inflowing salty andoxygen-enriched bottom water (Fig. 1). Siegel et al. (2005) combinedship measurements, satellite data and model simulations to show howthe hydrographical conditions of thewestern Baltic Sea change under dif-ferent wind conditions. Although the Darß Sill holds oxygen-rich bottomwater back in theMecklenburger Bay, seasonal hypoxias occur (HELCOM,2009), as well in the Arkona Sea. The ecosystem is with a mean winterDIN/DIP-ratio of 9.2 not as strongly nitrogen limited as the Baltic Proper(Feistel et al., 2008). Furthermore cyanobacteria blooms occur frequentlyin theMecklenburger Bay and the Arkona Sea, which are not as strong asin the Baltic Proper. However in the last ten years a monthly mean ofalmost 200 μg/l was reported twice (Wasmund et al., 2011). Althoughthe cyanobacteria blooms are limited by the higher surface salinities(Stal et al., 1999), the bloom of 2006 lasted nearly two months and wastransported up to the Kattegat (Siegel and Gerth, 2008).
In this model study we focus on the consequences of a BSAP imple-mentation with respect to the western Baltic Sea under the conditionsof a future climate and discuss the implications for water quality objec-tives and the implementation of the EU Water Framework Directive(WFD). This regional focus has several reasons: a) in recent discussionsin the HELCOM working group MONAS, national authorities expressedtheir discontent with present box model simulations used for the
Fig. 1. The bathymetry of the western Baltic Sea model with the rivers and the isolatedpoints (AS—Arkona Sea used in Figs. 5 and 4b, MB—Mecklenburger Bay used in Figs. 7and 9).
calculation of water quality objectives and nutrient load reduction tar-gets and ask for regionalized approaches; b) in the western Baltic Seaa serious discrepancy between WFD and BSAP approaches exists andquality objectives partly do not exist or disagreements prevail; c) be-cause of the ragged coastline, the shallowness as well as the high popu-lation density and intensive agriculture in the river basins, the westernBaltic Sea is, compared to the open Baltic Sea, much more directly con-trolled by riverine nutrient loads and their temporal and spatial variabil-ity. Another special aspect is the exchange with the North Sea and theresulting strong salinity gradients and the variable oxygen conditions.
2. Method
The ecosystem model used in the present article is described inNeumann et al. (2002) and Neumann et al. (2002). The physical part ofthe model is based on the circulation model MOM (Pacanowski andGriffies, 2000) and has been adapted to the Baltic Sea with an explicitfree surface, an open boundary condition with respect to the North Seaand freshwater riverine input. A thermodynamic sea-ice model wasused to estimate ice cover thickness and extent. The horizontal resolutionof themodel grid is 3 nauticalmiles (242×222 cells), while vertically it isresolved into 77 layers with a layer thickness of 2–3 m for the upper100 mand a constant thickness of 6 mat greater depths. The bathymetryof the studied region is shown in Fig. 1 and it can be seen that near-shoresome local features get lost due to the still quite rough resolution.
The biogeochemical model consists of nine state variables. The nutri-ent variables are dissolved ammonium, nitrate and phosphate. Primaryproduction is provided by three functional phytoplankton groups: largecells, small cells and nitrogen fixers. Large cells (in the following calleddiatoms) grow rapidly under nutrient-rich conditions while small cells(called flagellates) have a growth advantage under low-nutrient condi-tions, especially during the summer. The third functional group is ableto fix and utilize nitrogen, as a consequence the model assumes thatphosphate is the only limiting nutrient for them. Furthermore, thegrowth of the nitrogen fixing algae depends on the water temperature,the lower limit is 16 °C. A dynamically developing bulk zooplanktonvariable provides grazing pressure on the phytoplankton. Accumulateddead particles are represented in a detritus state variable. During theprocess of sedimentation a portion of the detritus is mineralized intodissolved ammonium and phosphate. Another portion reaches the seabottom where it accumulates as sedimentary detritus and is subse-quently buried, mineralized or resuspended in the water column,depending on the velocity of the near-bottom currents. Under oxic con-ditions some of the mineralized phosphate binds iron oxides and istherefore retained in the sediment, where it is dissolved again if theconditions become anoxic. The generation and decomposition of oxy-gen is coupled to biogeochemical processes via stoichiometric ratios,while the oxygen level controls processes such as denitrification andnitrification.
Recent studies (Eilola et al., 2011; Maar et al., 2011) showed that thebiogeochemical model ERGOMperformswell, especially for the westernBaltic Sea and the Baltic Proper. Although only the results for thewesternpart are presented here, the whole Baltic Sea was simulated. The valuesin Figs. 3, 4a, 5a and 6 are averaged over the upper 15 m in the westernBaltic Sea and smoothed with a ten-year running mean.
2.1. Meteorological forcing
For themeteorological forcing the same setup as by Neumann (2010)was used. The forcing data were derived from the CLM ensemble simula-tions (CLM Community, 2008). It is a regional climate model (RCM) usedfor dynamic downscaling of global climate data for the European regionwith a horizontal resolution of about 18 km and a time resolution of 1 hfor wind components and 3 h for all other meteorological variables. Thelarge-scale controlling conditions were derived from transient ClimateChange simulations performed with the coupled ocean–atmosphere
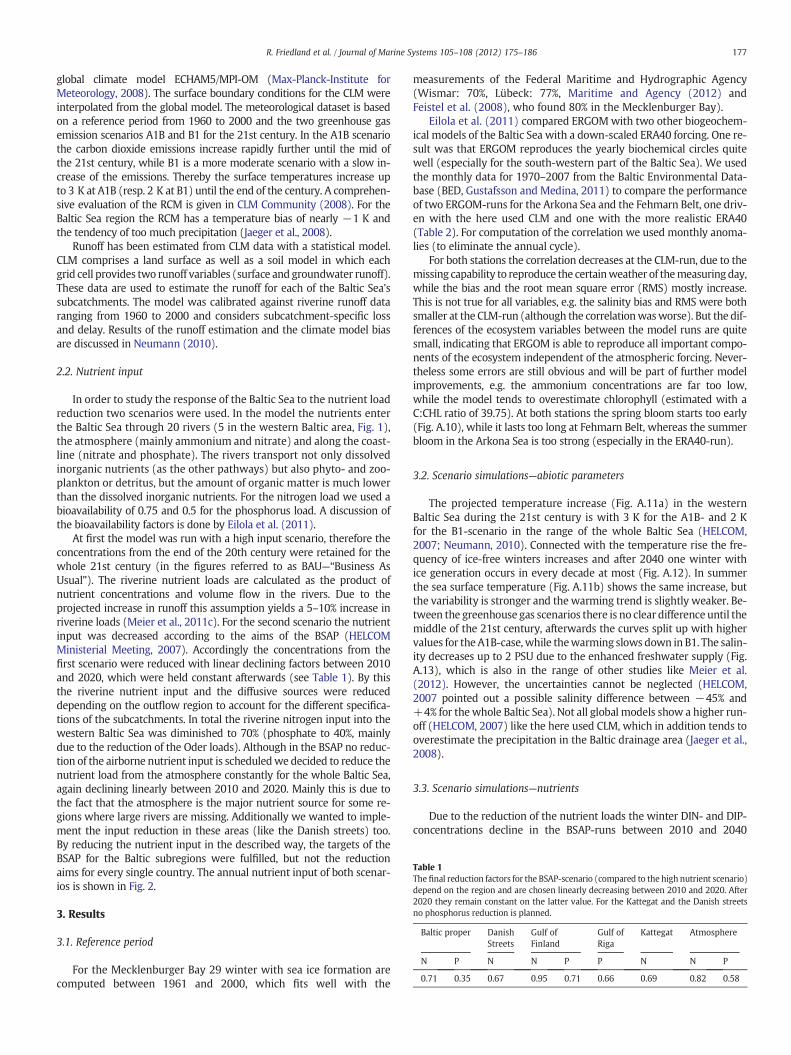
Table 1The final reduction factors for the BSAP-scenario (compared to the high nutrient scenario)depend on the region and are chosen linearly decreasing between 2010 and 2020. After2020 they remain constant on the latter value. For the Kattegat and the Danish streetsno phosphorus reduction is planned.
Baltic proper DanishStreets
Gulf ofFinland
Gulf ofRiga
Kattegat Atmosphere
N P N N P P N N P
0.71 0.35 0.67 0.95 0.71 0.66 0.69 0.82 0.58
177R. Friedland et al. / Journal of Marine Systems 105–108 (2012) 175–186
global climate model ECHAM5/MPI-OM (Max-Planck-Institute forMeteorology, 2008). The surface boundary conditions for the CLM wereinterpolated from the global model. The meteorological dataset is basedon a reference period from 1960 to 2000 and the two greenhouse gasemission scenarios A1B and B1 for the 21st century. In the A1B scenariothe carbon dioxide emissions increase rapidly further until the mid ofthe 21st century, while B1 is a more moderate scenario with a slow in-crease of the emissions. Thereby the surface temperatures increase upto 3 K at A1B (resp. 2 K at B1) until the end of the century. A comprehen-sive evaluation of the RCM is given in CLM Community (2008). For theBaltic Sea region the RCM has a temperature bias of nearly −1 K andthe tendency of too much precipitation (Jaeger et al., 2008).
Runoff has been estimated from CLM data with a statistical model.CLM comprises a land surface as well as a soil model in which eachgrid cell provides two runoff variables (surface and groundwater runoff).These data are used to estimate the runoff for each of the Baltic Sea'ssubcatchments. The model was calibrated against riverine runoff dataranging from 1960 to 2000 and considers subcatchment-specific lossand delay. Results of the runoff estimation and the climate model biasare discussed in Neumann (2010).
2.2. Nutrient input
In order to study the response of the Baltic Sea to the nutrient loadreduction two scenarios were used. In the model the nutrients enterthe Baltic Sea through 20 rivers (5 in the western Baltic area, Fig. 1),the atmosphere (mainly ammonium and nitrate) and along the coast-line (nitrate and phosphate). The rivers transport not only dissolvedinorganic nutrients (as the other pathways) but also phyto- and zoo-plankton or detritus, but the amount of organic matter is much lowerthan the dissolved inorganic nutrients. For the nitrogen load we used abioavailability of 0.75 and 0.5 for the phosphorus load. A discussion ofthe bioavailability factors is done by Eilola et al. (2011).
At first the model was run with a high input scenario, therefore theconcentrations from the end of the 20th century were retained for thewhole 21st century (in the figures referred to as BAU—“Business AsUsual”). The riverine nutrient loads are calculated as the product ofnutrient concentrations and volume flow in the rivers. Due to theprojected increase in runoff this assumption yields a 5–10% increase inriverine loads (Meier et al., 2011c). For the second scenario the nutrientinput was decreased according to the aims of the BSAP (HELCOMMinisterial Meeting, 2007). Accordingly the concentrations from thefirst scenario were reduced with linear declining factors between 2010and 2020, which were held constant afterwards (see Table 1). By thisthe riverine nutrient input and the diffusive sources were reduceddepending on the outflow region to account for the different specifica-tions of the subcatchments. In total the riverine nitrogen input into thewestern Baltic Sea was diminished to 70% (phosphate to 40%, mainlydue to the reduction of the Oder loads). Although in the BSAP no reduc-tion of the airborne nutrient input is scheduledwe decided to reduce thenutrient load from the atmosphere constantly for the whole Baltic Sea,again declining linearly between 2010 and 2020. Mainly this is due tothe fact that the atmosphere is the major nutrient source for some re-gions where large rivers are missing. Additionally we wanted to imple-ment the input reduction in these areas (like the Danish streets) too.By reducing the nutrient input in the described way, the targets of theBSAP for the Baltic subregions were fulfilled, but not the reductionaims for every single country. The annual nutrient input of both scenar-ios is shown in Fig. 2.
3. Results
3.1. Reference period
For the Mecklenburger Bay 29 winter with sea ice formation arecomputed between 1961 and 2000, which fits well with the
measurements of the Federal Maritime and Hydrographic Agency(Wismar: 70%, Lübeck: 77%, Maritime and Agency (2012) andFeistel et al. (2008), who found 80% in the Mecklenburger Bay).
Eilola et al. (2011) compared ERGOMwith two other biogeochem-ical models of the Baltic Sea with a down-scaled ERA40 forcing. One re-sult was that ERGOM reproduces the yearly biochemical circles quitewell (especially for the south-western part of the Baltic Sea). We usedthe monthly data for 1970–2007 from the Baltic Environmental Data-base (BED, Gustafsson and Medina, 2011) to compare the performanceof two ERGOM-runs for the Arkona Sea and the Fehmarn Belt, one driv-en with the here used CLM and one with the more realistic ERA40(Table 2). For computation of the correlation we used monthly anoma-lies (to eliminate the annual cycle).
For both stations the correlation decreases at the CLM-run, due to themissing capability to reproduce the certainweather of themeasuring day,while the bias and the root mean square error (RMS) mostly increase.This is not true for all variables, e.g. the salinity bias and RMS were bothsmaller at the CLM-run (although the correlationwasworse). But the dif-ferences of the ecosystem variables between the model runs are quitesmall, indicating that ERGOM is able to reproduce all important compo-nents of the ecosystem independent of the atmospheric forcing. Never-theless some errors are still obvious and will be part of further modelimprovements, e.g. the ammonium concentrations are far too low,while the model tends to overestimate chlorophyll (estimated with aC:CHL ratio of 39.75). At both stations the spring bloom starts too early(Fig. A.10), while it lasts too long at Fehmarn Belt, whereas the summerbloom in the Arkona Sea is too strong (especially in the ERA40-run).
3.2. Scenario simulations—abiotic parameters
The projected temperature increase (Fig. A.11a) in the westernBaltic Sea during the 21st century is with 3 K for the A1B- and 2 Kfor the B1-scenario in the range of the whole Baltic Sea (HELCOM,2007; Neumann, 2010). Connected with the temperature rise the fre-quency of ice-free winters increases and after 2040 one winter withice generation occurs in every decade at most (Fig. A.12). In summerthe sea surface temperature (Fig. A.11b) shows the same increase, butthe variability is stronger and the warming trend is slightly weaker. Be-tween the greenhouse gas scenarios there is no clear difference until themiddle of the 21st century, afterwards the curves split up with highervalues for the A1B-case, while thewarming slows down in B1. The salin-ity decreases up to 2 PSU due to the enhanced freshwater supply (Fig.A.13), which is also in the range of other studies like Meier et al.(2012). However, the uncertainties cannot be neglected (HELCOM,2007 pointed out a possible salinity difference between −45% and+4% for the whole Baltic Sea). Not all global models show a higher run-off (HELCOM, 2007) like the here used CLM, which in addition tends tooverestimate the precipitation in the Baltic drainage area (Jaeger et al.,2008).
3.3. Scenario simulations—nutrients
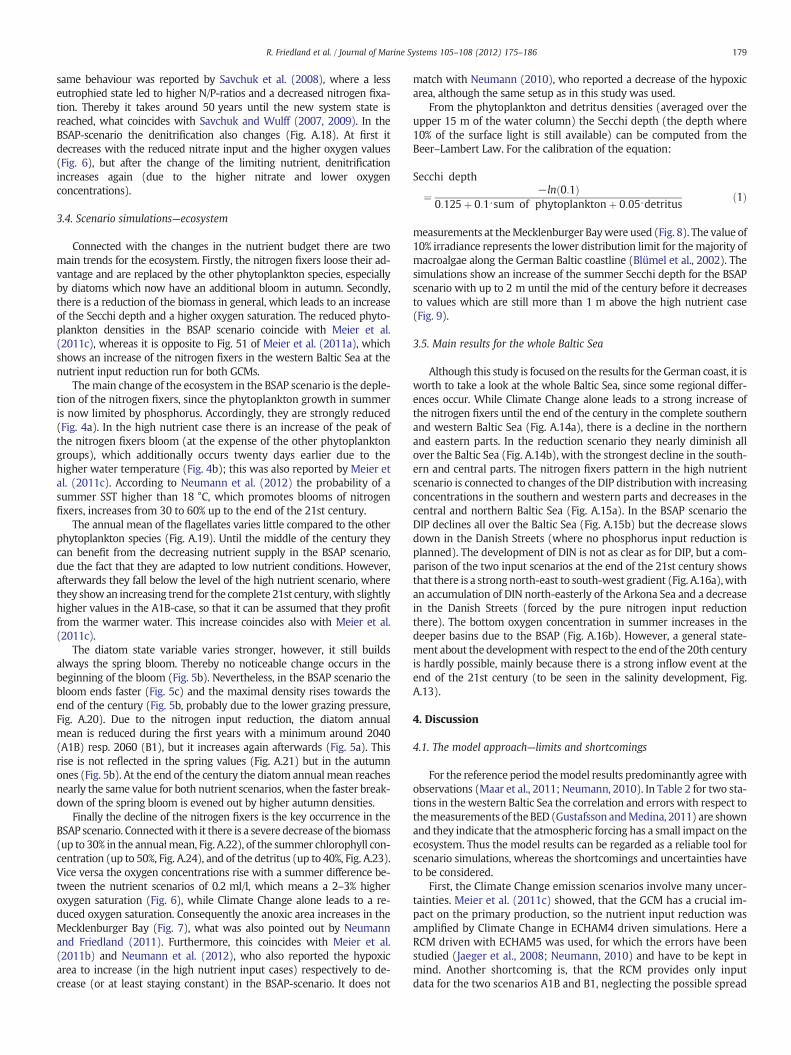
Due to the reduction of the nutrient loads the winter DIN- and DIP-concentrations decline in the BSAP-runs between 2010 and 2040
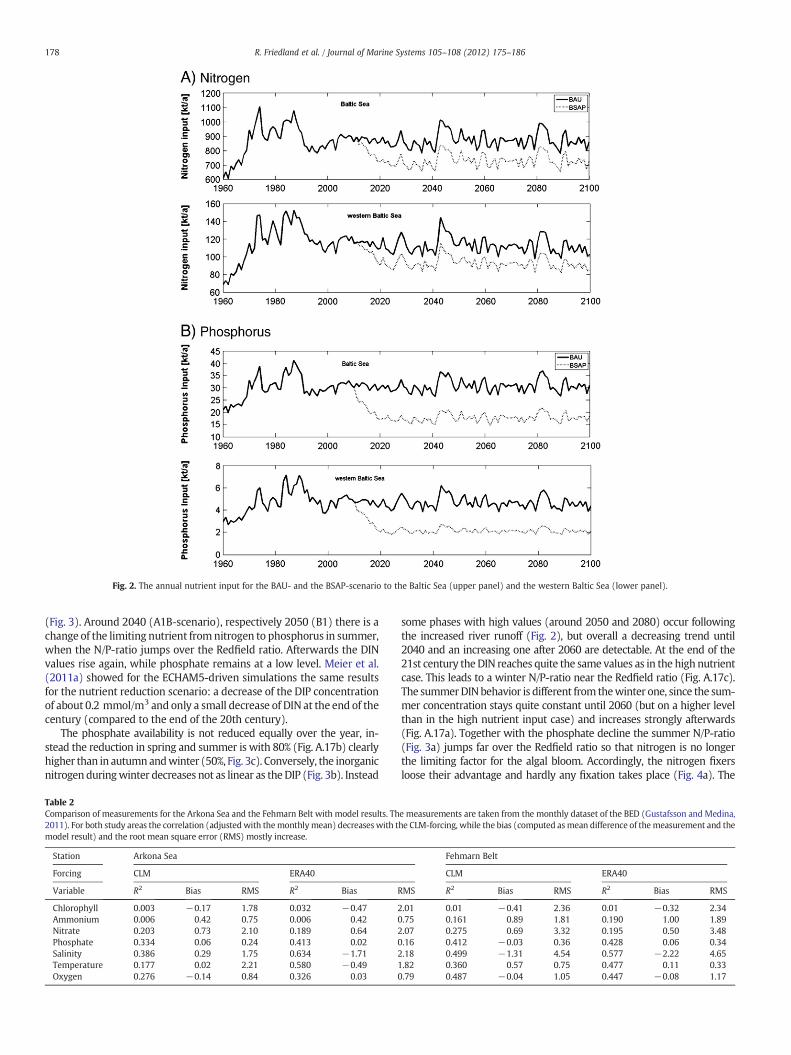
Fig. 2. The annual nutrient input for the BAU- and the BSAP-scenario to the Baltic Sea (upper panel) and the western Baltic Sea (lower panel).
178 R. Friedland et al. / Journal of Marine Systems 105–108 (2012) 175–186
(Fig. 3). Around 2040 (A1B-scenario), respectively 2050 (B1) there is achange of the limiting nutrient fromnitrogen to phosphorus in summer,when the N/P-ratio jumps over the Redfield ratio. Afterwards the DINvalues rise again, while phosphate remains at a low level. Meier et al.(2011a) showed for the ECHAM5-driven simulations the same resultsfor the nutrient reduction scenario: a decrease of the DIP concentrationof about 0.2 mmol/m3 and only a small decrease of DIN at the end of thecentury (compared to the end of the 20th century).
The phosphate availability is not reduced equally over the year, in-stead the reduction in spring and summer is with 80% (Fig. A.17b) clearlyhigher than in autumnandwinter (50%, Fig. 3c). Conversely, the inorganicnitrogen duringwinter decreases not as linear as the DIP (Fig. 3b). Instead
Table 2Comparison of measurements for the Arkona Sea and the Fehmarn Belt with model results. Th2011). For both study areas the correlation (adjustedwith themonthlymean) decreases with tmodel result) and the root mean square error (RMS) mostly increase.
Station Arkona Sea
Forcing CLM ERA40
Variable R2 Bias RMS R2 Bias R
Chlorophyll 0.003 −0.17 1.78 0.032 −0.47 2Ammonium 0.006 0.42 0.75 0.006 0.42 0Nitrate 0.203 0.73 2.10 0.189 0.64 2Phosphate 0.334 0.06 0.24 0.413 0.02 0Salinity 0.386 0.29 1.75 0.634 −1.71 2Temperature 0.177 0.02 2.21 0.580 −0.49 1Oxygen 0.276 −0.14 0.84 0.326 0.03 0
some phases with high values (around 2050 and 2080) occur followingthe increased river runoff (Fig. 2), but overall a decreasing trend until2040 and an increasing one after 2060 are detectable. At the end of the21st century theDIN reaches quite the same values as in the high nutrientcase. This leads to a winter N/P-ratio near the Redfield ratio (Fig. A.17c).The summerDINbehavior is different from thewinter one, since the sum-mer concentration stays quite constant until 2060 (but on a higher levelthan in the high nutrient input case) and increases strongly afterwards(Fig. A.17a). Together with the phosphate decline the summer N/P-ratio(Fig. 3a) jumps far over the Redfield ratio so that nitrogen is no longerthe limiting factor for the algal bloom. Accordingly, the nitrogen fixersloose their advantage and hardly any fixation takes place (Fig. 4a). The
e measurements are taken from the monthly dataset of the BED (Gustafsson and Medina,he CLM-forcing, while the bias (computed asmean difference of themeasurement and the
Fehmarn Belt
CLM ERA40
MS R2 Bias RMS R2 Bias RMS
.01 0.01 −0.41 2.36 0.01 −0.32 2.34
.75 0.161 0.89 1.81 0.190 1.00 1.89
.07 0.275 0.69 3.32 0.195 0.50 3.48
.16 0.412 −0.03 0.36 0.428 0.06 0.34
.18 0.499 −1.31 4.54 0.577 −2.22 4.65
.82 0.360 0.57 0.75 0.477 0.11 0.33
.79 0.487 −0.04 1.05 0.447 −0.08 1.17
179R. Friedland et al. / Journal of Marine Systems 105–108 (2012) 175–186
same behaviour was reported by Savchuk et al. (2008), where a lesseutrophied state led to higher N/P-ratios and a decreased nitrogen fixa-tion. Thereby it takes around 50 years until the new system state isreached, what coincides with Savchuk and Wulff (2007, 2009). In theBSAP-scenario the denitrification also changes (Fig. A.18). At first itdecreases with the reduced nitrate input and the higher oxygen values(Fig. 6), but after the change of the limiting nutrient, denitrificationincreases again (due to the higher nitrate and lower oxygenconcentrations).
3.4. Scenario simulations—ecosystem
Connected with the changes in the nutrient budget there are twomain trends for the ecosystem. Firstly, the nitrogen fixers loose their ad-vantage and are replaced by the other phytoplankton species, especiallyby diatoms which now have an additional bloom in autumn. Secondly,there is a reduction of the biomass in general, which leads to an increaseof the Secchi depth and a higher oxygen saturation. The reduced phyto-plankton densities in the BSAP scenario coincide with Meier et al.(2011c), whereas it is opposite to Fig. 51 of Meier et al. (2011a), whichshows an increase of the nitrogen fixers in the western Baltic Sea at thenutrient input reduction run for both GCMs.
Themain change of the ecosystem in the BSAP scenario is the deple-tion of the nitrogen fixers, since the phytoplankton growth in summeris now limited by phosphorus. Accordingly, they are strongly reduced(Fig. 4a). In the high nutrient case there is an increase of the peak ofthe nitrogen fixers bloom (at the expense of the other phytoplanktongroups), which additionally occurs twenty days earlier due to thehigher water temperature (Fig. 4b); this was also reported by Meier etal. (2011c). According to Neumann et al. (2012) the probability of asummer SST higher than 18 °C, which promotes blooms of nitrogenfixers, increases from 30 to 60% up to the end of the 21st century.
The annual mean of the flagellates varies little compared to the otherphytoplankton species (Fig. A.19). Until the middle of the century theycan benefit from the decreasing nutrient supply in the BSAP scenario,due the fact that they are adapted to low nutrient conditions. However,afterwards they fall below the level of the high nutrient scenario, wherethey showan increasing trend for the complete 21st century,with slightlyhigher values in the A1B-case, so that it can be assumed that they profitfrom the warmer water. This increase coincides also with Meier et al.(2011c).
The diatom state variable varies stronger, however, it still buildsalways the spring bloom. Thereby no noticeable change occurs in thebeginning of the bloom (Fig. 5b). Nevertheless, in the BSAP scenario thebloom ends faster (Fig. 5c) and the maximal density rises towards theend of the century (Fig. 5b, probably due to the lower grazing pressure,Fig. A.20). Due to the nitrogen input reduction, the diatom annualmean is reduced during the first years with a minimum around 2040(A1B) resp. 2060 (B1), but it increases again afterwards (Fig. 5a). Thisrise is not reflected in the spring values (Fig. A.21) but in the autumnones (Fig. 5b). At the end of the century the diatom annual mean reachesnearly the same value for both nutrient scenarios, when the faster break-down of the spring bloom is evened out by higher autumn densities.
Finally the decline of the nitrogen fixers is the key occurrence in theBSAP scenario. Connectedwith it there is a severe decrease of the biomass(up to 30% in the annualmean, Fig. A.22), of the summer chlorophyll con-centration (up to 50%, Fig. A.24), and of the detritus (up to 40%, Fig. A.23).Vice versa the oxygen concentrations rise with a summer difference be-tween the nutrient scenarios of 0.2 ml/l, which means a 2–3% higheroxygen saturation (Fig. 6), while Climate Change alone leads to a re-duced oxygen saturation. Consequently the anoxic area increases in theMecklenburger Bay (Fig. 7), what was also pointed out by Neumannand Friedland (2011). Furthermore, this coincides with Meier et al.(2011b) and Neumann et al. (2012), who also reported the hypoxicarea to increase (in the high nutrient input cases) respectively to de-crease (or at least staying constant) in the BSAP-scenario. It does not
match with Neumann (2010), who reported a decrease of the hypoxicarea, although the same setup as in this study was used.
From the phytoplankton and detritus densities (averaged over theupper 15 m of the water column) the Secchi depth (the depth where10% of the surface light is still available) can be computed from theBeer–Lambert Law. For the calibration of the equation:
Secchi depth
¼ −ln 0:1ð Þ0:125þ 0:1⋅sum of phytoplanktonþ 0:05⋅detritus ð1Þ
measurements at theMecklenburger Baywere used (Fig. 8). The value of10% irradiance represents the lower distribution limit for themajority ofmacroalgae along the German Baltic coastline (Blümel et al., 2002). Thesimulations show an increase of the summer Secchi depth for the BSAPscenario with up to 2 m until the mid of the century before it decreasesto values which are still more than 1 m above the high nutrient case(Fig. 9).
3.5. Main results for the whole Baltic Sea
Although this study is focused on the results for the German coast, it isworth to take a look at the whole Baltic Sea, since some regional differ-ences occur. While Climate Change alone leads to a strong increase ofthe nitrogen fixers until the end of the century in the complete southernand western Baltic Sea (Fig. A.14a), there is a decline in the northernand eastern parts. In the reduction scenario they nearly diminish allover the Baltic Sea (Fig. A.14b), with the strongest decline in the south-ern and central parts. The nitrogen fixers pattern in the high nutrientscenario is connected to changes of the DIP distributionwith increasingconcentrations in the southern and western parts and decreases in thecentral and northern Baltic Sea (Fig. A.15a). In the BSAP scenario theDIP declines all over the Baltic Sea (Fig. A.15b) but the decrease slowsdown in the Danish Streets (where no phosphorus input reduction isplanned). The development of DIN is not as clear as for DIP, but a com-parison of the two input scenarios at the end of the 21st century showsthat there is a strong north-east to south-west gradient (Fig. A.16a),withan accumulation of DIN north-easterly of the Arkona Sea and a decreasein the Danish Streets (forced by the pure nitrogen input reductionthere). The bottom oxygen concentration in summer increases in thedeeper basins due to the BSAP (Fig. A.16b). However, a general state-ment about the developmentwith respect to the endof the 20th centuryis hardly possible, mainly because there is a strong inflow event at theend of the 21st century (to be seen in the salinity development, Fig.A.13).
4. Discussion
4.1. The model approach—limits and shortcomings
For the reference period themodel results predominantly agreewithobservations (Maar et al., 2011; Neumann, 2010). In Table 2 for two sta-tions in thewestern Baltic Sea the correlation and errors with respect tothemeasurements of theBED (Gustafsson andMedina, 2011) are shownand they indicate that the atmospheric forcing has a small impact on theecosystem. Thus the model results can be regarded as a reliable tool forscenario simulations, whereas the shortcomings and uncertainties haveto be considered.
First, the Climate Change emission scenarios involve many uncer-tainties. Meier et al. (2011c) showed, that the GCM has a crucial im-pact on the primary production, so the nutrient input reduction wasamplified by Climate Change in ECHAM4 driven simulations. Here aRCM driven with ECHAM5 was used, for which the errors have beenstudied (Jaeger et al., 2008; Neumann, 2010) and have to be kept inmind. Another shortcoming is, that the RCM provides only inputdata for the two scenarios A1B and B1, neglecting the possible spread
Fig. 3. In the BSAP scenario a change from a nitrogen- to a phosphorus-limited ecosystem occurs.
180 R. Friedland et al. / Journal of Marine Systems 105–108 (2012) 175–186
of Climate Change. Furthermore, the river runoff strongly depends onthe GCM and the model results are strongly influenced by the runoff(like the phytoplankton peeks during the strong precipitation periodsaround 2050 and 2090 show). Vice versa Meier et al. (2011c) found aclimate related nutrient load increase of about 5–10% (through alltheir used GCMs) while the load reduction according to the BSAP isabout 25–30%. Furthermore Krämer et al. (2011) pointed out, thatthe nitrogen loads of the Oder could increase up to 23% due tolanduse changes within the next years. So it can be assumed thatthe human impact on the nutrient loads is more important than theeffects of Climate Change. However, some uncertainties with respectto the future nutrient loads are still unknown, e.g. the denitrification
in the soils could be affected by the warming or heavy rainfalls maywash more nutrients out. Finally only the calculation of more emissionscenarios with different global and regional climate models will showthe full spectrum of possible future changes and their likelihood in theBaltic Sea ecosystem.
However, themodel results show that for the western Baltic Sea thenutrient load reductions have a much stronger effect on the ecosystemthan Climate Change. The BSAP included specific nutrient load reduc-tion objectives for all Baltic Sea regions, whereas the concrete allocationof these load reductions within all countries was neglected. Therefore,the model results can be regarded as reliable as long as spatial averagesover a sea region are concerned. Our present approach does not allow a
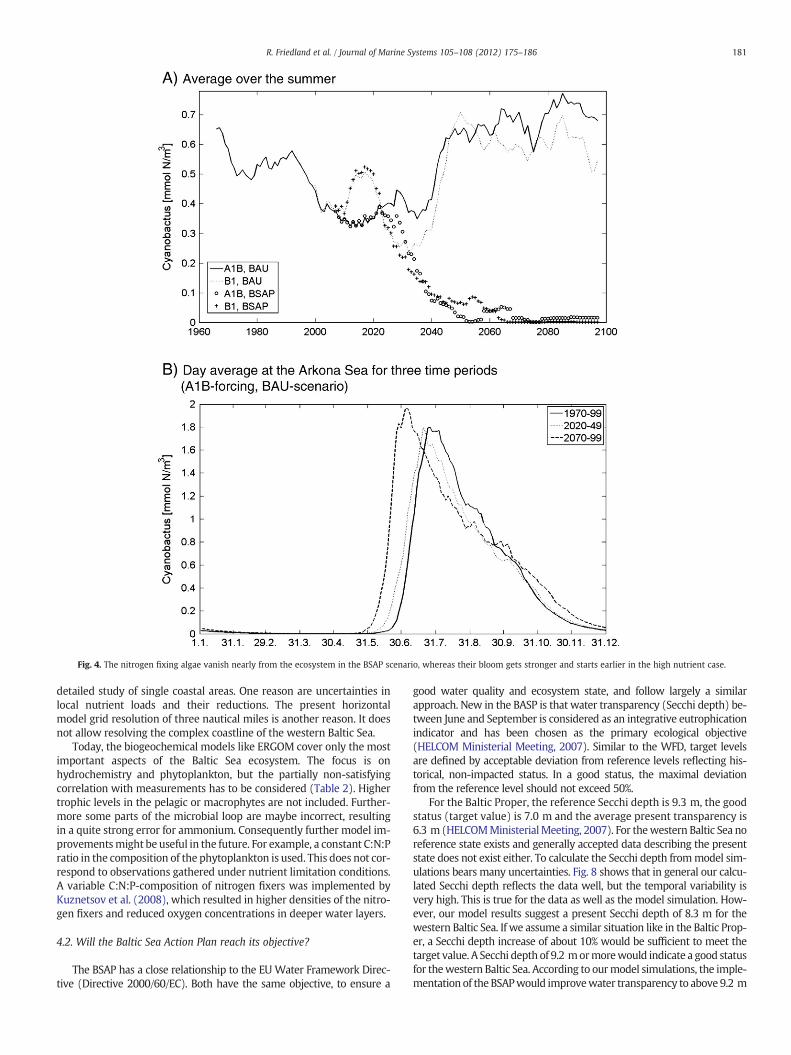
Fig. 4. The nitrogen fixing algae vanish nearly from the ecosystem in the BSAP scenario, whereas their bloom gets stronger and starts earlier in the high nutrient case.
181R. Friedland et al. / Journal of Marine Systems 105–108 (2012) 175–186
detailed study of single coastal areas. One reason are uncertainties inlocal nutrient loads and their reductions. The present horizontalmodel grid resolution of three nautical miles is another reason. It doesnot allow resolving the complex coastline of the western Baltic Sea.
Today, the biogeochemical models like ERGOM cover only the mostimportant aspects of the Baltic Sea ecosystem. The focus is onhydrochemistry and phytoplankton, but the partially non-satisfyingcorrelation with measurements has to be considered (Table 2). Highertrophic levels in the pelagic or macrophytes are not included. Further-more some parts of the microbial loop are maybe incorrect, resultingin a quite strong error for ammonium. Consequently further model im-provementsmight be useful in the future. For example, a constant C:N:Pratio in the composition of the phytoplankton is used. This does not cor-respond to observations gathered under nutrient limitation conditions.A variable C:N:P-composition of nitrogen fixers was implemented byKuznetsov et al. (2008), which resulted in higher densities of the nitro-gen fixers and reduced oxygen concentrations in deeper water layers.
4.2. Will the Baltic Sea Action Plan reach its objective?
The BSAP has a close relationship to the EU Water Framework Direc-tive (Directive 2000/60/EC). Both have the same objective, to ensure a
good water quality and ecosystem state, and follow largely a similarapproach. New in the BASP is that water transparency (Secchi depth) be-tween June and September is considered as an integrative eutrophicationindicator and has been chosen as the primary ecological objective(HELCOM Ministerial Meeting, 2007). Similar to the WFD, target levelsare defined by acceptable deviation from reference levels reflecting his-torical, non-impacted status. In a good status, the maximal deviationfrom the reference level should not exceed 50%.
For the Baltic Proper, the reference Secchi depth is 9.3 m, the goodstatus (target value) is 7.0 m and the average present transparency is6.3 m (HELCOMMinisterialMeeting, 2007). For thewestern Baltic Sea noreference state exists and generally accepted data describing the presentstate does not exist either. To calculate the Secchi depth frommodel sim-ulations bears many uncertainties. Fig. 8 shows that in general our calcu-lated Secchi depth reflects the data well, but the temporal variability isvery high. This is true for the data as well as the model simulation. How-ever, our model results suggest a present Secchi depth of 8.3 m for thewestern Baltic Sea. If we assume a similar situation like in the Baltic Prop-er, a Secchi depth increase of about 10% would be sufficient to meet thetarget value. A Secchi depth of 9.2 mormorewould indicate a good statusfor thewestern Baltic Sea. According to ourmodel simulations, the imple-mentation of the BSAPwould improvewater transparency to above 9.2 m
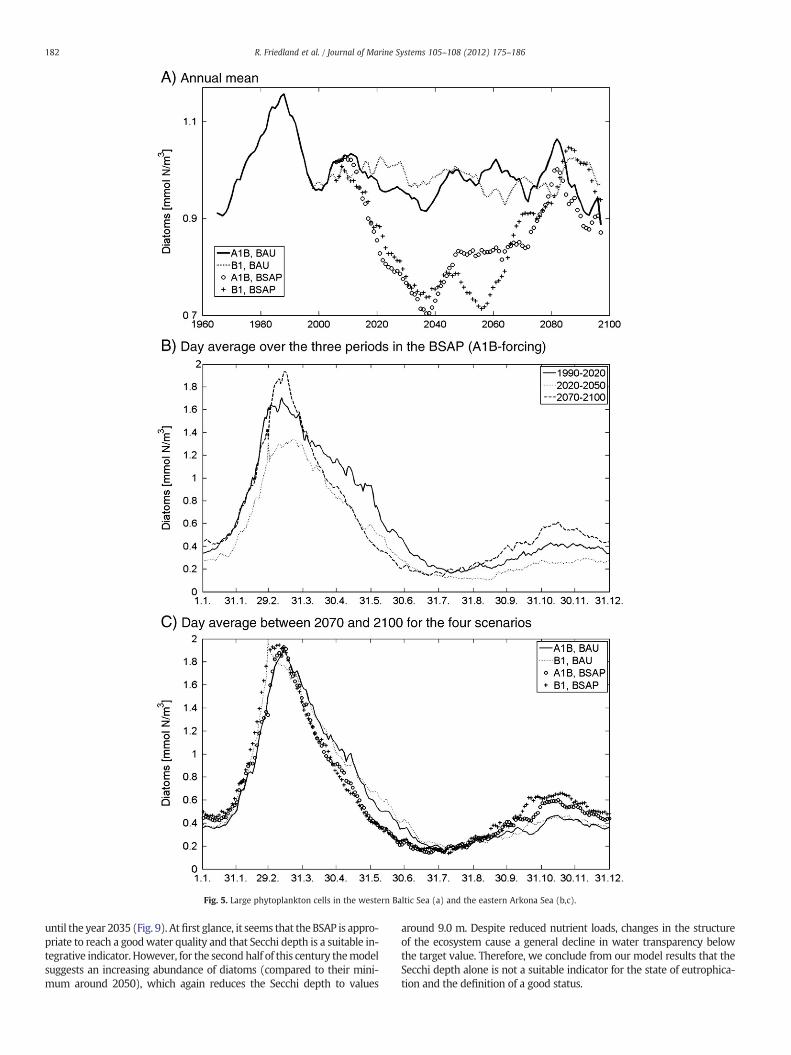
Fig. 5. Large phytoplankton cells in the western Baltic Sea (a) and the eastern Arkona Sea (b,c).
182 R. Friedland et al. / Journal of Marine Systems 105–108 (2012) 175–186
until the year 2035 (Fig. 9). Atfirst glance, it seems that the BSAP is appro-priate to reach a goodwater quality and that Secchi depth is a suitable in-tegrative indicator. However, for the second half of this century themodelsuggests an increasing abundance of diatoms (compared to their mini-mum around 2050), which again reduces the Secchi depth to values
around 9.0 m. Despite reduced nutrient loads, changes in the structureof the ecosystem cause a general decline in water transparency belowthe target value. Therefore, we conclude from our model results that theSecchi depth alone is not a suitable indicator for the state of eutrophica-tion and the definition of a good status.
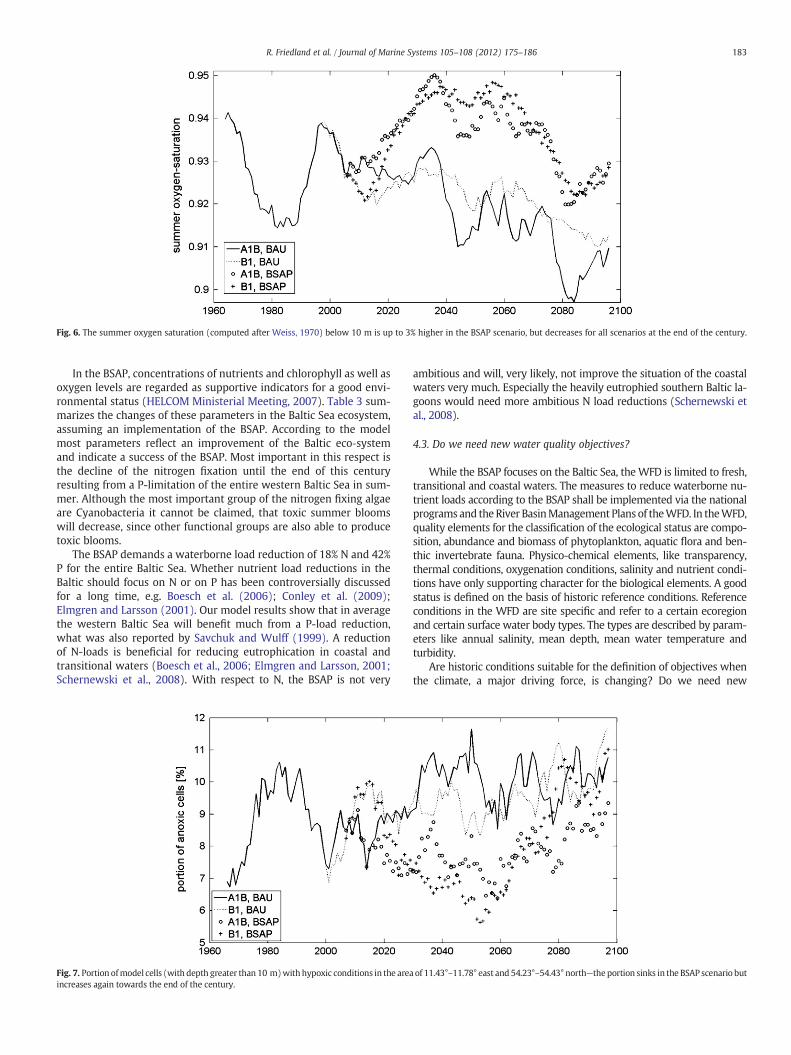
Fig. 6. The summer oxygen saturation (computed after Weiss, 1970) below 10 m is up to 3% higher in the BSAP scenario, but decreases for all scenarios at the end of the century.
183R. Friedland et al. / Journal of Marine Systems 105–108 (2012) 175–186
In the BSAP, concentrations of nutrients and chlorophyll as well asoxygen levels are regarded as supportive indicators for a good envi-ronmental status (HELCOM Ministerial Meeting, 2007). Table 3 sum-marizes the changes of these parameters in the Baltic Sea ecosystem,assuming an implementation of the BSAP. According to the modelmost parameters reflect an improvement of the Baltic eco‐systemand indicate a success of the BSAP. Most important in this respect isthe decline of the nitrogen fixation until the end of this centuryresulting from a P-limitation of the entire western Baltic Sea in sum-mer. Although the most important group of the nitrogen fixing algaeare Cyanobacteria it cannot be claimed, that toxic summer bloomswill decrease, since other functional groups are also able to producetoxic blooms.
The BSAP demands a waterborne load reduction of 18% N and 42%P for the entire Baltic Sea. Whether nutrient load reductions in theBaltic should focus on N or on P has been controversially discussedfor a long time, e.g. Boesch et al. (2006); Conley et al. (2009);Elmgren and Larsson (2001). Our model results show that in averagethe western Baltic Sea will benefit much from a P-load reduction,what was also reported by Savchuk and Wulff (1999). A reductionof N-loads is beneficial for reducing eutrophication in coastal andtransitional waters (Boesch et al., 2006; Elmgren and Larsson, 2001;Schernewski et al., 2008). With respect to N, the BSAP is not very
Fig. 7. Portion ofmodel cells (with depth greater than 10 m)with hypoxic conditions in the areaincreases again towards the end of the century.
ambitious and will, very likely, not improve the situation of the coastalwaters very much. Especially the heavily eutrophied southern Baltic la-goons would need more ambitious N load reductions (Schernewski etal., 2008).
4.3. Do we need new water quality objectives?
While the BSAP focuses on the Baltic Sea, theWFD is limited to fresh,transitional and coastal waters. The measures to reduce waterborne nu-trient loads according to the BSAP shall be implemented via the nationalprograms and theRiver BasinManagement Plans of theWFD. In theWFD,quality elements for the classification of the ecological status are compo-sition, abundance and biomass of phytoplankton, aquatic flora and ben-thic invertebrate fauna. Physico-chemical elements, like transparency,thermal conditions, oxygenation conditions, salinity and nutrient condi-tions have only supporting character for the biological elements. A goodstatus is defined on the basis of historic reference conditions. Referenceconditions in the WFD are site specific and refer to a certain ecoregionand certain surface water body types. The types are described by param-eters like annual salinity, mean depth, mean water temperature andturbidity.
Are historic conditions suitable for the definition of objectives whenthe climate, a major driving force, is changing? Do we need new
of 11.43°–11.78° east and 54.23°–54.43° north—the portion sinks in the BSAP scenario but
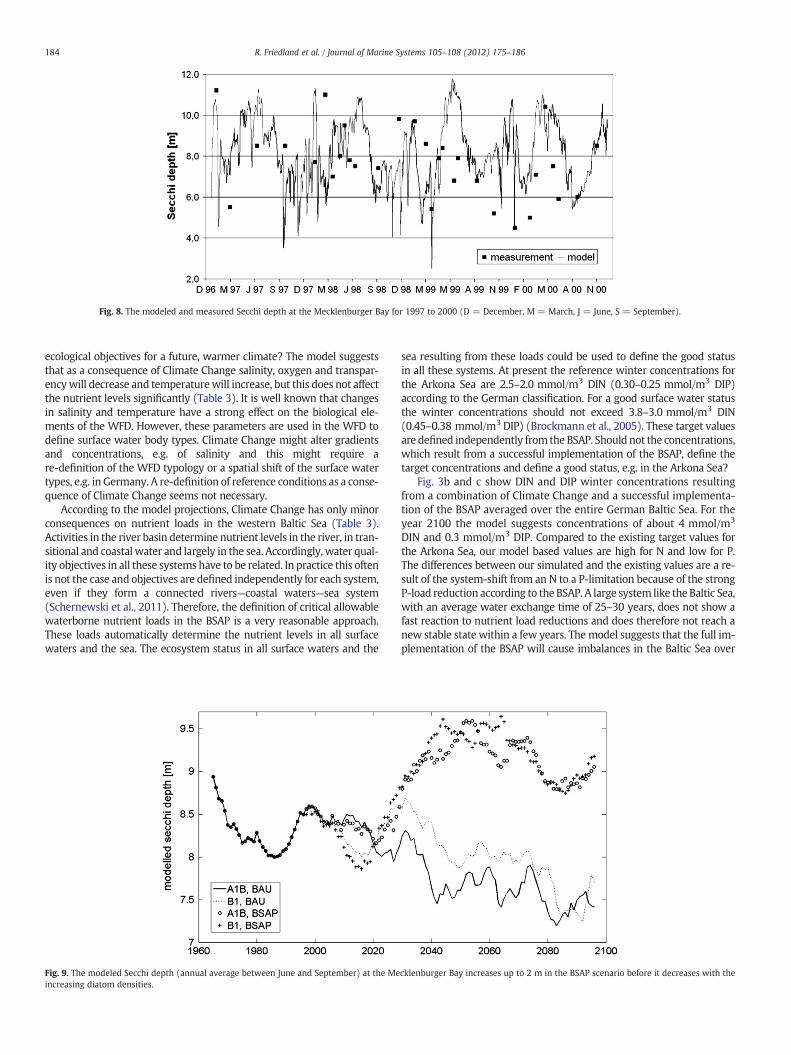
Fig. 8. The modeled and measured Secchi depth at the Mecklenburger Bay for 1997 to 2000 (D = December, M = March, J = June, S = September).
184 R. Friedland et al. / Journal of Marine Systems 105–108 (2012) 175–186
ecological objectives for a future, warmer climate? The model suggeststhat as a consequence of Climate Change salinity, oxygen and transpar-encywill decrease and temperaturewill increase, but this does not affectthe nutrient levels significantly (Table 3). It is well known that changesin salinity and temperature have a strong effect on the biological ele-ments of the WFD. However, these parameters are used in the WFD todefine surface water body types. Climate Change might alter gradientsand concentrations, e.g. of salinity and this might require are-definition of the WFD typology or a spatial shift of the surface watertypes, e.g. in Germany. A re-definition of reference conditions as a conse-quence of Climate Change seems not necessary.
According to the model projections, Climate Change has only minorconsequences on nutrient loads in the western Baltic Sea (Table 3).Activities in the river basin determine nutrient levels in the river, in tran-sitional and coastal water and largely in the sea. Accordingly, water qual-ity objectives in all these systems have to be related. In practice this oftenis not the case and objectives are defined independently for each system,even if they form a connected rivers—coastal waters—sea system(Schernewski et al., 2011). Therefore, the definition of critical allowablewaterborne nutrient loads in the BSAP is a very reasonable approach.These loads automatically determine the nutrient levels in all surfacewaters and the sea. The ecosystem status in all surface waters and the
Fig. 9. The modeled Secchi depth (annual average between June and September) at the Meincreasing diatom densities.
sea resulting from these loads could be used to define the good statusin all these systems. At present the reference winter concentrations forthe Arkona Sea are 2.5–2.0 mmol/m3 DIN (0.30–0.25 mmol/m3 DIP)according to the German classification. For a good surface water statusthe winter concentrations should not exceed 3.8–3.0 mmol/m3 DIN(0.45–0.38 mmol/m3 DIP) (Brockmann et al., 2005). These target valuesare defined independently from the BSAP. Should not the concentrations,which result from a successful implementation of the BSAP, define thetarget concentrations and define a good status, e.g. in the Arkona Sea?
Fig. 3b and c show DIN and DIP winter concentrations resultingfrom a combination of Climate Change and a successful implementa-tion of the BSAP averaged over the entire German Baltic Sea. For theyear 2100 the model suggests concentrations of about 4 mmol/m3
DIN and 0.3 mmol/m3 DIP. Compared to the existing target values forthe Arkona Sea, our model based values are high for N and low for P.The differences between our simulated and the existing values are a re-sult of the system-shift from an N to a P-limitation because of the strongP-load reduction according to the BSAP. A large system like the Baltic Sea,with an average water exchange time of 25–30 years, does not show afast reaction to nutrient load reductions and does therefore not reach anew stable state within a few years. Themodel suggests that the full im-plementation of the BSAP will cause imbalances in the Baltic Sea over
cklenburger Bay increases up to 2 m in the BSAP scenario before it decreases with the
185R. Friedland et al. / Journal of Marine Systems 105–108 (2012) 175–186
decades before a new system state can be reached (e.g. Fig. 3). Duringthis long intermediate period our suggested target concentrations for Nand P are not applicable. However, this will very likely be true for theexisting target values, as well.
5. Summary
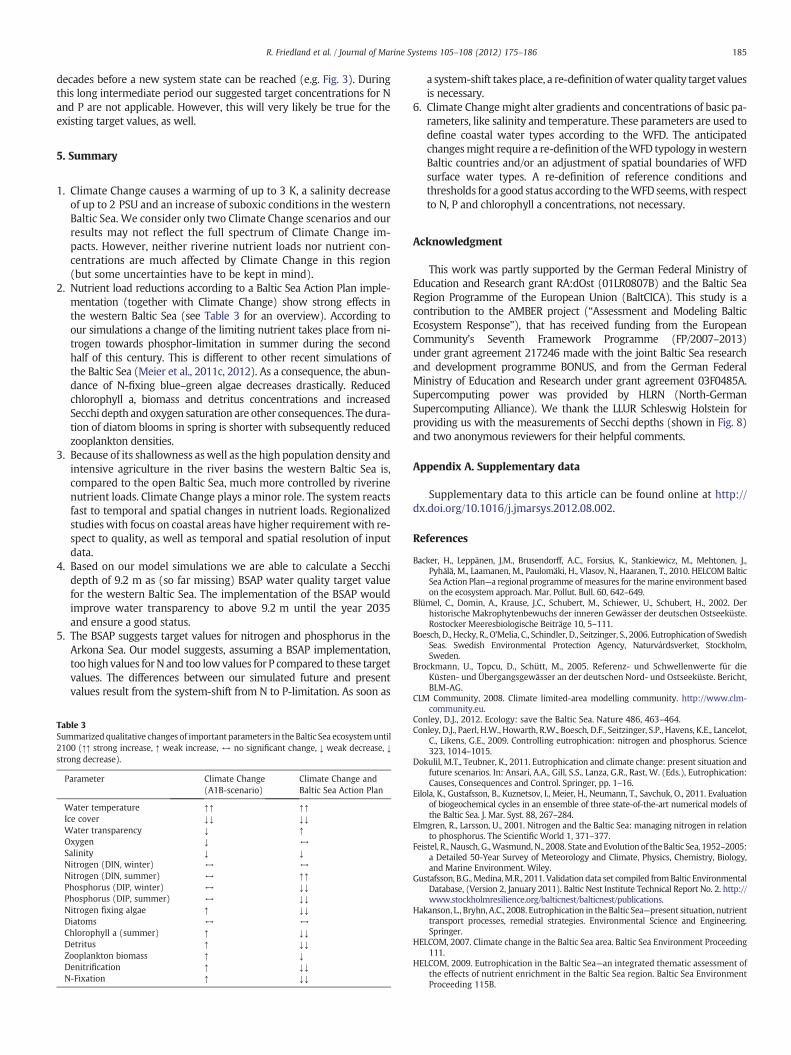
1. Climate Change causes a warming of up to 3 K, a salinity decreaseof up to 2 PSU and an increase of suboxic conditions in the westernBaltic Sea. We consider only two Climate Change scenarios and ourresults may not reflect the full spectrum of Climate Change im-pacts. However, neither riverine nutrient loads nor nutrient con-centrations are much affected by Climate Change in this region(but some uncertainties have to be kept in mind).
2. Nutrient load reductions according to a Baltic Sea Action Plan imple-mentation (together with Climate Change) show strong effects inthe western Baltic Sea (see Table 3 for an overview). According toour simulations a change of the limiting nutrient takes place from ni-trogen towards phosphor-limitation in summer during the secondhalf of this century. This is different to other recent simulations ofthe Baltic Sea (Meier et al., 2011c, 2012). As a consequence, the abun-dance of N-fixing blue–green algae decreases drastically. Reducedchlorophyll a, biomass and detritus concentrations and increasedSecchi depth and oxygen saturation are other consequences. The dura-tion of diatom blooms in spring is shorter with subsequently reducedzooplankton densities.
3. Because of its shallowness aswell as the high population density andintensive agriculture in the river basins the western Baltic Sea is,compared to the open Baltic Sea, much more controlled by riverinenutrient loads. Climate Change plays a minor role. The system reactsfast to temporal and spatial changes in nutrient loads. Regionalizedstudies with focus on coastal areas have higher requirement with re-spect to quality, as well as temporal and spatial resolution of inputdata.
4. Based on our model simulations we are able to calculate a Secchidepth of 9.2 m as (so far missing) BSAP water quality target valuefor the western Baltic Sea. The implementation of the BSAP wouldimprove water transparency to above 9.2 m until the year 2035and ensure a good status.
5. The BSAP suggests target values for nitrogen and phosphorus in theArkona Sea. Our model suggests, assuming a BSAP implementation,too high values for N and too lowvalues for P compared to these targetvalues. The differences between our simulated future and presentvalues result from the system-shift from N to P-limitation. As soon as
Table 3Summarizedqualitative changes of important parameters in the Baltic Sea ecosystemuntil2100 (↑↑ strong increase, ↑ weak increase, ↔ no significant change, ↓ weak decrease, ↓strong decrease).
Parameter Climate Change(A1B-scenario)
Climate Change andBaltic Sea Action Plan
Water temperature ↑↑ ↑↑Ice cover ↓↓ ↓↓Water transparency ↓ ↑Oxygen ↓ ↔Salinity ↓ ↓Nitrogen (DIN, winter) ↔ ↔Nitrogen (DIN, summer) ↔ ↑↑Phosphorus (DIP, winter) ↔ ↓↓Phosphorus (DIP, summer) ↔ ↓↓Nitrogen fixing algae ↑ ↓↓Diatoms ↔ ↔Chlorophyll a (summer) ↑ ↓↓Detritus ↑ ↓↓Zooplankton biomass ↑ ↓Denitrification ↑ ↓↓N-Fixation ↑ ↓↓
a system-shift takes place, a re-definition ofwater quality target valuesis necessary.
6. Climate Change might alter gradients and concentrations of basic pa-rameters, like salinity and temperature. These parameters are used todefine coastal water types according to the WFD. The anticipatedchangesmight require a re-definition of theWFD typology inwesternBaltic countries and/or an adjustment of spatial boundaries of WFDsurface water types. A re-definition of reference conditions andthresholds for a good status according to theWFD seems,with respectto N, P and chlorophyll a concentrations, not necessary.
Acknowledgment
This work was partly supported by the German Federal Ministry ofEducation and Research grant RA:dOst (01LR0807B) and the Baltic SeaRegion Programme of the European Union (BaltCICA). This study is acontribution to the AMBER project (“Assessment and Modeling BalticEcosystem Response”), that has received funding from the EuropeanCommunity's Seventh Framework Programme (FP/2007–2013)under grant agreement 217246 made with the joint Baltic Sea researchand development programme BONUS, and from the German FederalMinistry of Education and Research under grant agreement 03F0485A.Supercomputing power was provided by HLRN (North-GermanSupercomputing Alliance). We thank the LLUR Schleswig Holstein forproviding us with the measurements of Secchi depths (shown in Fig. 8)and two anonymous reviewers for their helpful comments.
Appendix A. Supplementary data
Supplementary data to this article can be found online at http://dx.doi.org/10.1016/j.jmarsys.2012.08.002.
References
Backer, H., Leppänen, J.M., Brusendorff, A.C., Forsius, K., Stankiewicz, M., Mehtonen, J.,Pyhälä, M., Laamanen, M., Paulomäki, H., Vlasov, N., Haaranen, T., 2010. HELCOM BalticSea Action Plan—a regional programme ofmeasures for themarine environment basedon the ecosystem approach. Mar. Pollut. Bull. 60, 642–649.
Blümel, C., Domin, A., Krause, J.C., Schubert, M., Schiewer, U., Schubert, H., 2002. Derhistorische Makrophytenbewuchs der inneren Gewässer der deutschen Ostseeküste.Rostocker Meeresbiologische Beiträge 10, 5–111.
Boesch, D., Hecky, R., O'Melia, C., Schindler, D., Seitzinger, S., 2006. Eutrophication of SwedishSeas. Swedish Environmental Protection Agency, Naturvårdsverket, Stockholm,Sweden.
Brockmann, U., Topcu, D., Schütt, M., 2005. Referenz- und Schwellenwerte für dieKüsten- und Übergangsgewässer an der deutschen Nord- und Ostseeküste. Bericht,BLM-AG.
CLM Community, 2008. Climate limited-area modelling community. http://www.clm-community.eu.
Conley, D.J., 2012. Ecology: save the Baltic Sea. Nature 486, 463–464.Conley, D.J., Paerl, H.W., Howarth, R.W., Boesch, D.F., Seitzinger, S.P., Havens, K.E., Lancelot,
C., Likens, G.E., 2009. Controlling eutrophication: nitrogen and phosphorus. Science323, 1014–1015.
Dokulil, M.T., Teubner, K., 2011. Eutrophication and climate change: present situation andfuture scenarios. In: Ansari, A.A., Gill, S.S., Lanza, G.R., Rast, W. (Eds.), Eutrophication:Causes, Consequences and Control. Springer, pp. 1–16.
Eilola, K., Gustafsson, B., Kuznetsov, I., Meier, H., Neumann, T., Savchuk, O., 2011. Evaluationof biogeochemical cycles in an ensemble of three state-of-the-art numerical models ofthe Baltic Sea. J. Mar. Syst. 88, 267–284.
Elmgren, R., Larsson, U., 2001. Nitrogen and the Baltic Sea: managing nitrogen in relationto phosphorus. The Scientific World 1, 371–377.
Feistel, R., Nausch,G.,Wasmund, N., 2008. State andEvolution of theBaltic Sea, 1952–2005:a Detailed 50-Year Survey of Meteorology and Climate, Physics, Chemistry, Biology,and Marine Environment. Wiley.
Gustafsson, B.G.,Medina,M.R., 2011. Validation data set compiled fromBaltic EnvironmentalDatabase, (Version 2, January 2011). Baltic Nest Institute Technical Report No. 2. http://www.stockholmresilience.org/balticnest/balticnest/publications.
Hakanson, L., Bryhn, A.C., 2008. Eutrophication in theBaltic Sea—present situation, nutrienttransport processes, remedial strategies. Environmental Science and Engineering.Springer.
HELCOM, 2007. Climate change in the Baltic Sea area. Baltic Sea Environment Proceeding111.
HELCOM, 2009. Eutrophication in the Baltic Sea—an integrated thematic assessment ofthe effects of nutrient enrichment in the Baltic Sea region. Baltic Sea EnvironmentProceeding 115B.
186 R. Friedland et al. / Journal of Marine Systems 105–108 (2012) 175–186
HELCOM Ministerial Meeting, 2007. Baltic Sea Action Plan. http://www.helcom.fi/stc/files/BSAP/BSAP-Final.pdf.
Jaeger, E.B., Anders, I., Lüthi, D., Rockel, B., Schär, C., Seneviratne, S.I., 2008. Analysis ofERA40-driven CLM simulations for Europe. Meteorol. Z. 17 (4), 349–367.
Krämer, I., Hürdler, J., Hirschfeld, J., Venohr, M., Schernewski, G., 2011. Nutrient fluxes fromland to sea: consequences of future scenarios on the Oder river basin—lagoon—coastalsea system. Int. Rev. Hydrobiol. 96, 520–540.
Kuznetsov, I., Neumann, T., Burchard, H., 2008. Model study on the ecosystem impact ofa variable C:N:P ratio for cyanobacteria in the Baltic Proper. Ecol. Model. 219,107–114.
Maar, M., Moller, E.F., Larsen, J., Madsen, K.S., Wan, Z., She, J., Jonasson, L., Neumann, T.,2011. Ecosystemmodelling across a salinity gradient from the North Sea to the BalticSea. Ecol. Model. 222, 1696–1711.
Maritime, F., Agency, H., 2012. http://www.bsh.de/en/Marine_data/Observations/IceVisited on April 18th 2012.
Max-Planck-Institute for Meteorology, 2008. Echam5 http://www.mpimet.mpg.de/en/wissenschaft/modelle/echam.html.
Meier, H.E.M., Andersson, H., Dieterich, C., Eilola, K., Höglund, A., Hordoir, R., Schimanke, S.,2011a. Transient scenario simulations for theBaltic Sea Regionduring the21st century.Rapport Oceanografi 108 81 pp.
Meier, H.E.M., Andersson, H., Eilola, K., Gustafsson, B.G., Kuznetsov, I., Müller-Karulis, B.,Neumann, T., Savchuk, O.P., 2011b. Hypoxia in future climates: a model ensemblestudy for the Baltic Sea. Geophys. Res. Lett. 38, L24608.
Meier, H.E.M., Eilola, K., Almroth, E., 2011c. Climate-related changes inmarine ecosystemssimulatedwith a 3-dimensional coupled physical–biogeochemicalmodel of the BalticSea. Climate Research 48, 31–55.
Meier, H.E.M., Hordoir, R., Andersson, H., Dieterich, C., Eilola, K., Gustafsson, B., Höglund, A.,Schimanke, S., 2012.Modeling the combined impact of changing climate and changingnutrient loads on the Baltic Sea environment in an ensemble of transient simulationsfor 1961–2099. Clim. Dyn. 1–21 (published online 25 April 2012).
Neumann, T., 2010. Climate-change effects on the Baltic Sea ecosystem: a model study.J. Mar. Syst. 81 (3), 213–224.
Neumann, T., Friedland, R., 2011. Climate change impacts on theBaltic Sea. In: Schernewski,G., Hofstede, J., Neumann, T. (Eds.), Global Change and Baltic Coastal Zones. Springer,pp. 23–32.
Neumann, T., Fennel, W., Kremp, C., 2002. Experimental simulations with an ecosystemmodel of the Baltic Sea: a nutrient load reduction experiment. Global Biogeochem.Cycles 16 (3), 1033–1054.
Neumann, T., Eilola, K., Gustafsson, B., Müller-Kaurlis, B., Kuznetsov, I., Meier, H.E.M.,Savchuk, O.P., 2012. Extremes of temperature, oxygen and blooms in the BalticSea in a changing climate. Ambio (Accepted).
Pacanowski, R.C., Griffies, S.M., 2000. MOM 3.0 manual. NOAA/Geophysical Fluid Dy-namics Laboratory.
Philippart, C., Anadón, R., Danovaro, R., Dippner, J., Drinkwater, K., Hawkins, S., Oguz, T.,O'Sullivan, G., Reid, P., 2011. Impacts of climate change on Europeanmarine ecosystems:observations, expectations and indicators. J. Exp. Mar. Biol. Ecol. 400, 52–69.
Savchuk, O.P., Wulff, F., 1999. Modelling regional and large-scale response of Baltic Seaecosystems to nutrient load reductions. Hydrobiologia 393, 35–43.
Savchuk, O.P., Wulff, F., 2007. Modeling the Baltic Sea eutrophication in a decision supportsystem. Ambio 36 (2–3), 141–148. http://dx.doi.org/10.1579/0044-7447.
Savchuk, O.P., Wulff, F., 2009. Long-termmodeling of large-scale nutrient cycles in the en-tire Baltic Sea. In: Andersen, J.H., Conley, D.J., Dumont, H.J. (Eds.), Eutrophication inCoastal Ecosystems. Developments in Hydrobiology, 207. Springer, pp. 209–224.
Savchuk, O.P., Wulff, F., Hille, S., Humborg, C., Pollehne, F., 2008. The Baltic Sea a centuryago—a reconstruction from model simulations, verified by observations. J. Mar. Syst.74, 485–494.
Schernewski, G., Behrendt, H., Neumann, T., 2008. An integrated river basin-coast-seamodelling scenario for nitrogen management in coastal waters. J. Coast. Conserv.12, 53–66.
Schernewski, G., Stybel, N.,Neumann,T., 2011.Managing Eutrophication: Cost-effectivenessof Zebra Mussel Farming in the Oder (Szczecin) Lagoon . Accepted.
Siegel, H., Gerth, M., 2008. Optical remote sensing applications in the Baltic Sea. In: Barale,V., Gade, M. (Eds.), Remote Sensing of the European Seas. Springer, pp. 91–102.
Siegel, H., Seifert, T., Schernewski, G., Gerth, M., Ohde, T., Reißmann, J., Podsetchine, V.,2005. Discharge and transport processes along the German Baltic Sea coast. OceanDynamics 55, 47–66.
Smith, V.H., Schindler, D.W., 2009. Eutrophication science: where do we go from here?Trends Ecol. Evol. 24, 201–207.
Stal, L.J., Staal, M., Villbrandt, M., 1999. Nutrient control of cyanobacterial blooms in theBaltic Sea. Aquat. Microb. Ecol. 18, 165–173.
Voss, M., Dippner, J.W., Humborg, C., Hürdler, J., Korth, F., Neumann, T., Schernewski, G.,Venohr, M., 2011. History and scenarios of future development of Baltic Sea eutrophi-cation. Estuarine Coastal Shelf Sci. 92, 307–322.
Wasmund, N., Busch, S., Gromisz, S., Hajdu, S., Höglander, H., Jaanus, A., Johansen, M.,Jurgensone, I., Karlsson, C., Kownacka, J., Krasniewski, W., Olenina, I., 2011.Cyanobacteria biomass indicator. HELCOM Indicator Fact Sheets 2011. http://www.helcom.fi/BSAP_assessment/ifs/ifs2011/en_GB/CyanobacteriaBiomass/ Visited on April24th 2012.
Weiss, R.F., 1970. The solubility of nitrogen, oxygen and argon in water and seawater.Deep Sea Oceanogr. Abstr. 17 (4), 721–735.