Embed Size (px)
Citation preview
1
Climate Change Informationfor Effective Adaptation A Practitioner‘s Manual
Published byDeutsche Gesellschaft für Technische Zusammenarbeit (GTZ) GmbHClimate Protection Programme Postfach 518065760 Eschborn / [email protected]://www.gtz.de/climate
ResponsibleDr. Juergen Kropp, Michael Scholze
Product planning and production controlMichael Wahl, Regine Hoffard
Language servicesAlister Penny, Thomas McClymont
DesignAdditiv. Visuelle Kommunikation, Berlin
Printed byKlarmannDruck GmbH, Kelkheim
Eschborn, Mai 2009
Climate Change Information for Effective AdaptationA Practitioner‘s Manual
Authors
Dr. Juergen Kropp, Potsdam Institute for Climate Impact Research, Head of the North-South Research Group
Michael Scholze, Deutsche Gesellschaft für Technische Zusammenarbeit (GTZ) GmbH, Climate Protection Programme
Content
Abbreviations 2
Foreword 3
Introduction 4
1 Definitions 8
What are adaptation and mitigation? 8
Weather and climate 12
2 Generating climate change information,
and the role of uncertainty 14
The earth’s climate system 14
The scientific approach to generating future climate
information 16
.......A) Emission scenarios 18
.......B) Global climate models 20
.......C) Regional climate models 22
.......D) Impact, vulnerability, and adaptation assessment 24
.......E) Knowledge of historical events 26
.......F) Local (non-expert) climate knowledge 28
Uncertainty and risk assessment 28
Part I Background
1 Accessing climate change information 32
Rapid literature assessment 34
Using online data analysis tools 36
Comprehensive assessment using climate change expertise 40
2 Interpreting climate change information and
dealing with uncertainty 40
General rules 40
Uncertainty and data interpretation 41
Uncertainty and identification of adaptation measures 42
3 Communicating climate change information 44
Part II Practical Steps
Annex 1: Storylines for the emission scenarios 46
Annex 2: List of links to online information sources, with comments 48
Annex 3: Selected climate change impacts 51
Annex 4: Potential institutions and national information sources 54
Annex 5: A selection of well-known RCM 55
References 57
2
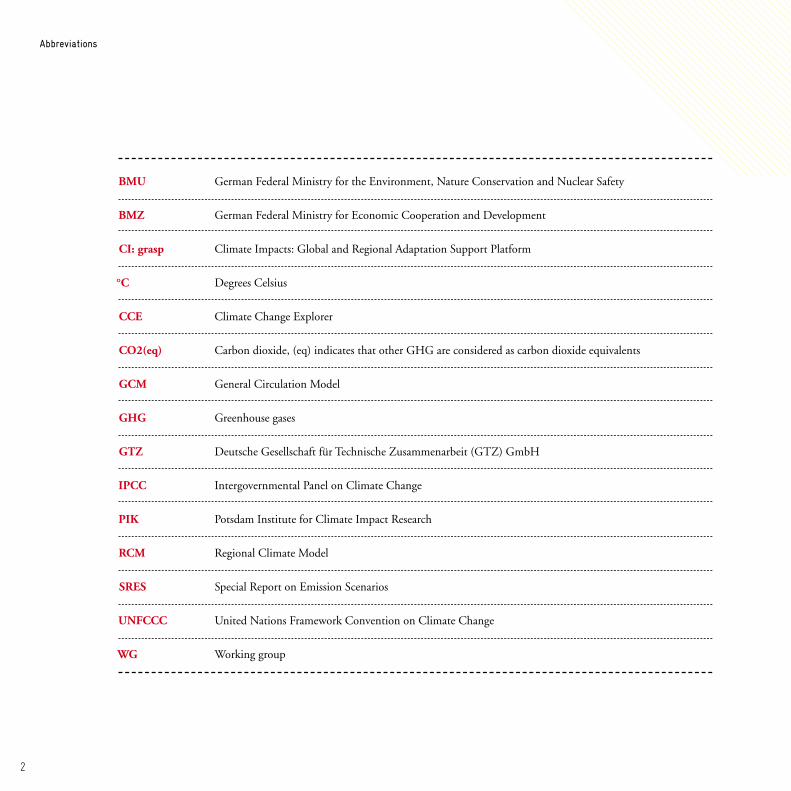
Abbreviations
BMU German Federal Ministry for the Environment, Nature Conservation and Nuclear Safety
BMZ German Federal Ministry for Economic Cooperation and Development
CI: grasp Climate Impacts: Global and Regional Adaptation Support Platform
°C Degrees Celsius
CCE Climate Change Explorer
CO2(eq) Carbon dioxide, (eq) indicates that other GHG are considered as carbon dioxide equivalents
GCM General Circulation Model
GHG Greenhouse gases
GTZ Deutsche Gesellschaft für Technische Zusammenarbeit (GTZ) GmbH
IPCC Intergovernmental Panel on Climate Change
PIK Potsdam Institute for Climate Impact Research
RCM Regional Climate Model
SRES Special Report on Emission Scenarios
UNFCCC United Nations Framework Convention on Climate Change
WG Working group
Foreword
comers in the field of climate change with a conven-iently accessible “big picture” of the problematique and it can help development experts to explore the relevant solutions space. This holds true for the mitigation chal-lenge as well as for the tasks associated with the adapta-tion to unavoidable environmental change as caused by past careless interference with nature.
Since development experts work at a very important in-terface, they are multipliers of knowledge and therefore can prepare the ground for an accelerated transition to sustainability. The main objective of the manual pre-sented here is to enhance the capacity of those practi-tioners and decision makers in developing countries by translating relevant aspects of climate change research into their every-day working contexts. This guide de-scribes the concrete steps of (i) how to obtain climate change information, (ii) how to interpret it adequately, and (iii) how to communicate the resulting knowledge in a careful and responsible way. I feel that this is pre-cisely what decision makers, project managers and civil servants need and what was largely lacking up till now. In that sense, the guide can be seen as a first bridge be-tween science and practice in a complex and difficult landscape.
Professor H.J. Schellnhuber, CBEDirector, Potsdam Institute for Climate Impact Research
Finding and implementing adequate responses to cli-mate change poses a tremendous challenge to indus-trialized countries. Yet the challenges faced by decision makers in developing countries are even larger: While OECD countries can afford, in principle, to instigate the transition to sustainability - if they have the politi-cal will to do so -, developing countries’ keep on per-ceiving fast economic growth as the primary goal, not least for stabilizing the political mood of their growing populations. Why should issues like climate protection or biodiversity support be on their agenda? On the other hand, developing countries are usually more vul-nerable to environmental change due to their regional exposition to the forces of nature, weak institutions, and the poverty of a considerable fraction of their resi-dents. Thus they face a dilemma: How can they grow in economic terms without contributing to the annihila-tion of the ultimate foundations of that growth? How can they benefit from capitalism if the (natural) capital stock tends to be destroyed in the process?
These are tantalizing questions that need to be addressed nevertheless. Science plays an increasingly important role in this context. In particular, it can provide new-
Foreword
3
4
Climate Change Information - A Practitioner’s Manual
1 GHG other than CO2 are converted to CO2 equivalents (CO2(eq)).
There is no doubt that our climate is changing. This will pose huge challenges to nations, organisations, enter-prises, cities, communities and individuals. Developing countries will suffer most from the adverse consequenc-es of climate change, and some highly vulnerable re-gions and people are already being affected.
There is increasing agreement that if temperatures rise by no more than 2 °C the earth’s integrity can be pre-served and many of the potentially grave consequences of climate change could be avoided. This threshold is associated with per capita emissions of approximately two tonnes of CO
2 equivalents1 each year. In terms of
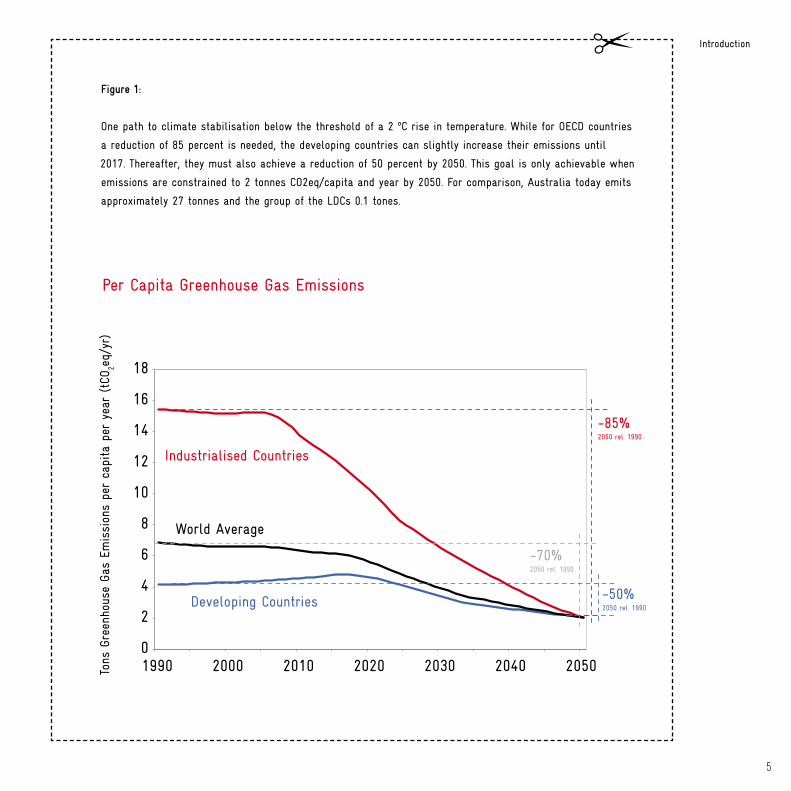
reducing greenhouse gases (GHG), the immense chal-lenge this poses is shown in Figure 1. Industrialised countries, and soon also developing countries, need to sharply reduce their emissions.
Introduction
Objectives
5
Introduction
Figure 1:
One path to climate stabilisation below the threshold of a 2 ºC rise in temperature. While for OECD countries
a reduction of 85 percent is needed, the developing countries can slightly increase their emissions until
2017. Thereafter, they must also achieve a reduction of 50 percent by 2050. This goal is only achievable when
emissions are constrained to 2 tonnes CO2eq/capita and year by 2050. For comparison, Australia today emits
approximately 27 tonnes and the group of the LDCs 0.1 tones.
Per Capita Greenhouse Gas Emissions
18
16
14
12
10
8
6
4
2
01990 2000 2010 2020 2030 2040 2050
Industrialised Countries
World Average
Developing Countries
-85%2050 rel. 1990
-50%2050 rel. 1990
-70%2050 rel. 1990
Tons
Gre
enho
use
Gas
Emis
sion
s pe
r ca
pita
per
yea
r (tCO
2eq/
yr)
6
Climate Change Information - A Practitioner’s Manual
If GHG emissions continue to rise, the worst case sce-nario of an increase of the global mean temperature of up to 6 °C is a real possibility. This would have disas-trous consequences, yet even at the ambitious stabilisa-tion target of +2 °C there would still be several regional negative impacts. Therefore, while it is imperative to aim for ambitious reductions in GHG emissions, there is also an urgent need to adapt to the unavoidable con-sequences of climate change.
In order to make the necessary adaptation to the con-sequences of climate change, decision makers must be well informed. At the international level, knowl-edge of the consequences of humankind’s behaviour on our climatic system – presented, for example, in the latest IPCC assessment reports – is well-founded and adequate for policy makers. However, more spe-cific information is needed for the implementation of concrete measures at the local level. It has been shown that the lack of such information is one of the sever-est bottlenecks to concrete action, in particular with regard to adaptation, but also for the implementation of integrated activities that would promote both miti-gation and adaptation. This manual therefore focuses on ways to gather and interpret the relevant informa-tion for decision making. It is written for develop-ment practitioners from both governmental and non- governmental organisations.
Related to the issues listed above, important questions often asked by practitioners include:
What trends in climate change can be identified in a specific region?
Who is affected by it, and in what ways?
What sources of information exist as a basis for decision making?
How reliable is this information?
What options are there for adaptation and mitigation?
How should we communicate relevant information to others?
This manual is intended to serve as a guide; its aim is to extend the capacity of practitioners to find answers for themselves in any specific situation, using the best in-formation available. As will be explained in more detail, a degree of uncertainty will always be involved due to
7
Introduction
2 For more information on climate proofing, please see: http://www.gtz.de/climate-check
the fact that in many cases no definite or comprehen-sive information about the impacts of climate change, or our vulnerability to it, can ever exist.
To be able to interpret climate change information we must first understand some of the approaches used in climate science. Therefore, Part I provides a brief over-view of climate (impact) research, and gives a few essen-tial definitions. It also describes basic climate modelling, as well as impact, vulnerability and adaptation analysis. It is therefore rather theoretical, and those already fa-miliar with the science of climate change might choose to skip it. By contrast, Part II is more practical. Advice is given about how to gather a solid information base on regional climate change. It contains useful hints for those planning either stand-alone or integrated pro-grammes, as well for anyone intending to mainstream climate change in their development activities, for example by “climate proofing” their investment deci-sions2.
Adapting to and mitigating climate change calls for cooperation between the scientific and develop-ment communities. This manual was therefore jointly written by the North-South Research Group of the Potsdam Institute for Climate Impact Research (PIK) and the Climate Protection Programme for Developing Countries of the Deutsche Gesellschaft für Technische
Zusammenarbeit (GTZ) GmbH. It is intended as a “translation” of relevant aspects of climate change sci-ence to meet the needs of development cooperation.
8
Part I Background to climate change research
Definitions
What are adaptation and mitigation?
There are many different definitions of adaptation to climate change, which shows that there is no com-mon understanding of the term (for an overview, see e.g. Schipper 2007). The latest IPCC assessment report, for instance, gives the following definition: “Adjustment in natural or human systems in response to actual or expected climatic stimuli or their effects, which moder-ates harm or exploits beneficial opportunities.” (IPCC 2007b, WG II, p. 869). In comparison the definition of mitigation is simple. It is just the reduction of GHG.
We can observe growing diversification of tasks in the work being undertaken by professional communities on adaptation and mitigation. However, interrelationships and synergies also exist between the two. Local mitiga-tion strategies, such as the installation of solar panels, can also have a tremendous effect on adaptation. For instance, instead of collecting wood for fuel, people have more time for education—a key precondition for adaptation—and for livelihood improvement.
1
Climate Change Information - A Practitioner’s Manual
9
Part I
Back-ground
Definitions
1
Global tempe-rature increase (°C)
Business as usual
1980
6
5
3
2
1
4
2000 2020 2040 2060 2080 2100
Adapta-tion with mitigation efforts
Adaptation without any mitigation
Stabilization at +2°C
Two strategies are necessary to reduce the risks of climate change:
1. Mitigation – the causes of climate change are removed by reducing GHG emissions. “avoid the unmanageable…”
2. Adaptation – the effects of climate change are dealt with by coping with their nega-tive impacts. “… and manage the unavoidable”
The two strategies are interlinked: the more successful the first strategy is, the less the second one is required. The diagram below shows how a risk management approach to climate change should involve both strat-egies. This manual only addresses issues of adaptation.
Figure 1:
Adaptation
and
mitigation:
two parallel
strategies
to combat
climate
change.
10
Climate Change Information - A Practitioner’s Manual
According to the IPCC, adaptation has a reactive com-ponent, i.e. learning from examples, and a proactive component, i.e. being prepared for coming events. The latter calls for anticipatory problem solving strategies, and is particularly important for the advisory services of experts in development cooperation.
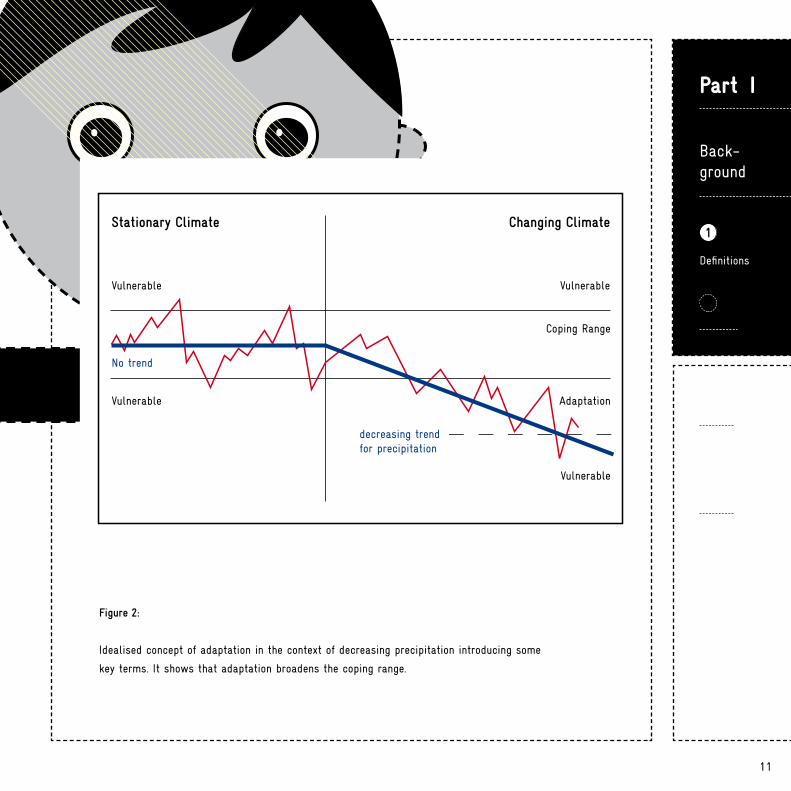
Some theoretical terms used in the discussion about ad-aptation are illustrated by the example in Figure 2. The zigzag curve shows a potential development of precipi-tation in an African country. Such variables are often referred to as “climate stimuli”. Historically, subsistence farmers have developed strategies to cope with varying levels of precipitation, which has resulted in a coping range.
However, weather events were sometimes too extreme to cope with (too much or too little rain), and the farm-ers lost their crops. In other words, they were vulnerable to these extremes, even before the climate changed (sta-tionary climate). With the changing climate, the trend in the curve is downwards (decreasing precipitation) and conditions exceed the coping range more often.
This is the point at which adaptation becomes relevant. Using climate change information in a proactive man-ner and applying measures such as improved watershed management or growing drought resistant crops, the
coping range of the subsistence farmers can be expand-ed. Nevertheless, there will be limits to the adaptation and, in the future, some areas might no longer be suit-able for agricultural production.
11
Part I
Back-ground
Definitions
1
11
Figure 2:
Idealised concept of adaptation in the context of decreasing precipitation introducing some
key terms. It shows that adaptation broadens the coping range.
Stationary Climate Changing Climate
Coping Range
Vulnerable
Vulnerable
Vulnerable
Vulnerable Adaptation
No trend
decreasing trend for precipitation
12
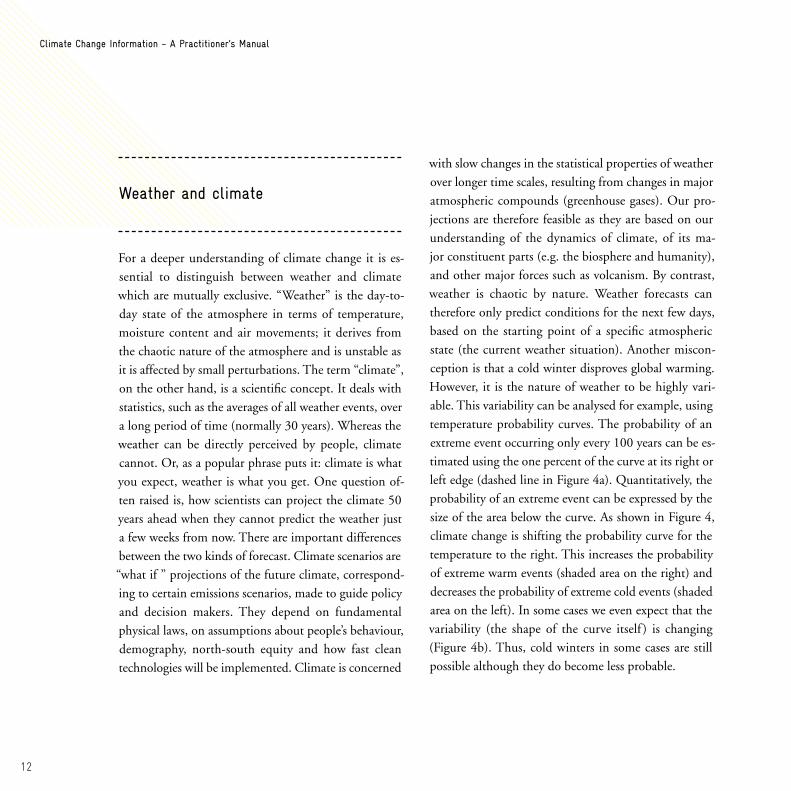
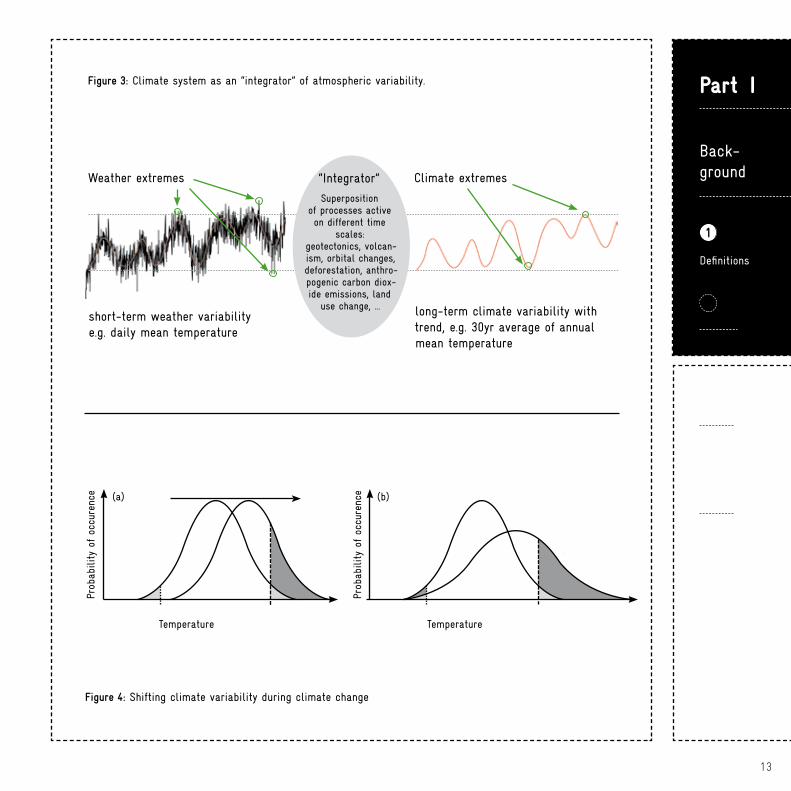
For a deeper understanding of climate change it is es-sential to distinguish between weather and climate which are mutually exclusive. “Weather” is the day-to-day state of the atmosphere in terms of temperature, moisture content and air movements; it derives from the chaotic nature of the atmosphere and is unstable as it is affected by small perturbations. The term “climate”, on the other hand, is a scientific concept. It deals with statistics, such as the averages of all weather events, over a long period of time (normally 30 years). Whereas the weather can be directly perceived by people, climate cannot. Or, as a popular phrase puts it: climate is what you expect, weather is what you get. One question of-ten raised is, how scientists can project the climate 50 years ahead when they cannot predict the weather just a few weeks from now. There are important differences between the two kinds of forecast. Climate scenarios are “what if ” projections of the future climate, correspond-ing to certain emissions scenarios, made to guide policy and decision makers. They depend on fundamental physical laws, on assumptions about people’s behaviour, demography, north-south equity and how fast clean technologies will be implemented. Climate is concerned
with slow changes in the statistical properties of weather over longer time scales, resulting from changes in major atmospheric compounds (greenhouse gases). Our pro-jections are therefore feasible as they are based on our understanding of the dynamics of climate, of its ma-jor constituent parts (e.g. the biosphere and humanity), and other major forces such as volcanism. By contrast, weather is chaotic by nature. Weather forecasts can therefore only predict conditions for the next few days, based on the starting point of a specific atmospheric state (the current weather situation). Another miscon-ception is that a cold winter disproves global warming. However, it is the nature of weather to be highly vari-able. This variability can be analysed for example, using temperature probability curves. The probability of an extreme event occurring only every 100 years can be es-timated using the one percent of the curve at its right or left edge (dashed line in Figure 4a). Quantitatively, the probability of an extreme event can be expressed by the size of the area below the curve. As shown in Figure 4, climate change is shifting the probability curve for the temperature to the right. This increases the probability of extreme warm events (shaded area on the right) and decreases the probability of extreme cold events (shaded area on the left). In some cases we even expect that the variability (the shape of the curve itself ) is changing (Figure 4b). Thus, cold winters in some cases are still possible although they do become less probable.
Weather and climate
Climate Change Information - A Practitioner’s Manual
13
Part I
Back-ground
Definitions
1
Figure 3: Climate system as an “integrator” of atmospheric variability.
Figure 4: Shifting climate variability during climate change
Weather extremes
short-term weather variabilitye.g. daily mean temperature
long-term climate variability with trend, e.g. 30yr average of annual mean temperature
Climate extremes“Integrator”
Superposition of processes active on different time
scales:geotectonics, volcan-ism, orbital changes, deforestation, anthro-pogenic carbon diox-ide emissions, land
use change, ...
Temperature Temperature
Prob
abili
ty o
f oc
cure
nce
Prob
abili
ty o
f oc
cure
nce(a) (b)
14
Climate Change Information - A Practitioner’s Manual
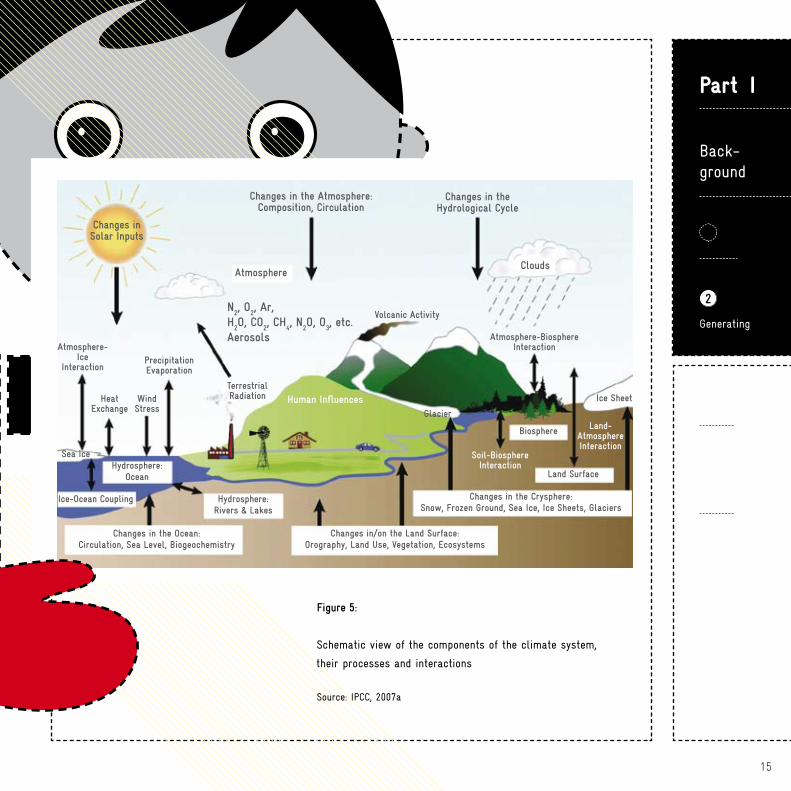
The physics underlying the climate system is well known and widely understood. The earth’s climate is determined by many factors, processes and interactions at a global scale (see Figure 5). Important elements include the biosphere, the ocean, sea ice, clouds, and the ways in which these interact. One important phe-nomenon in the earth’s atmosphere is the well known greenhouse effect. This natural effect is responsible for the comfortable living conditions on earth, with a mean global temperature of 15 ºC. Without an atmosphere, the mean temperature would be approximately 30 ºC lower.
Today, human beings have also become a component in the earth’s system, driving and accelerating global warm-ing through the intensive release of GHG into the at-mosphere. The warming itself leads to feedback mecha-nisms, such as the release of further GHG like methane, which was previously trapped in permafrost soils.
Generating climate change in-
formation, and the role of uncertainty
The earth’s climate system
2
Other forcing factors also exist that are beyond human-kind’s influence. Examples of these include variations in solar radiation and volcanic activity, and fluctuations in the earth’s axis and its orbit around the sun. These are exogeneous events, partly responsible for the changes which have occurred between ice ages and the inter-glacial periods. They take place over a larger time frame (tens of thousands of years or more), and must be clear-ly differentiated from climate change that is induced by human beings. The latter can be prevented by taking adequate action.
15
Part I
Back-ground
2
Generating
Figure 5:
Schematic view of the components of the climate system,
their processes and interactions
Source: IPCC, 2007a
Changes inSolar Inputs
Atmosphere
Atmosphere-Ice
InteractionPrecipitationEvaporation
TerrestrialRadiation
N2, O
2, Ar,
H2O, CO
2, CH
4, N
2O, O
3, etc.
Aerosols
Changes in the Atmosphere:Composition, Circulation
Changes in theHydrological Cycle
Volcanic Activity
Clouds
Atmosphere-BiosphereInteraction
Ice Sheet
Glacier
Biosphere Land-AtmosphereInteraction
Soil-BiosphereInteraction
Land Surface
Changes in the Crysphere:Snow, Frozen Ground, Sea Ice, Ice Sheets, Glaciers
Changes in/on the Land Surface:Orography, Land Use, Vegetation, Ecosystems
Hydrosphere:Ocean
Hydrosphere:Rivers & Lakes
Changes in the Ocean:Circulation, Sea Level, Biogeochemistry
Wind Stress
HeatExchange
Sea Ice
Ice-Ocean Coupling
Human Influences
16
Climate Change Information - A Practitioner’s Manual
The scientific approach to generating
future climate information
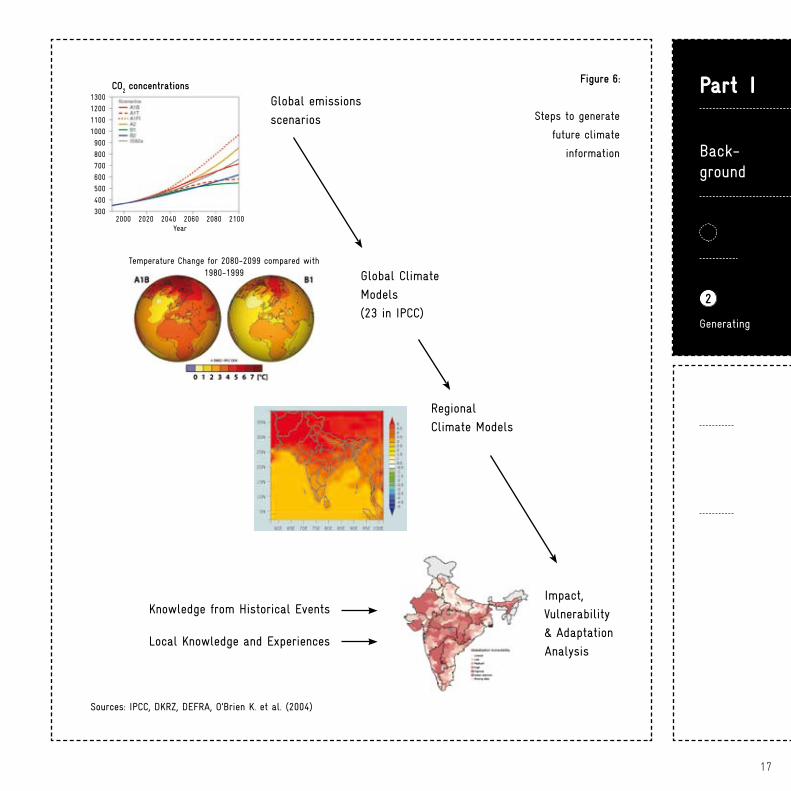
The scientific method for gathering relevant climate change information can be divided into the following steps: Global emission scenarios (SRES scenarios3), based on so-called narrative storylines for human-kind’s development over the next 100 years, describe how GHG emissions might develop in the future. The associated emission pathways are used as the basis for simulations using general circulation models (GCMs)4, which calculate the interrelationship of the elements of the earth system and thereby project future climate trends. Regional climate models (RCMs) are based on the results of the GCM, and project the climate in more precise geographical detail. The results of the GCM and the RCM are (regional) climate change scenarios (not emission scenarios!) which describe, for example, how temperature, precipitation or other climatic parameters are expected to change in an area under investigation. The effects of such climate scenarios on societies and ecosystems are investigated further in climate impact studies. These use vulnerability assessments and the analysis of adaptation strategies to provide stakehold-ers with relevant knowledge. Historical knowledge, i.e.
experiences from historic events, can be of great value for this, for instance by helping to understand extreme events and for the identification of measures to adapt to their increasingly frequent occurrence in the future. Besides this top-down, scientific approach, empirical lo-cal knowledge of climate variability and adaptation to it is also available. Such grassroots information is an im-portant complement to the entire scientific top-down approach. An overview of this process is given in Figure 6, and all the steps are described in more detail below.
3 SRES: Special Report on Emission Scenarios4 often also known as global climate models
17
Part I
Back-ground
2
Generating
Figure 6:
Steps to generate
future climate
information
Global emissions
scenarios
Global Climate
Models
(23 in IPCC)
Regional
Climate Models
Impact,
Vulnerability
& Adaptation
AnalysisLocal Knowledge and Experiences
1300
1200
1100
1000
900
800
700
600
500
400
300
CO2 concentrations
2000 2020 2040 2060 2080 2100Year
Temperature Change for 2080-2099 compared with 1980-1999
Sources: IPCC, DKRZ, DEFRA, O’Brien K. et al. (2004)
Knowledge from Historical Events
18
Climate Change Information - A Practitioner’s Manual
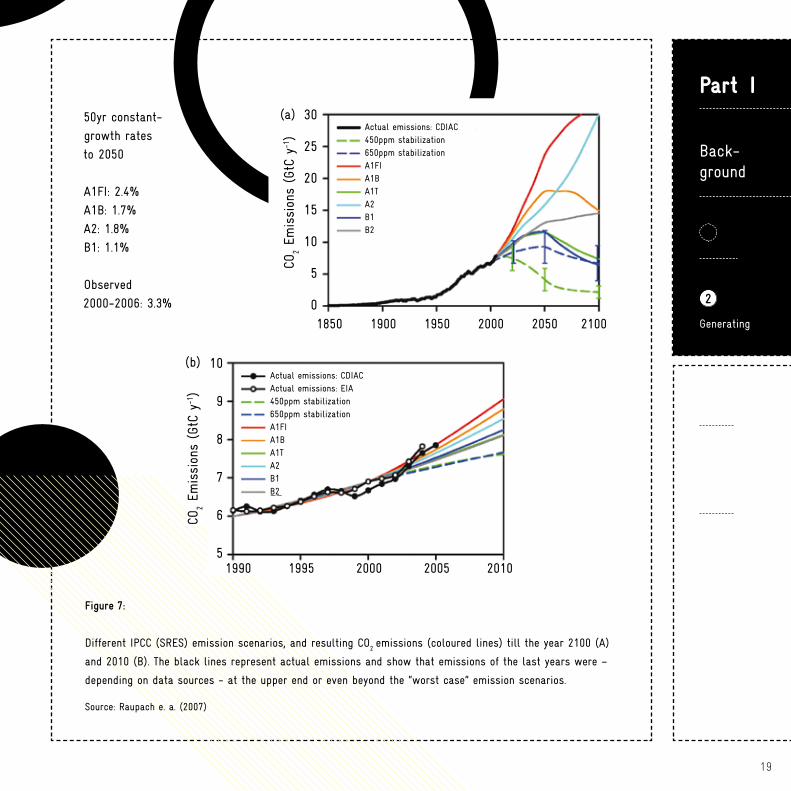
A ) E M I S S I O N S C E N A R I O S
Between 1970 and 2004, GHG emissions increased from 28.7 to 49 gigatonnes of CO
2eq per year – a rise
of 70 percent. Will this rapid increase continue in the coming decades? Future anthropogenic emissions will be determined by driving forces such as demographic and socioeconomic development, and technologi-cal change. A global population of 15 billion people; a mainly fossil fuel-based economy; an adjustment of income levels to match those in developed countries by 2050: all these things would boost GHG emissions. By contrast, a transformation to a low-carbon economy with seven billion people and moderate increases in in-come would stabilise GHG emissions. Both scenarios are plausible. The emission path humankind takes will depend on decisions made today and in the future. No one can predict what these decisions will be.
In other words, these emission scenarios present alter-native visions of how the future might unfold. They are grouped into four “families”, each of which contains scenarios that resemble one another in some respects.
Each climate model run is based on these emission scenarios, and therefore rests on specific assumptions about future emissions. The projected CO
2 emis-
sions for each of these scenarios are shown in Figure 7. A more detailed description of the assumptions behind these emission scenarios can be found in Annex 1.
19
Part I
Back-ground
2
Generating
Figure 7:
Different IPCC (SRES) emission scenarios, and resulting CO2 emissions (coloured lines) till the year 2100 (A)
and 2010 (B). The black lines represent actual emissions and show that emissions of the last years were –
depending on data sources - at the upper end or even beyond the “worst case” emission scenarios.
1990 1995 2000 2005 2010
10
9
8
7
6
5
CO2 Em
issi
ons
(GtC
y-1)
Actual emissions: CDIACActual emissions: EIA450ppm stabilization650ppm stabilizationA1FIA1BA1TA2B1B2
(b)
Actual emissions: CDIAC450ppm stabilization650ppm stabilizationA1FIA1BA1TA2B1B2
1850 1900 1950 2000 2050 2100
30
25
20
15
10
5
0CO
2 Em
issi
ons
(GtC
y-1)
(a)
Source: Raupach e. a. (2007)
50yr constant-
growth rates
to 2050
A1FI: 2.4%
A1B: 1.7%
A2: 1.8%
B1: 1.1%
Observed
2000-2006: 3.3%
20
Climate Change Information - A Practitioner’s Manual
B ) G L O B A L C L I M A T E M O D E L S
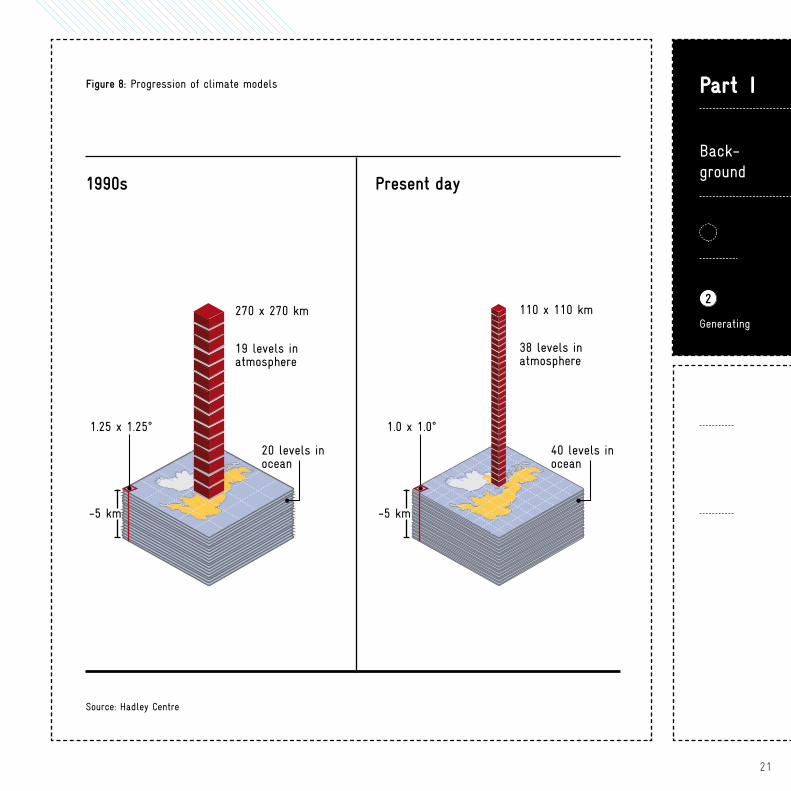
Atmosphere ocean general circulation models—general circulation models (GCM) for short or often also called global climate models—are computer models that di-vide the earth into horizontal and vertical grid cells. Each of the cells represents a specific climatic state for a specific time, based on a set of equations. Large com-puters are needed to calculate the mathematical equa-tions for each cell, describing major components of the climate system and their interactions over time. The length of the edges of the grid cells range in size from approximately 100km to 200km, and are divided verti-cally into several levels covering both the ocean and the atmosphere (see Figure 8). Higher resolution is limited not by a lack of scientific knowledge but by the lack of adequate computing power. As new supercomputers be-come ever more powerful (they have increased by a fac-tor of a million over the three decades since the 1970s), the resolution of the GCM is expected to increase fur-ther in the future. Today’s GCM already count as the most complex and comprehensive computer models ever developed 5.
23 different models were taken into consideration for the latest IPCC assessment reports. These vary ac-cording to the accentuation of the physical processes represented, and in terms of the grid resolutions. The
results of all the models are generally consistent, which enormously increased their apparent trustworthiness, as shown in the latest IPCC (2007) report.
5 For more information on these computer models and their results see a video produced by Japanese scientists: http://www.team-6.jp/cc-sim/english/
21
Part I
Back-ground
2
Generating
Figure 8: Progression of climate models
Present day1990s
38 levels inatmosphere
110 x 110 km
1.0 x 1.0°
-5 km
40 levels inocean
270 x 270 km
19 levels inatmosphere
1.25 x 1.25°
-5 km
20 levels inocean
Source: Hadley Centre
22
Climate Change Information - A Practitioner’s Manual
6 For a detailed description of the methods see PRECIS Handbook, p. 14: http://precis.metoffice.com/docs/PRECIS_Handbook.pdf
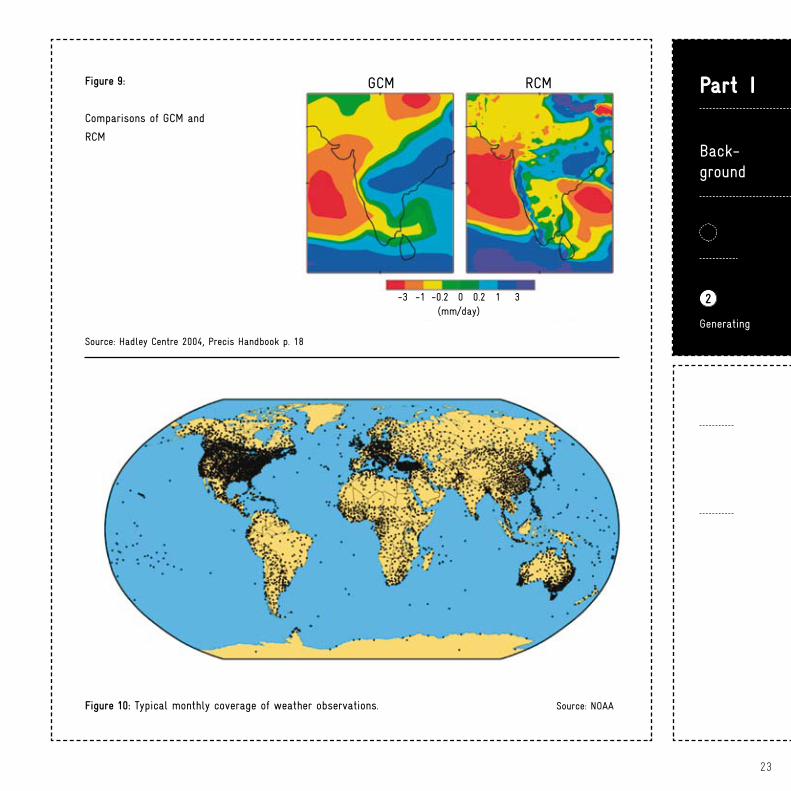
C ) R E G I O N A L C L I M A T E M O D E L S
The global models often produce results that are in-adequate for use in local assessments. Local climates are influenced significantly by smaller-scale features and processes, such as mountains, forests or lakes, the heat-island effect of large cities, etc. These features are not represented in detail in global climate models due to the low resolution. For instance, in a GCM, large mountain ranges like the Alps or the Andes are covered by just a few grid cells. More localised differences be-tween regions at higher and lower altitudes, or specific climatic conditions in valleys cannot be represented. For this reason, regional climate models (RCM) have been developed. Their resolution ranges from 10 to 50 km (see Figure 9) or refers to the station distribution in an observed area. There are two main types of regional climate model: statistical and dynamic6. The former analyse empirical data from weather stations and ex-trapolate the results into the future by using climatic trends taken from the GCMs. They have the advantage of being partly based on empirical local climatic knowl-edge. Here it is a disadvantage that, in developing coun-
tries, empirical climate data are often not available for long periods without gaps, due to a lack of observation-al coverage (see Figure 10). Therefore dynamic mod-els are usually applied (e.g. PRECIS, CCLM, REMO), which work in a similar way to the GCM. They are nested into coarser GCM, which means that they use GCM outputs for calculating a potential climate evolu-tion for the region under consideration. The simulation time needed for the regional models can be longer than that for the GCM because of the additional processes being represented in more detail. A list of well-known RCMs can be found in Annex 5.
23
Part I
Back-ground
2
Generating
Figure 10: Typical monthly coverage of weather observations. Source: NOAA
Figure 9:
Comparisons of GCM and
RCM
Source: Hadley Centre 2004, Precis Handbook p. 18
GCM RCM
-3 -1 -0.2 0 0.2 1 3(mm/day)
24
Climate Change Information - A Practitioner’s Manual
7 http://unfccc.int/adaptation/nairobi_workprogramme/compendium_on_methods_tools/items/2674.php
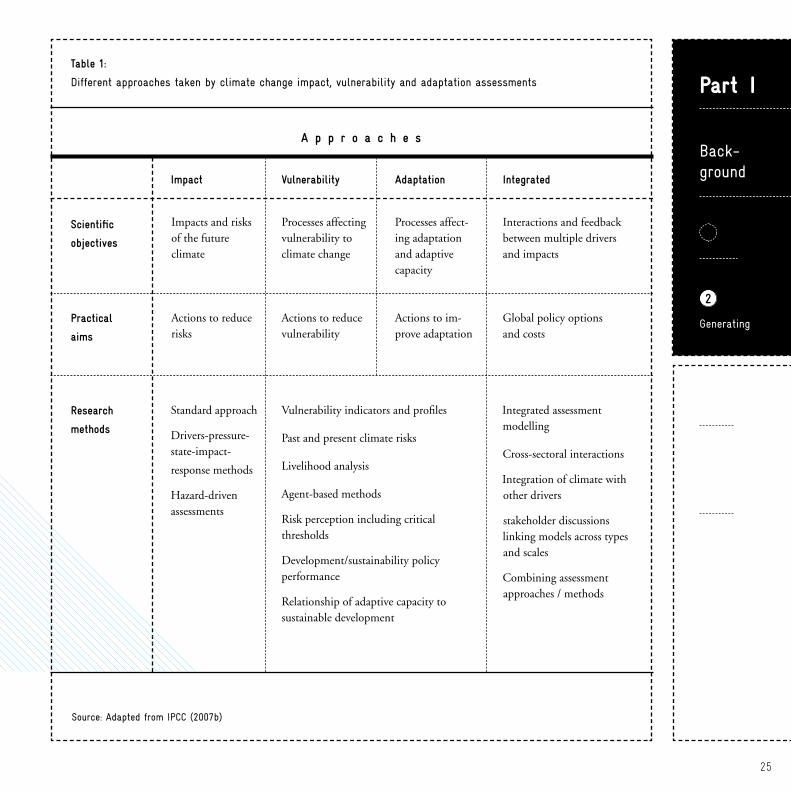
D ) I M P A C T , V U L N E R A B I L I T Y , A N D
A D A P T A T I O N A S S E S S M E N T
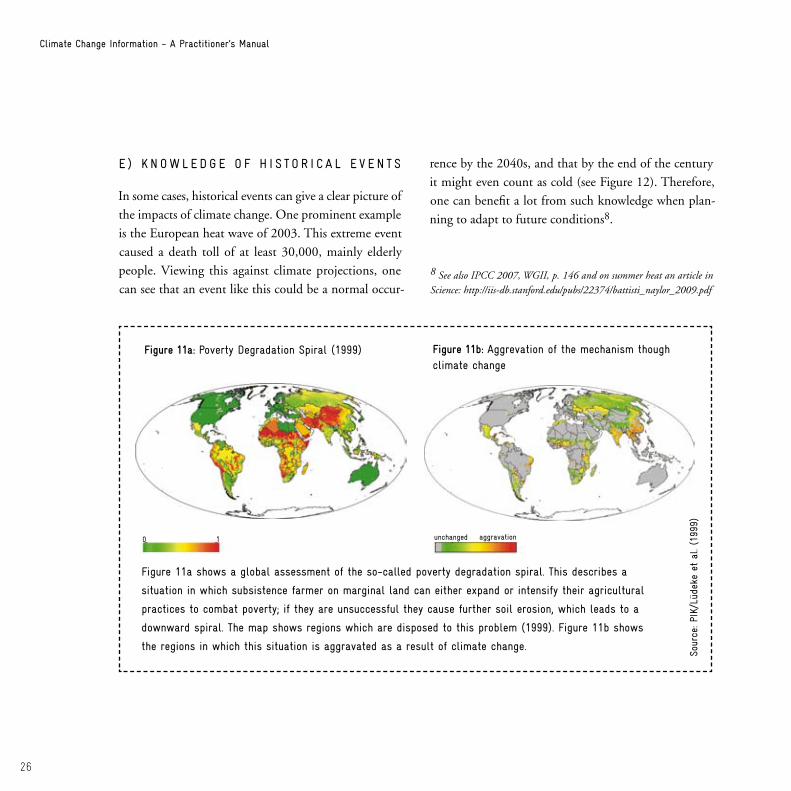
What does it mean if the temperature rises by 2 or 3 ºC, if the precipitation decreases by 30 percent, or if the sea level rises 50 centimetres? For decision makers to receive relevant information, data derived from GCM and RCM must be placed in the context of physical, so-cioeconomic and ecological processes, and the potential consequences of a changing climate must be deduced. A variety of different methodologies is available for this, the success and quality of which should be judged in terms of their comparability, transferability and trans-parency. An overview of the main approaches (impact, vulnerability, adaptation and integrated assessments) is given in Table 1. It is difficult to make clear distinc-tions between them. Vulnerability assessments play an important role in identifying potential sectoral or re-gional hot spots for the impacts of climate change. A non-comprehensive list of these scientific methodolo-gies (which in most cases require technical knowledge and expertise) can be found on the Internet7.
As climate change is often not the only driver of change, some more sophisticated impact, vulnerability and ad-aptation assessments also include future socioeconomic, land-use and technology scenarios in an integrated ap-proach. The amount of detail involved varies widely,
ranging from short studies to intense and long-lasting scientific research, including participatory processes with different stakeholders. Thus, the costs of perform-ing assessments can also vary significantly (see also Part II). An example of a global impact analysis is given in Figure 11a and b.
25
Part I
Back-ground
2
Generating
Integrated assessment modelling
Cross-sectoral interactions
Integration of climate with other drivers
stakeholder discussions linking models across types and scales
Combining assessment approaches / methods
Table 1:
Different approaches taken by climate change impact, vulnerability and adaptation assessments
Source: Adapted from IPCC (2007b)
A p p r o a c h e s
Impact Vulnerability Adaptation Integrated
Scientific
objectives
Interactions and feedback between multiple drivers and impacts
Global policy options and costs
Practical
aims
Research
methods
Standard approach Drivers-pressure-state-impact-
response methods
Hazard-driven assessments
Vulnerability indicators and profiles
Past and present climate risks
Livelihood analysis
Agent-based methods
Risk perception including critical thresholds
Development/sustainability policy performance
Relationship of adaptive capacity to sustainable development
Processes affecting vulnerability to climate change
Actions to reduce vulnerability
Processes affect-ing adaptation and adaptive capacity
Actions to im-prove adaptation
Impacts and risks of the future climate
Actions to reduce risks
26
Climate Change Information - A Practitioner’s Manual
Figure 11b: Aggrevation of the mechanism though climate change
E ) K N OW L E D G E O F H I S T O R I C A L E V E N T S
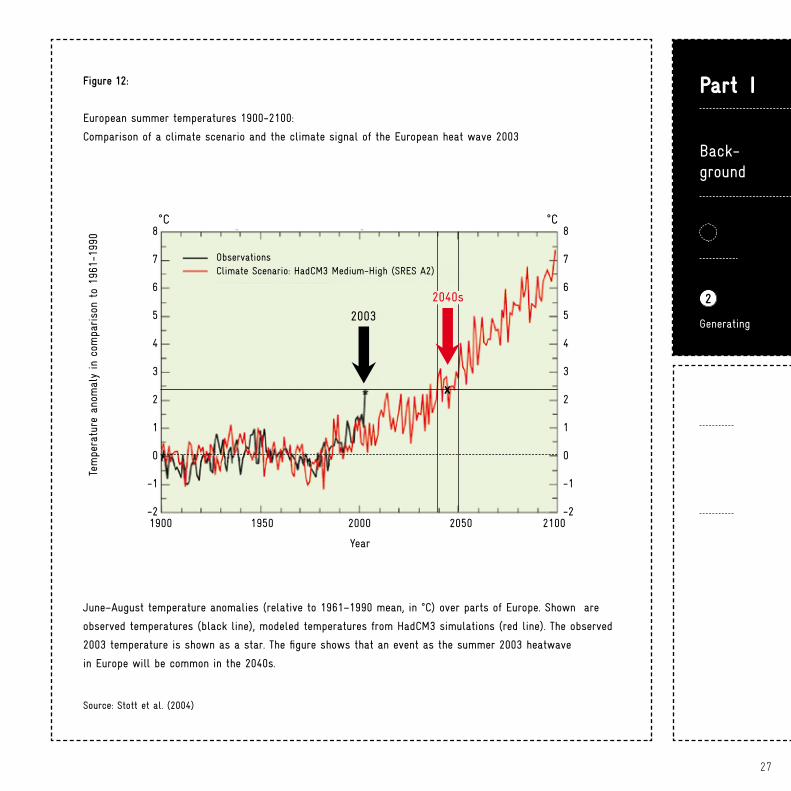
In some cases, historical events can give a clear picture of the impacts of climate change. One prominent example is the European heat wave of 2003. This extreme event caused a death toll of at least 30,000, mainly elderly people. Viewing this against climate projections, one can see that an event like this could be a normal occur-
rence by the 2040s, and that by the end of the century it might even count as cold (see Figure 12). Therefore, one can benefit a lot from such knowledge when plan-ning to adapt to future conditions8.
Figure 11a: Poverty Degradation Spiral (1999)
Sour
ce: P
IK/L
üdek
e et
al.
(199
9)
Figure 11a shows a global assessment of the so-called poverty degradation spiral. This describes a
situation in which subsistence farmer on marginal land can either expand or intensify their agricultural
practices to combat poverty; if they are unsuccessful they cause further soil erosion, which leads to a
downward spiral. The map shows regions which are disposed to this problem (1999). Figure 11b shows
the regions in which this situation is aggravated as a result of climate change.
8 See also IPCC 2007, WGII, p. 146 and on summer heat an article in Science: http://iis-db.stanford.edu/pubs/22374/battisti_naylor_2009.pdf
unchanged aggravation0 1
27
Part I
Back-ground
2
Generating
Figure 12:
European summer temperatures 1900-2100:
Comparison of a climate scenario and the climate signal of the European heat wave 2003
Source: Stott et al. (2004)
June–August temperature anomalies (relative to 1961–1990 mean, in °C) over parts of Europe. Shown are
observed temperatures (black line), modeled temperatures from HadCM3 simulations (red line). The observed
2003 temperature is shown as a star. The figure shows that an event as the summer 2003 heatwave
in Europe will be common in the 2040s.
Tem
pera
ture
ano
mal
y in
com
pariso
n to
196
1-19
90
Year
ObservationsClimate Scenario: HadCM3 Medium-High (SRES A2)
8
7
6
5
4
3
2
1
0
-1
-21900 1950 2000 2050 2100
°C °C8
7
6
5
4
3
2
1
0
-1
-2
2003
x
2040s
28
Climate Change Information - A Practitioner’s Manual
F ) L O C A L ( N O N - E X P E R T )
C L I M A T E K N O W L E D G E
An important source of information that is often ne-glected is the knowledge possessed by local people. Worldwide, over a period of millennia, humankind has responded to catastrophic weather events and changing climatic conditions. Although this knowledge is sparse, and in some cases highly subjective, it can be very in-formative. It has the advantage of being locally and re-gionally specific and comprehensive. It may range from specific weather parameters to local vulnerabilities and adaptation strategies. Furthermore, it can help to assess the plausibility of scientific findings; it supports learn-ing and provides hints for adequate action.
It is better to be vaguely right instead of precisely wrong (Karl Popper)
Science does not give exact or certain forecasts of the future climate, and it will never be able to do so. But it would be wrong to conclude that no action on adapta-tion can therefore be taken. Uncertainty is not the same
as ignorance; it is something that confronts many deci-sion makers—not only in the field of climate change. Companies have to take strategic decisions despite high levels of uncertainty about future markets. Politicians pass new laws without knowing exactly what effects they will have. In our day-to-day life we take many de-cisions without having enough validated information. What would one rather believe, a scientist’s projection of the climate for the next 50 years or an economist’s stock market prognosis for the next five years? To assess uncertainty—to judge its magnitude and find out its origins—is ultimately the responsibility of the decision maker. Climate research simply provides all the relevant information.
Therefore, the challenge that faces adaptation practition-ers is to manage rather than overcome the uncertainty!
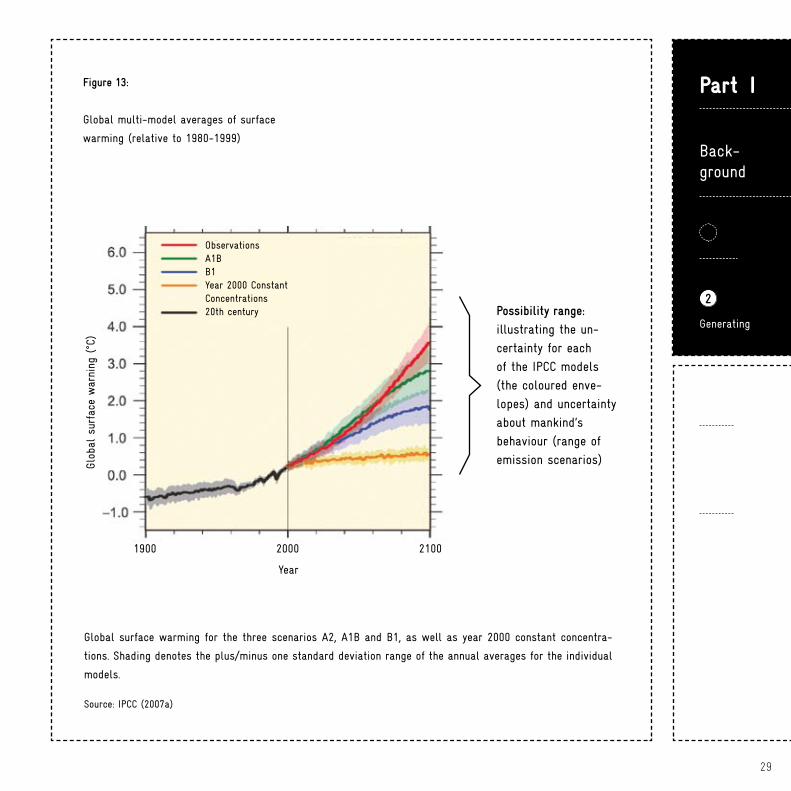
There are several reasons for uncertainty about climate change information. The single largest of these is the fact that we cannot predict the future level of GHG emissions. Many different “emission futures” are possi-ble. Scientists allow for this by using different emission scenarios (as described in Chapter 3.2.1 before). By comparing the climate model outcomes for the differ-ent emission scenarios, the range of possibility for fu-ture climatic developments can be seen. For the global level, this is illustrated in Figure 13.
Uncertainty and risk assessment
29
Part I
Back-ground
2
Generating
Figure 13:
Global multi-model averages of surface
warming (relative to 1980-1999)
Global surface warming for the three scenarios A2, A1B and B1, as well as year 2000 constant concentra-
tions. Shading denotes the plus/minus one standard deviation range of the annual averages for the individual
models.
Source: IPCC (2007a)
Possibility range:
illustrating the un-
certainty for each
of the IPCC models
(the coloured enve-
lopes) and uncertainty
about mankind’s
behaviour (range of
emission scenarios)
6.0
5.0
4.0
3.0
2.0
1.0
0.0
-1.0
Glob
al s
urfa
ce w
arni
ng (°C
)
Year
1900 2000 2100
ObservationsA1BB1Year 2000 ConstantConcentrations20th century
30
Climate Change Information - A Practitioner’s Manual
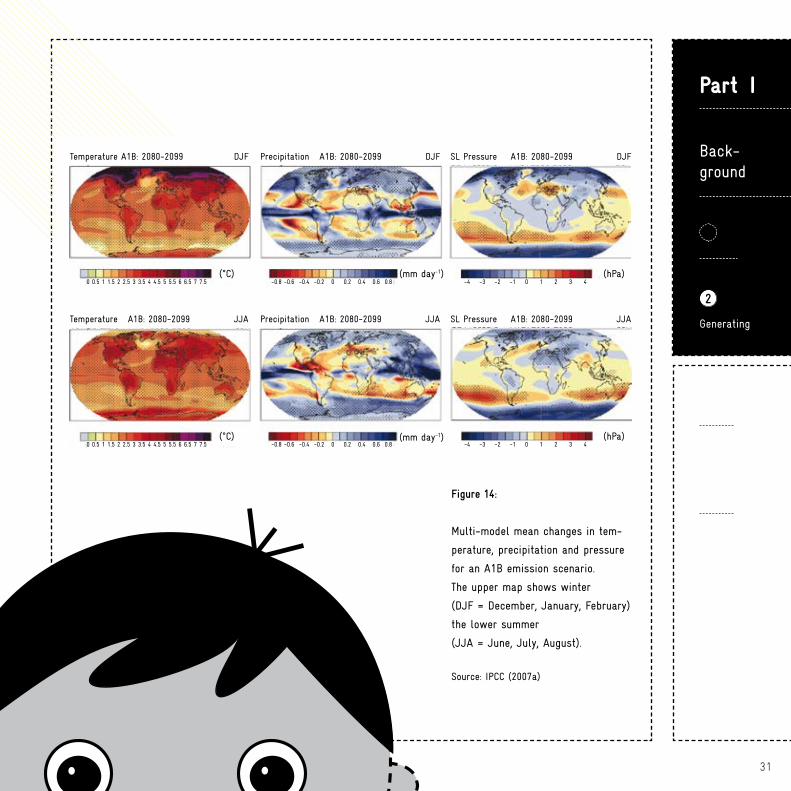
As seen in the shading around the lines, individual cli-mate models also contain uncertainties. Each model is just an approximation of reality, as the complexity of the entire earth system renders full analysis impossible as it would be too time consuming. Nevertheless, cli-mate models are constantly improving. While the early GCM only looked at the atmosphere, the latest ones incorporate all major components such as land surface, oceans, sea ice, aerosols and the carbon cycle. The phys-ics underlying these components is mostly understood, yet some elements of the climate system, such as clouds or monsoons, are still difficult to model. It is important to allow for the fact that uncertainties differ in regard to region and climate stimulus. Comparing the models is one way of dealing with this type of uncertainty, and it is a good basis for risk assessment. This is shown in Figure 14.
The colours in the diagram represent mean changes in temperature, precipitation and air pressure for sum-mer (above) and winter (below). The stippled areas are important as they denote the regions where almost all models produce similar results (average of all models). One can see that:
for some climatic variables (e.g. temperature) the models largely agree on the direction of change and magnitude for most parts of the world (stippled).
for other climatic variables there is less certainty (no stippled area). The coloured area nevertheless gives an indication of the expected direction of change. For the impact, vulnerability and adaptation assess-ments, judging the effects that climate change will have on socioeconomic and ecological systems is a complex task. Other drivers of change, such as overpopulation, migration, resource overuse and economic development often play an important role as well, which provides an-other source of uncertainty. A prominent example of how these complex networks of interrelation can be as-sessed is the so-called syndrome concept (Schellnhuber et al. 1997), which tries to assess patterns of global change on various scales9.
9 See: http://www.wbgu.de/wbgu_syndromkonzept_en.html
31
Part I
Back-ground
2
Generating
Figure 14:
Multi-model mean changes in tem-
perature, precipitation and pressure
for an A1B emission scenario.
The upper map shows winter
(DJF = December, January, February)
the lower summer
(JJA = June, July, August).
Source: IPCC (2007a)
Temperature A1B: 2080-2099 DJF
0 0.5 1 1.5 2 2.5 3 3.5 4 4.5 5 5.5 6 6.5 7 7.5(°C)
Temperature A1B: 2080-2099 JJA
0 0.5 1 1.5 2 2.5 3 3.5 4 4.5 5 5.5 6 6.5 7 7.5(°C)
Precipitation A1B: 2080-2099 JJA
-0.8 -0.6 -0.4 -0.2 0 0.2 0.4 0.6 0.8(mm day-1)
SL Pressure A1B: 2080-2099 DJF
-4 -3 -2 -1 0 1 2 3 4 (hPa)
SL Pressure A1B: 2080-2099 JJA
-4 -3 -2 -1 0 1 2 3 4 (hPa)
Precipitation A1B: 2080-2099 DJF
-0.8 -0.6 -0.4 -0.2 0 0.2 0.4 0.6 0.8(mm day-1)
32
While Part I presented the general background of basic concepts, climate change science and its methods, Part II provides practical information to guide you in the following activities:
Accessing climate change information
Interpreting climate change information and dealing with uncertainty
Communicating climate change information
The sub-chapters are complemented by several annexes to this manual.
There are various ways to collect climate change infor-mation, which are grouped here into three approaches. They should be seen as complementary; they differ mainly in their level of detail, expert involvement and related costs. A short summary of strength and weak-nesses is given for each approach.
Part II Practical Steps
Accessing climate change information
1
Climate Change Information - A Practitioner’s Manual
33
Part II
Practical Steps
1
Accessing
Table 2:
Most important
climate change related stimuli
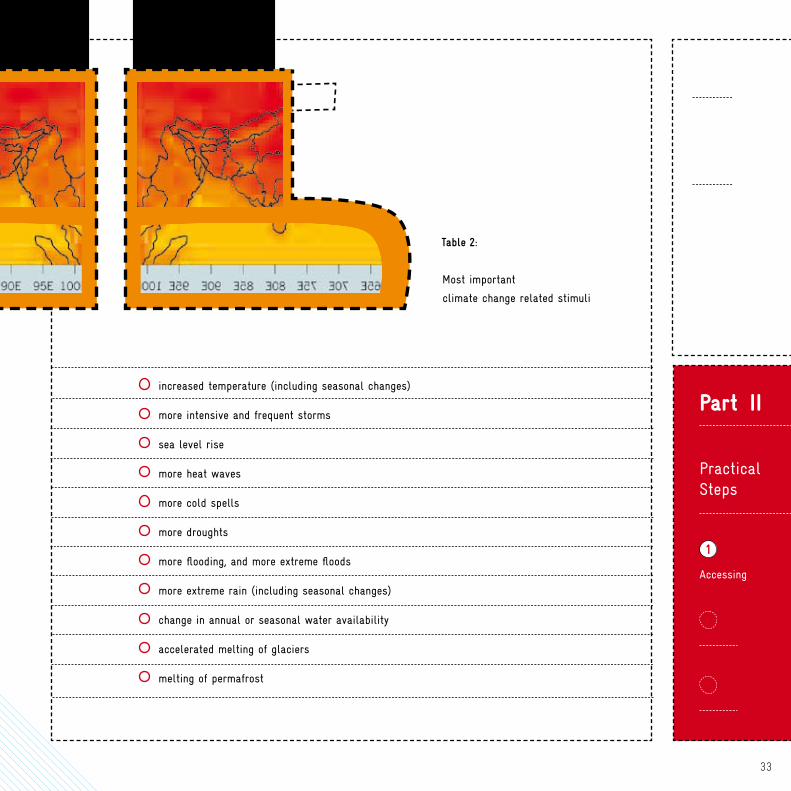
increased temperature (including seasonal changes)
more intensive and frequent storms
sea level rise
more heat waves
more cold spells
more droughts
more flooding, and more extreme floods
more extreme rain (including seasonal changes)
change in annual or seasonal water availability
accelerated melting of glaciers
melting of permafrost
34
Climate Change Information - A Practitioner’s Manual
Rather than generating your own climate change infor-mation, try to find existing material on the internet and obtain it from resource persons or institutes. The main steps involved:
1.Define your geographical, temporal and sectoral areas of interest
As the body of literature on climate change is over-whelming (the latest IPCC report contains four vol-umes with about 3,000 pages) your search should be as focused as possible.
2. Check literature and online databases; filter out what you need
A list of links to online information sources is provided, with comments, in Annex 2, and you can find a list of important climate change stimuli in Table 2. A general overview of climate change impacts, which might be relevant for your region, can be found in Annex 3.
3. Consult experts
Most countries have government officials, scientists and consultants working on climate change issues. Annex contains a list of potential institutions and national in-formation sources you could contact for more informa-tion.
4. Consolidate data in a clear and transparent manner
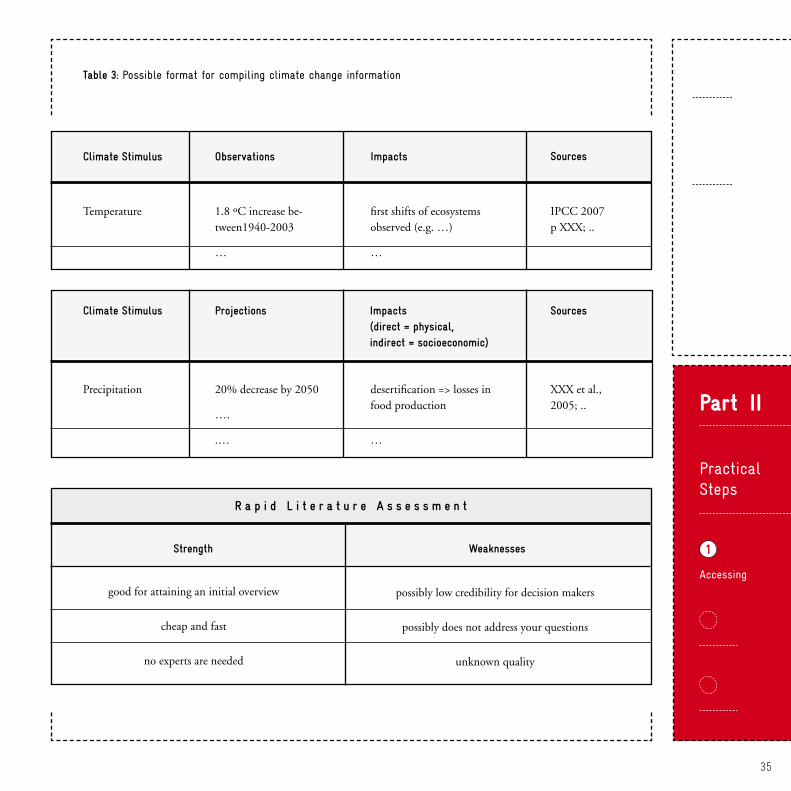
Bring together the information gained in a comprehen-sible and transparent manner, and make it available to others. A possible format for the compilation is given in Table 3.
Rapid literature assessment
35
Part II
Practical Steps
1
Accessing
Table 3: Possible format for compiling climate change information
Climate Stimulus
Temperature
Observations
1.8 ºC increase be-tween1940-2003
…
Impacts
first shifts of ecosystems observed (e.g. …)
…
Sources
IPCC 2007 p XXX; ..
Climate Stimulus Sources Projections Impacts (direct = physical, indirect = socioeconomic)
20% decrease by 2050
….
.…
desertification => losses in food production
…
XXX et al., 2005; ..
Precipitation
R a p i d L i t e r a t u r e A s s e s s m e n t
Strength Weaknesses
good for attaining an initial overview
cheap and fast
no experts are needed
possibly low credibility for decision makers
possibly does not address your questions
unknown quality
36
Climate Change Information - A Practitioner’s Manual
At the time of writing, various online tools are being developed which are intended to help decision makers analyse climate change data.
S E R V I R
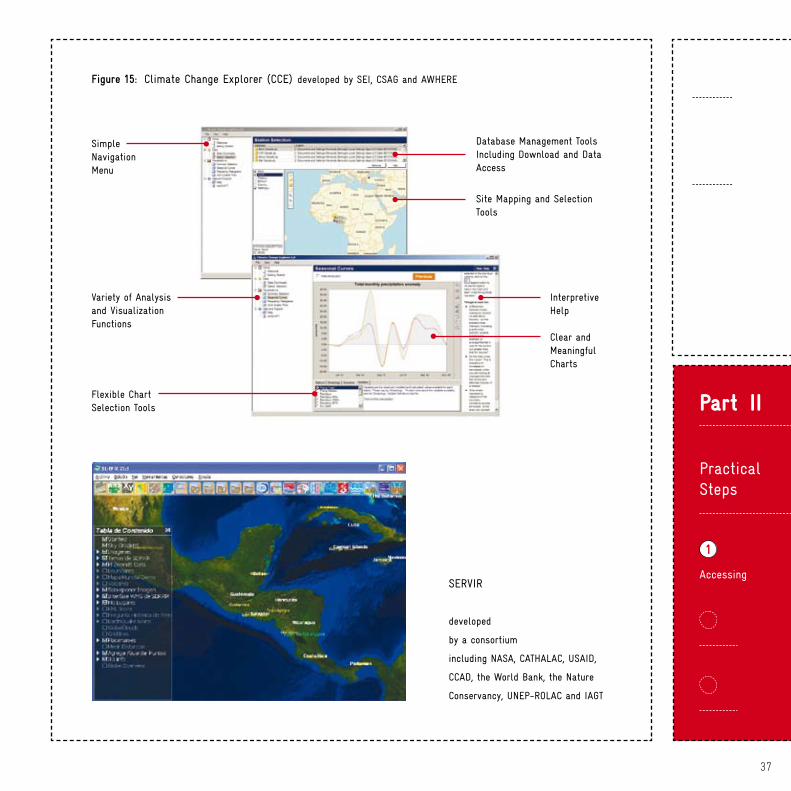
SERVIR is a regional visualisation and monitoring sys-tem for Mesoamerica and Africa that integrates satel-lite and other geospatial data for improved scientific knowledge and decision making by managers, research-ers, students and the general public. SERVIR address-es the nine societal benefit areas of the Global Earth Observation System of Systems (GEOSS): disasters, ec-osystems, biodiversity, weather, water, climate, oceans, health, agriculture and energy. Here, “climate” covers not only current weather conditions but also climate change projections. For more information: http://www.servir.net
C l i m a t e C h a n g e E x p l o r e r
The Climate Change Explorer provides users with an analytical foundation from which to explore the cli-mate variables relevant to their particular adaptation decisions. The approach makes links between under-standing vulnerability, monitoring and projecting cli-mate hazards and planning adaptation processes, and is grounded on several key assumptions regarding the interpretation of climate science. The Climate Change Explorer (CCE) is a desktop client that provides an interface for downloading, managing and visualising scaled down model outputs. You will need to apply for a separate password to download a version of this tool. For more information: http://wikiadapt.org/
Using online data analysis tools
37
Part II
Practical Steps
1
AccessingSERVIR
developed
by a consortium
including NASA, CATHALAC, USAID,
CCAD, the World Bank, the Nature
Conservancy, UNEP-ROLAC and IAGT
Figure 15: Climate Change Explorer (CCE) developed by SEI, CSAG and AWHERE
SimpleNavigationMenu
Variety of Analysis and VisualizationFunctions
Flexible Chart Selection Tools
Database Management Tools Including Download and Data Access
Site Mapping and Selection Tools
InterpretiveHelp
Clear and Meaningful Charts
38
Climate Change Information - A Practitioner’s Manual
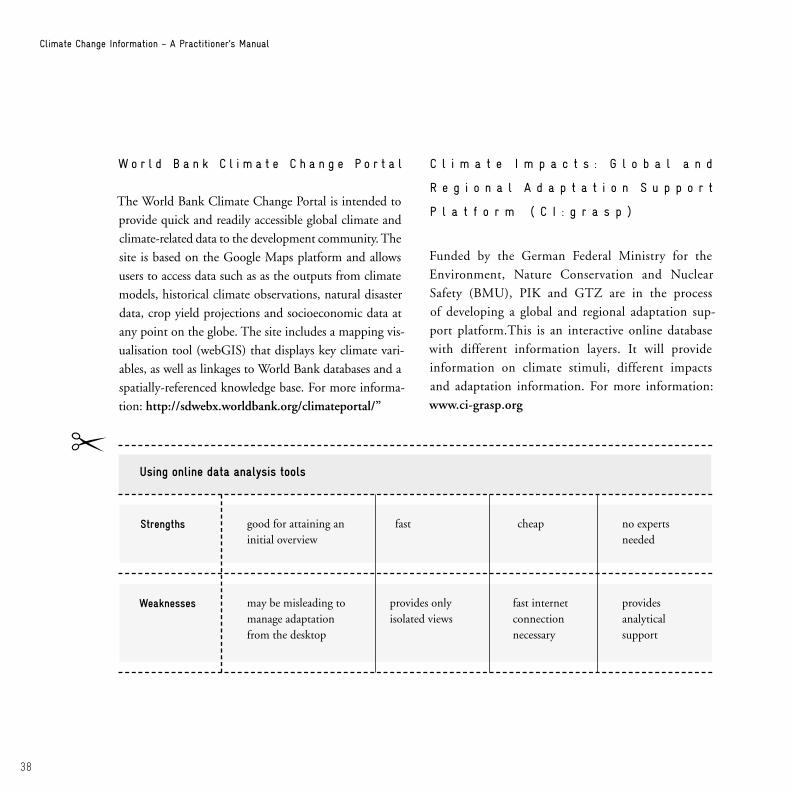
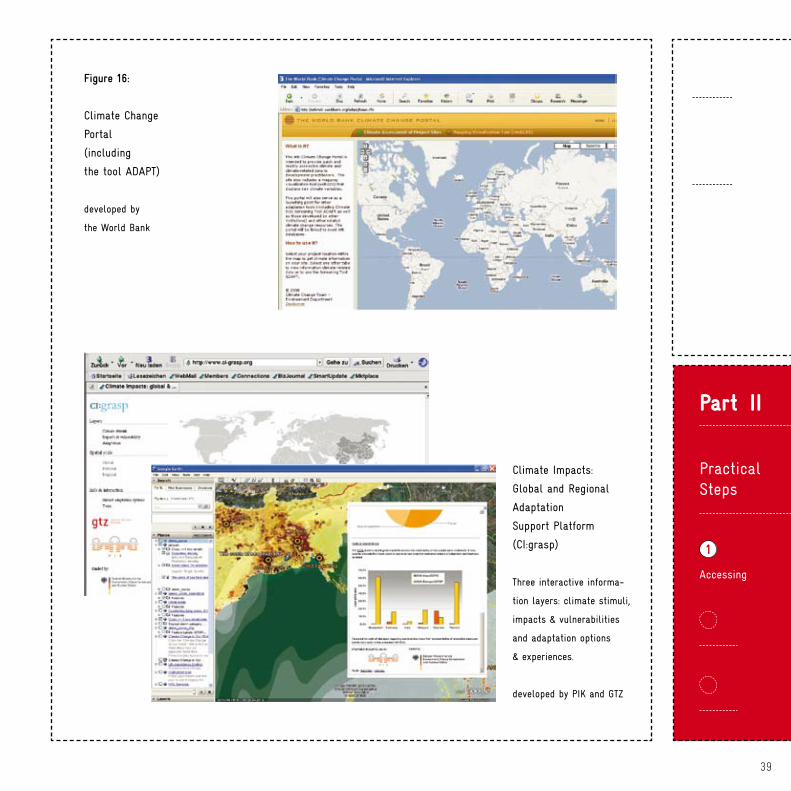
W o r l d B a n k C l i m a t e C h a n g e P o r t a l
The World Bank Climate Change Portal is intended to provide quick and readily accessible global climate and climate-related data to the development community. The site is based on the Google Maps platform and allows users to access data such as as the outputs from climate models, historical climate observations, natural disaster data, crop yield projections and socioeconomic data at any point on the globe. The site includes a mapping vis-ualisation tool (webGIS) that displays key climate vari-ables, as well as linkages to World Bank databases and a spatially-referenced knowledge base. For more informa-tion: http://sdwebx.worldbank.org/climateportal/”
C l i m a t e I m p a c t s : G l o b a l a n d
R e g i o n a l A d a p t a t i o n S u p p o r t
P l a t f o r m ( C I : g r a s p )
Funded by the German Federal Ministry for the Environment, Nature Conservation and Nuclear Safety (BMU), PIK and GTZ are in the process of developing a global and regional adaptation sup-port platform.This is an interactive online database with different information layers. It will provide information on climate stimuli, different impacts and adaptation information. For more information: www.ci-grasp.org
Strengths
Weaknesses
Using online data analysis tools
may be misleading to manage adaptation from the desktop
good for attaining an initial overview
provides only isolated views
fast cheap no experts needed
fast internet connection necessary
provides analytical support
39
Part II
Practical Steps
1
Accessing
Figure 16:
Climate Change
Portal
(including
the tool ADAPT)
developed by
the World Bank
Climate Impacts:
Global and Regional
Adaptation
Support Platform
(CI:grasp)
Three interactive informa-
tion layers: climate stimuli,
impacts & vulnerabilities
and adaptation options
& experiences.
developed by PIK and GTZ
40
Comprehensive assessment using
climate change expertise
General rules
Interpreting climate change information and
dealing with uncertainty
2
10 http://unfccc.int/adaptation/nairobi_workprogramme/compendium_on_methods_tools/items/2674.php
If you cannot find the necessary climate change infor-mation for your needs, you might consider commis-sioning your own tailored research. This might involve asking a scientific institution such as PIK to run an RCM for your region, or applying impact, vulnerabil-ity and adaptation assessments. This kind of research is a rapidly developing field, with a large number of re-search groups applying many different models. Only a preliminary overview of all this work is available so far9; nearly all of it is taking place in the scientific arena and only a few (international) consultancies are engaged in it. To identify such institutions, see Annex 4 and con-tact the climate change experts in your country.
The costs of such assessments can vary a lot. If RCM already exist in your region, scientific institutions nor-mally provide them free of charge. If new model runs are necessary this can take months or even years, and
can cost a five or six digit figure. Thanks to several re-search projects, the number of RCM for developing countries is increasing. You can find a selection of well- known RCM in Annex 5.
Climate change information has to be interpreted for any individual context. Here are some principles or rules of thumb to help you do this.
Use information about historic climate variability and change (especially extreme events), as well as adap-tation experiences as a starting point.
Adaptation is a social and institutional learning process. Bring together different stakeholders (decision
Climate Change Information - A Practitioner’s Manual
41
Part II
Practical Steps
2
Interpreting
makers, scientists, model developers, target groups, sector specialists etc.) to discuss the climate change information you have gathered, and its implica-tions.
Try to gather different regional scenarios.
Support climate change impact research in or-der to increase the knowledge base.
Compile the relevant information you have been able to obtain, and make it available to others.One of the main challenges will be the management of uncertainty. The following suggestions might help:
Uncertainty and data interpretation
Differentiate between uncertainties of models and of the emission scenarios (unknown develop-ment pathway of humankind).
Do not assume that uncertainty means there will be no change. One of the most improbable op-tions is that nothing will change.
There will always be an inherent, irresolvable uncertainty involved in climate change projections. A paradigm shift is needed. Uncertainty must be managed not overcome by decision makers.
The levels of uncertainty differ with regard to geographic area, time and climate variable (e.g. there is normally less uncertainty about tempera-ture than precipitation). Try to define both the ori-gin of climate change information for your region (scenario, models, impact assessments) and the level of uncertainty involved.
42
Climate Change Information - A Practitioner’s Manual
11 http://www.ipcc.ch/pdf/assessment-report/ar4/wg1/ar4-uncertainty-guidancenote.pdf
Uncertainty and identification
of adaptation measures
Some scientific studies (including those by the IPCC) rate the level of confidence in, and likelihood of their statements—make use of this information.10
Rather than using a single model, try to use “pos-sibility ranges”.
Be sure to evaluate the plausibility of all top-down information you acquire and add to it with complemen-tary information from climate experts, (sector) experts and stakeholders at the local level (bottom-up).
Be aware that adaptation to climate change is not the only area of planning affected by uncertainty.
Try to find “no regret” or “low regret” adaptation activities (ideally a “win-win-win” situation for mitiga-tion, adaptation and sustainability).
Try to identify flexible and reversible options.
Where there is just a low level of uncertainty, con-centrate on tangible impacts (e.g. countermeasures against glacier lake outburst). When facing more un-certainty, try to increase adaptive capacities (e.g. higher efficiency of water usage during the threat of a possible drought).
Use analogies by identifying regions with similar cli-

43
Part II
Practical Steps
2
Interpreting
matic conditions to those predicted for your region, or learn from past events in your region (see 3.2.5).
Try to apply “adaptive management”—an itera-tive learning process (learning to manage by manag-ing to learn) through which you continuously im-prove your knowledge of climate change impacts.
Take into account the time dimension of im-pacts. When are the impacts expected? Is action necessary today?
44
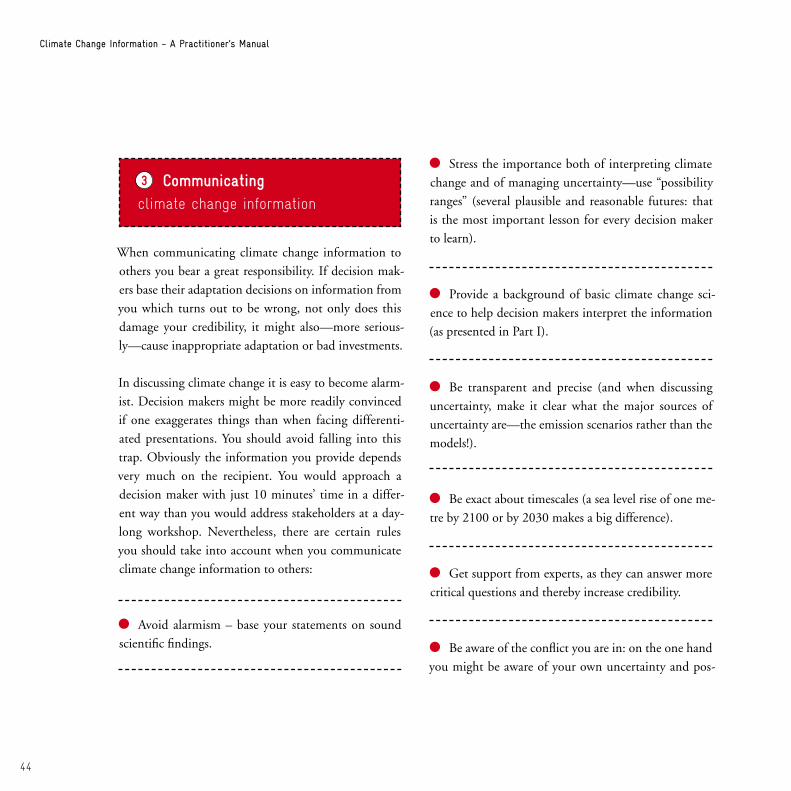
Climate Change Information - A Practitioner’s Manual
When communicating climate change information to others you bear a great responsibility. If decision mak-ers base their adaptation decisions on information from you which turns out to be wrong, not only does this damage your credibility, it might also—more serious-ly—cause inappropriate adaptation or bad investments.
In discussing climate change it is easy to become alarm-ist. Decision makers might be more readily convinced if one exaggerates things than when facing differenti-ated presentations. You should avoid falling into this trap. Obviously the information you provide depends very much on the recipient. You would approach a decision maker with just 10 minutes’ time in a differ-ent way than you would address stakeholders at a day-long workshop. Nevertheless, there are certain rules you should take into account when you communicate climate change information to others:
Avoid alarmism – base your statements on sound scientific findings.
Stress the importance both of interpreting climate change and of managing uncertainty—use “possibility ranges” (several plausible and reasonable futures: that is the most important lesson for every decision maker to learn).
Provide a background of basic climate change sci-ence to help decision makers interpret the information (as presented in Part I).
Be transparent and precise (and when discussing uncertainty, make it clear what the major sources of uncertainty are—the emission scenarios rather than the models!).
Be exact about timescales (a sea level rise of one me-tre by 2100 or by 2030 makes a big difference).
Get support from experts, as they can answer more critical questions and thereby increase credibility.
Be aware of the conflict you are in: on the one hand you might be aware of your own uncertainty and pos-
Communicating climate change information
3
45
Part II
Practical Steps
3
Communicating
12 http://royalsociety.org/trackdoc.asp?id=4085&pId=6229
Decision makers often ask for
the probability of a future sce-
nario. Climate change scenarios
cannot be associated with the
notion of probability as they are
hypothetical futures based on
hypothetical storylines about
humankind’s behaviour for the
next 100 years. Probability is
a statistical concept based on
the frequency of events. These
are not available for scenarios.
Nevertheless based on our phys-
ical understanding and using
certain assumptions about the
development path humans will
take, we can say how things are
likely to progress in the future.
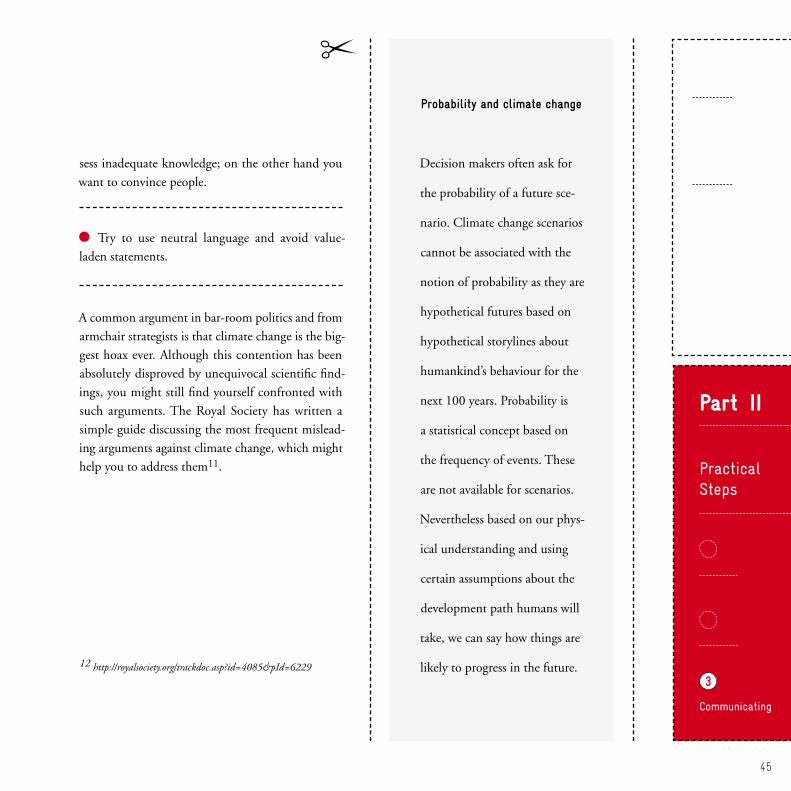
sess inadequate knowledge; on the other hand you want to convince people.
Try to use neutral language and avoid value-laden statements.
A common argument in bar-room politics and from armchair strategists is that climate change is the big-gest hoax ever. Although this contention has been absolutely disproved by unequivocal scientific find-ings, you might still find yourself confronted with such arguments. The Royal Society has written a simple guide discussing the most frequent mislead-ing arguments against climate change, which might help you to address them11.
Probability and climate change
46
Climate Change Information - A Practitioner’s Manual
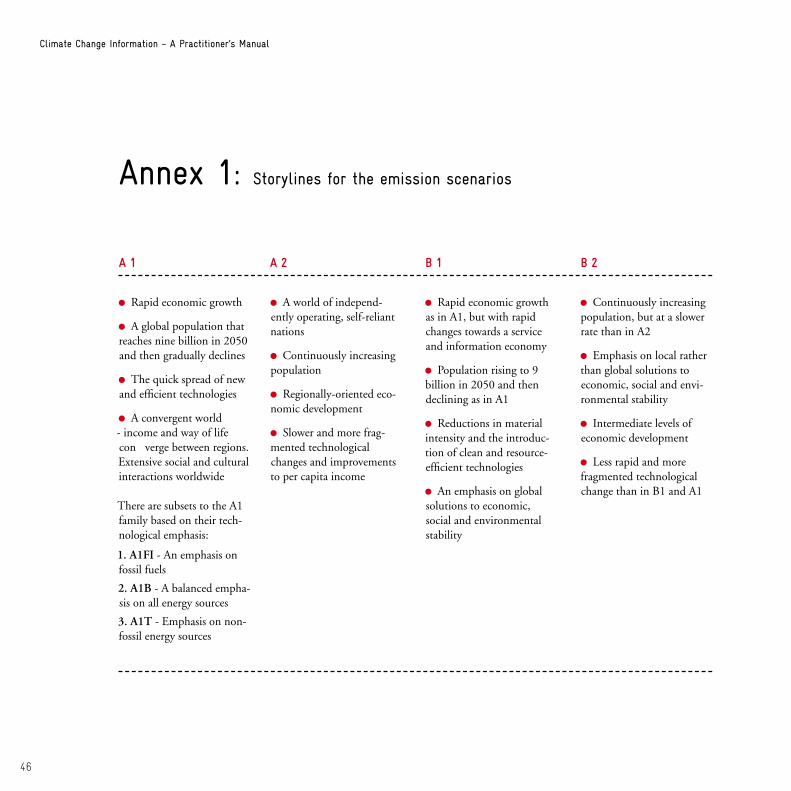
Annex 1: Storylines for the emission scenarios
A 2A 1 B 1 B 2
Continuously increasing population, but at a slower rate than in A2
Emphasis on local rather than global solutions to economic, social and envi-ronmental stability
Intermediate levels of economic development
Less rapid and more fragmented technological change than in B1 and A1
Rapid economic growth
A global population that reaches nine billion in 2050 and then gradually declines
The quick spread of new and efficient technologies
A convergent world - income and way of life con verge between regions. Extensive social and cultural interactions worldwide
There are subsets to the A1 family based on their tech-nological emphasis:
1. A1FI - An emphasis on fossil fuels
2. A1B - A balanced empha-sis on all energy sources
3. A1T - Emphasis on non-fossil energy sources
A world of independ-ently operating, self-reliant nations
Continuously increasing population
Regionally-oriented eco-nomic development
Slower and more frag-mented technological changes and improvements to per capita income
Rapid economic growth as in A1, but with rapid changes towards a service and information economy
Population rising to 9 billion in 2050 and then declining as in A1
Reductions in material intensity and the introduc-tion of clean and resource-efficient technologies
An emphasis on global solutions to economic, social and environmental stability
47
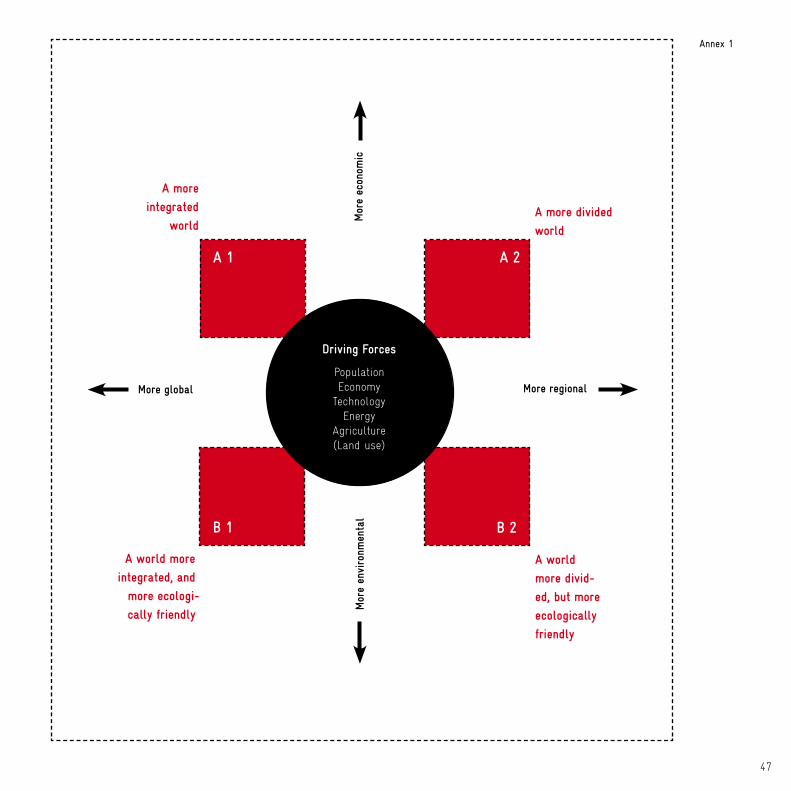
Annex 1
A more
integrated
world
A world more
integrated, and
more ecologi-
cally friendly
More global More regional
Mor
e ec
onom
icM
ore
envi
ronm
enta
lDriving Forces
PopulationEconomy
TechnologyEnergy
Agriculture (Land use)
A world
more divid-
ed, but more
ecologically
friendly
A more divided
world
B 1
A 1 A 2
B 2
48
Climate Change Information - A Practitioner’s Manual
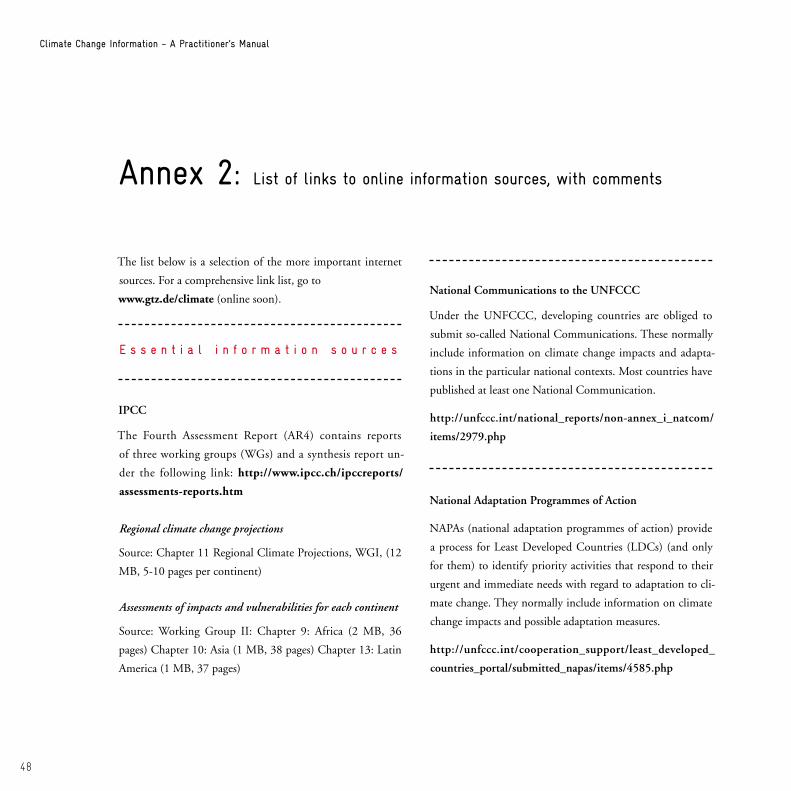
Annex 2: List of links to online information sources, with comments
The list below is a selection of the more important internet
sources. For a comprehensive link list, go to
www.gtz.de/climate (online soon).
IPCC
The Fourth Assessment Report (AR4) contains reports
of three working groups (WGs) and a synthesis report un-
der the following link: http://www.ipcc.ch/ipccreports/
assessments-reports.htm
National Communications to the UNFCCC
Under the UNFCCC, developing countries are obliged to
submit so-called National Communications. These normally
include information on climate change impacts and adapta-
tions in the particular national contexts. Most countries have
published at least one National Communication.
http://unfccc.int/national_reports/non-annex_i_natcom/
items/2979.php
National Adaptation Programmes of Action
NAPAs (national adaptation programmes of action) provide
a process for Least Developed Countries (LDCs) (and only
for them) to identify priority activities that respond to their
urgent and immediate needs with regard to adaptation to cli-
mate change. They normally include information on climate
change impacts and possible adaptation measures.
http://unfccc.int/cooperation_support/least_developed_
countries_portal/submitted_napas/items/4585.php
E s s e n t i a l i n f o r m a t i o n s o u r c e s
Regional climate change projections
Source: Chapter 11 Regional Climate Projections, WGI, (12
MB, 5-10 pages per continent)
Assessments of impacts and vulnerabilities for each continent
Source: Working Group II: Chapter 9: Africa (2 MB, 36
pages) Chapter 10: Asia (1 MB, 38 pages) Chapter 13: Latin
America (1 MB, 37 pages)
49
Annex 2
Adaptation country profiles
Country profiles on adaptation with an overview of key cli-
mate change figures, provided by UNDP
http://country-profiles.geog.ox.ac.uk/
http://www.adaptationlearning.net/profiles/
World Bank Climate Portal
The World Bank Climate Portal provides a rich variety of
country specific climate change information.
http://sdwebx.worldbank.org/climateportal/
Impact maps of climate change
A selection of world maps showing impacts of climate change,
provided by UNDP
http://www.undp.org/gef/adaptation/climate_change/02a.htm
A d d i t i o n a l s o u r c e s o f i n f o r m a t i o n WBGU
In-depth scientific explorations of the overarching themes of
global change and recommendations for action and research.
http://www.wbgu.de/wbgu_publications.html
AIACC
Assessments of Impacts and Adaptations to Climate Change
(AIACC) in Multiple Regions and Sectors provide rich cli-
mate change data for 24 countries
http://www.aiaccproject.org
http://sedac.ciesin.columbia.edu/aiacc/
I n f o rmat i on sources on na tu ra l d i sas te rs
CRED/OFDA International Disaster Database
The EMDAT database provides global disaster statistics, in-
cluding country-level disaster profiles.
http://www.em-dat.net/
50
Climate Change Information - A Practitioner’s Manual
Disaster Risk Index
A country-by-country tool to assess disaster risk, developed by
UNEP’s Global Resource
http://gridca.grid.unep.ch/undp/
Natural Disaster Hotspots: A Global Risk Analysis
A worldwide assessment of natural disasters by the Centre for
Hazards and Risk Research at Columbia University
http://www.ldeo.columbia.edu/chrr/research/hotspots/
PreView
Another UNEP tool for visualising natural disaster data in
more detail
http://www.grid.unep.ch/activities/earlywarning/preview/
Reliefweb
A country-by-country database of emergency appeals,
maintained by UNOCHA (United Nations Office for the
Coordination of Humanitarian Affairs)
http://www.reliefweb.int
51
Annex 2/3
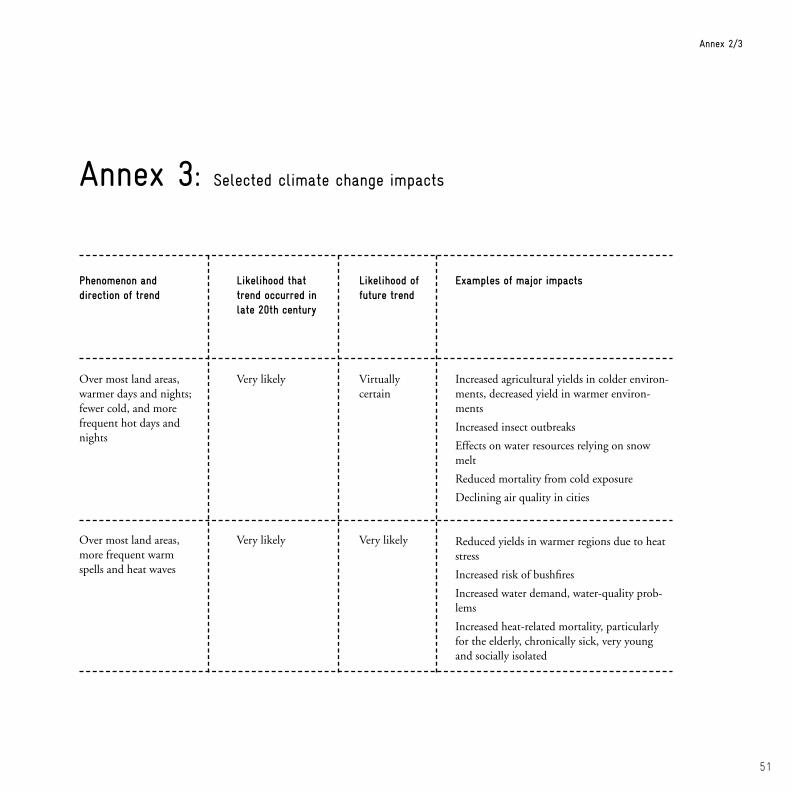
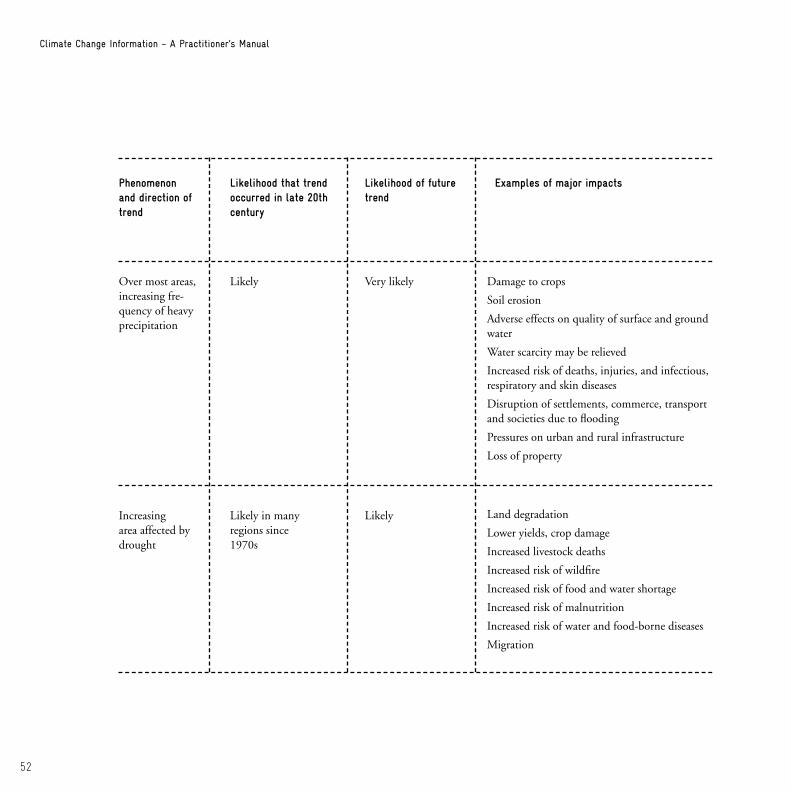
Annex 3: Selected climate change impacts
Phenomenon and direction of trend
Over most land areas, warmer days and nights; fewer cold, and more frequent hot days and nights
Over most land areas, more frequent warm spells and heat waves
Likelihood that trend occurred in late 20th century
Likelihood of future trend
Examples of major impacts
Very likely
Very likely
Virtually certain
Very likely
Increased agricultural yields in colder environ-ments, decreased yield in warmer environ-ments
Increased insect outbreaks
Effects on water resources relying on snow melt
Reduced mortality from cold exposure
Declining air quality in cities
Reduced yields in warmer regions due to heat stress
Increased risk of bushfires
Increased water demand, water-quality prob-lems
Increased heat-related mortality, particularly for the elderly, chronically sick, very young and socially isolated
52
Climate Change Information - A Practitioner’s Manual
Phenomenon and direction of trend
Over most areas, increasing fre-quency of heavy precipitation
Increasing area affected by drought
Likelihood that trend occurred in late 20th century
Likelihood of future trend
Examples of major impacts
Likely
Likely in manyregions since1970s
Very likely
Likely
Damage to crops
Soil erosion
Adverse effects on quality of surface and ground water
Water scarcity may be relieved
Increased risk of deaths, injuries, and infectious, respiratory and skin diseases
Disruption of settlements, commerce, transport and societies due to flooding
Pressures on urban and rural infrastructure
Loss of property
Land degradation
Lower yields, crop damage
Increased livestock deaths
Increased risk of wildfire
Increased risk of food and water shortage
Increased risk of malnutrition
Increased risk of water and food-borne diseases
Migration
53
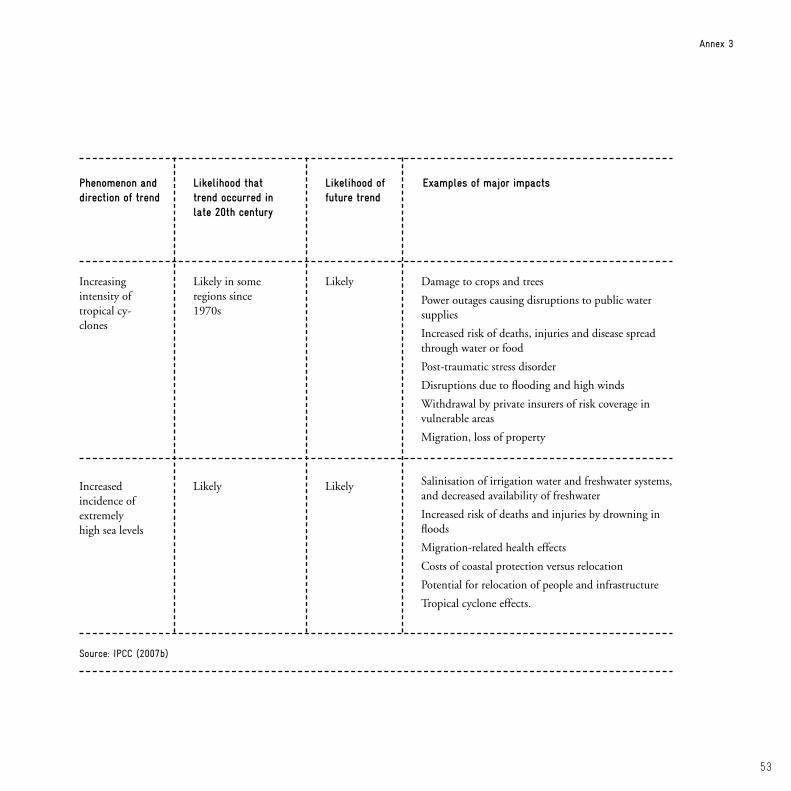
Annex 3
Phenomenon and direction of trend
Increasing intensity of tropical cy-clones
Increased incidence of extremely high sea levels
Likelihood that trend occurred in late 20th century
Likelihood of future trend
Examples of major impacts
Likely in someregions since 1970s
Likely
Likely
Likely
Damage to crops and trees
Power outages causing disruptions to public water supplies
Increased risk of deaths, injuries and disease spread through water or food
Post-traumatic stress disorder
Disruptions due to flooding and high winds
Withdrawal by private insurers of risk coverage in vulnerable areas
Migration, loss of property
Salinisation of irrigation water and freshwater systems, and decreased availability of freshwater
Increased risk of deaths and injuries by drowning in floods
Migration-related health effects
Costs of coastal protection versus relocation
Potential for relocation of people and infrastructure
Tropical cyclone effects.
Source: IPCC (2007b)
54
Climate Change Information - A Practitioner’s Manual
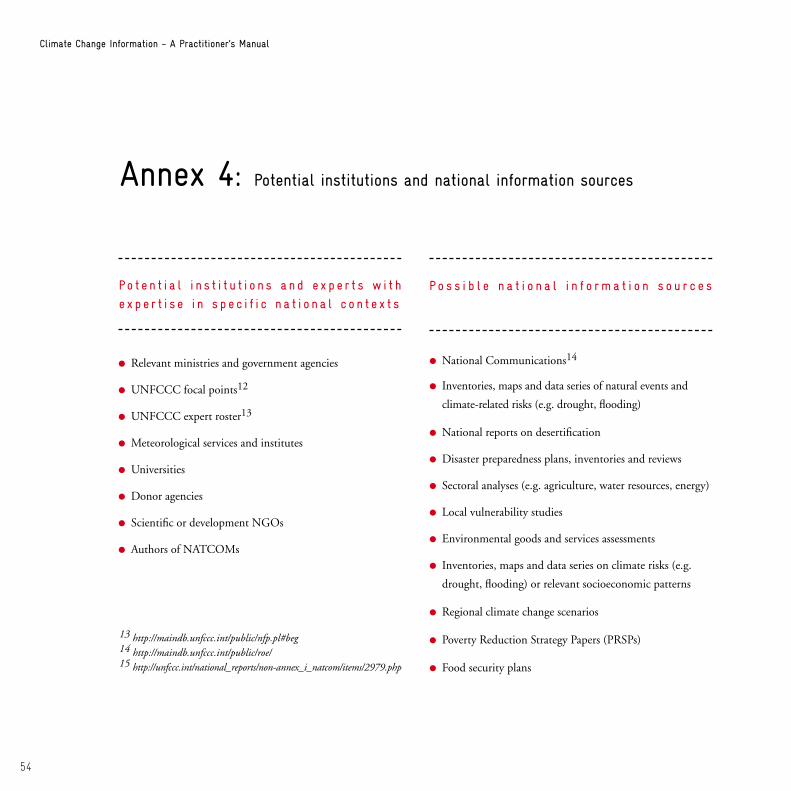
Annex 4: Potential institutions and national information sources
Po t e n t i a l i n s t i t u t i o n s a n d e x p e r t s w i t h
e x p e r t i s e i n s p e c i f i c n a t i o n a l c o n t e x t s
Relevant ministries and government agencies
UNFCCC focal points12
UNFCCC expert roster13
Meteorological services and institutes
Universities
Donor agencies
Scientific or development NGOs
Authors of NATCOMs
National Communications14
Inventories, maps and data series of natural events and
climate-related risks (e.g. drought, flooding)
National reports on desertification
Disaster preparedness plans, inventories and reviews
Sectoral analyses (e.g. agriculture, water resources, energy)
Local vulnerability studies
Environmental goods and services assessments
Inventories, maps and data series on climate risks (e.g.
drought, flooding) or relevant socioeconomic patterns
Regional climate change scenarios
Poverty Reduction Strategy Papers (PRSPs)
Food security plans
13 http://maindb.unfccc.int/public/nfp.pl#beg 14 http://maindb.unfccc.int/public/roe/ 15 http://unfccc.int/national_reports/non-annex_i_natcom/items/2979.php
Po s s i b l e n a t i o n a l i n f o r m a t i o n s o u r c e s
55
Annex 4/5
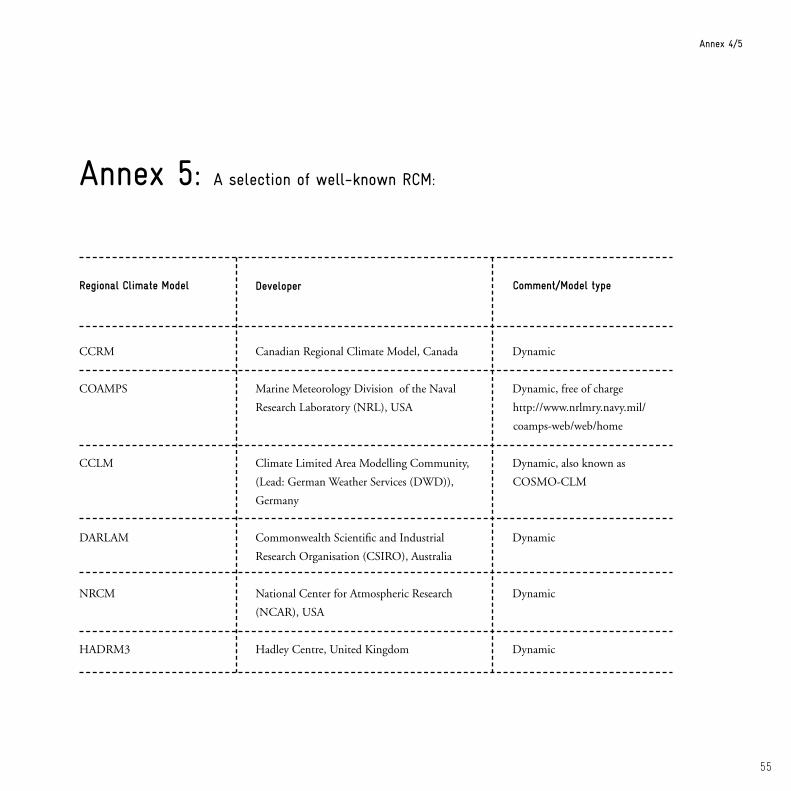
Annex 5: A selection of well-known RCM:
Dynamic
Dynamic, free of charge
http://www.nrlmry.navy.mil/
coamps-web/web/home
Dynamic, also known as
COSMO-CLM
Dynamic
Dynamic
Dynamic
Regional Climate Model
CCRM
COAMPS
CCLM
DARLAM
NRCM
HADRM3
Developer Comment/Model type
Canadian Regional Climate Model, Canada
Marine Meteorology Division of the Naval
Research Laboratory (NRL), USA
Climate Limited Area Modelling Community,
(Lead: German Weather Services (DWD)),
Germany
Commonwealth Scientific and Industrial
Research Organisation (CSIRO), Australia
National Center for Atmospheric Research
(NCAR), USA
Hadley Centre, United Kingdom
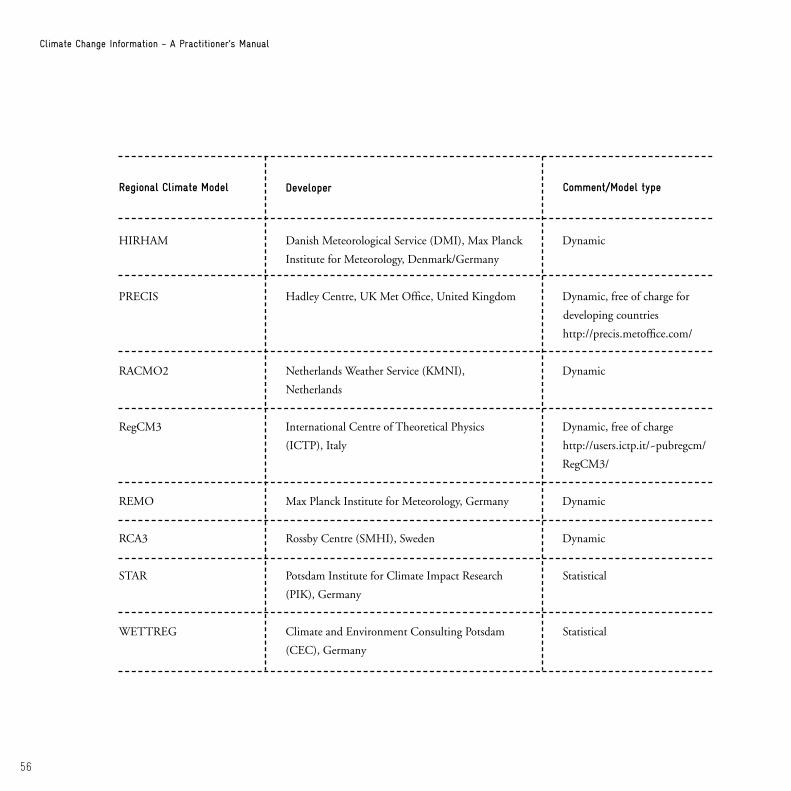
56
Climate Change Information - A Practitioner’s Manual
Dynamic
Dynamic, free of charge for
developing countries
http://precis.metoffice.com/
Dynamic
Dynamic, free of charge
http://users.ictp.it/~pubregcm/
RegCM3/
Dynamic
Dynamic
Statistical
Statistical
Regional Climate Model
HIRHAM
PRECIS
RACMO2
RegCM3
REMO
RCA3
STAR
WETTREG
Developer Comment/Model type
Danish Meteorological Service (DMI), Max Planck
Institute for Meteorology, Denmark/Germany
Hadley Centre, UK Met Office, United Kingdom
Netherlands Weather Service (KMNI),
Netherlands
International Centre of Theoretical Physics
(ICTP), Italy
Max Planck Institute for Meteorology, Germany
Rossby Centre (SMHI), Sweden
Potsdam Institute for Climate Impact Research
(PIK), Germany
Climate and Environment Consulting Potsdam
(CEC), Germany
Annex 5/ References
DEFRA (2009): Climate Change Scenarios for India, access May 13rd, 2009 http://www.defra.gov.uk/environment/climatechange/internat/devcountry/pdf/india-climate-2-climate.pdf
IPCC (2000): Special Report on Emissions Scenarios, edited by N. Nakicenovic and R. Swart, Intergovernmental Panel on Climate Change Cambridge (IPCC): Cambridge University Press, UK.
IPCC (2007a): Climate change 2007: The Physical Science Basis. Report of the Working Group I of the Intergovernmental Panel on Climate Change (IPCC), edited by S. Solomon, D. Qin, M. Manning, Z. Chen, M. Marquis, K.B. Averyt, M. Tignor and H.L. Miller, Cambridge: Cambridge University Press, UK.
IPCC (2007b): Climate Change 2007: Impacts, Adaptation and Vulnerability. Report of the Working Group II of the Intergovernmental Panel on Climate Change (IPCC); edited by M. L. Parry, O. F. Canziani, J. P. Palutikof, P. J. van der Linden and C. E. Hanson, Cambridge University Press, Cambridge, UK.
Jones, R.G. et al. (2004): Generating high resolution climate change scenarios using PRECIS, Met Office Hadley Centre, Exeter, UK, 40pp.
Lüdeke, M.K.B. et al. (1999): Rural poverty driven soil degradation under climate change: the sensitivity of disposi-tion towards the Sahel syndrome with respect to climate. Environmental Modeling and Assessment 4(4): 295-314.
Meinshausen, M. (2007): Page 49 in: Human Development 2007/2008, Fighting Climate Change: Human Solidarity in a divided world. United Nations Development Programme, New York. USA.
O’Brien, K. et al. (2004): Mapping vulnerability to multiple stressors: climate change and globalization in India, Global Environmental Change 14: 303–313.
Raupach, M.R. et al. (2007): Global and regional drivers of accelerating CO2 emissions. PNAS 104 (24): 10288-10293.
Schellnhuber, H.J. et al. (1997): Syndromes of Global Change. GAIA 6(1): 19-34.
Schipper, L. (2007): Climate Change Adaptation and Development: Exploring the Linkages, Tyndall Centre for Climate Change Research Working Paper 107, Norwich, UK.
Stott, P. A. et al. (2004): Human contribution to the European heatwave of 2003. Nature 432: 610-613.
glue here
Deutsche Gesellschaft für Technische Zusammenarbeit (GTZ) GmbH
- German Technical Cooperation -
Climate Protection Programme
Dag-Hammarskjöld-Weg 1-565760 Eschborn/GermanyT +49 61 96 79-0F +49 61 96 79-11 15E [email protected] www.gtz.de
GCM RCM
-3 -1 -0.2 0 0.2 1 3(mm/day)
GCM RCM
-3 -1 -0.2 0 0.2 1 3(mm/day)