Embed Size (px)
Citation preview
Climate, Drought, and Change Michael Anderson State Climatologist
Managing Drought Public Policy Institute of California
January 12, 2015 Oroville Reservoir January 2009
Presentation Overview
• The Rules
• What is Happening?
• Signs of Change
Folsom Reservoir January 2014
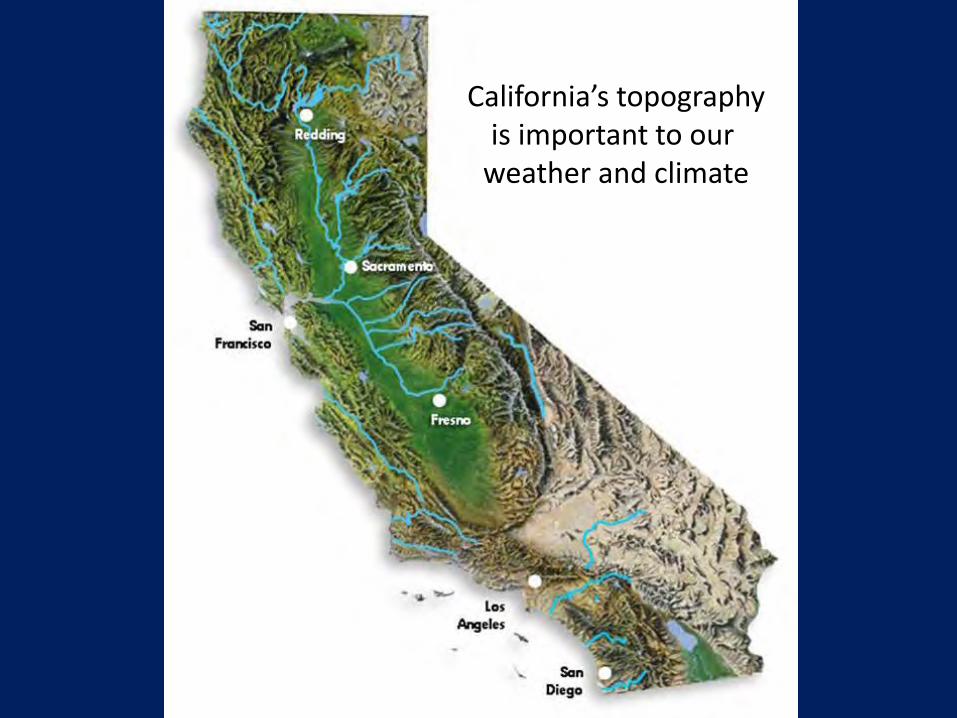
California’s topography is important to our
weather and climate
0
2
4
6
8
10
Oct Nov Dec Jan Feb Mar Apr May Jun Jul Aug Sep
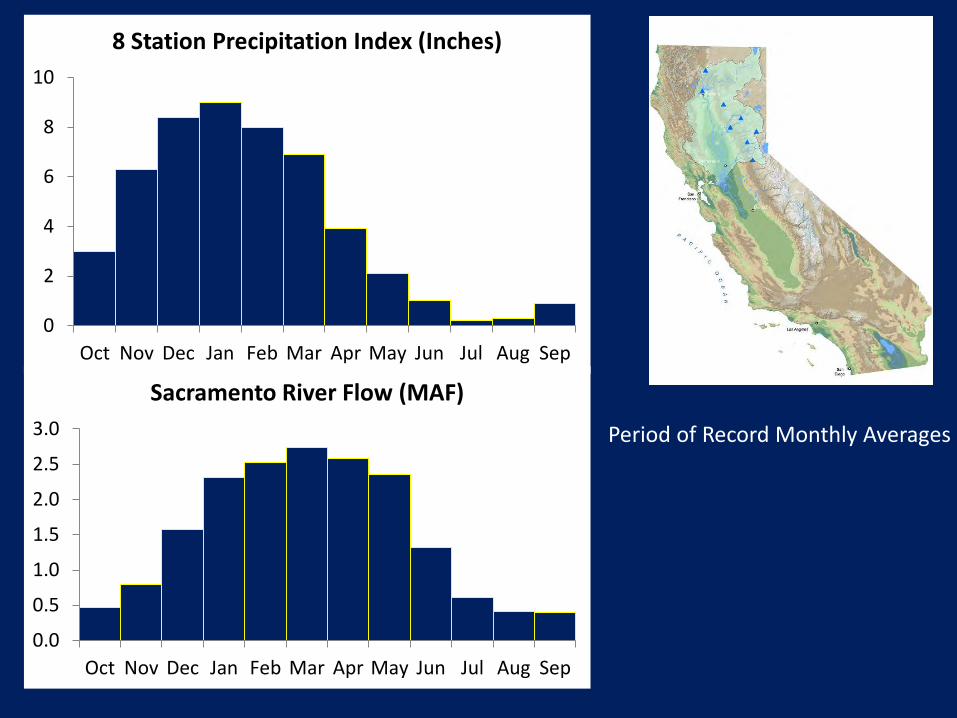
8 Station Precipitation Index (Inches)
0.0
0.5
1.0
1.5
2.0
2.5
3.0
Oct Nov Dec Jan Feb Mar Apr May Jun Jul Aug Sep
Sacramento River Flow (MAF)
Period of Record Monthly Averages
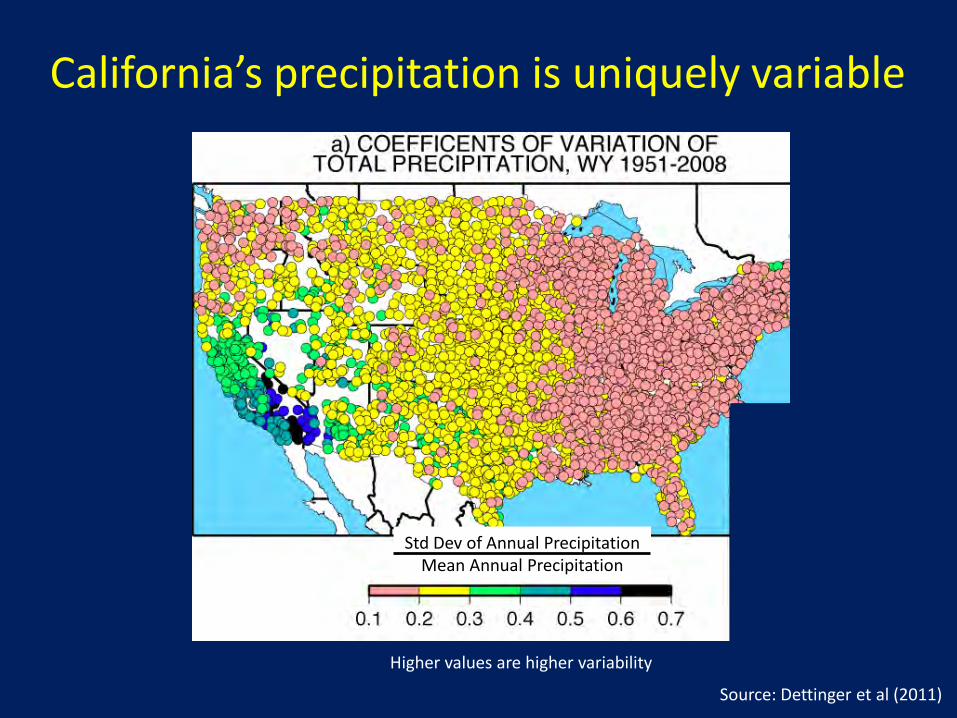
California’s precipitation is uniquely variable
Source: Dettinger et al (2011)
Std Dev of Annual Precipitation Mean Annual Precipitation
Higher values are higher variability
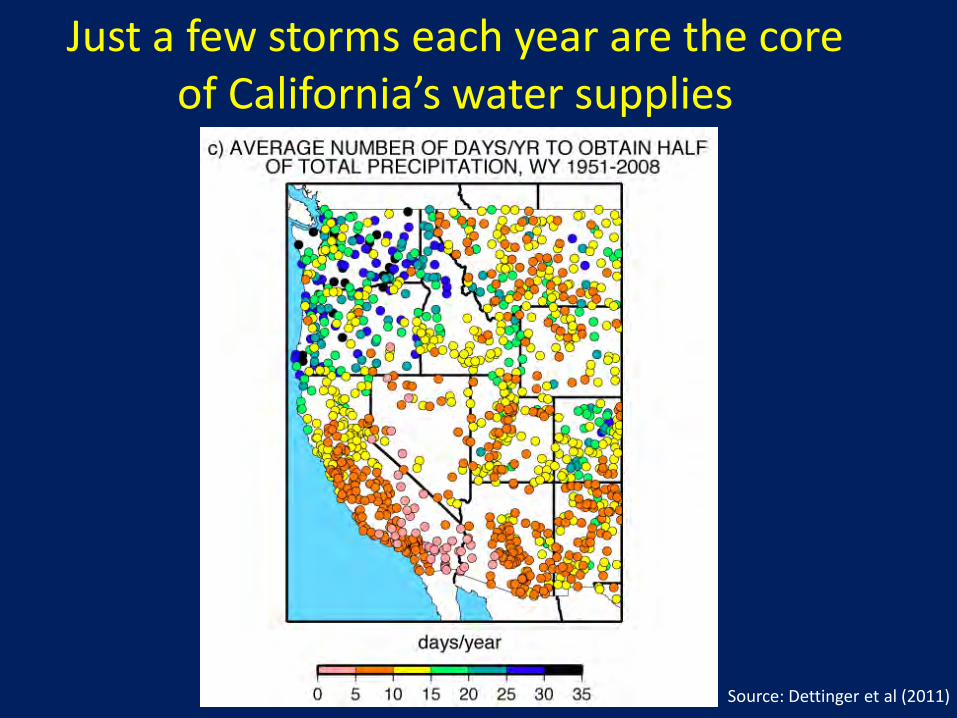
Just a few storms each year are the core of California’s water supplies
Source: Dettinger et al (2011)
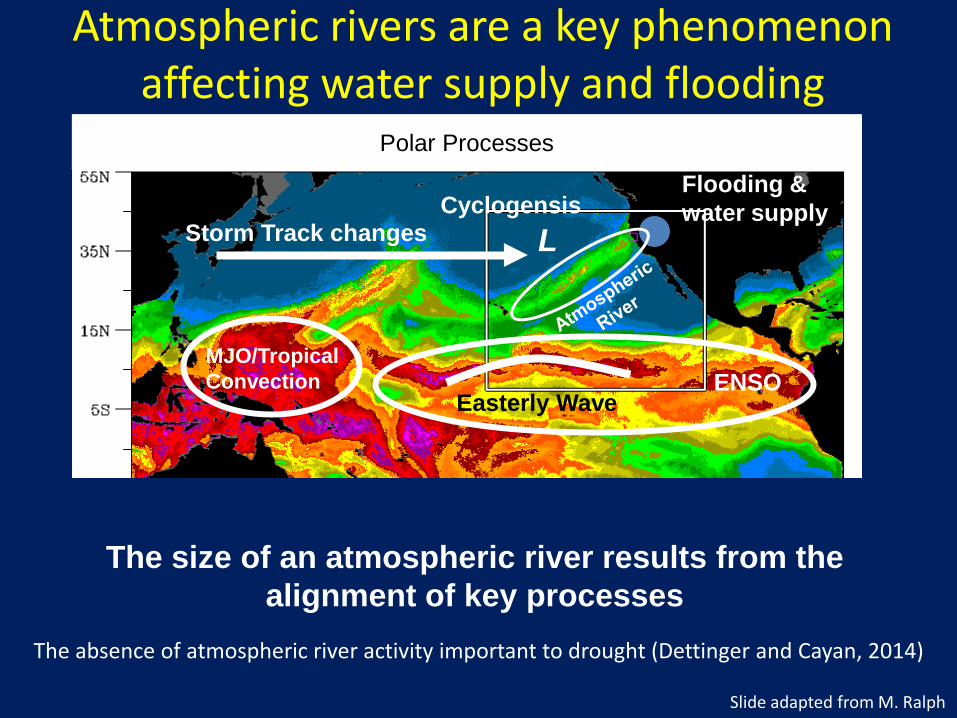
Storm Track changes
Flooding & water supply
MJO/Tropical Convection ENSO
Polar Processes
Atmospheric rivers are a key phenomenon affecting water supply and flooding
Easterly Wave
Cyclogensis L
The size of an atmospheric river results from the alignment of key processes
The absence of atmospheric river activity important to drought (Dettinger and Cayan, 2014)
Slide adapted from M. Ralph
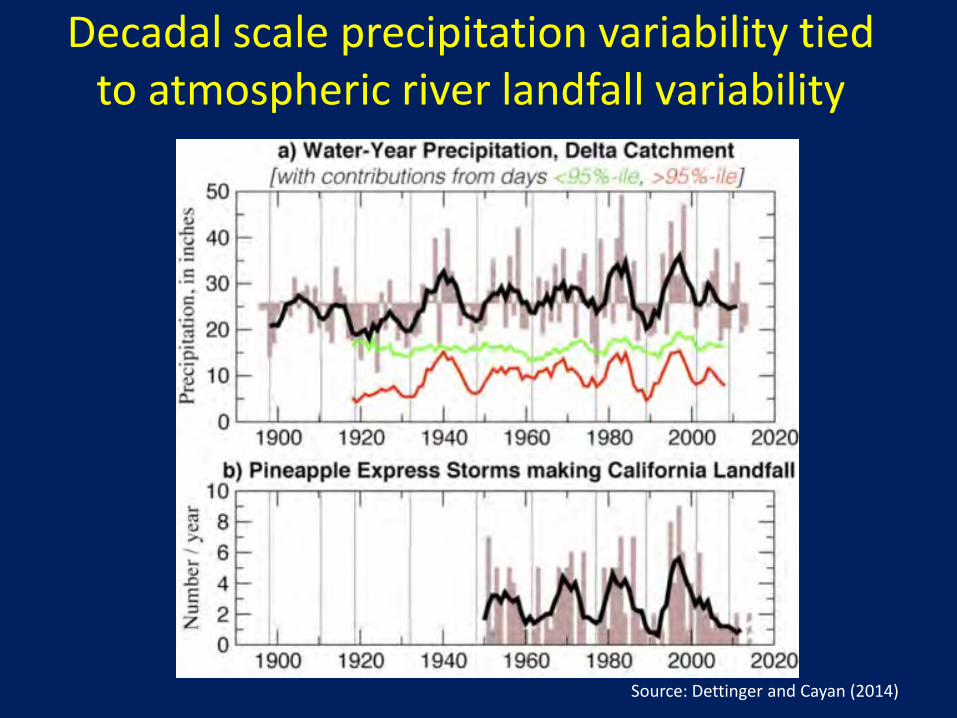
Decadal scale precipitation variability tied to atmospheric river landfall variability
Source: Dettinger and Cayan (2014)
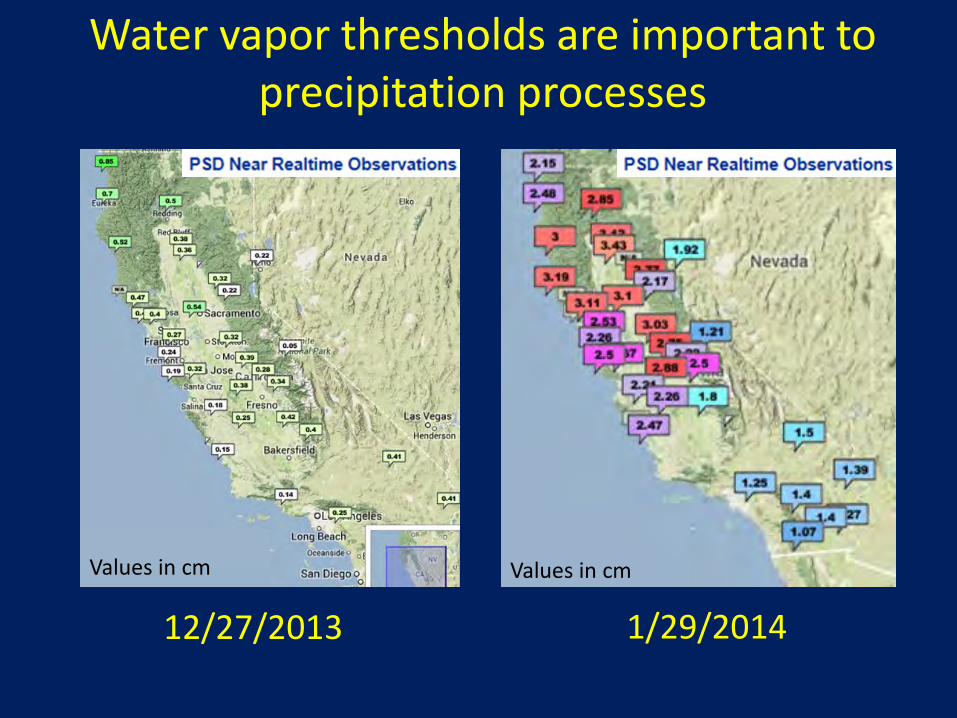
12/27/2013 1/29/2014
Values in cm Values in cm
Water vapor thresholds are important to precipitation processes

Presentation Overview
• The Rules
• What is Happening?
• Signs of Change
Folsom Reservoir January 2014
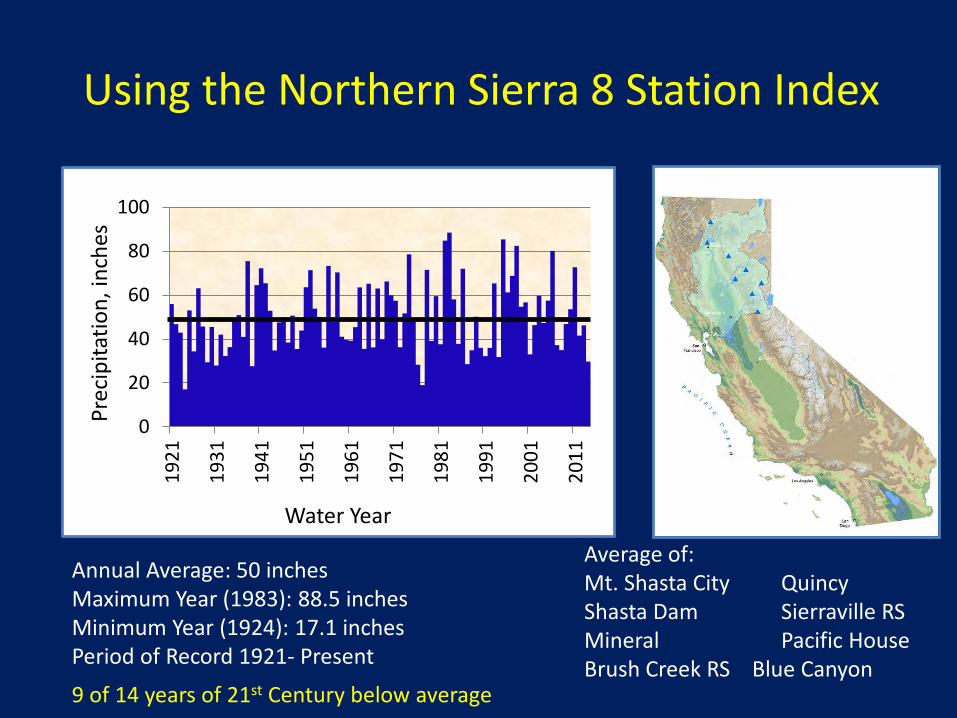
Water Year
Using the Northern Sierra 8 Station Index
Annual Average: 50 inches Maximum Year (1983): 88.5 inches Minimum Year (1924): 17.1 inches Period of Record 1921- Present
Average of: Mt. Shasta City Quincy Shasta Dam Sierraville RS Mineral Pacific House Brush Creek RS Blue Canyon
0
20
40
60
80
100
1921
1931
1941
1951
1961
1971
1981
1991
2001
2011
Water Year
Prec
ipita
tion,
inch
es
9 of 14 years of 21st Century below average
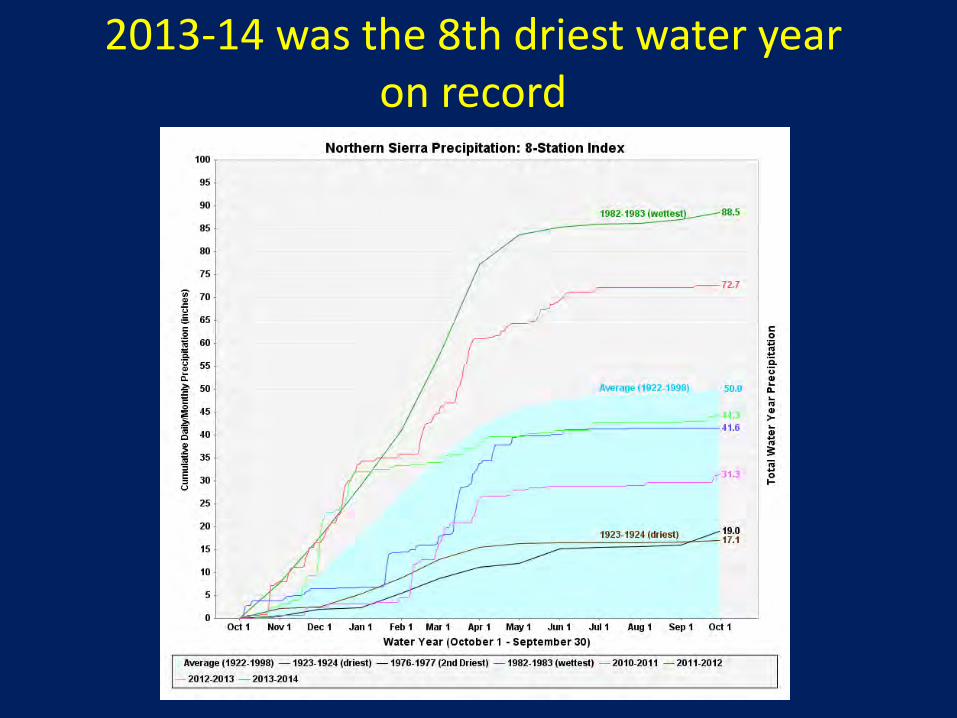
2013-14 was the 8th driest water year on record
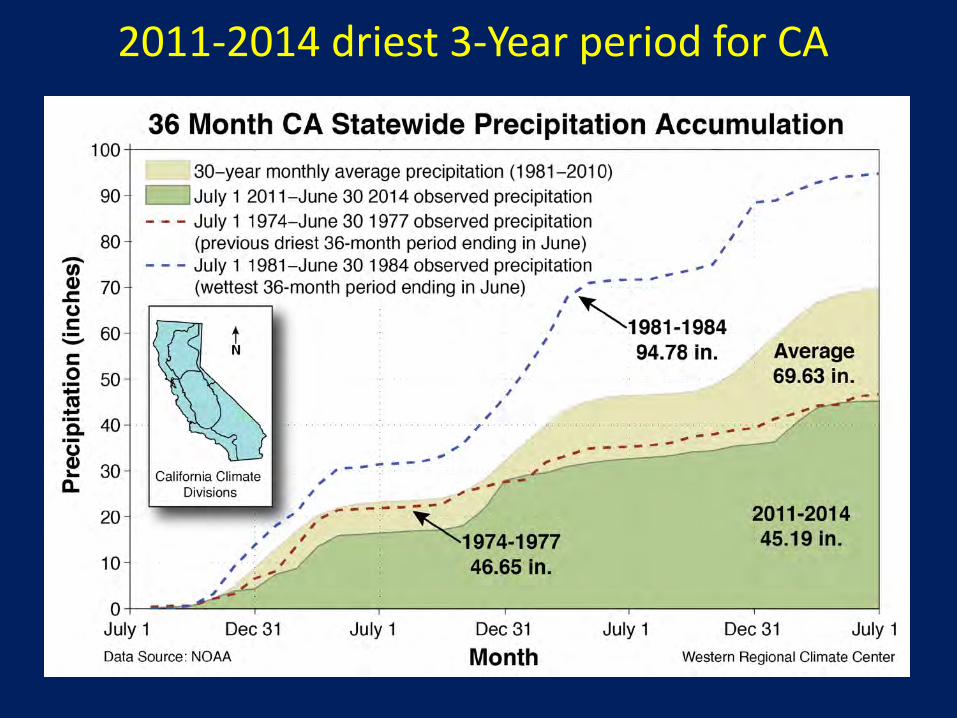
2011-2014 driest 3-Year period for CA
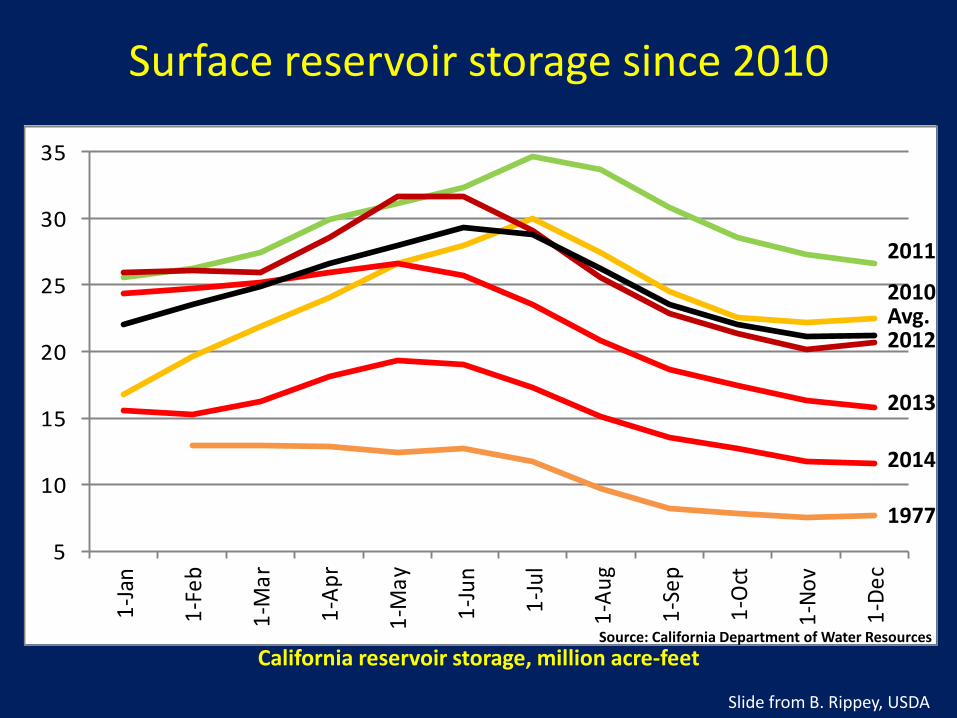
5
10
15
20
25
30
351-
Jan
1-Fe
b
1-M
ar
1-Ap
r
1-M
ay
1-Ju
n
1-Ju
l
1-Au
g
1-Se
p
1-O
ct
1-No
v
1-De
c
California reservoir storage, million acre-feet Source: California Department of Water Resources
2011
2010 Avg.
2013
2014
1977
2012
Slide from B. Rippey, USDA
Surface reservoir storage since 2010
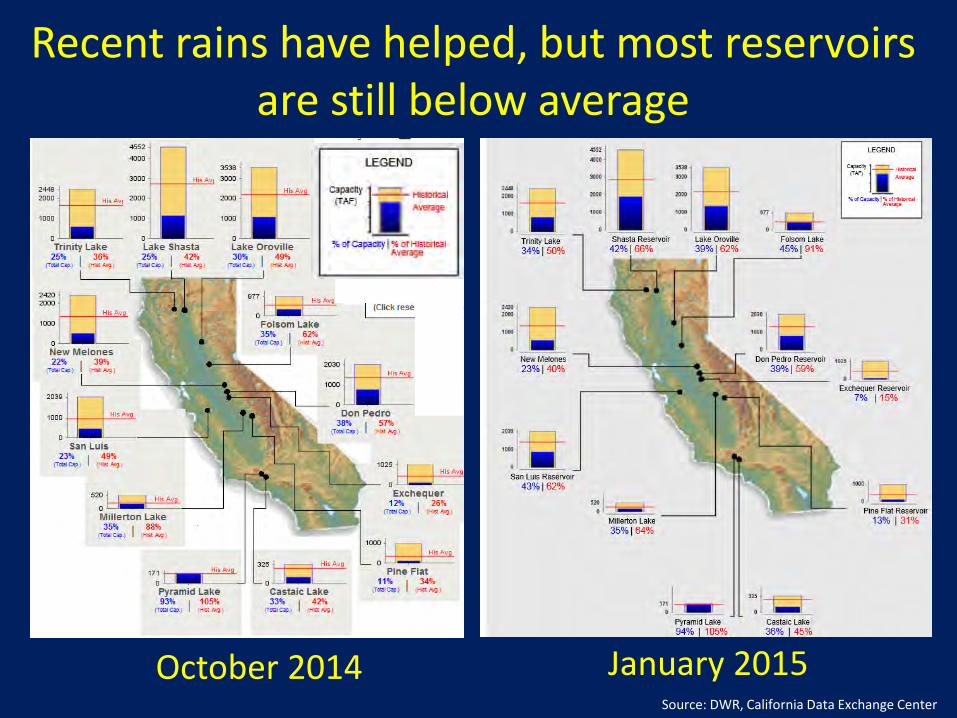
October 2014 January 2015 Source: DWR, California Data Exchange Center
Recent rains have helped, but most reservoirs are still below average
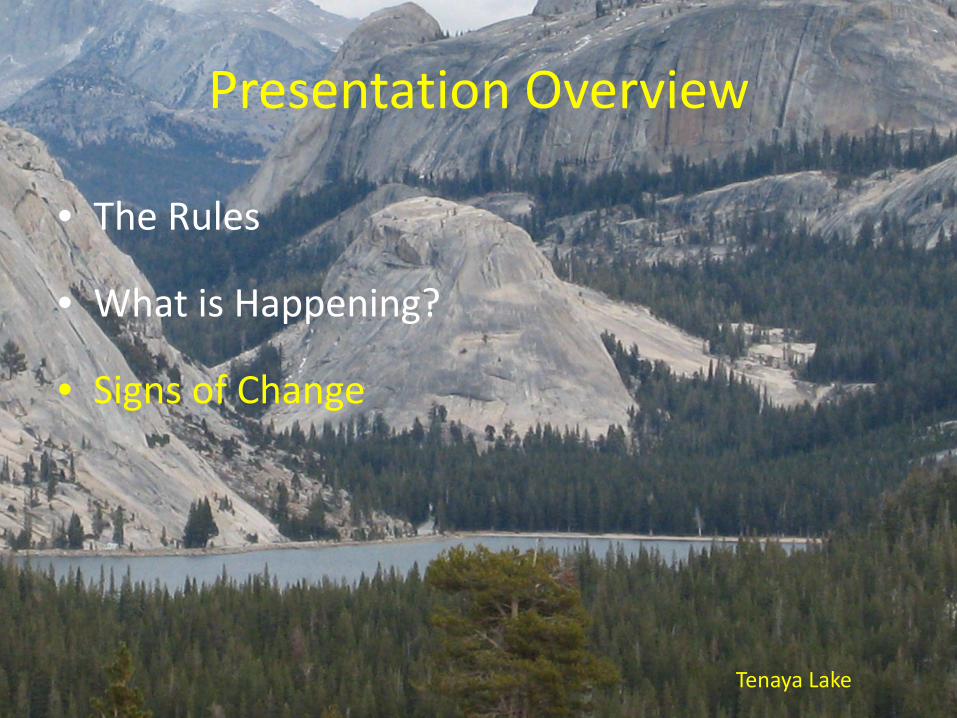
Tenaya Lake
Presentation Overview
• The Rules
• What is Happening?
• Signs of Change
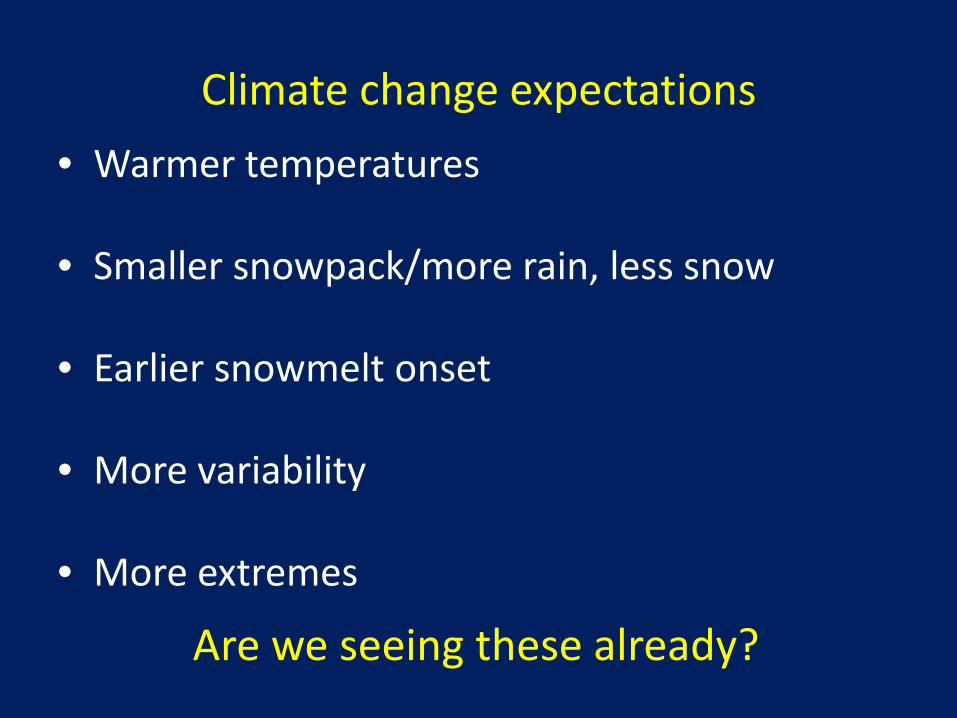
Climate change expectations • Warmer temperatures
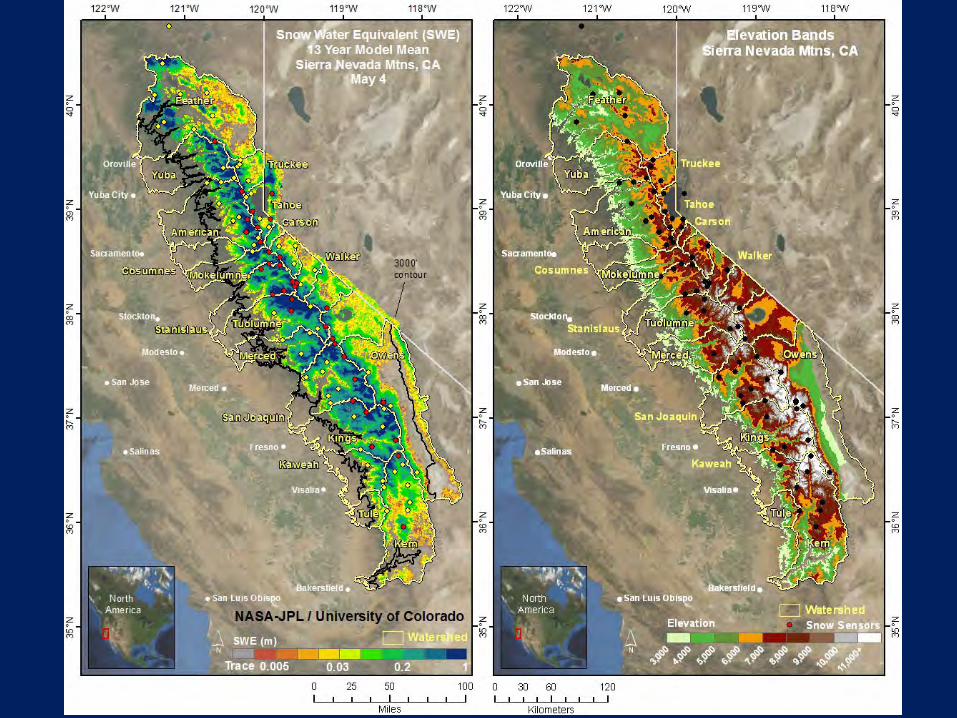
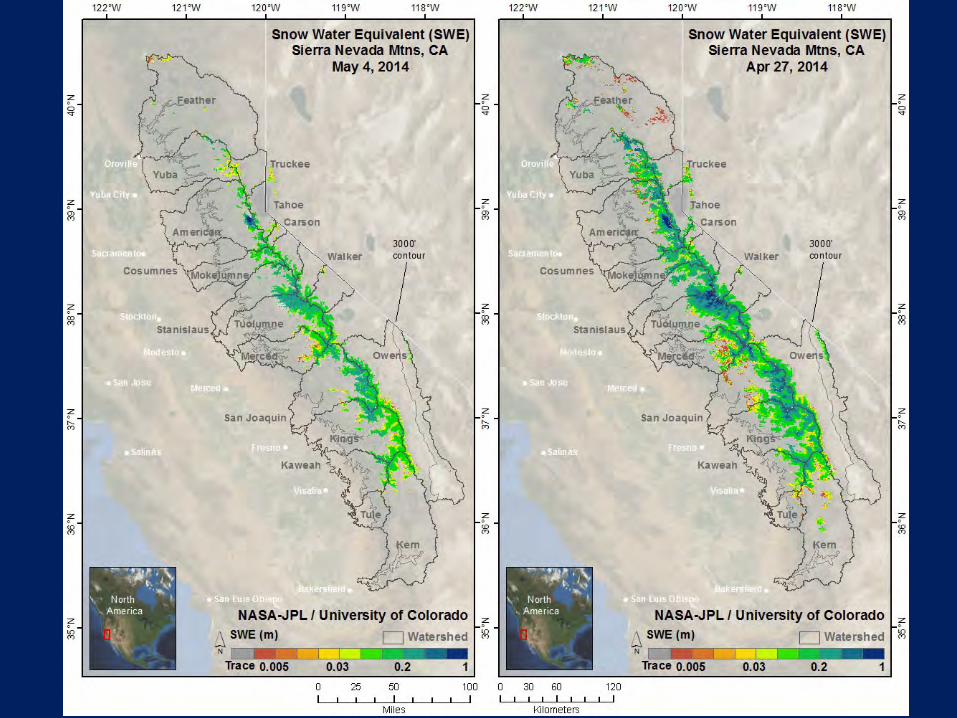
• Smaller snowpack/more rain, less snow
• Earlier snowmelt onset
• More variability
• More extremes
Are we seeing these already?
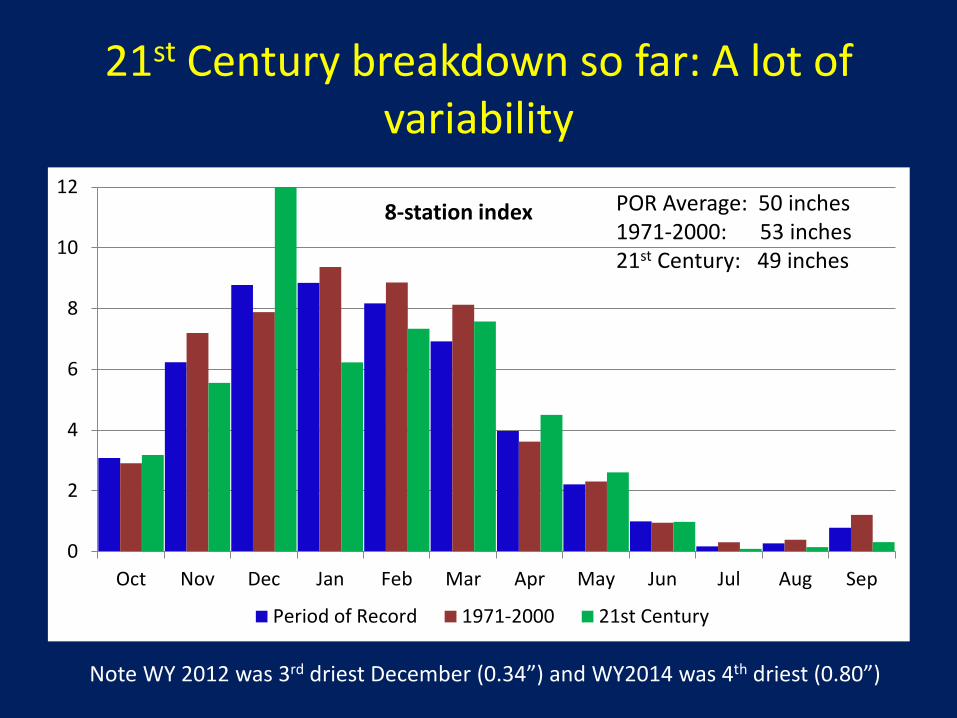
21st Century breakdown so far: A lot of variability
0
2
4
6
8
10
12
Oct Nov Dec Jan Feb Mar Apr May Jun Jul Aug Sep
Period of Record 1971-2000 21st Century
POR Average: 50 inches 1971-2000: 53 inches 21st Century: 49 inches
Note WY 2012 was 3rd driest December (0.34”) and WY2014 was 4th driest (0.80”)
8-station index
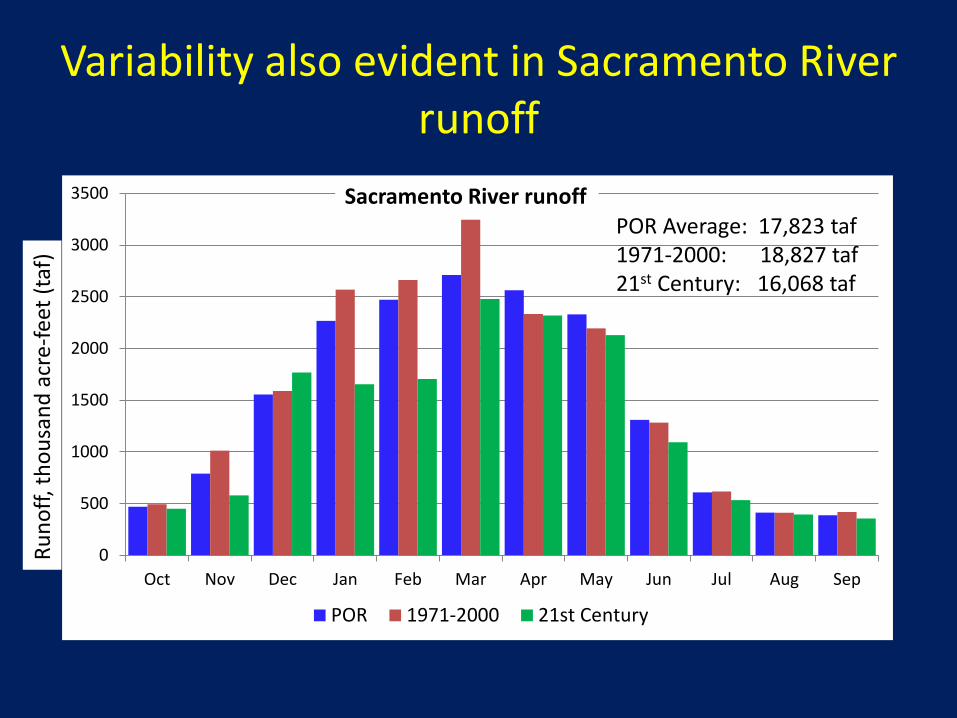
Variability also evident in Sacramento River runoff
POR Average: 18.3 MAF 1971-2000: 18.8 MAF 21st Century: 16.1 MAF
Runo
ff, th
ousa
nd a
cre-
feet
(taf
)
0
500
1000
1500
2000
2500
3000
3500
Oct Nov Dec Jan Feb Mar Apr May Jun Jul Aug Sep
POR 1971-2000 21st Century
POR Average: 17,823 taf 1971-2000: 18,827 taf 21st Century: 16,068 taf
Sacramento River runoff
0
10
20
30
40
50
60
70
80
50 51 52 53 54 55 56 57
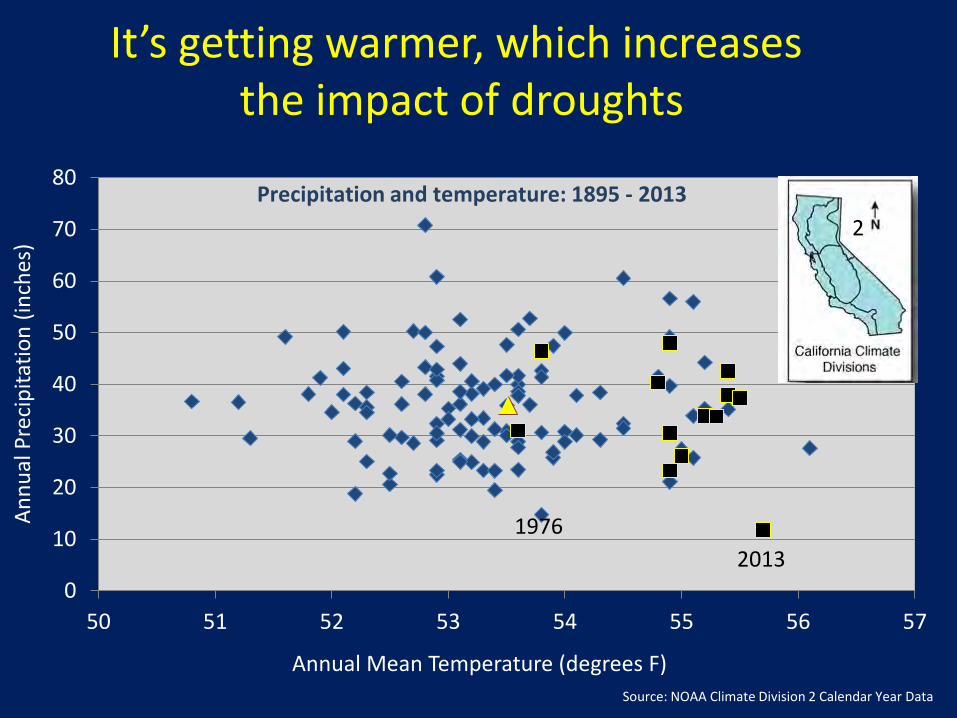
2013
Precipitation and temperature: 1895 - 2013
Annual Mean Temperature (degrees F)
Annu
al P
reci
pita
tion
(inch
es)
It’s getting warmer, which increases the impact of droughts
1976
2
Source: NOAA Climate Division 2 Calendar Year Data
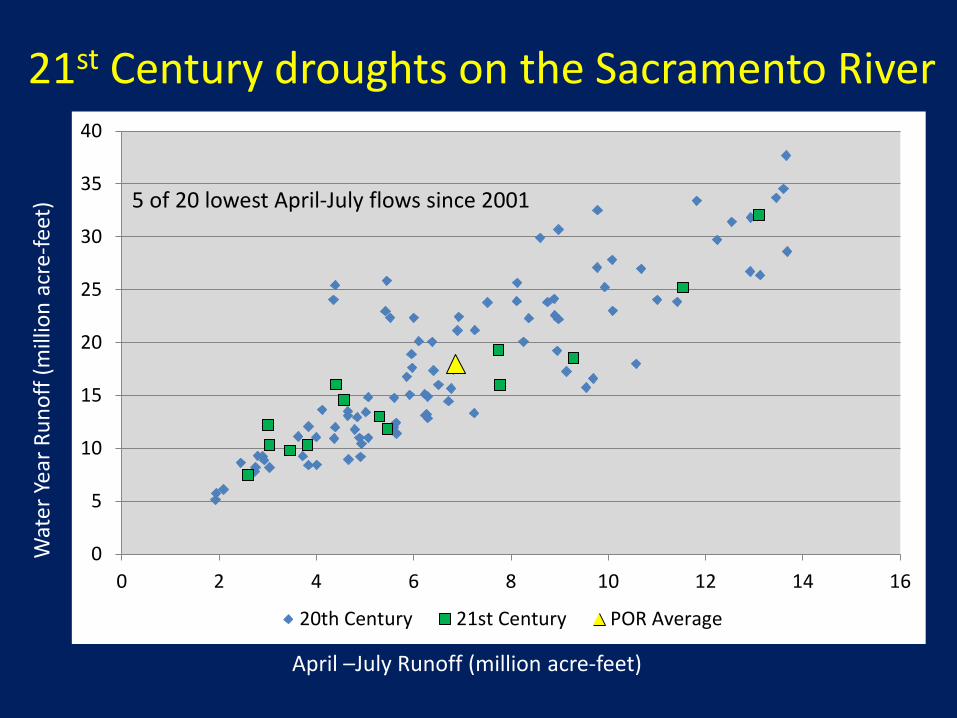
April –July Runoff (million acre-feet)
Wat
er Y
ear R
unof
f (m
illio
n ac
re-fe
et)
21st Century droughts on the Sacramento River
1976
2
0
5
10
15
20
25
30
35
40
0 2 4 6 8 10 12 14 16
20th Century 21st Century POR Average
5 of 20 lowest April-July flows since 2001
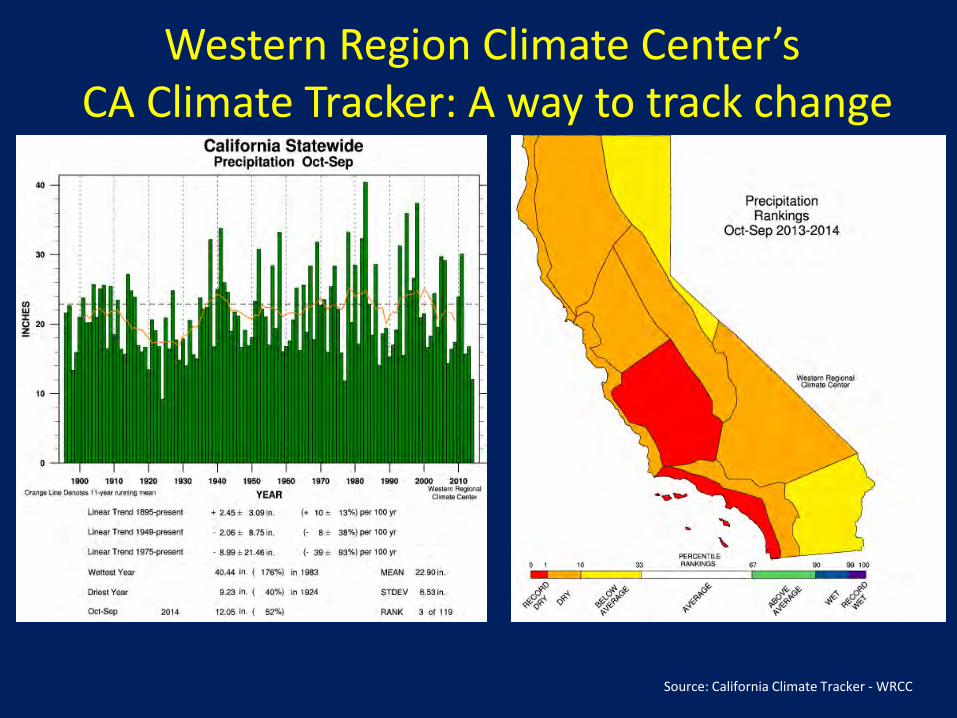
Source: California Climate Tracker - WRCC
Western Region Climate Center’s CA Climate Tracker: A way to track change
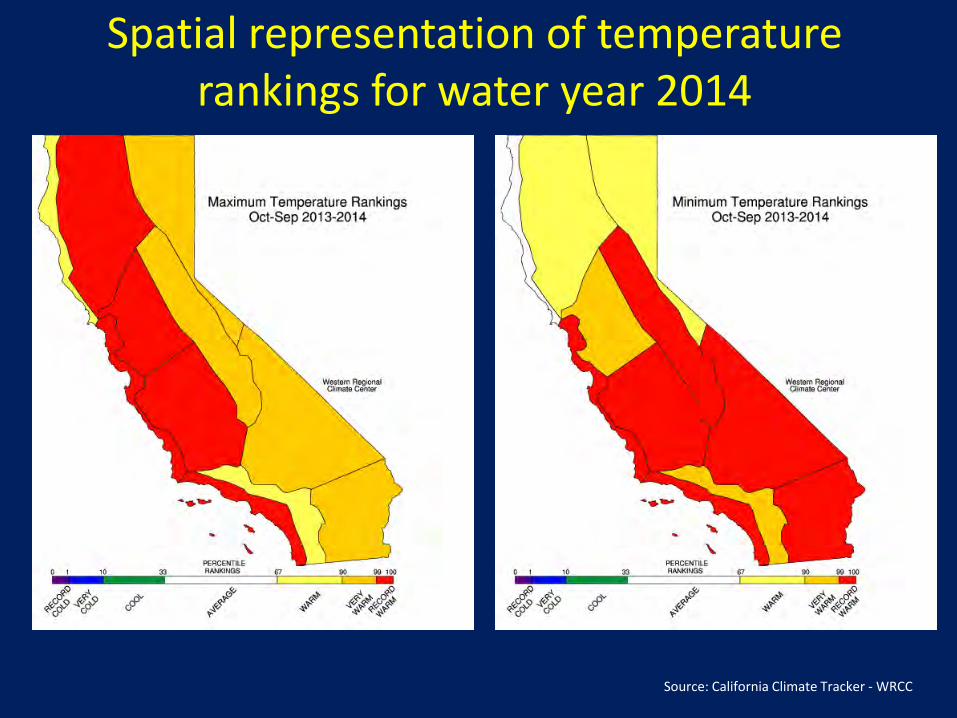
Spatial representation of temperature rankings for water year 2014
Source: California Climate Tracker - WRCC
Summarizing thoughts
• Current drought and other 21st Century droughts have shown record-setting characteristics and are warmer than 20th Century counterparts.
• Atmospheric river events provide significant inputs into annual precipitation totals. There are fewer such events in drought years, and characteristics of atmospheric events will change with climate change.
Summarizing thoughts
• Planning for future droughts can take advantage of information in the historical record, including paleo reconstructions. The trick will be to increase our understanding of causal mechanisms and watershed condition/response over different time scales.
• Averages are not so useful anymore. We need to understand variability and process.
Lessons from Australia’s Millennium Drought
Professor Jane M Doolan National Water Commission
Outline • Policy context
• Millennium Drought
– The prospect of things to come
• Key policy responses – Water allocation – Urban – Rural – Environment
• After the drought
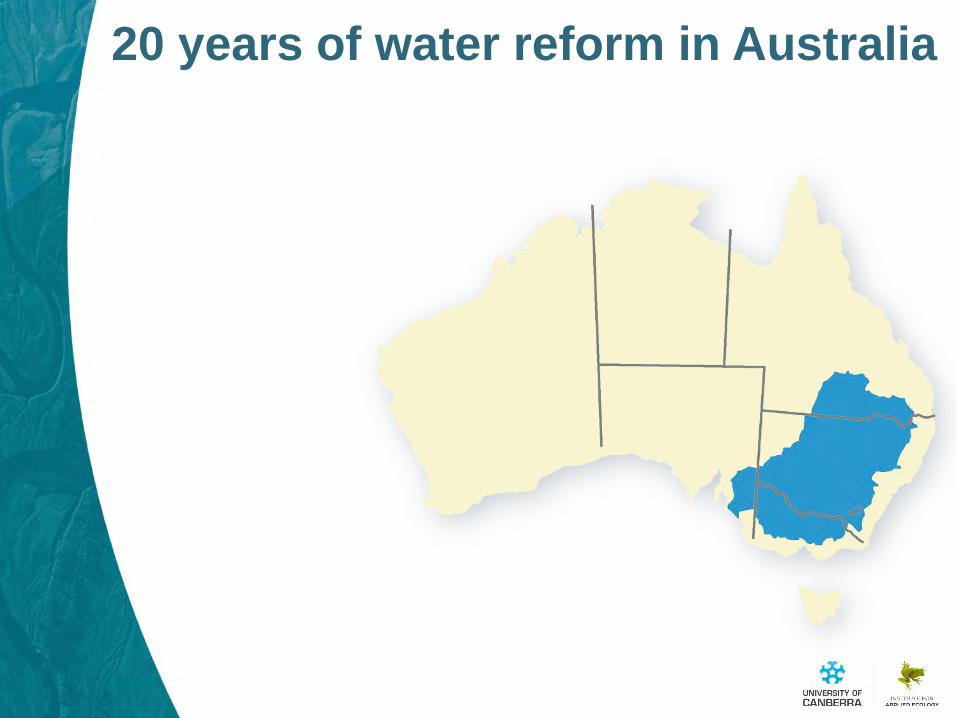
20 years of water reform in Australia
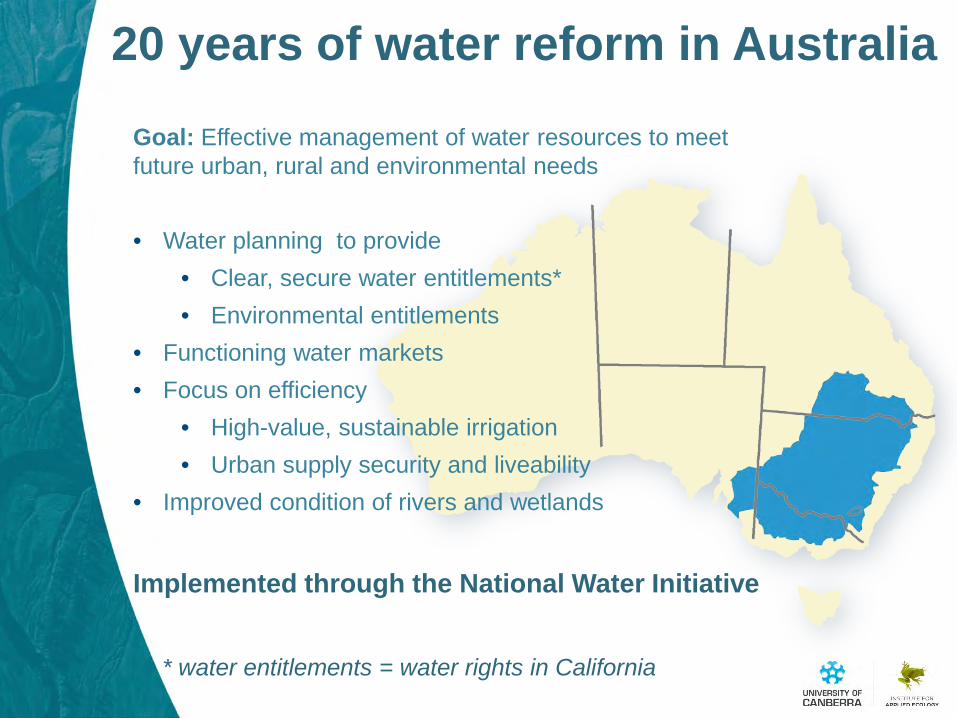
20 years of water reform in Australia
Goal: Effective management of water resources to meet future urban, rural and environmental needs
• Water planning to provide • Clear, secure water entitlements* • Environmental entitlements
• Functioning water markets • Focus on efficiency
• High-value, sustainable irrigation • Urban supply security and liveability
• Improved condition of rivers and wetlands
Implemented through the National Water Initiative * water entitlements = water rights in California
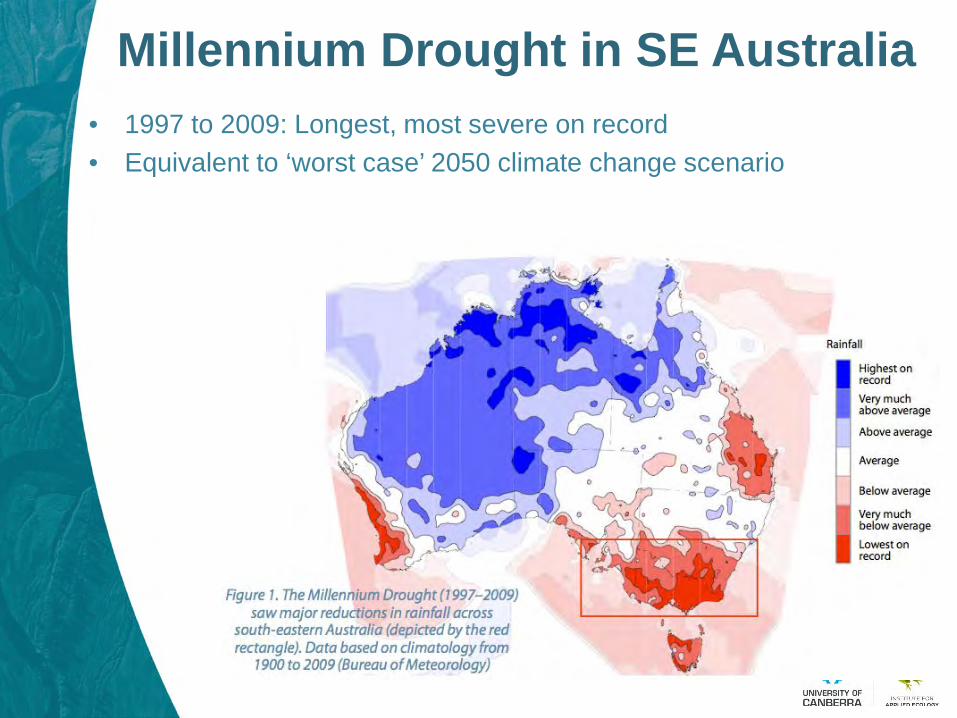
Millennium Drought in SE Australia • 1997 to 2009: Longest, most severe on record • Equivalent to ‘worst case’ 2050 climate change scenario
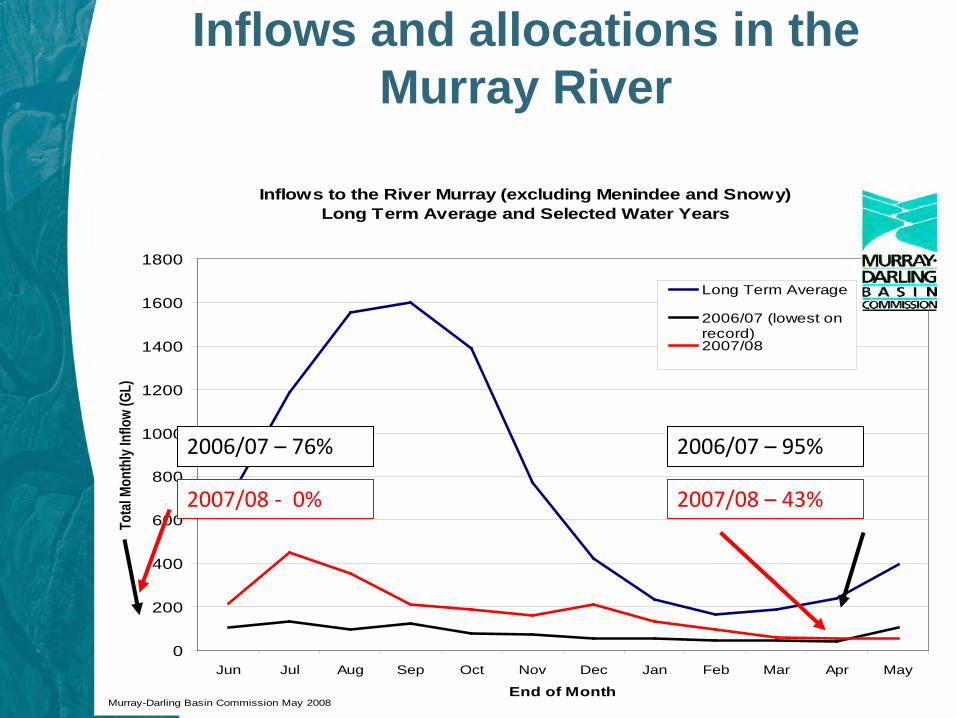
Inflows and allocations in the Murray River
Inflows to the River Murray (excluding Menindee and Snowy)Long Term Average and Selected Water Years
0
200
400
600
800
1000
1200
1400
1600
1800
Jun Jul Aug Sep Oct Nov Dec Jan Feb Mar Apr May
End of Month
Tota
l Mon
thly
Inflo
w (G
L)
Long Term Average
2006/07 (lowest onrecord)2007/08
Murray-Darling Basin Commission May 2008
2006/07 – 76% 2006/07 – 95%
2007/08 - 0% 2007/08 – 43%
Urban and agricultural impacts • Urban
– Water restrictions limited to indoor only use – Water carting to many small rural communities
• Irrigated Agriculture – Irrigation allocations: 0% -10% – 2002 – 2009
• Rice 99% • Cotton 84% • 1/3 all vines sacrificed
– Health impacts, foreclosures, suicides
• Economy – 2006-07: loss of ~1% of GDP – 2006-09: loss of 6,000 jobs in Murray region
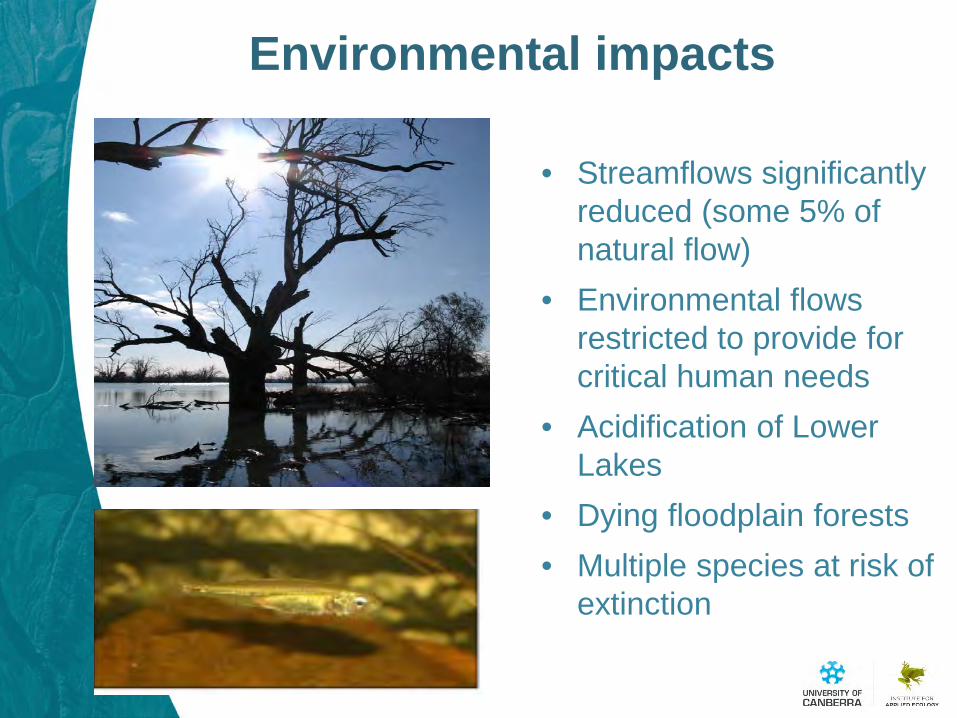
Environmental impacts
• Streamflows significantly reduced (some 5% of natural flow)
• Environmental flows restricted to provide for critical human needs
• Acidification of Lower Lakes
• Dying floodplain forests • Multiple species at risk of
extinction
Policy response and priorities
• Build on National Water Initiative reforms • Balance economic, social, environmental outcomes • Principles
• Must work under drier/variable future climate • Improve efficiency and promote conservation • Entitlement (water right) holders manage risk • Facilitate water markets • Look for multi-benefit solutions
• New $13B Murray-Darling Basin (MDB) Plan
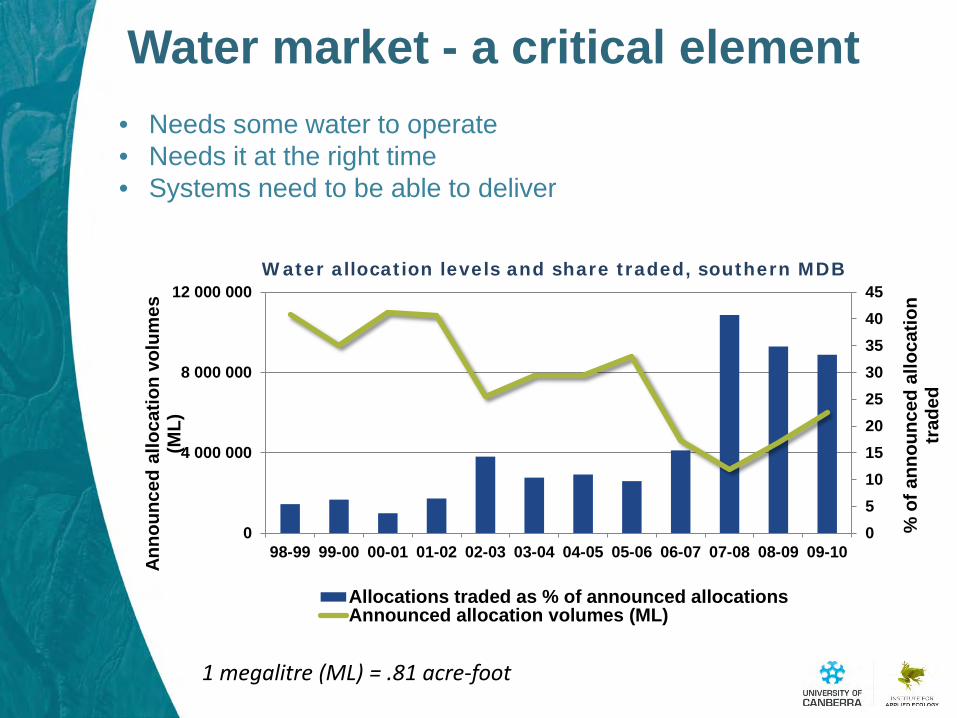
Water allocation levels and share traded, southern MDB
051015202530354045
0
4 000 000
8 000 000
12 000 000
98-99 99-00 00-01 01-02 02-03 03-04 04-05 05-06 06-07 07-08 08-09 09-10
% o
f ann
ounc
ed a
lloca
tion
trad
ed
Anno
unce
d al
loca
tion
volu
mes
(M
L)
Allocations traded as % of announced allocationsAnnounced allocation volumes (ML)
Water market - a critical element • Needs some water to operate • Needs it at the right time • Systems need to be able to deliver
1 megalitre (ML) = .81 acre-foot
Entitlements and markets
Entitlements protected, but improvements include • Introduced carry-over • Changed system reserve rules
• Allows market to operate in all years • Provides certainty of delivery
• Clearer environmental entitlements with credit-for-return flows
• Improved Victorian water grid
Urban management Goal: Supply minimum level of service with demand management and – where needed – new supply.
• Demand management • Per capita water usage down 43 %
• In 2011/12, average residential use in Melbourne: 149 L (39 gallons) per person per day
• Alternative, new sources • Recycled water, stormwater
• Groundwater
• Trading
• Desalination
• Pipelines and interconnectors
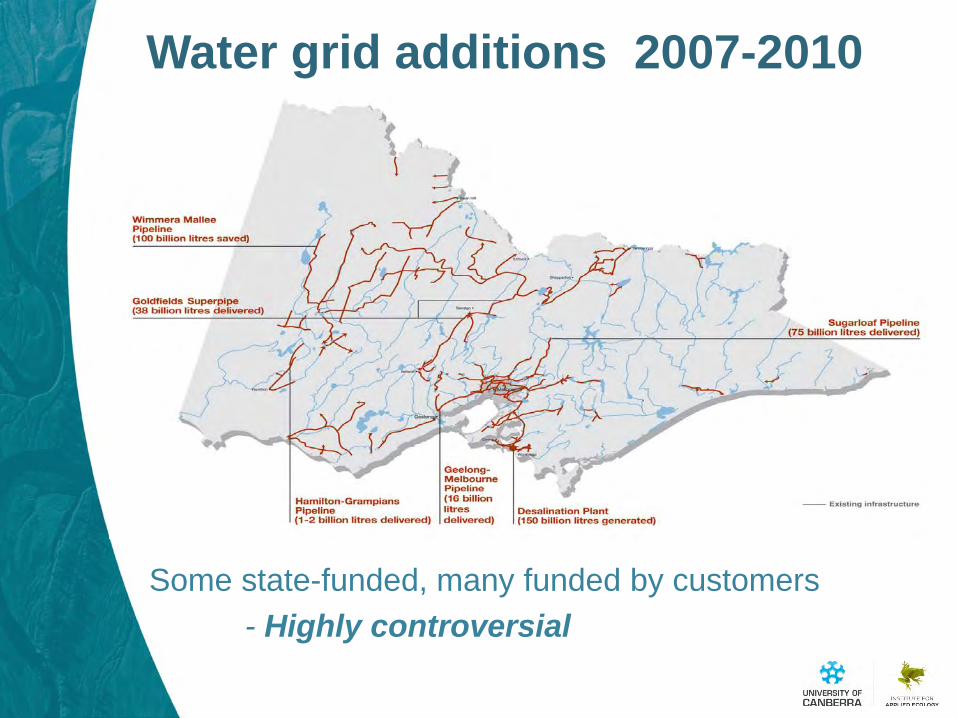
Water grid additions 2007-2010
Some state-funded, many funded by customers - Highly controversial
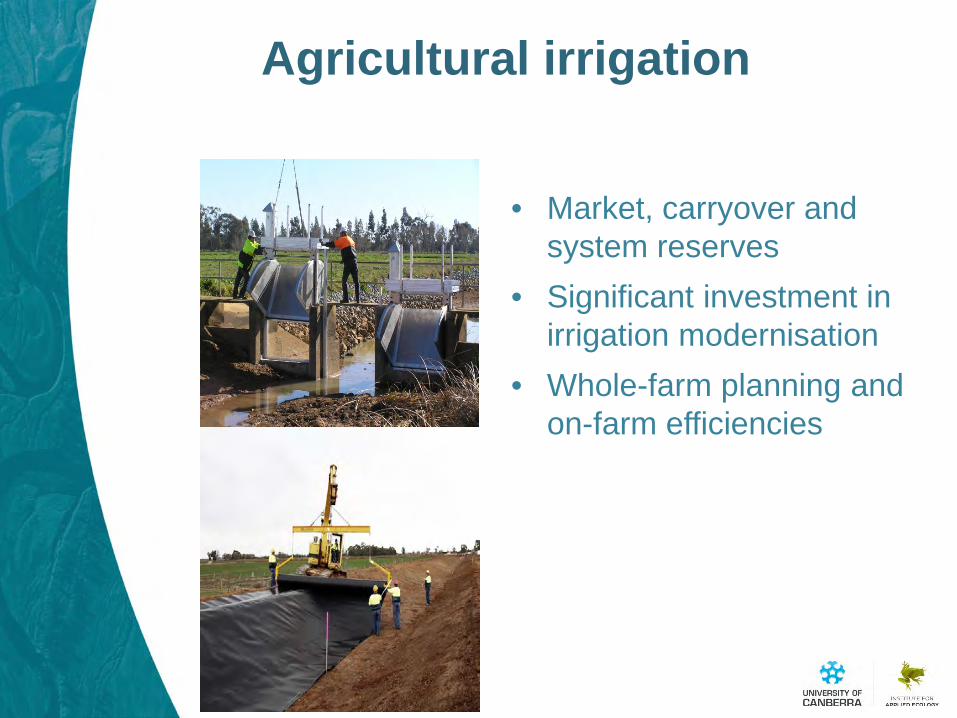
Agricultural irrigation
• Market, carryover and
system reserves • Significant investment in
irrigation modernisation • Whole-farm planning and
on-farm efficiencies
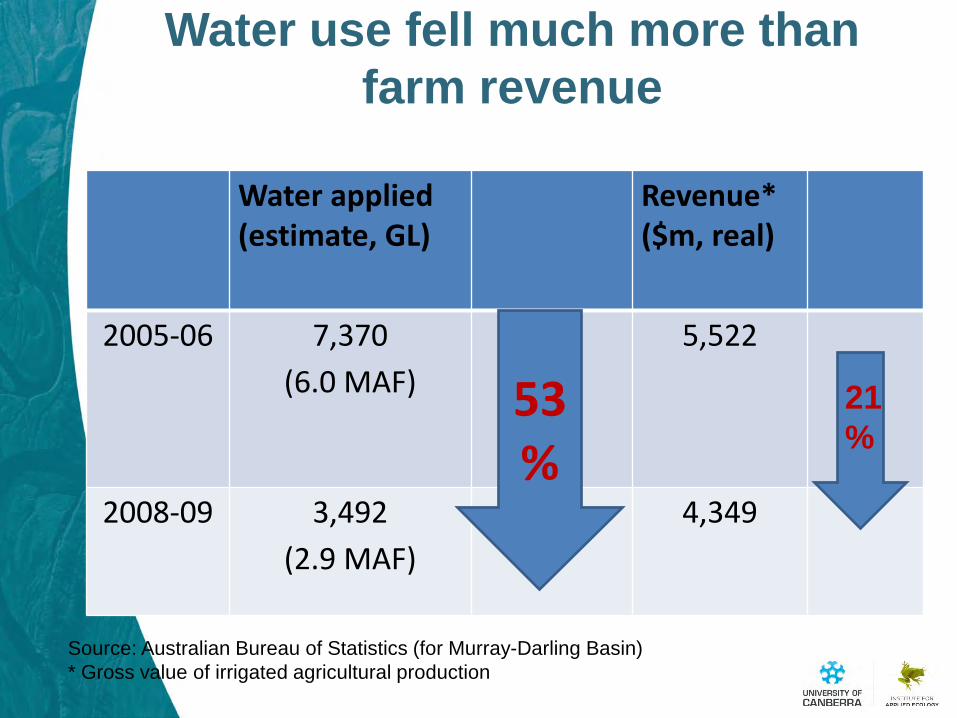
Water use fell much more than farm revenue
Water applied (estimate, GL)
Revenue* ($m, real)
2005-06 7,370 (6.0 MAF)
5,522
2008-09 3,492 (2.9 MAF)
4,349
53%
21 %
Source: Australian Bureau of Statistics (for Murray-Darling Basin) * Gross value of irrigated agricultural production
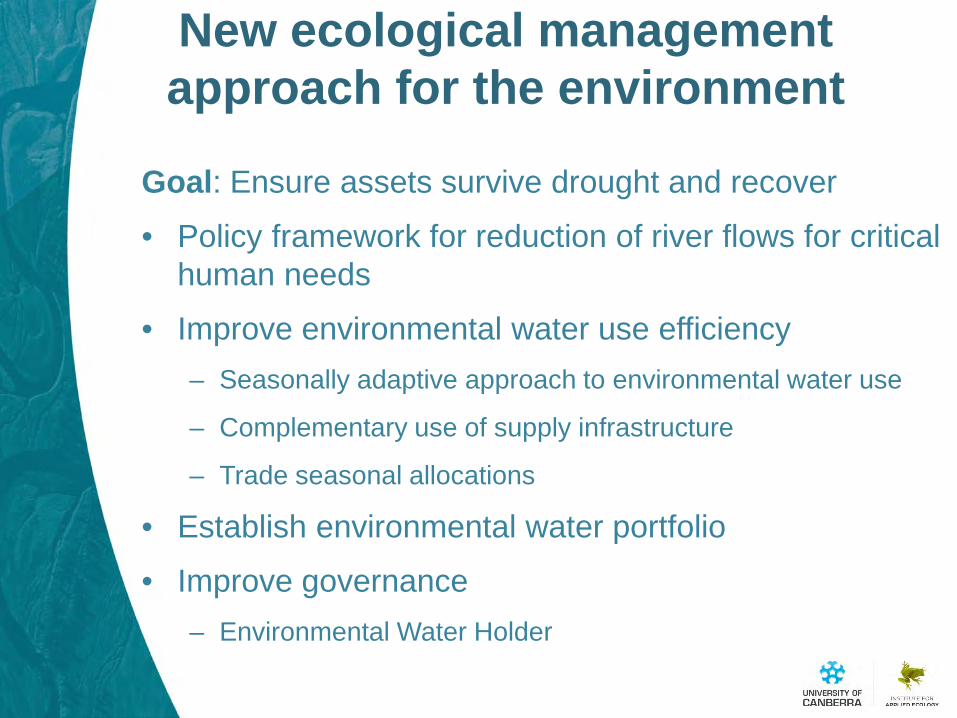
New ecological management approach for the environment
Goal: Ensure assets survive drought and recover
• Policy framework for reduction of river flows for critical human needs
• Improve environmental water use efficiency – Seasonally adaptive approach to environmental water use
– Complementary use of supply infrastructure
– Trade seasonal allocations
• Establish environmental water portfolio
• Improve governance – Environmental Water Holder
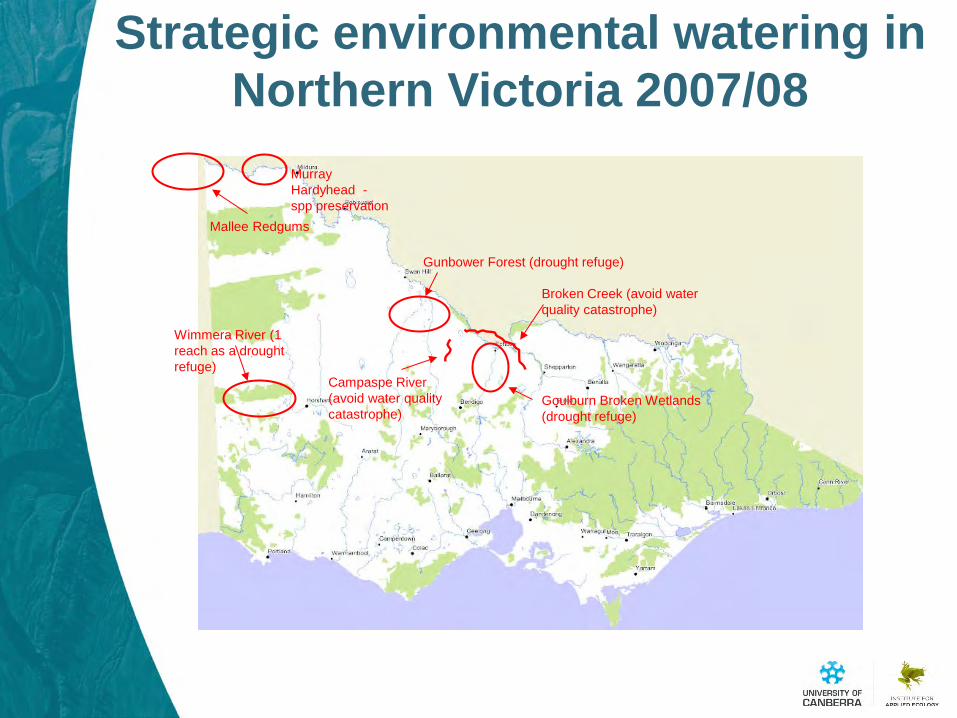
Strategic environmental watering in Northern Victoria 2007/08
Gunbower Forest (drought refuge)
Goulburn Broken Wetlands (drought refuge)
Mallee Redgums
Wimmera River (1 reach as a drought refuge)
Campaspe River (avoid water quality catastrophe)
Broken Creek (avoid water quality catastrophe)
Murray Hardyhead - spp preservation
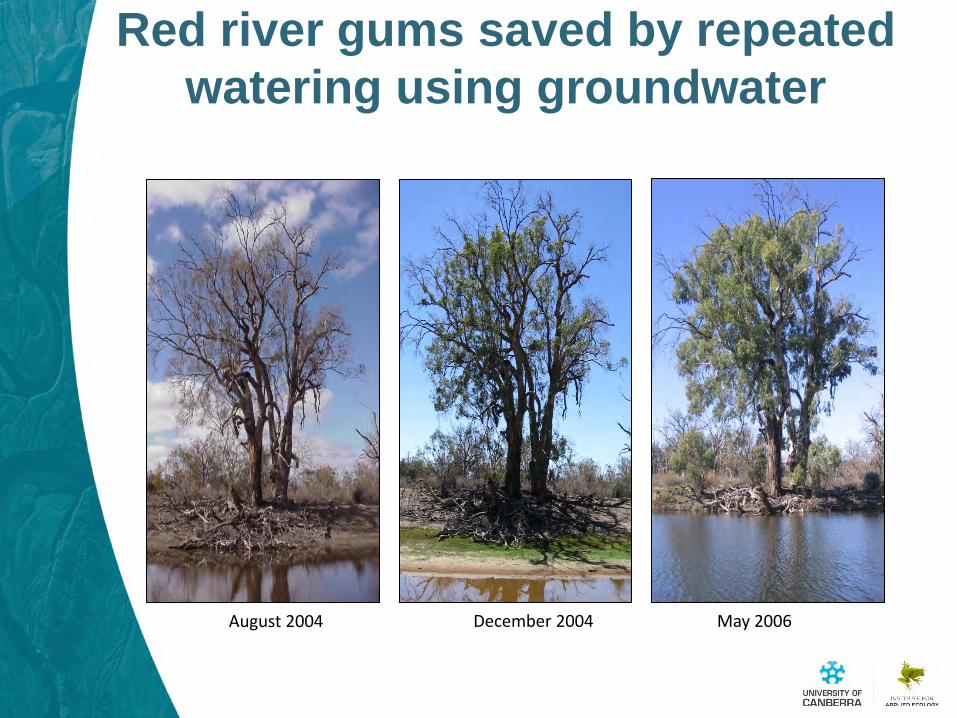
December 2004 May 2006 August 2004
Red river gums saved by repeated watering using groundwater
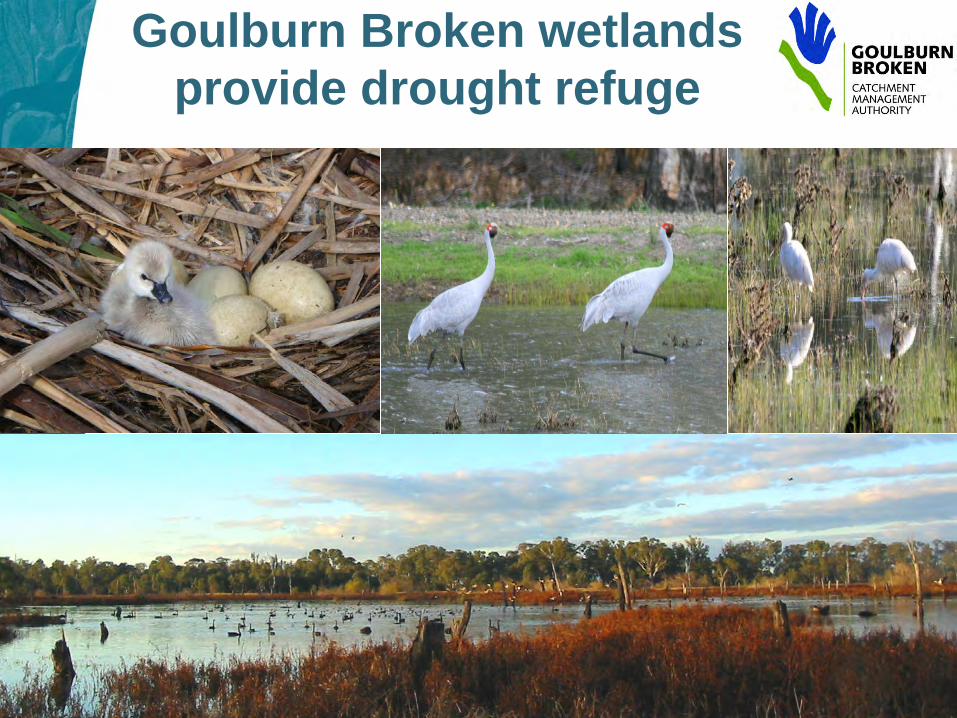
Goulburn Broken wetlands provide drought refuge
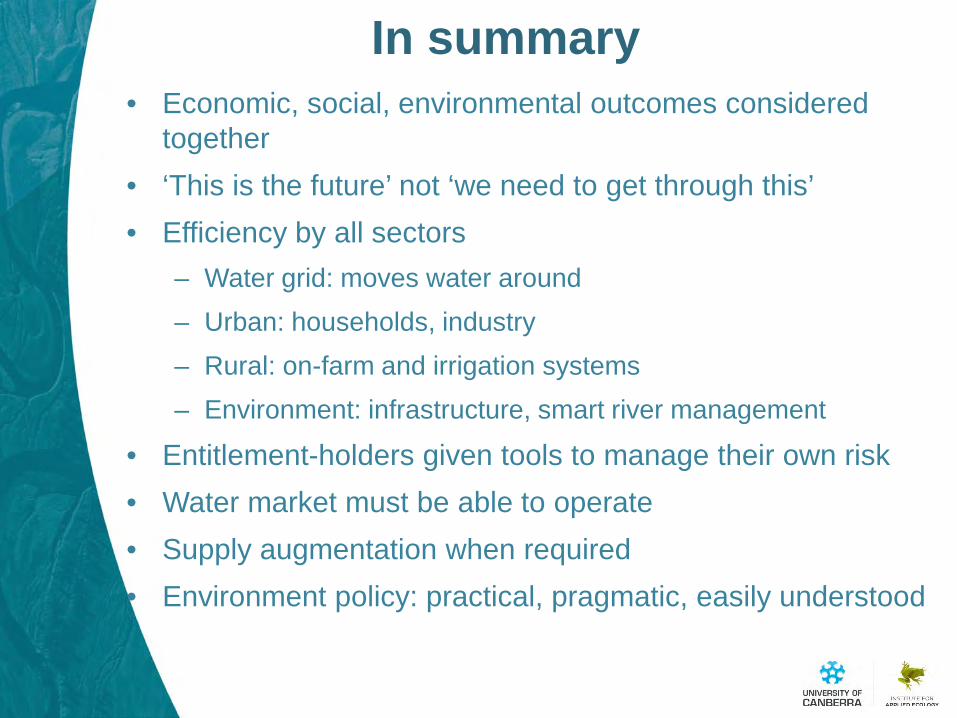
In summary • Economic, social, environmental outcomes considered
together • ‘This is the future’ not ‘we need to get through this’ • Efficiency by all sectors
– Water grid: moves water around – Urban: households, industry – Rural: on-farm and irrigation systems – Environment: infrastructure, smart river management
• Entitlement-holders given tools to manage their own risk • Water market must be able to operate • Supply augmentation when required • Environment policy: practical, pragmatic, easily understood
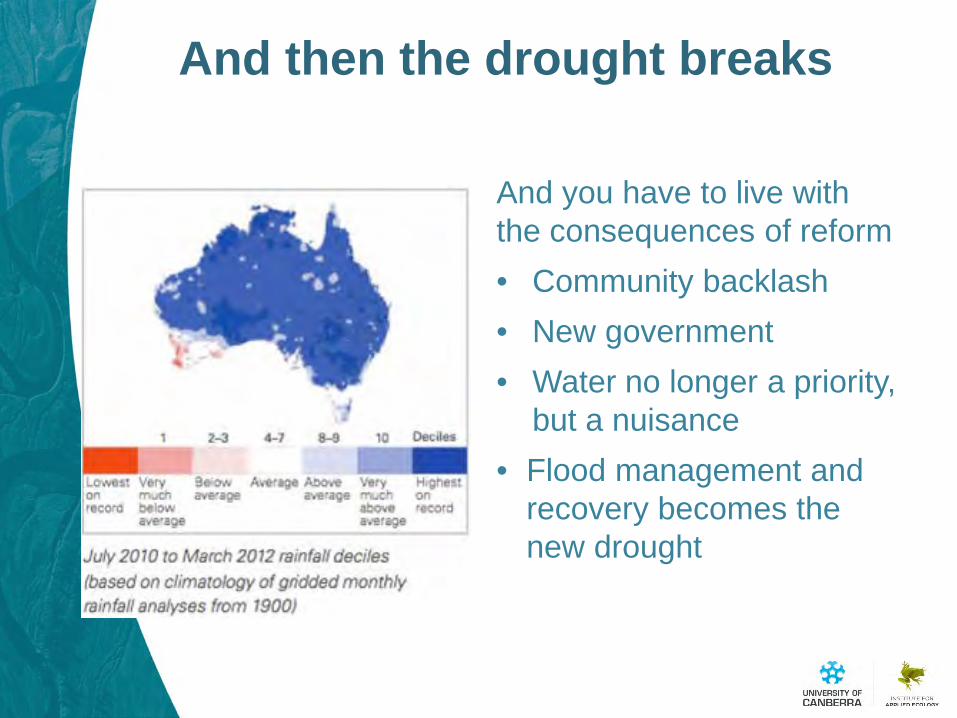
And then the drought breaks
And you have to live with the consequences of reform • Community backlash • New government • Water no longer a priority,
but a nuisance • Flood management and
recovery becomes the new drought