Embed Size (px)
Citation preview
CLONING AND BIOCHEMICAL CHARACTERIZATION OF CG16936, A PUTATIVE GLUTATHIONE TRANSFERASE IN
DROSOPHILA MELANOGASTER
TANUSYA MURALI
FACULTY OF SCIENCE
UNIVERSITY OF MALAYA KUALA LUMPUR
2013
CLONING AND BIOCHEMICAL CHARACTERIZATION OF CG16936, A PUTATIVE GLUTATHIONE TRANSFERASE IN
DROSOPHILA MELANOGASTER
TANUSYA MURALI
DISSERTATION SUBMITTED IN FULFILMENT OF THE REQUIREMENTS FOR THE DEGREE OF MASTER OF
SCIENCE
DEPARTMENT OF BIOLOGICAL SCIENCES FACULTY OF SCIENCE UNIVERSITI MALAYA
KUALA LUMPUR
2013
i
ABSTRACT
CG16936, which was classified as DmGSTE12 was studied in this project. This study
cloned and expressed CG16936 and the resulting recombinant CG16936 has been
reactive towards 1,2-dichloro-4-nitrobenze (DCNB) (0.4324 µmol/min/mg) but of no
activities towards, 1-chloro-2,4-nitrobenzene, trans-2-hexenal, p-nitrobenzyl chloride
(NBC), ethacryanic acid (EA), trans-4-phenyl-butene-2-one (PBO), hexa-2,4-dienal,
trans,trans-hepta-2,4-dienal, 1,2-epoxy-3-p-nitrophenoxy propane (EPNP),
bromosulfophthalein (BSP) and trans-oct-2-enal. In previous work, it was shown that
CG16936 was expressed in response to odorant treatment to fruit flies. Our work
investigated the direct contribution of the recombinant CG16936 towards conjugation of
odorants Glutathione (GSH). No evidence of conjugated product yielded when the
recombinant protein acted upon GSH and trans-2-hexenal on thin layer
chromatography. The absence of enzymatic activity hence suggested the inability of
CG16936 to conjugate t-2-hexenal to GSH. Upon exposure to benzaldehyde, expression
of CG16936 was demonstrated unchanged. The evidences suggested that CG16936
could have assumed other physiological function other than detoxification of odorant
and its direct involvement in oxidative stress.
ii
ABSTRAK
Kajian ini adalah CG16936, yang telah diklasifikasikan sebagai DmGSTE12. Kajian ini
telah mengklon dan mengekspreskan CG16936. Keputusan menunjukkan rekombinan
CG16936 adalah reaktif terhadap 1,2-dichloro-4-nitrobenze (DCNB) dengan aktiviti
spesifik sebanyak 0.4324 µmol/min/mg, namun tiada sebarang aktiviti ditunjukkan
terhadap 1-chloro-2,4-nitrobenzene (CDNB), trans-2-hexenal, p-nitrobenzyl chloride
(NBC), ethacryanic acid (EA), trans-4-phenyl-butene-2-one (PBO), hexa-2,4-dienal,
trans,trans-hepta-2,4-dienal, 1,2-epoxy-3-p-nitrophenoxy propane (EPNP),
bromosulfophthalein (BSP) dan trans-oct-2-enal. Dalam satu kajian yang terdahulu,
didapati Drosophila melanogaster telah mengekpres CG16936 sebagai gerakbalas
terhadap rawatan pengahbau. Dalam kajian ini, kami juga mengkaji sumbangan secara
langsung rekombinan CG16936 terhadap konjugasi dengan pengahbau Glutation
(GSH). Namun, apabila protein rekombinan bertindak balas dengan GSH dan t-2-
hexenal, tiada sebarang bukti yang menunjukkan produk konjugasi di atas lapisan
kromatografi nipis. Ketiadaan aktiviti oleh CG16936 terhadap t-2-hexenal
mencadangkan ketidakupayaanya untuk menghasilkan produk konjugasi dengan
substrat, t-2-hexenal dan GSH. Selain itu, pendedahan Drosophila melanogaster
terhadap benzaldehyde tidak mendorong atau mengekpres protein CG16936. Bukti yang
diperolehi mencadangkan CG16936 mungkin mempunyai fungsi fisiologi selain dari
penyahtoksik pengahbau dan penglibatan secara langsung dalam tekanan oksidatif.

iii
ACKNOWLEDGEMENT
I would like to express my utmost appreciation to my Principal investigator Dr.
Zazali for his guidance and invaluable advice throughout the years of my candidature. I
will be forever indebted to him for the knowledge he shared with me and working with
him was truly inspiring. Special thanks to my co-supervisor, Dr. Saiful for his advice on
the molecular part of this research.
This research would have not been possible without the support of many people.
Firstly my family members who were very supportive towards my research and
tolerated my absence all these years. The love I got from my family members were my
strength to move on when things don’t go as planned. A million thanks to all of you.
Next would be my laboratory mates of Lab E1.2 especially Nasuha and Kitha.
Thank you guys for all the amazing times, laughter and for lifting me up whenever i was
down. Besides the good times, it was nice sharing knowledge and exchanging ideas
which helped me a lot in my research. The years of carrying out this research was tough
but you guys definitely made it easier for me to endure.
Many thanks to members of Lab E1.1, Lab personnel from Third year
Biochemistry lab, Proteomics lab of Medical faculty, Genetics department of UM and
Prof. Alan Clark of University of Wellington for all the direct and indirect contribution
to the success of this research.
Finally, I dedicate this dissertation to my late grandmother, Rasamah whom I
lost a few months back. She was the one most eager to see me graduate; hence this is for
you Amayee. I hope I made you proud.
iv
List of Content
Pages
Abstract
i
Abstrak
ii
Acknowledgement
iii
List of Content
iv
List of Figures
viii
List of Tables
x
List of Abbreviations
xi
Introduction
1
Chapter 1: Literature review
2
1.1 GSTs and its roles
2
1.2 Gluthathione
10
1.3 Structure of GSTs
11
1.4 Classifications and nomenclature
16
1.5 Gene regulations
19
1.6 GST purification
22
1.7 Olfactory GSTs
23
1.8 CG16936
25
1.9 Drosophila melanogaster
27
1.10 Objectives
28
Chapter 2: Materials and method 29
2.0 Materials 29
2.0.1 Chemicals 29
2.0.2 Buffers
30
2.0.3 Kits
30
2.0.4 Columns/ matrice for purification
31
v
2.0.5 Equipments
31
2.0.6 Insects
32
2.1 Methodology
33
2.1.1 Total RNA extraction from Drosophila melanogaster 33
2.1.2 cDNA synthesis
33
2.1.3 Polymerase chain reaction (PCR)
34
2.1.4 Agarose gel electrophoresis of DNA
35
2.1.5 DNA extraction from agarose gel
35
2.1.6 Digestion with restriction enzymes
36
2.1.7 Ligation of digested PCR product and pET-30a(+)
37
2.1.8 Transformation with E.coli BL21(DE3) pLysS
37
2.1.9 Ligation of PCR product with pGEM-T vector.
38
2.1.10 Transformation with NovaBlue Singles™
Competent Cells
38
2.1.11 Plasmid extraction.
39
2.1.12 Digestion of ligated pGEM-T plasmid with restriction
enzymes
39
2.1.13 Cell culturing and lysis
40
2.1.14 Purification of recombinant CG16936
41
2.1.15 SDS-Polyacrylamide Gel (SDS-PAGE)
42
2.1.16 Bradford assay
43
2.1.17 Assay for GSTs
43
2.1.18 Thin layer chromatography
47
2.1.19 Drosophila exposure with/without odorant
48
Chapter 3 Results
49
3.1 RNA extraction
49
3.2 Polymerase chain reaction
50
vi
33.2.1 PCR gel image
51
3.3 Cloning of the PCR product
52
3.4 Plasmid purification
53
3.4.1 Sequencing results
53
3.4.2 Plasmid digestion
55
3.4.3 PCR using plasmid as template
56
3.5 Purification of recombinant CG16936
57
3.5.1 GSTrap™ HP and S-Hexylgluthatione
57
3.5.2 Sep-Pak C18
59
3.5.3 Superdex 75
60
3.5.4 HiPrep 16/60 Sephacryl S-200
61
3.5.5 HiTrap ANX FF
62
3.5.6 HiTrap DEAE FF
63
3.5.7 HisTrap™ FF Crude
64
3.5.8 S-2,4-(dinitrophenyl) GSH (DNP-SG)
65
3.5.9 Bromosulfophthalein GSH (BSP-SG)
66
3.5.10 Affi-Gel Blue Gel column
67
3.6 Substrate specificities
68
3.7 Thin layer chromatography
69
3.8 Exposure to odorant
70
Chapter 4 Discussion
71
4.1 Cloning and expression of CG16936
71
4.2 Purification of recombinant CG16936
76
4.3 Substrate specificities
85
4.4 Investigations of CG16936 as an olfactory GST
88
4.4.1 Exposure of Drosophila with odorant
88

vii
4.4.2 Conjugation of CG16936 with odorant substrate
90
Chapter 5 Conclusion
91
References
92
Appendices
105
viii
List of figures
Page
Figure 1.1: Activities of Cytochrome P450s, Microsomal epoxide
hydrolase and Glutathione S-transferase with three different xenobiotics
2
Figure 1.2: 4-HNE is metabolized through its conjugation by reaction
catalyzed by GST
5
Figure 1.3: Example functions catalyzed in the GST superfamily showing
reactions in which GSH is consumed by conjugation to the product.
9
Figure 1.4: Structure of glutathione
10
Figure 1.5: GST monomer (left) and dimer (right) showing N-terminal
thioredoxin-like domain in blue/cyan and the C-terminal all α-helical
domains in red. GSH is shown in dark grey to delineate the active site.
12
Figure 1.6: Active sites of S/C and Y-type GSTs
highlighting the extensive hydrogen bonding network
which anchors the glutathione tripeptide
14
Figure 1.7: Conjugation GST with the common substrates in the presence
of GSH
15
Figure 1.8: Drosophila melanogaster specimens
27
Figure 3.1: 1% Agarose gel electrophoresis image of PCR
51
Figure 3.2: Map of pET-30a(+) vector
52
Figure 3.3: Gel image of purified plasmids from 6 random colonies
53
Figure 3.4: Blast search tool results of the recombinant
CG16936
54
Figure 3.5: Expansion of Sequence ID: AE013599.4,
featuring GST E12 isoform A and C
54
Figure 3.6: Gel image showing the digestion of pET 30
55
Figure 3.7: Gel image of PCR performed using extracted plasmid as
template
56
Figure 3.8: SDS-PAGE of purification of CG16936 using GSTrap™ HP
58
Figure 3.9: SDS-PAGE of purification of CG16936 using S-Hexyl
glutathione
58
Figure 3.10: SDS-PAGE of purification of CG16936 using Sep-Pak C18 59
ix
List of figures (Cont.)
Figure 3.11: SDS-PAGE of purification of CG16936 using
Superdex 75
60
Figure 3.12: SDS-PAGE of purification of CG16936 using
Sephacryl S-200
61
Figure 3.13: SDS-PAGE of purification of CG16936 using Anion
Exchanger (HiTrap ANX FF)
62
Figure 3.14: SDS-PAGE of purification of CG16936 using
HiTrap DEAE FF
63
Figure 3.15: SDS-PAGE of purification of CG16936 using HisTrap™ FF
Crude
64
Figure 3.16: SDS-PAGE of purification of CG16936 using DNP-SG.
65
Figure 3.17: SDS-PAGE of purification of CG16936 using BSP-SG.
66
Figure 3.18: SDS-PAGE of purification of CG16936 using Affi-Gel Blue
Gel column
67
Figure 3.19: Progress of conjugating products for 20 minutes with DCNB
of the recombinant CG16936
69
Figure 3.20: T.L.C analysis of recombinant CG16936 conjugating activity
against DCNB and t-2-hexenal
69
Figure 3.21: Progress of conjugating products for 20 minutes with DCNB
comparing exposed and non-exposed Drosophila
70
Figure 4.1: Patterns of alternative splicing. Constitutive sequences present
in all final mRNAs are gray boxes. Alternative RNA segments that may or
may not be included in the mRNA are hatched boxes
73
x
List of Tables
Page
Table 2.1: Forward primer and reverse primer used for the
amplification CG16936
34
Table 2.2: Summary of columns and buffers used.
41
Table 2.3: SDS-PAGE gel formulations
43
Table 3.1: Gene sequence of CG16936 aligned with forward and reverse
primers
50
Table 3.2: Substrates specificity of recombinant CG16936
68
Table 4.1: Summary of different properties and chromatography techniques
76
Table 4.2: Summary of the recombinant CG16936
purification
84
xi
List of abbreviations and symbols
GST Glutathione transferase
GSH Glutathione
CDNB 1,chloro-2,4-dinitrobenzene
DCNB 1,2-dichloro-4-nitrobenzene.
PCR Polymerase chain reaction
BLAST Basic local alignment search tool
SDS-PAGE Sodium Dodecyl Sulphate polyacrylamide gel electrophoresis
BSA Bovine Serum Albumin
DNA Deoxyribonucleic acid
RNA Ribonucleic acid
cDNA Complementary Deoxyribonucleic acid
DEPC Diethylpyrocarbonate
kb kilobase
bp Base pair
LB Luria Bertani
E.Coli Escherichia coli
IPTG Isopropyl β-D-1- thiogalactopyranoside
rpm Revolutions per minute
FPLC Fast protein liquid chromatography
t.l.c Thin layer chromatography
ºC Degree Celsius
kDa kilo Dalton
INTRODUCTION
Living organisms mainly insects such as Drosophila are exposed to many
different compounds such as insecticides, pesticides, toxicants and carcinogens mainly
through pests control programs and harmful toxic compounds that are produced by
plant, fungal toxins (e.g. plant phenols and aflatoxins) and reactive oxygen species. It is
important that these organisms have ability to survive the threat posed by endogenous
compound or by exogenous compounds in order to adapt to the environment (Hayes and
McLellan, 1999). Most of these toxic compounds are able to bind and alter the structure
of nucleic acids, lipids and proteins (Chasseaud, 1979). All living things pose a group of
enzymes that are known as detoxification enzyme in order to neutralise the effect of
these toxic compounds (Habig and Jakoby, 1980).
Glutathione S-transferase, recently classified as glutathione transferases (GSTs;
EC 2.5.1.18) comprises a wide range of enzymes that is found plentiful in almost all
living things such as bacteria, mammals, plants, insects, helminthes and yeast (Sheehan
et al., 2001). GSTs in mammals are well studied because it has been found to be
associated with its resistance with drugs and in cancer epidemiology (Tew, 1994; Hayes
and Pulford, 1995). This group of enzymes are said to be involved in the phase II
detoxification. It catalyses the conjugation of glutathione to the hydrophilic centre of the
toxic compounds such as insecticides, drugs and endogenous toxic substrates that is
present in the organism (Ding et al., 2003; Enayati et al., 2005)
1
CHAPTER 1: LITERATURE REVIEW
1.1 GSTs and its roles.
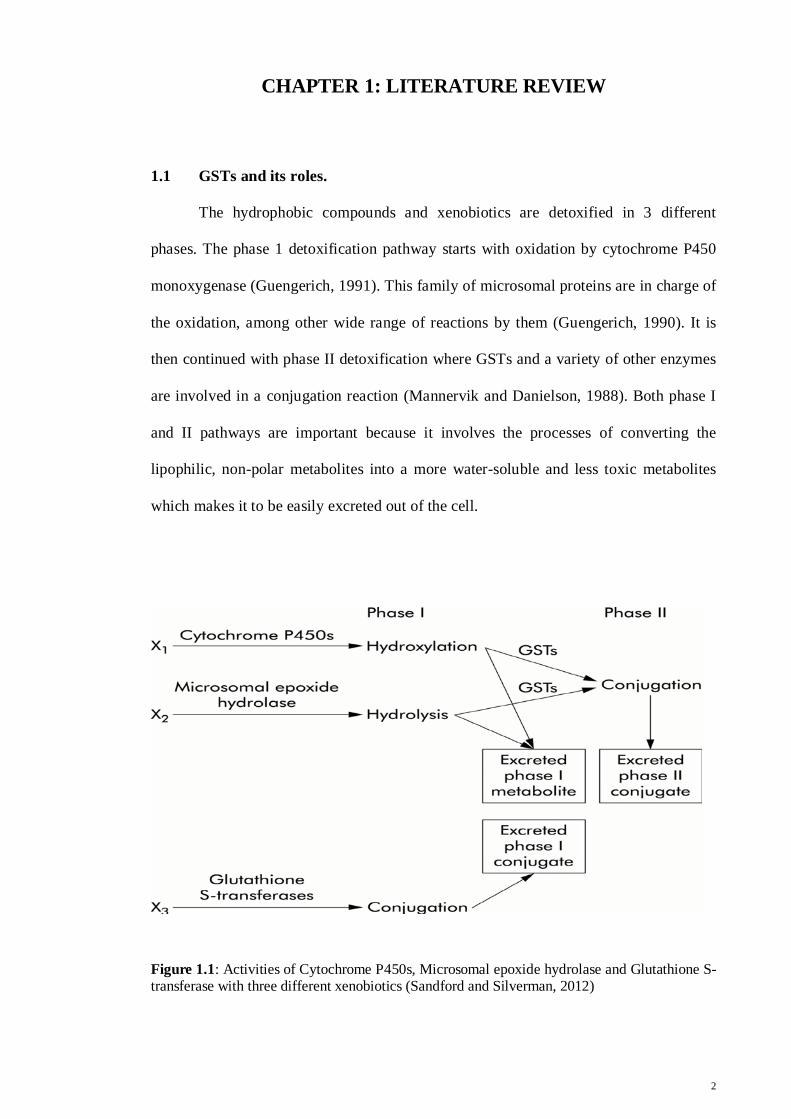
The hydrophobic compounds and xenobiotics are detoxified in 3 different
phases. The phase 1 detoxification pathway starts with oxidation by cytochrome P450
monoxygenase (Guengerich, 1991). This family of microsomal proteins are in charge of
the oxidation, among other wide range of reactions by them (Guengerich, 1990). It is
then continued with phase II detoxification where GSTs and a variety of other enzymes
are involved in a conjugation reaction (Mannervik and Danielson, 1988). Both phase I
and II pathways are important because it involves the processes of converting the
lipophilic, non-polar metabolites into a more water-soluble and less toxic metabolites
which makes it to be easily excreted out of the cell.
Figure 1.1: Activities of Cytochrome P450s, Microsomal epoxide hydrolase and Glutathione S-transferase with three different xenobiotics (Sandford and Silverman, 2012)
2
The most important part of detoxification by GSTs are their ability to conjugate
glutathione with a wide range of hydrophobic compound (Armstrong, 1997) which
plays a crucial role in cell survival. For this purpose GSTs are present is almost all
organisms and has been classified into at least 10 different classes which is done based
on its structure (tertiary and quaternary), sequence similarity, immunological properties
and substrate specificity (Sheehan et al., 2001). Each isozyme has unique catalytic
activity although it shows to have a broad range of substrate specificities.
Basically, the capacity of GSTs to conjugate the thiol group of the cysteine from
the reduced GSH to a wide range of electrophiles and the affinity to bind to various
hydrophobic compounds. As a result, the solubility of the compounds are increased,
hence helps in the excretion process (Lumjuan et al., 2007)
Reduced glutathione are used as a cofactor instead of a conjugate by some GSTs
to catalyze a dehydrochlorination reaction (Clark and Shamaan, 1984). GSTs are also
found to be involved in the transportation of drugs, hormones and other metabolites
through its ability to bind a hydrophobic compound that are not its substrate. This also
helps with the storage and sequestration process (Hayes and Pulford, 1995).
Besides that, the activation of a stress response mechanism can also be
associated with the changes in GST levels (Wilhelm et al., 1997). The cellular
glutathione levels are said to be altered as a step to protect the cells against oxidative
stress and electrophiles (Hayes and Pulford, 1995). In addition to that, when cells are
going through oxidative stress, the GSTs are said to exhibit the glutathione peroxidise
activity which can be associated with various physiological roles such as signal
transduction, apoptosis, differentiation and cell proliferation (Ketterer et al., 2001).
3
Furthermore, many proteins which have a GST like domains in their structure
are associated with other roles such as in protein assembly and folding (Blocki et al.,
1992; Koonin et al., 1994). The resistance of various anticancer agents and chemical
carcinogens has been associated with the over expression of GSTs in mammalian
tumour cells (Hayes and Pulford, 1995).
Wide range of GSTs has been found to be involved in various physiological
roles. For example, the ability of the Omega class GST to regulate the Ca2+ channel
activity of the ryanodine receptor which helps to protect cells from apoptosis that is
induced by Ca2+ (Dulhunty et al., 2001). The Bcl-2 family member, the Bax protein has
known to regulate the programmed cell death by promoting apoptosis. The Theta class
GST has been identified as a Bax-interacting protein because of its role in the regulation
of the apoptotic cell death (Kampranis et al., 2000; Fesik, 2001). On the other hand,
GSTP1-1 has been found to be expressed at high level in tumours which is important in
the diagnosis of cancer and its therapy (Sato, 1989). Besides that, this has been found to
be helpful to monitor the development of drug resistance in patients who are being
treated with chemotherapy (Hamada et al., 1994).
Not only the roles of GSTs differ among different classes, in fact it differs
among different isozyme of the same class. The GSTA4-4 is said to be involved in
defending against the product of cell membranes that generates harmful compounds.
High activity was observed with 4-hydroxynonenal (4-HNE), which is a product of lipid
peroxidation unlike the other Alpha class GSTs (Bruns et al., 1999) whereas the
GSTA3-3 is responsible to catalyze the double bond of isomerisation of 5-androstene-
3,17-dione (precursor to testosterone) and 5-pregnene-3,20-dione (precursor to
4
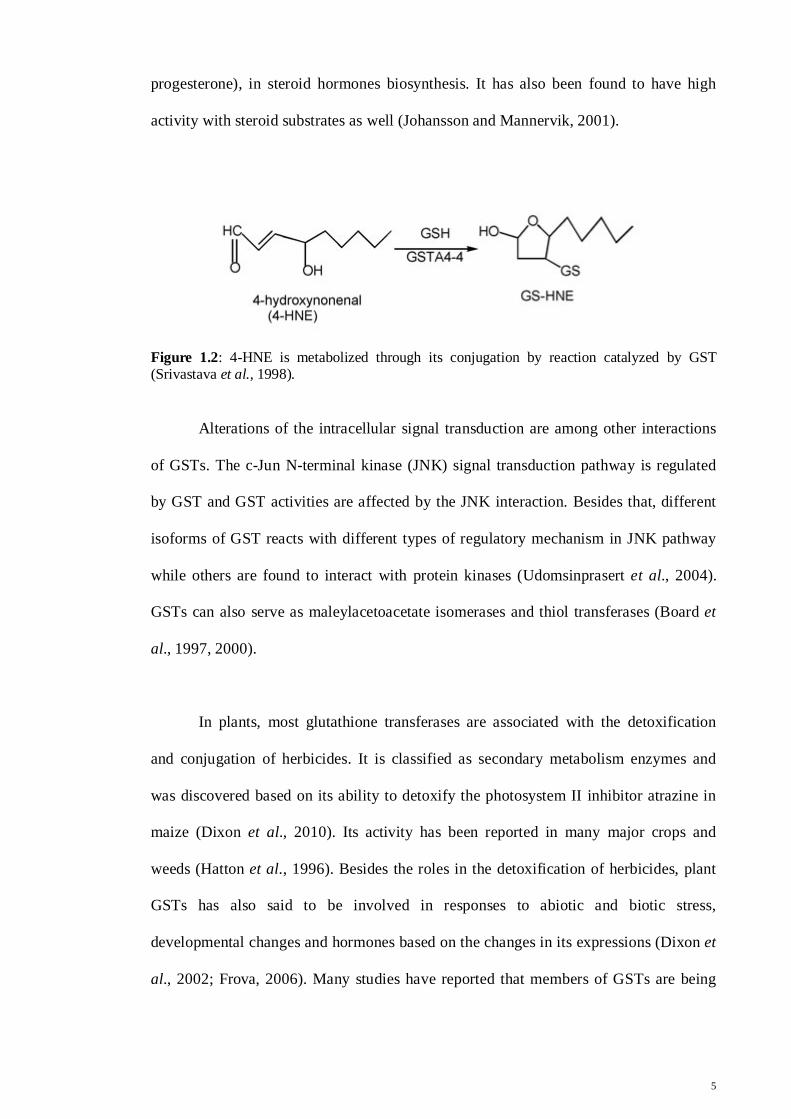
progesterone), in steroid hormones biosynthesis. It has also been found to have high
activity with steroid substrates as well (Johansson and Mannervik, 2001).
Figure 1.2: 4-HNE is metabolized through its conjugation by reaction catalyzed by GST (Srivastava et al., 1998).
Alterations of the intracellular signal transduction are among other interactions
of GSTs. The c-Jun N-terminal kinase (JNK) signal transduction pathway is regulated
by GST and GST activities are affected by the JNK interaction. Besides that, different
isoforms of GST reacts with different types of regulatory mechanism in JNK pathway
while others are found to interact with protein kinases (Udomsinprasert et al., 2004).
GSTs can also serve as maleylacetoacetate isomerases and thiol transferases (Board et
al., 1997, 2000).
In plants, most glutathione transferases are associated with the detoxification
and conjugation of herbicides. It is classified as secondary metabolism enzymes and
was discovered based on its ability to detoxify the photosystem II inhibitor atrazine in
maize (Dixon et al., 2010). Its activity has been reported in many major crops and
weeds (Hatton et al., 1996). Besides the roles in the detoxification of herbicides, plant
GSTs has also said to be involved in responses to abiotic and biotic stress,
developmental changes and hormones based on the changes in its expressions (Dixon et
al., 2002; Frova, 2006). Many studies have reported that members of GSTs are being
5
expressed selectively in response to environmental stress and cell division (Marrs, 1996;
Moons, 2005).
The involvement of GSTs has also been observed in the synthesis of sulphur-
containing secondary metabolites such as volatiles and glucosinolates, and the
conjugation, transport and storage of reactive oxylipins, phenolics and flavonoids
(Dixon et al., 2010).
There also has been increasing evidence showing that GSTs are involved in
various external stress responses. The expressions of GST genes in plants are stimulated
by these external stress responses such as hydrogen peroxide, heat, toxic chemicals and
dehydration (Marrs, 1996; Fujita and Hossain, 2003). The stress-related hormones, for
example the ethylene (Zhou and Goldsbrough, 1993), abscisic acid (Dixon et al., 1998)
and salicyclic acid (Wagner et al., 2002) are influenced by GST expressions. The
catalysis of anthocyanins production, are examples of other roles played by the plant
GST (Marrs, 1996; Sheehan et al., 2001). Many transgenic plants have demonstrated
the roles of GSTs in stress responses. For example, salt resistance of transgenic tomato
seedlings is promoted by the over expressions of GST (Roxas, 1997). Besides that, the
capability of plants to endure high or low temperature and high salt concentration are
said to be enhanced by the over expressions of GSTs in rice (Takesawa et al., 2002) and
tobacco (Roxas, 1997).
In insects, the GSTs are mainly responsible for the insecticides resistance (for
example DDT), which targets the nervous and results the death of larvaes during life
stages transition (Enayati et al., 2005; Low et al., 2007). The most important part of
DDT detoxification would be the dehydrochlorination which is catalysed by GSTs.
6
Although no conjugation was observed of DDT with glutathione, the glutathione has
been found to be an important cofactor in this reaction. The active site of the GST
generates the thiolate anion which acts as a general base and a hydrogen atom is
extracted from DDT which then eliminates the chlorine and generates DDE (Clark and
Shamaan, 1984). However, lindane which is an organochlorine insecticide is detoxified
by the conjugation to glutathione.
Besides organochlorines, GSTs are also found to be involved in the resistance of
organophosphate (Hayes and Wolf, 1988). Two distinct pathways are responsible in its
detoxification that results from the conjugation of glutathione to organophosphate
insecticides. The first path is the O-dealkylation where the glutathione conjugates with
the alkyl portion of the insecticides, for example the tetrachlorvinphos in resistant
houseflies (Oppenoorth et al., 1979) while the second path is known as the O-
dearylation where the leaving group reacts with glutathione. For example is the methyl
parathion and parathion detoxification that happens in the diamondback moth Plutella
xylostella (Chiang and Sun, 1993).
GSTs have also been found to interact with pyrethroids. Although metabolism of
pyrethroid insecticides by GSTs has not been detected, there is evidence that GSTs may
contribute to pyrethroid resistance in several ways. A study on the defence mechanism
of Tenebrio Molitor against pyrethroids revealed that the molecule of GST binds
pyrethroid insecticides in a sequestering mechanism adding to the defence of the
organism either as a passive way of detoxification or as a facilitating one
(Kostaropoulos et al., 2001).
7
The second contribution would be through GST’s protective role in oxidative
stress, with this oxidative stress being a by-product of pyrethroid toxicity (Vontas et al.,
2001). Another recent study also reported that the Omega class GST from the
lepidopteran silkworm moth, Bombyx mori, may also be contributing to resistance by
binding pyrethroid as well as having a role in oxidative stress response (Yamamoto et
al., 2009).
Some GSTs are also said to be involved in lipid peroxidation. The Sigma class
GST, namely DmGSTS1-1 were found to have high activity with 4-hyroxynonenal (4-
HNE) but has no activity with towards the universal GST substrate 1-chloro-2,4-
dinitrobenzene (CDNB). The 4-HNE has shown to be cytotoxic and found to be
associated in the etiology of various degenerative diseases at higher levels. It is an
electrophilic aldehyde that is derived from the lipid peroxidation and to have role in cell
signalling (Singh et al., 2001).
This enzyme has been suggested to have protective role related to oxidative
stress because of its high abundance in the adult Drosophila, where its localization in
tissues that are highly aerobic, for example the flight muscle and its sensitivity to
oxidative damage. This kind of function is somewhat same to the Alpha class GSTs
from mammals (Singh et al., 2001).
8
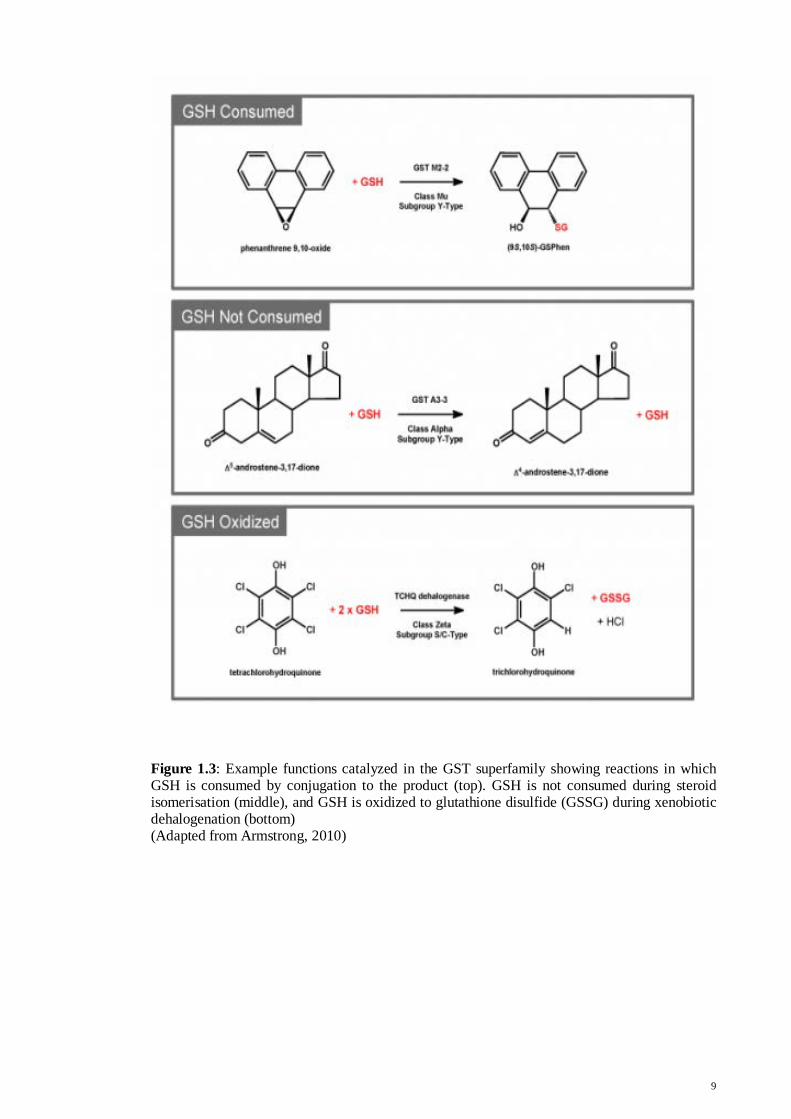
Figure 1.3: Example functions catalyzed in the GST superfamily showing reactions in which GSH is consumed by conjugation to the product (top). GSH is not consumed during steroid isomerisation (middle), and GSH is oxidized to glutathione disulfide (GSSG) during xenobiotic dehalogenation (bottom) (Adapted from Armstrong, 2010)
9
1.2 Glutathione
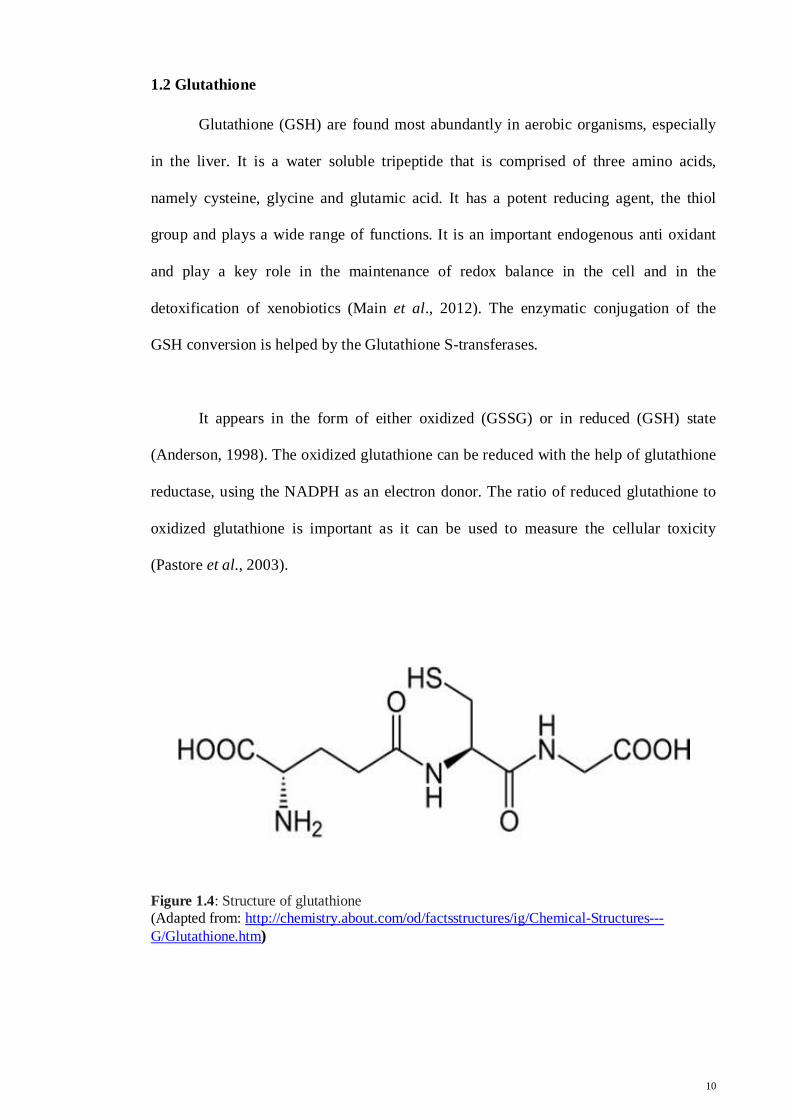
Glutathione (GSH) are found most abundantly in aerobic organisms, especially
in the liver. It is a water soluble tripeptide that is comprised of three amino acids,
namely cysteine, glycine and glutamic acid. It has a potent reducing agent, the thiol
group and plays a wide range of functions. It is an important endogenous anti oxidant
and play a key role in the maintenance of redox balance in the cell and in the
detoxification of xenobiotics (Main et al., 2012). The enzymatic conjugation of the
GSH conversion is helped by the Glutathione S-transferases.
It appears in the form of either oxidized (GSSG) or in reduced (GSH) state
(Anderson, 1998). The oxidized glutathione can be reduced with the help of glutathione
reductase, using the NADPH as an electron donor. The ratio of reduced glutathione to
oxidized glutathione is important as it can be used to measure the cellular toxicity
(Pastore et al., 2003).
Figure 1.4: Structure of glutathione (Adapted from: http://chemistry.about.com/od/factsstructures/ig/Chemical-Structures---G/Glutathione.htm)
10
1.3 Structure of GSTs
The discovery of a catalytic activity for the addition of glutathione (GSH) to 1,
2-dichloro-4-nitrobenzene in cytosolic extracts of liver in 1961 initiated the increasing
interest in the genetics and enzymology of the glutathione tranferases culminating in the
elucidation of the three-dimensional structures of several cytosolic isozymes. The
structural information is important for our understanding of the catalytic mechanisms of
the GSTs, evolution of the protein fold and molecular basis for their involvement in
detoxification endogenous and xenobiotic electrophiles. The mammalian cytosolic
GSTs (The alpha-, Mu- and pi-class) were among the first to be structurally
characterized because of their relevance to toxicology, cancer and drug metabolism.
The GST enzymes are large family of enzymes where the loci encoding the gene
have been found on at least seven chromosomes (Strange et al., 2001). Cytosolic GSTs
(soluble) consist of two subunits forming either identical (homodimers) or non-identical
(heterodimers) and are approximately 23-28 kDa in size. This hybridizing is strictly
with subunits from the same class. Large numbers of enzymes are formed by the
formation of homo- and hetero-dimers from just a limited number of genes. This
random dimer formation is also found to happen post translationally as well (Hayes and
Pulford, 1995).
The structural interactions of the subunits are very important especially for the
stability and dimer assembly, which is why it is class-specific. These findings explained
by the availability of crystal structure from the main classes. The novel GST classes
were defined by the unusual architecture at the interface between subunit (Board et al.,
2000; Rossjohn et al., 1998; Ji et al., 1995).
11
Each GST subunit contains a specific glutathione binding site, which known as
the G-site and the non specific electrophilic ligand binding site (H-site) which is found
to be adjacent to each other. Each monomer has polypeptide chains that folds into 2
domains and are joined together by a variable linker region. The polypeptides fold in a
very similar way between classes although the amino acid sequence identity is low.
Each class, however, still possess a very unique property among them, especially at the
C-terminus (Dirr et al., 1994; Wilce and Parker, 1994).
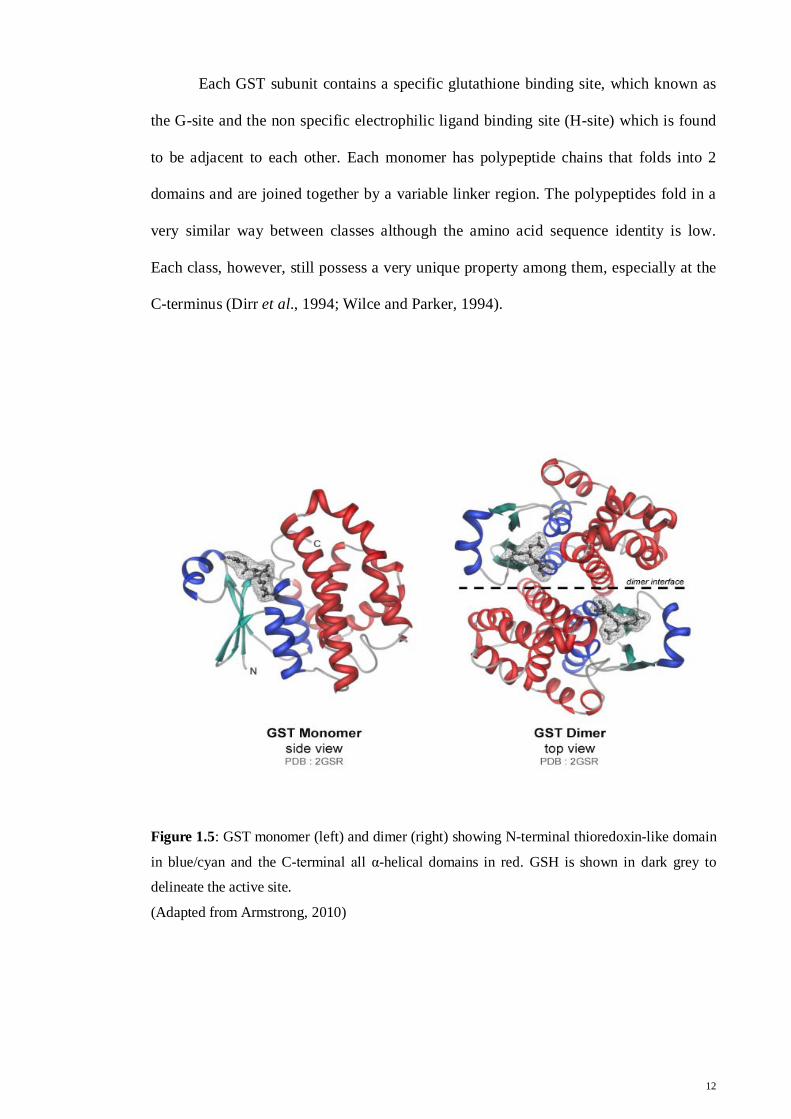
Figure 1.5: GST monomer (left) and dimer (right) showing N-terminal thioredoxin-like domain
in blue/cyan and the C-terminal all α-helical domains in red. GSH is shown in dark grey to
delineate the active site.
(Adapted from Armstrong, 2010)
12
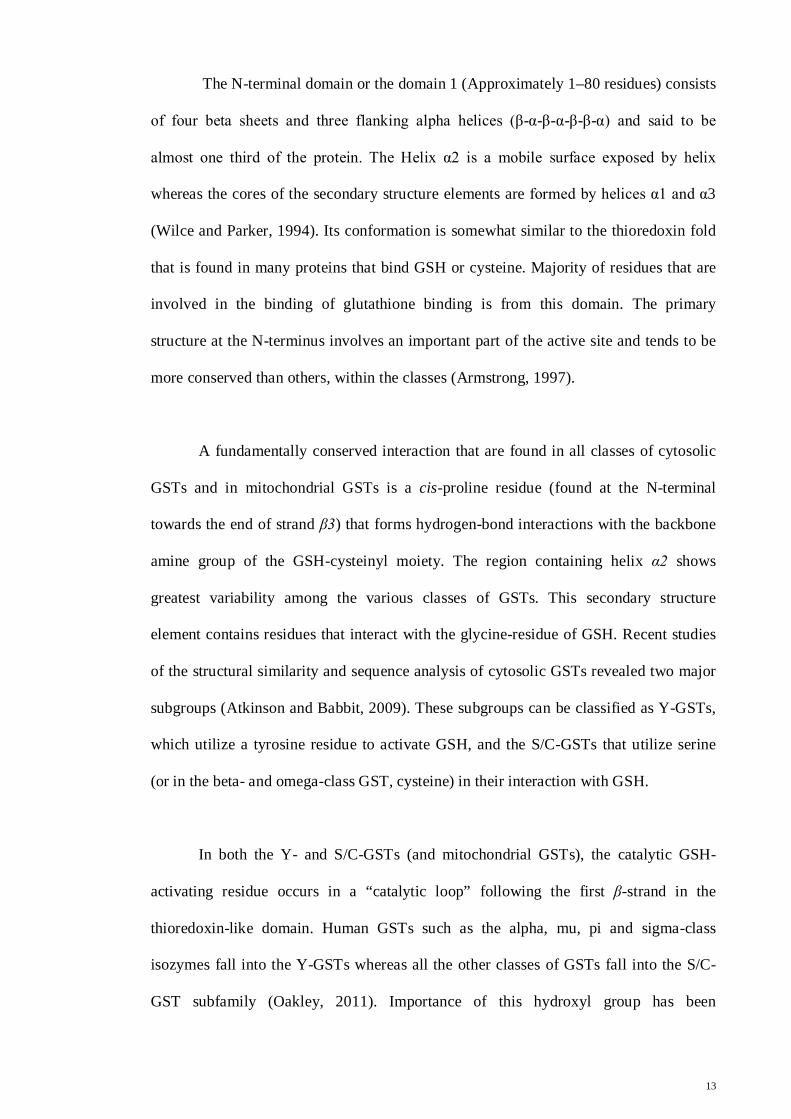
The N-terminal domain or the domain 1 (Approximately 1–80 residues) consists
of four beta sheets and three flanking alpha helices (β-α-β-α-β-β-α) and said to be
almost one third of the protein. The Helix α2 is a mobile surface exposed by helix
whereas the cores of the secondary structure elements are formed by helices α1 and α3
(Wilce and Parker, 1994). Its conformation is somewhat similar to the thioredoxin fold
that is found in many proteins that bind GSH or cysteine. Majority of residues that are
involved in the binding of glutathione binding is from this domain. The primary
structure at the N-terminus involves an important part of the active site and tends to be
more conserved than others, within the classes (Armstrong, 1997).
A fundamentally conserved interaction that are found in all classes of cytosolic
GSTs and in mitochondrial GSTs is a cis-proline residue (found at the N-terminal
towards the end of strand β3) that forms hydrogen-bond interactions with the backbone
amine group of the GSH-cysteinyl moiety. The region containing helix α2 shows
greatest variability among the various classes of GSTs. This secondary structure
element contains residues that interact with the glycine-residue of GSH. Recent studies
of the structural similarity and sequence analysis of cytosolic GSTs revealed two major
subgroups (Atkinson and Babbit, 2009). These subgroups can be classified as Y-GSTs,
which utilize a tyrosine residue to activate GSH, and the S/C-GSTs that utilize serine
(or in the beta- and omega-class GST, cysteine) in their interaction with GSH.
In both the Y- and S/C-GSTs (and mitochondrial GSTs), the catalytic GSH-
activating residue occurs in a “catalytic loop” following the first β-strand in the
thioredoxin-like domain. Human GSTs such as the alpha, mu, pi and sigma-class
isozymes fall into the Y-GSTs whereas all the other classes of GSTs fall into the S/C-
GST subfamily (Oakley, 2011). Importance of this hydroxyl group has been
13
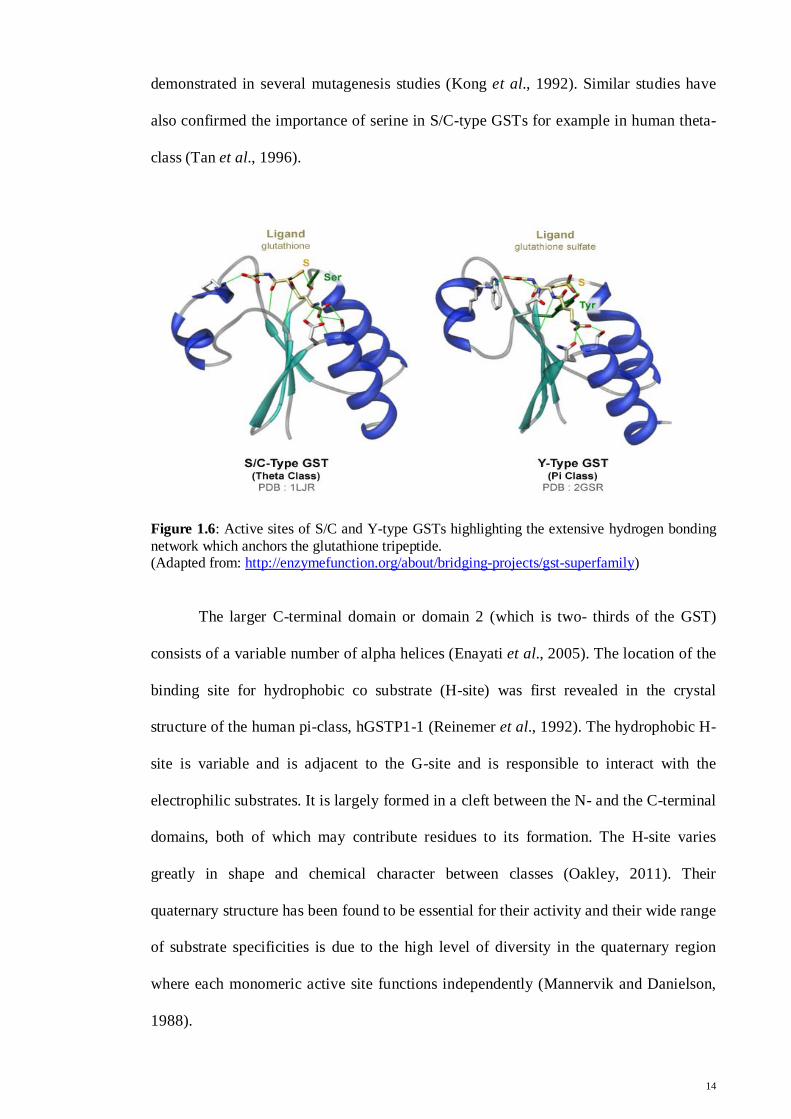
demonstrated in several mutagenesis studies (Kong et al., 1992). Similar studies have
also confirmed the importance of serine in S/C-type GSTs for example in human theta-
class (Tan et al., 1996).
Figure 1.6: Active sites of S/C and Y-type GSTs highlighting the extensive hydrogen bonding network which anchors the glutathione tripeptide. (Adapted from: http://enzymefunction.org/about/bridging-projects/gst-superfamily)
The larger C-terminal domain or domain 2 (which is two- thirds of the GST)
consists of a variable number of alpha helices (Enayati et al., 2005). The location of the
binding site for hydrophobic co substrate (H-site) was first revealed in the crystal
structure of the human pi-class, hGSTP1-1 (Reinemer et al., 1992). The hydrophobic H-
site is variable and is adjacent to the G-site and is responsible to interact with the
electrophilic substrates. It is largely formed in a cleft between the N- and the C-terminal
domains, both of which may contribute residues to its formation. The H-site varies
greatly in shape and chemical character between classes (Oakley, 2011). Their
quaternary structure has been found to be essential for their activity and their wide range
of substrate specificities is due to the high level of diversity in the quaternary region
where each monomeric active site functions independently (Mannervik and Danielson,
1988).
14
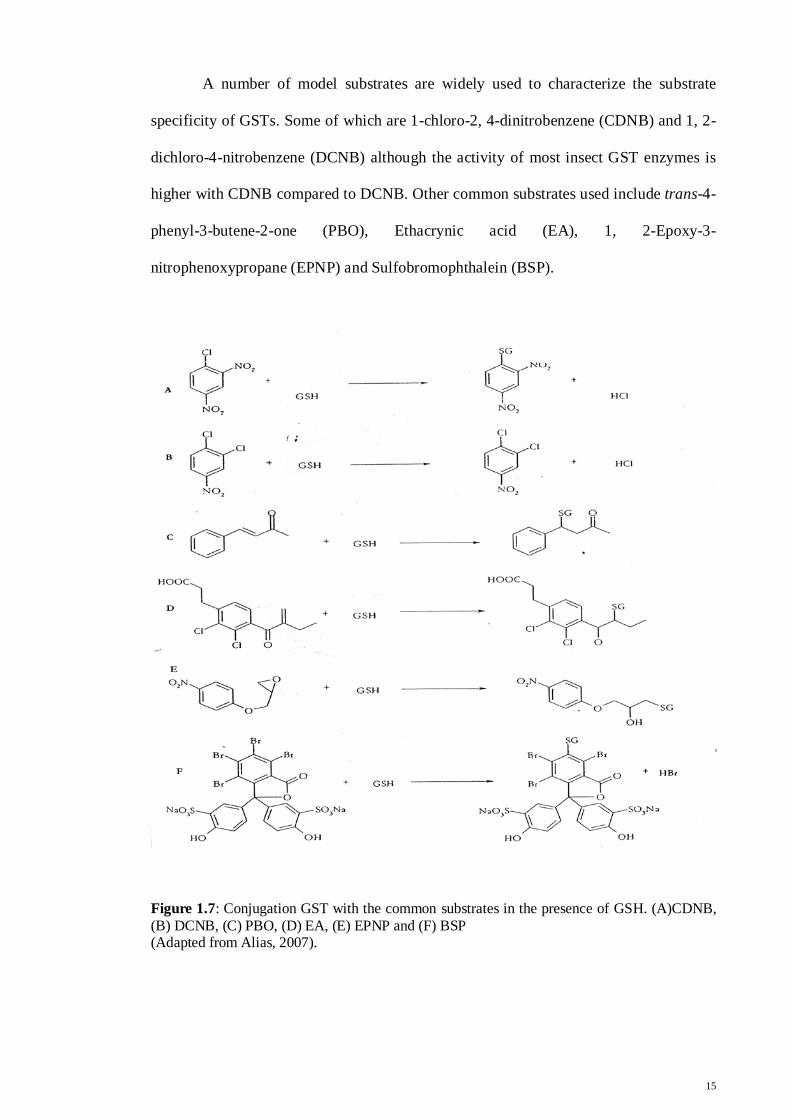
A number of model substrates are widely used to characterize the substrate
specificity of GSTs. Some of which are 1-chloro-2, 4-dinitrobenzene (CDNB) and 1, 2-
dichloro-4-nitrobenzene (DCNB) although the activity of most insect GST enzymes is
higher with CDNB compared to DCNB. Other common substrates used include trans-4-
phenyl-3-butene-2-one (PBO), Ethacrynic acid (EA), 1, 2-Epoxy-3-
nitrophenoxypropane (EPNP) and Sulfobromophthalein (BSP).
Figure 1.7: Conjugation GST with the common substrates in the presence of GSH. (A)CDNB, (B) DCNB, (C) PBO, (D) EA, (E) EPNP and (F) BSP (Adapted from Alias, 2007).
15
1.4 Classifications and nomenclature
The GST enzyme super family are a wide group of enzymes that has been
subdivided into a number of classes and subclasses based on a few criterias such as
amino acid or nucleotide sequence similarity, immunological, kinetic and tertiary or
quaternary structural properties (Sheehan et al., 2001).
Three main groups of GSTs have been identified to date according to their
location within the cell. The first group will be the microsomal GSTs (also known as
membrane –associated proteins in eicosanoid and glutathione metabolism (MAPEG)
(Jakobsson et al., 1999; Sheehan et al., 2001). The microsomal GSTs are trimeric,
membrane bound protein. Structurally, the microsomal GST is very different from the
cytosolic GST. However, both group of GSTs catalyse similar reactions (Gakuta and
Toshiro, 2000; Prabhu et al., 2001). Three microsomal GST genes were found in
mosquito Anopheles gambiae while a single microsomal GST gene was found in fruit
fly Drosophila melanogaster (Toba and Aigaki, 2000; Ranson et al., 2002).
The second group of GSTs will be the mitochondrial GSTs. This group of GSTs
has been classified as kappa class and is found in the mammalian mitochondria and
peroxisomes (Morel et al., 2004; Lander et al., 2004). This group of GST are
structurally very different from the microsomal and cytosolic GSTs (Robinson et al.,
2004). Most mitochondrial GSTs identified are from rat and human but none was
detected in the insect species to date.
16
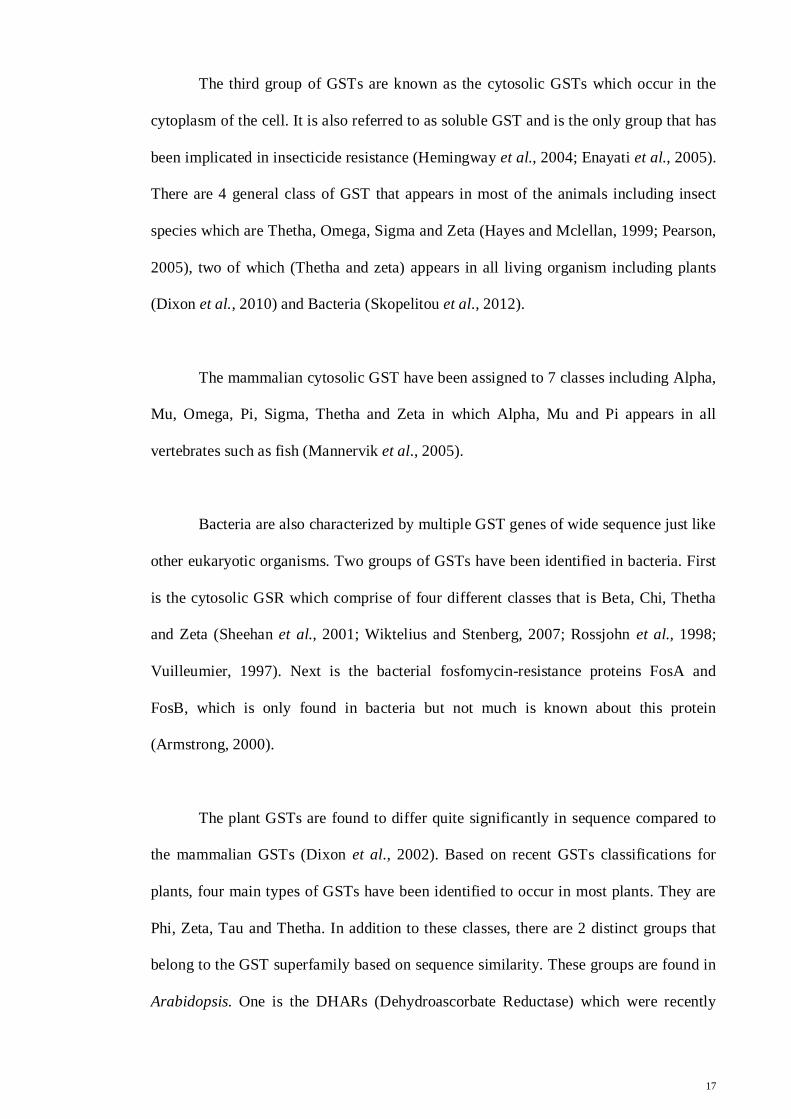
The third group of GSTs are known as the cytosolic GSTs which occur in the
cytoplasm of the cell. It is also referred to as soluble GST and is the only group that has
been implicated in insecticide resistance (Hemingway et al., 2004; Enayati et al., 2005).
There are 4 general class of GST that appears in most of the animals including insect
species which are Thetha, Omega, Sigma and Zeta (Hayes and Mclellan, 1999; Pearson,
2005), two of which (Thetha and zeta) appears in all living organism including plants
(Dixon et al., 2010) and Bacteria (Skopelitou et al., 2012).
The mammalian cytosolic GST have been assigned to 7 classes including Alpha,
Mu, Omega, Pi, Sigma, Thetha and Zeta in which Alpha, Mu and Pi appears in all
vertebrates such as fish (Mannervik et al., 2005).
Bacteria are also characterized by multiple GST genes of wide sequence just like
other eukaryotic organisms. Two groups of GSTs have been identified in bacteria. First
is the cytosolic GSR which comprise of four different classes that is Beta, Chi, Thetha
and Zeta (Sheehan et al., 2001; Wiktelius and Stenberg, 2007; Rossjohn et al., 1998;
Vuilleumier, 1997). Next is the bacterial fosfomycin-resistance proteins FosA and
FosB, which is only found in bacteria but not much is known about this protein
(Armstrong, 2000).
The plant GSTs are found to differ quite significantly in sequence compared to
the mammalian GSTs (Dixon et al., 2002). Based on recent GSTs classifications for
plants, four main types of GSTs have been identified to occur in most plants. They are
Phi, Zeta, Tau and Thetha. In addition to these classes, there are 2 distinct groups that
belong to the GST superfamily based on sequence similarity. These groups are found in
Arabidopsis. One is the DHARs (Dehydroascorbate Reductase) which were recently
17
found in other plants as well (Jakobsson et al., 1999) and a new lambda class GSTs
(Droog, 1997; Wongsantichon and Ketterman, 2005). These group enzymes differ from
other plant GSTs by being monomeric and plant specific. Finally, some genes encoding
the microsomal GSTs have been identified in plants (Dixon et al., 2002).
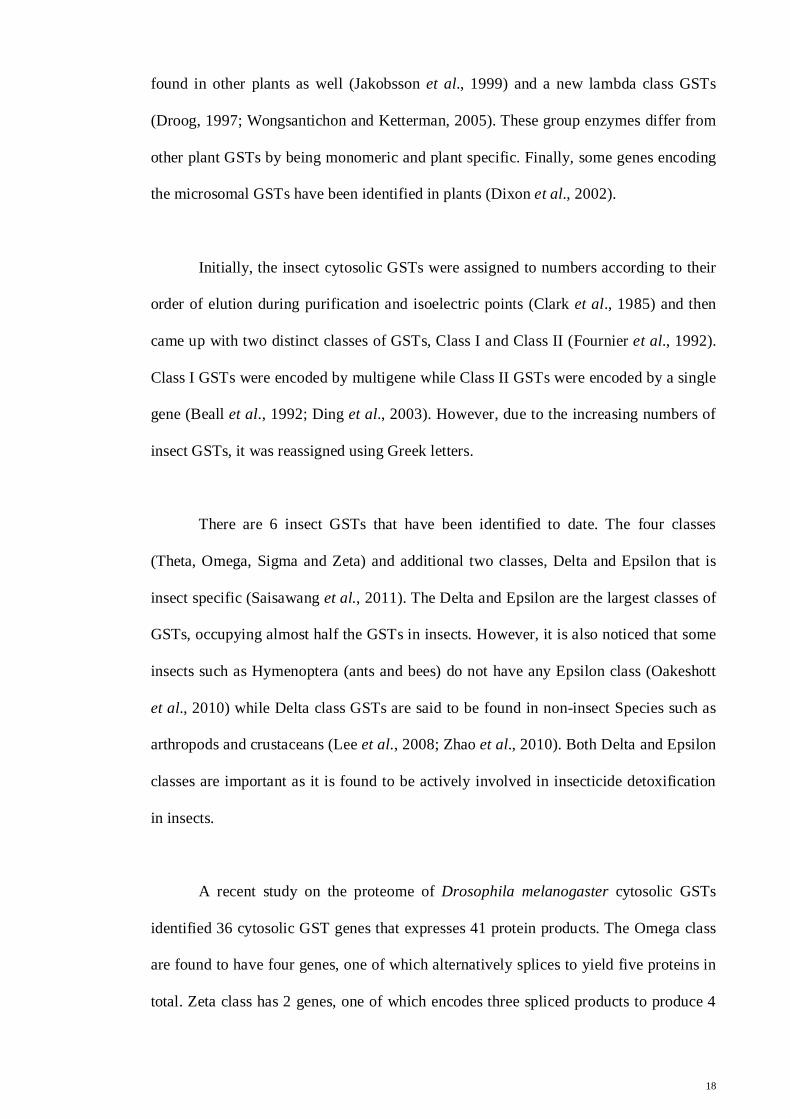
Initially, the insect cytosolic GSTs were assigned to numbers according to their
order of elution during purification and isoelectric points (Clark et al., 1985) and then
came up with two distinct classes of GSTs, Class I and Class II (Fournier et al., 1992).
Class I GSTs were encoded by multigene while Class II GSTs were encoded by a single
gene (Beall et al., 1992; Ding et al., 2003). However, due to the increasing numbers of
insect GSTs, it was reassigned using Greek letters.
There are 6 insect GSTs that have been identified to date. The four classes
(Theta, Omega, Sigma and Zeta) and additional two classes, Delta and Epsilon that is
insect specific (Saisawang et al., 2011). The Delta and Epsilon are the largest classes of
GSTs, occupying almost half the GSTs in insects. However, it is also noticed that some
insects such as Hymenoptera (ants and bees) do not have any Epsilon class (Oakeshott
et al., 2010) while Delta class GSTs are said to be found in non-insect Species such as
arthropods and crustaceans (Lee et al., 2008; Zhao et al., 2010). Both Delta and Epsilon
classes are important as it is found to be actively involved in insecticide detoxification
in insects.
A recent study on the proteome of Drosophila melanogaster cytosolic GSTs
identified 36 cytosolic GST genes that expresses 41 protein products. The Omega class
are found to have four genes, one of which alternatively splices to yield five proteins in
total. Zeta class has 2 genes, one of which encodes three spliced products to produce 4
18
proteins while the Theta class has four genes that encode five proteins (Saisawang et al.,
2011).
The Delta and Epsilon, each has more than 10 members each with over 25 genes
when combined. The Delta class has 11 members, DmGSTD1- DmGSTD10 plus a
recently identified member, DmGSTD11. While the Epsilon class are found to have 14
members, DmGSTE1-DmGSTE10 plus additional of 4 recently characterized members:
CG5224, CG16936, CG11784 and CG4688 which are denoted as DmGSTE11-
DmGSTE14 respectively (Saisawang et al., 2011).
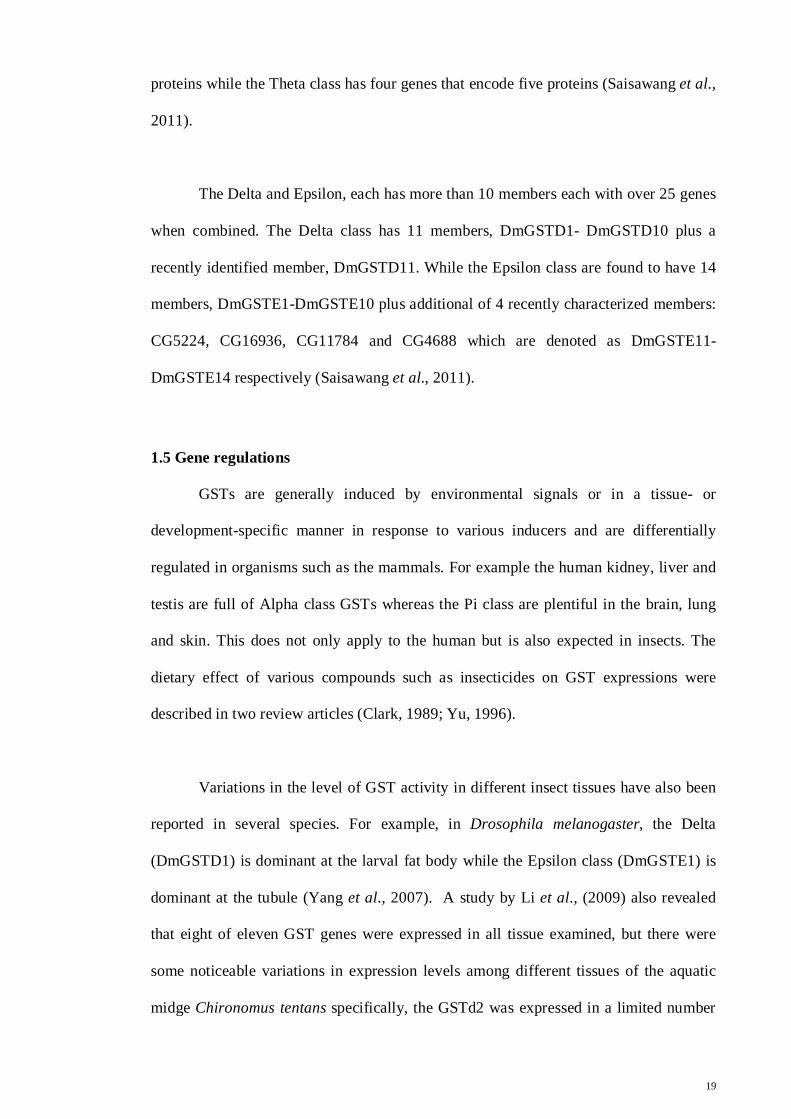
1.5 Gene regulations
GSTs are generally induced by environmental signals or in a tissue- or
development-specific manner in response to various inducers and are differentially
regulated in organisms such as the mammals. For example the human kidney, liver and
testis are full of Alpha class GSTs whereas the Pi class are plentiful in the brain, lung
and skin. This does not only apply to the human but is also expected in insects. The
dietary effect of various compounds such as insecticides on GST expressions were
described in two review articles (Clark, 1989; Yu, 1996).
Variations in the level of GST activity in different insect tissues have also been
reported in several species. For example, in Drosophila melanogaster, the Delta
(DmGSTD1) is dominant at the larval fat body while the Epsilon class (DmGSTE1) is
dominant at the tubule (Yang et al., 2007). A study by Li et al., (2009) also revealed
that eight of eleven GST genes were expressed in all tissue examined, but there were
some noticeable variations in expression levels among different tissues of the aquatic
midge Chironomus tentans specifically, the GSTd2 was expressed in a limited number
19
of tissues including midgut and fat bodies, whereas GSTu1 was virtually undetectable in
salivary glands and hemolymph.
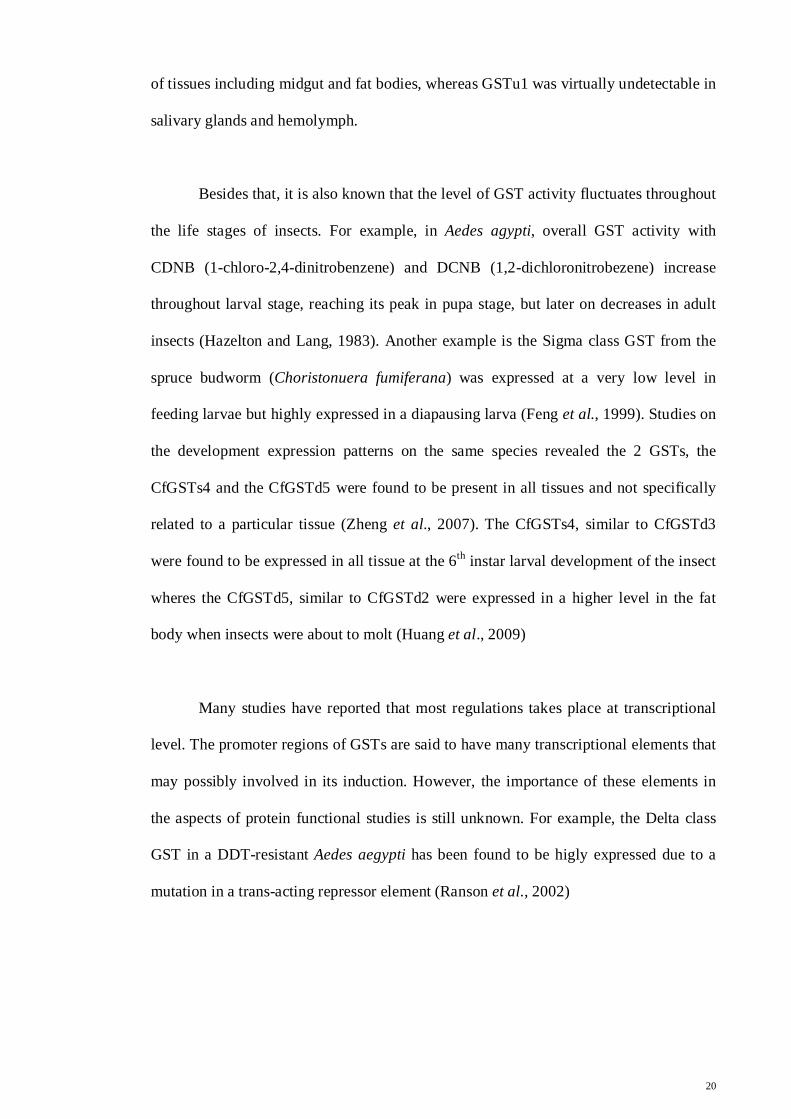
Besides that, it is also known that the level of GST activity fluctuates throughout
the life stages of insects. For example, in Aedes agypti, overall GST activity with
CDNB (1-chloro-2,4-dinitrobenzene) and DCNB (1,2-dichloronitrobezene) increase
throughout larval stage, reaching its peak in pupa stage, but later on decreases in adult
insects (Hazelton and Lang, 1983). Another example is the Sigma class GST from the
spruce budworm (Choristonuera fumiferana) was expressed at a very low level in
feeding larvae but highly expressed in a diapausing larva (Feng et al., 1999). Studies on
the development expression patterns on the same species revealed the 2 GSTs, the
CfGSTs4 and the CfGSTd5 were found to be present in all tissues and not specifically
related to a particular tissue (Zheng et al., 2007). The CfGSTs4, similar to CfGSTd3
were found to be expressed in all tissue at the 6th instar larval development of the insect
wheres the CfGSTd5, similar to CfGSTd2 were expressed in a higher level in the fat
body when insects were about to molt (Huang et al., 2009)
Many studies have reported that most regulations takes place at transcriptional
level. The promoter regions of GSTs are said to have many transcriptional elements that
may possibly involved in its induction. However, the importance of these elements in
the aspects of protein functional studies is still unknown. For example, the Delta class
GST in a DDT-resistant Aedes aegypti has been found to be higly expressed due to a
mutation in a trans-acting repressor element (Ranson et al., 2002)
20
Studies on the variation in activity by a particular GST can provide further
details on the function of different GSTs. However, the mechanism that involved in the
controlling the GST expression and the protein regulation in the cell are still unclear.
What is known is that GSTs expressions are induced by a series of chemical stresses
that happens within the cell as an adaptive response mechanism. Wide range of
compounds has been found to be capable of inducing individual isozymes which
activates the expression in an isoenzyme-specific manner (Mannervik et al., 2005).
A study on the potency of inducers of NAD(P)H:(quinone-acceptor)
oxidoreductase is shown to be parallel with their efficiency as substrates for glutathione
transferases. Besides, it is also reported that virtually all glutathione transferase
substrates are inducers, and their potencies in the nitrobenzene series correlate linearly
with the Hammett sigma or sigma- values of the aromatic substituents, precisely as
previously reported for their efficiencies as glutathione transferase substrates (Spencer
et al., 1991).
21
1.6 GST purification.
There are various ways to purify GSTs. One of the simplest method will be
through affinity chromatography. It is easily purified by using glutathione immobilized
to a matrix such as sepharose. The most commonly used columns for the purification of
GSTs and GST-tagged proteins will be GSTrap and GSH-agarose that are commercially
available. However, the problem using these columns is that not all GST isoforms bind
to it. For example, some epsilon class GSTs has no binding affinity towards GSTraps.
The glutathione conjugate of bromosulfophthalein (BSP) was used as a ligand to
trap GSTs. However, this too trapped limited isoforms of GSTs such as from the Sigma
and Epsilon class, leaving behind classes such as Zeta and Omega (Alias and Clark,
2007).
A recent publication by Pal et al. (2012) revealed the use of S-substituted
glutathiones as affinity ligands. Among the ligands that were newly introduced are S-
(2,4-(dinitrophenyl) glutathione (DNP-SG) that binds wide range of isoforms and also
non-GST proteins. Others were S-(2-chloro-4-nitrophenyl) glutathione (CNP-SG) and
S-(4-nitrobenzyl) glutathione (NB-SG). All matrices were observed to bind different
isoforms of GST.
22
1.7 Olfactory GST
Insects are always exposed to cytotoxic xenobiotics, such as plant derived
products, insecticides and herbicides. In order to protect the insects from these harmful
compounds, their olfactory systems are designed to trap and sample the volatile
hydrophobic compounds. These molecules that enter the olfactory systems are odorants
and pheromones from other organisms. Most odorants are small, volatile, lipophilic
molecules that enter the mucus flow and reach the odorant receptors which are located
on the cilia of the olfactory sensory neurons (Green et al., 2005).
Although there is not much detail known to what happens to the xenobiotics that
enters the olfactory sensilla but it is known that the entry of harmful xenobiotics is
somehow limited by a group of biotransformation enzymes. The presence of the odorant
binding proteins in the sensillum could be responsible for restricting the entry of the
toxic compounds. This is just a possibility as there is no evidence to prove the
restrictions of odorant binding proteins to the entry of these volatile compounds.
However, the concentration of these harmful substances is believed to be limited
by detoxification via a series of enzymatic processes, which helps to reduce the damage
caused to the cells. Xenobiotic metabolism is accomplished through the action of the
biotransformation enzymes (Rogers et al., 1999). Three groups of such enzymes have
been identified in the olfactory system of mammals to date. They are cytochrome P-450,
Glutathione tranferases and UDP-glucuronosyltransferases (Nef et al., 1989; Ben-Arie
et al., 1993).
23
A few studies has suggested that the olfactory enzymes are responsible of
catalyzing the transformation of odorants, which at the same time helps to terminate the
olfactory signal as well based on the various odorant types that is modified by them and
its presence in the olfactory system (Lazard et al., 1991; Ben-Arie et al., 1993).
Drosophila melanogaster has a relatively simple olfactory system, consisting of
-1000 receptor neurons (as compared to 100 million in humans) and it is located in the
third segment of the antenna (Stocker et al., 1990). The studies on the functional
analysis of an olfactory receptor in Drosophila melanogaster have identified almost 59
olfactory receptor genes which encode seven trans membrane-domain proteins
(Stortkuhl and Raffael, 2001). Recent studies on the Drosophila olfactory coding
system also proved that it could detect the odor of acid (Ai et al., 2010).
Many studies have been done to prove the presence of GSTs in the mammalian
olfactory system such as rats (Ben-arie et al., 1993), cattle (Longo et al., 1991) and
humans (Aceto et al., 1989). These olfactory GSTs were found to catalyse glutathione
conjugation of several classes that includes unsaturated aldehyde and ketones, as well as
epoxides. It is also believed to mediate the covalent modifications of odorants, the
agonists of olfactory neurons, thereby affecting their neutralization and clearance (Ben-
arie et al., 1993).
Olfactory specific GST was also detected in the Sphinx Moth Manduca sexta
and was named as GST-msolf1. Studies showed that the endogenous GSTs of male and
female antennae is able to modify trans-2-hexenal, a plant derived green leaf aldehyde
which is known to stimulate the olfactory system of Manduca sexta and hence
concluded that the GST-msolf1 play dual role of protecting the olfactory system from
24
harmful xenobiotics and inactivating aldehyde odorants, especially the components of
Manduca sexta sex pheromone (Rogers et al., 1999).
1.8 CG16936
The main aim of this research is to investigate the CG16936, a putative
Glutathione s-transferase. It is believed to be an Epsilon class GST. A similarity
percentage of 59% to 64% was matched to the Drosophila GSTs from the Epsilon class
(Alias and Clark, 2007). In general, GSTs that share greater than 60% identity are
assigned within a class, whereas those with less than 30% identity are assigned to
separate class (Sheehan et al., 2001).
The gene that codes this enzyme is about 672 base pairs in length which encodes
a protein of 223 amino acids. Most GSTs are intronless. In Drosophila melanogaster, 20
out of 37 genes are intronless (10 Epsilon and 10 Delta GSTs) (Sawicki et al., 2003).
However, the CG16936 contains intron which means that it has to be reverse-
transcribed into cDNA before the Polymerase chain reaction (PCR) is performed.
A recent study on the Drosophila systems approach to xenobiotic metabolism
revealed that the CG16936 is found most abundant in the tubule of the adult and larvae
(Yang et al., 2007). Several lines of evidence have also suggested that the tubule may
be the dominant tissue for xenobiotic mechanism in adult Drosophila.
A previous study on chemical challenges, GSTs from adult Drosophila
melanogaster was partially purified and chemicals such as Phenobarbital and Paraquat
were pre treated to all GSTs. There were increases in the relative amounts of all
25
isoforms detected except for CG16936 (Alias and Clark, 2007). This probably shows
that this enzyme may not be really be involved in insecticide detoxification.
The CG16936 have been previously reported to have a possible role in the
olfactory system of Drosophila melanogaster (Anholt and Mackay, 2001). Besides that,
a recent study on the molecular evolution of Glutathione S-transferase in genus
Drosophila also revealed that some uncharacterized genes such as the CG1681,
CG1702, and CG16936 are found to be among the slowest evolving compared to others
such as CG4623, CG4688, and CG11784 that were quickly evolving among the GST
family (Low et al., 2007).
A study on the proteome of Drosophila melanogaster, CG16936 were purified
and revealed 4 different isoforms of this GST with the same molecular weight
(25.4kDa) but different pI value ranging from 5.0 to 5.3 (Pal et al., 2012) respectively
although theoretically it was said to have a pI value of 5.9 (Alias and Clark, 2007).
26
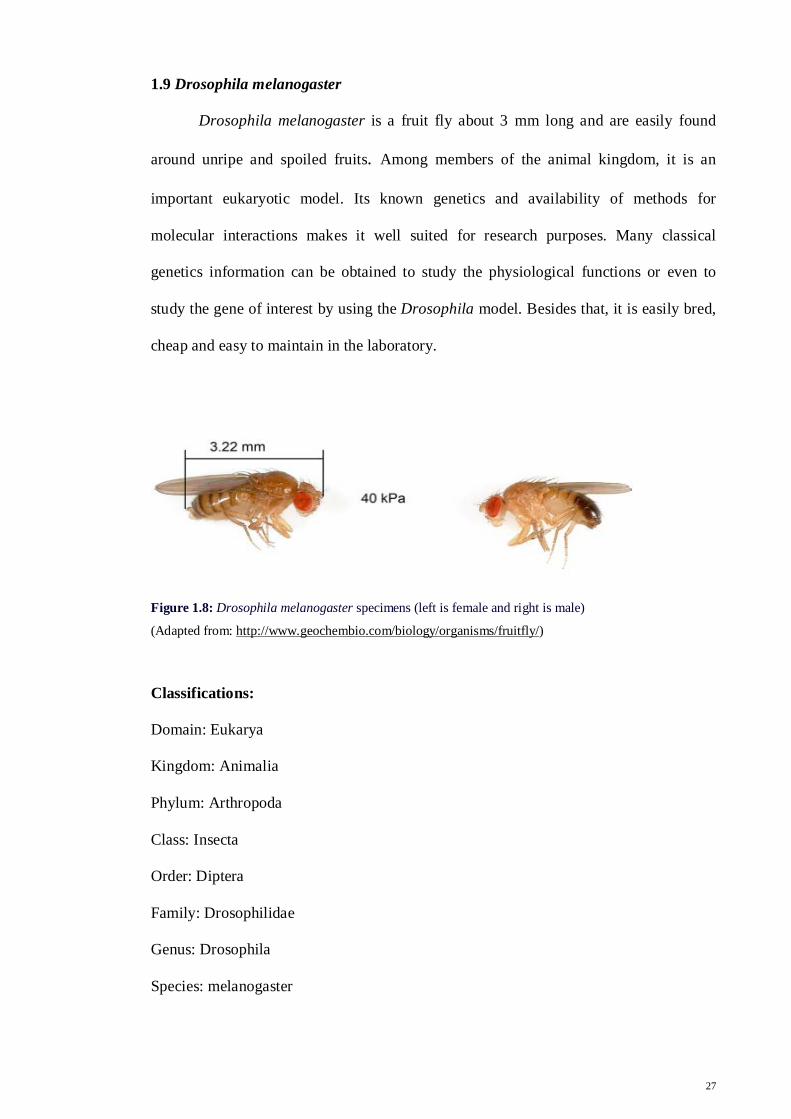
1.9 Drosophila melanogaster
Drosophila melanogaster is a fruit fly about 3 mm long and are easily found
around unripe and spoiled fruits. Among members of the animal kingdom, it is an
important eukaryotic model. Its known genetics and availability of methods for
molecular interactions makes it well suited for research purposes. Many classical
genetics information can be obtained to study the physiological functions or even to
study the gene of interest by using the Drosophila model. Besides that, it is easily bred,
cheap and easy to maintain in the laboratory.
Figure 1.8: Drosophila melanogaster specimens (left is female and right is male)
(Adapted from: http://www.geochembio.com/biology/organisms/fruitfly/)
Classifications:
Domain: Eukarya
Kingdom: Animalia
Phylum: Arthropoda
Class: Insecta
Order: Diptera
Family: Drosophilidae
Genus: Drosophila
Species: melanogaster
27
1.10 Objectives
1. To clone and express recombinant CG16936.
2. To purify and determine the substrate specificity of recombinant CG16936.
3. To evaluate the response of CG16936 expression in vivo when treated with
odorant.
4. To investigate the direct contribution of recombinant CG16936 towards
conjugation of odorants to GSH.
28
CHAPTER 2: MATERIALS AND METHOD 2.0 Materials 2.0.1 Chemicals 0.5M Tris-HCl pH 6.8 (Bio Rad), 1,2-Dichloro-4-nitrobenzene (DCNB) (Sigma), 1,2-
Epoxy-3-nitrophenoxypropane (EPNP) (Sigma), 1.5M Tris-HCl pH 8.8 (Bio Rad), 1-
Chloro-2,4-dinitrobenzene (CDNB)(Sigma), 1kb DNA Ladder (Promega), 2-
mercaptoethanol (Merck), 5-bromo-4-chloro-3-indolyl β–D-galactopyranoside (Sigma),
Acetic acid (Systerm), Acetone (Sigma), Agarose LE analytical grade (Promega),
Ammonium Persulphate (Bio Rad), Ammonium Sulphate (Systerm), Ampicilin Sodium
(Duchefa Biochemier), BamHI enzyme (Fermentas), BenchMark™ Protein Ladder
(Invitrogen), Benzaldehyde (Friendemann Schmidt), Bioneer Accu Power™ PCR
premix, Bromosulfophthalein (BSP) (Sigma), Bromophenol Blue (BDH), Bovine
Serum Albumin (Sigma), Butan-1-ol (Systerm), Chloroform (Systerm), Competent cells
(E.coliBL21(DE3)pLysS) (Novagen), Coomassie Brilliant Blue G-250 (Sigma), Diethyl
pyrocarbonate water (Fermentas), Ethacrynic acid (EA) (Sigma), Ethanol (Systerm),
Ethidium bromide (Sigma), FastDigest EcoRI enzyme (Fermentas), FastDigest NdeI
enzyme (Fermentas), Glutathione reduced (Sigma), Glycerol (Systerm), Hexa-2,4-
dienal (Sigma), HindIII enzyme (Fermentas), Imidazole (Bioworld), Isopropanol (Fisher
Scientific), Isopropyl β–D-thiogalactopyranoside (Gold Bio.Com), Kanamycin Sulphate
(CALBIOCHEM), Luria Bertani Agar (Pronadisa), Luria Bertani Broth (Promega),
Lysozyme (Sigma), 30% (w/v) Acrylamide/bis-acrylamide (29:1) (Bio Rad), Methanol
(Systerm), Ninhydrin (Sigma), NovaBlue Singles™ Competent Cells (Novagen),
Nuclease-free water (Fermentas), Ortho-Phosporic acid (Systerm), pET-30a(+) plasmid
DNA(Novagen), p-Nitrophenyl Chloride (NBC) (Sigma), Potassium Chloride
(Systerm), PureZOL™ RNA isolation reagent (Bio Rad), SOC medium (Invitrogen),
Sodium Chloride (Systerm), Sodium dihydrogen phosphate (System), Sodium Dodecyl
29
Sulphate (Sigma), Tetramethylethylenediamine (Bio Rad), trans-2-Hexenal (Sigma),
trans,trans-Hepta-2,4-dienal (Sigma), trans-4-Phenyl-3-butene-2-one (PBO) (Sigma)
and Tris base (Promega).
2.0.2 Buffers:
• 10x Buffer BamHI (Fermentas)
• TBE buffer (0.09M Tris-Borate and 2mM EDTA, pH 8.0)
• Buffer A ( 0.1M Sodium Phosphate buffer pH 6.8)
• Buffer B ( 0.1M Tris buffer, pH 9.0)
• Buffer C ( 0.1M Sodium Phosphate buffer, pH 7.5)
• SDS reducing buffer [0.5 M Tris-HCl pH 6.8, glycerol, 10% (w/v) SDS and
0.5% (w/v) Bromophenol Blue and β-mercaptoethanol(prior to use)]
• 10X Tris/Glycine/SDS running buffer (Biorad)
2.0.3 Kits
• First Strand cDNA Synthesis Kit (Fermentas)
• LaboPass™ Gel Extraction Kit
• pGEM-T Easy Vector Ligation Kit (Promega)
• T4 DNA Ligase Kit (Bioline)
• innuPREP Plasmid Rapid Kit (Analytik Jena)
30
2.0.4 Columns/ Matrice for protein purification
• GSTrap™ HP (GE Healthcare)
• Hi-Trap Desalting(G-25) (GE Healthcare)
• HisTrap™ FF Crude (GE Healthcare)
• HiPrep 16/60 Sephacryl S-200 (GE Healthcare)
• HiTrap ANX FF (GE Healthcare)
• HiTrap DEAE FF (GE Healthcare)
• S-Hexylglutathione (Sigma)
• Superdex 75 (Sigma)
• Affi-Gel Blue Gel (Biorad)
• S-2,4-(dinitrophenyl) GSH (DNP-SG) (Gift from Prof. Alan Clark, Department
of Biological Sciences, Victoria University of Wellington, New Zealand)
• Bromosulfophthalein GSH (BSP-SG) (Gift from Prof. Alan Clark, Department
of Biological Sciences, Victoria University of Wellington, New Zealand)
• Sep-PakC18 cartridge (Waters)
2.0.5 Equipments
The equipments that have been used in this study include:
• Amersham Bioscience AKTA FPLC™
• Pellet Pestle Motor Grinder (Sigma-Aldrich)
• Biorad Mycycler thermal cycler (Polymerase chain reaction machine)
• Agarose gel electrophoresis cell (Biorad)
• Alpha Innotech UV transilluminator
• Centrifuge machine (Eppendorf)
• Microwave
• Vortex mixer
31
• Water bath
• PCR air clean cupboard
• Shaking incubator
• pH meter
• Mini-protean tetra cell (Biorad)
• Jasco V630 spectrophotometer (Alpha Analytical)
• Laminar hood
• Sonicator
• T.L.C Silica Gel 60 F254 (Merck)
• Centrifugal concentrator (Vivaspin 20, Sartorius Stedim)
2.0.6 Insects
Drosophila melanogaster that is used in this study were obtained from the Department
of Genetics, University of Malaya and bred at the lab using medium containing oats,
sugar and agar (Full recipe at Appendix D).
32
2.1 METHODOLOGY
2.1.1 Total RNA extraction from Drosophila melanogaster.
One ml of PureZOL reagent was added per 50-100 mg of fresh Drosophila
melanogaster and was homogenised in a 2 ml round-bottom micro centrifuge tubes
using the pellet pestle motor grinder (Sigma-Aldrich). Homogenised sample was
incubated at room temperature for 5 minutes. Homogenate was then split into 1 ml
aliquots in 2 ml round-bottom micro centrifuge tubes. A total of 0.2 ml of chloroform
was added per 1 ml of PureZOL reagent used. Sample was then mixed vigorously for 15
seconds and incubated at room temperature (28ºC) for 2 to 3 minutes. Samples were
centrifuged at 12,000 x g for 15 minutes at 4oC. The aqueous upper phase was
transferred to a new 2 ml micro centrifuge tubes and 0.5 ml of isopropanol was added
per 1 ml of PureZOL reagent used. Tube was mixed by inversion. Sample was then
incubated at room temperature (28ºC) for 10 minutes and centrifuged at 12,000 x g for
15 minutes at 2-8oC (At this point, RNA can be seen as a pellet at the bottom of the
tube). Supernatant was carefully removed and pellet was washed once with 75% (v/v)
ethanol, adding 1 ml per 1 ml of PureZOL reagent used. Sample was vortexed and
centrifuged at 7,500 x g for 5 minutes at 4oC. Supernatant was removed and RNA pellet
was air-dried. Pellet was resuspended in 50-100 µl DEPC H2O. Total RNA was then
stored in -70oC until further analysis.
2.1.2 cDNA synthesis
Ten µl RNA (~50ng) was heated at 65oC for 10 minutes and was quenched on
ice. First strand cDNA Synthesis Kit (Fermentas) were used. The following components
were added into a sterile, nuclease-free 0.2 ml tube on ice as per recommended in the
manufacturer’s manual: 6 µl Template RNA (50 ng), 1 µl oligo (dT)18 Primer (0.5 µg/
µl), 4 µl DEPC-treated water, 4 µl 5 X reaction buffer, 1 µl RiboLock RNase Inhibitor
33
(20 units/µl), 2 µl 10 mM dNTP mix and 2 µl M-MuLV Reverse Transcriptase (20
units/µl) which sums up to a total volume of 20 µl. The reaction mixture was mixed
gently and spun down (quick spin) to make sure all components were at the bottom of
the tube. It is then incubated for 60 minutes at 37oC for the cDNA synthesis. Reaction
was terminated by heating at 70oC for 5 minutes. Reverse transcription reaction product
was directly used in PCR application or stored at -70oC until further use.
2.1.3 Polymerase chain reaction (PCR)
PCR were carried out to amplify CG16936.With a total volume of 5 µl of
cDNA template (50ng), 0.5 µl 10 mM reverse primer, 0.5 µl of 10 mM forward primer
and 14 µl of distilled water were added to Bioneer Accu PowerTM PCR Premix in a 0.2
ml micro centrifuge tube. PCR was performed with hot start of 95°C for 3 minutes then
followed by 35 cycles of amplification with denaturation at 95°C for 30 seconds,
annealing at temperature 62°C which was determined according to the melting
temperature of primers for 30 seconds and elongation for 1 minute at 72°C per 1 kb.
After 35 cycles, it was set to hold at 4°C for keeping the samples. Primers used were as
per Table 2.1 below.
Forward primer/
BamHI: 5’ CGC GGA TCC ATG TCA AAG CCA GCT CTG TA 3’
Tm: 64°C
Reverse primer/ Hind III:
5’ CCC AAG CTT CTA CTT GCC ACG GTT TTC TG 3’
Tm: 63°C
Table 2.1: Forward primer and reverse primer used for the amplification CG16936
Forward primer was designed with inclusion of the BamHI restriction
site (underline) followed by initiation codon ATG whereas the reverse primer was
designed with HindIII (underline with bold case) for CG16936. PCR product was then
loaded into a 1% (w/v) agarose gel.
34
2.1.4 Agarose Gel electrophoresis of DNA.
A total of 0.4 g of agarose powder was dissolved in 40 ml of 0.5 x TBE
buffer to prepare 1% (w/v) gel. The agarose solution was then micro waved to
completely dissolve the agarose powder into the buffer. It was then left to cool down to
55oC to 60oC before pouring into the gel tray. Proper comb (1.5 mm) was inserted to
form the well and gel was allowed to harden for 30 minutes. Comb was removed and
gel was placed in the gel tank. 0.5 x TBE buffer was poured until gel was completely
covered with the buffer and allowed to soak for 30 minutes. Two µl of loading dye
(Blue/Orange Loading Dye, 6 x) was mixed with 10 µl sample (PCR product) and
pipetted into the well. One kb DNA Ladder (Promega) was used as marker. The loading
dye/buffer gives colour and density to the sample to facilitated loading into the wells.
The dye was negatively charged in neutral buffers and thus moves in the same direction
as the DNA during electrophoresis, allowing us to monitor the progress of the gel.
Electrophoresis was performed at 60 V for approximately 1 hour and 30 minutes or
until the marker reaches bottom of the tank. Gel was taken out of the gel tank and
placed in a tupperware containing ethidium bromide (0.5 mg/ml) and stained for 10
minutes with gentle shaking. Gel was then placed in distilled water and destained for 20
minutes. The DNA bands were visualized by ultraviolet radiation (302 nm wavelength)
and the image saved.
2.1.5 DNA extraction from agarose gel.
DNA fragment was exercised from the agarose gel with a sharp scalpel.
Labopass Gel extraction kit was used. Gel slice was transferred into a 1.5 ml reaction
tube and 650 μl of gel solubilizer are added. It was incubated for 10 minutes at 50oC
until the agarose gel slice was completely dissolved. Fifty μl binding optimizer was
added and suspension was mixed by vortexing. Sample was applied onto spin filter
35
located in a 2.0 ml receiver tube. Cap was closed and centrifuged at 10,000 x g for 1
minute.
Filtrate was discarded and receiver tube was re-used. A total of 700 μl
washing solution [70% (v/v) ethanol] was added at centrifuged and 10,000 x g for 1
minute. Filtrate was discarded and receiver tube was reused. Spin filter was placed back
into the 2.0 ml receiver tube. It was then centrifuged at max speed for 2 minutes to
remove all traces of ethanol. Receiver tube was discarded and spin filter was placed into
a 1.5 ml elution tube. Ten to twenty μl elution buffer was added into the spin filter and
incubated at room temperature for 2 minutes. It was centrifuged at 8,000 x g for 1
minute. Half of the extracted DNA was used to be digested with restriction enzymes
while other half was used to ligate with pGEM-T vector.
2.1.6 Digestion with restriction enzymes.
Two different restriction enzymes were used based on the map of the cloning
vector used. HindIII and BamHI were chosen because it includes 6x Histidine tagging
to the gene of interest which will assist with purification process. The following
components were added into a 0.2 ml micro centrifuge tube accordingly: 18 µl
nuclease-free water, 2 µl 10 x Buffer BamHI, 10 μl PCR reaction mixture (~0.5 µg), 1
µl BamHI enzyme and 2 µl HindIII enzyme. Tube was mixed gently and spun down for
a few seconds. Tube was then incubated at 37oC for 16 hours. Digested PCR product
was purified using the gel purification method.
For the digestion of pET30a, the following components were added in a 0.2
ml micro centrifuge tube accordingly: 16 µl nuclease-free water, 2 µl 10x Buffer
BamHI, 1 µl pET-30a(+) plasmid DNA ,1 µl BamHI enzyme and 2 µl HindIII enzyme.
Tube was mixed gently and spun down for a few seconds. Tube was then incubated at
37oC for 16 hours. Digested plasmid was purified using the gel purification method.
36
2.1.7 Ligation of digested PCR product and pET-30a(+).
Ligation was done using the T4 DNA Ligase kit. Digested PCR product,
digested pET-30a(+) plasmid DNA, T4 DNA Ligase Kit was thawed and placed on ice.
(Solutions were mixed during the thawing process to avoid localized concentrations of
salt). A ligation-reaction mixture was prepared according to the following scheme: 2 µl
10 x T4 Ligase Reaction Buffer, 2 µl 10 x ATP Solution, 2 µl digested vector, 6 µl
digested PCR product, 1 µl T4 DNA Ligase and 7 µl of water (ddH2O). The ligation-
reaction mixture was mixed gently (by pipetting the mixture up and down) and was then
incubated for 16-24 hours (for maximum yield) at 12-14oC. Ligation-reaction mixture
was stored at -20oC until further use. Cloned product was confirmed using the agarose
gel electrophoresis method.
2.1.8 Transformation with E.coli BL21 (DE3) pLysS
Competent cells are thawed on ice. Super Optimal Broth with Catabolite
repression (SOC) medium was also thawed and warmed to room temperature (28ºC). 1-
2 µl ligation-reaction mixture was added to the competent cells tube (50 µl), mixed
gently (gentle flicking) and incubated on ice for 30 minutes. The cells were then heated
in a 42oC water bath for 45 seconds without shaking, followed by incubation on ice for
another 5 minutes. A total of 250 µl room temperature SOC medium was added to the
tube containing the transformation mixture and was incubated at 37oC for 1 hour with
shaking at 250 rpm. Hundred µl of the transformation mixture was plated onto LB
(Luria Bertani) agar containing Kanamycin (30µg/ml) [(pET-30a(+) has the kanamycin
resistant gene)]. Plate was incubated at room temperature until the transformation
mixture has absorbed into the agar. Plate was then inverted and incubated at 37oC
overnight.
37
2.1.9 Ligation of PCR product with pGEM-T vector. Ligation of purified PCR product with pGEM-T was done using the pGEM-
T Vector Ligation Kit. The following were added to a 0.2 ml micro centrifuge tube
according to the protocol provided by the manufacturer: 5 µl 2 x Rapid Ligation Buffer,
1 µl pGEM®-T vector, 3 µl purified PCR product product, and 1 µl T4 DNA Ligase.
Reaction was mixed by pipetting and incubated overnight at 4oC to produce maximum
amount of transformants.
2.1.10 Transformation with NovaBlue Singles™ Competent Cells Competent cells are thawed on ice and mixed gently to ensure that cells are
evenly suspended. 5 μl of the ligation mixture was added directly to the cells. Tube was
flicked gently to mix. Tube was placed on ice for 5 minutes. Tube was heated for
exactly 30 seconds in a 42°C water bath, without shaking. It was then placed on ice for
2 minutes. 250 μl of room temperature SOC medium was added to tube. Tube was
shaken at 37°C (250 rpm) for 30 minutes prior to plating. 100 µl of the transformation
mixture was plated onto X-gal plate and covered with aluminium foil to prevent light
exposure. Plate was incubated at room temperature until the transformation mixture has
absorbed into the agar. Plate was then inverted and incubated at 37oC overnight.
Colonies in white were cells containing plasmid with insert while the colonies in blue
are cells containing plasmid without insert. One bacteria colony was inoculated into a 5-
ml LB broth containing kanamycin (30 µg/ml) and placed in a shaking incubator
(250rpm) at 37oC and left overnight for the bacteria cells to multiply.
38
2.1.11 Plasmid extraction.
InnuPREP Plasmid Rapid Kit was used to extract the plasmid. Three-5 ml of
the overnight E.coli culture from section 2.1.10 was transferred into a 1.5 ml reaction
tube. It was centrifuged for 1 minute at maximum speed to pellet the cells and
supernatant was removed completely. Bacterial cell pellet was resuspended in 200 µl re-
suspension buffer completely by vortexing or by pipetting up and down. Two hundred
µl lysis buffer was added and mixed carefully by inverting the tube 5-10 times. 300 µl
of neutralization buffer was added and mixed gently, but thoroughly, by inverting the
tube 4-6 times. Sample was applied onto a Pre-filter located in a 2.0 ml receiver tube. It
was centrifuged at 10,000 x g for 2 minutes. Clarified filtrate was applied onto a spin
filter located in a 2.0 ml receiver tube and centrifuged at 10,000 x g for 1 minute.
Filtrate was discarded and the 2.0 ml receiver tube was re-used. 500 µl washing solution
A was added to the spin filter and centrifuged at 10,000 x g for 1 minute. Filtrate was
discarded and 2.0 ml receiver tube was re-used. 700 µl washing solution B was added to
the spin filter and centrifuged 10,000 x g for 1 minute. Filtrate was discarded and the
tube was centrifuged at maximum speed for 2 minutes to remove all traces of ethanol.
The 2.0 ml receiver tube was discarded. Spin filter was placed into 1.5 ml elution tube
and 30 µl of elution buffer was added to the centre of the spin filter. Tube was incubated
at room temperature for 1 minute and centrifuged at 6,000 x g for 1 minute. Extracted
plasmid DNA was kept at -20oC for further analysis.
2.1.12 Digestion of ligated pGEM-T plasmid with restriction enzymes.
Digestion was carried out as specified in the manufacturer’s manual. Plasmid
was double digested with FastDigest NdeI and EcoRI with a suitable common buffer,
which gave maximal activity to both enzymes. Mixture was mixed gently and spun
down. It was then incubated at 37oC in a heat block for 5 minutes. The NdeI and EcoRI
39
were chosen because these two restriction sites were present in both pGEM-T and
pET30. After digestion, the reaction mixture was loaded into an 1% (w/v) agarose gel.
The lower band at approximately 700 bp which was the PCR product, was gel purified
and used to ligate into the expression vector, pET30 and transformed in the E.coli BL21
for protein expression as mentioned in section 2.1.7 and 2.1.8.
2.1.13 Cell culturing and lysis.
One gram of LB broth was dissolved in 50 ml of distilled water in a conical
flask and autoclaved. The flask was cooled to 37oC and kanamycin was added to a final
concentration of 30 µg/ml. One bacteria colony was inoculated into the flask and placed
in a shaking incubator (250rpm) at 37oC and left overnight for the bacteria cells to
multiply. The next day, 10 ml of the fresh bacterial culture was added into a new 500 ml
LB broth containing kanamycin (30 µg/ml) and placed in shaking incubator (250 rpm)
at 37oC for 5 hours. IPTG was added to the final concentration of 1 mM to the flask and
continued shaking at 37oC for an additional of 3 hours.
Bacterial culture was then centrifuged at 6,000 rpm for 15 minutes at 4oC to
pellet the cells. Cell pellet was then resuspended with 10 ml of lysis buffer [(25 mM
sodium phosphate, 1.0 mM EDTA, lysozyme (0.25 mg/ml)] and left to shake for 15
minutes. Crude lysate was centrifuged at 10,000 x g for 30 minutes at 4oC to remove
cellular debris. Supernatant containing the protein of interest was transferred to a clean
tube without disturbing the pellet and stored on ice.
40
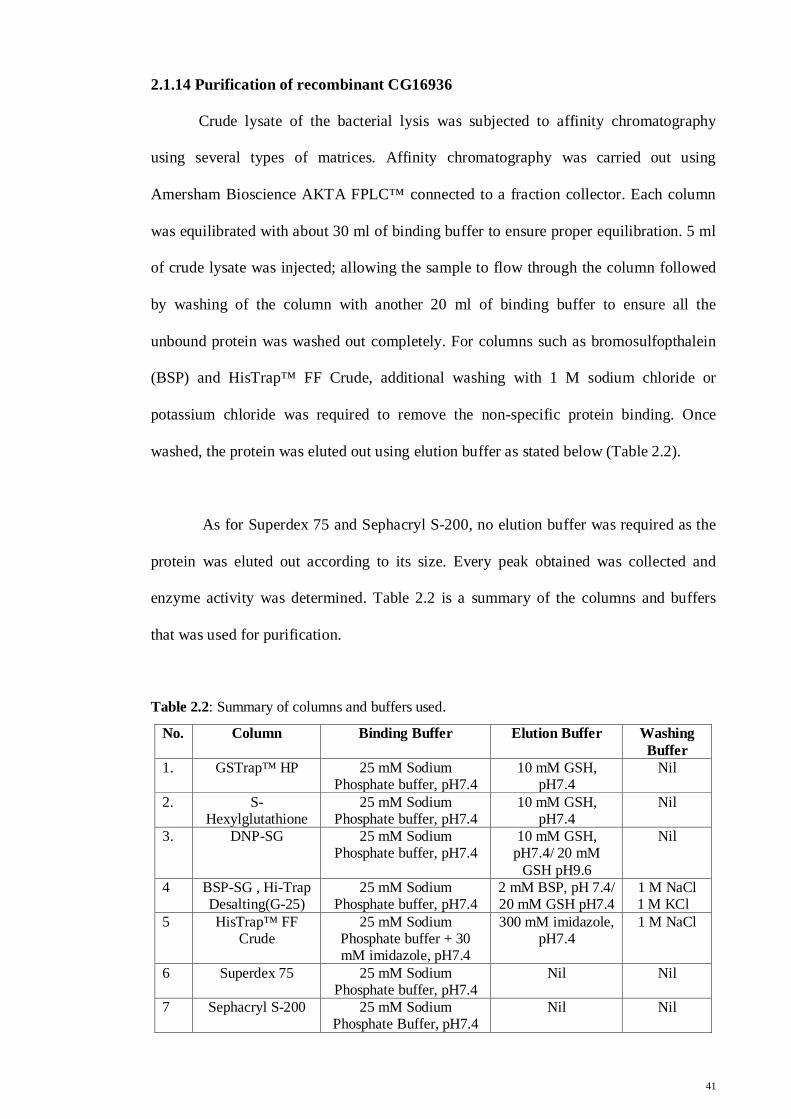
2.1.14 Purification of recombinant CG16936
Crude lysate of the bacterial lysis was subjected to affinity chromatography
using several types of matrices. Affinity chromatography was carried out using
Amersham Bioscience AKTA FPLC™ connected to a fraction collector. Each column
was equilibrated with about 30 ml of binding buffer to ensure proper equilibration. 5 ml
of crude lysate was injected; allowing the sample to flow through the column followed
by washing of the column with another 20 ml of binding buffer to ensure all the
unbound protein was washed out completely. For columns such as bromosulfopthalein
(BSP) and HisTrap™ FF Crude, additional washing with 1 M sodium chloride or
potassium chloride was required to remove the non-specific protein binding. Once
washed, the protein was eluted out using elution buffer as stated below (Table 2.2).
As for Superdex 75 and Sephacryl S-200, no elution buffer was required as the
protein was eluted out according to its size. Every peak obtained was collected and
enzyme activity was determined. Table 2.2 is a summary of the columns and buffers
that was used for purification.
Table 2.2: Summary of columns and buffers used.
No. Column Binding Buffer Elution Buffer Washing Buffer
1. GSTrap™ HP 25 mM Sodium Phosphate buffer, pH7.4
10 mM GSH, pH7.4
Nil
2. S-Hexylglutathione
25 mM Sodium Phosphate buffer, pH7.4
10 mM GSH, pH7.4
Nil
3. DNP-SG 25 mM Sodium Phosphate buffer, pH7.4
10 mM GSH, pH7.4/ 20 mM
GSH pH9.6
Nil
4 BSP-SG , Hi-Trap Desalting(G-25)
25 mM Sodium Phosphate buffer, pH7.4
2 mM BSP, pH 7.4/ 20 mM GSH pH7.4
1 M NaCl 1 M KCl
5 HisTrap™ FF Crude
25 mM Sodium Phosphate buffer + 30 mM imidazole, pH7.4
300 mM imidazole, pH7.4
1 M NaCl
6 Superdex 75 25 mM Sodium Phosphate buffer, pH7.4
Nil Nil
7 Sephacryl S-200 25 mM Sodium Phosphate Buffer, pH7.4
Nil Nil
41
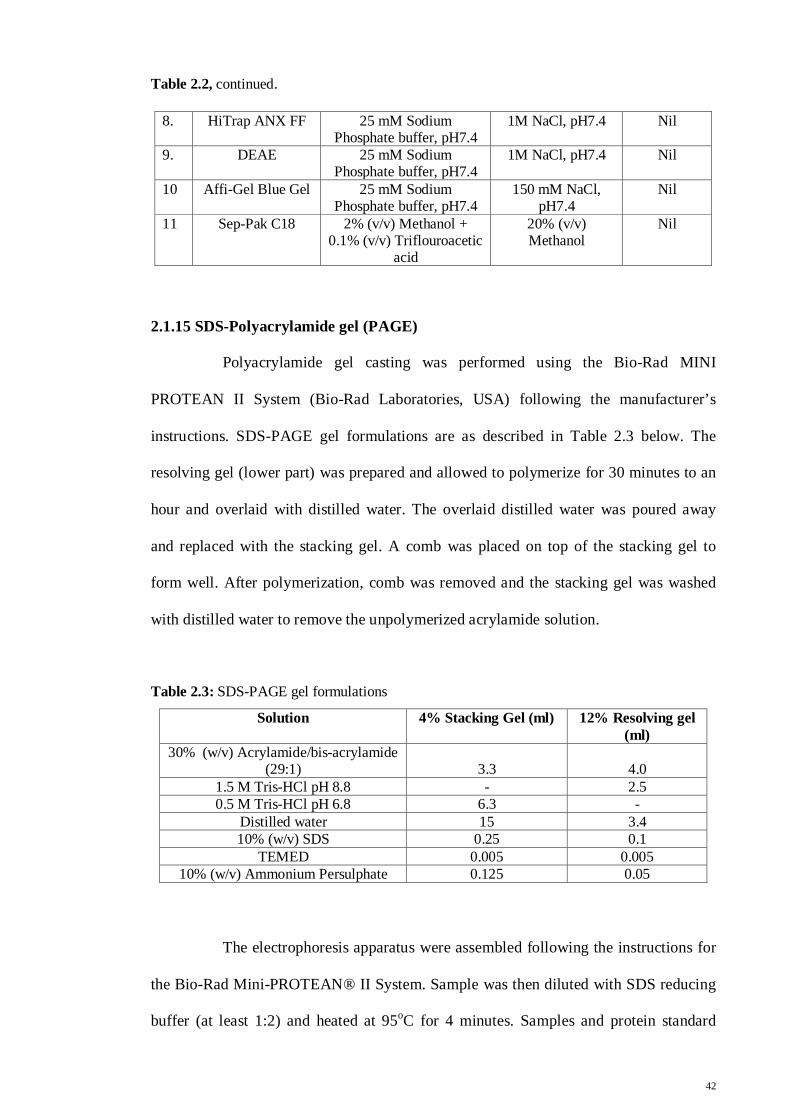
Table 2.2, continued.
8. HiTrap ANX FF 25 mM Sodium Phosphate buffer, pH7.4
1M NaCl, pH7.4 Nil
9. DEAE 25 mM Sodium Phosphate buffer, pH7.4
1M NaCl, pH7.4 Nil
10 Affi-Gel Blue Gel 25 mM Sodium Phosphate buffer, pH7.4
150 mM NaCl, pH7.4
Nil
11 Sep-Pak C18 2% (v/v) Methanol + 0.1% (v/v) Triflouroacetic
acid
20% (v/v) Methanol
Nil
2.1.15 SDS-Polyacrylamide gel (PAGE)
Polyacrylamide gel casting was performed using the Bio-Rad MINI
PROTEAN II System (Bio-Rad Laboratories, USA) following the manufacturer’s
instructions. SDS-PAGE gel formulations are as described in Table 2.3 below. The
resolving gel (lower part) was prepared and allowed to polymerize for 30 minutes to an
hour and overlaid with distilled water. The overlaid distilled water was poured away
and replaced with the stacking gel. A comb was placed on top of the stacking gel to
form well. After polymerization, comb was removed and the stacking gel was washed
with distilled water to remove the unpolymerized acrylamide solution.
Table 2.3: SDS-PAGE gel formulations
Solution 4% Stacking Gel (ml) 12% Resolving gel (ml)
30% (w/v) Acrylamide/bis-acrylamide (29:1)
3.3
4.0
1.5 M Tris-HCl pH 8.8 - 2.5 0.5 M Tris-HCl pH 6.8 6.3 -
Distilled water 15 3.4 10% (w/v) SDS 0.25 0.1
TEMED 0.005 0.005 10% (w/v) Ammonium Persulphate 0.125 0.05
The electrophoresis apparatus were assembled following the instructions for
the Bio-Rad Mini-PROTEAN® II System. Sample was then diluted with SDS reducing
buffer (at least 1:2) and heated at 95oC for 4 minutes. Samples and protein standard
42
markers were loaded into the wells. Electrophoresis was performed in descending
directions, with running buffer 1X Tris-glycine buffer (25 mM Tris-HCl pH 8.6, 192
mM Glycine, and 0.1% (w/v) SDS) with a constant voltage of 120 volts until the
bromophenol marker reaches the bottom edge of the gel tank. Once done, the
electrophoresis apparatus was dissembled and gel was stained in Colloidal Coomassie
staining solution [(5% (w/v) Coomassie Brilliant Blue, 85% (v/v) Ortho-phosphoric
acid and Ammonium Sulphate] and left overnight. Gel was then washed with 20% (v/v)
methanol and viewed under visible white light.
2.1.16 Bradford assay
A total of 100 mg Coomassie Brilliant Blue G-250 was dissolved in 50 ml
95% (v/v) ethanol and 100 ml of 85% (w/v) phosphoric acid was added to the mixture.
The solution was then diluted to 1 liter when the dye has completely dissolved, and was
filtered through Whatman #1 paper just before use. Filtered Bradford solution was
wrapped in aluminium foil and stored in dark as it is light sensitive. Standards (BSA)
ranging from 20-100 µg was prepared in 100 µl volume.
Hundred µl of sample was added to 5 ml Bradford reagent and mixed well
using vortex. Mixture was incubated for 5 minutes in the dark. Absorbance of the
mixture was measured at 595 nm (Bradford, 1976).
2.1.17 Assay for GSTs 1-Chloro-2,4-dinitrobenzene (CDNB)
All the below were added in a cuvette accordingly: 2.85 ml Buffer A (0.1M
Sodium Phosphate, pH 6.8), 0.05 ml 60 mM GSH (freshly prepared), 0.05 ml sample
.The sample was replaced with potassium phosphate buffer for negative control. Finally,
43
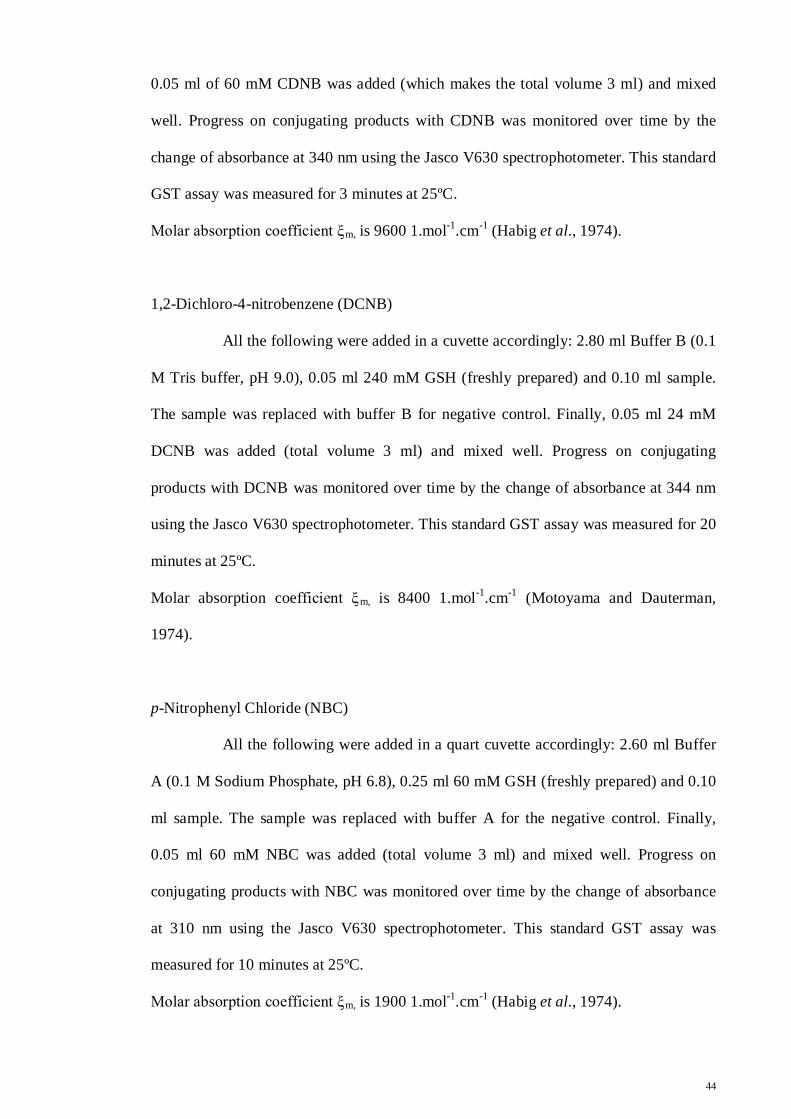
0.05 ml of 60 mM CDNB was added (which makes the total volume 3 ml) and mixed
well. Progress on conjugating products with CDNB was monitored over time by the
change of absorbance at 340 nm using the Jasco V630 spectrophotometer. This standard
GST assay was measured for 3 minutes at 25ºC.
Molar absorption coefficient ξm, is 9600 1.mol-1.cm-1 (Habig et al., 1974).
1,2-Dichloro-4-nitrobenzene (DCNB)
All the following were added in a cuvette accordingly: 2.80 ml Buffer B (0.1
M Tris buffer, pH 9.0), 0.05 ml 240 mM GSH (freshly prepared) and 0.10 ml sample.
The sample was replaced with buffer B for negative control. Finally, 0.05 ml 24 mM
DCNB was added (total volume 3 ml) and mixed well. Progress on conjugating
products with DCNB was monitored over time by the change of absorbance at 344 nm
using the Jasco V630 spectrophotometer. This standard GST assay was measured for 20
minutes at 25ºC.
Molar absorption coefficient ξm, is 8400 1.mol-1.cm-1 (Motoyama and Dauterman,
1974).
p-Nitrophenyl Chloride (NBC)
All the following were added in a quart cuvette accordingly: 2.60 ml Buffer
A (0.1 M Sodium Phosphate, pH 6.8), 0.25 ml 60 mM GSH (freshly prepared) and 0.10
ml sample. The sample was replaced with buffer A for the negative control. Finally,
0.05 ml 60 mM NBC was added (total volume 3 ml) and mixed well. Progress on
conjugating products with NBC was monitored over time by the change of absorbance
at 310 nm using the Jasco V630 spectrophotometer. This standard GST assay was
measured for 10 minutes at 25ºC.
Molar absorption coefficient ξm, is 1900 1.mol-1.cm-1 (Habig et al., 1974).
44
1,2-Epoxy-3-nitrophenoxypropane (EPNP).
All the following were added in a quart cuvette accordingly: 2.60 ml Buffer
A (0.1 M Sodium Phosphate, pH 6.8), 0.25 ml 60 mM GSH (freshly prepared) and 0.10
ml sample. The sample was replaced with buffer A for negative control. Finally, 0.05
ml 30 mM EPNP was added (total volume 3 ml) and mixed well. Progress on
conjugating products with EPNP was monitored over time by the change of absorbance
at 360 nm using the Jasco V630 spectrophotometer. This standard GST assay was
measured for 10 minutes at 25ºC.
Molar absorption coefficient ξm, is 500 1.mol-1.cm-1 (Habig et al., 1974).
Sulfobromophthalein (BSP)
All the following were added in a quart cuvette accordingly: 2.60 ml Buffer
C (0.1 M Sodium Phosphate, pH 7.5), 0.25 ml 60 mM GSH (freshly prepared) and 0.10
ml sample. The sample was replaced with buffer C for negative control. Finally, 0.05 ml
2 mM BSP was added (total volume 3 ml) and mixed well. Progress on conjugating
products with BSP was monitored over time by the change of absorbance at 330 nm
using the Jasco V630 spectrophotometer. This standard GST assay was measured for 10
minutes at 25ºC.
Molar absorption coefficient ξm, is 4500 1.mol-1.cm-1 (Habig et al., 1974).
Ethacrynic acid (EA)
All the following were added in a quart cuvette accordingly: 2.8 ml Buffer A
(0.1 M Sodium Phosphate, pH 6.8), 0.05 ml 15 mM GSH (freshly prepared) and 0.10 ml
sample. The sample was replaced with buffer A for negative control. Finally, 0.05 ml 12
mM EA is added (total volume 3 ml) and mixed well. Progress on conjugating products
45
with EA was monitored over time by the change of absorbance at 270 nm using the
Jasco V630 spectrophotometer. This standard GST assay was measured for 10 minutes
at 25ºC.
Molar absorption coefficient ξm, is 5000 1.mol-1.cm-1 (Habig et al., 1974).
trans-4-Phenyl-3-butene-2-one (PBO)
All the following were added in a quartz cuvette accordingly: 2.8 ml Buffer
A (0. 1M Sodium Phosphate, pH 6.8), 0.05 ml 15 mM GSH (freshly prepared) and 0.10
ml sample. The sample was replaced with buffer A for negative control. Finally, 0.05
ml 3 mM PBO was added (total volume 3 ml) and mixed well. Progress on conjugating
products with PBO was monitored over time by the change of absorbance at 290 nm
using the Jasco V630 spectrophotometer. This standard GST assay was measured for 10
minutes at 25ºC.
Molar absorption coefficient ξm, is -24800 1.mol-1.cm-1 (Habig et al., 1974).
Hexa-2,4-dienal
All the following were added in a quartz cuvette accordingly: 2.8 ml Buffer
A (0.1M Sodium Phosphate, pH 6.8), 0.05 ml 150 mM GSH (freshly prepared) and 0.10
ml sample. The sample was replaced with buffer A for negative control. Finally, 0.05
ml 3 mM hexa-2,4-dienal was added (total volume 3 ml) and mixed well. Progress on
conjugating products with hexa-2,4-dienal was monitored over time by the change of
absorbance at 280 nm using the Jasco V630 spectrophotometer. This standard GST
assay was measured for 10 minutes at 25ºC. Molar absorption coefficient ξm, is -34200
1.mol-1.cm-1 (Brophy et al., 1989).
46
trans,trans-Hepta-2,4-dienal.
All the following were added in a quart cuvette accordingly: 2.8 ml Buffer
A, 0.05 ml 150 mM GSH (freshly prepared) and 0.10 ml sample. The sample was
replaced with buffer A for negative control. Finally, 0.05 ml 3 mM trans,trans-Hepta-
2,4-dienal is added (total volume 3 ml) and mixed well. Progress on conjugating
products with trans,trans-Hepta-2,4-dienal was monitored over time by the change of
absorbance at 280 nm using the Jasco V630 spectrophotometer. This standard GST
assay was measured for 10 minutes at 25ºC.
Molar absorption coefficient ξm, is -30300 1.mol-1.cm-1 (Brophy et al., 1989).
2.1.18 Thin Layer Chromatography.
A 0.2 mm thick t.l.c silica gel 60 F254 plate was cut into 10 cm X 10 cm. A
light pencil line was drawn at about 1 cm from the end of the chromatographic plate.
Each sample was spotted within a distance of 0.5 cm each. A separate capillary was
used for every sample. Each spot was made as small as possible, no more than 2-3 mm
in diameter. A developing chamber was prepared using a large beaker as a chamber.
The developing solvent, a mixture of butan-1-ol/acetic acid/water (12:3:5, v/v/v) was
poured into the beaker at a depth of approximately 1cm was covered with aluminium
foil to prevent evaporation of the solvent and to allow saturation in the chamber for
about 15 minutes. The prepared t.l.c plate was then placed into the developing chamber
and once again covered with aluminium foil. The plate was removed once the solvent
has risen to near the top of the plate (about 1 cm from the top). Plate was kept in the
hood until the majority of solvent has evaporated from the plate. Once dried, the plate
was stained with ninhydrin (0.25 %, w/v in acetone). The stained spots were outlined
with a marker.
47
2.1.19 Drosophila exposure with/without odorant.
Six bottles containing fresh medium containing oats, sugar and agar (full
recipe in appendix D) was prepared. Approximately 200 mg of adult Drosophila was
transferred into each bottle. A Q-tip dipped in distilled water is inserted into 3 bottles
each to act as negative control while a Q-tip dipped into odorant (benzaldehyde) was
inserted into the remaining 3 bottles to be used as the positive control. The Drosophila
was exposed for 5 days continuously replacing the Q-tips with freshly dipped
odorant/water every day. After 5 days, Q-tips were removed and Drosophila was kept in
-20ºC for further analysis.
48
CHAPTER 3: RESULTS 3.1 RNA extraction
The CG16936 is an epsilon class GST that have not been characterized
previously. The gene that codes this protein contains intron. Thus, RNA instead of DNA
was extracted from Drosophila melanogaster. The concentration of RNA extracted was
quantified using the absorbance readings of the Spectrophotometer. Absorbance was
read at 260 nm and 280 nm. A crude way to calculate the concentration from the
absorption at 260 nm was used:
Beer Lambert’s law: A = e C l
Where A is the measured absorption at 260 nm
e is the RNA extinction coefficient (0.040)
C the RNA concentration
and l is the path length (1 cm)
Purity of nucleotide was evaluated by using the ratio of
Absorbance260nm/Absorbance280nm as a range of 1.7 to 2 is considered pure RNA
(Glasel, 1995).
49
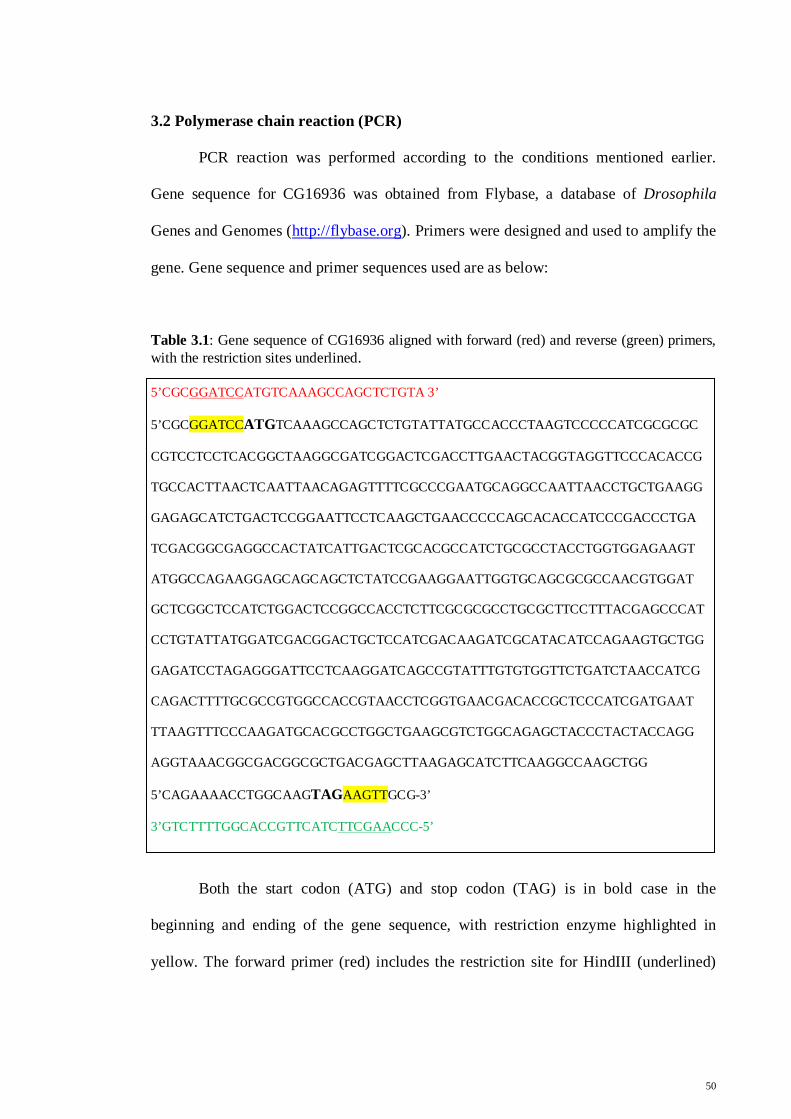
3.2 Polymerase chain reaction (PCR)
PCR reaction was performed according to the conditions mentioned earlier.
Gene sequence for CG16936 was obtained from Flybase, a database of Drosophila
Genes and Genomes (http://flybase.org). Primers were designed and used to amplify the
gene. Gene sequence and primer sequences used are as below:
Table 3.1: Gene sequence of CG16936 aligned with forward (red) and reverse (green) primers, with the restriction sites underlined. 5’CGCGGATCCATGTCAAAGCCAGCTCTGTA 3’
5’CGCGGATCCATGTCAAAGCCAGCTCTGTATTATGCCACCCTAAGTCCCCCATCGCGCGC
CGTCCTCCTCACGGCTAAGGCGATCGGACTCGACCTTGAACTACGGTAGGTTCCCACACCG
TGCCACTTAACTCAATTAACAGAGTTTTCGCCCGAATGCAGGCCAATTAACCTGCTGAAGG
GAGAGCATCTGACTCCGGAATTCCTCAAGCTGAACCCCCAGCACACCATCCCGACCCTGA
TCGACGGCGAGGCCACTATCATTGACTCGCACGCCATCTGCGCCTACCTGGTGGAGAAGT
ATGGCCAGAAGGAGCAGCAGCTCTATCCGAAGGAATTGGTGCAGCGCGCCAACGTGGAT
GCTCGGCTCCATCTGGACTCCGGCCACCTCTTCGCGCGCCTGCGCTTCCTTTACGAGCCCAT
CCTGTATTATGGATCGACGGACTGCTCCATCGACAAGATCGCATACATCCAGAAGTGCTGG
GAGATCCTAGAGGGATTCCTCAAGGATCAGCCGTATTTGTGTGGTTCTGATCTAACCATCG
CAGACTTTTGCGCCGTGGCCACCGTAACCTCGGTGAACGACACCGCTCCCATCGATGAAT
TTAAGTTTCCCAAGATGCACGCCTGGCTGAAGCGTCTGGCAGAGCTACCCTACTACCAGG
AGGTAAACGGCGACGGCGCTGACGAGCTTAAGAGCATCTTCAAGGCCAAGCTGG
5’CAGAAAACCTGGCAAGTAGAAGTTGCG-3’
3’GTCTTTTGGCACCGTTCATCTTCGAACCC-5’
Both the start codon (ATG) and stop codon (TAG) is in bold case in the
beginning and ending of the gene sequence, with restriction enzyme highlighted in
yellow. The forward primer (red) includes the restriction site for HindIII (underlined)
50
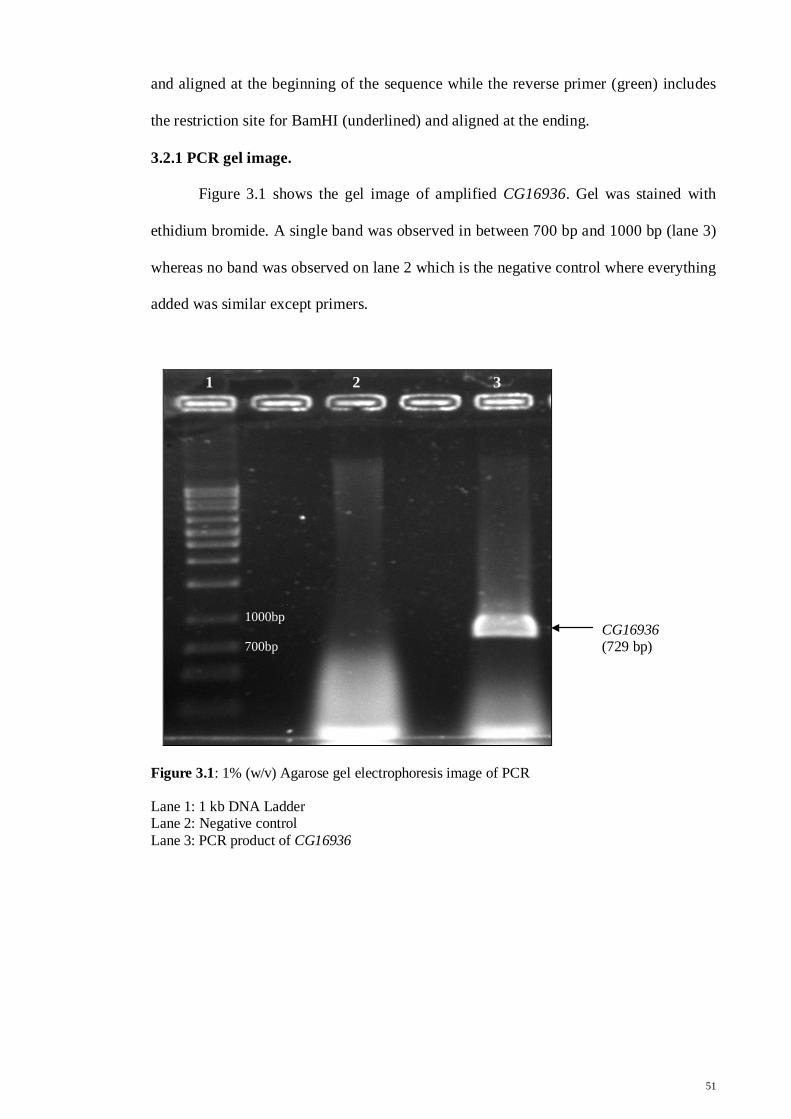
and aligned at the beginning of the sequence while the reverse primer (green) includes
the restriction site for BamHI (underlined) and aligned at the ending.
3.2.1 PCR gel image.
Figure 3.1 shows the gel image of amplified CG16936. Gel was stained with
ethidium bromide. A single band was observed in between 700 bp and 1000 bp (lane 3)
whereas no band was observed on lane 2 which is the negative control where everything
added was similar except primers.
Figure 3.1: 1% (w/v) Agarose gel electrophoresis image of PCR Lane 1: 1 kb DNA Ladder Lane 2: Negative control Lane 3: PCR product of CG16936
1 2 3
CG16936 (729 bp) 700bp
1000bp
51
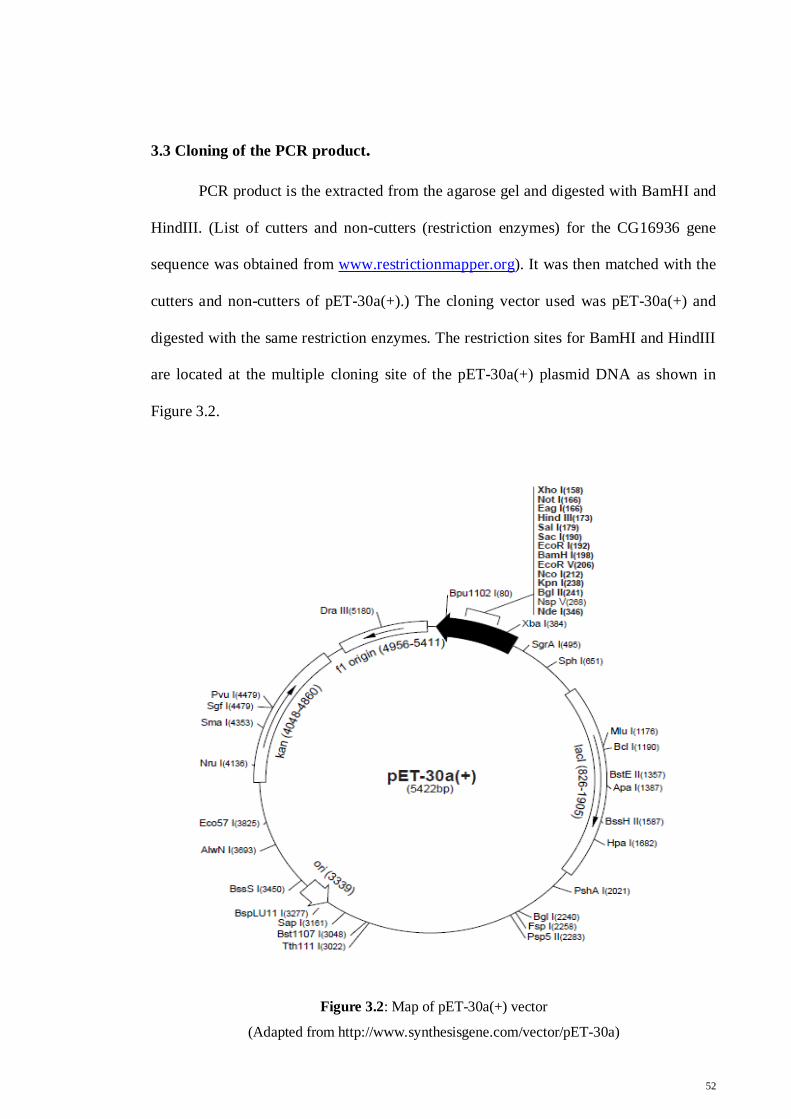
3.3 Cloning of the PCR product.
PCR product is the extracted from the agarose gel and digested with BamHI and
HindIII. (List of cutters and non-cutters (restriction enzymes) for the CG16936 gene
sequence was obtained from www.restrictionmapper.org). It was then matched with the
cutters and non-cutters of pET-30a(+).) The cloning vector used was pET-30a(+) and
digested with the same restriction enzymes. The restriction sites for BamHI and HindIII
are located at the multiple cloning site of the pET-30a(+) plasmid DNA as shown in
Figure 3.2.
Figure 3.2: Map of pET-30a(+) vector
(Adapted from http://www.synthesisgene.com/vector/pET-30a)
52
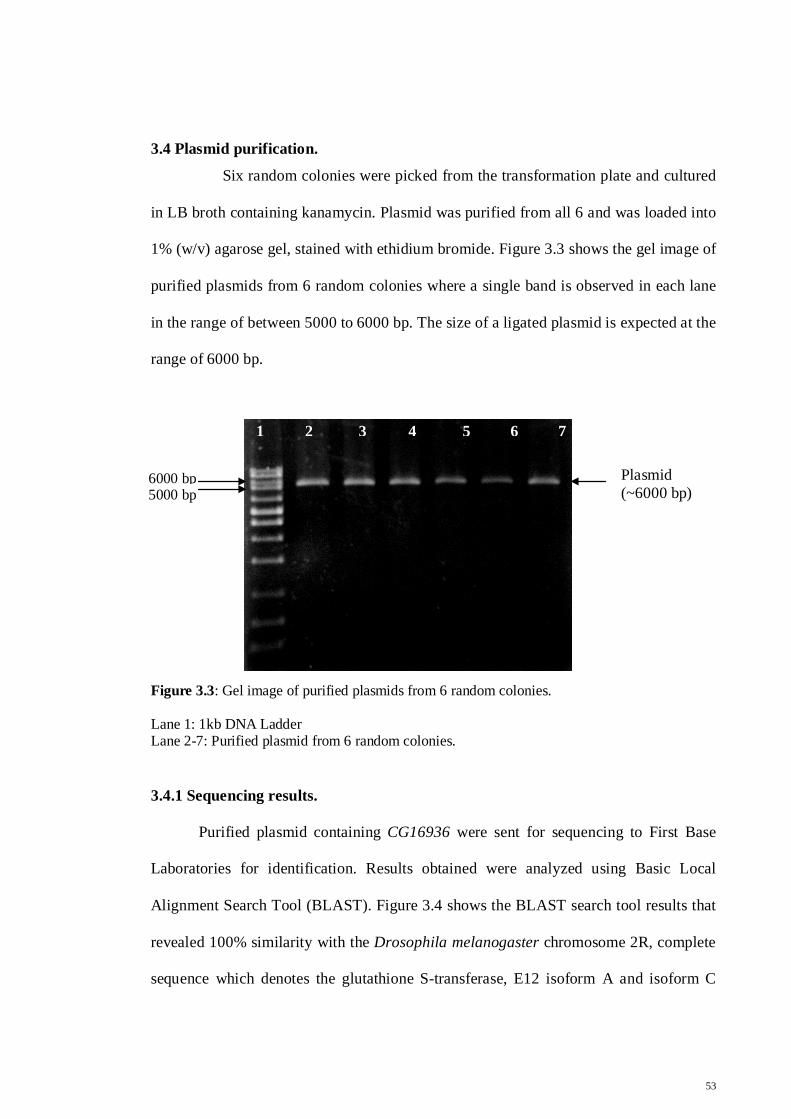
3.4 Plasmid purification.
Six random colonies were picked from the transformation plate and cultured
in LB broth containing kanamycin. Plasmid was purified from all 6 and was loaded into
1% (w/v) agarose gel, stained with ethidium bromide. Figure 3.3 shows the gel image of
purified plasmids from 6 random colonies where a single band is observed in each lane
in the range of between 5000 to 6000 bp. The size of a ligated plasmid is expected at the
range of 6000 bp.
Figure 3.3: Gel image of purified plasmids from 6 random colonies. Lane 1: 1kb DNA Ladder Lane 2-7: Purified plasmid from 6 random colonies.
3.4.1 Sequencing results.
Purified plasmid containing CG16936 were sent for sequencing to First Base
Laboratories for identification. Results obtained were analyzed using Basic Local
Alignment Search Tool (BLAST). Figure 3.4 shows the BLAST search tool results that
revealed 100% similarity with the Drosophila melanogaster chromosome 2R, complete
sequence which denotes the glutathione S-transferase, E12 isoform A and isoform C
1 2 3 4 5 6 7
6000 bp 5000 bp
Plasmid (~6000 bp)
53
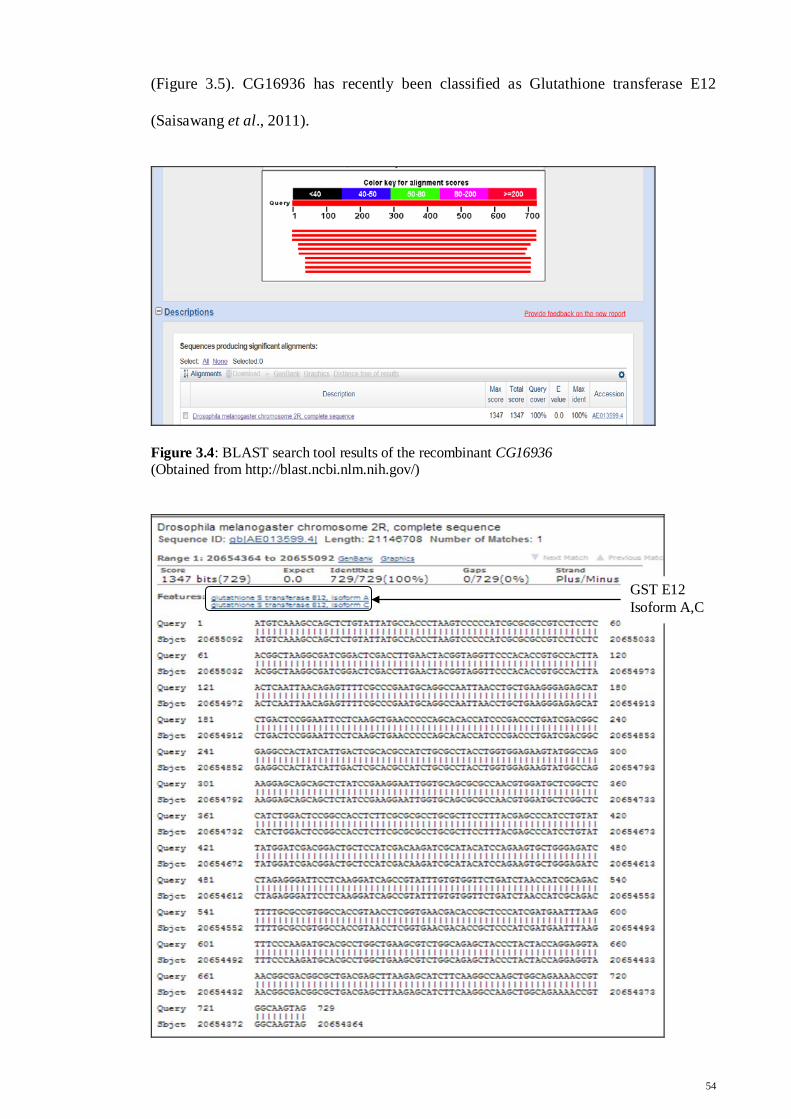
(Figure 3.5). CG16936 has recently been classified as Glutathione transferase E12
(Saisawang et al., 2011).
Figure 3.4: BLAST search tool results of the recombinant CG16936 (Obtained from http://blast.ncbi.nlm.nih.gov/)
GST E12 Isoform A,C
54
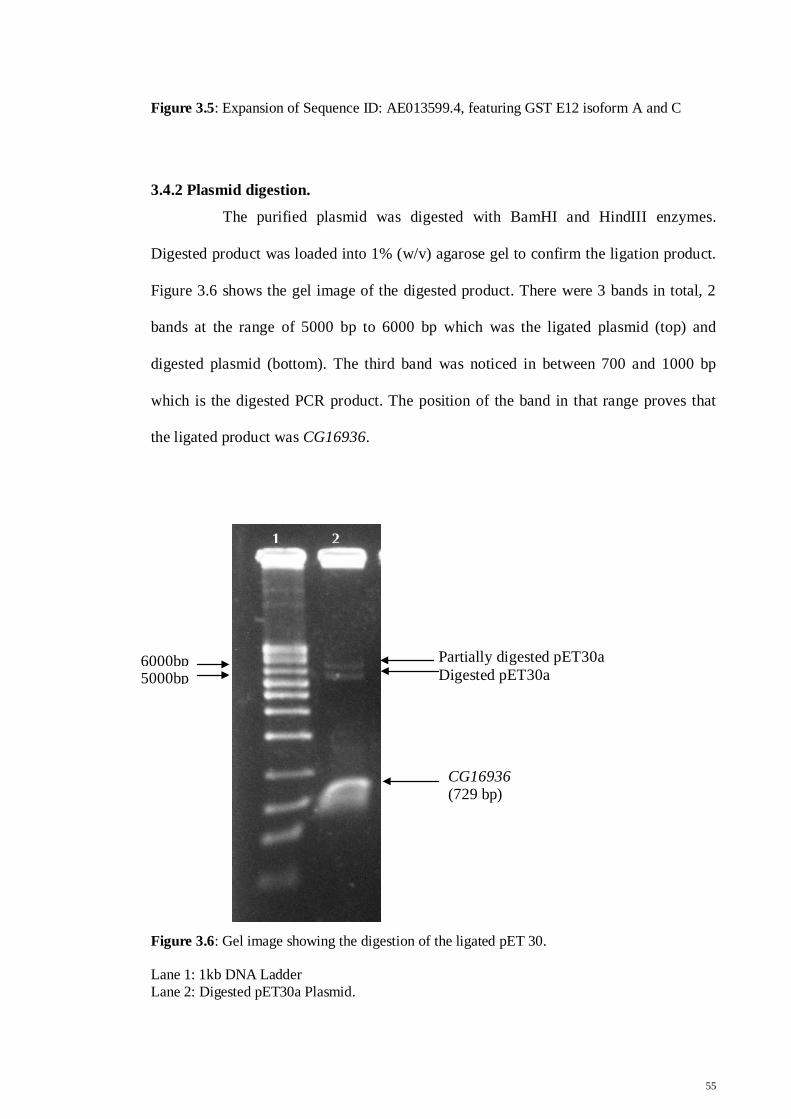
Figure 3.5: Expansion of Sequence ID: AE013599.4, featuring GST E12 isoform A and C
3.4.2 Plasmid digestion.
The purified plasmid was digested with BamHI and HindIII enzymes.
Digested product was loaded into 1% (w/v) agarose gel to confirm the ligation product.
Figure 3.6 shows the gel image of the digested product. There were 3 bands in total, 2
bands at the range of 5000 bp to 6000 bp which was the ligated plasmid (top) and
digested plasmid (bottom). The third band was noticed in between 700 and 1000 bp
which is the digested PCR product. The position of the band in that range proves that
the ligated product was CG16936.
Figure 3.6: Gel image showing the digestion of the ligated pET 30. Lane 1: 1kb DNA Ladder Lane 2: Digested pET30a Plasmid.
1 2
CG16936 (729 bp)
Partially digested pET30a Digested pET30a 5000bp
6000bp
55
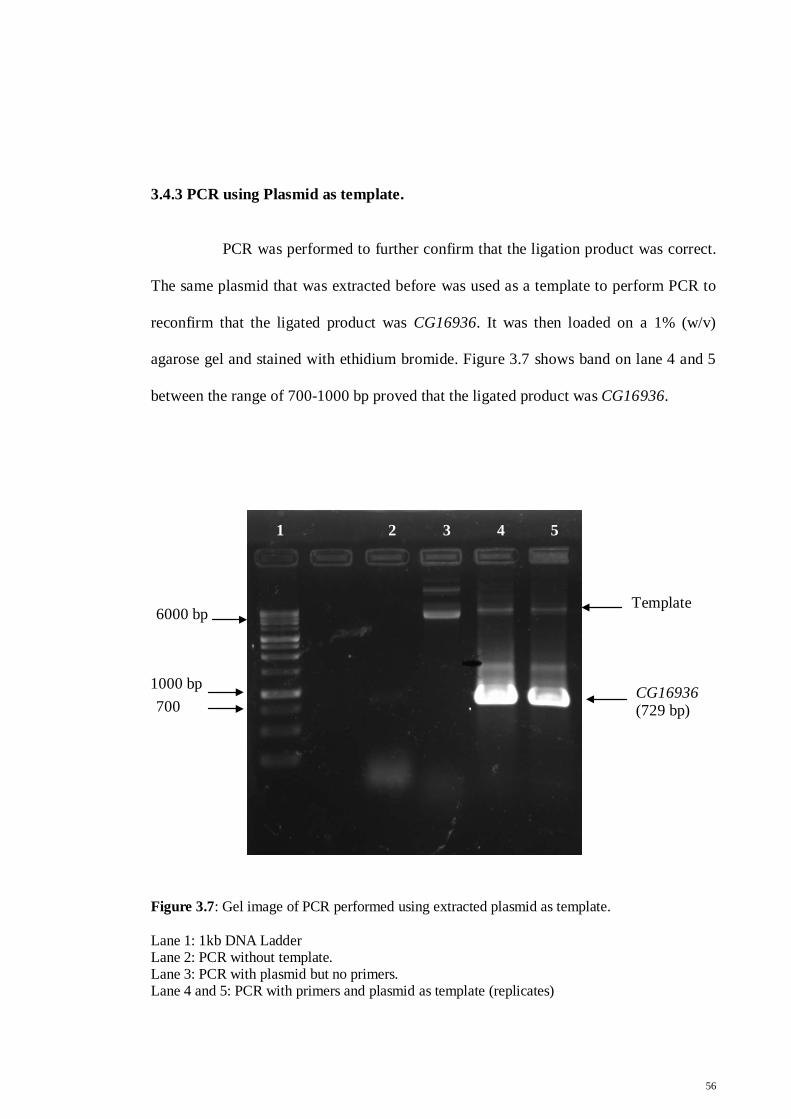
3.4.3 PCR using Plasmid as template.
PCR was performed to further confirm that the ligation product was correct.
The same plasmid that was extracted before was used as a template to perform PCR to
reconfirm that the ligated product was CG16936. It was then loaded on a 1% (w/v)
agarose gel and stained with ethidium bromide. Figure 3.7 shows band on lane 4 and 5
between the range of 700-1000 bp proved that the ligated product was CG16936.
Figure 3.7: Gel image of PCR performed using extracted plasmid as template. Lane 1: 1kb DNA Ladder Lane 2: PCR without template. Lane 3: PCR with plasmid but no primers. Lane 4 and 5: PCR with primers and plasmid as template (replicates)
1 2 3 4 5
Template
CG16936 (729 bp)
6000 bp
700
1000 bp
56
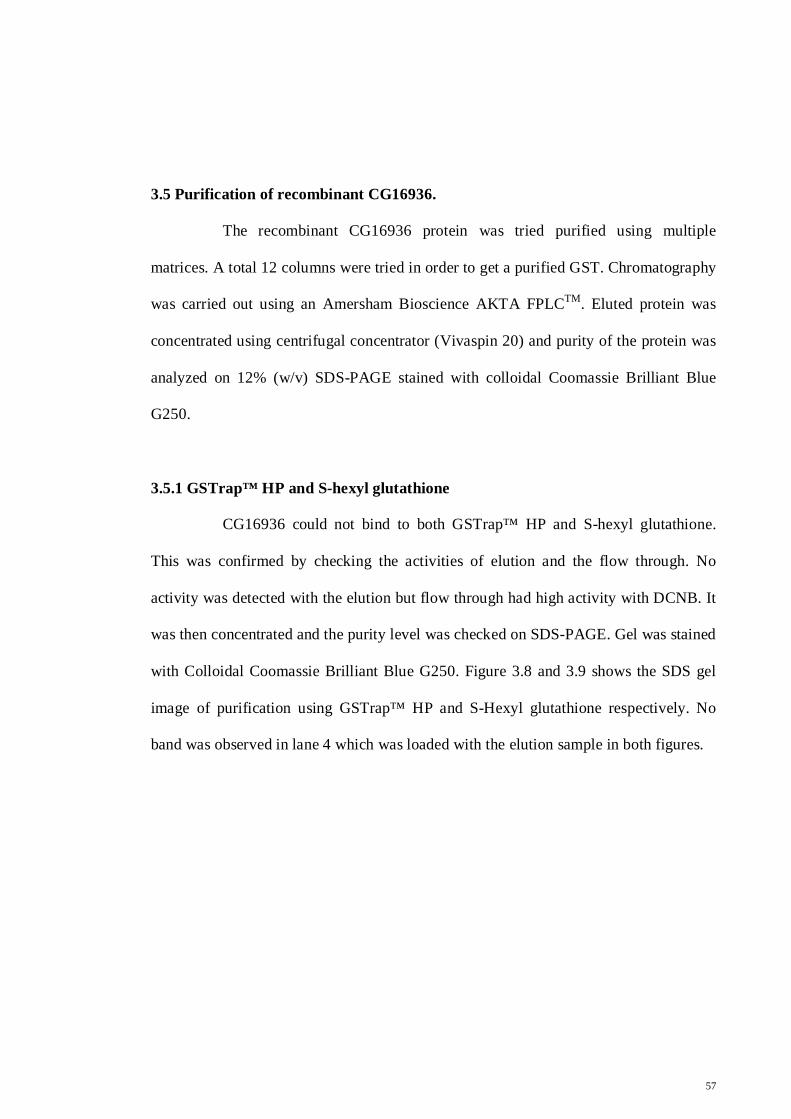
3.5 Purification of recombinant CG16936.
The recombinant CG16936 protein was tried purified using multiple
matrices. A total 12 columns were tried in order to get a purified GST. Chromatography
was carried out using an Amersham Bioscience AKTA FPLCTM. Eluted protein was
concentrated using centrifugal concentrator (Vivaspin 20) and purity of the protein was
analyzed on 12% (w/v) SDS-PAGE stained with colloidal Coomassie Brilliant Blue
G250.
3.5.1 GSTrap™ HP and S-hexyl glutathione
CG16936 could not bind to both GSTrap™ HP and S-hexyl glutathione.
This was confirmed by checking the activities of elution and the flow through. No
activity was detected with the elution but flow through had high activity with DCNB. It
was then concentrated and the purity level was checked on SDS-PAGE. Gel was stained
with Colloidal Coomassie Brilliant Blue G250. Figure 3.8 and 3.9 shows the SDS gel
image of purification using GSTrap™ HP and S-Hexyl glutathione respectively. No
band was observed in lane 4 which was loaded with the elution sample in both figures.
57
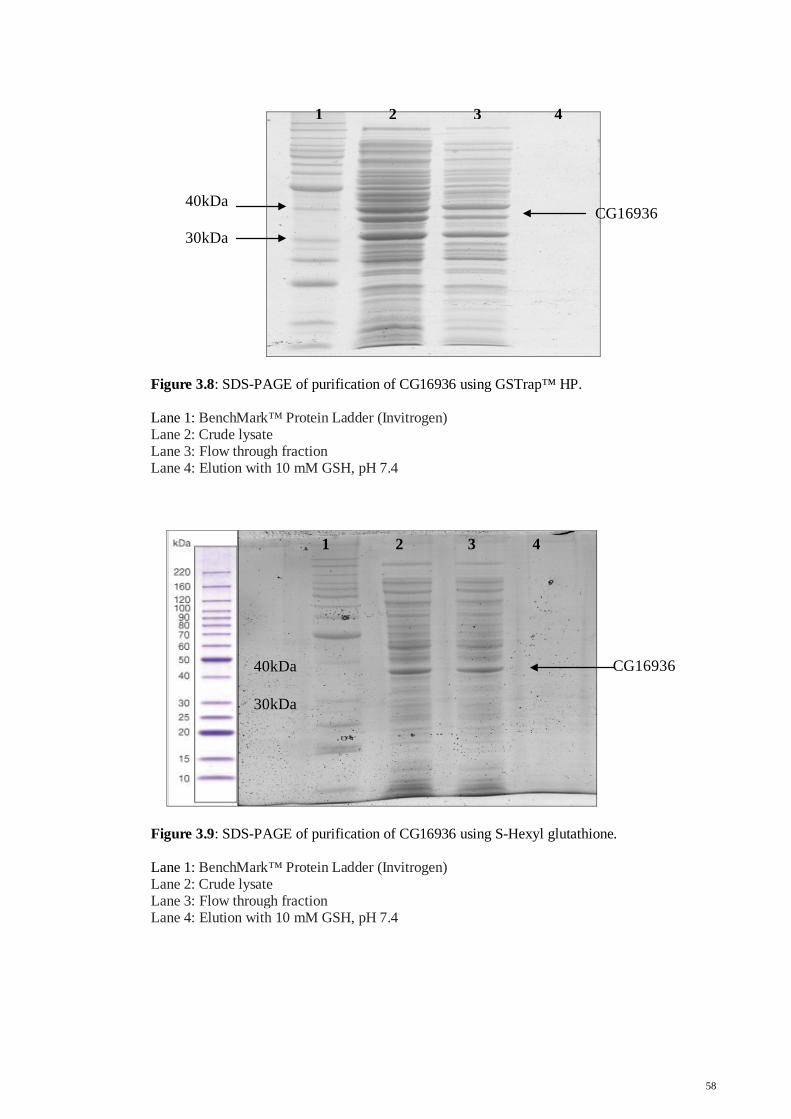
Figure 3.8: SDS-PAGE of purification of CG16936 using GSTrap™ HP. Lane 1: BenchMark™ Protein Ladder (Invitrogen) Lane 2: Crude lysate Lane 3: Flow through fraction Lane 4: Elution with 10 mM GSH, pH 7.4
Figure 3.9: SDS-PAGE of purification of CG16936 using S-Hexyl glutathione.
Lane 1: BenchMark™ Protein Ladder (Invitrogen) Lane 2: Crude lysate Lane 3: Flow through fraction Lane 4: Elution with 10 mM GSH, pH 7.4
3 1 2 4
CG16936 40kDa
30kDa
1 2 3 4
CG16936 40kDa
30kDa
58
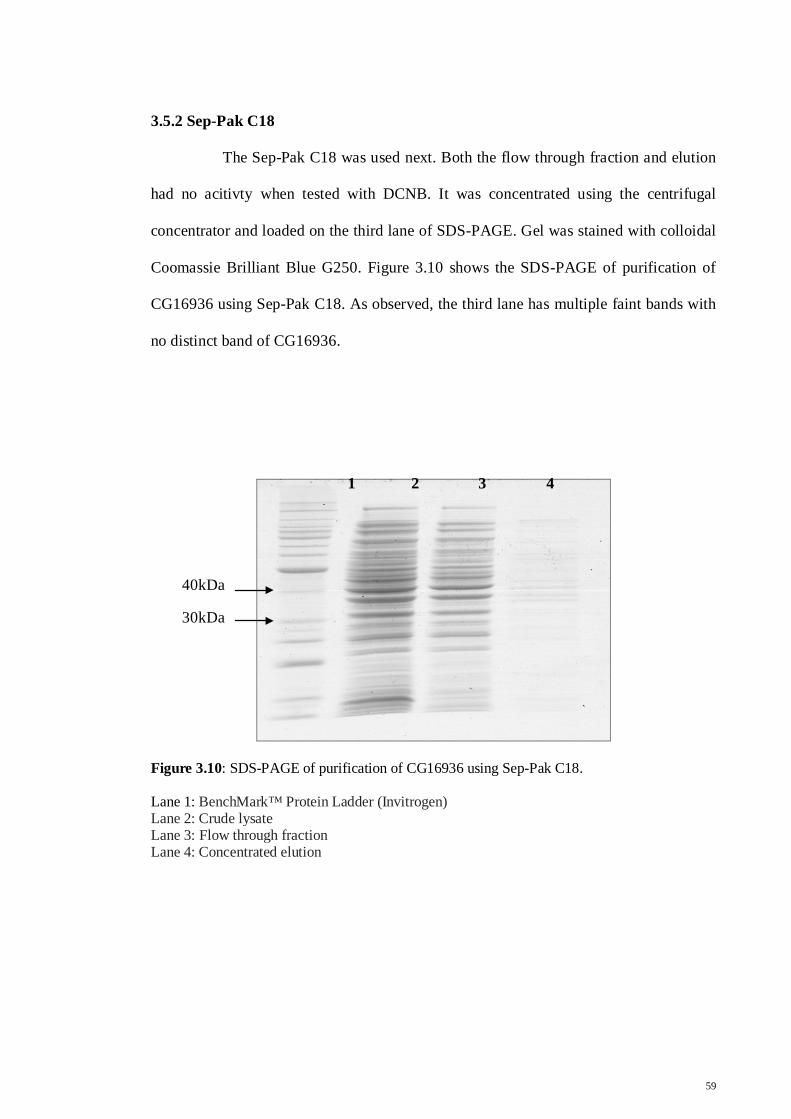
3.5.2 Sep-Pak C18
The Sep-Pak C18 was used next. Both the flow through fraction and elution
had no acitivty when tested with DCNB. It was concentrated using the centrifugal
concentrator and loaded on the third lane of SDS-PAGE. Gel was stained with colloidal
Coomassie Brilliant Blue G250. Figure 3.10 shows the SDS-PAGE of purification of
CG16936 using Sep-Pak C18. As observed, the third lane has multiple faint bands with
no distinct band of CG16936.
Figure 3.10: SDS-PAGE of purification of CG16936 using Sep-Pak C18.
Lane 1: BenchMark™ Protein Ladder (Invitrogen) Lane 2: Crude lysate Lane 3: Flow through fraction Lane 4: Concentrated elution
40kDa
30kDa
1 2 3 4
59
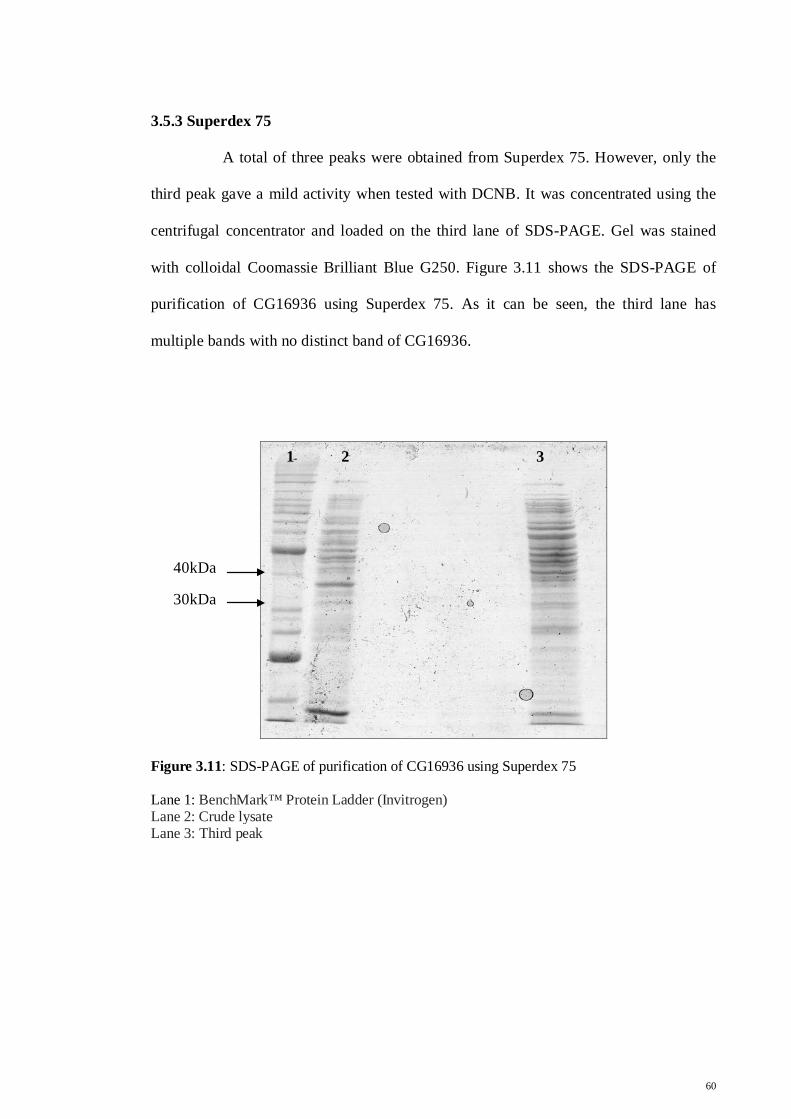
3.5.3 Superdex 75
A total of three peaks were obtained from Superdex 75. However, only the
third peak gave a mild activity when tested with DCNB. It was concentrated using the
centrifugal concentrator and loaded on the third lane of SDS-PAGE. Gel was stained
with colloidal Coomassie Brilliant Blue G250. Figure 3.11 shows the SDS-PAGE of
purification of CG16936 using Superdex 75. As it can be seen, the third lane has
multiple bands with no distinct band of CG16936.
Figure 3.11: SDS-PAGE of purification of CG16936 using Superdex 75
Lane 1: BenchMark™ Protein Ladder (Invitrogen) Lane 2: Crude lysate Lane 3: Third peak
40kDa
30kDa
1 2 3
60
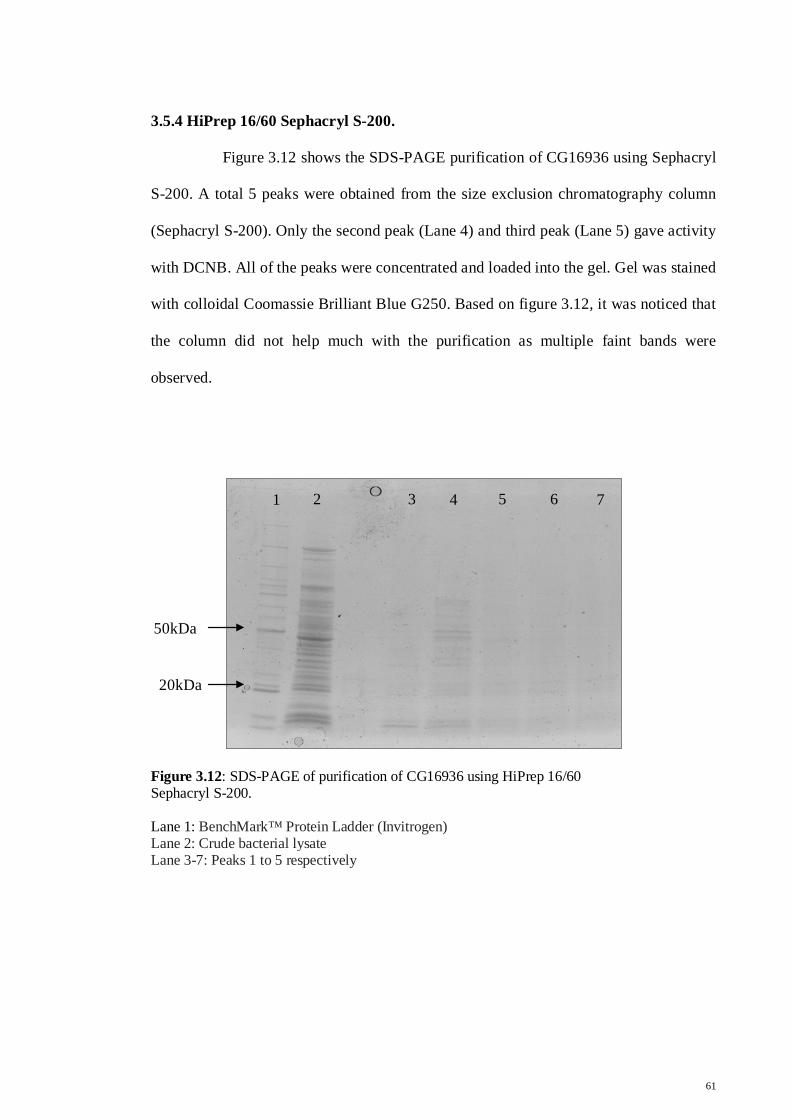
3.5.4 HiPrep 16/60 Sephacryl S-200.
Figure 3.12 shows the SDS-PAGE purification of CG16936 using Sephacryl
S-200. A total 5 peaks were obtained from the size exclusion chromatography column
(Sephacryl S-200). Only the second peak (Lane 4) and third peak (Lane 5) gave activity
with DCNB. All of the peaks were concentrated and loaded into the gel. Gel was stained
with colloidal Coomassie Brilliant Blue G250. Based on figure 3.12, it was noticed that
the column did not help much with the purification as multiple faint bands were
observed.
Figure 3.12: SDS-PAGE of purification of CG16936 using HiPrep 16/60 Sephacryl S-200. Lane 1: BenchMark™ Protein Ladder (Invitrogen) Lane 2: Crude bacterial lysate Lane 3-7: Peaks 1 to 5 respectively
1 2 3 4 5 6 7
50kDa
20kDa
61
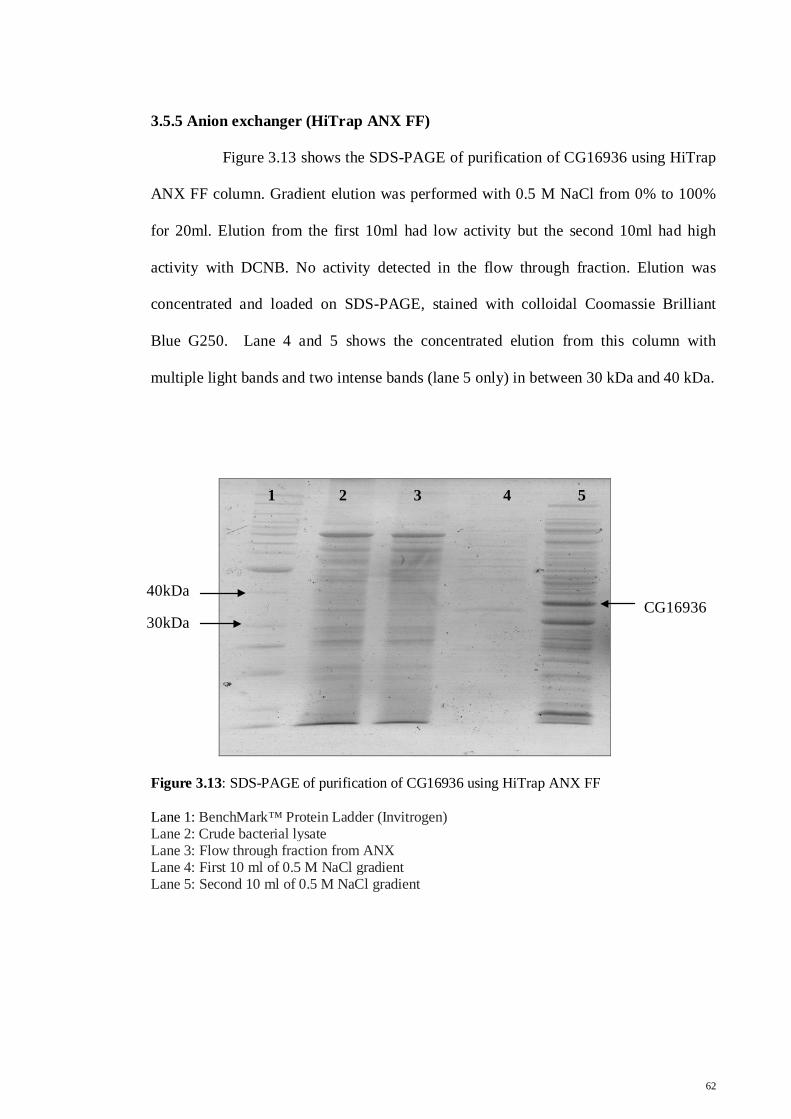
3.5.5 Anion exchanger (HiTrap ANX FF)
Figure 3.13 shows the SDS-PAGE of purification of CG16936 using HiTrap
ANX FF column. Gradient elution was performed with 0.5 M NaCl from 0% to 100%
for 20ml. Elution from the first 10ml had low activity but the second 10ml had high
activity with DCNB. No activity detected in the flow through fraction. Elution was
concentrated and loaded on SDS-PAGE, stained with colloidal Coomassie Brilliant
Blue G250. Lane 4 and 5 shows the concentrated elution from this column with
multiple light bands and two intense bands (lane 5 only) in between 30 kDa and 40 kDa.
Figure 3.13: SDS-PAGE of purification of CG16936 using HiTrap ANX FF
Lane 1: BenchMark™ Protein Ladder (Invitrogen) Lane 2: Crude bacterial lysate Lane 3: Flow through fraction from ANX Lane 4: First 10 ml of 0.5 M NaCl gradient Lane 5: Second 10 ml of 0.5 M NaCl gradient
1 2 3 4 5
CG16936 40kDa
30kDa
62
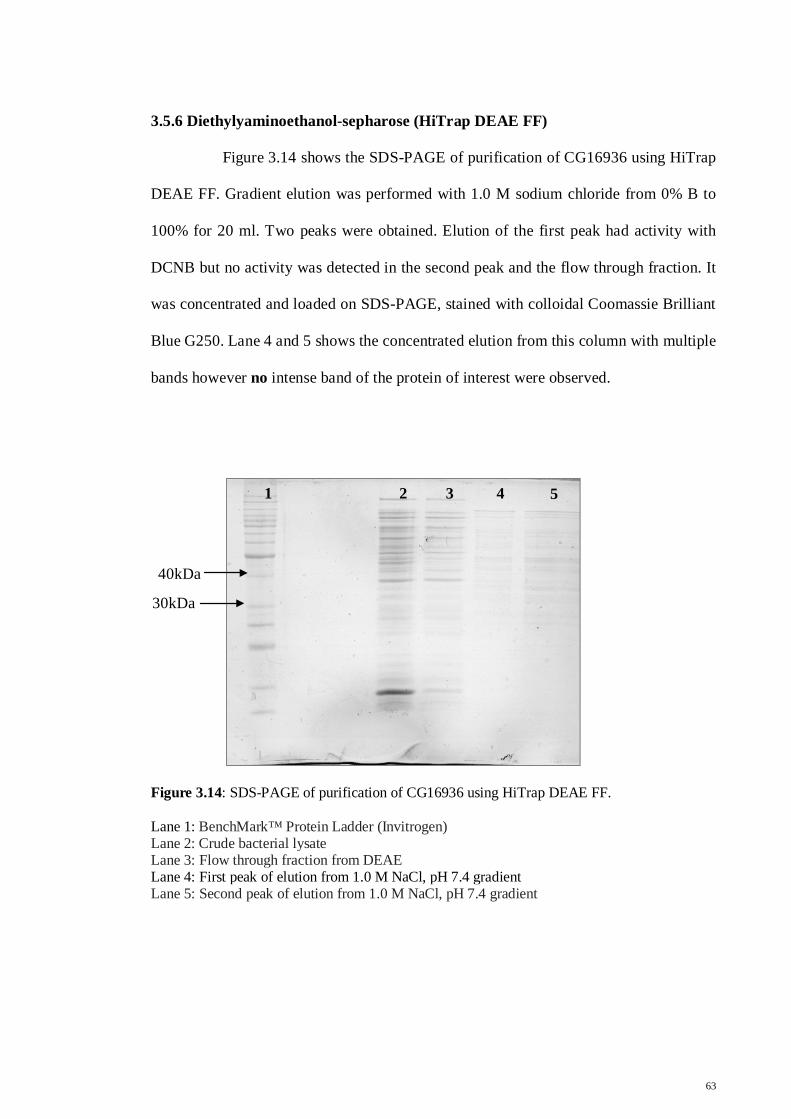
3.5.6 Diethylyaminoethanol-sepharose (HiTrap DEAE FF)
Figure 3.14 shows the SDS-PAGE of purification of CG16936 using HiTrap
DEAE FF. Gradient elution was performed with 1.0 M sodium chloride from 0% B to
100% for 20 ml. Two peaks were obtained. Elution of the first peak had activity with
DCNB but no activity was detected in the second peak and the flow through fraction. It
was concentrated and loaded on SDS-PAGE, stained with colloidal Coomassie Brilliant
Blue G250. Lane 4 and 5 shows the concentrated elution from this column with multiple
bands however no intense band of the protein of interest were observed.
Figure 3.14: SDS-PAGE of purification of CG16936 using HiTrap DEAE FF.
Lane 1: BenchMark™ Protein Ladder (Invitrogen) Lane 2: Crude bacterial lysate Lane 3: Flow through fraction from DEAE Lane 4: First peak of elution from 1.0 M NaCl, pH 7.4 gradient Lane 5: Second peak of elution from 1.0 M NaCl, pH 7.4 gradient
1 2 3 4 5
40kDa
30kDa
63
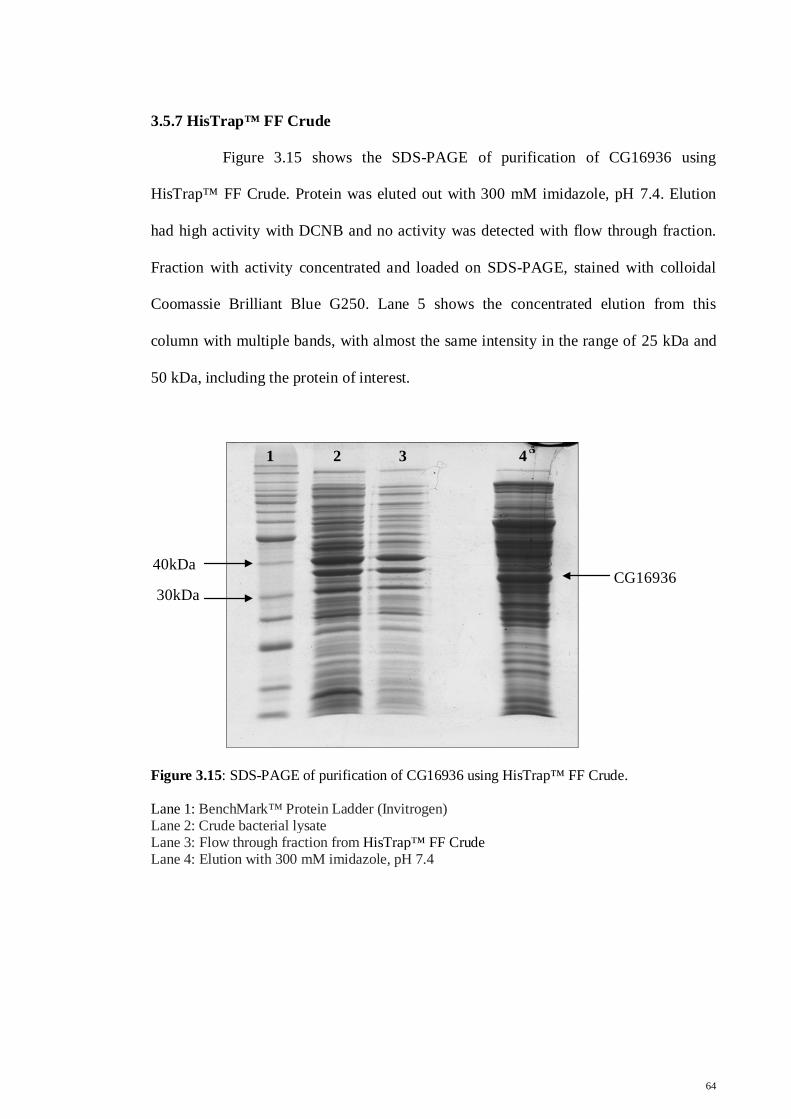
3.5.7 HisTrap™ FF Crude
Figure 3.15 shows the SDS-PAGE of purification of CG16936 using
HisTrap™ FF Crude. Protein was eluted out with 300 mM imidazole, pH 7.4. Elution
had high activity with DCNB and no activity was detected with flow through fraction.
Fraction with activity concentrated and loaded on SDS-PAGE, stained with colloidal
Coomassie Brilliant Blue G250. Lane 5 shows the concentrated elution from this
column with multiple bands, with almost the same intensity in the range of 25 kDa and
50 kDa, including the protein of interest.
Figure 3.15: SDS-PAGE of purification of CG16936 using HisTrap™ FF Crude.
Lane 1: BenchMark™ Protein Ladder (Invitrogen) Lane 2: Crude bacterial lysate Lane 3: Flow through fraction from HisTrap™ FF Crude Lane 4: Elution with 300 mM imidazole, pH 7.4
1 2 3 4
CG16936 40kDa
30kDa
64
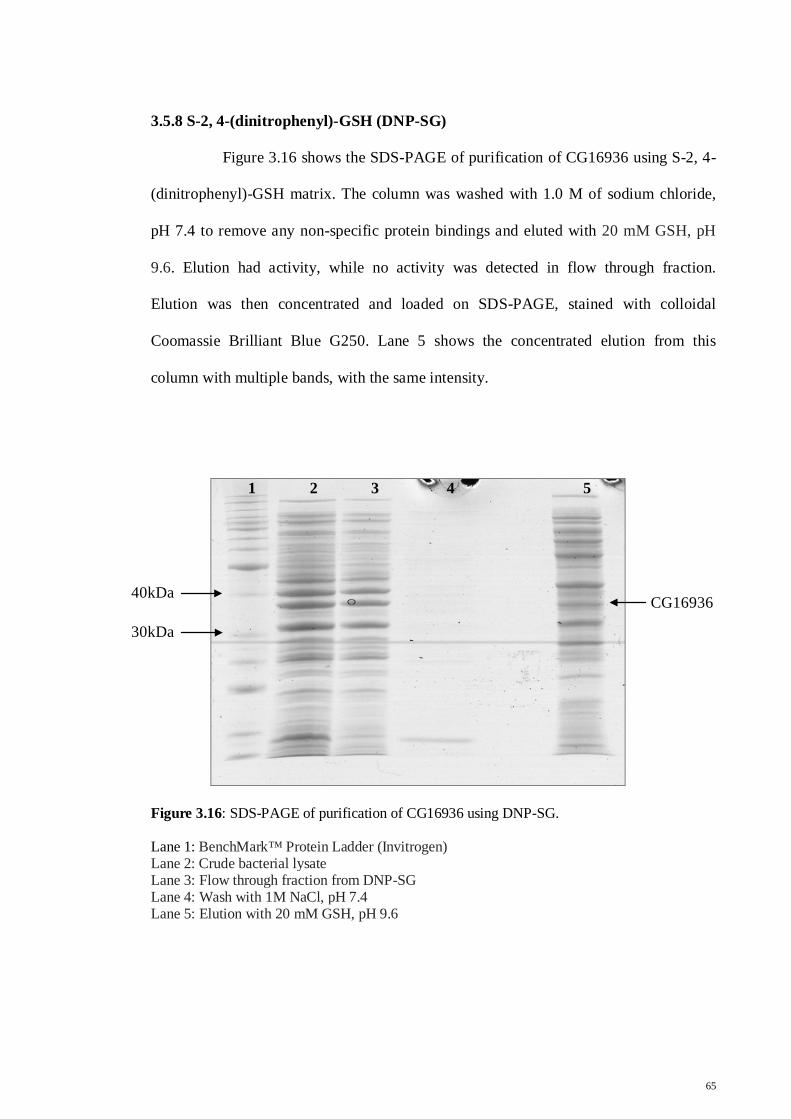
3.5.8 S-2, 4-(dinitrophenyl)-GSH (DNP-SG)
Figure 3.16 shows the SDS-PAGE of purification of CG16936 using S-2, 4-
(dinitrophenyl)-GSH matrix. The column was washed with 1.0 M of sodium chloride,
pH 7.4 to remove any non-specific protein bindings and eluted with 20 mM GSH, pH
9.6. Elution had activity, while no activity was detected in flow through fraction.
Elution was then concentrated and loaded on SDS-PAGE, stained with colloidal
Coomassie Brilliant Blue G250. Lane 5 shows the concentrated elution from this
column with multiple bands, with the same intensity.
Figure 3.16: SDS-PAGE of purification of CG16936 using DNP-SG.
Lane 1: BenchMark™ Protein Ladder (Invitrogen) Lane 2: Crude bacterial lysate Lane 3: Flow through fraction from DNP-SG Lane 4: Wash with 1M NaCl, pH 7.4 Lane 5: Elution with 20 mM GSH, pH 9.6
1 2 3 4 5
CG16936 40kDa
30kDa
65
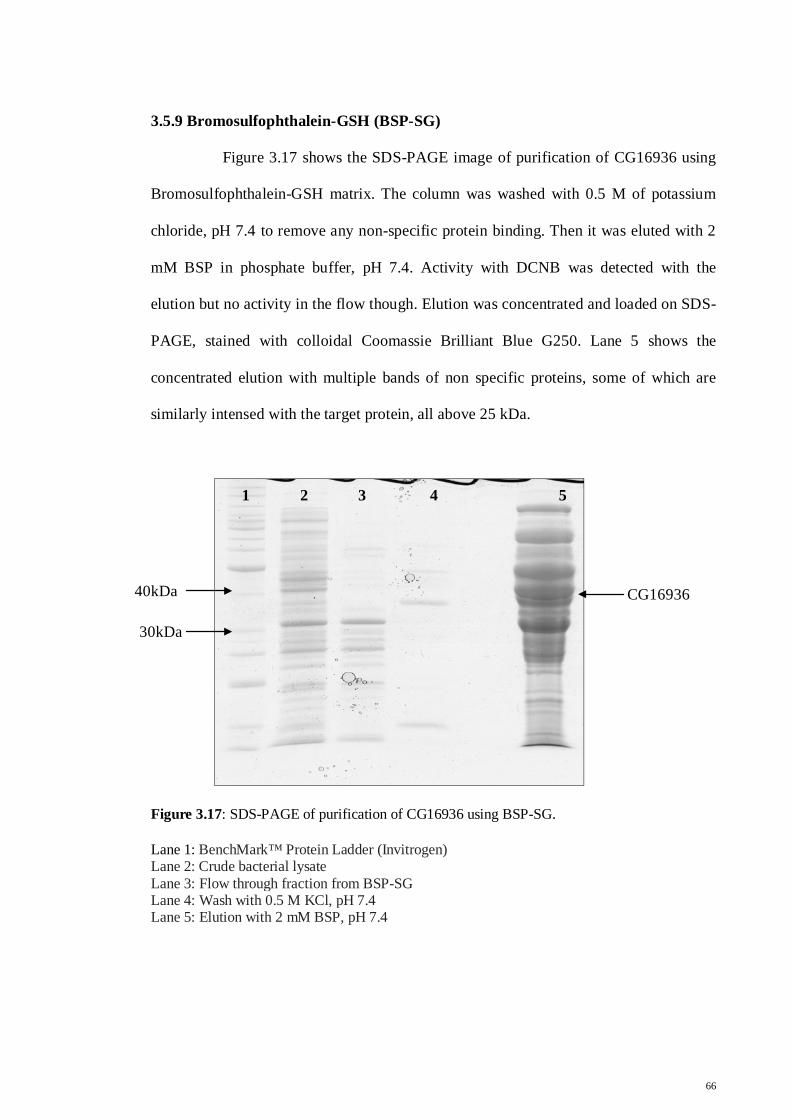
3.5.9 Bromosulfophthalein-GSH (BSP-SG)
Figure 3.17 shows the SDS-PAGE image of purification of CG16936 using
Bromosulfophthalein-GSH matrix. The column was washed with 0.5 M of potassium
chloride, pH 7.4 to remove any non-specific protein binding. Then it was eluted with 2
mM BSP in phosphate buffer, pH 7.4. Activity with DCNB was detected with the
elution but no activity in the flow though. Elution was concentrated and loaded on SDS-
PAGE, stained with colloidal Coomassie Brilliant Blue G250. Lane 5 shows the
concentrated elution with multiple bands of non specific proteins, some of which are
similarly intensed with the target protein, all above 25 kDa.
Figure 3.17: SDS-PAGE of purification of CG16936 using BSP-SG. Lane 1: BenchMark™ Protein Ladder (Invitrogen) Lane 2: Crude bacterial lysate Lane 3: Flow through fraction from BSP-SG Lane 4: Wash with 0.5 M KCl, pH 7.4 Lane 5: Elution with 2 mM BSP, pH 7.4
1 2 3 4 5
CG16936
30kDa
40kDa
66
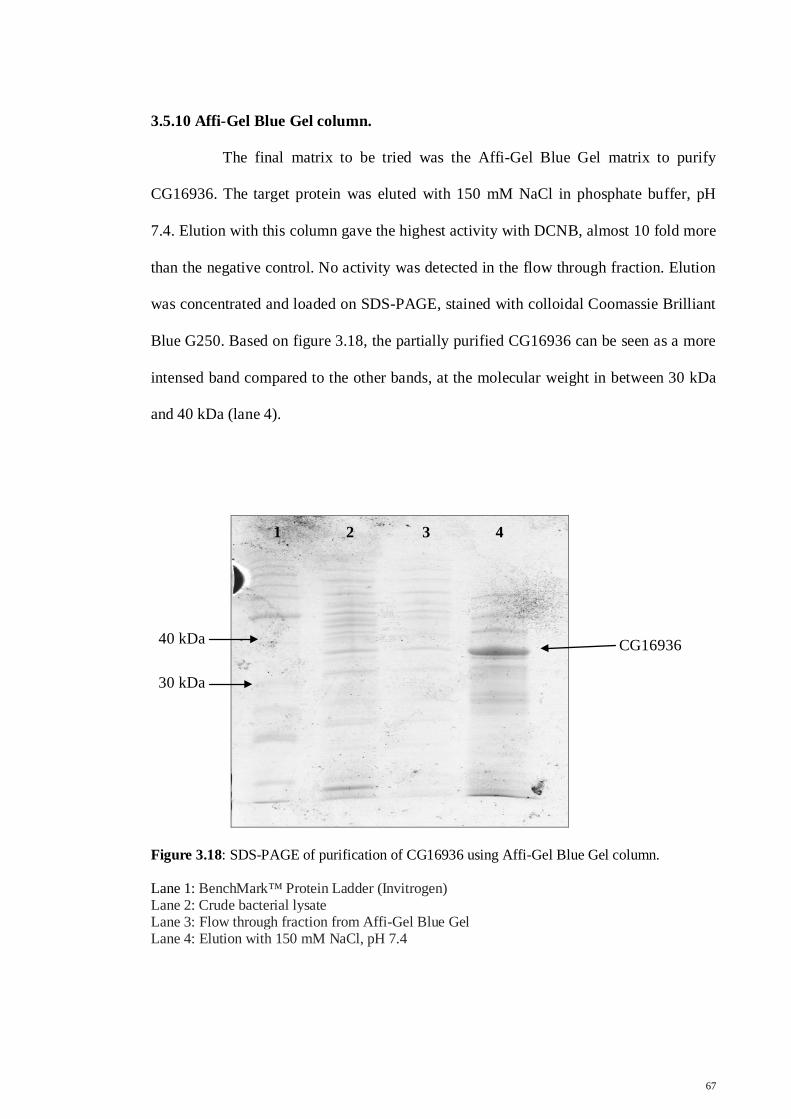
3.5.10 Affi-Gel Blue Gel column.
The final matrix to be tried was the Affi-Gel Blue Gel matrix to purify
CG16936. The target protein was eluted with 150 mM NaCl in phosphate buffer, pH
7.4. Elution with this column gave the highest activity with DCNB, almost 10 fold more
than the negative control. No activity was detected in the flow through fraction. Elution
was concentrated and loaded on SDS-PAGE, stained with colloidal Coomassie Brilliant
Blue G250. Based on figure 3.18, the partially purified CG16936 can be seen as a more
intensed band compared to the other bands, at the molecular weight in between 30 kDa
and 40 kDa (lane 4).
Figure 3.18: SDS-PAGE of purification of CG16936 using Affi-Gel Blue Gel column.
Lane 1: BenchMark™ Protein Ladder (Invitrogen) Lane 2: Crude bacterial lysate Lane 3: Flow through fraction from Affi-Gel Blue Gel Lane 4: Elution with 150 mM NaCl, pH 7.4
1 2 3 4
CG16936
30 kDa
40 kDa
67
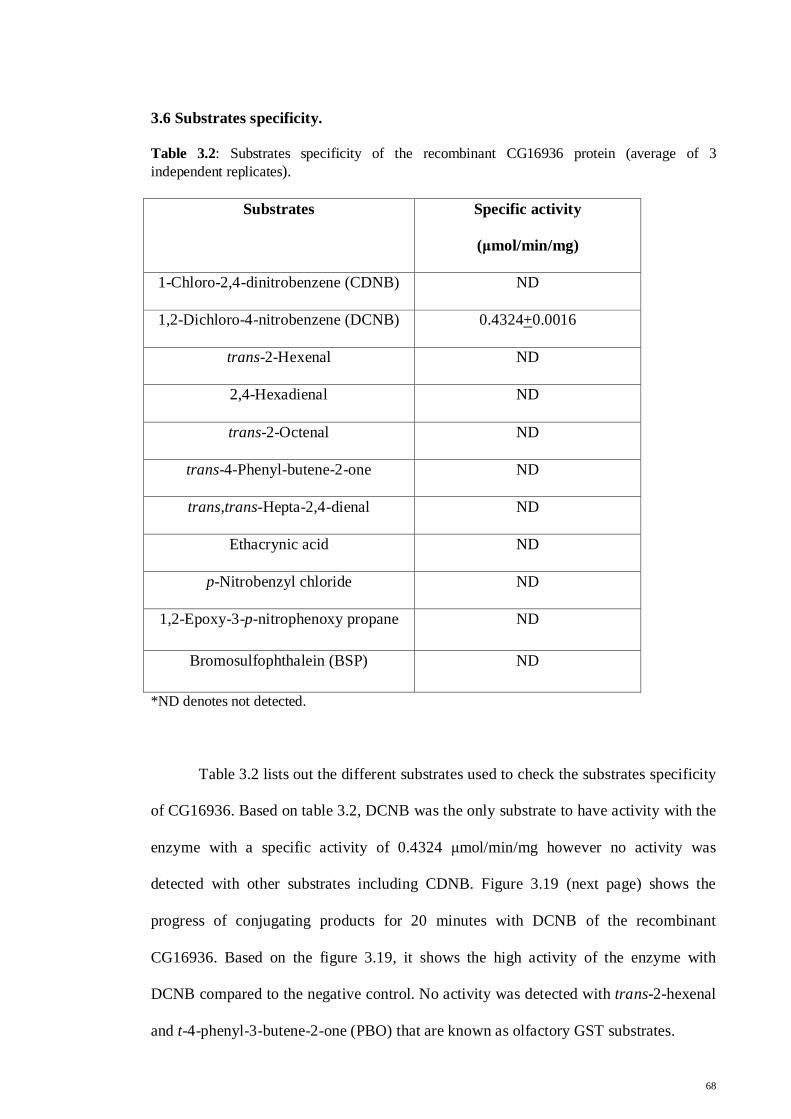
3.6 Substrates specificity.
Table 3.2: Substrates specificity of the recombinant CG16936 protein (average of 3 independent replicates).
Substrates Specific activity
(μmol/min/mg)
1-Chloro-2,4-dinitrobenzene (CDNB) ND
1,2-Dichloro-4-nitrobenzene (DCNB) 0.4324+0.0016
trans-2-Hexenal ND
2,4-Hexadienal ND
trans-2-Octenal ND
trans-4-Phenyl-butene-2-one ND
trans,trans-Hepta-2,4-dienal ND
Ethacrynic acid ND
p-Nitrobenzyl chloride ND
1,2-Epoxy-3-p-nitrophenoxy propane ND
Bromosulfophthalein (BSP) ND
*ND denotes not detected.
Table 3.2 lists out the different substrates used to check the substrates specificity
of CG16936. Based on table 3.2, DCNB was the only substrate to have activity with the
enzyme with a specific activity of 0.4324 μmol/min/mg however no activity was
detected with other substrates including CDNB. Figure 3.19 (next page) shows the
progress of conjugating products for 20 minutes with DCNB of the recombinant
CG16936. Based on the figure 3.19, it shows the high activity of the enzyme with
DCNB compared to the negative control. No activity was detected with trans-2-hexenal
and t-4-phenyl-3-butene-2-one (PBO) that are known as olfactory GST substrates.
68
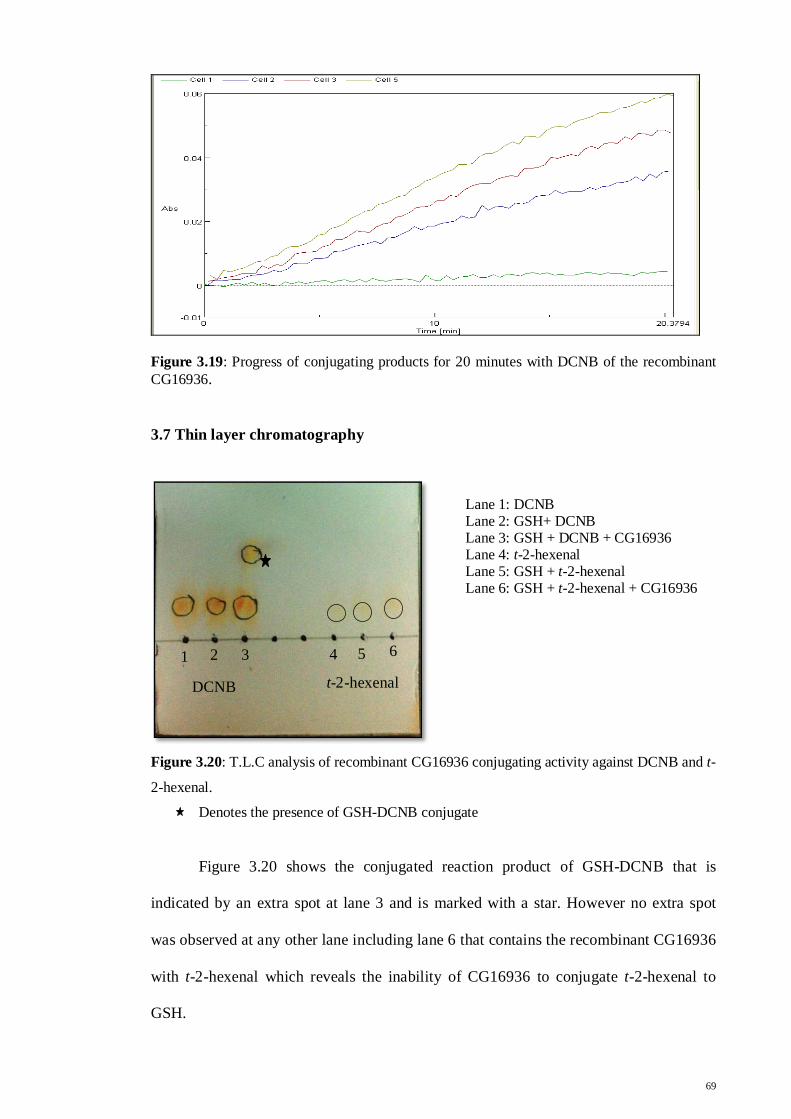
Figure 3.19: Progress of conjugating products for 20 minutes with DCNB of the recombinant CG16936.
3.7 Thin layer chromatography
Figure 3.20: T.L.C analysis of recombinant CG16936 conjugating activity against DCNB and t-
2-hexenal. Denotes the presence of GSH-DCNB conjugate
Figure 3.20 shows the conjugated reaction product of GSH-DCNB that is
indicated by an extra spot at lane 3 and is marked with a star. However no extra spot
was observed at any other lane including lane 6 that contains the recombinant CG16936
with t-2-hexenal which reveals the inability of CG16936 to conjugate t-2-hexenal to
GSH.
Lane 1: DCNB Lane 2: GSH+ DCNB Lane 3: GSH + DCNB + CG16936 Lane 4: t-2-hexenal Lane 5: GSH + t-2-hexenal Lane 6: GSH + t-2-hexenal + CG16936
DCNB t-2-hexenal 1 2 3 4 5 6
69
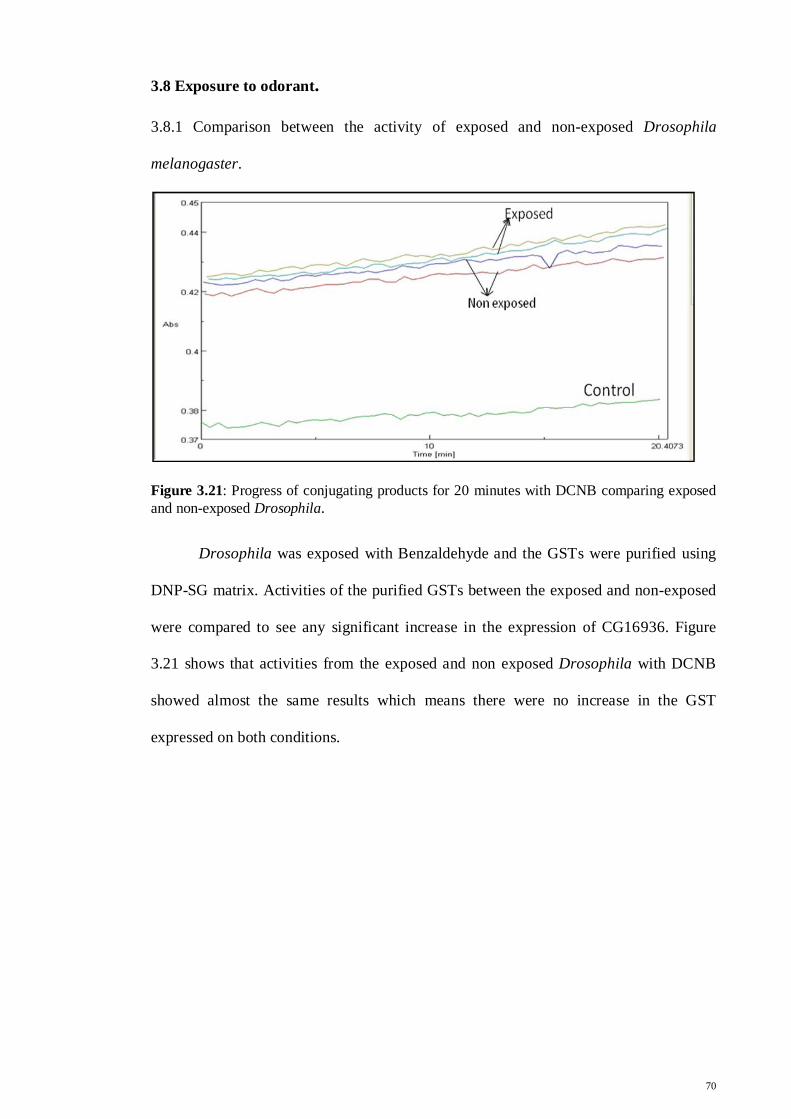
3.8 Exposure to odorant.
3.8.1 Comparison between the activity of exposed and non-exposed Drosophila
melanogaster.
Figure 3.21: Progress of conjugating products for 20 minutes with DCNB comparing exposed and non-exposed Drosophila.
Drosophila was exposed with Benzaldehyde and the GSTs were purified using
DNP-SG matrix. Activities of the purified GSTs between the exposed and non-exposed
were compared to see any significant increase in the expression of CG16936. Figure
3.21 shows that activities from the exposed and non exposed Drosophila with DCNB
showed almost the same results which means there were no increase in the GST
expressed on both conditions.
70
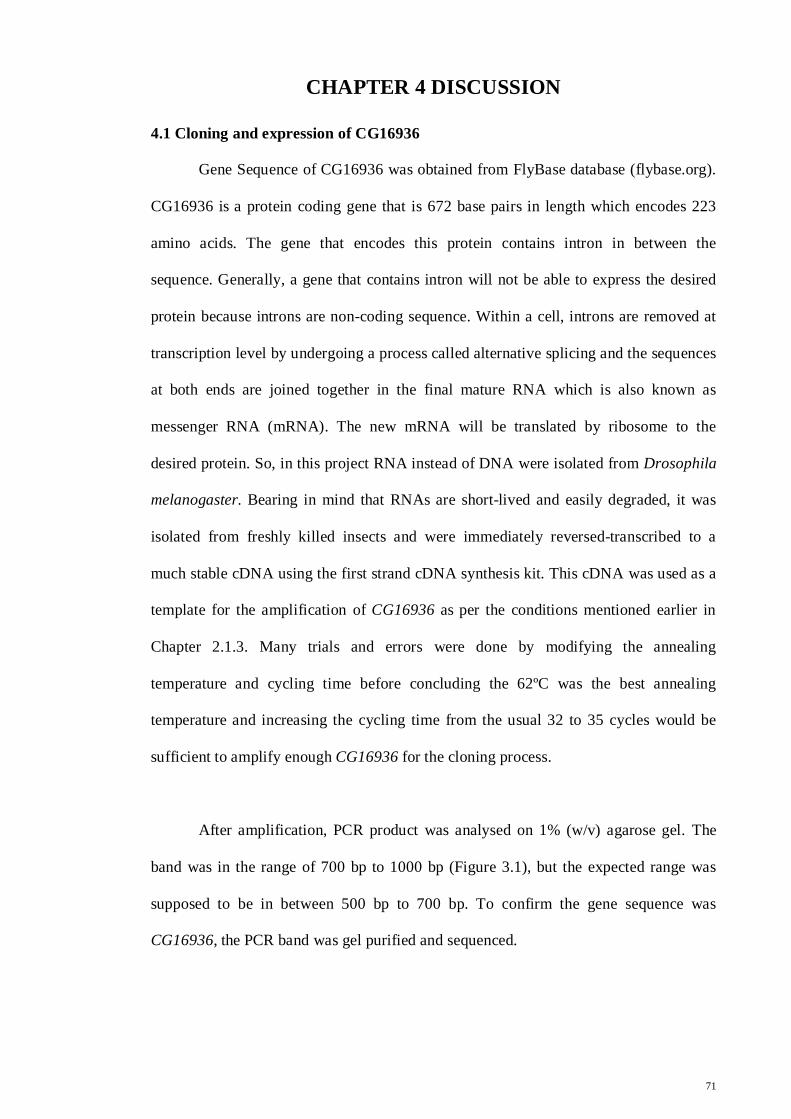
CHAPTER 4 DISCUSSION
4.1 Cloning and expression of CG16936
Gene Sequence of CG16936 was obtained from FlyBase database (flybase.org).
CG16936 is a protein coding gene that is 672 base pairs in length which encodes 223
amino acids. The gene that encodes this protein contains intron in between the
sequence. Generally, a gene that contains intron will not be able to express the desired
protein because introns are non-coding sequence. Within a cell, introns are removed at
transcription level by undergoing a process called alternative splicing and the sequences
at both ends are joined together in the final mature RNA which is also known as
messenger RNA (mRNA). The new mRNA will be translated by ribosome to the
desired protein. So, in this project RNA instead of DNA were isolated from Drosophila
melanogaster. Bearing in mind that RNAs are short-lived and easily degraded, it was
isolated from freshly killed insects and were immediately reversed-transcribed to a
much stable cDNA using the first strand cDNA synthesis kit. This cDNA was used as a
template for the amplification of CG16936 as per the conditions mentioned earlier in
Chapter 2.1.3. Many trials and errors were done by modifying the annealing
temperature and cycling time before concluding the 62ºC was the best annealing
temperature and increasing the cycling time from the usual 32 to 35 cycles would be
sufficient to amplify enough CG16936 for the cloning process.
After amplification, PCR product was analysed on 1% (w/v) agarose gel. The
band was in the range of 700 bp to 1000 bp (Figure 3.1), but the expected range was
supposed to be in between 500 bp to 700 bp. To confirm the gene sequence was
CG16936, the PCR band was gel purified and sequenced.
71
The sequencing results were analysed using Basic Local Alignment Search Tool
(BLAST) to identify the gene sequence. Result matched 100% to the Drosophila
melanogaster chromosome 2R, complete sequence (Figure 3.4). The result was clicked
to expand, and the gene sequence was aligned to Glutathione s-transferase E12 isoform
A and C (Figure 3.5). A recent paper on the studies of the proteome of Drosophila
melanogaster has classified CG16936, as Glutathione transferase, E12 (DmGSTE12)
(Saisawang et al., 2011). Another paper on the purifications of GSTs from Drosophila
melanogaster identified 4 isoforms of CG16936 with the same molecular weight but
differing pI values ranging from 5.0 to 5.4 (Pal et al., 2012) although theoretically, it
was said to have a pI value of 5.9 (Alias & Clark, 2007). It is known that alternative
splicing could actually help producing multiple protein isoforms with just a single gene
(Black, 2003).
Many studies have proved the existence of alternative splicing in insect genes.
For example, Ranson et al., (1998) reported the involvement of alternative RNA
splicing in generating multiple functional GST transcripts in the Anopheles gambiae.
Another study on the proteome of Drosophila melanogaster identified 36 cytosolic GST
genes that expressed 41 protein products through alternative splicing (Saisawang et al.,
2011). In addition to that, out of 28 genes that encodes cytosolic GSTs in Anopheles
gambiae, two were alternatively spliced which resulted to a total of 32 transcripts (Ding
et al., 2003). Based on these facts, it can be assumed that CG16936 that was expressed
in this project was longer in sequence because it could be a result of a newly spliced
gene. Hence, the difference in the size of the amplified and the theoretical gene
sequence.
72
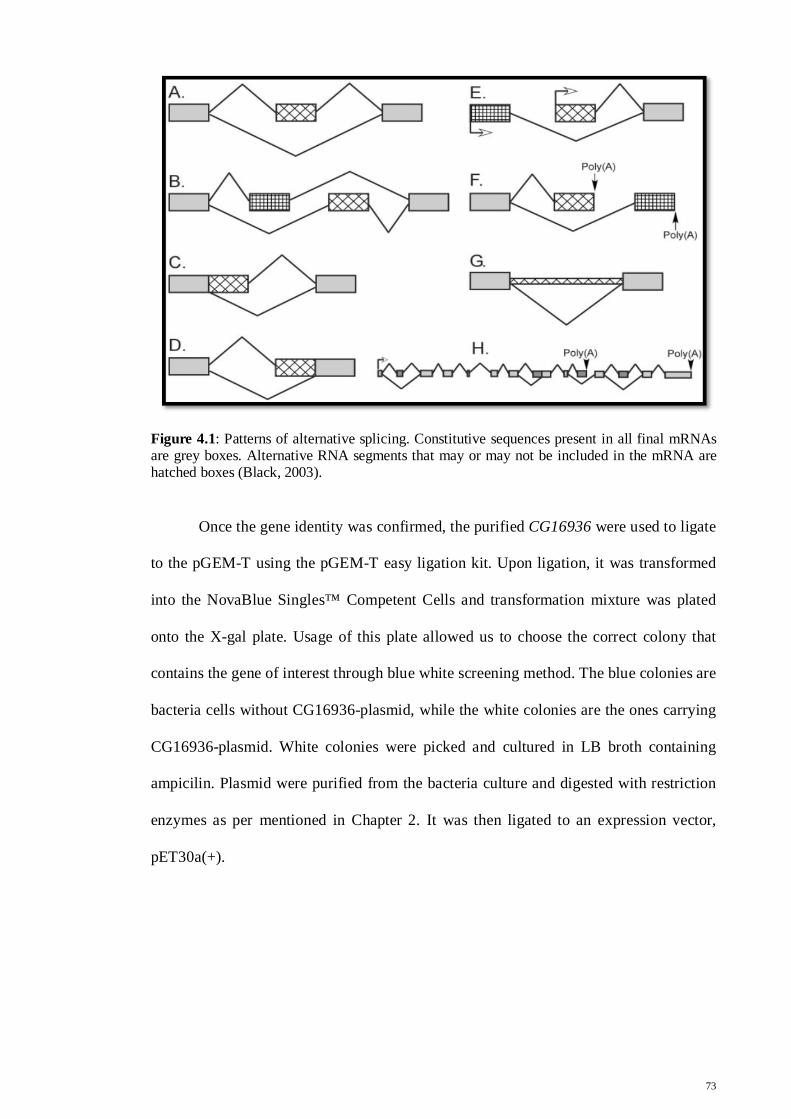
Figure 4.1: Patterns of alternative splicing. Constitutive sequences present in all final mRNAs are grey boxes. Alternative RNA segments that may or may not be included in the mRNA are hatched boxes (Black, 2003).
Once the gene identity was confirmed, the purified CG16936 were used to ligate
to the pGEM-T using the pGEM-T easy ligation kit. Upon ligation, it was transformed
into the NovaBlue Singles™ Competent Cells and transformation mixture was plated
onto the X-gal plate. Usage of this plate allowed us to choose the correct colony that
contains the gene of interest through blue white screening method. The blue colonies are
bacteria cells without CG16936-plasmid, while the white colonies are the ones carrying
CG16936-plasmid. White colonies were picked and cultured in LB broth containing
ampicilin. Plasmid were purified from the bacteria culture and digested with restriction
enzymes as per mentioned in Chapter 2. It was then ligated to an expression vector,
pET30a(+).
73
Restriction enzymes were chosen by comparing the non-cutters and cutters of
the gene sequence of CG16936 and pET-30a(+) vector. The pET-30a(+) system were
used to express the protein because many studies proved to have successfully cloned
GSTs with this vector and had a well expressed protein. For example, the cloning of a
pi-class GST from freshwater mussels Cristaria plicata (Hu et al., 2012) and GSTs
from Drosophila melanogaster (Sawicki et al., 2003). The pET30a(+) are one of the
best vectors known for its good expression level because it uses the T7 promoter system
that can be induced by adding IPTG. Besides that it also carries the His.Tag sequence at
the N-terminal. Choosing the appropriate restriction enzymes will help to attach the
histidine tagging to the protein of interest which could help with protein purification
later.
Upon digesting the pET30a(+) plasmid, it was loaded on a 1% (w/v) agarose gel
to check the digestion level. The band that contained the digested plasmid was carefully
excised and gel purified. This was done for two reasons. Firstly was to remove the
undigested plasmids. Secondly, was to remove the short fragments resulted from the
digested plasmid to prevent religation and circularization of the plasmid. Next, the
purified digested plasmid was ligated with the digested CG16936 using T4 DNA ligase
kit as per instruction.
Ligated plasmids were transformed into E.coli BL21 (DE3) pLysS host. This
strain was used because it is the best competent cells that provide varying levels of
expression control with T7 promoter-driven, vectors such as the pET vector. It was used
in the cloning and expression of delta class GSTs in Drosophila melanogaster (Sawicki
et al., 2003) and Epsilon class GSTs in Anopheles Cracens (Wongtrakul et al., 2009).
Transformed E.coli was spread on agar plate containing Kanamycin. The plate was
74
incubated for 16 hours at 37ºC. The cells that didn’t uptake the ligated plasmid will not
be able to grow while the cells that contained the pET30-CG16936 will be able to
develop resistance towards kanamycin as the pET30a(+) has a kanamycin resistant
gene. This was an additional step to be selective towards the colonies that contained the
plasmid.
Six random colonies were picked and cultured in LB broth containing
Kanamycin sulphate. The colony that doesn’t have the plasmid will not be able to grow.
Plasmids were purified from these bacterial cultures using plasmid purification kit.
Upon purification, it was loaded into 1% (w/v) agarose gel to check for purity and size.
It showed a single band at approximately 6000 bp (figure 3.3). The size of pET30a and
CG16936 is about 5400 and 700 bp respectively. The size of the ligated plasmid was
expected at 6000 bp approximately. Once the size has been confirmed, the purified
plasmid was then double digested and the mixture was loaded into 1% (w/v) agarose gel
to check if the insert was in correct size.
The gel image showed 3 bands in total (Figure 3.6). Two bands were at the
range of 5000 bp and 6000 bp which is the undigested plasmid (top) and digested
plasmid (bottom). A single band was observed in between 700 bp and 1000 bp, which
was believed to be CG16936.
Finally, to confirm that the insert was CG16936, the same plasmid was used as a
template to perform PCR using the Forward and Reverse primers specific for CG16936.
The PCR product was loaded on 1% (w/v) agarose gel once again to check if there is
any gene amplified and there was single band in between 700 bp and 1000 bp (Figure
3.7). All those procedures confirmed the ligation of CG16936 with pET30a. The
75
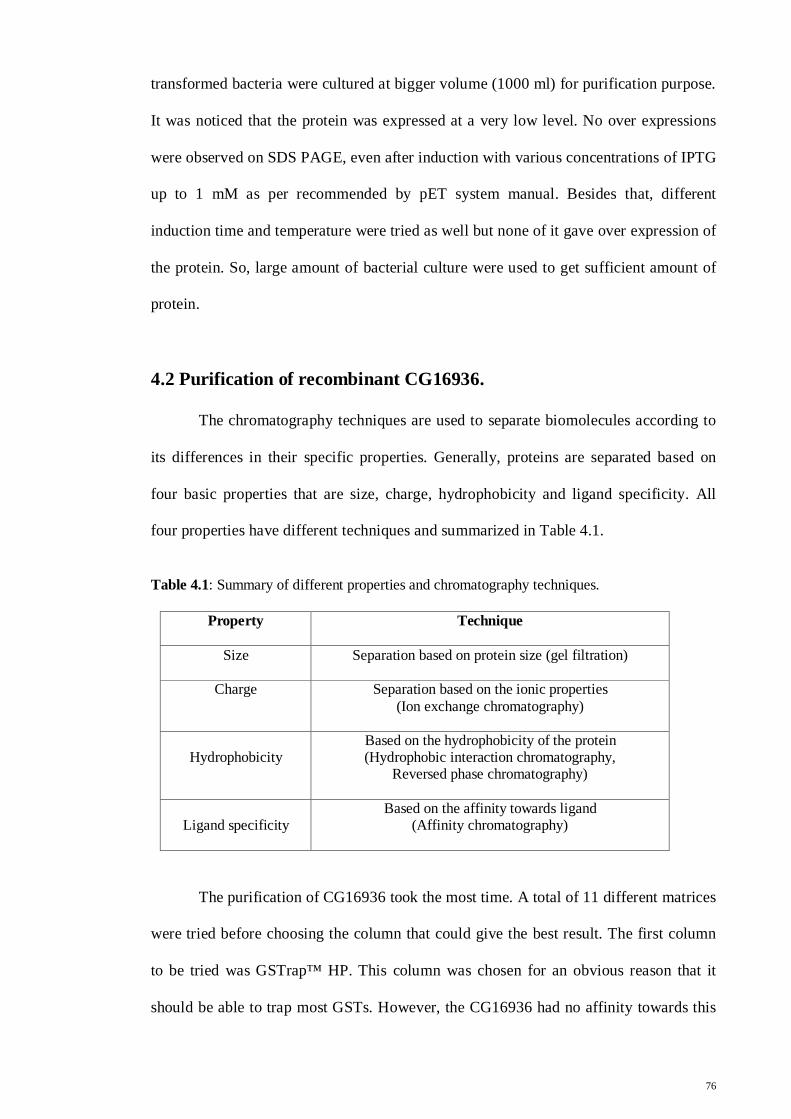
transformed bacteria were cultured at bigger volume (1000 ml) for purification purpose.
It was noticed that the protein was expressed at a very low level. No over expressions
were observed on SDS PAGE, even after induction with various concentrations of IPTG
up to 1 mM as per recommended by pET system manual. Besides that, different
induction time and temperature were tried as well but none of it gave over expression of
the protein. So, large amount of bacterial culture were used to get sufficient amount of
protein.
4.2 Purification of recombinant CG16936.
The chromatography techniques are used to separate biomolecules according to
its differences in their specific properties. Generally, proteins are separated based on
four basic properties that are size, charge, hydrophobicity and ligand specificity. All
four properties have different techniques and summarized in Table 4.1.
Table 4.1: Summary of different properties and chromatography techniques.
Property Technique
Size Separation based on protein size (gel filtration)
Charge Separation based on the ionic properties (Ion exchange chromatography)
Hydrophobicity Based on the hydrophobicity of the protein (Hydrophobic interaction chromatography,
Reversed phase chromatography)
Ligand specificity
Based on the affinity towards ligand (Affinity chromatography)
The purification of CG16936 took the most time. A total of 11 different matrices
were tried before choosing the column that could give the best result. The first column
to be tried was GSTrap™ HP. This column was chosen for an obvious reason that it
should be able to trap most GSTs. However, the CG16936 had no affinity towards this
76

column. The protein came out in the flow through fraction and was confirmed by the
high activity in the flow through and no activity with the elution. To double confirm this
fact, the elution was concentrated (using a protein concentrator, vivaspin) and analysed
on SDS-PAGE. As expected, the lane that was loaded with the elution was clear with no
bands (Figure3.8). A few studies have also confirmed that some isoforms of the epsilon
class GSTs are unable to bind to GSTrap™ HP (Saisawang et al., 2011).
S-hexyl glutathione was tried next. It is a ligand that is used for the affinity
chromatography of Glutathione transferases and glutathione peroxidases. This column
has shown to trap several GSTs that were unable to be trapped by GSTrap™ HP (Alias
& Clark, 2007). However, this column was also unable to retain the CG16936. This was
confirmed by checking the enzyme activity of both the flow through fraction and elution
which revealed that only the flow through had activity with DCNB. No band was
observed on the SDS gel image as well (Figure 3.9, chapter 3). Purification was then
repeated with the same column but this time the crude was allowed to flow through the
Sephadex G-25 to remove any endogenous inhibitors that may inhibit the binding of
CG16936 to this column (Pal et al., 2012). The G-25 is a desalting column that has the
potential to bind any inhibitory pigments with sufficient affinity to separate them from
the protein of target. The fraction that had activity with DCNB was then
chromatographed with S-hexylglutathione. However, it gave the same results as
GSTrap™ HP with activity in the flow through and no band was observed on SDS-
PAGE. This confirmed that CG16936 has no affinity towards this matrice as well. It
was reported previously that GSTs that are active towards DCNB could not bind at all
or were less firmly bound to the GSH-affinity gel than the ones that are active with
CDNB (Stenersen et al., 1987).
77
Sep-Pak C18 is a cartridge column with strong hydrophobicity that can be used
to absorb analytes of even weak hydrophobicity from aqueous solutions. This column is
mostly used to separate proteins and peptides based on their hydrophobicity. The
binding strength of the protein to the column depends on the hydrophobicity of the
protein itself. The more hydrophobic the protein is, the stronger it binds to the column
and higher concentration of salt is needed to elute. Purification with this column did not
give the desired result as well where multiple bands were observed on SDS-PAGE
(Figure 3.10) and no activity was detected in the elution. The crude supernatant may
have contained much different kinds of protein with hydrophobic properties that will
also bind to this column. The usage of this column must be accompanied with another
column that uses different purification technique such as ion exchange or ligand
specificities to help reduce the binding of non specific protein binding and get higher
protein purity.
Superdex 75 and Sephacryl S-200 are gel filtration columns that is used to
separate protein, peptides and other macromolecules according to their molecular size as
they pass through a porous structure. Molecules with diameter greater than the largest
pores within the resin material will not enter the particle but passes through the column
and be eluted first. Whereas, the smaller molecules, will enter the resin particle and will
be eluted later in order of decreasing molecular weight.
Superdex 75 separates molecules in range of 3000 to 70000 dalton. Purification
with superdex 75 gave 3 peaks, none of which gave activity with DCNB. When
analyzed on SDS-PAGE, it showed multiple bands with the same intensity. This is
probably because proteins from bacterial lysate may have molecular weight almost
similar to CG16936. When being eluted out, these proteins come out together with
78
CG16936 as one peak which gives multiple bands on SDS PAGE (Figure 3.11). For this
reason, a column with a broader range of molecular weight was used instead. Sephacryl
S-200 was chose as its range was between 5000 and 250000 dalton. Having in mind that
a column with a broader range of molecular weight should be able to separate the
proteins better, Sephacryl S-200 was chosen. A total of 5 peaks were obtained from the
purification using Sephacryl S-200. The second and third peak gave activity with
DCNB. The elutions (from the second and third peak) were then analyzed on SDS-
PAGE but multiple faint bands were observed as well (Figure 3.12).
HisTrap™ FF Crude columns are packed with Ni Sepharose High Performance
and is designed for the purification of histidine tagged proteins by immobilized metal
ion chromatography (IMAC). This column was chosen next as CG16936 has
polyhistidine tagging attached. First the enzyme was eluted with an increasing gradient
of imidazole concentration (0 to 500 mM imidazole) to determine the most optimum
concentration of imidazole needed to elute the target protein. The concentration was set
at 300mM and elution gave significant activity with DCNB. However, the SDS gel
showed multiple bands, with a number of intensed bands (Figure 3.15). The column was
tried washing with different concentrations of sodium chloride before elution to remove
the non specific bindings. This did not help as low concentration of sodium chloride
gave no difference while higher concentration of washing striped off the target protein
as well. The disadvantage of using this HisTrap is that this column has high affinity
towards poly-histidine. Proteins with polyhistidines (as short as 3 histidines in a row), in
the amino acid sequence of a protein could easily bind to this column. The washing step
did not help much with the removal of non specific binding as multiple bands were still
observed on SDS gel.
79
Chromatography method that separates ions and polar molecules based on the
charge is known as ion exchange chromatography. There are two types of ion
exchangers, cation exchanger where the positively charged molecules will be attracted
to a negatively charged resin while anion exchanger attracts the negatively charged
molecules to a positively charged resin. Binding of the protein to the ion exchanger
depends on the pI value of the protein itself and the pH it is exposed to. The CG16936
has a pI value of 5.9 (Alias and Clark, 2007). Buffer with a higher pH value than the pI
value of the protein will make the protein to be negatively charged. Hence, the protein
will be attracted to a positively charged resin (Anion exchanger). For that purpose a
weak anion exchanger (ANX resin, Diethyl aminopropyl) with a running buffer of
pH7.4 was used. After loading the sample, a fair amount of running buffer,
approximately 20 to 30 ml were allowed to pass through the column before elution. To
determine the optimum concentration of elution buffer, a gradient of increasing
concentration was performed (0% to 100% 0.5 M NaCl, pH7.4). Two peaks were
obtained. Both fractions were checked for activity with DCNB and revealed a
significant activity in the second peak and a much lower activity in the first peak.
Elution was concentrated using centrifugal concentrator and the purity level was
analysed on SDS PAGE. The fraction with high activity had multiple bands with 2
intensed bands in between the range of 30 kDa and 50 kDa (Figure 3.13). CG16936 was
expected to be one of the bands.
DEAE (Diethyl aminoethyl resin) is another type of weak anion exchanger was
employed next. The same elution method was used. However, the final concentration of
the eluting buffer was increased from 0.5 M NaCl pH 7.4 to 1.0 M NaCl pH 7.4. Almost
similar results were obtained as ANX column. Two peaks were obtained. Elution of the
first peak had activity with DCNB but no activity was detected in the second peak and
80
the flow through fraction. Mutiple bands were observed on SDS-PAGE (Figure 3.14).
Purification was repeated with a slight modification where the pH of the running and
eluting buffer was increased to 8.0. CG16936 was eluted out using a step wise elution of
30%, 40% and 50% of 1.0 M NaCl, pH8.0. The percentage was chosen based on the
peaks obtained from the gradient elution. Once again, multiple bands were observed on
SDS-PAGE. This may be due to the fact that a lot of other bacterial proteins will also be
negatively charged besides CG16936, hence the binding and multiple bands. Usage of
this column followed by another column with a different technique should be able to
give a better purity.
A recent study on the purification of GST proteome of Drosophila melanogaster
introduced the use of S-substituted glutathiones as affinity ligands (Pal et al., 2012).
Two of the matrices were tried. First was the glutathione conjugate of
bromosulfophthalein (BSP-SG). Supernatant was injected into the column and about 20-
30 ml of running buffer was allowed to flow through the column to make sure the
unbound was completely removed. The column was then washed with 0.5 M NaCl pH
7.4 to clear the non-specific protein binding and 2 mM BSP pH 7.4 was used to elute
out the protein of interest. Both the wash and elute fraction gave activity with DCNB
with the elute giving slightly higher activity. However, this gave multiple bands on SDS
PAGE (Figure 3.17). The same method was repeated but this time replacing the wash
buffer with 1.0 M KCl, pH7 .4. This change managed to remove most of the non
specific binding including our protein of interest. As a result, high activity was detected
in the wash fraction instead of the elution and a few faint bands on the SDS gel, in the
elute lane.
81
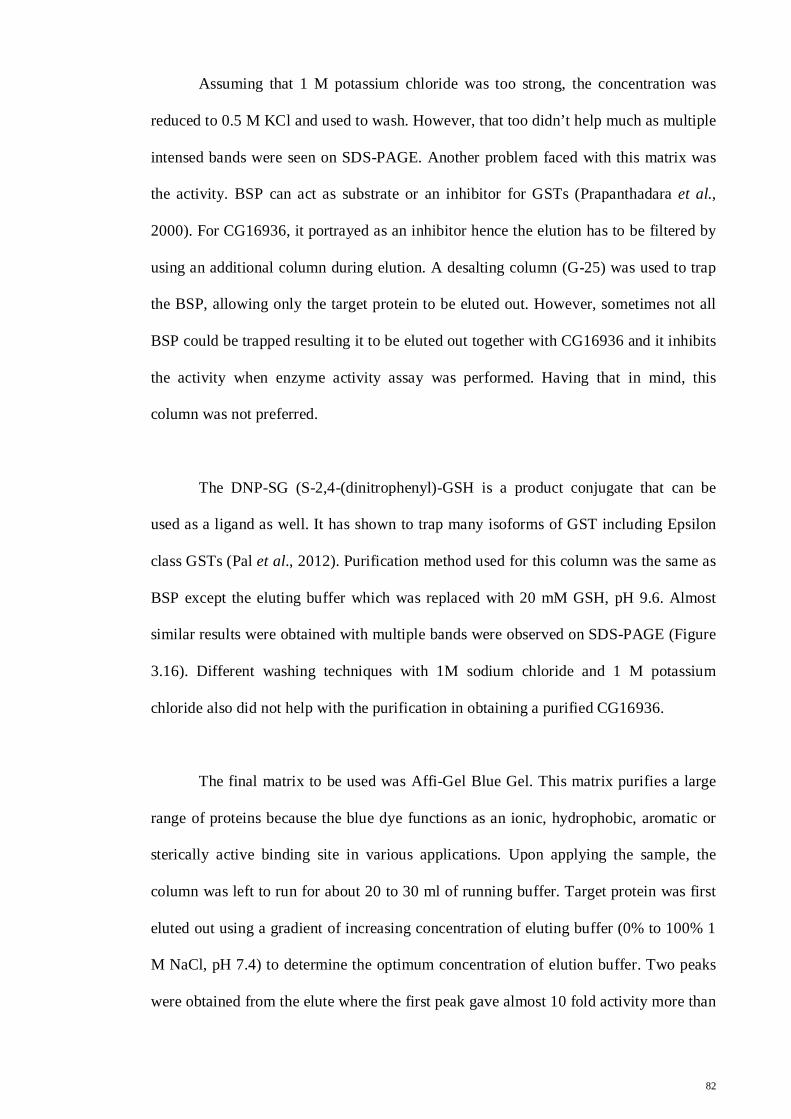
Assuming that 1 M potassium chloride was too strong, the concentration was
reduced to 0.5 M KCl and used to wash. However, that too didn’t help much as multiple
intensed bands were seen on SDS-PAGE. Another problem faced with this matrix was
the activity. BSP can act as substrate or an inhibitor for GSTs (Prapanthadara et al.,
2000). For CG16936, it portrayed as an inhibitor hence the elution has to be filtered by
using an additional column during elution. A desalting column (G-25) was used to trap
the BSP, allowing only the target protein to be eluted out. However, sometimes not all
BSP could be trapped resulting it to be eluted out together with CG16936 and it inhibits
the activity when enzyme activity assay was performed. Having that in mind, this
column was not preferred.
The DNP-SG (S-2,4-(dinitrophenyl)-GSH is a product conjugate that can be
used as a ligand as well. It has shown to trap many isoforms of GST including Epsilon
class GSTs (Pal et al., 2012). Purification method used for this column was the same as
BSP except the eluting buffer which was replaced with 20 mM GSH, pH 9.6. Almost
similar results were obtained with multiple bands were observed on SDS-PAGE (Figure
3.16). Different washing techniques with 1M sodium chloride and 1 M potassium
chloride also did not help with the purification in obtaining a purified CG16936.
The final matrix to be used was Affi-Gel Blue Gel. This matrix purifies a large
range of proteins because the blue dye functions as an ionic, hydrophobic, aromatic or
sterically active binding site in various applications. Upon applying the sample, the
column was left to run for about 20 to 30 ml of running buffer. Target protein was first
eluted out using a gradient of increasing concentration of eluting buffer (0% to 100% 1
M NaCl, pH 7.4) to determine the optimum concentration of elution buffer. Two peaks
were obtained from the elute where the first peak gave almost 10 fold activity more than
82
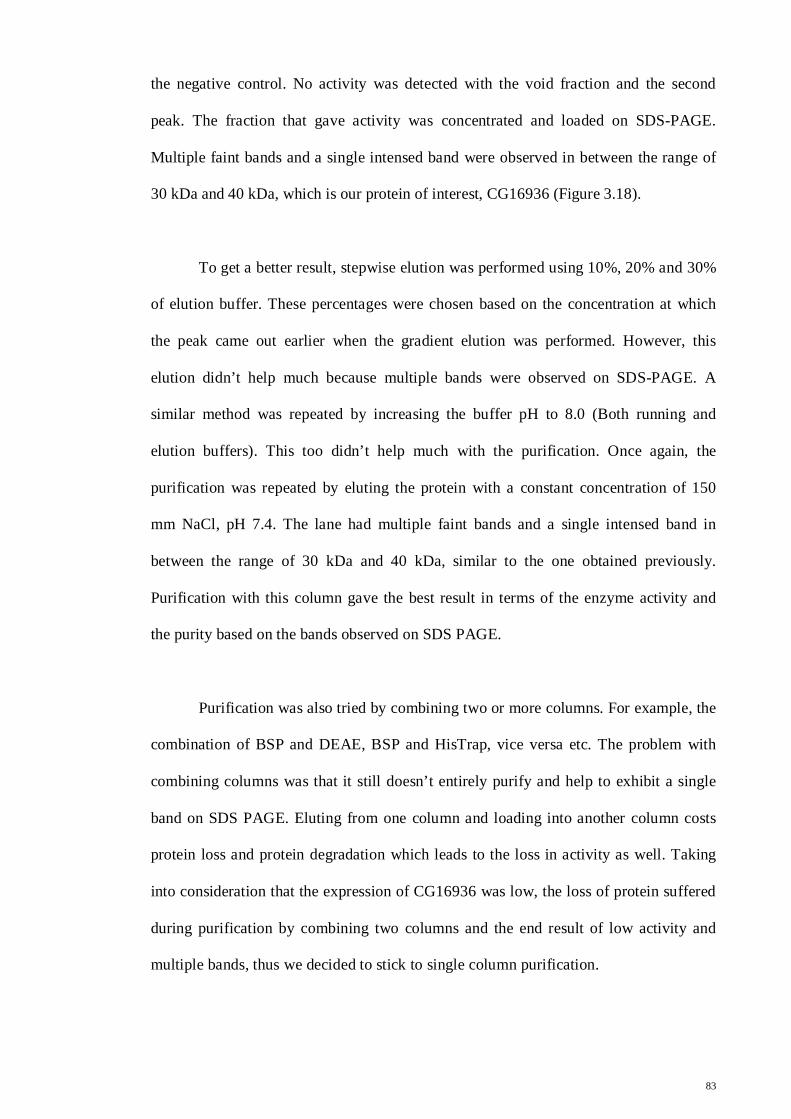
the negative control. No activity was detected with the void fraction and the second
peak. The fraction that gave activity was concentrated and loaded on SDS-PAGE.
Multiple faint bands and a single intensed band were observed in between the range of
30 kDa and 40 kDa, which is our protein of interest, CG16936 (Figure 3.18).
To get a better result, stepwise elution was performed using 10%, 20% and 30%
of elution buffer. These percentages were chosen based on the concentration at which
the peak came out earlier when the gradient elution was performed. However, this
elution didn’t help much because multiple bands were observed on SDS-PAGE. A
similar method was repeated by increasing the buffer pH to 8.0 (Both running and
elution buffers). This too didn’t help much with the purification. Once again, the
purification was repeated by eluting the protein with a constant concentration of 150
mm NaCl, pH 7.4. The lane had multiple faint bands and a single intensed band in
between the range of 30 kDa and 40 kDa, similar to the one obtained previously.
Purification with this column gave the best result in terms of the enzyme activity and
the purity based on the bands observed on SDS PAGE.
Purification was also tried by combining two or more columns. For example, the
combination of BSP and DEAE, BSP and HisTrap, vice versa etc. The problem with
combining columns was that it still doesn’t entirely purify and help to exhibit a single
band on SDS PAGE. Eluting from one column and loading into another column costs
protein loss and protein degradation which leads to the loss in activity as well. Taking
into consideration that the expression of CG16936 was low, the loss of protein suffered
during purification by combining two columns and the end result of low activity and
multiple bands, thus we decided to stick to single column purification.
83
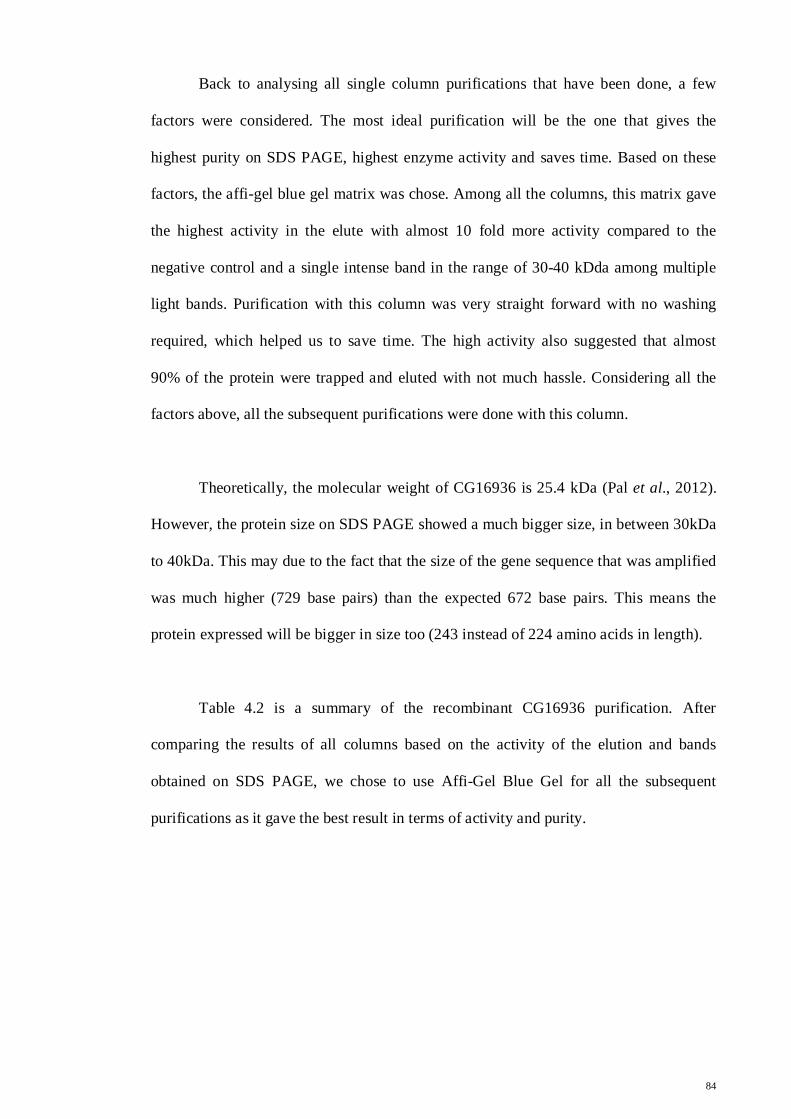
Back to analysing all single column purifications that have been done, a few
factors were considered. The most ideal purification will be the one that gives the
highest purity on SDS PAGE, highest enzyme activity and saves time. Based on these
factors, the affi-gel blue gel matrix was chose. Among all the columns, this matrix gave
the highest activity in the elute with almost 10 fold more activity compared to the
negative control and a single intense band in the range of 30-40 kDda among multiple
light bands. Purification with this column was very straight forward with no washing
required, which helped us to save time. The high activity also suggested that almost
90% of the protein were trapped and eluted with not much hassle. Considering all the
factors above, all the subsequent purifications were done with this column.
Theoretically, the molecular weight of CG16936 is 25.4 kDa (Pal et al., 2012).
However, the protein size on SDS PAGE showed a much bigger size, in between 30kDa
to 40kDa. This may due to the fact that the size of the gene sequence that was amplified
was much higher (729 base pairs) than the expected 672 base pairs. This means the
protein expressed will be bigger in size too (243 instead of 224 amino acids in length).
Table 4.2 is a summary of the recombinant CG16936 purification. After
comparing the results of all columns based on the activity of the elution and bands
obtained on SDS PAGE, we chose to use Affi-Gel Blue Gel for all the subsequent
purifications as it gave the best result in terms of activity and purity.
84
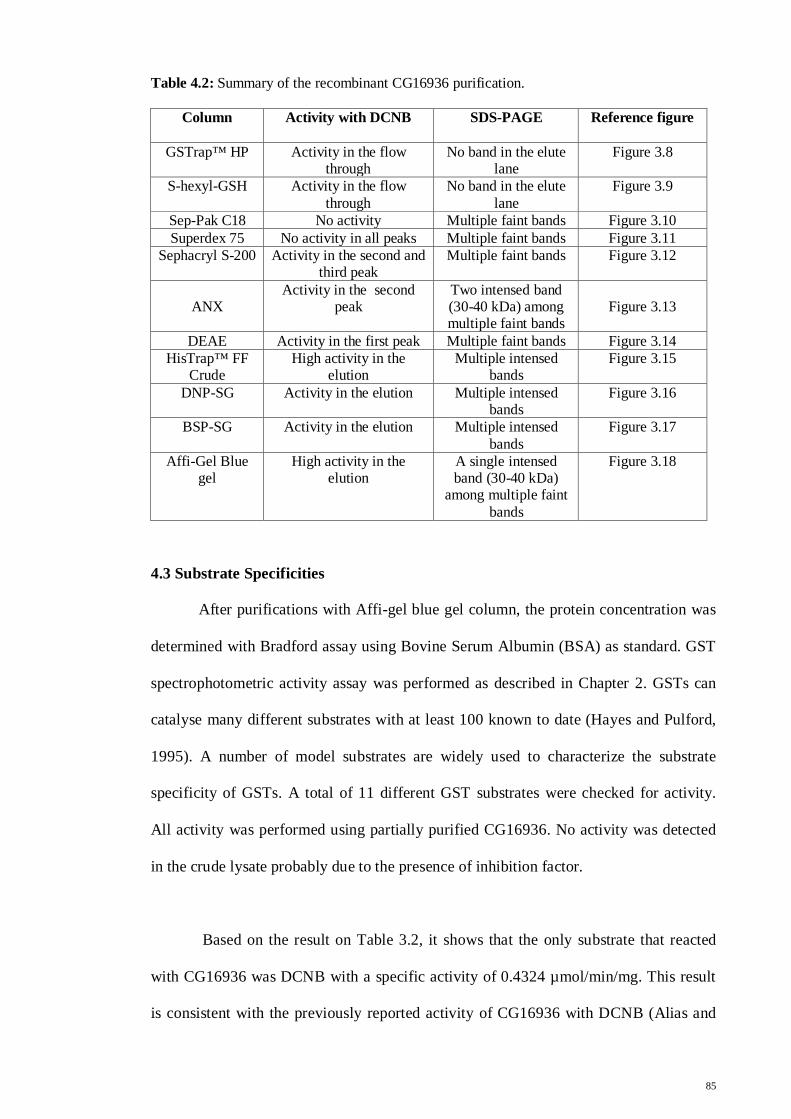
Table 4.2: Summary of the recombinant CG16936 purification.
Column Activity with DCNB SDS-PAGE Reference figure
GSTrap™ HP Activity in the flow through
No band in the elute lane
Figure 3.8
S-hexyl-GSH Activity in the flow through
No band in the elute lane
Figure 3.9
Sep-Pak C18 No activity Multiple faint bands Figure 3.10 Superdex 75 No activity in all peaks Multiple faint bands Figure 3.11
Sephacryl S-200 Activity in the second and third peak
Multiple faint bands Figure 3.12
ANX
Activity in the second peak
Two intensed band (30-40 kDa) among multiple faint bands
Figure 3.13
DEAE Activity in the first peak Multiple faint bands Figure 3.14 HisTrap™ FF
Crude High activity in the
elution Multiple intensed
bands Figure 3.15
DNP-SG Activity in the elution Multiple intensed bands
Figure 3.16
BSP-SG Activity in the elution Multiple intensed bands
Figure 3.17
Affi-Gel Blue gel
High activity in the elution
A single intensed band (30-40 kDa)
among multiple faint bands
Figure 3.18
4.3 Substrate Specificities
After purifications with Affi-gel blue gel column, the protein concentration was
determined with Bradford assay using Bovine Serum Albumin (BSA) as standard. GST
spectrophotometric activity assay was performed as described in Chapter 2. GSTs can
catalyse many different substrates with at least 100 known to date (Hayes and Pulford,
1995). A number of model substrates are widely used to characterize the substrate
specificity of GSTs. A total of 11 different GST substrates were checked for activity.
All activity was performed using partially purified CG16936. No activity was detected
in the crude lysate probably due to the presence of inhibition factor.
Based on the result on Table 3.2, it shows that the only substrate that reacted
with CG16936 was DCNB with a specific activity of 0.4324 µmol/min/mg. This result
is consistent with the previously reported activity of CG16936 with DCNB (Alias and
85
Clark, 2007). A few other studies have also shown that DCNB is a more preferred
substrate compared to CDNB by most Epsilon class GST, especially CG16936 (Pal et
al., 2012). The result shows that the CG16936 was highly specific towards its substrate
as it only reacted with DCNB of all the other 11 substrates. This includes the absence of
activity with CDNB which is the universal substrate for most GSTs from animals to
insects. Another notable result was the absence of activity with trans-2-hexenal which is
an odorant substrate for olfactory GSTs.
Every substrate that was used was common GST substrates, some of which has
its own functions. Activities with this particular substrate will help to understand the
role of the enzyme that reacts with it. For example, trans-2-hexenal and trans-4-Phenyl-
butene-2-one (PBO) are said to be olfactory GST substrates. Studies done by Ben-Arie
et al., (1993) on the olfactory GSTs of rat has listed out a few odorants that were
olfactory GST substrates. The absence of activity with these two substrates suggested
that CG16936 has no olfactory related detoxification functions.
Next, is the use of trans-2-octenal. Trans-2-octenal is an aldehyde resulted from
the end product of lipid peroxidation. GSTs that react to these substrates can be
associated to their function in oxidative stress. For example, the Sigma class GST in
Drosophila melanogaster (Singh et al., 2001). The DmGSTS1-1 is said to be inactive
towards the commonly used substrate CDNB but has high activity for 4-
hydroxynonenal (4-HNE) an aldehyde derived from lipid peroxidation. The localization
of this enzyme in flight muscle suggests that it may have a protective role against
oxidative stress. Almost four different types of aldehydes (trans-2-hexenal, trans-2-
octenal, 2,4-hexadienal, trans,trans-hepta-2,4-dienal) were checked for activity with
86
CG16936. Absences of activity with these substrates suggested that probably this
enzyme may not be involved in oxidative stress as well.
The high activity with DCNB implies its participation in detoxification of
pesticide. However, work done by Alias and Clark (2007) indicated that CG16936
expression remained unchanged in adult fruit flies when treated with pesticides such as
Phenobarbital and paraquat which contradicts its participation in insecticides
detoxifications.
Most Epsilon class GSTs are associated with insecticide resistance. Although in
general it is said to detoxify insecticides, some Epsilon GSTs has portrayed to be
responsible to detoxify certain substrate only. For example, the GSTE2 are particularly
associated with DDT detoxification (Lumjuan et al., 2005) however the GSTE3 has no
activity with DDT but showed to have high activity with 4-HNE which suggest its
involvement in oxidative stress (Wongkratul et al., 2009).
The ability to utilize 4-HNE was reported in GSTE1 by Sawicki et al. (2003)
and activity with HNE (Saisawang et al., 2011). However, GSTE1 showed no response
to H2O2 exposure in the strain of Anopheles gambiae (Ding et al., 2005). Enzymes
associated to oxidative stress will have increased expression level when exposed to
hydrogen peroxide but the GSTE1 showed no response although it has proven activity
with 4-HNE. This was similar to CG16936, where exposure to chemicals such as
phenobarbital did not induce the enzyme but the enzyme still has high activity with
DCNB. Based on all the evidences mentioned above, the role of this enzyme in
Drosophila melanogaster was inconclusive.
87
4.4 Investigations of CG16936 as an olfactory GST
4.4.1 Exposure of Drosophila to odorant
Six bottles of Drosophila melanogaster were prepared. Three bottles of the flies
were exposed to odorant as per described in chapter 2. Benzaldehyde was chosen as
preferred odorant because a previous study on the olfactory system of Drosophila
reported that exposure to this odorant has expressed the CG16936 (Anholt and Mackay,
2001). Upon the exposure, the insect was homogenized and purified using the DNP-SG
matrix and eluted with 20 mM GSH, pH 9.6. This column was chosen because it has
proven to capture the multiple isoforms of CG16936 (Pal et al., 2012).
The elute was then checked for activity with DCNB. DCNB was chosen as the
preferred substrate to check the activity of the purified GST because not many GSTs
react with DCNB. Since the entire Drosophila cells were homogenized, it contains
many other GSTs besides CG16936. Usage of DNP-SG will trap many different
isoforms of GSTs as well. To minimize the reaction of other GSTs, a substrate that is
not most preferred by most GSTs were used. Besides that, DCNB is the only substrate
that CG16936 reacts with high activity. The activities of the purified GSTs from the
exposed and non-exposed were compared and not much difference was observed in the
activities of both samples (refer to Figure 3.21). The activity level was almost similar
which implies that the exposure to the odorant did not give any effects in terms of the
expression of CG16936 in Drosophila melanogaster.
Olfactory GSTs are said to be responsible in protecting the olfactory system of
insects from harmful xenobiotics by inactivating aldehyde odorants (Rogers et al.,
1999). The exposure to odorants such as volatile hydrophobic compounds will express
more of these enzymes in order to detoxify these compounds. The expression level can
88
be associated with the enzyme activity. High enzyme activity can be interpreted as high
expression. However, no such observations were noticed. Due to the no response in the
expression after being exposed to odorant, we didn’t further proceed to 2D gel analysis.
2D gel analysis would have been useful to visualise the expression level of CG16936 by
comparing the spot intensity of exposed and non exposed samples as it can be
interpreted that more intensed spot can be considered as high expression level.
Although the CG16936 was shown to be expressed in response to exposure to
odorant; benzaldehyde, there was no evidence of the gene being translated into
CG16936 protein and that it participated in olfactory detoxifications. A gene expression
does not necessarily mean that the expressed gene was translated into functional protein.
Gene expression is found to be a random process and not all genes that are expressed
will be translated into protein. The transcription and translation processes suggested to
be random, which leads to cell to cell variations in mRNA and protein levels (Raj and
Oudenaarden, 2008).
Another factor to be considered is the location of the enzyme. A study on the
Drosophila system revealed that the CG16936 was found most abundant in the tubule of
the adult and larvae (Yang et al., 2007) whereas most olfactory GSTs are found in the
head, or to be more specific in the olfactory system of the organism. For example,
olfactory GSTs from the sphinx moth were isolated from the antennae (Rogers et al.,
1999) and in the rat were found in the vomeronasal organ (Green et al., 2005) and the
olfactory ephithelium (Ben-Arie et al., 1993). Having this in mind, the location of
CG16936 does not exactly portray its role as an olfactory GST but more convinced to
be involved in basic detoxifications of pesticides.
89
4.4.2 Conjugation of CG16936 with odorant substrate.
A spectrophotometric assay was performed and an aliquot of the reaction was
loaded on the t.l.c plate to check the ability of CG16936 to conjugate with odorant
substrates. GST reactions were carried out with and without the addition of the
recombinant CG16936. The plate was stained with ninhydrin to identify the spots which
appeared in orange colour. Based on figure 3.20, it shows the conjugated reaction
product with DCNB, indicated by an extra spot at lane 3 and marked with a star. DCNB
was used as a control substrate because of its proven activity with CG16936. However
no extra spot was observed at any other lane including lane 6 that contains the
recombinant CG16936 and t-2-hexenal which reveals that there was no conjugation.
This was expected as no activity was detected with this substrate as well. Trans-2-
hexenal, a plant derived green leaf aldehyde that has leafy odour, known to be the best
substrate for most olfactory GSTs such as the rat olfactory and the sphinx moth (Rogers
et al., 1999).
Odorants are found to be the most efficient substrates for olfactory enzymes.
The ability to conjugate with an odorant substrate is an important characteristic of
olfactory GSTs. Conjugation between olfactory GSTs and t-2-hexenal on t.l.c plate
were observed in the studies of characterization of mouse vomeronasal organ (Green et
al., 2005). The absence of conjugation of the recombinant CG16936 with this substrate
indicates the inability of CG16936 to detoxify odorants and doubts its ability to act as
an olfactory GST in Drosophila melanogaster.
90
CHAPTER 5 CONCLUSION
CG16936 has been recently classified as Glutathione transferase E12. Our
recombinant CG16936 has shown to have high activity towards DCNB with a specific
activity of 0.4324μmol/min/mg. No activities were detected with the other 11 GST
substrates including CDNB, the universal substrate and t-2-hexenal, an odorant
substrate specific for olfactory GSTs. The absence of activity and inability of the
recombinant CG16936 to conjugate with t-2-hexenal suggested that this enzyme was
unable to detoxify odorant substrates. Besides that, exposure of Drosophila to
benzaldehyde did not induce or over express the CG16936 protein. Thus, our findings
suggested that in contrary, the CG16936 may have not specifically be responsible to
detoxification of odorant. Its activity towards DCNB implies its participation in
detoxification of pesticides and other general conjugate substrates.
Future work suggestions would be to investigate more on the olfactory GSTs of
Drosophila melanogaster. This can be done by exposing the flies with various other
odorants, besides benzaldehyde to see the gene and protein expressions. Besides that,
maybe the head can be isolated and checked for olfactory GSTs upon exposure. For
some reasons, the CG16936 was found to be expressed when exposed to benzaldehyde.
Function of that can be investigated as well. Due to time constrain, we did not proceed
to other methods of purification and reported it as partially purified. Future work can be
done trying other purification methods and a pure CG16936 can be used to do kinetic
studies as well as for characterization of this enzyme which can help us to understand
the function CG16936 better.
91
REFERENCES
Ai, M., Min., S., Grosjaen, Y., Leblanc, C., Bell.,R., Benton, R. & Suh, G.S.B. (2010).
Acid sensing by the Drosophila Olfactory System. Nature, 468(7324), 691-695.
Aceto, A., DiIlio, C., Angelucci S., Longo, V., Gervasi, P.G. & Federici, G. (1989).
Glutathione transferases in human nasal mucosa. Archives of Toxicology, 63(6), 427–431.
Alias, Z. & Clark, A.G. (2007). Studies on the glutathione S-transferases proteome of
adult Drosophila melanogaster. Responsiveness to chemical challenge. Proteomics, 7, 3618 – 3628.
Anderson, M.E. (1998). Glutathione: an overview of biosynthesis and modulation.
Chemico- Biological Interaction, 111–2, 1–14. Anholt, R.R.H. & Mackay, T.F.C. (2001). The Genetic architecture of odor-guided
behaviour in Drosophila melanogaster. Behaviour Genetics, 31, 17-27. Armstrong, R.N. (1997). Structure, catalytic mechanism, and evolution of the
glutathione transferases. Chemical Research Toxicology, 10, 2–18. Armstrong, R.N. (2000). Mechanistic Diversity in a Metalloenzyme Superfamily.
Biochemistry, 39, 13625 – 13632. Armstrong, R. (2010). Glutathione Transferases (GST) superfamily. Retrieved from
http://enzymefunction.org/about/bridging-projects/gst-superfamily. Atkinson, H.J. & Babbit, P.C. (2009). Glutathione transferase are structural and
functional outliers in the thioredoxin fold. Biochemistry, 48, 11108-11116. Ben-Arie, N., Khen, M. & Lancet, D. (1993). Glutathione S transferase in rat olfactory
epithelium: Purification, molecular properties and odorant biotransformation. Biochemical Journal, 292, 379–384.
Beall, C., Fyrberg, C., Song, S. & Fyrberg, E. (1992). Isolation of a Drosophila gene
encoding glutathione S-transferase. Biochemical Genetics, 30, 515–527.
92

Black, D.L. (2003). Mechanisms of alternative pre messenger RNA splicing. Annual reviews of Biochemistry, 72(1), 291-336.
BLAST: Basic Local Alignment Search Tool. Retrieved 11, November, 2011 from
http://blast.ncbi.nlm.nih.gov/Blast.cgi Blocki, F.A., Schlievert, P.M. & Wackett, L.P. (1992). Rat liver protein linking
chemical and immunological detoxification systems. Nature (London), 360, 269-270.
Board, P.G., Baker, R.T., Chelvanayagam, G. & Jermiin, L.S. (1997). Zeta, a novel
class of glutathione transferases in a range of species from plants to humans. Biochemical Journal, 328, 929–935.
Board, P.G., Coggan, M., Chelvanayagam, G., Easteal, S., Jermiin, L.S., Schulte, G.K.,
Danley, D.E., Hoth, L.R., Griffor, M.C., Kamath, A.V., Rosner, M.H., Chrunyk, B.A., Perregaux, D.E., Gabel, C.A., Geoghegan, K.F. & Pandit, J. (2000). Identification, characterization, and crystal structure of the Omega class glutathione transferases. Journal of Biological Chemistry, 275, 24798–24806.
Bradford, M.M. (1976). A rapid and sensitive for the quantitation of microgram
quantitites of protein utilizing the principle of protein-dye binding. Analytical Biochemistry, 72, 248-254.
Brophy, D.M., Southan, C. & Barrett, J. (1989). Glutathione transferase in the
tapeworm Moniezia expansa. Biochemical Journal, 262(3), 939-946. Bruns, C.M., Hubatsch, I., RidderstroÈm, M., Mannervik, B. & Tainer, J.A. (1999).
Human Glutathione Transferase A4-4 Crystal Structures and Mutagenesis Reveal the Basis of High Catalytic Efficiency with Toxic Lipid Peroxidation Products. Journal of Molecular Biology, 288, 427-439.
Chasseaud, L.F. (1979). The role of glutathione S-transferase in metabolism of chemical
carcinogens and other electrophilic agents. Advances in Cancer Research, 26, 175-274.
Chiang, F.M & Sun, C.N. (1993). Glutathione transferase isozymes of diamondback
moth larvae and their role in the degradation of some organophosphorus insecticides. Pesticide Biochemstry and Physiology, 45, 7–14.
93
Clark, A.G. (1989). The comparative enzymology of the glutathione S-transferases from non-vertebrate organisms. Comparative Biochemistry and Physiology B, 92, 419–446.
Clark, A.G. & Shamaan, N.A. (1984). Evidence that DDT-dehydrochlorinase from the
housefly is a glutathione S-transferase. Pesticide Biochemistry and Physiology, 22, 249-261.
Clark, A.G., Dick, G.L., Martindale, S.M. & Smith, J.N. (1985). Glutathione S-
transferases from the New Zealand grass grub, Costelytra zealandica, their isolation and characterization and the effect on their activity of endogenous factors. Insect Biochemistry, 15, 35–44.
Ding, Y., Ortelli, F., Rossiter, L.C., Hemingway, J. & Ranson, H. (2003). The
Anopheles gambiae glutathione transferase supergene family: annotation, phylogeny and expression profiles. BioMed Central Genomics, 4, 35-50.
Ding, Y., Hawkes, N., Meredith, J., Eggleston, P., Hemingway, J. & Ranson, H.
(2005). Characterization of the promoters of Epsilon glutathione transferases in the mosquito Anopheles gambiae and their response to oxidative stress. Biochemical Journal, 387, 879-888.
Dirr, H.W., Reinemer, P. & Huber, R. (1994). X-ray crystal structures of cytosolic
glutathione S-transferases. Implications for protein architecture, substrate recognition and catalytic function. European Journal of Biochemistry, 220, 645-661.
Dixon, D.P., Cummins, I., Cole, D.J. & Edwards, R. (1998). Glutathione-mediated
detoxification systems in plants. Current Opinion in Plant Biology, 1, 258–266. Dixon, D.P., Lapthorn, A. & Edwards, R. (2002). Plant glutathione transferases.
Genome Biology, 3(3), 1-10. Dixon, D.P., Skipsey, M., & Edwards, R. (2010). Roles for glutathione transferases.
Phytochemistry, 71, 338-350. Drosophila melanogaster, fruit fly. Retrieved 7, July, 2012 from
http://www.geochembio.com/biology/organisms/fruitfly/ Droog, F. (1997). Plant glutathione S-transferases, a tale of Theta and Tau. Journal of
Plant Growth Regulation, 16(2), 95-107.
94
Dulhunty, A., Gage, P., Curtis, S., Chelvanayagam, G. and Board, P. (2001). The glutathione transferase structural family includes a nuclear chloride channel and a ryanodine receptor calcium release channel modulator. Journal Biological Chemistry, 276, 3319–3323.
Enayati, A.A., Ranson, H. & Hemingway, J. (2005). Insect glutathione transferases and
insecticide resistance. Insect Molecular Biology, 14, 3–8. Feng, Q.L., Davey, K.G., Pang A.S.D., Primavera M., Ladd, T.R., Zheng, S.C., Sohi,
S.S., Retnakaran, A. & Palli, S.R. (1999). Glutathione S-Tranferases from the spruce budworm, Choristonuera fumiferana: Identification, characterization, localization, cDNA cloning and expression. Insect Biochemistry and Molecular Biology, 29, 779-793.
Fesik, S.W. (2001). Insights into programmed cell death through structural biology. Cell
(Cambridge, Mass.) 103, 273–282. FlyBase: A Database for Drosophila Genes and Genomes. Retrieved 10, January, 2010
from http://flybase.org. Frova, C. (2006). Glutathione transferases in the genomics era: New insights and
perspectives. Biomolecular Engineering, 23(4), 149-169. Fujita, M. & Hossain, M.Z. (2003). Modulation of Pumpkin Glutathione S-Transferases
By Aldehydes and Related Compounds. Plant and Cell Physiology, 44(5), 481-490.
Fournier, D., Bride, J.M., Poire, M., Berge, J.B. and Plapp, F.W. (1992). Insect
glutathione S-transferases. Biochemical characteristics of the major forms from houseflies susceptible and resistant to insecticides. Journal of Biological Chemistry, 267, 1840–1845.
Gakuta, T. & Toshiro, A. (2000). Disruption of the microsomal glutathione S-
transferase-like gene reduces life span of Drosophila melanogaster. Gene, 253, 179–187.
Glutathione Chemical Structure. Retrieved from 6, July, 2012 from
http://chemistry.about.com/od/factsstructures/ig/Chemical-Structures---G/Glutathione.htm.
Glasel, J.A. (1995). Validity of Nucleic Acid Purities Monitored by A260/A280
Absorbance Ratios, Biotechniques 18:62-63.
95
Green, N., Weech, M. & Walters, E. (2005). Localization and characterization of glutathione-s-transferase isozymes, alpha, mu, and pi within the mouse vomeronasal organ. Neuroscience Letters, 375, 198-202
Guengerich, F.P. (1991). Oxidation of toxic and carcinogenic chemicals by human
cytochrome p-450 enzymes. Chemical Research in Toxicology, 4, 391–407. Guengerich, F. P. (1990). Enzymatic oxidation of xenobiotic chemicals. Critical Review
in Biochemistry and Molecular Biology, 25, 97-153. Habig, H., Pabst, M.J. & Jacoby, W.B. (1974). Gluthatione S-transferases: The first step
in mercapturic acid formation. Journal of Biological Chemistry, 249, 7130-7139.
Habig, W.H. & Jakoby, W.B. (1980). An enzymatic basis of detoxification. Vol.2 pp.
63-94. Academic press, New York. Hatton, P.J., Dixon, D., Cole, D.J. & Edwards, R. (1996). Glutathione transferase
activities and herbicide selectivity in maize and associated weed species. Pesticide Science, 46, 267–275.
Hamada. S., Kamada. M., Furumoto. H., Hirao. T. & Aono, T. (1994). Expression of
glutathione S-transferase π in human ovarian cancer as an indicator of resistance to chemotherapy. Gynecologic Oncology, 52, 3I3-319.
Hayes, J.D. & Wolf, C.R. (1988). Role of glutathione-S-transferase in drug resistence.
In Glutathione Conjugation, Cap. X, Sies, H. and Ketterer, B. eds, pp. 315-355. Academic Press, London.
Hayes, J.D. & Pulford, D. J. (1995). The glutathione S-transferase supergene family:
regulation of GST and the contribution of the isoenzymes to cancer chemoprotection and drug resistance. Critical Review in Biochemistry and Molecular Biology, 30, 445–600.
Hayes, J.D. & McLellan, L.I. (1999). Glutathione and glutathione-dependent enzymes
represent a co-ordinately regulated defence against oxidative stress. Free Radical Research, 31, 273-300.
Hazelton, G.A.& Lang C.A. (1983). Glutathione S-tranferases activity in a yellow fever
mosquito (Aedes Aegypti) during growth and aging. Biochemical Journal, 210, 281-287.
96
Hemingway, J., Hawkes, N.J., Mccarroll, L. & Ranson, H. (2004). The molecular basis of insecticide resistance in mosquitoes. Molecular and population biology of mosquitoes, 34(7), 653-665.
Hu, B., Deng, L., Wen, C., Yang, X., Pei, P., Xie, Y. And Luo, S. (2012). Cloning,
identification and functional characterization of pi-class glutathione s transferase from the freshwater mussels Cristaria plicata. Fish & Shellfish Immunology , 32, 51-60.
Huang, Y., Krell, P.J., Ladd, T., Feng, Q., & Zheng, S. (2009). Cloning,
Characterization And Expression Of Two Glutathione S-Transferase cDNAs In The Spruce Budworm, Choristoneura Fumiferana. Archives Of Insect Biochemistry And Physiology, 70, 44–56.
Ji, X.H., Rosenvinge, E.C., Johnson, W.W., Tomarev, S.I., Piatigorsky, J., Armstrong,
R.N. & Gilliland, G.L. (1995). 3-Dimensional structure, catalytic properties and evolution of a sigma-class glutathione transferase from squid, a progenitor of the lens S-crystallins of cephalopods. Biochemistry, 34, 5317-5328.
Johansson, A.S., Mannervik, B. (2001). Human glutathione transferase A3–3, a highly
efficient catalyst of double-bond isomerization in the biosynthetic pathway of steroid hormones. Journal of Biological Chemistry, 276, 33061–33065.
Jakobsson, P.J., Morgenstern, R., Mancini, J., Ford-Hutchinson, A. & Persson, B.
(1999). Common structural features of MAPEG- a widespread superfamily of a membrane associated proteins with highly divergent functions in eicosanoid and glutathione metabolism. Protein Science, 8, 689-692.
Kampranis, S.C., Damianova, R., Atallah, M., Toby, G., Kondi, G., Tsichlis, P. N. &
Makris, A.M. (2000). A novel plant glutathione S -transferase/peroxidase suppresses Bax lethality in yeast. Journal of Biological Chemistry, 275, 29207–29216.
Ketterer, B. (2001). A bird’s eye view of the glutathione transferase field. Chemico-
Biological Interaction, 138, 27–42 Kong, K.H., Nishida, M., Inoue, H. & Takashashi, K. (1992). Tyrosine-7 is an essential
residue for the catalytic activity of human class pi glutathione s-transferase-chemical modification and site directed mutagenesis studies. Biochemical and Biophysical Research Communications, 182, 1122-1129.
97
Koonin, E.V., Mushegian, A.R., Tatusov, R.L., Altschul, S.F., Bryant, S.H., Bork, P. & Valencia, A. (1994). Eukaryotic translation elongation factor 1 contains a glutathione transferase domain. Study of a diverse, ancient protein superfamily using motif search and structural modeling. Protein Science, 3, 2045–2054.
Kostaropoulos, I., Papadopoulos, A.I., Metaxakis, A., Boukouvala, E., &
Papadopoulou-Mourkidou, E. (2001). Glutathione S-transferases in the defense against pyrethroids in insects. Pesticide Biochemistry and Physiology, 31, 313–319.
Lander, J.E., Parsons, J.F., Rife, C.L., Gilliland, G.L. & Armstrong, R.N. (2004).
Parallel evolutionary pathways for glutathione transferases: structure and mechanims of the mitochondrial class Kappa enzyme rGSTK1–1. Biochemistry, 43, 352–261.
Lazard, D., Tal, N., Rubenstein, M., Khen, M., Lancet, D. & Zupko, K. (1990).
Identification and biochemical analysis of novel olfactory-specific cytochrome P-450IIA and UDP-glucuronosyl transferase. Biochemistry, 29, 7433–7440.
Lee, K.W., Raisuddin, S., Rhee, J.S., Hwang, D.S., Yu, I.T., Lee, Y.M., Park, H.G. &
Lee, J. S. (2008). Expression of glutathione S-transferase (GST) genes in the marine copepod 16 Tigriopus japonicus exposed to trace metals. Aquatic Toxicology, 89, 158-166
Li, X., Zhang, X., Zhang, J., Zhang, Xin, Starkey, S.R. & Zhu, K.Y. (2009).
Identification and characterization of eleven glutathione S-transferase gene from aquatic midge Chironomus tentans. Insect Biochemistry and Molecular Biology, 39, 745-754
Lumjuan, N., McCarroll, L., Prapanthadara, L., Hemingway, J. & Ranson, H. (2005).
Elevated activity of an Epsilon class Glutathione transferase confers DDT resistance in the dengue vector, Aedes aegypti. Insect Biochemistry and Molecular Biology, 35, 861-871.
Lumjuan, N., Stevenson, B.J., Prapanthadara, L., Somboon, P., Brophy, P.M., Loftus,
B.J., Severson, D.W. and Ranson, H. (2007). The Aedes aegypti glutathione transferase family. Insect Biochemistry and Molecular Biology, 37, 1026-1035.
Longo, V., Mazzaccaro, A., Naldi, F. & Gervasi, P.G. (1991). Drug-metabolizing
enzymes in liver, olfactory and respiratory epithelium of cattle. Journal of Biochemical Toxicology, 6, 123–128.
98
Low, W.L., Ng, H.L., Morton, C.G, Parker, M.W., Batterham, P. & Robin, C. (2007). Molecular evolution of Glutathione S-transferase in genus Drosophila. Genetics, 177, 1363–1375.
Main, P.A., Angley, M.T., O'Doherty, C.E., Thomas, P. & Fenech, M. (2012). The
potential role of the antioxidant and detoxification properties of glutathione in autism spectrum disorders: a systematic review and meta-analysis. Nutrition & Metabolism, 9(1), 35.
Mannervik, B. & Danielson, U. (1988). Glutathione transferases—structure and
catalytic activity. Critical Review in Biochemistry and Molecular Biology, 23, 283–337.
Mannervik, B., Board, B.G., Hayes, J.D., Listowsky, I. & Pearson, W.R. (2005).
Nomenclature for mammalian soluble Glutathione Transferases. Methods in Enzymology, 401, 1-8.
Marrs, K.A. (1996). The functions and regulation of glutathione S-transferases in plants.
Annual Review in Plant Physiology and Plant Molecular Biology, 47, 127–158. Map of pET-30a(+) vector. Retrieved 3, January, 2010, from http://
www.synthesisgene.com/vector/pET-30a. Maps sites for restriction enzymes in DNA sequence. Retrieved 10, January, 2010, from
http://www.restriction mapper.org. Moons, A. (2005). Regulatory and functional interactions of plant growth regulators and
plant glutathione S-transferases (GSTs). Plant Hormones, 72, 155–202. Morel, F., Rauch, C., Petit, E., Piton, A., Theret, N., Coles, B. & Guillouzo, A. (2004).
Gene and protein characterization of the human glutathione S-transferase kappa and evidence for a peroxisomal localization. Journal of Biological Chemistry, 279, 16246–16253.
Motoyama, N. & Dauterman, W.C. (1977). Purification and properties of housefly
glutathione s-transferase. Insect Biochemistry, 7(4), 361-369. Nef, P., Heldman, J., Lazard, D., Margalit, T., Jaye, M., Hanukoglu, I. & Lancet, D.
(1989). Olfactory-specific cytochrome P-450. Journal of Biological Chemistry, 264, 6780–6785.
99
Oakley, A. (2011). Glutathione transferases: A structural perspective. Drug metabolism Reviews, 43(2), 138-151.
Oakeshott, J. G., Johnson, R. M., Berenbaum, M. R., Ranson, H., Cristino, A. S. and
Claudianos, C. (2010). Metabolic enzymes associated with xenobiotic and chemosensory responses in 24 Nasonia vitripennis. Insect Molecular Biology, 19(1), 147-163.
Oppenoorth, F.J., Van der Pas, L.J.T. & Houx, N.W.H. (1979). Glutathione S-
transferase and hydrolytic activity in a tetrachlorvinphos-resistant strain of housefly and their influence on resistance. Pesticide Biochemistry and Physiology, 11, 176-188.
Pal, R., Blakemore, M., Ding, M. & Clark, A.G. (2012). A Study of the Glutathione
Transferase Proteome of Drosophila melanogaster: Use of S- Substituted Glutathiones as Affinity Ligands, Affinity Chromatography, Sameh Magdeldin (Ed.), ISBN: 978-953-51-0325-7.
Pastore, A., Piemonte, F., Locatelli, M., Russo, A.L., Gaeta, L.M., Tozzi, M. &
Federici, G. (2003). Determination of blood total, reduced, and oxidized glutathione in paediatric subjects. Clinical Chemistry, 47(1), 1467-1469.
Prapanthadara, L., Promtet, N., Koottathep, S., Somboon, P., & Ketterman, A.J., (2000).
Isoenzymes of glutathione S-transferase from the mosquito Anopheles dirus species B: the purification, partial characterization and interaction with various insecticides. Insect Biochemistry and Molecular Biology 30, 395-403.
Pearson, W.R. (2005). Phylogenies of glutathione transferase families. Methods in
Enzymology, 401, 186–204. Prabhu, K.S., Reddy, P.V., Gmpricht, G., Hildenbrandt, G.R., Scholz, R.W., Sordillo,
L.M. & Reddy, C.C. (2001). Microsomal glutathione S-transferase A1–1 with glutathione peroxidase activity from sheep liver: molecular cloning, expression and characterization. Biochemical Journal, 360, 345–354.
Raj, A. & Oudenaarden, A.V. (2008). Nature, nurture, or chance: Stochastic gene
expression and its consequences. Cell, 135(2), 216-226. Ranson H., Collins F. & Hemingway J. (1998). The role of alternative mRNA splicing
in generating heterogeneity within the Anopheles gambiae class I glutathione S-transferase family. Proceedings of National Academy of Sciences U.S.A., 95,14284–14289
100
Ranson, H., Claudianos, C., Ortelli, F., Abgrall, C., Hemingway, J., Sharakhova, M.V., Unger, M.F., Collins, F.H. & Feyereisen, R. (2002). Evolution of supergene families associated with insecticide resistance. Science, 298, 179–181.
Reinemer, P., Dirr, H.W., Ladenstein, R., Huber, R., Lo Bello, M. & Federici, G.
(1992). Three dimensional structure of class pi glutathione S-transferase from human placenta in complex with S-hexylglutathione at 2.8 A resolution. Journal Molecular Biology, 227, 214-226.
Robinson, A., Huttley, G.A., Booth, H.S. & Board, P.G. (2004). Modelling and
bioinformatics studies of the human Kappa-class glutathione transferase predict a novel third glutathione transferase family with similarity to prokaryotic 2-hydroxychromene 2-carboxylate isomerases. Biochemical Journal, 379, 541–552.
Rogers, M.E., Jani, M.K. & Vogt, R.G. (1999). An olfactory Specific Glutathione S-
transferase in the Spinx moth Manduca sexta. The Journal of Experimental Biology, 202, 1625-1637.
Rossjohn, J., Polekhina, G., Feil, S. C., Allocati, N., Masulli, M., DiIlio, C. & Parker,
M.W. (1998). A mixed disulfide bond in bacterial glutathione transferase : functional and evolutionary implications. Structure, 6, 721-734.
Roxas, V.P., Smith, R.K., Allen, E.R. & Allen, R.D., (1997). Overexpression of
glutathione S-transferase/ glutathione peroxidise enhances the growth of transgenic tobacco seedlings during stress. Nature Biotechnology, 15, 988-991.
Saisawang, C., Wonsantichon, J. & Ketterman, A.J. (2011). A preliminary
characterization of the cytocolic glutathione transferase proteome from Drosophila melanogaster. Biochemical Journal, 442(1), 181-190.
Sandford, A.J. & Silverman, E.K (2012). Chronic obstructive pulmonary disease.
Thorax, 57, 736-741. Sato, K. (1989). Glutathione transferases as markers of preneoplasia and neoplasia.
Advances in Cancer Research, 52, 205–255. Sawicki, R., Singh, S.P., Mondal A.K, Benes, H. & Zimniak, P. (2003). Cloning,
expression and biochemical characterization of one Epsilon-class (GST-3) and ten Delta-class (GST-1) glutathione S-transferase from Drosophila melanogaster, and identification of additional nine members of the Epsilon class. Biochemical Journal, 370, 661-669.
101
Sheehan, D., Meade, G., Foley, V.M. & Dowd, C.A. (2001). Structure, function and evolution of glutathione transferases: implications for classification of non-mammalian members of an ancient enzyme superfamily. Biochemical Journal, 360, 1–16.
Singh, S.P., Coronella, J.A., Benes, H., Cochrane, B.J. & Zimniak, P. (2001). Catalytic
function of Drosophila melanogaster glutathione S-transferase DmGSTS1-1 in conjugation of lipid peroxidation end products. European Journal Biochemistry, 268, 2912-2923.
Skopelitou, K., Dhavala, P., Papageorgiou, A.C.& Labrou, N.E. (2012). A Glutathione
Transferase from Agrobacterium tumefaciens Reveals a Novel Class of Bacterial GST Superfamily. PLoS ONE 7(4): e34263. doi:10.1371/journal.pone.0034263.
Spencer, S.R., Xue, L., Klenz, E.M. & Talalay, P. (1991). The potency of inducers of
NAD(P)H: (quinine-acceptor) oxidoreductase parallels their efficiency as substrates for glutathione transferases. Biochemistry Journal, 273, 711-717.
Stenersen, J., Kobro, S., Bjerke, M., & Arend, U. (1987). Glutathione transferases in
aquatic and terrestrial animals from nine phyla. Comparative Biochemistry and Physiology C., 86(1), 73–82.
Strange, R.C., Spiteri, M.A., Ramachandran, S. & Fryer, A.A. (2001). Glutathione-S-
transferase family of enzymes. Mutation Research, 482, 21–26. Stocker, R.F., Lienhard, M.C., Borst, A. & Fischbach, K.F. (1990). Neuronal
architecture of the antennal lobe in Drosophila melanogaster. Cell Tissue Research, 262(1), 9–34.
Stortkuhl, K. & Raffael, K. (2001). Functional analysis of an olfactory receptor in
Drosophila melanogaster. Neurobiology, 98(16), 9381-9385. Srivastava, S., Chandra, A., Wang, L.F., Seifert, W.E.J., DaGue, B.B., Ansari, N.H.,
Srivastava, S.K. & Bhatnagar, A. (1998). Metabolism of the lipid peroxidation product, 4-hydroxy-trans-2-nonenal, in isolated perfused rat heart. Journal of Biological Chemistry, 273, 10893–900.
Takesawa, T., Ito, M., Kanzaki, H., Kameya, N. & Ikuo, N., (2002). Over-expression of
glutathione S-transferase in transgenic rice enhances germination and growth at low temperature. Molecular Breeding, 9, 93-101.
102
Tan, K.L., Chelvanayagam, G., Parker, M.W. & Board, P.G. (1996). Mutagenesis of the active site of the human theta class glutathione transferase GSTT2-2: catalysis with different substrate involves different residues. Biochemical Journal, 319, 315-321.
Tew, K.D. (1994). Glutathione-associated enzymes in anticancer drug resistance.
Cancer Research, 54, 4313–4320. Toba, G. & Aigaki, T. (2000). Disruption of the microsomal glutathione S-transferase-
like gene reduces life span of Drosophila melanogaster. Gene, 253, 179–187. Udomsinprasert, R., Bogoyevitch, M.A. & Ketterman A. J. (2004). Reciprocal
regulation of glutathione S-transferase spliceforms and the Drosophila c-Jun N-terminal kinase pathway components. Biochemical Journal, 383, 483-490
Vontas, J.G., Small, G.J. & Hemingway, J. (2001). Glutathione Stransferases as
antioxidant defence agents confer pyrethroid resistance in Nilaparvata lugens. Biochemical Journal, 357, 65–72.
Vuilleumier, S. (1997). Bacterial glutathione S-transferases:what are they good for?.
Journal of Bacteriology, 179, 1431–1441. Wagner, U., Edwards, R., Dixon D.P. & Mauch, F., (2002). Probing the diversity of the
Arabidopsis glutathione S-Transferase gene family. Plant Molecular Biology, 49, 515-532.
Wilce, M.C.J. & Parker, M.W. (1994). Structure and function of Glutathione S-
transferase. Biochimica et Biophysica Acta, 1205, 1-18. Wilhelm, D., Bender, K., Knebel, A. & Angel, P. (1997). The level of intracellular
glutathione is a key regulator for the induction of stress-activated signal transduction pathways including Jun N-terminal protein kinases and p38 kinase by alkylating agents. Molecular and Cellular Biology, 17, 4792–4800.
Wiktelius, E. & Stenberg, G. (2007). Novel class of glutathione transferases from
cyanobacteria exhibit high catalytic activities towards naturally occurring isothiocyanates. Biochemical Journal, 406, 115–123.
Wongsantichon, J. & Ketterman, A. (2005). Alternative splicing of glutathione
transferases. Methods in Enzymology, 401, 100-116.
103
Wongtrakul, J., Wongsantichon, J., Vararattanavech, A., Leelapat, P., Prapanthadara, L. & Ketterman, A.J. (2009). Molecular cloning and expression of several new Anopheles cracens Epsilon GSTs. Protein & Peptide, 16, 75-81.
Yamamoto, K., Nagaoka, S., Banno, Y. & Aso, Y. (2009). Biochemical properties of an
omega-class glutathione s-transferase of the silkworm, Bombyx mori. Comparative Biochemistry and Physiology C, 149, 461-467.
Yang, J., McCart,C., Woods, D. J., Terhzaz, S., Greenwood, K.G., Constant,R.H. &
Dow, J.A.T. (2007). A Drosophila systems approach to xenobiotic metabolism. Physiological Genomics, 30, 223–231.
Yu, S.J. (1996). Insect glutathione S-transferases. Zoological Studies, 35, 9–19. Zhou, J. & Goldsbrough, P.B. (1993). An Arabidopsis gene with homology to
glutathione S-transferase is regulated by ethylene. Plant Mol Biol, 22, 517–523. Zhao, D., Chen, L., Qin, C., Zhang, H., Wu, P. & Zhang, F. (2010). A delta-class
glutathione transferase from the Chinese mitten crab Eriochei sinesis: cDNA cloning, characterization, and mRNA expression. Fish & Shellfish Immunology, 29, 698-703.
Zheng, S.C., Deng, H.M., Ladd, T.R., Tomkins, B., Krell, P.J. & Feng, Q. (2007).
Cloning and characterization of two glutathione S-transferase cDNAs in the spruce budworm, Choristoneura fumiferana. Archive of Insect Biochemistry and Physiology, 66, 146–157.
104
APPENDICES
Appendix A: Buffer Solution Preparation
Buffer A- Sodium Phosphate Buffer (0.1 M, pH 7.4)
12 g of NaH2PO4 was dissolved in approximately 900 ml of dH2O. The pH of the
solution was adjusted 7.35 at 20ºC and the volume was made up to 1000 ml.
Buffer B- Tris Buffer (0.1 M, pH 9.0)
12.11 g Tris base was dissolved in approximately 900 ml of dH2O and the pH was
adjusted 9.0 at 20ºC. The volume was then made up to 1000 ml.
Buffer C- Sodium Phosphate Buffer (0.1 M, pH 7.5)
12 g of NaH2PO4 was dissolved in approximately 900 ml dH2O and the pH was
adjusted to 7.5 at 20ºC. The volume was then made up to 1000 ml.
Running buffer for FPLC
Sodium Phosphate buffer (25 mM, pH 7.4)
3 g NaH2PO4 was dissolved in approximately 900 ml of dH2O. The pH of the solution
was adjusted to 7.35 at 20ºC and the volume was made up to 1000 ml.
Elution buffers for FPLC
Glutathione (10 mM, pH 7.4)
0.307 g of reduced glutathione was dissolved in 100 ml of 25 mM phosphate buffer and
pH was adjusted to 7.4 at 20ºC.
105
Imidazole (300 mM, pH 7.4)
2.0424 g of imidazole was dissolved in 100 ml 25 mM phosphate buffer and pH was
adjusted to 7.4.
Bromosulfophthalein (2 mM, pH 7.4)
0.167 g of BSP was dissolved in 100 ml 25 mM phosphate buffer and pH was adjusted
to 7.4.
Sodium chloride (1 M, pH 7.4)
5.844 g of sodium chloride was added to 100 ml of 25 mM Phosphate buffer and pH
was adjusted to 7.4
Potassium Chloride (1 M, pH 7.4)
7.456 g of potassium chloride was added to 100 ml of 25 mM phosphate buffer and pH
was adjusted to 7.4.
Appendix B: Preparations for cell culturing.
Luria Bertani broth
20 g of LB broth was dissolved in 1000 ml dH2O. The solution was then autoclaved at
120ºC for 20 minutes.
Kanamycin stock solution (30 mg/ml)
1.5 g kanamycin sulphate is dissolved in 50 ml deionized water. Solution was filter
sterilized and stored in -20ºC.
106
Ampicilin stock solution (100 mg/ml)
5 g ampicilin sodium salt is dissolved in 50 ml deionized water. Solution was filter
sterilized and stored in -20ºC.
X-gal stock solution (40 mg/ml)
400 mg of 5-bromo-4-chloro-3-indolyl β-D-galactopyranoside were dissolved 10 ml
dimethylformamide. Solution is protected from light by wrapping in aluminium foil.
Solution is stored in -20ºC.
IPTG stock solution (100 mM)
238.3 mg isopropyl β-D-thiogalactopyranoside dissolved in 10 ml deionized water.
Solution is filter-sterilized and store in -20ºC.
LB Agar plates preparation
35 g of LB Agar was dissolved in 1000 ml dH2O. The solution was then autoclaved at
120ºC for 20 minutes.
The autoclaved LB agar was allowed to cool to 55ºC. 1 ml kanamycin stock solution
was added and mixed. For blue/white screening, 2 ml X-gal stock solution and 0.5 ml
IPTG stock solution were added. Agar was poured into plates, allowed to set, inverted
and stored at 4ºC under sterile conditions
107
Appendix C: Solutions for SDS Polyacrylamide Gel Electrophoresis
SDS (10% (w/v)
10 g SDS was dissolved in 50 ml miliQ dH2O with gentle shaking. Then the volume
was made up to 100 ml.
SDS Sample Buffer
The buffer consisted of 62.5 mM Tris-HCl, pH 6.8, 20% (v/v) glycerol, 2% (w/v) SDS
and 5% (v/v) β-mercaptoethanol. To prepare a buffer solution of 2 ml, 0.25 ml of 0.5 M
Tris-HCl, pH 6.8, 0.4 ml glycerol, 0.4 ml 10% (w/v) SDS, 0.1 ml β-mercaptoethanol,
0.1 ml of 0.5% (w/v) bromophenol blue and 0.75 ml miliQ H2O were mixed. To
prepare sample in sample buffer, the sample was diluted at least 1:4 ratio. Then, the
sample was heated at 95ºC for 4minutes.
SDS gel staining.
Colloidal Coomassie Brilliant Blue G-250.
One g of Coomassie Brilliant Blue G-250 was added in 20 ml of dH2O was sonicated
until it dissolves. 11.8 ml of 85% (w/v) phosphoric acid is added to the CBB solution.
100 g of ammonium sulphate was dissolved in approximately 600 ml of dH2O. Then the
CBB solution was added little by little and made up to 1 litre.
108
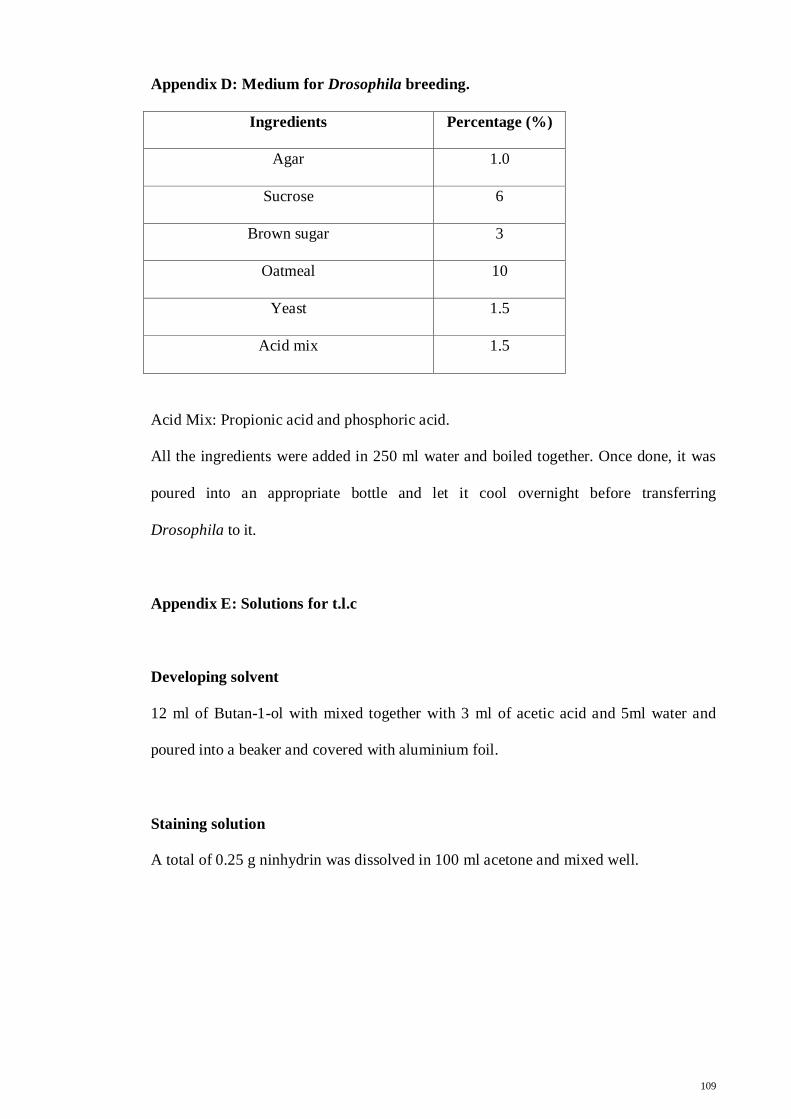
Appendix D: Medium for Drosophila breeding.
Ingredients Percentage (%)
Agar 1.0
Sucrose 6
Brown sugar 3
Oatmeal 10
Yeast 1.5
Acid mix 1.5
Acid Mix: Propionic acid and phosphoric acid.
All the ingredients were added in 250 ml water and boiled together. Once done, it was
poured into an appropriate bottle and let it cool overnight before transferring
Drosophila to it.
Appendix E: Solutions for t.l.c
Developing solvent
12 ml of Butan-1-ol with mixed together with 3 ml of acetic acid and 5ml water and
poured into a beaker and covered with aluminium foil.
Staining solution
A total of 0.25 g ninhydrin was dissolved in 100 ml acetone and mixed well.
109
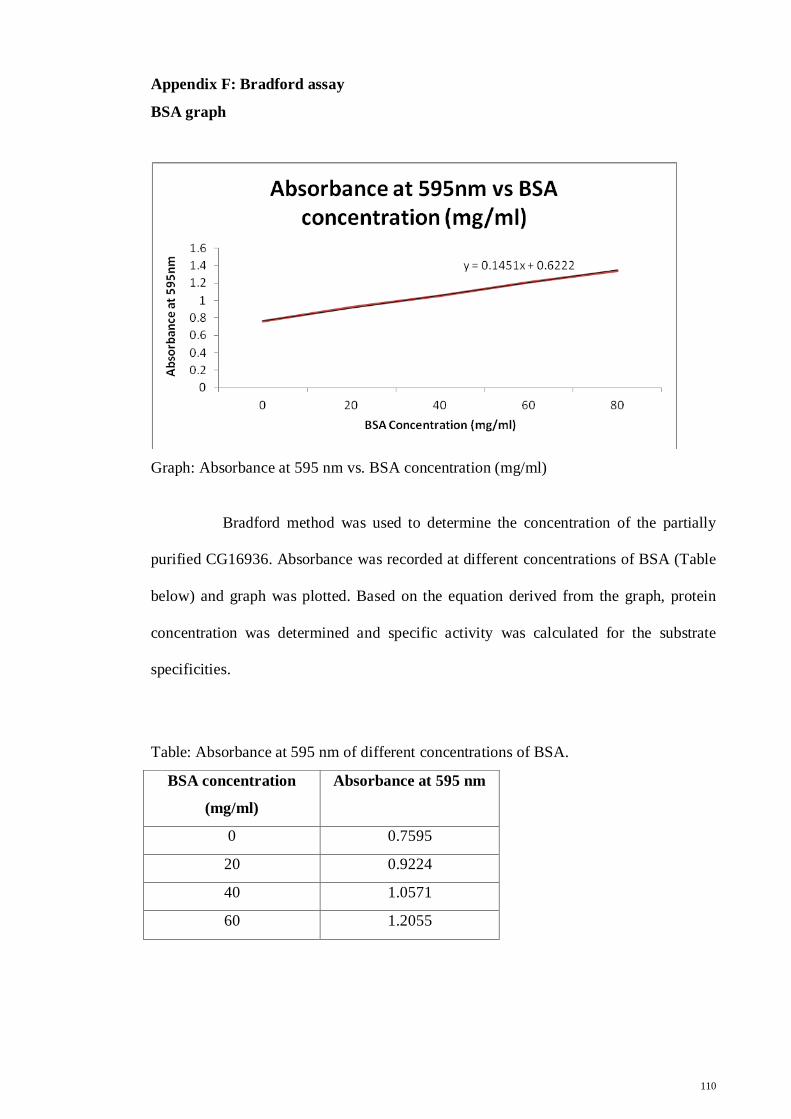
Appendix F: Bradford assay
BSA graph
Graph: Absorbance at 595 nm vs. BSA concentration (mg/ml)
Bradford method was used to determine the concentration of the partially
purified CG16936. Absorbance was recorded at different concentrations of BSA (Table
below) and graph was plotted. Based on the equation derived from the graph, protein
concentration was determined and specific activity was calculated for the substrate
specificities.
Table: Absorbance at 595 nm of different concentrations of BSA.
BSA concentration
(mg/ml)
Absorbance at 595 nm
0 0.7595
20 0.9224
40 1.0571
60 1.2055
110
Appendix G: Substrates preparations
1-Chloro-2,4-dinitrobenzene (CDNB)
0.2430 g of CDNB was dissolved in 20 ml of ethanol. It was mixed well and stored at
room temperature, in a universal bottle covered with aluminium foil to protect it from
light.
1,2-Dichloro-4-nitrobenzene (DCNB)
0.092 g of DCNB was dissolved in 20 ml of ethanol. It was mixed well and stored at
room temperature, in a universal bottle covered with aluminium foil to protect it from
light.
p-Nitrophenyl chloride (NBC)
0.2058 g of NBC was dissolved in 20 ml of ethanol. It was mixed well and stored in a
universal bottle, at room temperature.
1,2-Epoxy-3-nitrophenoxypropane (EPNP)
0.1171 g of EPNP was dissolved in 20 ml ethanol. It was mixed well and stored in a
universal bottle, at room temperature.
Sulfobromophthalein (BSP)
0.0334 g of BSP was dissolved in 20 ml ethanol. It was mixed well and stored in a
universal bottle, at room temperature.
111
Ethacynic acid (EA)
0.0727 g was dissolved in 20 ml ethanol. It was mixed well and stored in a universal
bottle, at room temperature.
Trans-4-phenyl-3-butene-2-one (PBO)
0.0876 g was dissolved in 20 ml ethanol. It was mixed well and stored in a universal
bottle, at room temperature.
Trans-2-hexenal
2.326 µl of trans-2-hexenal stock in 20 ml ethanol. It was mixed well and stored in a
universal bottle, at room temperature.
Trans-Oct-2-enal
11.19 µl of trans-octenal stock in 50 ml Buffer A. It was mixed well and stored in a
volumetric flask covered with aluminium, at room temperature.
2,4-Heptadienal
94.94 µl of 2,4-heptadienal stock in 250 ml Buffer A. It was mixed well and stored in a
volumetric flask covered with aluminium, at room temperature.
Hexa-2,4-dienal
82.42 µl of hexa-2,4-dienal stock in 250 ml buffer A. It was mixed well and stored in a
volumetric flask covered with aluminium, at room temperature.
112