Embed Size (px)
Citation preview
Coal Geology of Adams, Blaine, Richardson, and Sitka Quadrangles, Kentucky, and Louisa Quadrangle, Kentucky-West Virginia
GEOLOGICAL SURVEY BULLETIN 1526

Coal Geology of Adams, Blaine, Richardson, and Sitka Quadrangles, Kentucky, and Louisa Quadrangle, Kentucky-West Virginia
By PHILIP T. HAYES and CAROL WAITE CONNOR
GEOLOGICAL SURVEY BULLETIN 1526
Resources and physical and chemical characteristics of the Pennsylvanian-age bituminous coal are noted. Stratigraphy, structure, and depositional history are discussed, in relation to published geologic quadrangle maps
UNITED STATES GOVERNMENT PRINTING OFFICE, WASHINGTON : 1982
UNITED STATES DEPARTMENT OF THE INTERIOR
JAMES G. WATT, Secretary
GEOLOGICAL SURVEY
Dallas L. Peck, Director
Library of Congress Cataloging in Publication Data Hayes,PhilipThayer, 1923-Coal geology of Adams, Blaine, Richardson, and Sitka quadrangles, Kentucky, and Louisa quadrangle, KentuckyWest Virginia. (Geological Survey Bulletin 1526) Bibliography: p. 56 Supt. ofDocs. No.: I 19.3:1526 1. Coal-Geology-Kentucky. 2. Coal-Geology-WestVirginia. I. Connor, Carol Waite. II. Title. III. Series. QE75.B9 No. 1526 [TN805.K3] 557.3s 81--607980 [553.2'4'0976926] AACR2
For sale by the Superintendent of Documents, U.S. Government Printing Office Washington, D.C. 20402
CONTENTS
Abstract - - - - - - - - - - -- - -- - -- - - -- - - - - - - - - - - - - - - - - - - - - - - - -- - -- - - - - - - - - - - - - - - - --Introduction - -- - - - -- -- - - - - - - - - - - - - - - - - - - - -- - - - - - - - - - -- - - - -- - - -- - - - - - -- - - - --
Location - - - - - - - - - -- - -- - - - - - - - - - - - - - - - - - - - - - - -- - -- - - - -- - -- - - - - - - - - - - - - - -Description of project - - - - - - - - - - - - - - - - - -- - - - -- - - - - - -- - - -- - - - - - - - - -- - - - - --Previous work---------------------------------------------------------A.cknow ledgmen ts - - - - - - - - - - - - - - - - - - - - - - - - - - - - - - - - - - - - - - - - - - - - - - - - - - - - - -Methods and definitions ------------------------------------------------
Geologic setting - - -- - - - - - - - - - - - - - - - - -- - - - - - - -- - - - -- - - - - - - - - - - - - - -- - - -- - -- - - -Stratigraphy of Pennsylvanian rocks -------------------------------------
Lee Formation-----------------------------------------------------Breathitt Formation -- ---- - ---- ---- --- -- -- --- - --- ---- ----- -- -- -----
Base of formation to base of Van Lear coal bed -- - - - - - - - - - - - - -- - - -Base of Van Lear coal bed to base of Whitesburg coal bed --- --- --Base of Whitesburg coal bed to base of Magoffm Member --------Base of Magoffin Member to base of Peach Orchard coal zone --- -Base of Peach Orchard coal zone to top of Richardson coal zone -- -Top of Richardson coal zone to top of formation - - - - - -- - - - -- - - - - - -
Conemaugh and Monongahela(?) Formations ------------------------Interpretation of depositional history------------------------------------
Open marine carbonates and tidal flats --- ----- -- ---- ---- ------ ----- -Rocks below Lee Formation - - - - - - - - - - - - - - - - -- - - - - - -- - - -- - - - - - - - -
Barrier-island complex---------------------------------------------Sandstone of Lee Formation -- -- ---- ------- ----- ------ -- -- ---- - -
Estuary or lagoon - - - - - - - - - - - - - - - - - - - - - - - - - - - - - - - - - - - - - - - - - - - - - - - - - -Rocks from base of Breathitt Formation to below Van Lear coal bed
Page
1 2 2 2 2 3 4 5 5 5 7 7 7 8 9
10 10 11 12 15 15 16 16 16 16
Lower delta plain - -- -- -- ---- ------ --- ---- - --- ------- ---- ---- - ----- - 17 Rocks from below Van Lear .coal bed to Whitesburg coal bed ------ 17
Transitional zone ------- ----- ---- --- -- --- - ---- ----- ----- - ---- -- ----- 18 Rocks from Whitesburg coal bed to base of Peach Orchard coal zone 18
Upper delta plain - - - - - - - - - - - - - - - - - - - - - - - - -- - - - - - -- - - - - - - - - - - - - - -- - - 18 Rocks from base of Peach Orchard coal zone to base of Princess No.
6 coal zone - - - - - -- - - - - - - - - - - - - - - - - - - - - - - - - - -- - -- - - - - - - - - - - - - - 18 All uvial plain - - -- - - - - - - - - - - - - - - - - - - - - - - - - - - - - - - - - - - - -- - - - - - - - -- - - - - 19
Rocks from base of Princess No. 6 coal zone to top of Breathitt For-mation - - - - - - - - - -- - - - - - - - - - - - - - - - - - - - - - - - - - - - - -- - - - - - - - - - -- - - 19
Rocks from base of Conemaugh Formation to Brush Creek coal bed 19 Lower delta plain - - - - - - - - - - - - - - - - -- - - - - - - - - - - - - -- - - - - -- - - - - - - - - - - - - 20
Rocks from Brush Creek Limestone Member to top of exposed sec-tion in Monongahela(?) Formation----------------------------- 20
Geologic structure -- - -- - -- - - - - - - - - - - - - - - - - - - - - - - - - - - - - - - - - -- - - - - - - - - - - - - 20 Coal beds or zones - - - - - - - - - - - - - - - - - - - - - - - - - - - - - - - - - - - - - - - - - - - - - - - - - - - - - - - - - 21
Unnamed coal bed below the sandstone of the Lee Formation - - - - - - - - -- - - 25 Van Lear coal bed - - - - - - - - -- - - - - - - - - - - - - - - -- - - - -- - - - - - - - - - - - - - -- - - - -- - - - 25 Williamson coal zone - - - - - - - - - - - - - - - - - -- - -- -- - -- - - - - - - - - - - - - - - - - - - -- - - - - 29 Whitesburg coal bed---------------------------------------------------- 29 Little Fire Clay coal bed - - -- - - - - - - - - - - -- - - - - - - - - - - - - - - - - - - - - - - - - - - - - - - - - 36
m
IV CONTENTS
Coal beds or zones - Continued Page
Fire Clay coal bed- - - - - - - - - - -- -- - - -- - - - - -- - - - - - - - - - - - - - -- - - - - - - - -- -- - - - - 38 Fire Clay rider coal bed - - - - -- - - - - -- -- - - - - - - - - - -- - - - -- - - - - -- - -- - - - - - - - - - 39 Hamlin coal zone - -- - -- - - - - - -- - - -- -- - - - - - - - -- - - -- - -- - - - -- -- - - -- - - - - - - - - 40 Haddix coal bed ------------------------------------------------------- 40 Hazard coal zone -- - - -- - -- - - - - - - - -- - - - -- - -- - - - -- - - : - - - - - - - - - -- - - - - - - -- - - 42 Peach Orchard coal zone - - - -- - - - - -- - -- -- - - - - - - - -- - - - - - - - -- -- - - - -- - - - -- - - 43 Broas coal zone - - - - - -- - - - - - - - - -- - -- -- - -- -- - - - - - - - - - - -- - -- - - - -- - -- - - - -- - 44 Richardson coal zone - - - - - - - - - - - - - -- - - -- - - - - - - - -- - - - -- - - -- -- - - -- - - - -- - - - 46 Princess No. 6 coal zone - - - - - - - - - - - - - - - - - - - - - - - - - - - - - - - - - - - - - - - - - - - - - - - - 48 Princess No. 7 coal bed -- -- - - - - - - - - - - - - - - - - -- - -- - - - - - - - - - -- - - -- - - - - - - - - - 49 Princess No. 8 coal bed - - - - - - - - - - - - - - - - -- - - - - - - - - - - - - - - - - - - - - - - - - - - - - - -- 50 Princess No. 9 coal zone ------------------------------------------------ 50 Brush Creek coal bed - - - - - - -- - - - - -- - - - - -- - - - - - - -- - - - - - - - - - -- - - -- - - -- - -- - 52 Unnamed coal bed of Conemaugh Formation --- ------------- ------- ---- -- 53
General observations on analytical data-------------------·------------------- 53 Stratigraphic trends - --- --- --- ----- ---- ------- ---- ------ -- --- ----- --- --- 54 Geographic trends -- - - - - -- - - - - - - - - - - - - - - -- - - - - - - - - - - -- - - - - - - - -- - - - - - - - - - 55
References cited ---- ---- --- --------- --- ---- -- ---- ---- --- - ----- ----- -- -- - ---- 56
ILLUSTRATIONS
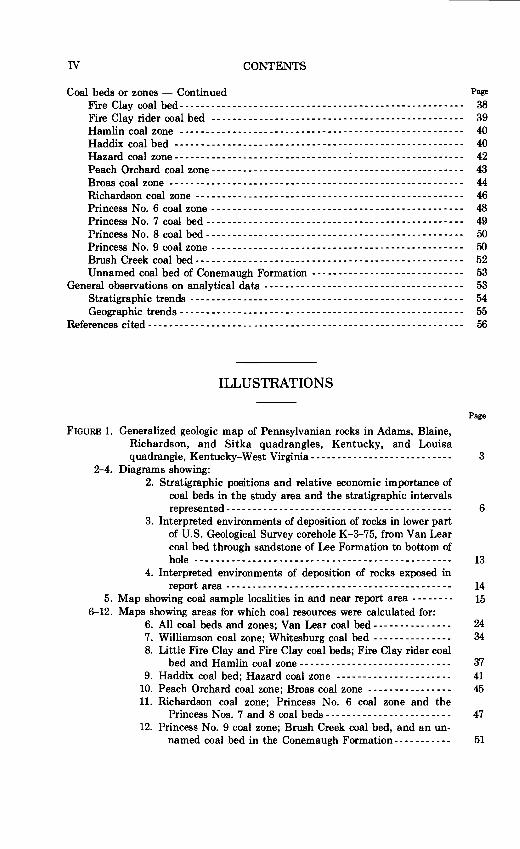
FIGURE 1. Generalized geologic map of Pennsylvanian rocks in Adams, Blaine, Richardson, and Sitka quadrangles, Kentucky, and Louisa
Page
quadrangle, Kentucky-West Virginia--------------------------- 3 2-4. Diagrams showing:
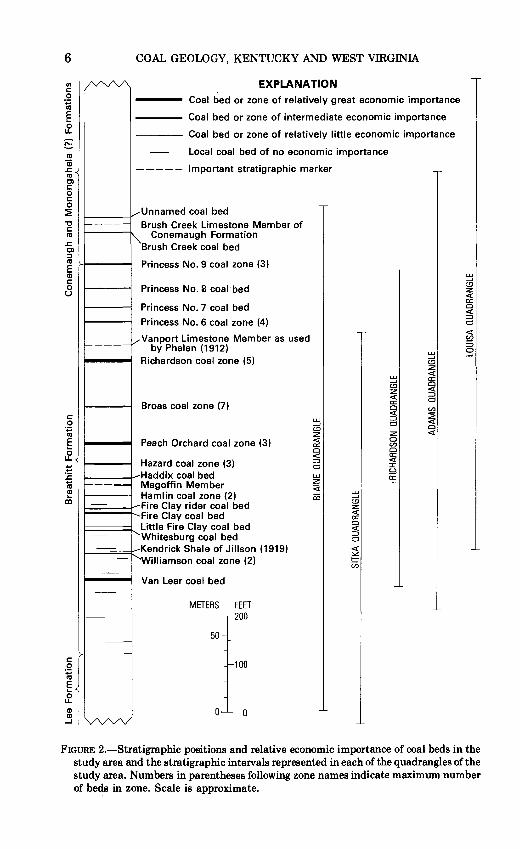
2. Stratigraphic positions and relative economic importance of coal beds in the study area and the stratigraphic intervals represented------------------------------------------- 6
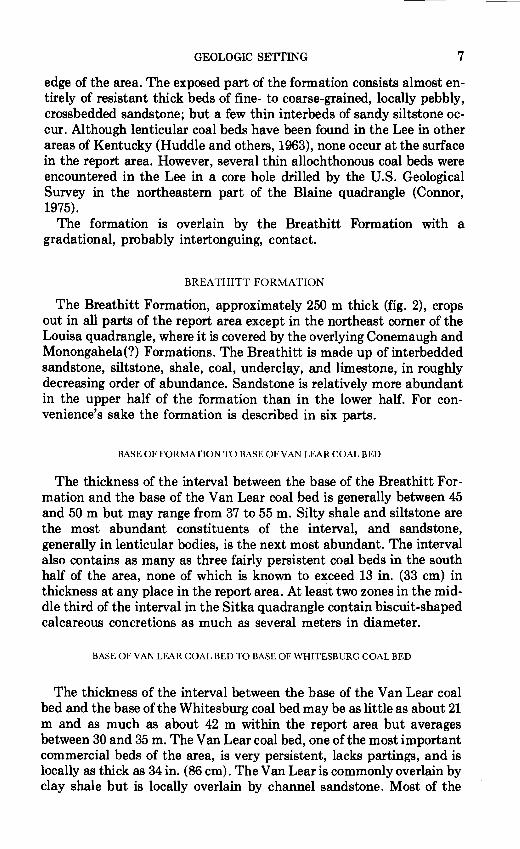
3. Interpreted environments of deposition of rocks in lower part of U.S. Geological Survey corehole K-3-75, from Van Lear coal bed through sandstone of Lee Formation to bottom of h~e ------------------------------------------------- 13
4. Interpreted environments of deposition of rocks exposed in report area------------------------------------------- 14
5. Map showing coal sample localities in and near report area -------- 15 6-12. Maps showing areas for which coal resources were calculated for:
6. All coal beds and zones; Van Lear coal bed--------------- 24 7. Williamson coal zone; Whitesburg coal bed ------ ----- ---- 34 8. Little Fire Clay and Fire Clay coal beds; Fire Clay rider coal
bed and Hamlin coal zone - - - - - - - - - - - - - -- - -- - -- -- - - - - -- 37 9. Haddix coal bed; Hazard coal zone ---------------------- 41
10. Peach Orchard coal zone; Broas coal zone ---------------- 45 11. Richardson coal zone; Princess No. 6 coal zone and the
Princess Nos. 7 and 8 coal beds - -- -- -- -- --- --- ---- ---- - 47 12. Princess No. 9 coal zone; Brush Creek coal bed, and an un-
named coal bed in the Conemaugh Formation------- ---- 51
CONTENTS v
TABLES
Page
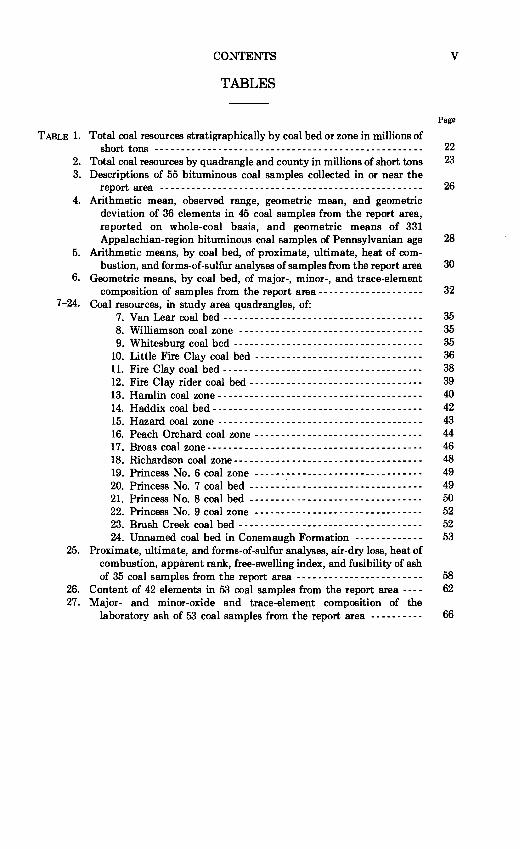
TABLE 1. Total coal resources stratigraphically by coal bed or zone in millions of short tons --------------------------------------------------- 22
2. Total coal resources by quadrangle and county in millions of short tons 23 3. Descriptions of 55 bituminous coal samples collected in or near the
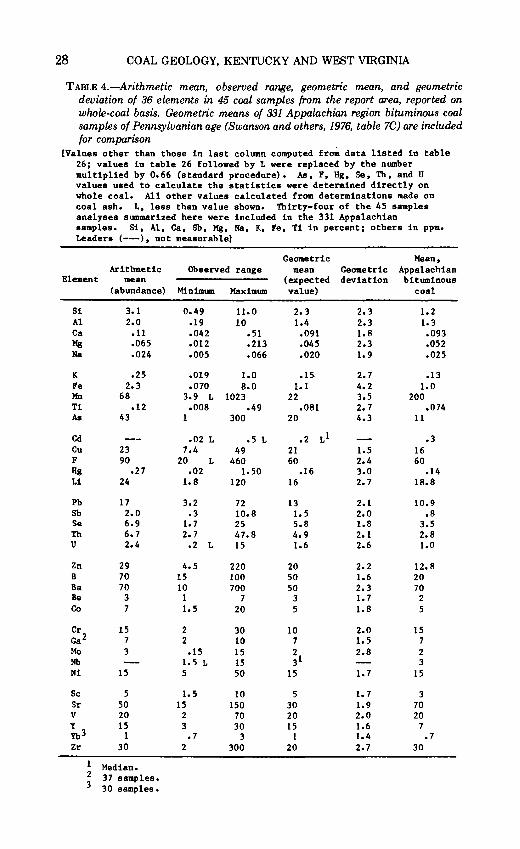
report area -------------------------------------------------- 26 4. Arithmetic mean, observed range, geometric mean, and geometric
deviation of 36 elements in 45 coal samples from the report area, reported on whole-coal basis, and geometric means of 331 Appalachian-region bituminous coal samples of Pennsylvanian age 28
5. Arithmetic means, by coal bed, of proximate, ultimate, heat of com-bustion, and forms-of-sulfur analyses of samples from the report area 30
6. Geometric means, by coal bed, of major-, minor-, and trace-element composition of samples from the report area -------------------- 32
7-24. Coal resources, in study area quadrangles, of: 7. Van Lear coal bed - - - - - - - - - - - - - - - - - - - -- - - -- - - - - - - - - - - - - - 35 8. Williamson coal zone - ----- -- -- --- --- ----- ---------- ---- 35 9. Whitesburg coal bed ------------------------------------ 35
10. Little Fire Clay coal bed -------------------------------- 36 11. Fire Clay coal bed-------------------------------------- 38 12. Fire Clay rider coal bed --------------------------------- 39 13. Hamlin coal zone --------------------------------------- 40 14. Haddix coal bed---------------------------------------- 42 15. Hazard coal zone --- ---- -- -- ---- -- --- ------- ----- ------- 43 16. Peach Orchard coal zone - ---- -- --- --- ----- ---- ------ ---- 44 17. Broas coal zone----------------------------------------- 46 18. Richardson coal zone------------------------------------ 48 19. Princess No. 6 coal zone -------------------------------- 49 20. Princess No. 7 coal bed --------------------------------- 49 21. Princess No. 8 coal bed - - - - - - - - - - - - - -- - - - - - - - - - -- - - - - - - - 50 22. Princess No. 9 coal zone -------------------------------- 52 23. Brush Creek coal bed----------------------------------- 52 24. Unnamed coal bed in Conemaugh Formation ------------- 53
25. Proximate, ultimate, and forms-of-sulfur analyses, air-dry loss, heat of combustion, apparent rank, free-swelling index, and fusibility of ash of 35 coal samples from the report area ------------------------ 58
26. Content of 42 elements in 53 coal samples from the report area --- - 62 27. Major- and minor-oxide and trace-element composition of the
laboratory ash of 53 coal samples from the report area -- ---- ---- 66

COAL GEOLOGY OF ADAMS, BLAINE, RICHARDSON, AND SITKA
QUADRANGLES, KENTUCKY, AND LOUISA QUADRANGLE,
KENTUCKY -WEST VIRGINIA
By PHILIP T. HAYES and CAROL WAITE CONNOR
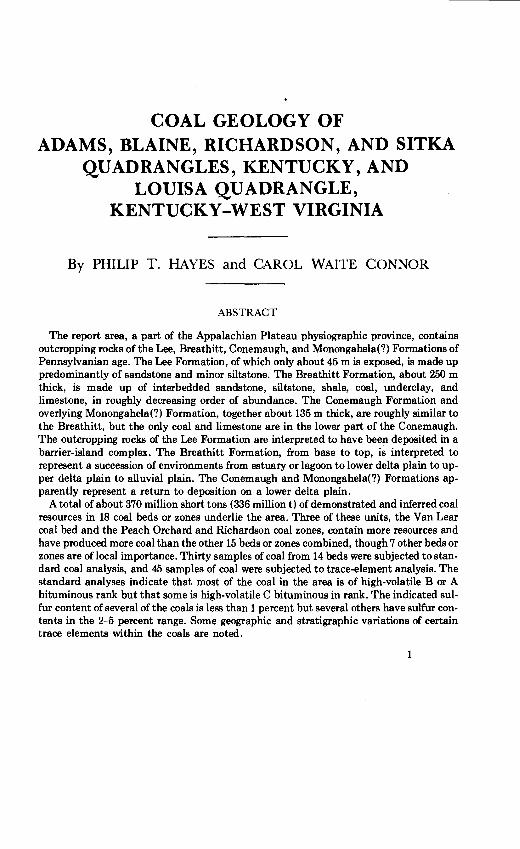
ABSTRACT
The report area, a part of the Appalachian Plateau physiographic province, contains outcropping rocks of the Lee, Breathitt, Conemaugh, and Monongahela(?) Formations of Pennsylvanian age. The Lee Formation, of which only about 45 m is exposed, is made up predominantly of sandstone and minor siltstone. The Breathitt Formation, about 250 m thick, is made up of interbedded sandstone, siltstone, shale, coal, underclay, and limestone, in roughly decreasing order of abundance. The Conemaugh Formation and overlying Monongahela(?) Formation, together about 135m thick, are roughly similar to the Breathitt, but the only coal and limestone are in the lower part of the Conemaugh. The outcropping rocks of the Lee Formation are interpreted to have been deposited in a barrier-island complex. The Breathitt Formation, from base to top, is interpreted to represent a succession of environments from estuary or lagoon to lower delta plain to upper delta plain to alluvial plain. The Conemaugh and Monongahela(?) Formations apparently represent a return to deposition on a lower delta plain.
A total of about 370 million short tons (336 million t) of demonstrated and inferred coal resources in 18 coal beds or zones underlie the area. Three of these units, the Van Lear coal bed and the Peach Orchard and Richardson coal zones, contain more resources and have produced more coal than the other 15 beds or zones combined, though 7 other beds or zones are of local importance. Thirty samples of coal from 14 beds were subjected to standard coal analysis, and 45 samples of coal were subjected to trace-element analysis. The standard analyses indicate that most of the coal in the area is of high-volatile B or A bituminous rank but that some is high-volatile C bituminous in rank. The indicated sulfur content of several of the coals is less than 1 percent but several others have sulfur contents in the 2--0 percent range. Some geographic and stratigraphic variations of certain trace elements within the coals are noted.
1
2 COAL GEOLOGY, KENTUCKY AND WEST VIRGINIA
INTRODUCTION
LOCATION
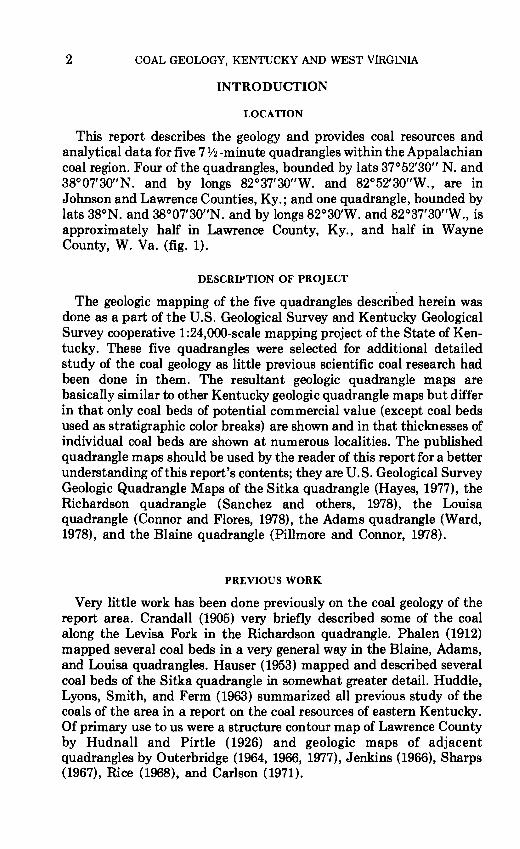
This report describes the geology and provides coal resources and analytical data for five 7 V2 -minute quadrangles within the Appalachian coal region. Four of the quadrangles, bounded by lats 37° 52'30" N. and 38°07'30"N. and by longs 82°37'30"W. and 82°52'30"W., are in Johnson and Lawrence Counties, Ky.; and one quadrangle, bounded by lats 38°N. and 38°07'30"N. and by longs 82°30'W. and 82°37'30"W., is approximately half in Lawrence County, Ky., and half in Wayne County, W. Va. (fig. 1).
DESCRIPTION OF PROJECT
The geologic mapping of the five quadrangles described herein was done as a part of the U.S. Geological Survey and Kentucky Geological Survey cooperative 1 :24,000-scale mapping project of the State of Kentucky. These five quadrangles were selected for additional detailed study of the coal geology as little previous scientific coal research had been done in them. The resultant geologic quadrangle maps are basically similar to other Kentucky geologic quadrangle maps but differ in that only coal beds of potential commercial value (except coal beds used as stratigraphic color breaks) are shown and in that thicknesses of individual coal beds are shown at numerous localities. The published quadrangle maps should be used by the reader of this report for a better understanding of this report's contents; they are U.S. Geological Survey Geologic Quadrangle Maps of the Sitka quadrangle (Hayes, 1977), the Richardson quadrangle (Sanchez and others, 1978), the Louisa quadrangle (Connor and Flores, 1978), the Adams quadrangle (Ward, 1978), and the Blaine quadrangle (Pillmore and Connor, 1978).
PREVIOUS WORK
Very little work has been done previously on the coal geology of the report area. Crandall (1905) very briefly described some of the coal along the Levisa Fork in the Richardson quadrangle. Phalen (1912) mapped several coal beds in a very general way in the Blaine, Adams, and Louisa quadrangles. Hauser (1953) mapped and described several coal beds of the Sitka quadrangle in somewhat greater detail. Huddle, Lyons, Smith, and Ferm (1963) summarized all previous study of the coals of the area in a report on the coal resources of eastern Kentucky. Of primary use to us were a structure contour map of Lawrence County by Hudnall and Pirtle ( 1926) and geologic maps of adjacent quadrangles by Outerbridge (1964, 1966, 1977), Jenkins (1966), Sharps (1967), Rice (1968), and Carlson (1971).
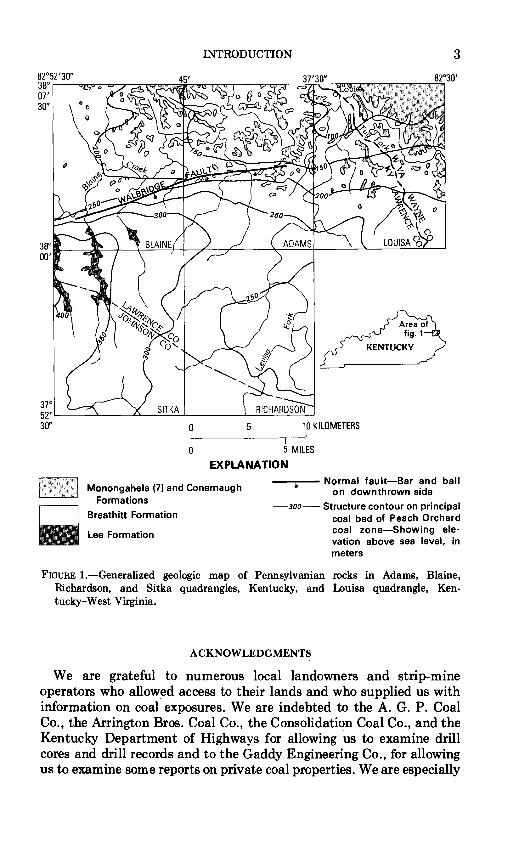
INTRODUCTION 3
0 5 MILES
EXPLANATION
Monongahela (?)and Conemaugh Formations
-"'"""'T"-- Normal fault-Bar and ball on downthrown side
-Joo- Structure contour on principal coal bed of Peach Orchard coal zone-Showing elevation above sea level, in meters
Breathitt Formation
Lee Formation
FIGURE !.-Generalized geologic map of Pennsylvanian rocks in Adams, Blaine, Richardson, and Sitka quadrangles, Kentucky, and Louisa quadrangle, Kentucky-West Virginia.
ACKNOWLEDGMENTS
We are grateful to numerous local landowners and strip-mine operators who allowed access to their lands and who supplied us with information on coal exposures. We are indebted to the A. G. P. Coal Co., the Arrington Bros. Coal Co., the Consolidation Coal Co., and the Kentucky Department of Highways for allowing us to examine drill cores and drill records and to the Gaddy Engineering Co., for allowing us to examine some reports on private coal properties. We are especially
4 COAL GEOLOGY, KENTUCKY AND WEST VIRGINIA
indebted to Charles L. Rice and William F. Outerbridge of the U.S. Geological Survey for acquainting us with local coal stratigraphy when we were beginning our work in the area and to John C. Horne of the University of South Carolina for sharing his unpublished data on coal beds in highway cuts. Many other geologists also lent help and advice both in the field and during compilation.
METHODS AND DEFINITIONS
The coal resource calculations presented in this report were made in accordance with the standardized methods used by the U.S. Bureau of Mines and the U.S. Geological Survey (1976) except that, for reasons described here, in most cases we were more conservative in the calculation of inferred resources than is customary. The coal beds as depicted on the geologic quadrangle maps of the report area were drawn in accordance with the latest guidelines accepted by the joint U.S. Geological Survey-Kentucky Geological Survey geologic mapping project. In general, the methods for resource calculation and guidelines for coalbed mapping are compatible, but the reader should be aware of what those methods and guidelines are and the small ways in which they may seem to be in conflict.
Resource calculations were not made for beds that are less than 14 in. (36 em) thick, and coal beds believed to be less than that thickness are not shown on the geologic maps except where they are important stratigraphic markers separating differently colored stratigraphic units on the maps. On the maps, coal beds more than 14 in. (36 em) thick are depicted by one symbol within about 1 km of points of observation, such as adits, prospects, strip benches, road cuts, or drill holes, and are depicted by another symbol for an additional 1 km, except in cases where the bed is known to be cut out by channel sands or thins to less than 14 in. (36 em) in a lesser distance. In the resource calculations, the resources were considered to be demonstrated if they are within 0. 75 mi (1.21 km) of an adit, strip mine, or point of measurement, except in cases where the bed is known to be cut out by channel sands or otherwise thinned to less than 14 in. (36 em) in a lesser distance. U.S. Bureau of Mines and U.S. Geological Survey resource calculation standards dictate that coal resources to a distance of 3 mi ( 4.8 km) from points of control be considered inferred resources, but because of the lenticular nature of most beds in these quadrangles we generally did not calculate inferred resources beyond the mapped limit of the bed (about 1 mi or 1.6 km). For a few beds known to be laterally extensive, the inferred resources were calculated for a greater distance, but nowhere more than 3 mi ( 4.8 km) from a point of observation. In the resource tables, coal that occurs in beds greater than 28 in. (71 em) thick is shown separately from coal that occurs in beds 14-28 in. (36-71 em) thick. For beds with one or more partings, the thickness of the coal bed
GEOLOGIC SETTING 5
· is considered to be the total thickness of the coal, exclusive of the partings. In cases where a parting is thicker than the coal benches above or below, the benches are considered to be separate beds.
The resource tables have columns showing coal mined and coal lost in mining prior to 1976. These calculations are relatively simple to make for stripped areas because the area stripped can be seen. Because mine maps are unavailable for a vast majority of the small underground mines, however, it is only possible to estimate how large an area has been worked. In most cases, we assumed that an area within a radius of about 300ft (90 m) of the adit had been mined or lost in mining.
GEOLOGIC SETTING
The report area, a part of the Appalachian Plateau physiographic province, is underlain by nearly horizontal, sparsely faulted Carboniferous rocks that have been intricately dissected by a dendritic drainage system (fig. 1). There is little flat land, except along the bottoms of some of the major streams, and local relief between drainage courses and adjacent ridges ranges from 60 to 120 m in the northwestern part of the area and from 105 to 150 m in the southeastern part. The highest ground elevation above sea level is about 390 m in the southcentral part of the Sitka quadrangle; the lowest point is about 165 m above sea level in the northwest part of the Louisa quadrangle. All of the area drains to the Big Sandy River, which joins the Ohio River about 32 km north of Louisa, Ky. Roughly, the southeast half of the area drains via the Levisa and Tug Forks, which join at Louisa to form the Big Sandy. The remainder of the area drains via tributaries, chiefly Blaine Creek, that join the Big Sandy north of Louisa.
STRATIGRAPHY OF PENNSYLVANIAN ROCKS
All the consolidated rocks that crop out within the report area are assigned to the Pennsylvanian System. The oldest exposed formation is the Lower Pennsylvanian Lee Formation (fig. 2), which is overlain by the Lower and Middle Pennsylvanian Breathitt Formation. The Breathitt Formation of Kentucky is represented in West Virginia by the Kanawha and overlying Allegheny Formations. Above the Breathitt or Allegheny is the Upper Pennsylvanian Conemaugh Formation, which is overlain with undefined contact in this area by the Upper Pennsylvanian Monongahela(?) Formation.
LEE FORMATION
The Lee Formation is present in valley bottoms in three separate outcrop belts in the western part of the report area (fig. 1). Nowhere is its base exposed; the maximum exposed thickness is 45 m near the west
6 COAL GEOLOGY, KENTUCKY AND WEST VIRGINIA
~~ EXPLANATION 0
·.;:::; «< E 0 u.
«< Q) .r:. «< Cl c: 0 c: 0 ~ "'C c: «<
.r:. Cl ::I «< E G) c: 0
0
c: 0
'.;:::; «< E 0 u.
Coal bed or zone of relatively great economic importance
Coal bed or zone of intermediate economic importance
Coal bed or zone of relatively little economic importance
Local coal bed of no economic importance
----- Important stratigraphic marker
Unnamed coal bed r----- Brush Creek Limestone Member of
!"' Conemaugh Formation Brush Creek coal bed
Princess No.9 coal zone (3)
Princess No. 8 coal bed
Princess No. 7 coal bed
Princess No. 6 coal zone (4)
y Van port Limestone Member as used ~---- by Phalen (1912)
Richardson coal zone (5)
Broas coal zone (7)
Peach Orchard coal zone (3)
Hazard coal zone (3) r------+-Haddix coal bed ---= Magoffin Member
Hamlin coal zone (2) ~===1:::Fire Clay rider coal bed
Fire Clay coal bed ~==;;;;;l Little Fire Clay coal bed
Whitesburg coal bed 1---==cJ..-Kendrick Shale of Jillson (1919)
Williamson coal zone (2)
Van Lear coal bed
METERS FEET 200
50 -r-----
100
0
~ C!)
z <( c:r::: Cl <( ::::> d w z ~ CD ~
C!) z <( c:r::: Cl <( ::::> d <( ::..: 1-C/5
~ C!)
z <( c:r::: Cl <( ::::> d
z 0 en Cl c:r::: <( :::I: (..)
cc
w ....J C!)
z <( c:r::: Cl <( ::::> d en ::2: <( Cl <(
~ C!)
z <( c:r::: Cl <( ::::> d <( en s g
FIGURE 2.-Stratigraphic positions and relative economic importance of coal beds in the study area and the stratigraphic intervals represented in each of the quadrangles of the study area. Numbers in parentheses following zone names indicate maximum number of beds in zone. Scale is approximate.
GEOLOGIC SE'ITING 7
edge of the area. The exposed part of the formation consists almost entirely of resistant thick beds of fine- to coarse-grained, locally pebbly, crossbedded sandstone; but a few thin interbeds of sandy siltstone occur. Although lenticular coal beds have been found in the Lee in other areas of Kentucky (Huddle and others, 1963), none occur at the surface in the report area. However, several thin allochthonous coal beds were encountered in the Lee in a core hole drilled by the U.S. Geological Survey in the northeastern part of the Blaine quadrangle (Connor, 1975).
The formation is overlain by the Breathitt Formation with a gradational, probably intertonguing, contact.
BREATHITT FORMATION
The Breathitt Formation, approximately 250m thick (fig. 2), crops out in all parts of the report area except in the northeast corner of the Louisa quadrangle, where it is covered by the overlying Conemaugh and Monongahela(?) Formations. The Breathitt is made up of interbedded sandstone, siltstone, shale, coal, underclay, and limestone, in roughly decreasing order of abundance. Sandstone is relatively more abundant in the upper half of the formation than in the lower half. For convenience's sake the formation is described in six parts.
BASE OF FORMATION TO BASE OF VAN LEAR COAL BED
The thickness of the interval between the base of the Breathitt Formation and the base of the Van Lear coal bed is generally between 45 and 50 m but may range from 37 to 55 m. Silty shale and siltstone are the most abundant constituents of the interval, and sandstone, generally in lenticular bodies, is the next most abundant. The interval also contains as many as three fairly persistent coal beds in the south half of the area, none of which is known to exceed 13 in. (33 em) in thickness at any place in the report area. At least two zones in the middle third of the interval in the Sitka quadrangle contain biscuit-shaped calcareous concretions as much as several meters in diameter.
BASE OF VAN LEAR COAL BED TO BASE OF WHITESBURG COAL BED
The thickness of the interval between the base of the Van Lear coal bed and the base of the Whitesburg coal bed may be as little as about 21 m and as much as about 42 m within the report area but averages between 30 and 35 m. The Van Lear coal bed, one of the most important commercial beds of the area, is very persistent, lacks partings, and is locally as thick as 34 in. (86 em). The Van Lear is commonly overlain by clay shale but is locally overlain by channel sandstone. Most of the
8 COAL GEOLOGY, KENTUCKY AND WEST VIRGINIA
12-28-m-thick (averaging 19-m-thick) interval separating the Van Lear from the next overlying coal zone, the Williamson, is made up of silty shale, siltstone, and sandstone, but locally a thin canneloid coal is present 5 or 6 m above the Van Lear. The Williamson coal may occur as one bed or as two beds separated by as much as a meter of rooted shale. The coal beds are locally absent, presumably owing to nondeposition, and are generally only a few inches thick, but one is locally as much as 36 in. (91 em) thick. The Williamson coal zone is commonly overlain by the Kendrick Shale of Jillson (1919), which, where present, may be as much as 6 m thick. The Kendrick is a dark-gray fissile marine shale that contains fossiliferous limestone concretions. Most of the 8-28-m-thick (averaging 13- to 14-m-thick) interval separating the Williamson coal zone from the Whitesburg coal bed is made up of siltstone, silty shale, and sandstone; a rare thin lenticular coal bed may occur in the interval.
BASE OF WHITESBURG COAL BED TO BASE OF MAGOFFIN MEMBER
The interval between the base of the Whitesburg coal bed and the base of the Magoffin Member generally ranges in thickness from 21 to 35 m and averages about 28 m. Within the interval are five very persistent coal beds or zones. The Whitesburg coal bed at the base, except where locally cut out by overlying channel sandstones, ranges in thickness from a few inches to as much as 42 in. (107 em). The bed is rarely parted and has been mined at many localities. The Whitesburg may be separated from the Little Fire Clay coal bed, next above, by as little as 0.7 m and by as much as 7.5 m, but the separation is generally 2-4m. The rock immediately above the Whitesburg is commonly canneloid shale, but most of the interval up to the Little Fire Clay coal bed is usually silty shale, although sandstone or siltstone may be present. The Little Fire Clay coal bed (included as the upper bed of the Whitesburg coal zone in the Blaine quadrangle), called the Upper Whitesburg bed by Huddle, Lyons, Smith, and Ferm (1963), is nearly everywhere less than 10 in. (25 em) thick but is locally as much as 26 in. (66 em) thick; it lacks partings. The interval between the Little Fire Clay coal bed and the Fire Clay coal bed, next above, is 5-12 m and averages about 9 m; it consists primarily of sandstone and siltstone or silty shale at most localities. The Fire Clay coal bed is generally less than 10 in. (25 em) thick but is locally as much as 34 in. (86 em); it is of moderate economic importance. A flint-clay parting from 1 to 5 em thick is nearly everywhere found in or adjacent to the Fire Clay coal bed. From 0.7 to 6 m and averaging about 2m above the Fire Clay coal bed is the Fire Clay rider coal bed. The Fire Clay rider, which is nearly everywhere distinctively canneloid in its upper part, is generally less than 12 in. (30 em) thick but is locally as thick as 37 in. (94 em). The interval between the Fire Clay rider coal bed and the Hamlin coal zone
GEOLOGIC SETTING 9
may be as little as 3 m or as great as 14m but generally is between 6 and 10m. It is made up of varying proportions of siltstone, silty shale, and sandstone, but a rare thin lenticular coal bed may be present. The Hamlin coal zone is commonly made up of two coal beds, each less than 6 in. (15 em) thick, separated by rooted clay; but in some places only one bed is present. The greatest observed thickness of a bed of the Hamlin zone is 19 in. (48 em). The thickness of the interval between the Hamlin coal zone and the base of the Magoffin Mem her may range from as little as 3m to as much as 13m but is most commonly about 6-7 m. This interval generally is made up of varying proportions of sandstone, siltstone, and silty shale. Locally in the Richardson and Louisa quadrangles, the top of the interval is occupied by the Taylor coal bed, which is everywhere less than 14 in. (36 em) thick.
BASE OF MAGOFFIN MEMBER TO BASE OF PEACH ORCHARD COAL ZONE
The interval between the base of the Magoffin Member and the base of the Peach Orchard coal zone varies greatly in both thickness and lithology. The thickness may be as little as 16m and as great as 64 m, although for the most part it ranges from 21 to 47 m and may average about 27 m. The interval may contain as many as four coal beds, or there may be none. Some variations in lithology are due to nondeposition and some to channel scour and fill.
The Magoffm Member of the Breathitt Formation, which contains marine invertebrate fossils, is apparently absent over extensive areas of the Blaine, Adams, Sitka, and Richardson quadrangles; where present, it varies in lithologic character. It is nowhere more than 6 m thick and is more commonly 1-2 m thick. The Magoffin consists of a bed of resistant, calcareous, fine-grained sandstone as much as 1 m thick, that grades upward into gray, fossiliferous limestone as much as 0.7 m thick. This is overlain by dark-gray, calcareous, sparsely fossiliferous, platy shale. Any or all of these components may be missing locally. The Haddix coal bed lies from 0 to 2 m above the Magoffin Member. The Haddix has been cut out by channel sandstones in many places, but where not cut out, it seems to be persistent. It is thicker than 14 in. (36 em) at many places and is locally as thick as 34 in. (86 em). From 3 to 20m, averaging about 8 m, above the Haddix coal bed lies the Hazard coal bed or zone. The interval between the beds is generally occupied by silty shale but may be occupied by sandstone. In most places the Hazard is one bed, but in the Sitka and Blaine quadrangles an additional one or two beds may occur within a few meters above the top of the principal bed. The Hazard coal bed or the principal bed of the Hazard zone is generally less than 14 in. (36 em) thick but is locally as thick as 51 in. (130 em). The thickness of the interval between the Hazard coal bed or zone and the base of the Peach Orchard coal zone
10 COAL GEOLOGY, KENTUCKY AND WEST VIRGINIA
may be as little as 5 moras great as 32m but is generally in the 6 to 18 m range and probably averages about 12 m. The interval nearly everywhere contains some channel sandstone in addition to silty shale and is commonly dominated by sandstone.
BASE OF PEACH ORCHARD COAL ZONE TO TOP OF RICHARDSON COAL ZONE
The interval from the base of the Peach Orchard coal zone to the top of the Richardson coal zone is 35-75 m thick and averages about 60-65 m thick. This interval contains a considerably higher proportion of sandstone than the underlying part of the Breathitt Formation and contains the thickest coal beds.
The Peach Orchard coal zone, 3-18m thick and averaging about 10m thick, usually contains two or three coal beds that commonly contain partings of carbonaceous shale. Individual coal beds in the zone may be as thick as 84 in. (213 em), exclusive of partings, and nearly everywhere at least one bed of the zone exceeds 14 in. (36 em) in thickness. The coal beds of the zone are generally separated by siltstone or silty shale. From 8 to 29m and averaging 14m above the Peach Orchard coal zone is the Broas coal zone. This interval contains sandstone with some siltstone or silty shale. The Broas coal zone usually contains two coal beds separated by 5-15 m, averaging 9 m, of siltstone and sandstone. The beds of the Broas zone are generally less than 14 in. (36 em) thick, but locally the upper bed is 63 in. (160 em) thick, and the lower bed 24 in. (61 em) thick. The Broas coal zone is separated from the Richardson coal zone, next above, by an interval that may range from 9 to 36m thick and averages about 20-25 m thick, dominantly of sandstone. The Richardson coal zone generally contains about three coal beds within a zone that averages about 10m thick. The lowest bed of the zone is the most persistent, and except where locally missing, is nearly everywhere more than 14 in. (36 em) thick. At one place it is 93 in. (236 em) thick. Upper beds of the zone are generally thinner than 14 in. (36 em), but one is locally 58 in. (147 em) thick.
TOP OF RICHARDSON COAL ZONE TO TOP OF FORMATION
The interval between the top of the Richardson coal zone and the top of the Breathitt Formation, present in its entirety only in the northern tier of quadrangles (fig. 2), ranges in thickness from 33 to 60 m and averages about 50 m, tending to be thicker to the east than to the west. Within the interval is a marine limestone unit, a flint-clay marker bed, and three coal zones any or all of which may be locally cut out by one of the many channel sandstone bodies in the interval.
In parts of the Blaine and Adams quadrangles, the fossiliferous Vanport Limestone Member of Phalen (1912) rests immediately upon or within 1 to 2 m above the top of the Richardson coal zone. The Van port
GEOLOGIC SETTING 11
is probably absent in the other quadrangles because the shallow sea in which it was deposited did not reach that far southeastward. It is cut out over large parts of the Adams and Blaine quadrangles by channel sandstones. Where present, the Vanport, rarely more than 1m thick, is commonly sideritic and limonitic.
The Princess No. 6 coal zone lies between 5 and 35m and averages about 10 m above the Richardson coal zone or Vanport Limestone Member. The interval may be occupied by sandstone or siltstone, and a flint-clay marker bed a few centimeters thick can generally be found within a few meters below the base of the Princess No.6. The Princess No. 6 coal zone was not observed south of the northern tier of quadrangles. In those northern quadrangles, it generally contains three or four coal beds each only a few centimeters thick separated by rooted clay. The greatest observed thickness of any individual bed in the zone is 14 in. (36 em), but the entire zone may be as much as 3m thick. The Princess No. 7 coal bed lies 6-10 m, and averages 8 m, above the Princess No.6 coal zone. The Princess No. 7 is nearly everywhere less than 14 in. (36 em) thick but is locally as much as 36 in. (91 em) thick. Ranging from 8 to 14 m and averaging 11 m above the Princess No. 7 coal bed is the Princess No. 8 coal bed. The Princess No. 8 rarely exceeds 14 in. (36 em) in thickness but locally is 26 in. (66 em) thick. The Princess No.8 bed lies between 12 and 24m and averages about 15m below the top of the Breathitt Formation. The top of the Breathitt is placed at the top of the main (middle) bed of the Princess No.9 coal zone in the few areas where that bed occurs; otherwise, it is placed at the lowest occurrence of the reddish-gray and greenish-gray shales of the Conemaugh Formation.
CONEMAUGH AND MONONGAHELA(?) FORMATIONS
The lower part of the Conemaugh Formation is exposed across the northern part of the Blaine, Adams, and Louisa quadrangles. All of the Conemaugh Formation and the lower part of the Monongahela(?) Formation are exposed only in the extreme northeastern part of the Louisa quadrangle. As in the Louisa quadrangle (Connor and Flores, 1978), we here consider the formation undivided because the Pittsburgh coal bed, defined as the base of the Monongahela Formation, is not present. However, about 110 m above the base of the Conemaugh is an underclay that, in stratigraphic position and appearance, resembles an underclay in the quadrangle to the northwest that Sharps (1967) considered to be a possible lateral equivalent of the Pittsburgh coal bed. Another 25m of rocks are partly exposed above the underclay. Troughcrossbedded sandstone, relatively more abundant and thicker bedded in the upper part of the interval, is the dominant rock type; inspection of hand specimens indicates that it is more feldspathic than sandstones in the Breathitt Formation. Except where carbonaceous, the interven-
12 COAL GEOLOGY, KENTUCKY AND WEST VIRGINIA
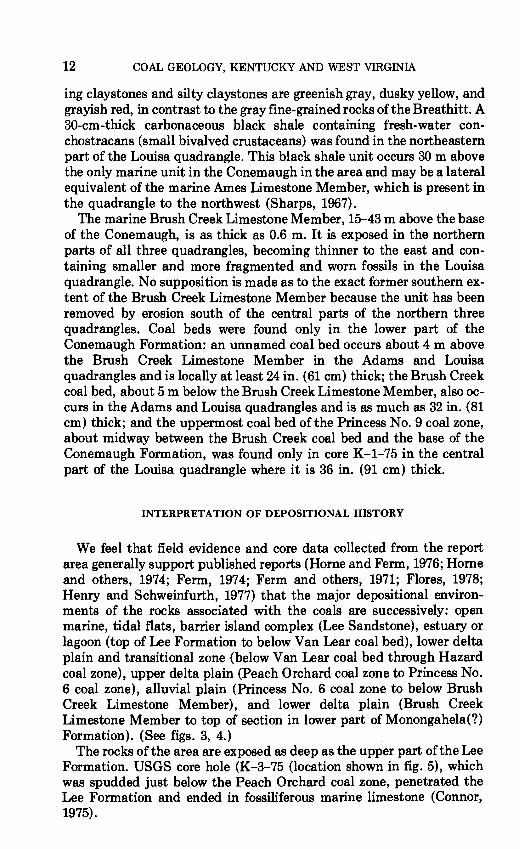
ing claystones and silty claystones are greenish gray, dusky yellow, and grayish red, in contrast to the gray fine-grained rocks of the Breathitt. A 30-cm-thick carbonaceous black shale containing fresh-water conchostracans (small bivalved crustaceans) was found in the northeastern part of the Louisa quadrangle. This black shale unit occurs 30 m above the only marine unit in the Conemaugh in the area and may be a lateral equivalent of the marine Ames Limestone Member, which is present in the quadrangle to the northwest (Sharps, 1967).
The marine Brush Creek Limestone Member, 15-43 m above the base of the Conemaugh, is as thick as 0.6 m. It is exposed in the northern parts of all three quadrangles, becoming thinner to the east and containing smaller and more fragmented and worn fossils in the Louisa quadrangle. No supposition is made as to the exact former southern extent of the Brush Creek Limestone Member because the unit has been removed by erosion south of the central parts of the northern three quadrangles. Coal beds were found only in the lower part of the Conemaugh Formation: an unnamed coal bed occurs about 4 m above the Brush Creek Limestone Member in the Adams and Louisa quadrangles and is locally at least 24 in. (61 em) thick; the Brush Creek coal bed, about 5 m below the Brush Creek Limestone Member, also occurs in the Adams and Louisa quadrangles and is as much as 32 in. (81 em) thick; and the uppermost coal bed of the Princess No.9 coal zone, about midway between the Brush Creek coal bed and the base of the Conemaugh Formation, was found only in core K-1-75 in the central part of the Louisa quadrangle where it is 36 in. (91 em) thick.
INTERPRETATION OF DEPOSITIONAL HISTORY
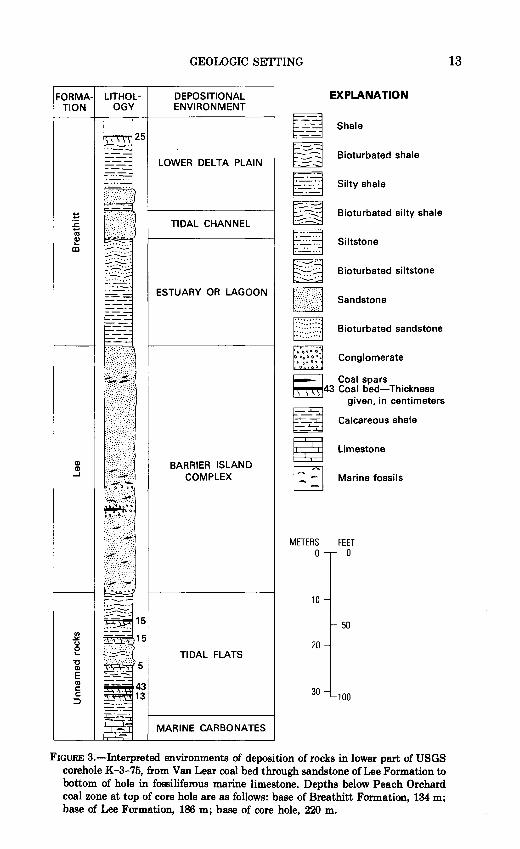
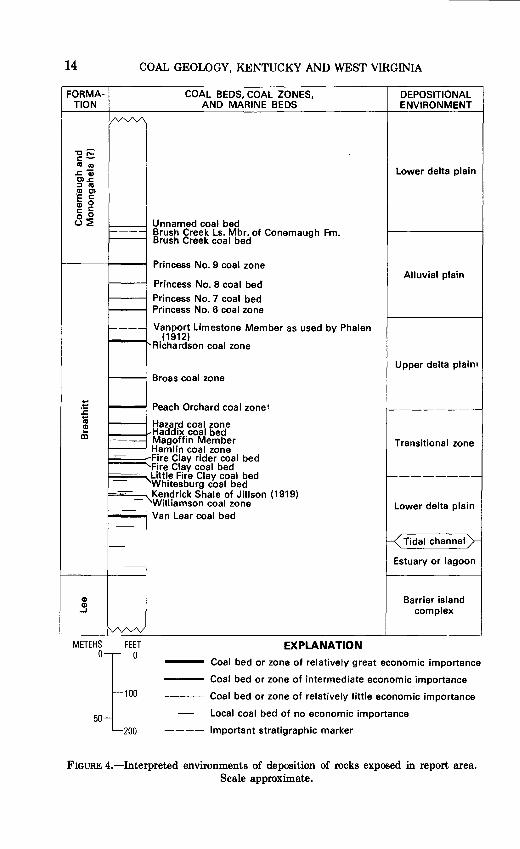
We feel that field evidence and core data collected from the report area generally support published reports (Horne and Ferm, 1976; Home and others, 1974; Ferm, 1974; Ferm and others, 1971; Flores, 1978; Henry and Schweinfurth, 1977) that the major depositional environments of the rocks associated with the coals are successively: open marine, tidal flats, barrier island complex (Lee Sandstone), estuary or lagoon (top of Lee Formation to below Van Lear coal bed), lower delta plain and transitional zone (below Van Lear coal bed through Hazard coal zone), upper delta plain (Peach Orchard coal zone to Princess No. 6 coal zone), alluvial plain (Princess No. 6 coal zone to below Brush Creek Limestone Member), and lower delta plain (Brush Creek Limestone Member to top of section in lower part· of Monongahela(?) Formation). (See figs. 3, 4.)
The rocks of the area are exposed as deep as the upper part of the Lee Formation. USGS core hole (K-3-75 (location shown in fig. 5), which was spudded just below the Peach Orchard coal zone, penetrated the Lee Formation and ended in fossiliferous marine limestone (Connor, 1975).
FORMA- LITHOL-TION OGY
Q) Q)
....J
II) ~ CJ e "'0 Q)
E «< r::: r:::
::J
GEOLOGIC SETI'ING
DEPOSITIONAL ENVIRONMENT
LOWER DELTA PLAIN
TIDAL CHANNEL
ESTUARY OR LAGOON
BARRIER ISLAND COMPLEX
TIDAL FLATS
MARINE CARBONATES
EXPLANATION
~ Shale
(-~ Bioturbated shale
~ Silty shale
~ Bioturbated silty shale
~ Siltstone
~ Bioturbated siltstone
[///:~-W~J Sandstone
[2] Bioturbated sandstone
[Tiill Conglomerate
Fl Coal spars ~43 Coal bed-Thickness
g ~ Ca~::::~. :::~~oters ~ Limestone
I : :I Marine fossils
METERS FEET 0 0
10
50
20
30 100
FIGURE 3.-Interpreted environments of deposition of rocks in lower part of USGS corehole K-3-75, from Van Lear coal bed through sandstone of Lee Formation to bottom of hole in fossiliferous marine limestone. Depths below Peach Orchard coal zone at top of core hole are as follows: base of Breathitt Formation, 134m; base of Lee Formation, 186m; base of core hole, 220m.
13
14 COAL GEOLOGY, KENTUCKY AND WEST VIRGINIA
FORMA-TION
~
-cr:::: c:-cu cu ..r:.Q; C)..t:: :I cu cu C) ·e c: CD 0 t:: t:: 0 0 0~ r--
1-----r--
r--r--r----
1-----
1---
::: ,___ :s cu 1----CD
eli 1---~
-
I:=::==
-
-
--
-
-
CD CD
....I
1\/VvV METERS FEET
0110: 50
200
COAL BEDS, COAL ZONES, DEPOSITIONAL AND MARINE BEDS ENVIRONMENT
Lower delta plain
Unnamed coal bed Brush Creek Ls. Mbr. of Conemaugh Fm. Brush Creek coal bed
Princess No. 9 coal zone
Princess No. 8 coal bed Alluvial plain
Princess No. 7 coal bed Princess No. 6 coal zone
Vanport Limestone Member as used by Phalen (1912)
!'Richardson coal zone
Upper delta plaint Broas coal zone
Peach Orchard coal zonet r---------~azard coal zone
addix coal bed Magoffin Member Transitional zone Hamlin coal zone Fire Clay rider coal bed
r'Fire Clay coal bed Little Fire Clay coal bed r---------
!"Whitesburg coal bed ,~endrick Shale of Jillson (1919)
Williamson coal zone Lower delta plain Van Lear coal bed
K Tidal channel>-
Estuary or lagoon
Barrier island complex
EXPLANATION
Coal bed or zone of relatively great economic importance
Coal bed or zone of intermediate economic importance
Coal bed or zone of relatively little economic importance
Local coal bed of no economic importance
Important stratigraphic marker
FIGURE 4.-Interpreted environments of deposition of rocks exposed in report area. Scale approximate.
GEOLOGIC SE'ITING 15
~r 82°52 '30" 45' 37'30" ,
30' .3
1 J8 • (K-3-75) • 10
5•• 4 • 6.7 (K-2-75) 19 2 • •
20 24 11 • .21 25
1 26 • 12 (K-1-75) 27 ••
8 .13 22•.23 28 • • L.I.J 9
115-14 N (K-4-75)• <(
~ BLAINE 111 ADAMS LOUISA , .34
EXPLANATION • CORE LOCALITY-
K- number indicates USGS core
.35 • SURFACE SAMPLE 38 .36 LOCALITY
39 •• 37 41 ,.
29 • 40 30 • 42 • .31 •• 43 0 2 4 KILOMETERS
32 I I I
37° • 33• SITKA
I I RICHARDSON 0 1 2 MILES
52' 30"
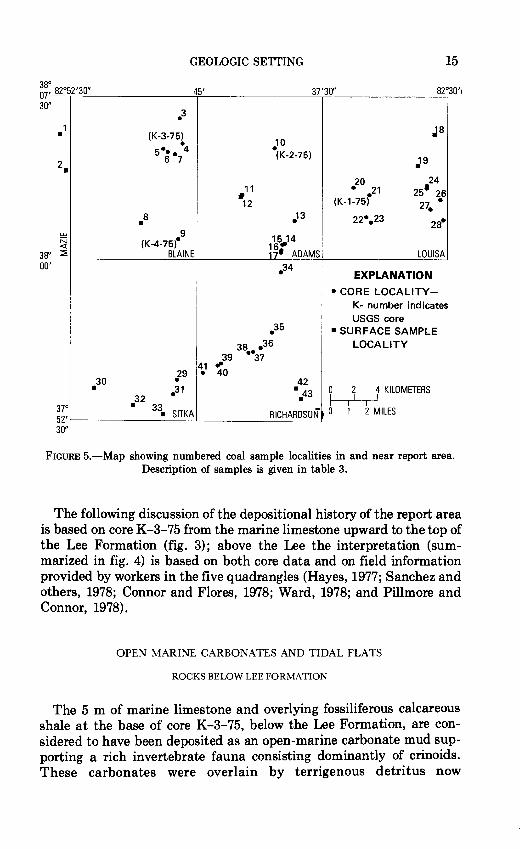
FIGURE 5.-Map showing numbered coal sample localities in and near report area. Description of samples is given in table 3.
The following discussion of the depositional history of the report area is based on core K -3-75 from the marine limestone upward to the top of the Lee Formation (fig. 3); above the Lee the interpretation (summarized in fig. 4) is based on both core data and on field information provided by workers in the five quadrangles (Hayes, 1977; Sanchez and others, 1978; Connor and Flores, 1978; Ward, 1978; and Pillmore and Connor, 1978).
OPEN MARINE CARBONATES AND TIDAL FLATS
ROCKS BELOW LEE FORMATION
The 5 m of marine limestone and overlying fossiliferous calcareous shale at the base of core K-3-75, below the Lee Formation, are considered to have been deposited as an open-marine carbonate mud supporting a rich invertebrate fauna consisting dominantly of crinoids. These carbonates were overlain by terrigenous detritus now
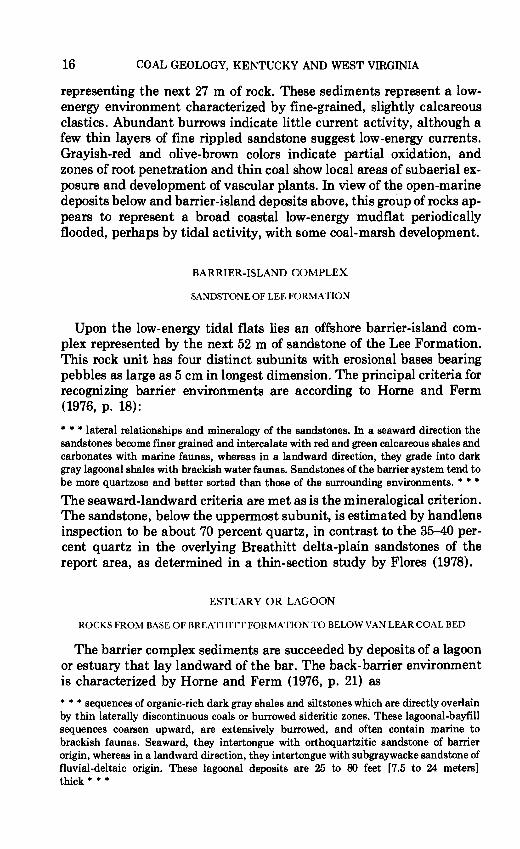
16 COAL GEOLOGY, KENTUCKY AND WEST VIRGINIA
representing the next 27 m of rock. These sediments represent a lowenergy environment characterized by fine-grained, slightly calcareous clastics. Abundant burrows indicate little current activity, although a few thin layers of fine rippled sandstone suggest low-energy currents. Grayish-red and olive-brown colors indicate partial oxidation, and zones of root penetration and thin coal show local areas of subaerial exposure and development of vascular plants. In view of the open-marine deposits below and barrier-island deposits above, this group of rocks appears to represent a broad coastal low-energy ·mudflat periodically flooded, perhaps by tidal activity, with some coal-marsh development.
BARRIER-ISLAND COMPLEX
SANDSTONE OF LEE FORMATION
Upon the low-energy tidal flats lies an offshore barrier-island complex represented by the next 52 m of sandstone of the Lee Formation. This rock unit has four distinct subunits with erosional bases bearing pebbles as large as 5 em in longest dimension. The principal criteria for recognizing barrier environments are according to Home and Ferm (1976, p. 18):
* * *lateral relationships and mineralogy of the sandstones. In a seaward direction the sandstones become finer grained and intercalate with red and green calcareous shales and carbonates with marine faunas, whereas in a landward direction, they grade into dark gray lagoonal shales with brackish water faunas. Sandstones of the barrier system tend to be more quartzose and better sorted than those of the surrounding environments. * * *
The seaward-landward criteria are met as is the mineralogical criterion. The sandstone, below the uppermost subunit, is estimated by handlens inspection to be about 70 percent quartz, in contrast to the 35-40 percent quartz in the overlying Breathitt delta-plain sandstones of the report area, as determined in a thin-section study by Flores (1978).
ESTUARY OR LAGOON
ROCKS FROM BASE OF BREATHITT FORMATION TO BELOW VAN LEAR COAL BED
The barrier complex sediments are succeeded by deposits of a lagoon or estuary that lay landward of the bar. The back-barrier environment is characterized by Horne and Ferm (1976, p. 21) as
* * * sequences of organic-rich dark gray shales and siltstones which are directly overlain by thin laterally discontinuous coals or burrowed sideritic zones. These lagoonal-bayfill sequences coarsen upward, are extensively burrowed, and often contain marine to brackish faunas. Seaward, they intertongue with orthoquartzitic sandstone of barrier origin, whereas in a landward direction, they intertongue with subgraywacke sandstone of fluvial-deltaic origin. These lagoonal deposits are 25 to 80 feet [7.5 to 24 meters] thick* * *
GEOLOGIC SETTING 17
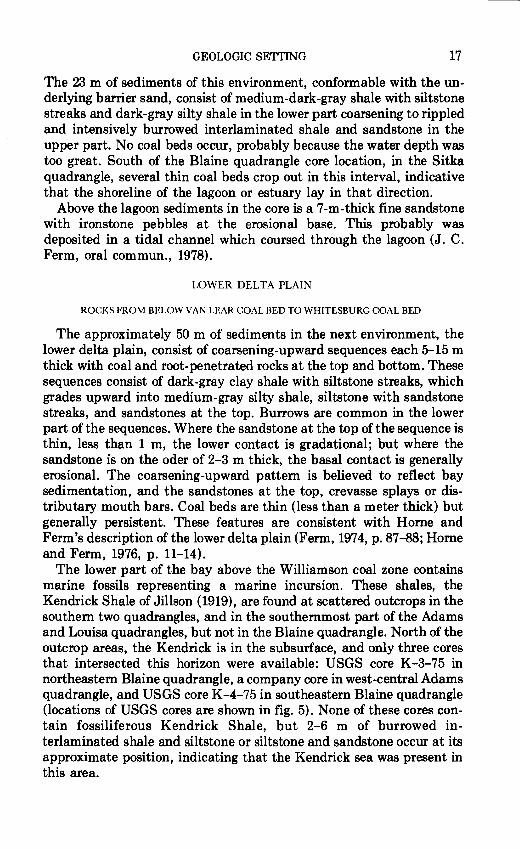
The 23 m of sediments of this environment, conformable with the underlying barrier sand, consist of medium-dark-gray shale with siltstone streaks and dark-gray silty shale in the lower part coarsening to rippled and intensively burrowed interlaminated shale and sandstone in the upper part. No coal beds occur, probably because the water depth was too great. South of the Blaine quadrangle core location, in the Sitka quadrangle, several thin coal beds crop out in this interval, indicative that the shoreline of the lagoon or estuary lay in that direction.
Above the lagoon sediments in the core is a 7-m-thick fine sandstone with ironstone pebbles at the erosional base. This probably was deposited in a tidal channel which coursed through the lagoon (J. C. Ferm, oral commun., 1978).
LOWER DELTA PLAIN
ROCKS FROM BELOW VAN LEAR COAL BED TO WHITESBURG COAL BED
The approximately 50 m of sediments in the next environment, the lower delta plain, consist of coarsening-upward sequences each 5-15 m thick with coal and root-penetrated rocks at the top and bottom. These sequences consist of dark-gray clay shale with siltstone streaks, which grades upward into medium-gray silty shale, siltstone with sandstone streaks, and sandstones at the top. Burrows are common in the lower part of the sequences. Where the sandstone at the top of the sequence is thin, less than 1 m, the lower contact is gradational; but where the sandstone is on the oder of 2-3 m thick, the basal contact is generally erosional. The coarsening-upward pattern is believed to reflect bay sedimentation, and the sandstones at the top, crevasse splays or distributary mouth bars. Coal beds are thin (less than a meter thick) but generally persistent. These features are consistent with Home and Ferm's description of the lower delta plain (Ferm, 1974, p. 87-88; Home and Ferm, 1976, p. 11-14).
The lower part of the bay above the Williamson coal zone contains marine fossils representing a marine incursion. These shales, the Kendrick Shale of Jillson (1919), are found at scattered outcrops in the southern two quadrangles, and in the southernmost part of the Adams and Louisa quadrangles, but not in the Blaine quadrangle. North of the outcrop areas, the Kendrick is in the subsurface, and only three cores that intersected this horizon were available: USGS core K-3-75 in northeastern Blaine quadrangle, a company core in west-central Adams quadrangle, and USGS core K-4-75 in southeastern Blaine quadrangle (locations of USGS cores are shown in fig. 5). None of these cores contain fossiliferous Kendrick Shale, but 2-6 m of burrowed interlaminated shale and siltstone or siltstone and sandstone occur at its approximate position, indicating that the Kendrick sea was present in this area.
18 COAL GEOLOGY, KENTUCKY AND WEST VIRGINIA
TRANSITIONAL ZONE
ROCKS FROM WHITESBURG COAL BED
TO BASE OF PEACH ORCHARD COAL ZONE
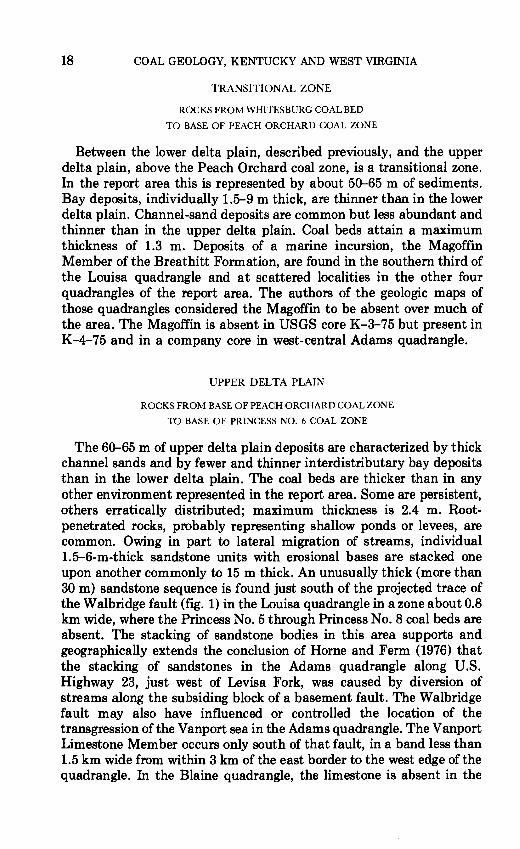
Between the lower delta plain, described previously, and the upper delta plain, above the Peach Orchard coal zone, is a transitional zone. In the report area this is represented by about 50-65 m of sediments. Bay deposits, individually 1.5-9 m thick, are thinner than in the lower delta plain. Channel-sand deposits are common but less abundant and thinner than in the upper delta plain. Coal beds attain a maximum thickness of 1.3 m. Deposits of a marine incursion, the Magoffin Member of the Breathitt Formation, are found in the southern third of the Louisa quadrangle and at scattered localities in the other four quadrangles of the report area. The authors of the geologic maps of those quadrangles considered the Magoffin to be absent over much of the area. The Magoffin is absent in USGS core K-3-75 but present in K-4-75 and in a company core in west-central Adams quadrangle.
UPPER DELTA PLAIN
ROCKS FROM BASE OF PEACH ORCHARD COAL ZONE
TO BASE OF PRINCESS NO. 6 COAL ZONE
The 60-65 m of upper delta plain deposits are characterized by thick channel sands and by fewer and thinner interdistributary bay deposits than in the lower delta plain. The coal beds are thicker than in any other environment represented in the report area. Some are persistent, others erratically distributed; maximum thickness is 2.4 m. Rootpenetrated rocks, probably representing shallow ponds or levees, are common. Owing in part to lateral migration of streams, individual 1.5-6-m-thick sandstone units with erosional bases are stacked one upon another commonly to 15m thick. An unusually thick (more than 30m) sandstone sequence is found just south of the projected trace of the Walbridge fault (fig. 1) in the Louisa quadrangle in a zone about 0.8 km wide, where the Princess No. 5 through Princess No. 8 coal beds are absent. The stacking of sandstone bodies in this area supports and geographically extends the conclusion of Horne and Ferm (1976) that the stacking of sandstones in the Adams quadrangle along U.S. Highway 23, just west of Levisa Fork, wa.s caused by diversion of streams along the subsiding block of a basement fault. The Walbridge fault may also have influenced or controlled the location of the transgression of the Vanport sea in the Adams quadrangle. The V anport Limestone Member occurs only south of that fault, in a band less than 1.5 km wide from within 3 km of the east border to the west edge of the quadrangle. In the Blaine quadrangle, the limestone is absent in the
GEOLOGIC SETTING 19
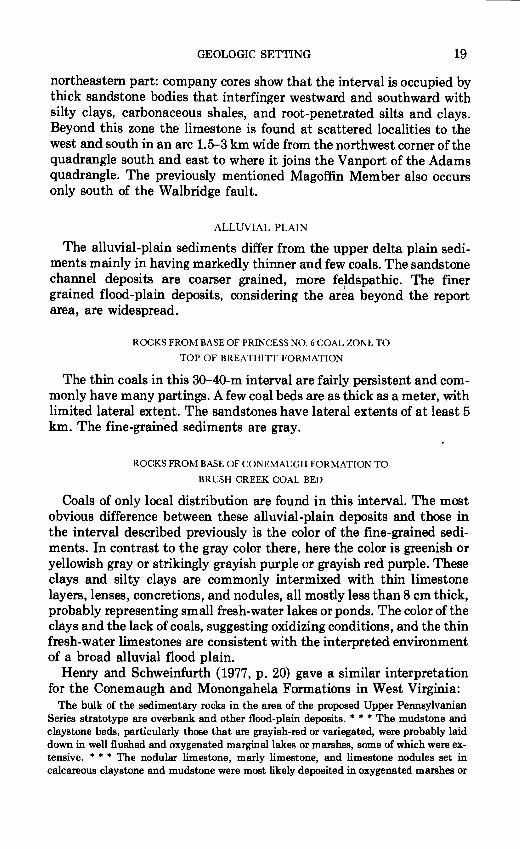
northeastern part: company cores show that the interval is occupied by thick sandstone bodies that interfinger westward and southward with silty clays, carbonaceous shales, and root-penetrated silts and clays. Beyond this zone the limestone is found at scattered localities to the west and south in an arc 1.5-3 km wide from the northwest corner of the quadrangle south and east to where it joins the Vanport of the Adams quadrangle. The previously mentioned Magoffin Member also occurs only south of the Walbridge fault.
ALL UVIAL PLAIN
The alluvial-plain sediments differ from the upper delta plain sediments mainly in having markedly thinner and few coals. The sandstone channel deposits are coarser grained, more feldspathic. The finer grained flood-plain deposits, considering the area beyond the report area, are widespread.
ROCKS FROM BASE OF PRINCESS NO. 6 COAL ZONE TO
TOP OF BREATHITT FORMATION
The thin coals in this 30-40-m interval are fairly persistent and commonly have many partings. A few coal beds are as thick as a meter, with limited lateral extent. The sandstones have lateral extents of at least 5 km. The fine-grained sediments are gray.
ROCKS FROM BASE OF CONEMAUGH FORMATION TO
BRUSH CREEK COAL BED
Coals of only local distribution are found in this interval. The most obvious difference between these alluvial-plain deposits and those in the interval described previously is the color of the fine-grained sediments. In contrast to the gray color there, here the color is greenish or yellowish gray or strikingly grayish purple or grayish red purple. These clays and silty clays are commonly intermixed with thin limestone layers, lenses, concretions, and nodules, all mostly less than 8 em thick, probably representing small fresh-water lakes or ponds. The color of the clays and the lack of coals, suggesting oxidizing conditions, and the thin fresh-water limestones are consistent with the interpreted environment of a broad alluvial flood plain.
Henry and Schweinfurth (1977, p. 20) gave a similar interpretation for the Conemaugh and Monongahela Formations in West Virginia:
The bulk of the sedimentary rocks in the area of the proposed Upper Pennsylvanian Series stratotype are overbank and other flood-plain deposits. * **The mudstone and claystone beds, particularly those that are grayish-red or variegated, were probably laid down in well flushed and oxygenated marginal lakes or marshes, some of which were extensive. * * * The nodular limestone, marly limestone, and limestone nodules set in calcareous claystone and mudstone were most likely deposited in oxygenated marshes or
20 COAL GEOLOGY, KENTUCKY AND WEST VIRGINIA
lakes. * * * The thin, discontinuous coal beds, carbonaceous shale, and carbonaceous claystone were deposited in stagnant, swampy depressions and marshes between and adjacent to the main stream channels.
LOWER DELTA PLAIN
ROCKS FROM BRUSH CREEK LIMESTONE MEMBER
TO TOP OF EXPOSED SECTION IN MONONGAHELA(?) FORMATION
A marine transgression resulted in deposition of the Brush Creek Limestone Member of the Conemaugh Formation, which is found in the extreme northeastern part of the Blaine quadrangle, in the northern part of the Adams quadrangle from the northwest comer to about the middle on the east, and in the north half of the Louisa quadrangle. Limestone with large whole fossils (pelecypods, brachiopods, crinoid stems) is found only in the north-central part of the Adams quadrangle. To the west, south, and east, shells are progressively smaller, more broken and worn, and crinoid stem segments are typically disarticulated. These features indicate a high-energy coastal zone. Though the southern~ limit of Brush Creek marine conditions cannot be observed, owing to erosion, it is clear that the shoreline of the sea was not far to the south. A few meters above the limestone is a coal bed, probably a brackish-water swamp deposit. About 30 m above the Brush Creek Limestone Member is carbonaceous black shale, 30 em thick, replete with conchostracans, small bivalved brackish- or fresh-water crustaceans. This unit may be a lateral equivalent of the Ames sea, which did not reach this far south: the nearest outcrop of its deposits is about 18 km to the northwest, in the Fallsburg-Prichard quadrangle (Sharps, 1967).
Above the marine and brackish-water beds are 100m of lower delta plain deposits. The fine-grained deposits are similar to those of the alluvial plain. The sandstones are as thick as 9 m, have erosional bases, and are noticeably feldspathic, even without viewing with a handlens. Only a few thin carbonaceous shales or coaly shales are found. This part of the section is exposed only in the northeast comer of the Louisa quadrangle.
GEOLOGIC STRUCTURE
Inasmuch as the area is part of the Appalachian Plateau, the rock units are generally nearly horizontal and undisturbed by faulting. The single mapped fault in the area, the Walbridge fault, trends eastnortheast for about 18 km from the southwestern part of the Blaine quadrangle to the east-central part of the Adams quadrangle (fig. 1).
COAL BEDS OR ZONES 21
This fault, which apparently dies out at both ends, is relatively downdropped on its south side a maximum of several tens of meters. The fault lies precisely along the trend of the north-dipping Walbridge monoclinal flexure, along which dips average 5°-10° and are locally much greater. To the south and north of the fault and monocline are several gently dipping and very gently east plunging anticlines and synclines. As a result of these structural features, the structurally highest part of the area, in which the oldest rocks are exposed, is in the northwestern part of the Sitka quadrangle, and the structurally lowest part of the area, in which the youngest rocks are exposed, is in the northeastern part of the Louisa quadrangle (figs. 1, 2).
COAL BEDS OR ZONES
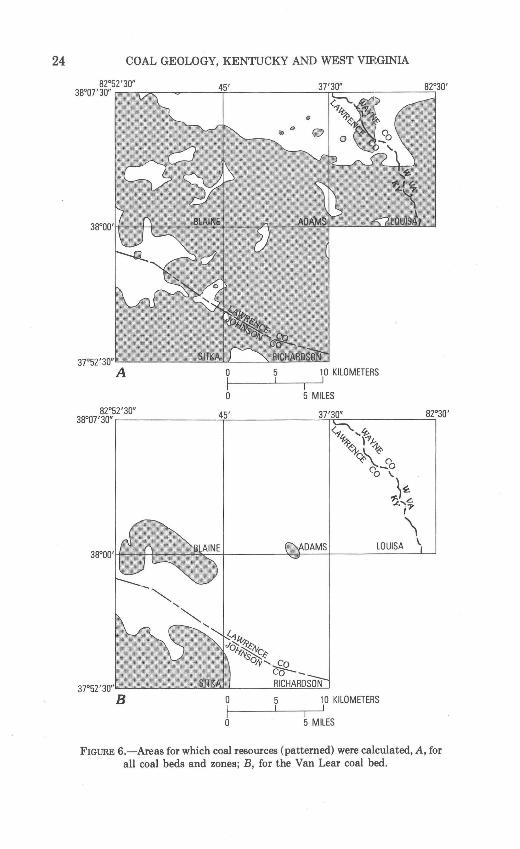
Resource figures were calculated for 18 coal beds or zones in the report area (table 1). Three of these, the Van Lear coal bed and the Peach Orchard and Richardson coal zones, together contain more resources and have produced more coal in the past than the other 15 beds or zones combined. Seven other coal beds or zones of local importance contain most of the remaining resources; listed from stratigraphically lowest to highest, they are the Whitesburg bed, Fire Clay bed, Fire Clay rider bed, Haddix bed, Hazard zone, Broas zone, and Princess No. 9 zone. The eight remaining coal beds or zones together contain only about 2 percent of the resources. All the 18 coal beds or zones and one additional uncommercial coal bed are described briefly herein in ascending stratigraphic order. (See fig. 2 for depiction of their position.) The total calculated resources of all beds and zones in each quadrangle and county are given in table 2. Figure 6A shows the areas for which resources were calculated.
Because only unweathered coal samples can yield meaningful analytical results, no outcrop samples were collected. Samples were collected where available from working strip mines and cores. Sample descriptions are given in table 3 and sample localities are shown in figure 5. A summary of U.S. Geological Survey chemical analyses is given in table 4; bed-by-bed summaries of U.S. Bureau of Mines analyses and U.S. Geological Survey chemical analyses are given in tables 5 and 6; and analyses for 53 samples are given in table 27 near the end of this report.
In the sections following, general comments on heat of combustion (as calculated on a moist, mineral-matter-free basis), ash, and sulfur are made for each coal bed. Elements other than sulfur are mentioned only if their abundance is considered unusual-at least three times greater than or as little as one-third the average of all the coal beds.
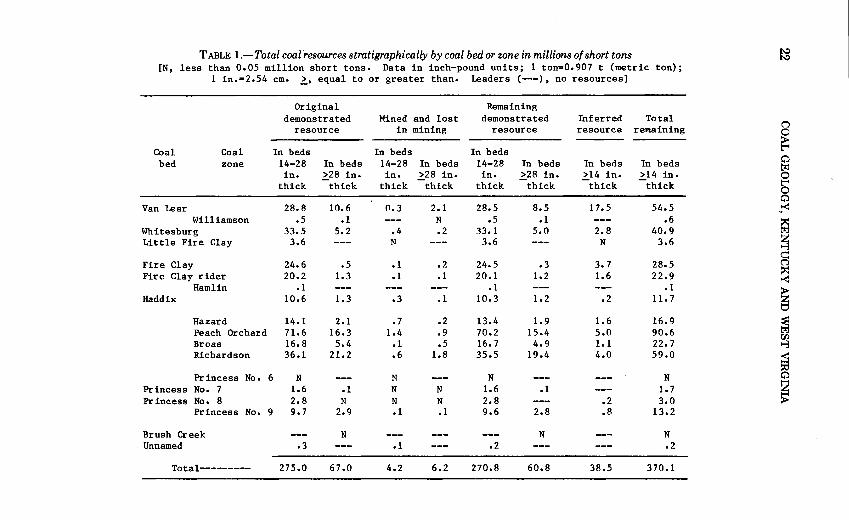
TABLE 1.-Total coal resources stratigraphically by coal bed or zone in millions of short tons [N, less than 0.05 million short tons. Data in inch-pound units; 1 ton=0.907 t (metric ton);
1 in.=2.54 em. ~.equal to or greater than. Leaders (---),no resources]
Coal Coal bed zone
Van Lear Williamson
Whitesburg Little Fire Clay
Fire Clay Fire Clay rider
Hamlin Haddix
Hazard Peach Orchard Broas Richardson
Princess No. 6 Princess No. 7 Princess No. 8
Princess No. 9
Brush Creek Unnamed
Total---------
Original demonstrated
resource
In beds 14-28 in.
thick
28.8 .5
33.5 3.6
24.6 20.2
.1 10.6
14.1 71.6 16.8 36.1
N 1.6 2.8 9.7
.3
275.0
In beds ~28 in.
thick
10.6 .1
5.2
.5 1.3
1.3
2.1 16.3 5.4
21.2
.1 N
2.9
N
67.0
Mined and lost in mining
In beds 14-28 In beds in. >28 in.
thick -thick
0.3 2.1 N
.4 • 2 N
.1 .2
.1 .1
.3 .1
.7 .2 1.4 .9
.1 • 5
.6 1.8
N N N N N .1 .1
.1
4.2 6.2
Remaining demonstrated
resource
In beds 14-28 in.
thick
28.5 .5
33.1 3.6
24.5 20.1
.1 10.3
13.4 70.2 16.7 35.5
N 1.6 2.8 9.6
.2
270.8
In beds ~28 in.
thick
8.5 .1
5.0
.3 1.2
1.2
1.9 15.4 4.9
19.4
.1
2.8
N
60.8
Inferred resource
In beds ~14 in.
thick
17.5
2.8 N
3.7 1.6
.2
1.6 5.0 1.1 4.0
.2
.8
38.5
Total remaining
In beds >14 in. -thick
54.5 .6
40.9 3.6
28.5 22.9
.1 11.7
16.9 90.6 22.7 59.0
N 1.7 3.0
13.2
N .2
370.1
~
0 0 > t"'l 0 tzj 0 s 0 ~-<
@ ~ ?5 ~ -<
~ ~ 00 ~
~ ~
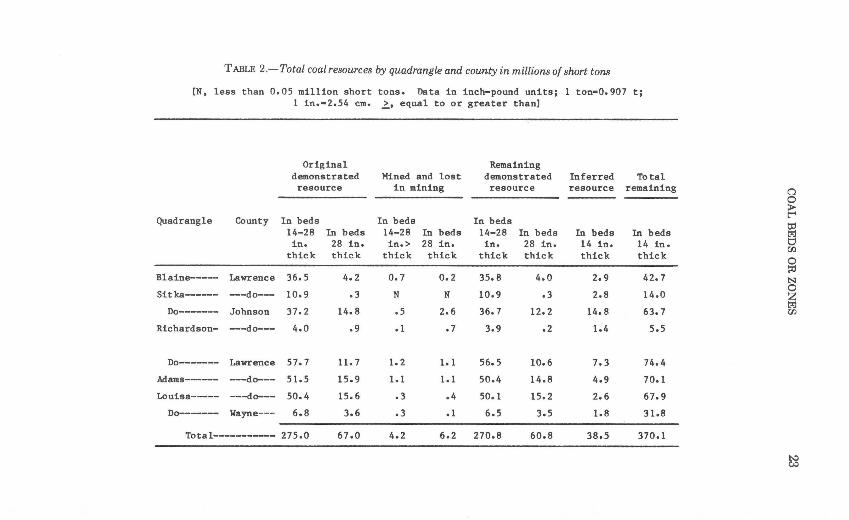
TABLE 2.-Total coal resources by quadrangle and county in millions of short tons
(N, less than 0.05 million short tons. Data in inch-pound units; 1 tona0.907 t; 1 in.a2.54 em. ~' equal to or greater than]
Original Remaining demonstrated Mined and lost demonstrated Inferred Total resource in mining resource resource remaining
Quadrangle County In beds In beds In beds 14-28 In beds 14-28 In beds 14-28 In beds In beds In beds in. 28 in. in.> 28 in. in. 28 in. 14 in. 14 in.
thick thick thick thick thick thick thick thick
Blaine----- Lawrence 36.5 4.2 0.7 0.2 35.8 4.0 2.9 42.7
Sitka------ ---do--- 10.9 .3 N N 10.9 .3 2.8 14.0
Do------- Johnson 37.2 14.8 .5 2.6 36.7 12.2 14.8 63.7
Richardson- ---do--- 4.0 .9 .1 .7 3.9 .2 1.4 5.5
Do------- Lawrence 57.7 11.7 1.2 1. 1 56.5 10.6 7.3 74.4
Adams------ ---do--- 51.5 15.9 1.1 1.1 50.4 14.8 4.9 70.1
Louisa----- ---do--- 50.4 15.6 .3 .4 50.1 15.2 2.6 67.9
Do------- Wayne--- 6.8 3.6 .3 .1 6.5 3.5 1.8 31.8
Total----------- 275.0 67.0 4.2 6.2 270.8 60.8 38.5 370.1
0 0 > t'"'4 t:P t.:zj t:l 00
0 !:0 N 0 z t.:zj 00
t-.:) ~
24 COAL GEOLOGY, KENTUCKY AND WEST VIRGINIA
0 5 10 KILOMETERS
5 MILES
LOUISA
3J052'30" B 0 10 KILOMETERS
0 5 MILES
FIGURE 6.-Areas for which coal resources (patterned) were calculated, A, for all coal beds and zones; B, for the Van Lear coal bed.
COAL BEDS OR ZONES 25
UNNAMED COAL BED BELOW THE SANDSTONE OF THE LEE FORMATION
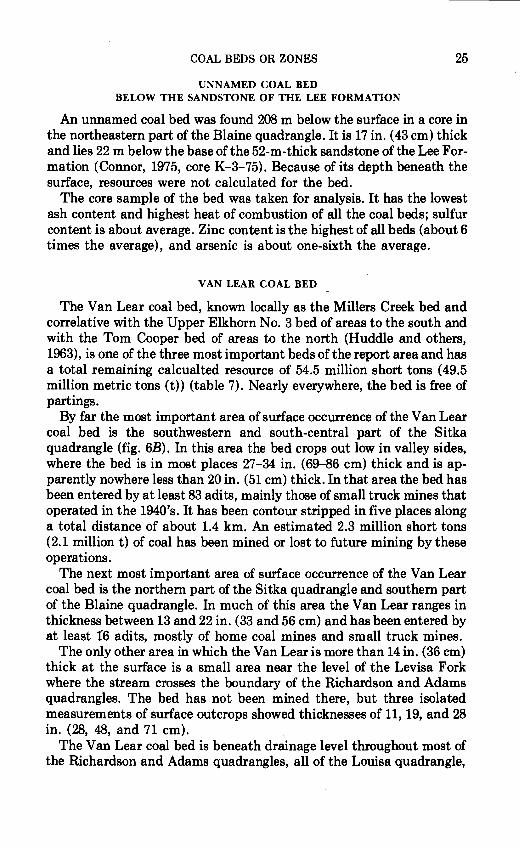
An unnamed coal bed was found 208 m below the surface in a core in the northeastern part of the Blaine quadrangle. It is 17 in. ( 43 em) thick and lies 22 m below the base of the 52-m -thick sandstone of the Lee Formation (Connor, 1975, core K-3-75). Because of its depth beneath the surface, resources were not calculated for the bed.
The core sample of the bed was taken for analysis. It has the lowest ash content and highest heat of combustion of all the coal beds; sulfur content is about average. Zinc content is the highest of all beds (about 6 times the average), and arsenic is about one-sixth the average.
VAN LEAR COAL BED
The Van Lear coal bed, known locally as the Millers Creek bed and correlative with the Upper Elkhorn No.3 bed of areas to the south and with the Tom Cooper bed of areas to the north (Huddle and others, 1963), is one of the three most important beds of the report area and has a total remaining calcualted resource of 54.5 million short tons (49.5 million metric tons (t)) (table 7). Nearly everywhere, the bed is free of partings.
By far the most important area of surface occurrence of the Van Lear coal bed is the southwestern and south-central part of the Sitka quadrangle (fig. 6B). In this area the bed crops out low in valley sides, where the bed is in most places 27-34 in. (69-86 em) thick and is apparently nowhere less than 20 in. (51 em) thick. In that area the bed has been entered by at least 83 adits, mainly those of small truck mines that operated in the 1940's. It has been contour stripped in five places along a total distance of about 1.4 km. An estimated 2.3 million short tons (2.1 million t) of coal has been mined or lost to future mining by these operations.
The next most important area of surface occurrence of the Van Lear coal bed is the northern part of the Sitka quadrangle and southern part of the Blaine quadrangle. In much of this area the Van Lear ranges in thickness between 13 and 22 in. (33 and 56 em) and has been entered by at least 16 adits, mostly of home coal mines and small truck mines.
The only other area in which the Van Lear is more than 14 in. (36 em) thick at the surface is a small area near the level of the Levisa Fork where the stream crosses the boundary of the Richardson and Adams quadrangles. The bed has not been mined there, but three isolated measurements of surface outcrops showed thicknesses of 11, 19, and 28 in. (28, 48, and 71 em).
The Van Lear coal bed is beneath drainage level throughout most of the Richardson and Adams quadrangles, all of the Louisa quadrangle,
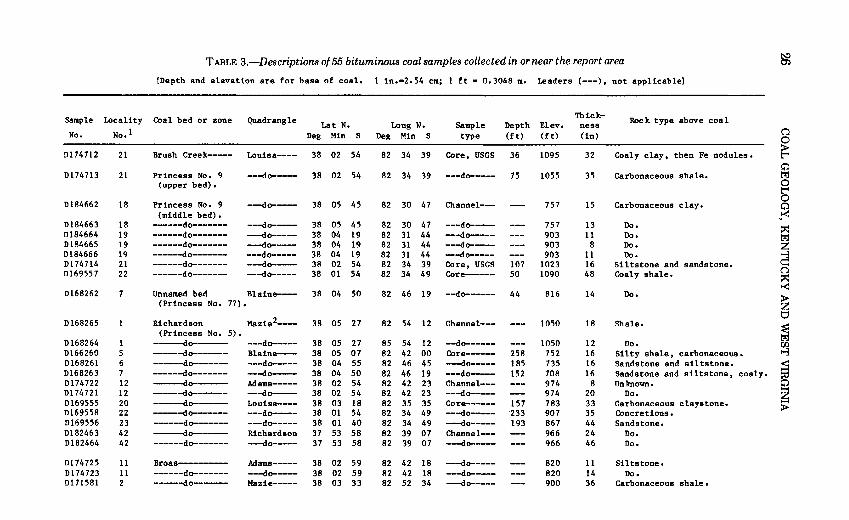
TABLE 3.-Descriptions of 55 bitumioous coal samples collected in or near the report area 1:...:> 0')
[Depth and elevation are for base of coal. 1 in.•2.54 em; 1 ft • 0.3048 m. Leaders (---), not applicable]
Sample Locality Coal bed or zone Quadrangle Thick- Rock type above coa 1 Lat N. Long w. Sample Depth Elev. ness No. No.1 Deg Min s Deg Min s type (ft) (ft) (in) 0
0 Dl74712 21 Brush Creek----- Louisa---- 38 02 54 82 34 39 Core, USGS 36 1095 32 Coaly clay, then Fe nodules. >
~
0 Dl74713 21 Princess No. 9 ---do----- 38 02 54 82 34 39 ---do----- 75 1055 35 Carbonaceous shale. t:rj
(upper bed). 0 ~
Dl84662 18 Princess No. 9 38 05 45 82 30 47 0
--do----- Channel--- --- 757 15 Carbonaceous clay. ~ (middle bed).
Dl84663 18 ------do------- ---do----- 38 05 45 82 30 47 ---do----- --- 757 13 Do. ~ Dl84664 19 ------do------- ---do----- 38 04 19 82 31 44 ---do----- --- 903 11 no. t:rj
Dl84665 19 ------do------- ---do----- 38 04 19 82 31 44 ---do----- --- 903 8 Do. z D184666 19 ------do------- ---do----- 38 04 19 82 31 44 ---do----- --- 903 11 Do. ~ D174714 21 ------do------- ---do----- 38 02 54 82 34 39 Core, USGS 107 1023 16 Siltstone and sandstone. Dl69557 22 ------do------- ---do----- 38 01 54 82 34 49 Core------ 50 1090 48 Coaly shale. 0
~ ....:::
D168262 7 Unnamed bed Blaine---- 38 04 50 82 46 19 --do------ 44 816 14 Do.
~ (Princess No. 7?).
Mazie2----t:l
Dl68265 1 Richardson 38 05 27 82 54 12 Channel--- --- 1050 18 Shale.
~ (Princess No. 5). D168264 1 ------do------- ---do----- 38 05 27 85 54 12 --do------ --- 1050 12 Do. 00 D166260 5 ------do------- Blaine---- 38 05 07 82 42 00 Core------ 258 752 16 Silty shale, carbonaceous. ~ D168261 6 ------do------- ---do----- 38 04 55 82 46 45 --do----- 185 735 16 Sandstone and siltstone. ~ D168263 7 ------do------- ---do----- 38 04 50 82 46 19 ---do----- 152 708 16 Sandstone and siltstone, coaly. :;:o Dl74722 12 ------do------- Adams----- 38 02 54 82 42 23 Channel--- --- 974 8 Unknown. 0 Dl74721 12 ------do------- ---do----- 38 02 54 82 42 23 ---do----- 974 20 Do. ----
~ D169555 20 ------do------- Louisa---- 38 03 18 82 35 35 Core------ 157 783 33 Carbonaceous claystone. Dl69558 22 ------do------- ---do----- 38 01 54 82 34 49 ---do----- 233 907 35 Concretions. D169556 23 -----do------- ---do----- 38 01 40 82 34 49 ---do----- 193 867 44 Sandstone. D182463 42 ------do------- Richardson 37 53 58 82 39 07 Channel--- --- 966 24 Do. D182464 42 ------do------- ---do----- 37 53 58 82 39 07 ---do----- --- 966 46 Do.
D174725 11 Broas---------- Adams----- 38 02 59 82 42 18 ---do----- --- 820 11 Siltstone. Dl74723 11 ------do------- ---do---- 38 02 59 82 42 18 ---do----- --- 820 14 Do. Dl71581 2 ------do------- Mazie----- 38 03 33 82 52 34 ---do----- --- 900 36 Carbonaceous shale.

Dl68259 3 Peach Orchard-- Blaine---- 38 06 29 82 46 02 Core----- 321 654 8 Silty clay. Dl82462 43 ------do------- Richardson 37 53 31 82 38 46 Channel--- --- 849 25 Shale.
Dl74719 9 Hazard--------- Blaine---- 38 00 56 82 46 23 Core. USGS 50 1000 20 Siltstone and sandstone.
Dl74715 4 Haddix--------- ---do----- 38 05 17 82 45 53 --do----- 107 513 13 Shale. Fe streaks. Dl68087 33 ------do------- Sitka----- 37 52 30 82 45 00 Run of mine --- 840 --- Silty shale.
(auger).
Dl71600 13 Fire Clay rider Adams----- 38 01 43 82 39 07 Core----- 33 688 6 Shale. Dl71599 14 ------do------- ---do----- 38 00 42 82 39 45 ---do----- 130+ 718 7 Sandstone. Dl71598 15 ------do------- ---do----- 38 00 40 82 39 53 ---do----- 70 728 9 Do. Dl71591 16 ------do------- ---do----- 38 00 22 82 39 56 ---do----- 62 736 10 Do. Dl71597 17 ------do------- ---do----- 38 00 20 82 39 55 ---do----- 34 734 10 Do. D171596 34 ------do------- Richardson 37 59 20 82 39 55 ---do----- 64 723 18 Carbonaceous shale. D171595 35 ------do------- ---do----- 37 56 35 82 40 30 ---do----- 32 588 17 Sandstone. D171594 39 ------do------- ---do----- 37 55 05 82 43 35 ---do----- 28 683 22 Do. 0 D171593 40 ------do------- ---do----- 37 55 00 82 43 45 ---do----- 74 682 26 Do. ~ D171592 29 ------do------- Sitka----- 37 54 25 82 46 10 ---do----- 26 798 6 Shale. t""
D171590 16 Little Fire Clay Adams----- 38 00 22 82 39 56 --do----- 103 695 7 Carbonaceous shale. txl
D171589 36 ------do------- Richardson 37 55 50 82 41 10 ---do----- 24 580 18 Unknown. ~ D171588 37 ------do------- ---do----- 37 55 40 82 41 40 ---do----- 16 626 12 Carbonaceous shale. 00
D171587 38 ------do------- ---do----- 37 55 35 82 41 55 ---do----- 22 640 8 Do. 0 D171586 41 ------do------- ---do----- 37 54 45 82 44 40 ---do---- 35 688 18 Shale. ~ D171585 31 ------do------- Sitka----- 37 53 45 82 46 25 ---do----- 33 771 7 Sandstone and siltstone. N D171584 8 ------do------- Blaine---- 38 01 39 82 48 19 Channel--- --- 860 9 Silty clay. 0
z D171583 8 ------do------- ---do----- 38 01 39 82 48 19 ---do----- --- 860 6 Do. tz:.j D174720 9 ------do------- ---do----- 38 00 56 82 46 23 Core. USGS 177 873 17 Carbonaceous shale. 00
Dl71582 8 Whitesburg----- ---do----- 38 01 38 82 48 18 Channel--- --- 846 29 Do. Dl71580 30 ------do-..;. _____ Sitka----- 37 54 02 82 51 07 ---do----- --- 928 28 Shale • black. fissile.
Dl74716 4 Williamson----- Blaine---- 38 05 17 82 45 53 Core. USGS 250 370 18 Shale with siltstone streaks.
Dl74717 4 Van Lear------- ---do----- 38 05 17 82 45 53 ---do----- 294 326 10 Silty shale. Dl71579 32 ------do------- Sitka----- 37 53 17 82 48 47 Channel--- --- 756 28 Shale.
Dl74718 4 Unnamed bed below Blaine---- 38 05 17 82 45 53 Core. USGS 683 -63 17 Do. sandstone of Lee Formation.
lshown in figure 5. 1:-.j
2Princess No. 6 at this locality according to Outerbridge (1977). -l
28 COAL GEOLOGY, KENTUCKY AND WEST VffiGINIA
TABLE 4.-Arithmetic mean, observed range, geometric mean, and geometric deviation of 36 elements in 45 coal samples from the report area, reported on whole-coal basis. Geometric means of 331 Appalachian region bituminous coal samples of Pennsylvanian age (Swanson and others, 1976, table 7C) are included for comparison
[Values other than those in last column computed from data listed in table 26; values in table 26 followed by L were replaced by the number multiplied by 0.66 (standard procedure). As, F, Hg, Se, Th, and U values used to calculate the statistics were determined directly on whole coal. All other values calculated from determinations made on coal ash. L, less than value shown. Thirty-four of the 45 samples analyses summarized here were included in the 331 Appalachian samples. Si, Al, Ca, Sb, Mg, Na, K, Fe, Ti in percent; others in ppm. Leaders (---), not measurable)
Element Arithmetic
mean (abundance)
Si Al Ca Mg Na
K Fe Mn Ti As
Cd Cu F Hg Li
Pb Sb Se Th u
Zn B Ba Be Co
Cr Ga 2
Mo Nb Ni
Sc Sr v y Yb3 Zr
3.1 2.0
.11
.065
.024
.25 2.3
68 .12
43
23 90
.27 24
17 2.0 6.9 6.7 2.4
29 70 70
3 7
15 7 3
15
5 50 20 15
1 30
1 Median. 2 37 samples. 3 30 samples.
Observed range
Minimum Maximum
0.49 .19 .042 .012 .005
.019
.070 3.9 L
.008 1
.02 L 7.4
20 L .02
1. 8
3.2 .3
1.7 2. 7 .2 L
4.5 15 10
1 1. 5
2 2
.15 1.5 L 5
1. 5 15
2 3
.7 2
11.0 10
.51
.213
.066
1.0 8.0
1023 .49
300
.5 L 49
460 1.50
120
72 10.8 25 47.8 15
220 100 700
7 20
30 10 15 15 50
10 150
70 30
3 300
Geometric mean Geometric
(expected deviation value)
2.3 1.4
.091
.045
.020
.15 1.1
22 .081
20
.2 Ll 21 60
.16 16
13 1. 5 5.8 4.9 1.6
20 50 50
3 5
10 7
21 3
15
5 30 20 15
1 20
2.3 2.3 1.8 2.3 1. 9
2.7 4.2 3.5 2. 7 4.3
1.5 2.4 3.0 2.7
2.1 2.0 1.8 2.1 2.6
2.2 1.6 2.3 1. 7 1.8
2.0 1.5 2.8
1.7
1. 7 1.9 2.0 1.6 1.4 2.7
Mean, Appalachian bituminous
coal
1. 2 1.3 .093 .052 .025
.13 1.0
200 .074
11
.3 16 60
.14 18.8
10.9 .8
3.5 2.8 1.0
12.8 20 70
2 5
15 7 2 3
15
3 70 20
7 .7
30
COAL BEDS OR ZONES 29
and the northern two-thirds of the Blaine quadrangle. The bed should be within 100 m of the surface, though, along the major drainage courses in the Richardson and southern part of the Adams quadrangle, and exploratory drilling could delineate areas within which the bed is of mineable thickness.
Two samples of the Van Lear coal bed were collected, one for the U.S. Bureau of Mines and one for U.S. Geological Survey chemical analysis. The ash content is a little higher than average, heat of combustion about average, and sulfur content about half the average of all the beds. Silica, lithium, and zinc contents are about one-fourth the average; manganese and cadmium contents are one-seventh the average; and arsenic and mercury contents are less than one-tenth the average.
WILLIAMSON COAL ZONE
Neither of the coal beds of the Williamson coal zone is of much commercial importance. One or the other exceeds 14 in. (36 em) in thickness at only a few scattered localities in the Blaine, Richardson, and Sitka quadrangles (fig. 7A). One is as much as 36 in. (91 em) thick near a hilltop in the northwest part of the Sitka quadrangle. A bed of the zone has been entered by three adits for small truck mines in the southern and east-central parts of the Sitka quadrangle. A bed of the zone is 18 in. ( 46 em) thick at a locality near the west edge of the Richardson quadrangle, and one is 20 in. (51 em) thick at a locality in the southwestern part of the Blaine quadrangle. The total calculated remaining resource of the zone is 0.6 million short tons (0.54 million t) (table 8).
One sample from the Williamson coal zone was available for analysis. The ash content is about two-thirds the average, heat of combustion about average, and sulfur content about one-third the average of all the beds. It has unusually low concentration of more elements than any other bed: silica, potassium, fluorine, and selenium contents are about one-fourth the average; titanium, lithium, uranium, and zinc contents are about one-fifth the average; and arsenic and mercury contents are about one-tenth the average or less.
WHITESBURG COAL BED
The Whitesburg coal bed, called the Lower Whitesburg coal bed by Huddle and others (1963), is a very persistent bed without partings and is apparently more than 14 in. (36 em) thick over extensive areas of the· Sitka, Richardson, and Blaine quadrangles and locally in the Adams quadrangle (fig. 7B). It reaches thicknesses as great as 42 in. (107 em) in the Sitka quadrangle, 36 in. (91 em) in the Blaine quadrangle, 34 in. (86 em) in the Adams quadrangle, and 29 in. (74 em) in the Richardson quadrangle. The bed has been entered by at least 50 adits of small truck
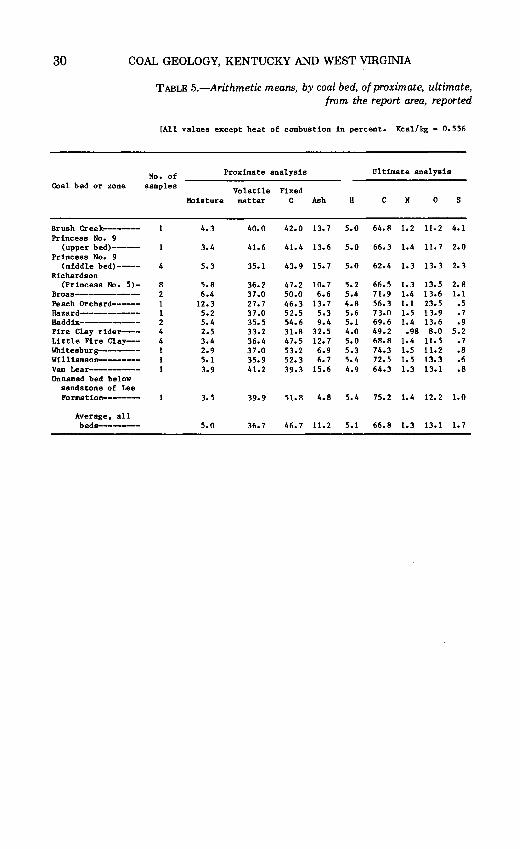
30 COAL GEOLOGY, KENTUCKY AND WEST VIRGINIA
TABLE 5.-Arithmetic means, by coal bed, of proximate, ultimate, from the report area, reported
[All values except heat of combustion in percent. Kcal/kg = o. 556
No. of Proximate analysis Ultimate analysis
Coal bed or zone ~amples Volatile Fixed
Moisture matter c Ash H c N 0
Brush Creek-------- 4.3 40.0 42.0 13.7 5.0 64.8 1. 2 11.2 4.1 Princess No. 9
{upper bed)----- 3.4 41.6 41.4 13.6 s.o 66.3 1.4 u. 7 2.0 Princess No. 9
{middle bed)----- 4 5.3 35.1 43.9 15.7 s.o 62.4 1.3 13.3 2.3 Richardson
{Princess No. 5)- 8 5.8 36.2 47.2 10.7 5.2 66.5 1. 3 13.5 2. 8 Broas------------ 2 6.4 37.0 50.0 6.6 5.4 71.9 1.4 13.6 1.1 Peach Orchard------ 1 12.3 27.7 46.3 13.7 4.8 56.3 1.1 23.5 .5 Hazard----------- 1 5.2 37.0 52.5 5.3 5.6 73.0 1.5 13.9 .7 Haddix------------ 2 5.4 35.5 54.6 9.4 5.1 69.6 1.4 13.6 .9 Fire Clay rider--- 4 2.5 33.2 31.8 32.5 4.0 49.2 .98 8.0 5.2 Little Fire Clay-- 4 3.4 36.4 47.5 12.7 s.o 68.8 1.4 u.s .7 Whitesburg--------- 1 2.9 37.0 53.2 6.9 5.3 74.3 1.5 11.2 .8 Williamson--------- 1 5.1 35.9 52.3 6. 7 5.4 72.5 1. 5 13.3 .6 Van Lear----------- 1 3.9 41.2 39.3 15.6 4.9 64.3 1.3 13.1 .8 Unnamed bed below
sandstone of Lee Formation-------- 3.5 39.9 51.8 4.8 5.4 75.2 1.4 12.2 1.0
Average, all beds------- s.o 36.7 46.7 11.2 5.1 66.8 1.3 13.1 1. 7
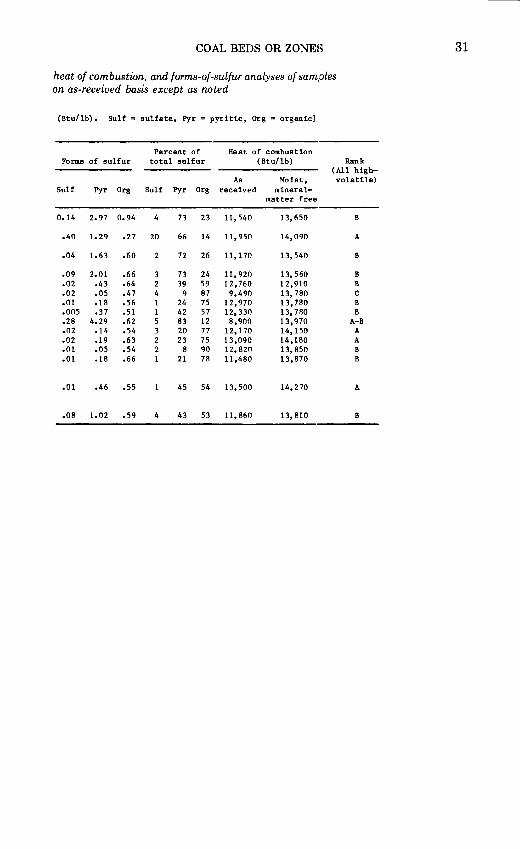
COAL BEDS OR ZONES 31
heat of combustion, and forms-of-sulfur analyses of samples on as-received basis except as noted
(Btu/lb). Sulf = sulfate, Pyr = pyritic, Org = organic]
Percent of Heat of combustion Forms of sulfur total sulfur (Btu/lb) Rank
(All high-As Moist, volatile)
Sulf Pyr Org Sulf Pyr Org received mineral-matter free
0.14 2.97 0.94 4 73 23 11,540 13,650 B
.40 1. 29 .27 20 66 14 11,950 14,090 A
.04 1.63 .60 72 26 11,170 13,540 B
.09 2.01 .66 3 73 24 11,920 13,560 B
.02 .43 .64 2 39 59 12,760 12,910 B
.02 .05 .47 4 9 87 9,490 13,780 c
.01 .18 .56 1 24 75 12,970 13,780 B
.005 .37 .51 1 42 57 12,330 13,780 B
.28 4.29 .62 5 83 12 8,900 13,970 A-B
.02 .14 .54 3 20 77 12,170 14,150 A
.02 .19 .63 2 23 75 13,090 14,180 A
.01 .05 .54 2 8 90 12,820 13,850 B
.01 .18 .66 1 21 78 11,480 13,870 B
.01 .46 .55 45 54 13,500 14,2 70 A
.08 1.02 .59 43 53 11,860 13,810 B
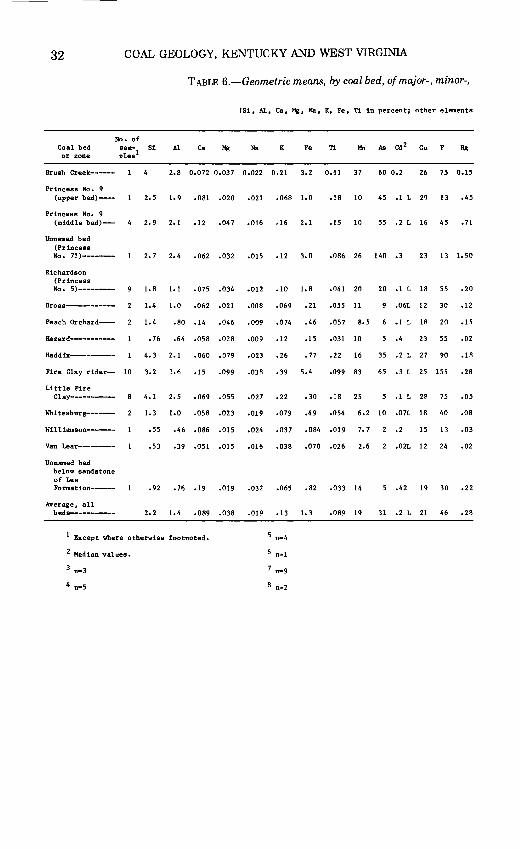
32 COAL GEOLOGY, KENTUCKY AND WEST VIRGINIA
TABLE 6.-Geometric means, by coal bed, of major-, minor-,
[Si, Al, Ca, Mg, Na, K, Fe, T1 in percent; other elements
Coal bed or zone
No. of sa- Si ples 1
Al Ca Mg Na K Fe Ti Mn As Cd2 Cu F Hg
Brush Creek-----
Princess No. 9 (upper bed)----
Princess No. 9 (middle bed)--
Unnamed bed (Princess No • 7?) -------
Richardson (Princess No. 5) ---------
Bross-----------
Peach Orchard----
Hazard-----------
Haddix--------
2.8 0.072 0.037 0.022 0.21 3.2 o.u 37 60 0.2 26 75 0.15
2.5 1.9 .081 .020 .021 .068 1.0 .18 10 45 .1 L 29 13 .45
2.9 2.1 .12 .047 .016 .16 2.1 .15 10 55 .2 L 16 45 .71
2. 7 2.4 .062 .032 .015 .12 3.0 .086 26 140 .3 23 13 1.50
1.8 1.1 .075 .034 .012 .10 1.8 .041 20 20 .1 L 18 55 .20
1.4 1.0 .062 .021 .ooa .069 .21 .055 11 .06L 12 30 .12
1.4 .so .14 .046 .oo9 .074 .46 .os1 a.s .1 L 18 20 .15
• 76 .64 .058 .028 .009 .12 .15 .031 10 .4 23 55 .02
4.3 2.1 .060 .079 .023 .26 .77 .22 16 35 • 2 L 27 90 .18
Fire Clay rider-- 10 3.2 1.6 .15 .099 .038 .39 5.4 .099 83 65 .3 L 25 155 .28
Little Fire Clay----------
Whitesburg-------
Williamson-------
Van Lear--------
Unnamed bed below sandstone of Lee Formation-----
Average, all beds-----------
4.1 2.5 .069 .055 .027 .22 .30 .18 25 5 .1 L 28 75 .05
1.3 1.0 .058 .023 .019 .079 .49 .054 6.2 10 .07L 18 40 .08
.55 .46 .086 .015 .024 .037 .084 .019 7. 7 2 .2 15 13 .03
.53 .39 .051 .015 .016 .038 .070 .026 2.6 2 .02L 12 24 .02
.92 .76 .19 .019 .032 .065 .82 .033 14 5 .42 19 30 .22
2.2 1.4 .089 .038 .019 .13 1.3 .089 19 31 • 2 L 21 46 • 2 8
1 Except where otherwise footnoted.
2 Median values.
5 n•4
3 n•3
4 n•S
7 n•9
8 n•2
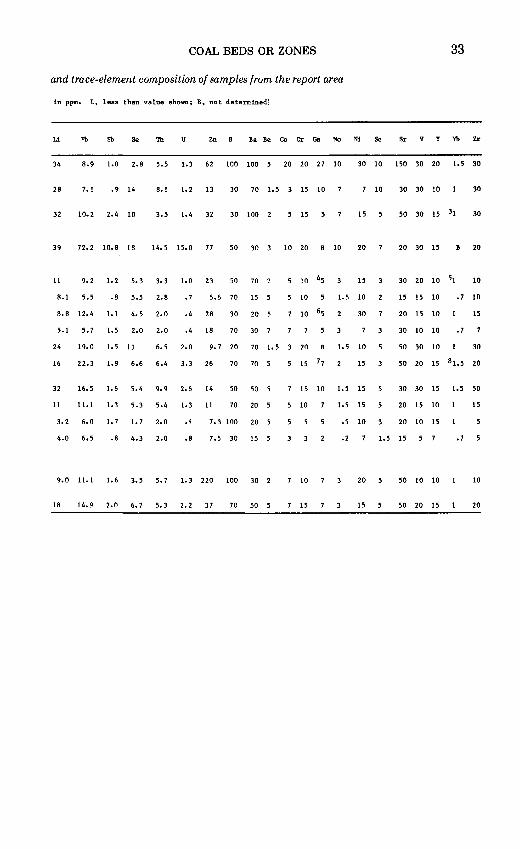
COAL BEDS OR ZONES 33
and trace-element composition of samples from the report area
in ppm. L, less than value shown; B, not determined]
Li Pb Sb Se u Zn Ba Be Co Cr Ga Mo Ni Sc Sr V Y Yb Zr
34 8.9 1.0 2.8 s.s 1.3 62 100 100 20 20 27 10 30 10 150 30 20 1.5 30
28 7.1 .9 14 8.1 1. 2 13 30 70 1.5 15 10 7 10 30 30 10 30
32 10.2 2.4 10 3.5 1.4 32 30 100 2 15 15 50 30 15 31 30
39 72.2 10.8 18 14.5 15.0 77 50 30 3 10 20 B 10 20 20 30 15 20
11 9. 2
8.1 5.5
8.8 12.4
5.1 s. 7
1. 2
.8
1.1
1.5
s. 3
s.s
4. 5
2.0
3.3
2.8
2.0
2.0
1.0
• 7
.4
.4
23 50
S.6 70
28 30
18 70
70 2
15 5
20 5
30 7
24
16
19.0 1.5 11 6.S 2.0 9. 7 20 70 1.5
22.3 1.8 6.6 6.4 3.3 26 70 70 5
32 16.S
11 11.1
3. 2 6.0
4.0 6.S
1.6
1.3
1. 7
5.4
5.3
1. 7
9.9
S.4
2.0
.8 4.3 2.0
2.6
1.3
.4
.8
14 so
11 70
7.3 100
so. 5
20 5
20
7 .s 30 15 5
9.0 11.1 1.6 3.5 5. 7 1.3 220 100 30 2
18 14.9 2.0 6. 7 S.3 2.2 37 70 so 5
5 10 45
5 10
10 65
15
1.5 10
30
20 1.5 10
15 77 15
7 15 10
5 10
7 10
7 15
1.5 15
1.5 15
.5 10
.2
20
15
30 20 10 51 10
15 15 10 • 7 10
20 15 10
30 10 10 • 7
15
50 30 10 30
50 20 15 8 1.5 20
30 30 15
20 15 10
20 10 15
1.5 15
50 10 10
50 20 15
1.5 50
15
• 7
10
20
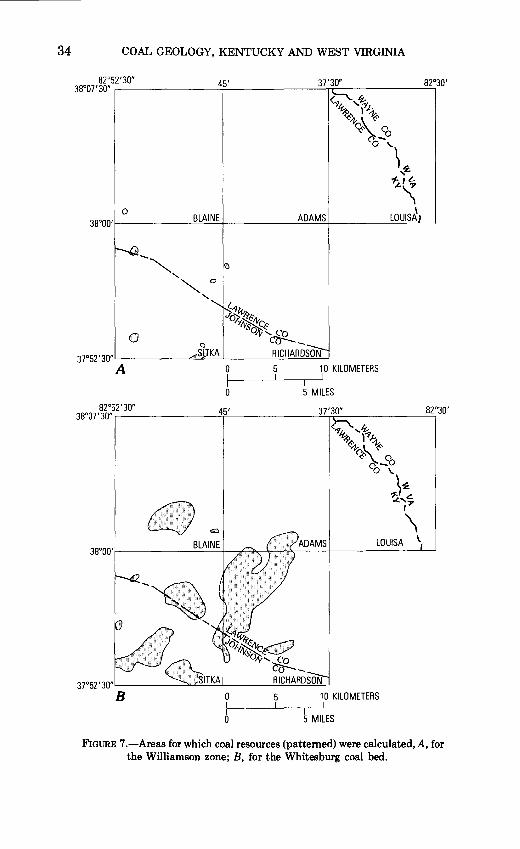
34 COAL GEOLOGY, KENTUCKY AND WEST VIRGINIA
45 1 37130"
10,~ %~ 1\
"YC(c-\:. 00
co-,
)~ .....
"i' ~ \
0 BLAINE ADAMS LOUISt) I
~-""' ()
' ""'0 ................
~~~ "o~~
0 ;s01Y~ Co
0 ~-;~ I _, ... .SJTKA RICHARDSON 3J0521301
A 0 5 10 KILOMETERS
0 5 MILES
82°52130" 38°07130" ..-----------:r=----------=-.:....n':..__----------, 451 37130" 82°301
<-1~ "f-1h ~~ C(c- Q
Q-0 0 \.
~£ ~ .... ~ ,1'
\ LOUISA \
3J052130"'-------"--L., . ..:;__I_TK_A__.___ __ -----'-'-=-~~-'-=--' 8 0 10 KILOMETERS
5 MILES
FIGURE 7 .-Areas for which coal resources (patterned) were calculated, A, for the Williamson zone; B, for the Whitesburg coal bed.
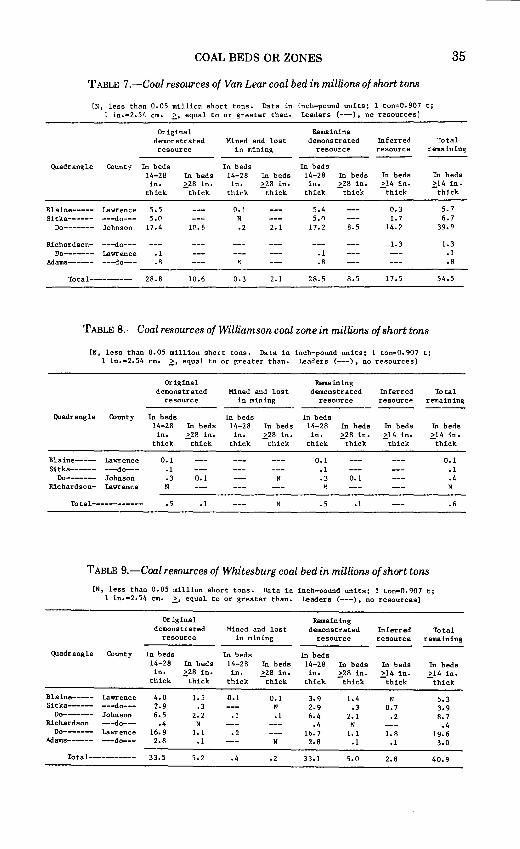
COAL BEDS OR ZONES 35
TABLE 7 .-Coal resources of Van Lear coal bed in millions of short tons
[N, less than 0. OS million short tons. Data in inch-pound units; 1 ton=O. 907 t; 1 in.=2.S4 em. ~. equal to or greater than. Leaders (---), no resources]
Original Remaining demonstrated Mined and lost demonstrated Inferred Total resource in mining resource resource remaining
Quadrangle County In beds In beds In beds 14-28 In beds 14-28 In beds 14-28 In beds In beds In beds in. >28 in. in. >28 in. in. >28 in. >14 in. >14 in.
thick -thick thick -thick thick -thick -thick -thick
Blaine----- Lawrence s. s 0.1 S.4 0.3 s. 7 Sitka------ ---do--- s.o N s.o 1. 7 6. 7
Do------- Johnson 17.4 10.6 .2 2.1 17.2 8.5 14.2 39.9
Richardson- ---do--- 1.3 1.3 Do------- Lawrence .1 .1 .1
Adams------ ---do--- .ll N .A .8
Total---------- 28.8 10.6 0.3 2.1 28.S 8.S l7.S S4.S
TABLE 8.-Coal resources of Williamson coal zone in millions of short tons
[N, less than O.OS million short tons. Data in inch-pound units; 1 tona0.907 t; 1 in.=2.S4 em. ~. equal to or greater than. Leaders (---), no resources]
Original Remaining demonstrated Mined and lost demonstrated Inferred Total
resource in mining resource resource remaining
Quadrangle County In beds In beds In beds 14-28 In beds 14-28 In beds 14-28 In beds In beds In beds in. >28 in. in. ~28 in. in. >28 in. >14 in. >14 in.
thick -thick thick thick thick -thick -thick -thick
Blaine----- Lawrence 0.1 0.1 0.1 Sitka------ ---do--- .} .1 .1
Do------- Johnson .3 0.1 N .3 0.1 .4 Richardson- lawrence N N N
Tot a 1------------ .s .1 N .s .1 .6
TABLE 9.-Coal resources of Whitesburg coal bed in millions of short tons
[N, less than 0. OS million short tons. Data in inch-pound units; 1 ton=O. 907 t; 1 in.=2.S4 em. ~. equal to or greater than. Leaders (---), no resources]
Original Remaining demonstrated Mined and lost demonstrated Inferred Total
resource in mining resource resource remaining
Quadrangle County In beds In beds In beds 14-28 In beds 14-28 In beds 14-28 In beds In beds In beds in. ~28 in. in. ~28 in. in. >28 in. >14 in. >14 in.
thick thick thick thick thick -thick -thick -thick
Blaine----- Lawrence 4.0 1. s 0.1 0.1 3.9 1.4 N s.3 Sitka------ ---do--- 2.9 .3 N 2.9 .3 o. 7 3.9
Do------- Johnson 6.S 2. 2 .1 .1 6.4 2.1 .2 8. 7 Richardson ---do--- .4 N .4 N .4
Do------- Lawrence 16.9 1.1 • 2 16.7 1.1 1.8 19.6 Adams------ ---do--- 2.8 .1 N 2.8 .1 .1 3.0
Tot a 1----------- 33.5 5.2 .4 .2 33.1 5.0 2.8 40.9
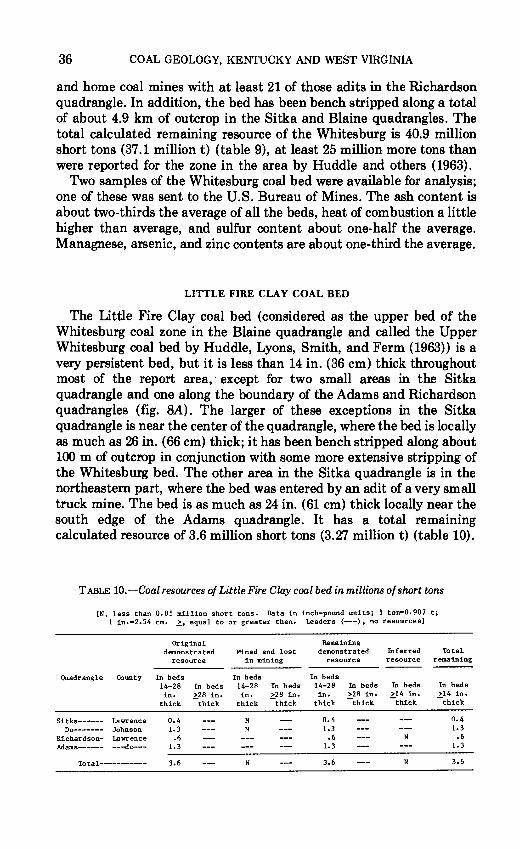
36 COAL GEOLOGY, KENTUCKY AND WEST VIRGINIA
and home coal mines with at least 21 of those adits in the Richardson quadrangle. In addition, the bed has been bench stripped along a total of about 4.9 km of outcrop in the Sitka and Blaine quadrangles. The total calculated remaining resource of the Whitesburg is 40.9 million short tons (37.1 million t) (table 9), at least 25 million more tons than were reported for the zone in the area by Huddle and others ( 1963).
Two samples of the Whitesburg coal bed were available for analysis; one of these was sent to the U.S. Bureau of Mines. The ash content is about two-thirds the average of all the beds, heat of combustion a little higher than average, and sulfur content about one-half the average. Managnese, arsenic, and zinc contents are about one-third the average.
LITTLE FIRE CLAY COAL BED
The Little Fire Clay coal bed (considered as the upper bed of the Whitesburg coal zone in the Blaine quadrangle and called the Upper Whitesburg coal bed by Huddle, Lyons, Smith, and Ferm (1963)) is a very persistent bed, but it is less than 14 in. (36 em) thick throughout most of the report area, · except for two small areas in the Sitka quadrangle and one along the boundary of the Adams and Richardson quadrangles (fig. SA). The larger of these exceptions in the Sitka quadrangle is near the center of the quadrangle, where the bed is locally as much as 26 in. (66 em) thick; it has been bench stripped along about 100m of outcrop in conjunction with some more extensive stripping of the Whitesburg bed. The other area in the Sitka quadrangle is in the northeastern part, where the bed was entered by an adit of a very small truck mine. The bed is as much as 24 in. (61 em) thick locally near the south edge of the Adams quadrangle. It has a total remaining calculated resource of 3.6 million short tons (3.27 million t) (table 10).
TABLE 10.-Coal resources of Little Fire Clay coal bed in millions of short tons
[N, less than 0.05 million short tons. Data in inch-pound units; 1 ton•0.907 t; 1 in.=2.54 em. ~. equal to or greater than. leaders (--), no resources)
Original Remaining demonstrated Mined and lost demonstrated Inferred Total
resource in mining resource resource remaining
Quadrangle County In beds In beds In beds 14-28 In beds 14-28 In beds 14-28 In beds In beds In beds in. >28 in. in. >28 in. in. >28 in. >14 in. >14 in.
thick -thick thick -thick thick -thick -thick -thick
Sitka------ Lawrence 0.4 N 0.4 0.4 Do------- Johnson 1.3 N 1.3 1.3
Richardson- Lawrence .6 .6 N .6 Adams------ ---do--- 1.3 1.3 1.3
Total----------- 3.6 N 3.6 N 3.6
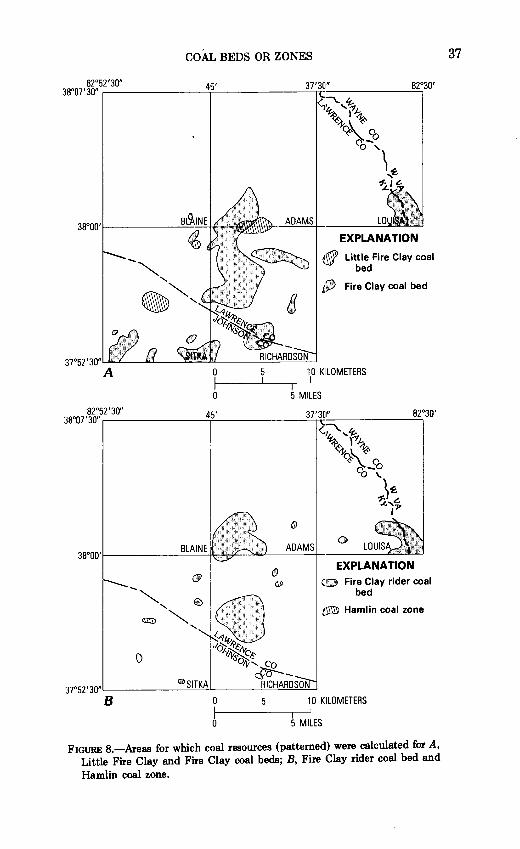
COAL BEDS OR ZONES
82052'30" 45' 37'3[1" 8 03 38°07'30" ,---------~~-----~~:~-----~2 0'
(1~'~h ~~~ C(<- Q _o
00'
\~ ... 1}.1 £.
38°00't-------=:=:7*~-~~....!.A~D~AM~S~---~LO~
0
0
EXPLANATION
~f/ Little Fire Clay coal bed
l!Ji> Fire Clay coal bed
10 KILOMETERS
5 MILES
0 38oOO'!------~~~~"'---A_DA_._M_._S+ __ __:_::....::._:~
0
g] ul~lt-~~ oft~~
01\1, co cfCf--
37052'30"L-------.:::..:...:..:.:.:..:..L ___ ~R~IC~H~A!..!.!RD~S~O!.:!.N_j
EXPLANATION (:]D Fire Clay rider coal
bed
t~ Hamlin coal zone
B 10 KILOMETERS
0 5 MILES
FIGURE 8.-Areas for which coal resources (patterned) were calculated for A, Little Fire Clay and Fire Clay coal beds; B, Fire Clay rider coal bed and Hamlin coal zone.
37
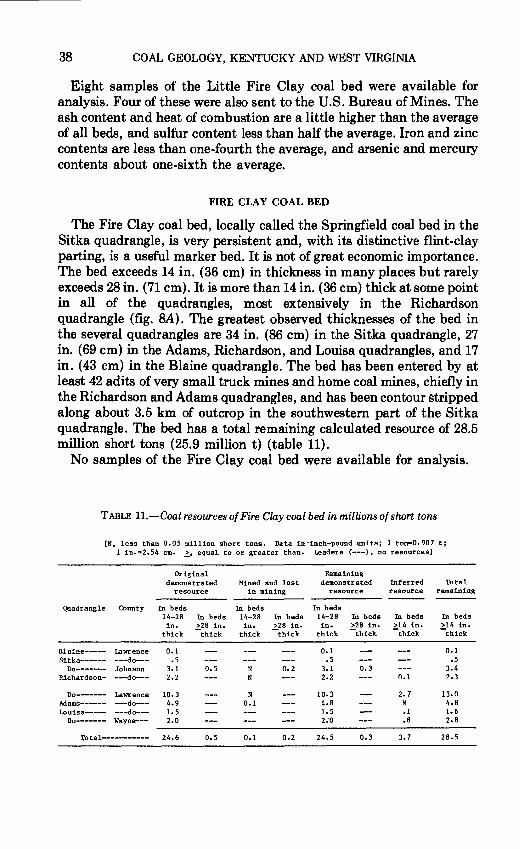
38 COAL GEOLOGY, KENTUCKY AND WEST VIRGINIA
Eight samples of the Little Fire Clay coal bed were available for analysis. Four of these were also sent to the U.S. Bureau of Mines. The ash content and heat of combustion are a little higher than the average of all beds, and sulfur content less than half the average. Iron and zinc contents are less than one-fourth the average, and arsenic and mercury contents about one-sixth the average.
FIRE CLAY COAL BED
The Fire Clay coal bed, locally called the Springfield coal bed in the Sitka quadrangle, is very persistent and, with its distinctive flint-clay parting, is a useful marker bed. It is not of great economic importance. The bed exceeds 14 in. (36 em) in thickness in many places but rarely exceeds 28 in. (71 em). It is more than 14 in. (36 em) thick at some point in all of the quadrangles, most extensively in the Richardson quadrangle (fig. SA). The greatest observed thicknesses of the bed in the several quadrangles are 34 in. (86 em) in the Sitka quadrangle, 27 in. (69 em) in the Adams, Richardson, and Louisa quadrangles, and 17 in. (43 em) in the Blaine quadrangle. The bed has been entered by at least 42 adits of very small truck mines and home coal mines, chiefly in the Richardson and Adams quadrangles, and has been contour stripped along about 3.5 km of outcrop in the southwestern part of the Sitka quadrangle. The bed has a total remaining calculated resource of 28.5 million short tons (25.9 million t) (table 11).
No samples of the Fire Clay coal bed were available for analysis.
TABLE 11.-Coal resources of Fire Clay coal bed in millions of short tons
[N, less than 0.05 million short tons. Data in -inch-pound units; 1 ton•O. 907 t; 1 in.•2.54 em. ~. equal to or greater than. Leaders (---), no resources]
Original Remaining demonstrated Mined and lost demonstrated Inferred Total
resource in mining resource resource remaining
Quadrangle County In beds In beds In beds 14-28 In beds 14-28 In beds 14-28 In beds In beds In beds in. >28 in. in. >28 in. in. >28 in. >14 in. >14 in.
thick -thick thick -thick thick -thick -thick -thick
Blaine----- Lawrence 0.1 0.1 o.1 Sitka------ ---do--- .5 .5 .5
Do------- Johnson 3.1 0.5 N 0.2 3.1 0.3 3.4 Richardson- ---do--- 2.2 N 2.2 0.1 2.3
Do------- Lawrence 10.3 N 10.3 2. 7 13.0 Adams------ ---do--- 4.9 0.1 4.8 N 4.8 Louisa----- ---do--- 1. 5 1.5 .1 1.6
Do------- Wayne--- 2.0 2~0 .8 2.8
Total--------- 24.6 0.5 0.1 0.2 24.5 0.3 3. 7 28.5
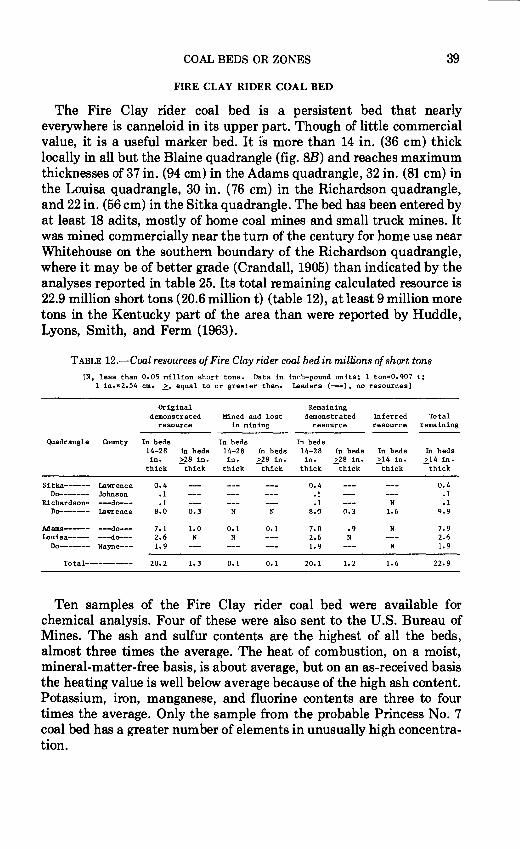
COAL BEDS OR ZONES 39
FIRE CLAY RIDER COAL BED
The Fire Clay rider coal bed is a persistent bed that nearly everywhere is canneloid in its upper part. Though of little commercial value, it is a useful marker bed. It is more than 14 in. (36 em) thick locally in all but the Blaine quadrangle (fig. 8B) and reaches maximum thicknesses of 37 in. (94 em) in the Adams quadrangle, 32 in. (81 em) in the Louisa quadrangle, 30 in. (76 em) in the Richardson quadrangle, and 22 in. (56 em) in the Sitka quadrangle. The bed has been entered by at least 18 adits, mostly of home coal mines and small truck mines. It was mined commercially near the tum of the century for home use near Whitehouse on the southern boundary of the Richardson quadrangle, where it may be of better grade (Crandall, 1905) than indicated by the analyses reported in table 25. Its total remaining calculated resource is 22.9 million short tons (20.6 million t) (table 12), at least 9 million more tons in the Kentucky part of the area than were reported by Huddle, Lyons, Smith, and Ferm (1963).
TABLE 12.-Coal resources of Fire Clay rider coal bed in millions of short tons
[N, less than O. 05 million short tons. Data in inch-pound units; 1 ton=O. 907 t; 1 in.•2.54 em. ~. equal to or greater than. Leaders (---), no resources]
Original Remaining demonstrated Mined and lost demonstrated Inferred Total
resource in mining resource resource remaining
Quadrangle County In beds In beds In beds 14-28 In beds 14-28 In beds 14-28 In beds In beds In beds in. >28 in. in. ~28 in. in. >28 in. ~14 in. >14 in.
thick -thick thick thick thick -thick thick -thick
Sitka------ Lawrence 0.4 0.4 0.4 Do------- Johnson .1 .1 .1
Richardson- ---do--- .1 .1 N .1 Do------- Lawrence 8.0 0.3 N N 8.0 0.3 1.6 9.9
Adams----- ---do--- 7.1 1.0 0.1 0.1 7.0 .9 N 7.9 Louisa----- ---do--- 2.6 N N 2.6 N 2.6
Do------- Wayne--- 1. 9 1. 9 N 1. 9
To tal----------- 20.2 1. 3 0.1 0.1 20.1 1. 2 1. 6 22.9
Ten samples of the Fire Clay rider coal bed were available for chemical analysis. Four of these were also sent to the U.S. Bureau of Mines. The ash and sulfur contents are the highest of all the beds, almost three times the average. The heat of combustion, on a moist, mineral-matter-free basis, is about average, but on an as-received basis the heating value is well below average because of the high ash content. Potassium, iron, manganese, and fluorine contents are three to four times the average. Only the sample from the probable Princess No. 7 coal bed has a greater number of elements in unusually high concentration.
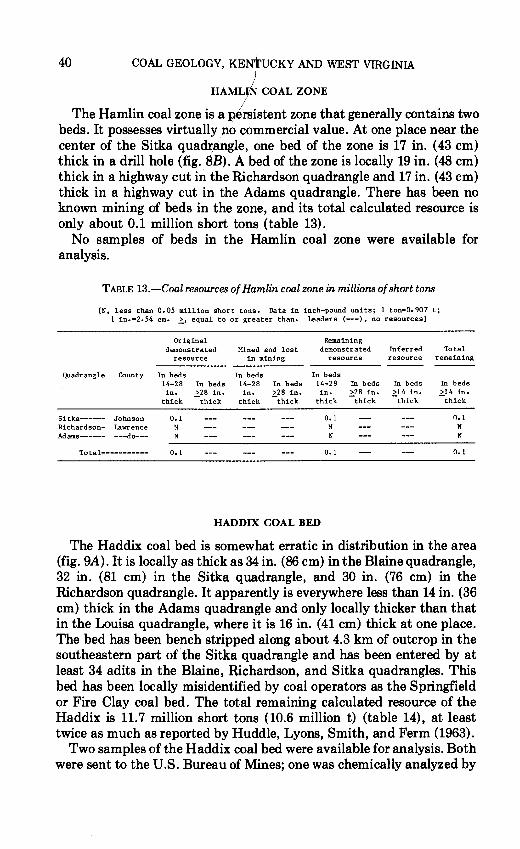
40 COAL GEOLOGY, KENtUCKY AND WEST VIRGINIA I
HAML~ COAL ZONE
The Hamlin coal zone is a Ji~istent zone that generally contains two beds. It possesses virtually J}o commercial value. At one place near the center of the Sitka quadrangle, one bed of the zone is 17 in. ( 43 em) thick in a drill hole (fig. BB). A bed of the zone is locally 19 in. (48 em) thick in a highway cut in the Richardson quadrangle and 17 in. (43 em) thick in a highway cut in the Adams quadrangle. There has been no known mining of beds in the zone, and its total calculated resource is only about 0.1 million short tons (table 13).
No samples of beds in the Hamlin coal zone were available for analysis.
TABLE 13.-Coal resources of Hamlin coal zone in millions of short tons
[N, less than 0.05 million short tons. Data in inch-pound units; 1 ton=0.907 t; 1 in.=2.54 em. ~. equal to or greater than. Leaders (---), no resources]
Original Remaining demonstrated Mined and lost demonstrated Inferred Total
resource in mining resource resource remaining
Quadrangle County In beds In beds In beds 14-28 In beds 14-28 In beds 14-28 In beds In beds In beds in. >28 in. in. >28 in. in. >28 in. >14 in. >14 in.
thick -thick thick -thick thick -thick -thick -thick
Sitka------ Johnson 0.1 0.1 0.1 Richardson- Lawrence N N N
Adams------ ---do--- N N N
To tal----------- 0.1 0.1 0.1
HADDIX COAL BED
The Haddix coal bed is somewhat erratic in distribution in the area (fig. 9A). It is locally as thick as 34 in. (86 em) in the Blaine quadrangle, 32 in. (81 em) in the Sitka quadrangle, and 30 in. (76 em) in the Richardson quadrangle. It apparently is everywhere less than 14 in. (36 em) thick in the Adams quadrangle and only locally thicker than that in the Louisa quadrangle, where it is 16 in. (41 em) thick at one place. The bed has been bench stripped along about 4.3 km of outcrop in the southeastern part of the Sitka quadrangle and has been entered by at least 34 adits in the Blaine, Richardson, and Sitka quadrangles. This bed has been locally misidentified by coal operators as the Springfield or Fire Clay coal bed. The total remaining calculated resource of the Haddix is 1L7 million short tons (10.6 million t) (table 14), at least twice as much as reported by Huddle, Lyons, Smith, and Ferm (1963).
Two samples of the Haddix coal bed were available for analysis. Both were sent to the U.S. Bureau of Mines; one was chemically analyzed by
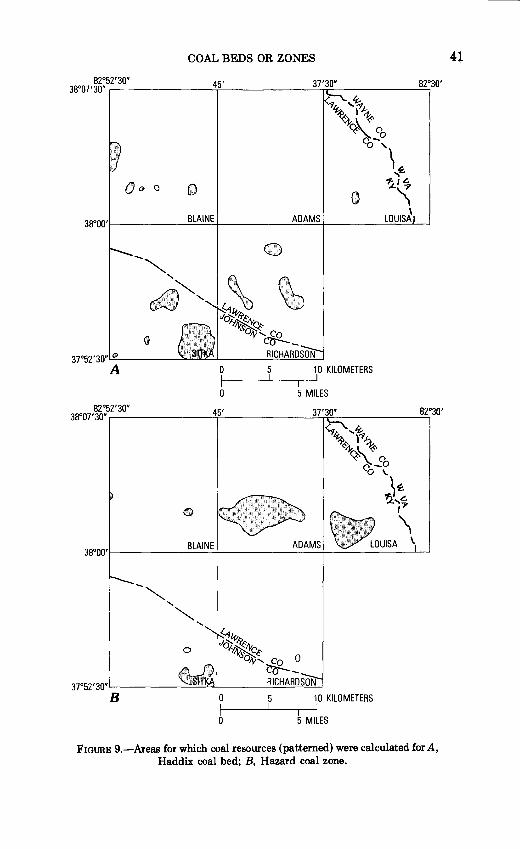
COAL BEDS OR ZONES
45' 37'30"
Oo 0
0
~~ ~ "o~.#"'c
YS~~ Co C<i'--
37052'30"L..:"::__ ___ ____:s.~:.z...:..L__ __ ~RI~CH.!.CA~RD~S~O.!..!.N_J
A 0 5 10 KILOMETERS
0 5 MILES
82°52'30" 45' 37'30" 82°30' 38°07'30",---------T------~~-----~
<."'ip,
"~~~ o..v-.... co 0 ~-
0
37052'30"~-------==~w..~._ ___ .:..:.;RI~CH.!!:A~R~DS~OC!..!N_.J 8 0 10 KILOMETERS
5 MILES
FIGURE 9.-Areas for which coal resources (patterned) were calculated for A, Haddix coal bed; B, Hazard coal zone.
41
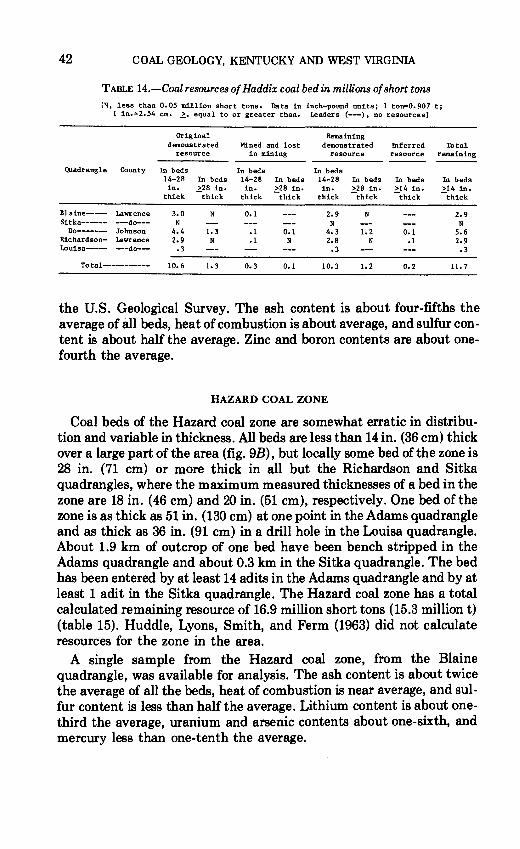
42 COAL GEOLOGY, KENTUCKY AND WEST VIRGINIA
TABLE 14.-Coal resources of Haddix coal bed in millions of short tons
[N, less than 0.05 million short tons. Data in inch-pound units; 1 ton-0.907 t; 1 in.•2.54 em. ~. equal to or greater than. Leaders (---), no resources)
Original Remaining demonstrated Mined and lost demonstrated Inferred Total
resource in mining resource resource remaining
Quadrangle County In beds In beds In beds 14-28 In beds 14-28 In beds 14-28 In beds In beds In beds in. ~28 in. in. >28 in. in. >28 in. >14 in. >14 in.
thick thick thick -thick thick -thick -thick -thick
Blaine----- Lawrence 3.0 N 0.1 2.9 N 2.9 Sitka------ ---do--- N N N
Do------- Johnson 4.4 1.3 .1 0.1 4.3 1. 2 0.1 5.6 Richardson- Lawrence 2.9 N .1 N 2.8 N .1 2.9 Louisa---- ---do--- .3 .3 .3
To tal----------- 10.6 1. 3 0.3 0.1 10.3 1.2 0.2 11.7
the U.S. Geological Survey. The ash content is about four-fifths the average of all beds, heat of combustion is about average, and sulfur content is about half the average. Zinc and boron contents are about onefourth the average.
HAZARD COAL ZONE
Coal beds of the Hazard coal zone are somewhat erratic in distribution and variable in thickness. All beds are less than 14 in. (36 em) thick over a large part of the area (fig. 9B), but locally some bed of the zone is 28 in. (71 em) or more thick in all but the Richardson and Sitka quadrangles, where the maximum measured thicknesses of a bed in the zone are 18 in. (46 em) and 20 in. (51 em), respectively. One bed of the zone is as thick as 51 in. (130 em) at one point in the Adams quadrangle and as thick as 36 in. (91 em) in a drill hole in the Louisa quadrangle. About 1.9 km of outcrop of one bed have been bench stripped in the Adams quadrangle and about 0.3 km in the Sitka quadrangle. The bed has been entered by at least 14 adits in the Adams quadrangle and by at least 1 adit in the Sitka quadrangle. The Hazard coal zone has a total calculated remaining resource of 16.9 million short tons (15.3 million t) (table 15). Huddle, Lyons, Smith, and Ferm (1963) did not calculate resources for the zone in the area.
A single sample from the Hazard coal zone, from the Blaine quadrangle, was available for analysis. The ash content is about twice the average of all the beds, heat of combustion is near average, and sulfur content is less than half the average. Lithium content is about onethird the average, uranium and arsenic contents about one-sixth, and mercury less than one-tenth the average.
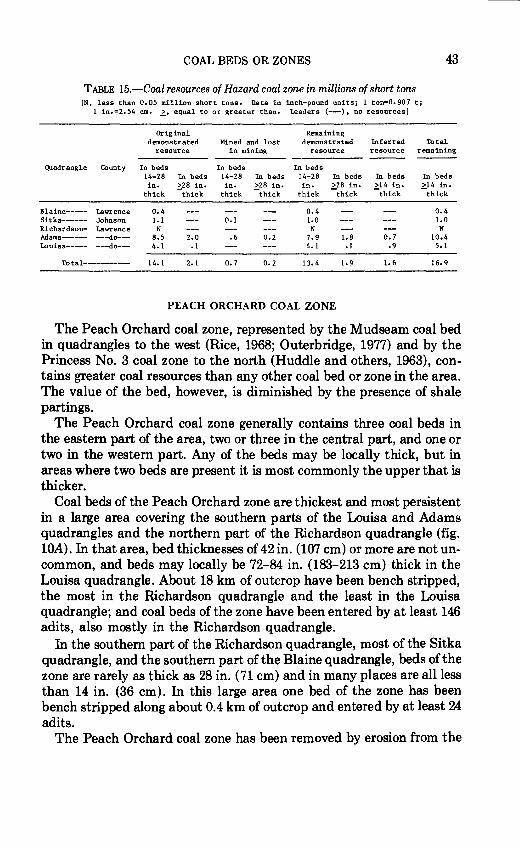
COAL BEDS OR ZONES
TABLE 15.-Coal resources of Hazard coal zone in millions of short tons [N, less than 0.05 million short tons. Data in inch-pound units; 1 ton~0.907 t;
1 in.=2.54 em. ~. equal to or greater than. Leaders (---), no resources)
Original Remaining demonstrated Mined and lost demonstrated Inferred
43
Total resource in mining resource resource remaining
Quadrangle County In beds In beds In beds 14-28 In beds 14-28 In beds 14-28 In beds In beds In beds in. ~28 in. in. >28 in. in. >28 in. >14 in. >14 in.
thick thick thick -thick thick -thick -thick -thick
Blaine----- Lawrence 0.4 0.4 0.4 Sitka------ Johnson 1.1 0.1 1.0 1.0 Richardson- Lawrence N N N Adams----- ---do--- 8.5 2.0 .6 0.2 7.9 1.8 o. 7 10.4 Louisa--- ---do--- 4.1 .1 4.1 .1 .9 5.1
To tal----------- 14.1 2.1 o. 7 0.2 13.4 1. 9 1. 6 16.9
PEACH ORCHARD COAL ZONE
The Peach Orchard coal zone, represented by the M udseam coal bed in quadrangles to the west (Rice, 1968; Outerbridge, 1977) and by the Princess No. 3 coal zone to the north (Huddle and others, 1963), contains greater coal resources than any other coal bed or zone in the area. The value of the bed, however, is diminished by the presence of shale partings.
The Peach Orchard coal zone generally contains three coal beds in the eastern part of the area, two or three in the central part, and one or two in the western part. Any of the beds may be locally thick, but in areas where two beds are present it is most commonly the upper that is thicker.
Coal beds of the Peach Orchard zone are thickest and most persistent in a large area covering the southern parts ·of the Louisa and Adams quadrangles and the northern part of the Richardson quadrangle (fig. lOA). In that area, bed thicknesses of 42 in. (107 em) or more are not uncommon, and beds may locally be 72-84 in. (183-213 em) thick in the Louisa quadrangle. About 18 km of outcrop have been bench stripped, the most in the Richardson quadrangle and the least in the Louisa quadrangle; and coal beds of the zone have been entered by at least 146 adits, also mostly in the Richardson quadrangle.
In the southern part of the Richardson quadrangle, most of the Sitka quadrangle, and the southern part of the Blaine quadrangle, beds of the zone are rarely as thick as 28 in. (71 em) and in many places are all less than 14 in. (36 em). In this large area one bed of the zone has been bench stripped along about 0.4 km of outcrop and entered by at least 24 adits.
The Peach Orchard coal zone has been removed by erosion from the
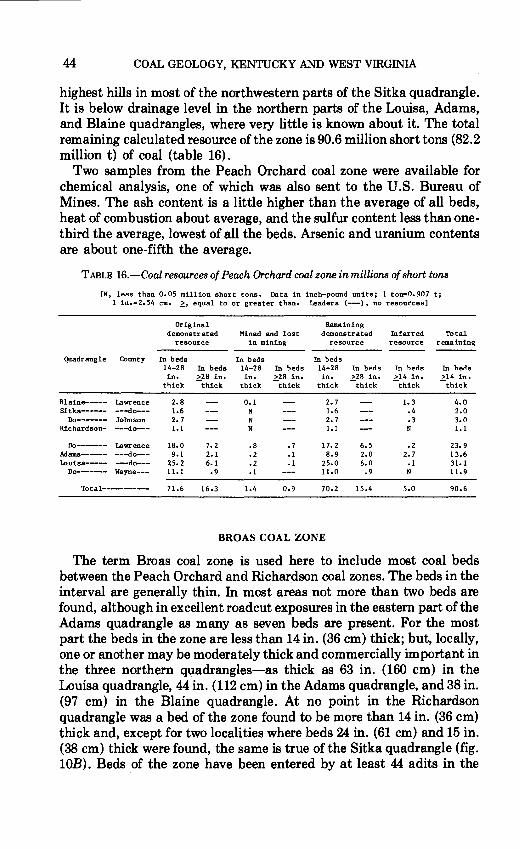
44 COAL GEOLOGY, KENTUCKY AND WEST VIRGINIA
highest hills in most of the northwestern parts of the Sitka quadrangle. It is below drainage level in the northern parts of the Louisa, Adams, and Blaine quadrangles, where very little is known about it. The total remaining calculated resource of the zone is 90.6 million short tons (82.2 million t) of coal (table 16).
Two samples from the Peach Orchard coal zone were available for chemical analysis, one of which was also sent to the U.S. Bureau of Mines. The ash content is a little higher than the average of all beds, heat of combustion about average, and the sulfur content less than onethird the average, lowest of all the beds. Arsenic and uranium contents are about one-fifth the average.
TABLE 16.-Coal resources of Peach Orchard coal zone in millions of short tons
[N, less than 0. 05 million short tons. Data in inch-pound units; 1 ton•0.907 t; 1 in.•2.54 em. ~. equal to or greater than. Leaders (--), no resources]
Original Remaining demonstrated Mined and lost demonstrated Inferred Total
resource in mining resource resource remaining
Quadrangle County In beds In beds In beds 14-28 In beds 14-28 In beds 14-28 In beds In beds In beds in. >28 in. in. >28 in. in. >28 in. >14 in. >14 in.
thick -thick thick -thick thick -thick -thick -thick
Blaine----- Lawrence 2.8 0.1 2. 7 1. 3 4.0 Sitka------ ---do--- 1.6 N 1.6 .4 2.0
Do------- Johnson 2. 7 N 2. 7 .3 3.0 Richardson- --do--- 1.1 N 1.1 N 1.1
Do------ Lawrence 18.0 7. 2 .8 • 7 17.2 6.5 .2 23.9 Adams------ ---do--- 9.1 2.1 .2 .1 8.9 2.0 2. 7 13.6 Louisa----- ---do--- 45.2 6.1 .2 .1 25.0 6.0 .1 31.1
Do------- Wayne--- 11.1 .9 .1 u.o .9 N 11.9
Total----------- 71.6 16.3 1.4 0.9 70.2 15.4 5.0 90.6
BROAS COAL ZONE
The term Broas coal zone is used here to include most coal beds between the Peach Orchard and Richardson coal zones. The beds in the interval are generally thin. In most areas not more than two beds are found, although in excellent road cut exposures in the eastern part of the Adams quadrangle as many as seven beds are present. For the most part the beds in the zone are less than 14 in. (36 em) thick; but, locally, one or another may be moderately thick and commercially important in the three northern quadrangles-as thick as 63 in. (160 em) in the Louisa quadrangle, 44 in. (112 em) in the Adams quadrangle, and 38 in. (97 em) in the Blaine quadrangle. At no point in the Richardson quadrangle was a bed of the zone found to be more than 14 in. (36 em) thick and, except for two localities where beds 24 in. (61 em) and 15 in. (38 em) thick were found, the same is true of the Sitka quadrangle (fig. lOB). Beds of the zone have been entered by at least 44 adits in the
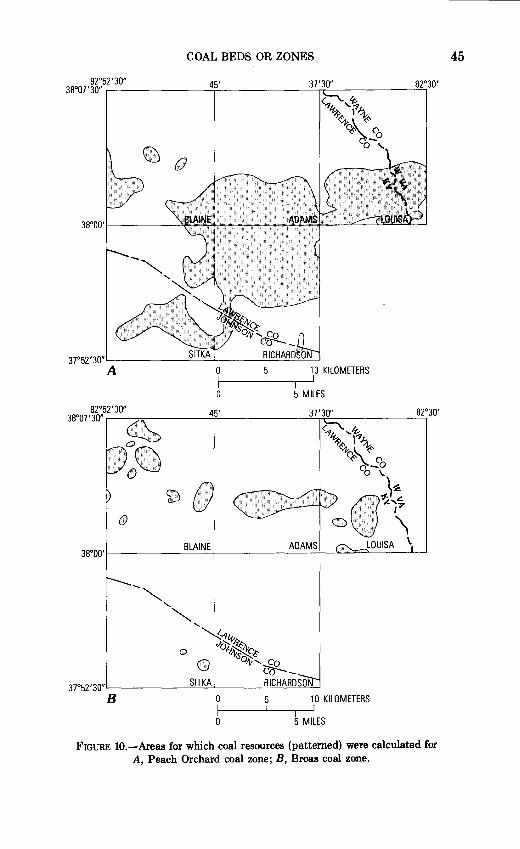
COAL BEDS OR ZONES
45'
37°52'30"~..,__ _____ ::..:...:..:.::...:.J.. ___ ~~~~
A 0 1 0 KILOMETERS
5 MILES
<."~tv.
0 cl%~~ 0.. 0.-v-.... co
ecf--3J052'30"L.,__-----.:::.:SI~TK~A~--~R.!.!CIC~H.!!:CA:!..!!RD~s!.!:!o.!..L.IN
B o
0
10 KILOMETERS
5 MILES
FIGURE 10.-Areas for which coal resources (patterned) were calculated for A, Peach Orchard coal zone; B, Broas coal zone.
45
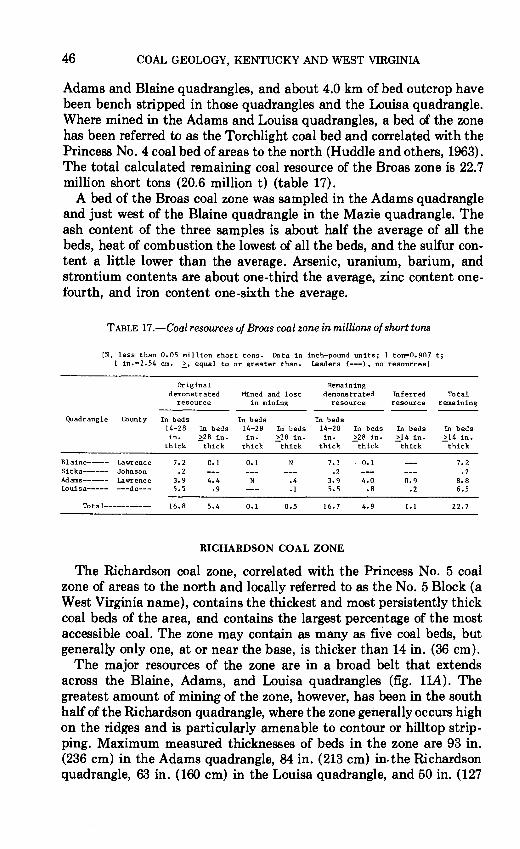
46 COAL GEOLOGY, KENTUCKY AND WEST VIRGINIA
Adams and Blaine quadrangles, and about 4.0 km of bed outcrop have been bench stripped in those quadrangles and the Louisa quadrangle. Where mined in the Adams and Louisa quadrangles, a bed of the zone has been referred to as the Torchlight coal bed and correlated with the Princess No. 4 coal bed of areas to the north (Huddle and others, 1963). The total calculated remaining coal resource of the Broas zone is 22.7 million short tons (20.6 million t) (table 17).
A bed of the Broas coal zone was sampled in the Adams quadrangle and just west of the Blaine quadrangle in the Mazie quadrangle. The ash content of the three samples is about half the average of all the beds, heat of combustion the lowest of all the beds, and the sulfur content a little lower than the average. Arsenic, uranium, barium, and strontium contents are about one-third the average, zinc content onefourth, and iron content one-sixth the average.
TABLE 17 .-Coal resources of Broas coal zone in millions of short tons
[N, less than 0.05 million short tons. Data in inch-pound units; 1 ton=0.907 t; 1 in.=2.54 em. ~. equal to or greater than. Leaders (---), no resources)
Original Remaining demonstrated Mined and lost demonstrated Inferred Total
resource in mining resource resource remaining
Quadrangle County In beds In beds In beds 14-28 In beds 14-28 In beds 14-28 In beds In beds In beds in. ~28 in. in. ~28 in. in. >28 in. >14 in. ~14 in.
thick thick thick thick thick -thick -thick thick
Blaine----- Lawrence 7. 2 0.1 0.1 N 7.1 0.1 7. 2 Sitka------ Johnson .2 .2 .2 Adams------ Lawrence 3. 9 4.4 N .4 3.9 4.0 o. 9 8.8 Louisa----- ---do--- s.s .9 .1 s.s .8 .2 6.5
Total----------- 16.8 5.4 0.1 o.s 16.7 4.9 1.1 22.7
RICHARDSON COAL ZONE
The Richardson coal zone, correlated with the Princess No. 5 coal zone of areas to the north and locally referred to as the No.5 Block (a West Virginia name), contains the thickest and most persistently thick coal beds of the area, and contains the largest percentage of the most accessible coal. The zone may contain as many as five coal beds, but generally only one, at or near the base, is thicker than 14 in. (36 em).
The major resources of the zone are in a broad belt that extends across the Blaine, Adams, and Louisa quadrangles (fig. 11A). The greatest amount of mining of the zone, however, has been in the south half of the Richardson quadrangle, where the zone generally occurs high on the ridges and is particularly amenable to contour or hilltop stripping. Maximum measured thicknesses of beds in the zone are 93 in. (236 em) in the Adams quadrangle, 84 in. (213 em) in. the Richardson quadrangle, 63 in. (160 em) in the Louisa quadrangle, and 50 in. (127
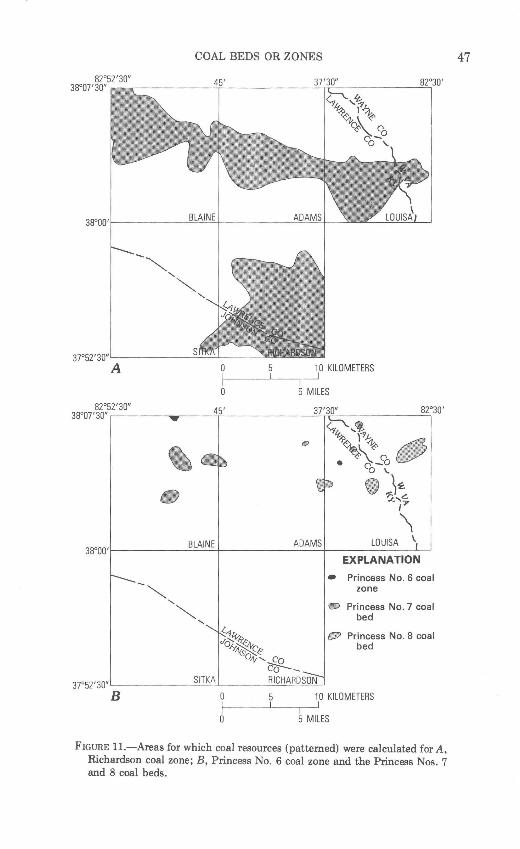
82°52'30" 38°07'30"
COAL BEDS OR ZONES
3JC52'30"L-_____ --=...:..c _ _,__ __ _
A 0 10 KILOMETERS
5 MILES
\ BLAINE ADAMS 38°00'~----~~-=-+-----____:_-=--~------_L_j
LOUISA
EXPLANATION
• Princess No. 6 coal zone
e Princess No. 7 coal bed
<."~tv. (Jjf) Princess No. 8 coal cl~~~ bed
01\i' co cy-_ 3r 52 ,30, L_ _____ ~SI~TK~A.:L_ __ ____:R~IC:::.:.H.!:..A"-"RD=S=O"-'-N_,
B 10 KILOMETERS
FIGURE 11.-Areas for which coal resources (patterned) were calculated for A, Richardson coal zone; B, Princess No. 6 coal zone and the Princess Nos. 7 and 8 coal beds.
47
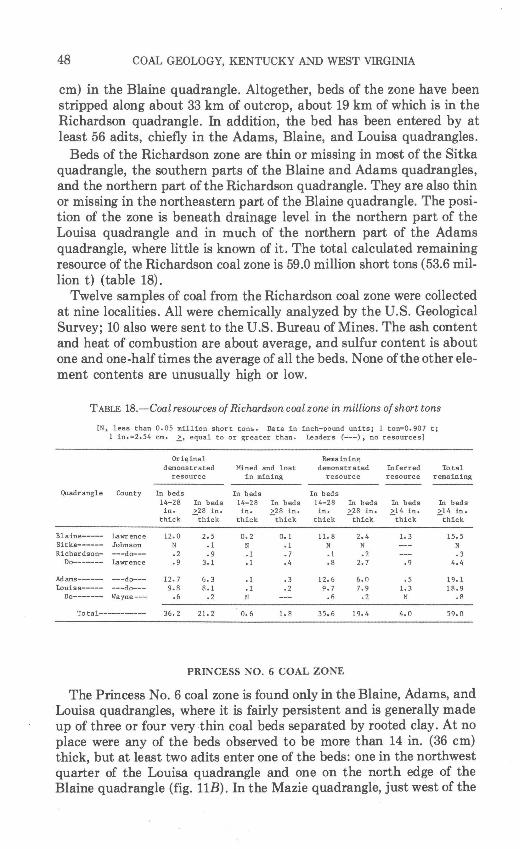
48 COAL GEOLOGY, KENTUCKY AND WEST VIRGINIA
em) in the Blaine quadrangle. Altogether, beds of the zone have been stripped along about 33 km of outcrop, about 19 km of which is in the Richardson quadrangle. In addition, the bed has been entered by at least 56 adits, chiefly in the Adams, Blaine, and Louisa quadrangles.
Beds of the Richardson zone are thin or missing in most of the Sitka quadrangle, the southern parts of the Blaine and Adams quadrangles, and the northern part of the Richardson quadrangle. They are also thin or missing in the northeastern part of the Blaine quadrangle. The position of the zone is beneath drainage level in the northern part of the Louisa quadrangle and in much of the northern part of the Adams quadrangle, where little is known of it. The total calculated remaining resource of the Richardson coal zone is 59.0 million short tons (53.6 million t) (table 18).
Twelve samples of coal from the Richardson coal zone were collected at nine localities. All were chemically analyzed by the U.S. Geological Survey; 10 also were sent to the U.S. Bureau of Mines. The ash content and heat of combustion are about average, and sulfur content is about one and one-half times the average of all the beds. None of the other element contents are unusually high or low.
TABLE 18.-Coal resources of Richardson coal zone in millions of short tons
[N, less than 0.05 million short ton!>• Data in inch-pound units; 1 ton=0.907 t; 1 in.=2.54 em. ~. equal to or greater than. Leaders (---), no resources]
Ori11inal Remaining del!lonstr a ted Mined and lost demonstrated Inferred Total
resource in mining resource resource remaining
Quadrangle County In beds In beds In beds 14-28 In beds 14-28 In beds 14-28 In beds In beds In beds in. ~28 in. in. >28 in. in. ~28 in. >14 in. >14 in.
thick thick thick -thick thick thick -thick -thick
Blaine----- Lawrence 12.0 2. 5 o. 2 0.1 11.8 2.4 1. 3 15.5 Sitka------ Johnson N .1 N .1 N N N Richardson- ---do--- .2 .9 .1 • 7 .1 .2 • 3
Do------- Lawrence • 9 3.1 .1 .4 • 8 2. 7 • 9 4.4
Adal!ls------ ---do--- 12.7 6. 3 .1 • 3 12.6 6. 0 .5 19. 1 Louisa----- ---do--- 9.8 8.1 .1 .2 9. 7 7.9 1. 3 18.9
Do------- Wayne--- .6 .2 N .6 .2 N .8
To tal----------- 36.2 21.2 0.6 1. 8 35.6 19.4 4.0 59.0
PRINCESS NO. 6 COAL ZONE
The Princess No.6 coal zone is found only in the Blaine, Adams, and Louisa quadrangles, where it is fairly persistent and is generally made up of three or four very thin coal beds separated by rooted clay. At no place were any of the beds observed to be more than 14 in. (36 em) thick, but at least two adits enter one of the beds: one in the northwest quarter of the Louisa quadrangle and one on the north edge of the Blaine quadrangle (fig. liB). In the Mazie quadrangle, just west of the
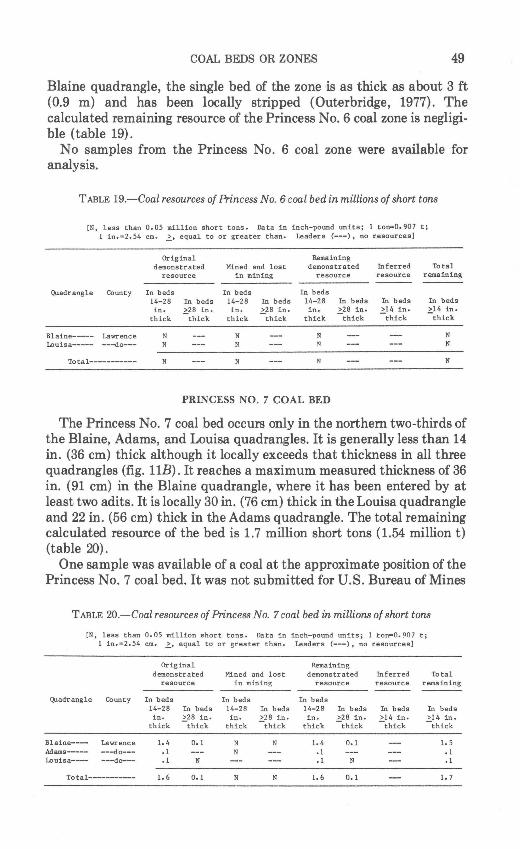
COAL BEDS OR ZONES 49
Blaine quadrangle, the single bed of the zone is as thick as about 3ft (0.9 m) and has been locally stripped (Outerbridge, 1977). The calculated remaining resource of the Princess No.6 coal zone is negligible (table 19).
No samples from the Princess No. 6 coal zone were available for analysis.
TABLE 19.-Coal resources of Princess No. 6 coal bed in millions of short tons
[N, less than 0.05 million short tons. Data in inch-pound units; 1 ton-0.907 t; 1 in.a2,54 em. ~. equal to or greater than. Leaders (---), no resources]
Original Remaining demonstrated Mined and lost demonstrated Inferred Total
resource in mining resource resource remaining
Quadrangle County In beds In beds In beds 14-28 In beds 14-28 In beds 14-28 In beds In beds In beds in. ~28 in. in. >28 in. in. >28 in. >14 in. >14 in.
thick thick thick -thick thick -thick -thick -thick
Blaine----- Lawrence N N N N Louisa----- ---do--- N N N N
Total----------- N N N N
PRINCESS NO. 7 COAL BED
The Princess No.7 coal bed occurs only in the northern two-thirds of the Blaine, Adams, and Louisa quadrangles. It is generally less than 14 in. (36 em) thick although it locally exceeds that thickness in all three quadrangles (fig. 11B). It reaches a maximum measured thickness of 36 in. (91 em) in the Blaine quadrangle, where it has been entered by at least two adits. It is locally 30 in. (76 em) thick in the Louisa quadrangle and 22 in. (56 em) thick in the Adams quadrangle. The total remaining calculated resource of the bed is 1.7 million short tons (1.54 million t) (table 20).
One sample was available of a coal at the approximate position of the Princess No. 7 coal bed. It was not submitted for U.S. Bureau of Mines
TABLE 20.-Coal resources of Princess No. 7 coal bed in millions of short tons
[N, less than 0.05 million short tons. Data in inch-pound units; 1 tonm0,907 t; 1 in.-2.54 em. ~. equal to or greater than. Leaders (---), no resources]
Original Remaining demonstrated Mined and lost demonstrated Inferred Total
resource in mining resource resource remaining
Quadrangle County In beds In beds In beds 14-28 In beds 14-28 In beds 14-28 In beds In beds In beds in. ~28 in. in. >28 tn. in. >28 in. >14 in. >14 in.
thick thick thick -thick thick -thick -thick -thick
Blaine---- Lawrence 1. 4 0.1 N N 1. 4 0.1 1. 5 Adams----- ---do--- .1 N .1 .1 Louisa---- ---do--- .1 N .1 N .1
To tal----------- 1. 6 0.1 N N 1.6 0.1 1. 7
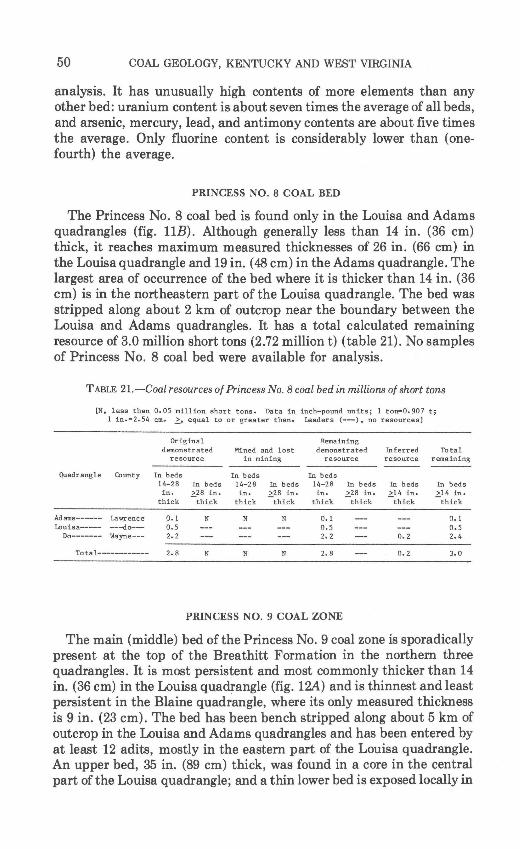
50 COAL GEOLOGY, KENTUCKY AND WEST VIRGINIA
analysis. It has unusually high contents of more elements than any other bed: uranium content is about seven times the average of all beds, and arsenic, mercury, lead, and antimony contents are about five times the average. Only fluorine content is considerably lower than (onefourth) the average.
PRINCESS NO. 8 COAL BED
The Princess No.8 coal bed is found only in the Louisa and Adams quadrangles (fig. 11B). Although generally less than 14 in. (36 em) thick, it reaches maximum measured thicknesses of 26 in. (66 em) in the Louisa quadrangle and 19 in. (48 em) in the Adams quadrangle. The largest area of occurrence of the bed where it is thicker than 14 in. (36 em) is in the northeastern part of the Louisa quadrangle. The bed was stripped along about 2 km of outcrop near the boundary between the Louisa and Adams quadrangles. It has a total calculated remaining resource of 3.0 million short tons (2.72 million t) (table 21). No samples of Princess No. 8 coal bed were available for analysis.
TABLE 21.-Coal resources of Princess No. 8 coal bed in millions of short tons
[N, less than 0.05 million short tons. Data in inch-pound units; 1 ton=0.907 t; 1 in.=2.54 em. ~. equal to or greater than. Leaders (---), no resources)
Original Remaining demonstrated Mined and lost demonstrated Inferred Total
resource in mining resource resource remaining
Quadrangle County In beds In beds In beds 14-28 In beds 14-28 In beds 14-28 In beds In beds In beds in. ~28 in. in. ~28 in. in. >28 in. >14 in. ~14 in.
thick thick thick thick thick -thick -thick thick
Adams------ Lawrence 0.1 N N N 0.1 0.1 Louisa----- ---do--- o.s o.s o. 5
Do------- Wayne--- 2. 2 2. 2 o. 2 2. 4
To tal------------ 2. 8 N N N 2. 8 o. 2 3.0
PRINCESS NO. 9 COAL ZONE
The main (middle) bed of the Princess No.9 coal zone is sporadically present at the top of the Breathitt Formation in the northern three quadrangles. It is most persistent and most commonly thicker than 14 in. (36 em) in the Louisa quadrangle (fig. 12A) and is thinnest and least persistent in the Blaine quadrangle, where its only measured thickness is 9 in. (23 em). The bed has been bench stripped along about 5 km of outcrop in the Louisa and Adams quadrangles and has been entered by at least 12 adits, mostly in the eastern part of the Louisa quadrangle. An upper bed, 35 in. (89 em) thick, was found in a core in the central part of the Louisa quadrangle; and a thin lower bed is exposed locally in
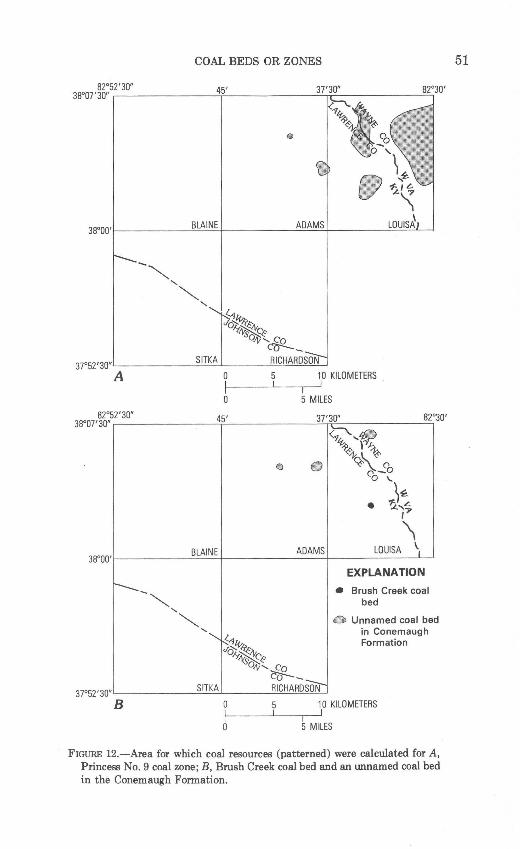
COAL BEDS OR ZONES
38o00~1--------=B.:::.LA:.:..:IN..:.:E+-____ ___:_A::::.DA:...::M..::.:S4------==~~
37052130"L ____ _:S~IT~K~A L--~~[Qgl!i] A 0 5 10 KILOMETERS
5 MILES
I 45 1 37130"
<'1 ''(!!> %~ \~ 1-o~~
<;) • ~ Q o-o 0 \.
~~ • ~ ..... £. ,7
\ BLAINE ADAMS LOUISA \ I
EXPLANATION
!---_""' • Brush Creek coal bed
.......
""' db Unnamed coal bed
.................
R<1ip, in Conemaugh
J~~ Formation
IVs: c~ o,y, co ey__ SITKA RICHARIJW
1 0 KILOMETERS
5 MILES
FIGURE 12.-Area for which coal resources (patterned) were calculated for A, Princess No.9 coal zone; B, Brush Creek coal bed and an unnamed coal bed in the Conemaugh Formation.
51
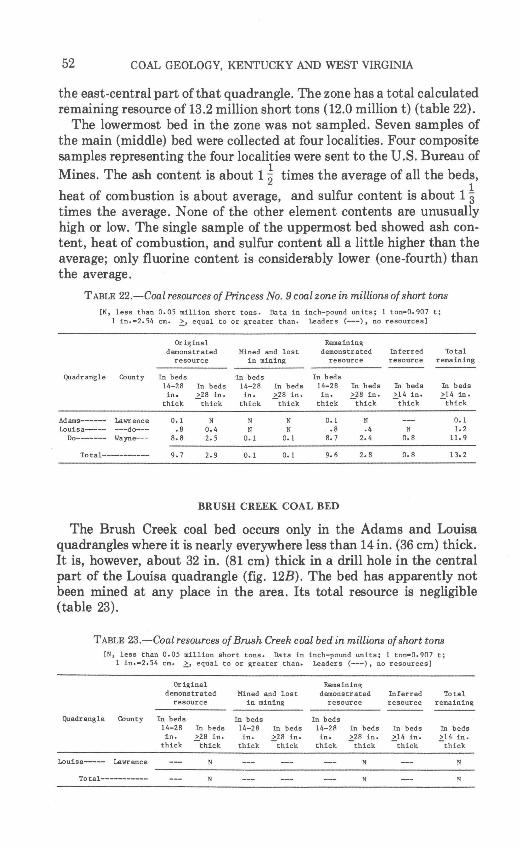
52 COAL GEOLOGY, KENTUCKY AND WEST VIRGINIA
the east-central part of that quadrangle. The zone has a total calculated remaining resource of 13.2 million short tons (12.0 million t) (table 22).
The lowermost bed in the zone was not sampled. Seven samples of the main (middle) bed were collected at four localities. Four composite samples representing the four localities were sent to the U.S. Bureau of Mines. The ash content is about 1 ~ times the average of all the beds,
heat of combustion is about average, and sulfur content is about 1 ~ times the average. None of the other element contents are unusually high or low. The single sample of the uppermost bed showed ash content, heat of combustion, and sulfur content all a little higher than the average; only fluorine content is considerably lower (one-fourth) than the average.
TABLE 22.-Coal resources of Princess No. 9 coal zone in millions of short tons
[N, less than 0.05 million short tons. Data in inch-pound units; 1 ton=0.907 t; 1 in.=2.54 em. ~. equal to or greater than. Leaders (---), no resources]
Original Remaining demonstrated Mined and lost demonstrated Inferred Total
resource in mining resource resource remaining
Quadrangle County In beds In beds In beds 14-28 In beds 14-28 In beds 14-28 In beds In beds In beds in. ~28 in. in. ~28 in. in. ~28 in. >14 in. >14 in.
thick thick thick thick thick thick -thick -thick
Adams------ Lawrence 0.1 N N N 0.1 N 0.1 Louisa----- ---do--- .8 0.4 N N . • 8 .4 N 1. 2
Do------- Wayne--- 8.8 2. 5 0.1 0.1 8. 7 2.4 0.8 ll. 9
To tal----------- 9. 7 2. 9 0.1 0.1 9.6 2. 8 0.8 13.2
BRUSH CREEK COAL BED
The Brush Creek coal bed occurs only in the Adams and Louisa quadrangles where it isnearly everywhere less than 14 in. (36 em) thick. It is, however, about 32 in. (81 em) thick in a drill hole in the central part of the Louisa quadrangle (fig. 12B). The bed has apparently not been mined at any place in the area. Its total resource is negligible (table 23).
TABLE 23.-Coal resources of Brush Creek coal bed in millions of short tons [N, less than 0.05 million short tons. Data in inch-pound units; 1 ton•0.907 t;
1 in.=2.54 em. ~. equal to or greater than. Leaders (---), no resources]
Quadrangle County
Louisa----- Lawrence
To tal-----------
Original demonstrated
resource
In beds 14-28 In beds in. >28 in.
thick -thick
N
N
Mined and lost in mining
In beds 14-28 In beds in. >28 in.
thick -thick
Remaining demonstrated Inferred Total
resource resource remaining
In beds 14-28 In beds In beds In beds in. >28 in. >14 in. >14 in.
thick -thick -thick -thick
N N
N N
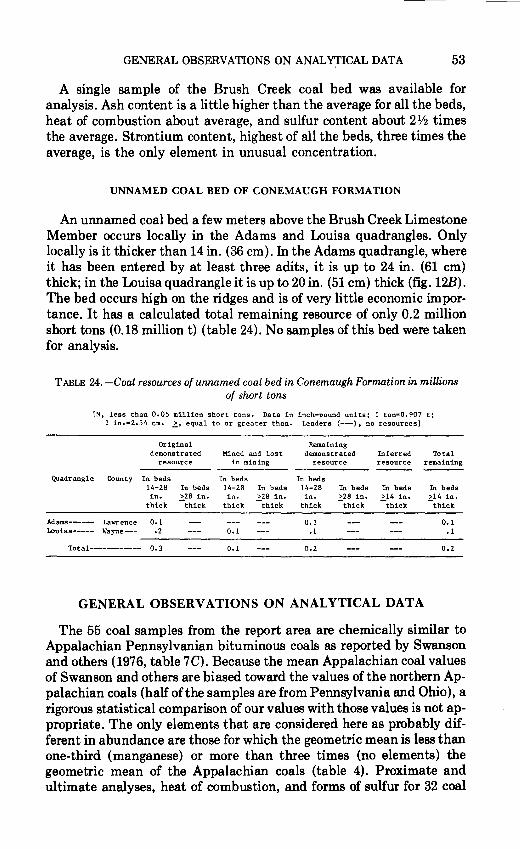
GENERAL OBSERVATIONS ON ANALYTICAL DATA 53
A single sample of the Brush Creek coal bed was available for analysis. Ash content is a little higher than the average for all the beds, heat of combustion about average, and sulfur content about 21/2 times the average. Strontium content, highest of all the beds, three times the average, is the only element in unusual concentration.
UNNAMED COAL BED OF CONEMAUGH FORMATION
An unnamed coal bed a few meters above the Brush Creek Limestone Member occurs locally in the Adams and Louisa quadrangles. Only locally is it thicker than 14 in. (36 em). In the Adams quadrangle, where it has been entered by at least three adits, it is up to 24 in. (61 em) thick; in the Louisa quadrangle it is up to 20 in. (51 em) thick (fig. 12B). The bed occurs high on the ridges and is of very little economic importance. It has a calculated total remaining resource of only 0.2 million short tons (0.18 million t) (table 24). No samples of this bed were taken for analysis.
TABLE 24.-Coal resources of unnamed coal bed in Conemaugh Formation in millions of short tons
[N, less than 0.05 million short tons. Data in inch-pound units; 1 tons0,907 t; 1 in.~2.54 em. 2:_, equal to or greater than. Leaders (---), no resources]
Original Remaining demonstrated Mined and lost demonstrated Inferred Total
resource in mining resource resource remaining
Quadrangle County In beds In beds In beds 14-28 In beds 14-28 In beds 14-28 In beds In beds In beds in. 2:_28 in. in. >28 in. in. >28 in. 2:_14 in. >14 in.
thick thick thick -thick thick -thick thick -thick
Adams------ Lawrence 0.1 0.1 0.1 Louisa----- Wayne--- .2 0.1 .1 .1
Total------------ 0.3 0.1 0.2 0.2
GENERAL OBSERVATIONS ON ANALYTICAL DATA
The 55 coal samples from the report area are chemically similar to Appalachian Pennsylvanian bituminous coals as reported by Swanson and others (1976, table 7C). Because the mean Appalachian coal values of Swanson and others are biased toward the values of the northern Appalachian coals (half of the samples are from Pennsylvania and Ohio), a rigorous statistical comparison of our values with those values is not appropriate. The only elements that are considered here as probably different in abundance are those for which the geometric mean is less than one-third (manganese) or more than three times (no elements) the geometric mean of the Appalachian coals (table 4). Proximate and ultimate analyses, heat of combustion, and forms of sulfur for 32 coal
54 COAL GEOLOGY, KENTUCKY AND WEST VIRGINIA
samples in the report area are similar to those reported by Swanson and others (1976, table 7A).
Sampling limitations were discussed in the previous section, "Coal Beds and Zones." For the report area, analytical data were examined and, where the distribution was considered adequate, statistically tested for stratigraphic and geographic trends.
Detailed analytical data are given in tables 25, 26, and 27 of this report, on pages 58--69 following "References Cited."
STRATIGRAPHIC TRENDS
Coal beds in the upper and lower parts of the stratigraphic section were compared for differences in trace-element contents and U.S. Bureau of Mines analyses by means of the statistical "t-test." The division between the upper and lower parts is placed at the base of the Peach Orchard coal zone, which is approximately at the boundary between the upper and lower delta plain environments. (See "Interpretation of Depositional History.") All the trace-element contents were tested using coal-bed geometric means (table 6). The Bureau of Mines analyses were tested using coal-bed arithmetic means (table 5). The tests were made both including and excluding the Fire Clay rider coal bed, the extremely high ash content (32.5 percent) of which could strongly influence the abundance of some elements.
The results show that the stratigraphically higher coal beds taken as a whole (with the Fire Clay rider coal bed excluded from the test) have higher contents of total and pyritic sulfur, as percent of total sulfur, of iron (at the 95 percent probability level), and of arsenic and mercury (at the 90 percent probability level) than do the lower coal beds. Ash content, although not significantly higher in the upper beds at the levels considered (90 and 95 percent), is significantly higher at the 80 percent level. With the Fire Clay rider coal bed included in the test, only moisture and mercury have significantly higher values (90 percent probability level).
The lower coal beds taken as a whole, with the Fire Clay rider coal bed excluded from the test, have higher organic sulfur contents, a higher heat of combustion, and more nitrogen and carbon (at the 95 percent probability level) and greater moisture and sodium contents (90 percent probability level). With the Fire Clay rider coal bed included in the test, heat of combustion is higher in the lower part of the section at the same probability level (95 percent), organic sulfur content at a lower level (90 percent), and sodium content at a higher level (95 percent).
It was observed that with the boundary between the upper and lower parts of the stratigraphic sequence placed higher, between the Broas and Richardson coal zones, the differences in forms of sulfur (as percent of total sulfur) are even more significant (99.9 percent probability
GENERAL OBSERVATIONS ON ANALYTICAL DATA 55
level). From the Richardson zone upward, without exception, the coal beds have more pyritic sulfur. From below the Richardson, excepting the unusual Fire Clay rider coal bed, the beds have more organic sulfur. (See table 5.)
Heat of combustion may be higher in beds in the lower part of thesequence because of the greater depth of burial, and sodium content may be higher because the lower delta plain would have had greater marine influence than the upper delta plain. The reason for the greater amount of organic sulfur in coal beds interpreted to have been deposited in the lower delta plain environment is not known, nor is it known why more total sulfur and pyritic sulfur occur in beds interpreted to have been deposited in the upper delta and alluvial plain. The greater amount of iron, arsenic, and mercury in the upper coal beds is related to the higher percentages of pyrite (as indicated by pyritic sulfur) in those beds.
The significantly higher percentages of pyritic sulfur in the interpreted upper delta plain coal beds than in the lower delta plain coal beds, is in contradiction to the findings of Caruccio and others (1977). For their larger study area they stated {p. 61) that "in general * * * greater percentages of framboidal pyrite, combined with a greater percentage of pyritic sulfur, occur in lower delta plain sequences * * * ." Although we have no direct data on framboidal pyrite for our area, the above statement on the association of pyritic sulfur and framboidal pyrite suggests that more framboidal pyrite may be present in the upper delta plain coal beds in our area. A correlation coefficient run on Caruccio and others' raw data (1977, table A-2, cols. 7 and 9) shows that a high correlation, 99 percent probability level, does indeed occur between the percentage of pyritic sulfur and the percentage of framboidal pyrite. It is possible, however, that the relatively high percentage of pyrite in the upper beds in this report area is postdiagenetic and has no relation to depositional environments. If so, the percentages offramboidal pyrite in the upper beds would probably be relatively low.
GEOGRAPHIC TRENDS
The number of samples and their distribution were considered amenable to testing for geographic trends only for the Richardson coal zone and the Fire Clay rider coal bed.
Eight of the nine Richardson samples occur fortuitously in a linear pattern about 29 km long across the northern part of the report area (fig. 5, locs. 1, 5-7, 12, 20, 22, 23) in a generally land to sea (southeast to northwest) orientation. Correlation coefficients were determined for the analytical data (tables 25, 26) versus distance along the line. For the U.S. Bureau of Mines analyses, correlation coefficients were significant at the 95 percent probability level only for ash (as-received basis, raw data), which, as might be expected, increases in the source direction.
56 COAL GEOLOGY, KENTUCKY AND WEST VIRGINIA
For the element data (whole-coal basis, log transformed), correlation coefficients were fiignificant at the 95 percent level for more than onethird of the elements tested. Increasing in the source direction are silicon, magnesium, sodium, potassium, and copper contents. Increasing in the seaward direction are calcium, iron, titanium, mercury, boron, germanium, and molybdenum contents. Sulfur and arsenic contents exhibit a tendency to increase in the seaward direction, but at lower levels of probability.
The 10 Fire Clay rider coal bed samples occur in a linear pattern about 23 km long almost perpendicular to the line of Richardson coal zone samples and therefore generally paralleling the paleoshoreline (fig. 5, locs.13-17, 34, 35, 39, 40, 29). Because ofthisorientation, few significant correlations of analytical data versus distance along the line were expected. As only four of the samples were analyzed by the U.S. Bureau of Mines, correlation coefficients for those data were not determined. For the element data (whole-coal basis, log transformed) only manganese showed a correlation at the 95 percent probability level, increasing northeastward, for an unknown reason.
REFERENCES CITED
Carlson, J. E., 1971, Geologic map ofthe Webbville quadrangle, eastern Kentucky: U.S. Geological Survey Geologic Quadrangle Map GQ-927.
Caruccio, F. T., Ferm, J. C., Home, John, Geidel, Gwendelyn, and Baganz, Bruce, 1977, Paleoenvironment of coal and its relation to drainage quality: U.S. Environmental Protection Agency, Interagency Energy-Environment Research and Development Program Report, 108 p.
Connor, C. W., 1975, Graphic lithologic logs of four U.S. Geological Survey cores of Carboniferous rocks, Lawrence County, Kentucky: U.S. Geological Survey Open-File Report 75-316, 15 p.
Connor, C. W., and Flores, R. M., 1978, Geologic map of the Louisa quadrangle, Kentucky-West Virginia: U.S. Geological Survey Geologic Quadrangle Map GQ-1462.
Crandall, A. R., 1905, The coals of the Big Sandy valley south of Louisa and between Tug Fork and the headwaters of the North Fork of Kentucky River: Kentucky Geological Survey Bulletin 4, 141 p.
Ferm, J. C., 197 4, Carboniferous environmental models in eastern United States and their significance, in Carboniferous of the southeastern United States: Geological Society of America Special Paper 148, p. 79-95.
Ferm, J. C., Horne, J. C., Swinchatt, J.P., and Whaley, P. W., 1971, Carboniferous depositional environments in northeastern Kentucky: Geological Society of Kentucky, 30 p.
Flores, R. M., 1978, Petrographic differentiation of depositional environments of sandstones of the Breathitt Formation, northeastern Kentucky and southwestern West Virginia: U.S. Geological Survey Journal of Research, v. 6, no. 5, p. 593-602.
Hauser, R. E., 1953, Geology and mineral resources of the Paintsville [15 minute] quadrangle, Kentucky: Kentucky Geological Survey, ser. 9, Bulletin 13, 80 p.
REFERENCES CITED 57
Hayes, P. T., 1977, Geologic map of the Sitka quadrangle, Johnson and Lawrence Counties, Kentucky: U.S. Geological Survey Geologic Quadrangle Map GQ-1398.
Henry, T. W., and Schweinfurth, S. P., 1977, Upper Penns'ylvanian Series, in Englund and others, A field guide to proposed Pennsylvanian System stratotype, West Virginia: AAPG/SEPM, p. 16-20.
Home, J. C., and Ferm, J. C., [1976], Carboniferous depositional environments in the Pocahontas Basin, eastern Kentucky and southern West Virginia, a field guide: University of South Carolina, 129 p.
Horne, J. C., Ferm, J. C., and Swinchatt, J.P., 1974, Depositional model for the Mississippian-Pennsylvanian boundary in northeastern Kentucky, in Car,boniferous of the southeastern United States: Geological Society of America Special Paper 148, p. 97-114.
Huddle, J. W., Lyons, E. J., Smith, H. L., and Ferm, J. C., 1963, Coal reserves of eastern Kentucky: U.S. Geological Survey Bulletin 1120, 247 p.
Hudnall, J. S., and Pirtle, G. W., 1926, Structural geologic map of Lawrence County, Kentucky: Kentucky Geological Survey, ser. 6 (reprinted without revision as Kentucky Geological Survey, ser. 9, 1949).
Jenkins, E. C., 1966, Geologic map of the Milo quadrangle, Kentucky-West Virginia and the part of the Webb quadrangle in Kentucky: U.S. Geological Survey Geologic Quadrangle Map GQ-543.
Jillson, W. R., 1919, The Kendrick Shale-A new calcareous horizon in the Coal Measures of eastern Kentucky: Kentucky Department of Geology and Forestry, Mineral and Forest Resources of Kentucky, ser. 5, v. 1, no. 2, p. 96-104.
Outerbridge, W. F., 1964, Geologic map of the Offutt quadrangle, Kentucky: U.S. Geological Survey Geologic Quadrangle Map GQ-348.
__ 1966, Geologic map of the Paintsville quadrangle, Johnson and Floyd Counties, Kentucky: U.S. Geological Survey Geologic Quadrangle Map GQ-495.
___ 1977, Geologic map of the Mazie quadrangle, eastern Kentucky, U.S. Geological Survey Geologic Quadrangle Map GQ-1388.
Phalen, W. C., 1912, Description of the Kenova quadrangle [Kentucky-West Virginia-Ohio]: U.S. Geological Survey Geologic Atlas, Folio 184.
Pillmore, C. L., and Connor, C. W., 1978, Geologic map of the Blaine quadrangle, Lawrence County, Kentucky: U.S. Geological Survey Geologic Quadrangle Map GQ-1507.
Rice, C. L., 1968, Geologic map of the Redbush quadrangle, eastern Kentucky: U.S. Geological Survey Geologic Quadrangle Map GQ-708.
Sanchez, J.D., Alvord, D. C., and Hayes, P. T., 1978, Geologic map of the Richardson quadrangle, Lawrence and Johnson counties, Kentucky: U.S. Geological Survey Geologic Quadrangle Map GQ-1460.
Sharps, J. A., 1967, Geologic map of the Fallsburg quadrangle, Kentucky-West Virginia and the Prichard quadrangle in Kentucky: U.S. Geological Survey Geologic Quadrangle Map GQ-584.
Swanson, V. E., Medlin, J. H., Hatch, J. R., Coleman, S. L., Wood, G. H., Jr., Woodruff, S. D., Hildebrand, R. T., 1976, Collection, chemical analysis, and evaluation of coal samples in 1975: U.S. Geological Survey Open-File Report 76-468, 503 p.
U.S. Bureau of Mines and U.S. Geological Survey, 1976, Coal resource classification system of the U.S. Bureau of Mines and U.S. Geological Survey: U.S. Geological Survey Bulletin 1450-B, p. B1-B7.
Ward, D. E., 1978, Geologic map of the Adams quadrangle, Lawrence County, Kentucky: U.S. Geological Survey Geologic Quadrangle Map GQ-1489.
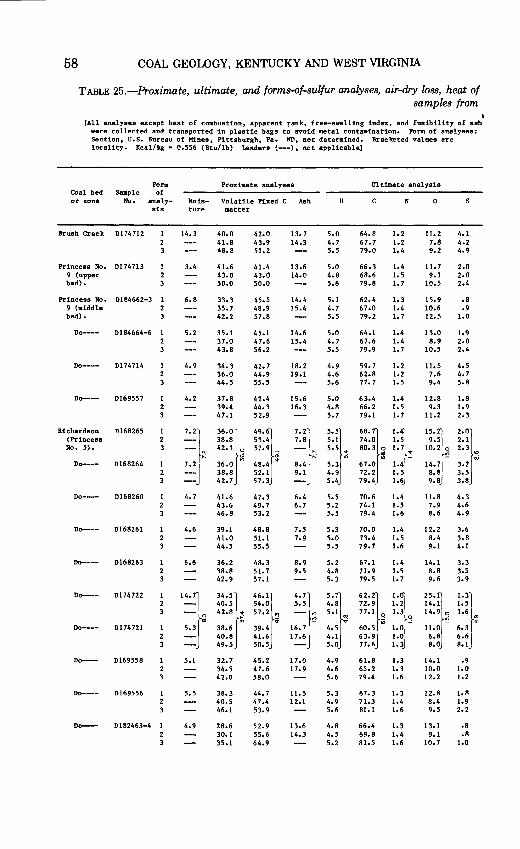
58 COAL GEOLOGY, KENTUCKY AND WEST VIRGINIA
TABLE 25.-Proximate, ultimate, and forms-of-sulfur analyses, air-dry loss, heat of samples from
t [All analyses except heat of combustion, apparent rank, free-swelling index, and fusibility of ash
were collected and transported in plastic bags to avoid metal contamination. Form of analyses: Section, u.s. Bureau of Mines, Pittsburgh, Pa. ND, not determined. Brae keted values are locality. Kcal/kg • 0.556 (Btu/lb) Leaders (--), not applicable]
Form Proximate analyses Ultimate analysis Coal bed Sample of or zone No. analy- Mois- Volatile Fixed C Ash H N 0
sis ture matter
Brush Creek D174712 14.3 40.0 42.0 13.7 5.0 64.8 1.2 11.2 4.1 41.8 43.9 14.3 4. 7 67.7 1.2 7.8 4.2 48.8 51.2 5.5 79.0 1.4 9.2 4.9
Princess No. D174713 3.4 41.6 41.4 13.6 5.0 66.3 1.4 11.7 2.0 9 (upper 43.0 43.0 14.0 4.8 68.6 1.5 9.1 2.0 bed). 50.0 50.0 5.6 79.8 1.7 10.5 2.4
Princess No. D184662-3 6.8 33.3 45.5 14.4 5.1 62.4 1.3 15.9 .8 9 (middle 35.7 48.9 15.4 4.7 67.0 1.4 10.6 .9 bed). 42.2 57.8 5.5 79.2 1. 7 12.5 1.0
Do---- D184664-6 5.2 35.1 45.1 14.6 5.0 64.1 1.4 13.0 1.9 37.0 47.6 15.4 4. 7 67.6 1.4 8.9 2.0 43.8 56.2 5.5 79.9 1. 7 10.5 2.4
Do--- D174714 4.9 34.3 42.7 18.2 4.9 59.7 1.2 11.5 4.5 36.0 44.9 19.1 4.6 62.8 1.2 7.6 4. 7 44.5 55.5 5.6 77.7 1.5 9.4 5.8
Do--- D169557 4.2 37.8 42.4 15.6 5.0 63.4 1.4 12.8 1.8 39.4 44.3 16.3 4.8 66.2 1.5 9.3 1.9 4 7.1 52.9 5. 7 79.1 1. 7 11.2 2.3
Richardson D168265 1 '·} ~-·} "·'} '·'} '·} "·~ '·~ "·~ '·l (Princess 2 38.8 53.4 7.8 5.1 74.0 1.5 9.5 2.1 No. 5). 3 42.1 ~ 57.9 - - ... 5.5 ;:'; 80.3 ;g 1. 7 "": 10.2 ~ 2.3 "'
oi ,.: 3.2 N Do--- D168264 7.2 36.0 48.4 ~ 8.4 5.3 67.0 1.4 14.7
38.8 52.1 9.1 4.9 72.2 1.5 8.8 3.5 42.7 57.3 5.4 79.4 1.6 9.8 3.8
Do---- D168260 4. 7 41.6 47.3 6.4 5.5 70.6 1.4 11.8 4.3 43.6 49.7 6. 7 5.2 74.1 1.5 7.9 4.6 46.8 53.2 5.5 79.4 1.6 8.6 4.9
Do--- D168261 4.6 39.1 48.8 7.5 5.3 70.0 1.4 12.2 3.6 41.0 51.1 7.9 5.0 73.4 1. 5 8.4 3.8 44.5 55.5 5.5 79.7 1.6 9.1 4.1
Do--- D168263 6.6 36.2 48.3 8.9 5.2 67.1 1.4 14.1 3.3 38.8 51.7 9.5 4.8 71.9 1.5 8.8 3.5 42.9 57.1 5.3 79.5 1. 7 9.6 3.9
Do--- D174722 "·} "·'} "·'} .. '} '·J "·'} '·~ "·'} '·l 40.5 54.0 5.5 4.8 72.9 1.2 14.1 1.5 42.8 ~ 57.2 ~ --,.., 5.1 "' 77.1 ~ 1.3 3 14.9 ~ 1.6
16.7 ~ ..= ~ Do-- D174721 5.3 38.6 39.4 4.5 60.5 1.0 ll.O 6.3
40.8 41.6 17.6 4.1 63.9 1.0 6.8 6.6 49.5 50.5 5.0 77.6 1. 3 s.o 8.1
Do--- D169558 5.1 32.7 45.2 17.0 4.9 61.8 1.3 14.1 .9 34.5 47.6 17.9 4.6 65.2 1. 3 10.0 1.0 42.0 58.0 5.6 79.4 1.6 12.2 1.2
Do--- D169556 5.5 38.3 44.7 ll.5 5.3 67.3 1.3 12.8 1.8 40.5 47.4 12.1 4.9 71.3 1.4 8.4 1.9 46.1 53.9 5.6 81.1 1.6 9.5 2.2
Do--- D182463-4 4.9 28.6 52.9 13.6 4.8 66.4 1.3 13.1 .8 30.1 55.6 14.3 4.5 69.8 1.4 9.1 .8 35.1 64.9 5.2 81.5 1.6 10.7 1.0
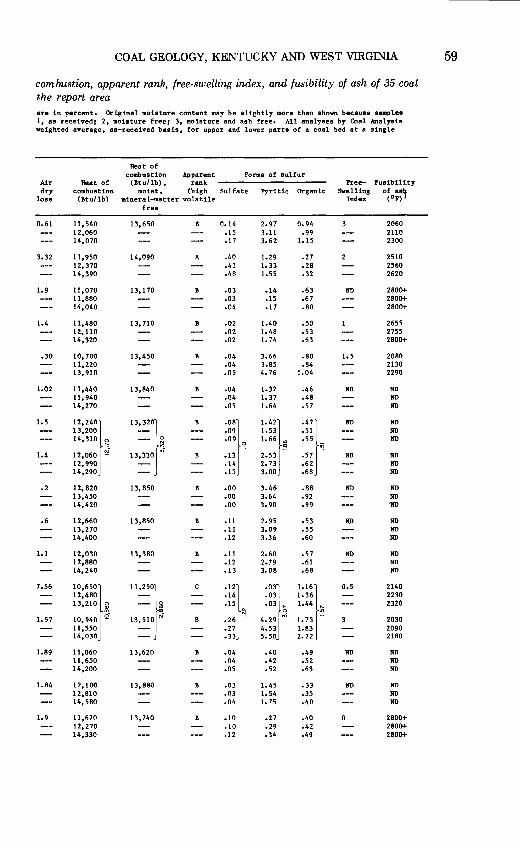
COAL GEOLOGY, KENTUCKY AND WEST VIRGINIA 59
combustion, apparent rank, free-swelling index, and fusibility of ash of 35 coal the report area are in percent. Original moisture content may be slightly more than shown because samples 1, as received; 2, moisture free; 3, moisture and ash free. All analyses by Coal Analysis weighted average, as-received basis, for upper and lower parts of a coal bed at a single
Heat of combustion Apparent Forms of sulfur
Air Heat of (Btu/lb), rank Free- Fusibility dry combustion moist, (high Sulfate Pyritic Organic Swelling of ash
loss (Btu/lb) miners l-1Datter volatile Index (OF) 1
free
0.61 11,540 13,650 0.14 2.97 0.94 2060 12,060 .15 3.11 .99 2110 14,070 .17 3.62 1.15 2300
3.32 11,950 14,090 A .40 1.29 .27 2510 12,370 .41 1.33 .2S 2560 14,390 .4S 1.55 .32 2620
1.9 11,070 13,170 .03 .14 .63 ND 2SOO+ 11,SSO .03 .15 .67 2SOO+ 14,040 .04 .17 .so 2SOO+
1.4 11,4SO 13,710 .02 1.40 .so 2655 12,110 .02 1.4S .53 2755 14,320 .02 1. 74 .63 2SOO+
.30 10,700 13,450 B .04 3.66 .so 1.5 20SO 11,220 .04 3.S5 .S4 2130 13,910 .05 4. 76 1.04 2290
1.02 11,440 13,S40 .04 1.32 .46 ND ND 11,940 .04 1.37 .4S ND 14,270 .05 1.64 .57 ND
1.5 12,240} "~} ·"1 '·'] ·"I
ND ND 13,200 .09 1.53 .51 ND 14,310 g_ .09 ~ 1.66 ; .55 ND
~ 1.4 12,060 £:! 13,330 !2 .13 2.53 .57 ND ND
12,990 .14 2. 73 .62 ND 14,290 .15 3.00 .6S ND
.2 12, S20 13, S50 .oo 3. 46 .ss ND ND 13,450 .oo 3.64 .92 ND 14,420 .oo 3.90 .99 -ND
.6 12,660 13,S50 B .11 2.95 .53 ND ND 13,270 .11 3.09 .55 ND 14,400 .12 3.36 .60 ND
1.1 12,030 13,3SO .11 2.60 .57 ND ND 12,SSO .12 2.79 .61 ND 14,240 .13 3.0S .6S ND
7.56 10,650}
"~1~ ·"} ·"} '·"} 0.5 2140
12,4SO .14 .03 1.36 2230
13,210 ~- .15 .03 q 1.44 ~ 2320 N N
1.57 10,940 Q 13,510 £:! B .26 . 4. 29 "' 1. 73 2030 11,550 .27 4.53 1.S3 2090 14,030 .33 5.50 2.22 21SO
1.S9 11,060 13,620 .04 .40 .49 ND ND 11,650 .04 .42 .52 ND 14,200 .05 .52 .63 ND
1.84 12,100 13,880 B .03 1.45 .33 ND ND 12,810 .03 1.54 .35 ND 14,580 .04 1. 75 .40 ND
1.9 11,670 13,740 .10 .27 .40 2800+ 12,270 .10 .29 .42 2800+ 14,330 .12 .34 .49 2800+
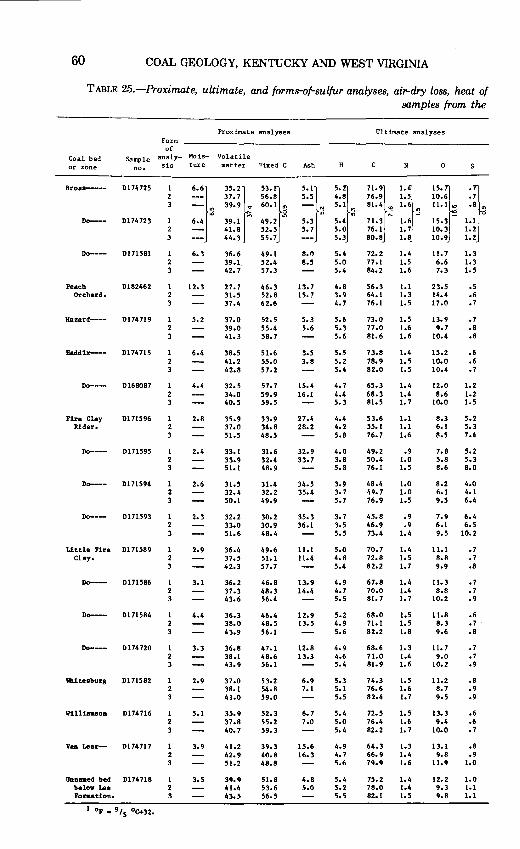
60 COAL GEOLOGY, KENTUCKY AND WEST VIRGINIA
TABLE 25.-Proximate, ultimate, and forms-of-sulfur analyses, ai~dry loss, heat of samples from the
Proximate analyses Ultimate analyses Form of
Coal bed Sample analy- Mois- Volatile or zone sis ture matter Fixed C Ash H N 0
Broas--- D174725
~}- "·'} "·'} '·'} '·~ 11.} 1.~ "·~ 37.7 56.8 5.5 4.8 76.9 1.5 10.6 } 39.9 ~ 60.1 g - N 5.1 "' 81.4 ~ 1.6 ~ 11.1 ~ .a "! ..; ,; .,;
Do-- D174723 6.4 39.1 49.2 5.3 5.4 71.3 1.6 15.3 1.1 41.8 52.5 5. 7 5.0 76.1 1. 7 10.3 1.2 44.3 55.7 5.3 80.8 1.8 10.9 1.2
Do--- D171581 6.3 36.6 49.1 8.0 5.4 72.2 1.4 11.7 1.3 39.1. 52.4 8.5 5.0 77.1 1.5 6.6 1.3 42.7 57.3 5.4 84.2 1.6 7.3 1.5
Peach D182462 12.3 27.7 46.3 13.7 4.8 56.3 1.1 23.5 .5 Orchard. 31.5 52.8 15.7 3.9 64.1 1.3 14.4 .6
37.4 62.6 4.7 76.1 1.5 17.0 .7
Hazard--- D174719 5.2 37.0 52.5 5.3 5.6 73.0 1.5 13.9 .7 39.0 55.4 5.6 5.3 77.0 1.6 9. 7 .8 41.3 58.7 5.6 81.6 1.6 10.4 .8
Haddix-- Dl74715 6.4 38.5 51.6 3.5 5.5 73.8 1.4 15.2 .6 41.2 55.0 3.8 5.2 78.9 1.5 10.0 .6 42.8 57.2 5.4 82.0 1.5 10.4 .7
Do--- D168087 4.4 32.5 57.7 15.4 4. 7 65.3 1.4 12.0 1.2 34.0 59.9 16.1 4.4 68.3 1.4 8.6 1.2 40.5 59.5 5.3 81.5 1. 7 10.0 1.5
Fire Clay D171596 1 2.8 35.9 33.9 27.4 4.4 53.6 1.1 8.3 5.2 Rider. 2 37.0 34.8 28.2 4.2 55.1 1.1 6.1 5.3
3 51.5 48.5 5.8 76.7 1.6 8.5 7.4
Do--- D171595 2.4 33.1 31.6 32.9 4.0 49.2 .9 7.8 5.2 33.9 32.4 33.7 3.8 50.4 1.0 5.8 5.3 51.1 48.9 5.a 76.1 1.5 a.6 a.o
Do-- D171594 2.6 31.5 31.4 34.5 3.9 4a.4 1.0 a.2 4.0 32.4 32.2 35.4 3. 7 49.7 1.0 6.1 4.1 50.1 49.9 5.7 76.9 1.5 9.5 6.4
Do-- D171593 1 2.3 32.2 30.2 35.3 3. 7 45.a .9 7.9 6.4 2 33.0 30.9 36.1 3.5 46.9 .9 6.1 6.5 3 51.6 4a.4 5.5 73.4 1.4 9.5 10.2
Little Fire D171589 2.9 36.4 49.6 ll.1 5.0 70.7 1.4 ll.1 .7 Clay. 37.5 51.1 11.4 4.8 72.8 1.5 8.8 .7
42.3 57.7 5.4 82.2 1.7 9.9 .a
Do-- D171586 3.1 36.2 46.8 13.9 4.9 67.8 1.4 11.3 • 7 37.3 4a.3 14.4 4.7 70.0 1.4 a.a .7 43.6 56.4 5.5 a1. 7 1. 7 10.2 .9
Do-- D171584 4.4 36.3 46.4 12.9 5.2 6a.o 1.5 u.s .6 3a.o 48.5 13.5 4.9 71.1 1.5 a.3 • 7 43.9 56.1 5.6 82.2 1.8 9.6 .a
Do-- D174720 3.3 36.8 47.1 12.8 4.9 68.6 1.3 11.7 • 7 3a.1 4a.6 13.3 4.6 71.0 1.4 9.0 • 7 43.9 56.1 5.4 a1.9 1.6 10.2 .9
Whitesburg D1715a2 2.9 37.0 53.2 6.9 5.3 74.3 1.5 11.2 .a 38.1 54.8 7.1 5.1 76.6 1.6 a. 1 .9 41.0 59.0 5.5 a2.4 1. 7 9.5 .9
Williaason D174716 5.1 35.9 52.3 6. 7 5.4 72.5 1.5 13.3 .6 37.a 55.2 7.0 5.0 76.4 1.6 9.4 .6 40.7 59.3 5.4 82.2 1. 7 10.0 .7
Van Lear- D174717 3.9 41.2 39.3 15.6 4.9 64.3 1.3 13.1 .a 42.9 40.8 16.3 4. 7 66.9 1.4 9.a .9 51.2 48.a 5.6 79.9 1.6 11.9 1.0
Unn-ed bed D174718 1 3.5 39.9 51.a 4.a 5.4 75.2 1.4 12.2 1.0 below Lee 2 41.4 53.6 5.0 5.2 7a.o 1.4 9.3 1.1 Formation. 3 43.5 56.5 5.5 82.1 1.5 9.a 1.1
1 o, • 9 Is oC+32.
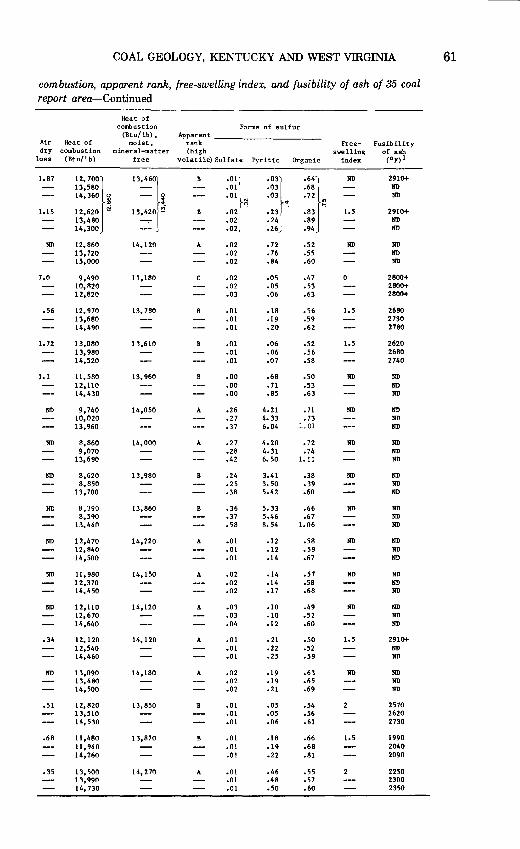
COAL GEOLOGY, KENTUCKY AND WEST VIRGINIA 61
combustion, apparent rank, free-swelling index, and fusibility of ash of 35 coal report area-Continued
Heat of combustion Forms of sulfur
(Btu/lb), Apparent Air Heat of moist, rank Free- Fusibility dry combustion mineral-matter (high swelling of ash
loss (Btu/lb) free volatile) Sulfate Pyritic Organic index (OF)l
1.87
12, "'} 13,461
'"} '"} ·"} ND 2910+-
13,580 .01 .03 .68 ND
14,360 ~ -- 0 .01 ~ .03 • 72 ., ND
"::'~ ...
"': 1.15 12,620 £:! .02 .23 .83 1.5 2910+
13,480 .02 .24 .89 ND 14,300 .02 .26 .94 ND
ND 12,860 14,120 A .02 • 72 .52 ND ND 13,720 .02 • 76 .55 ND 15,000 .02 .84 .60 ND
7.0 9,490 11,180 .02 .os .47 2800+ 10,820 .02 .05 .53 2800+ 12,820 .03 .06 .63 2800+
.56 12,970 13,780 .01 .18 .56 1.5 2680 13,680 .01 .19 .59 2730 14,490 .01 .20 .62 2780
1. 72 13,080 13,610 B .01 .06 .52 1.5 2620 13,980 .01 .06 .56 2680 14,520 .01 .07 .58 2740
1.1 11,580 13,960 .oo .68 .so ND ND 12,110 .oo .71 .53 ND 14,430 .oo .85 .63 ND
ND 9,740 14,050 A .26 4.21 .71 ND ND 10,020 .27 4. 33 • 73 ND 13,960 .37 6.04 1. 01 ND
ND 8,860 14,000 A .27 4.20 .72 ND ND 9,070 .28 4.31 • 74 ND
13,690 .42 6. so 1.11 ND
ND 8,620 13,980 B .24 3.41 .38 ND ND 8,850 .25 3. so .39 ND
13,700 .38 5.42 .60 ND
ND 8,390 13,860 .36 5.33 .66 ND ND 8,590 .37 5.46 .67 ND
13,440 .58 8.54 1.06 ND
ND 12,470 14,220 A .01 .12 .58 ND ND 12,1!40 .01 .12 • 59 ND 14,500 .01 .14 .67 ND
ND 11,980 14,150 A .02 .14 .57 ND ND 12,370 .02 .14 .58 ND 14,450 .02 .17 .68 ND
ND 12,110 14,120 A .03 .10 .49 ND ND 12,670 .03 .10 .52 ND 14,640 .04 .12 .60 ND
.34 12,120 14,120 A .01 • 21 .50 1.5 2910+-12,540 .01 .22 .52 ND 14,460 .01 .25 .59 ND
ND 13,090 14,180 A .02 .19 .63 ND ND 13,480 .02 .19 .65 ND 14,500 .02 .21 .69 ND
.51 12,820 13,850 B .01 .05 .54 2570 13,510 .01 .05 .56 2620 14,530 .01 .06 .61 2730
.68 11,480 13,870 B .01 .18 .66 1.5 1990 11,940 .01 .19 .68 2040 14,260 .01 .22 .81 2090
.35 13,500 14,270 A .01 .46 .55 2250 13,990 .01 .48 .57 2300 14,730 .01 .so .60 2350
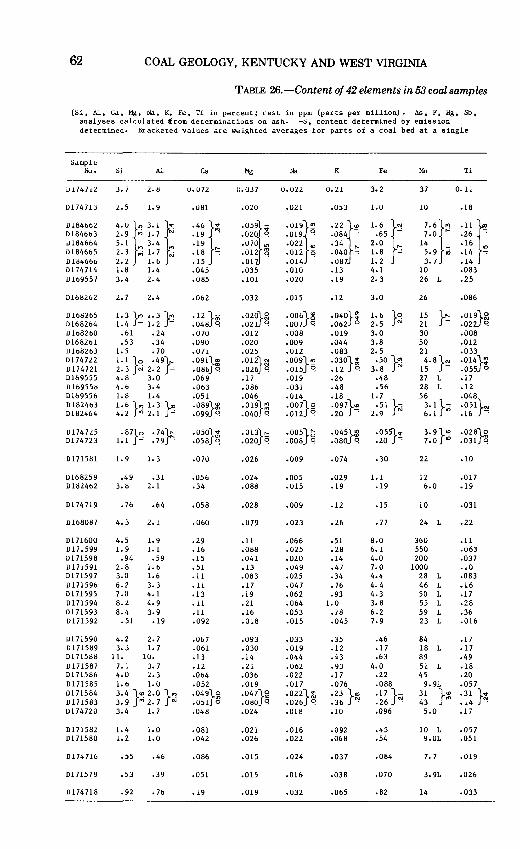
62 COAL GEOLOGY, KENTUCKY AND WEST VIRGINIA
TABLE 26.-Content of 42 elements in 53 coal samples
[Si, Al, Ca, Mg, Na, K, Fe, Ti in percent; rest in ppm (parts per million) • As, F, Hg, Sb, analyses calculated lfrom determinations on ash. -s, content determined by emission determined. Bracketed values are weighted averages for parts of a coal bed at a single
Samplto No. Si Al Ca Mg Na K Fe Mn Ti
lJ1747l2 j. 7 2. is 0.072 0.037 0.022 0.21 3.2 37 O.ll
0174713 2.5 1. 9 .081 .• 020 .021 .053 1.0 10 .18
0184662 ... rol r .. T ·"T .oT ·'T ~-· r '·T .u r 0184663 2. 9 "' 1. 7 .19 . .020 C! .019 C! .084 -: .65 7.0 1'- .26 . 0184664 5.1 "' 3. 4 "' .19 .070 I() .022 ID .34 1'- 2.0 1'- 14 .16 I()
0184665 2. 3 ,.; 1. 7 ,.; .18 !'::. .012 ~ .012 C! .040 -: 1.8 ...: s. 9 ;;; .14 ..., 018466o 2. 2 1. 6 .15 .01 .014 .081 1. 2 3. 7 .14 D174714 1.8 1.4 .045 .035 .010 .13 4.1 10 .083 0169557 3.4 2.4 .085 .101 .020 .19 2.3 26 1 .25
0168262 2. 7 2.4 .062 .032 .015 .12 3.0 26 .086
0168265 1.3 }!<! 1.3 r .12 };; .02fr2 .006}~ .040}~ 1. 6 }~ 15 }~ .019}2 0168264 1.4 - 1.2 - .048 C! .02 C! .007 C! .062 C! 2.5 21 .022 C! D 168260 .61 • 24 .070 .012 .008 .019 3.0 30 .008 0168261 .53 .34 .090 .020 .009 .044 3.8 50 .012 D168263 1. 5 • 70 .071 .025 .012 .083 2. 5 21 .033 0174722 1.1 }~ .49r .091}:::: .012}::;: .009}~ .030}~ .so }0! 4-8}~ .014}~ 0174721 2. 3 N 2. 2 ...: .086 C! .026 ~ .015 ~ .12 C! 3.8 N 15 .oss C! 0169555 4.8 3.0 .069 .17 .019 .26 .48 27 1 .17 0169551:l 4. 6 3.4 .063 .086 .031 .48 .56 28 1 .12 0169556 1. 8 1.4 .051 .046 .014 .18 1. 7 56 .048 0182463 1.6 }"l 1.3 }~ .089}~ .019}~ .007}~ .097}~ .51}-: 3.1 }-: .051}~ 0182464 4.2 "'2.1 - .099 C! .040 C! .012 ~ .20 . 2o9 N 6.1 I() .16 .
D174725 .87}~ • 74f. .osop; .01~}!':: .005}6 .04~}:g .055}:! 3-9}"! • 028}~ 0174723 1.1 - • 79 . .058 C! .020 C! .008 C! • 080 C! .20 . 7.0 I() .031 C!
0171581 1. 9 1. 3 .070 .026 .009 .074 .30 22 .10
0168259 .49 .31 .056 .024 .oos .029 1.1 12 .017 0182462 3.1:l 2.1 .34 .088 .015 .19 .19 6.0 .19
0174719 • 76 .64 .058 .028 .009 .12 .15 10 .031
0168087 4.3 2.1 .060 .079 .023 .26 • 77 24 1 .22
0171600 4.5 1. 9 .29 .ll .066 .51 8.0 360 .11 0171599 1. 9 1. 1 .16 .088 .025 .28 6.1 550 .063 0171598 .94 .59 .15 .041 .020 .14 4.0 200 .037 0171591 2. 8 1. 6 • 51 .13 .049 .47 7.0 1000 .10 0171597 3.0 1.6 .11 .083 .025 .34 4.4 28 1 .083 D171596 6. 2 3. 3 .11 .17 .047 • 76 4.4 46 1 .16 0171595 7 .o 4.1 .13 .19 .062 .93 4.3 50 1 .17 0171594 8.2 4. 9 .11 .21 .064 1. 0 3.8 55 1 .28 0171593 8.4 3.9 .11 .16 .053 • 78 6.2 59 1 .36 D171592 .51 .19 .092 .018 .015 .045 7. 9 23 1 .016
0171590 4.2 2. 7 .067 .093 .033 .35 .46 84 .17 0171589 3.3 1. 7 .061 .030 .019 .12 .17 18 1 .17 0171588 11. 10. .13 .14 .044 .43 .63 89 .49 0171587 7. 1 3. 7 .12 .21 .062 .93 4.0 51 1 .18 0171586 4.0 2.3 .064 .036 .022 .17 .22 45 .20 0171585 1. 6 1. 0 .052 .019 .017 .076 .088 9.91 .057 0171584 3.4 }"! 2.0 }"l .049}g .047}~ .022}~ .23 }"' .17 }- 31 }~ .31 }"' 0171583 3, 9 r<> 2. 7 N .051 C! .080 C! .026 C! .36 "! .26 "! 43 .14 "! 0174720 3.4 1. 7 .048 .024 .018 .10 .096 s.o .17
0171582 1. 4 1. 0 .081 .021 .016 .092 .45 10 1 .057 0171580 1. 2 1.0 .042 .026 .022 .068 .54 9.01 .051
0174716 .55 .46 .086 .015 .024 .037 .084 7. 7 .019
0171579 .53 .39 .051 .015 .016 .038 .070 3.91 .026
0174718 .92 • 76 .19 .019 .032 .065 .82 14 .033
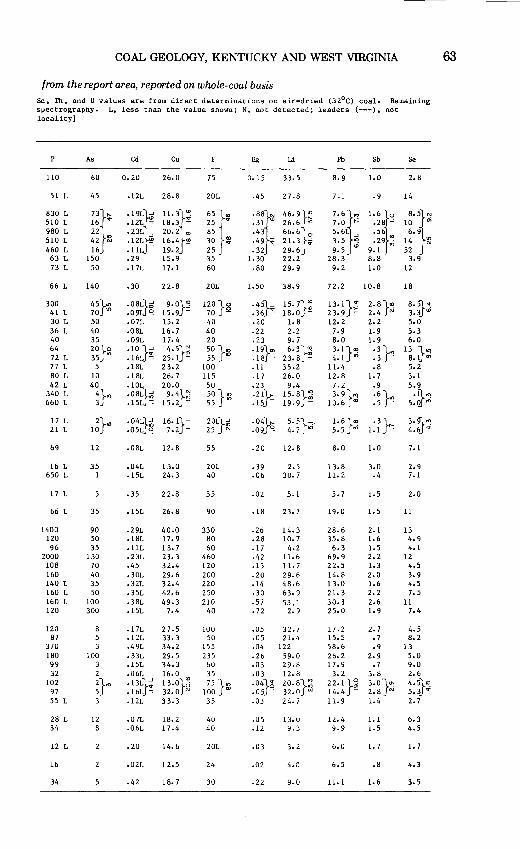
COAL GEOLOGY, KENTUCKY AND WEST VIRGINIA 63
from the report area, reported on whole-coal basis
Se, Th, and U values are from direct determinations on air-dried (32°C) coal. Remaining S]JeC trogr aphy. L, less than the value shown; N, not detected; leaders (---), not locality]
p As Cd Cu F Hg Li Pb Sb Se
110 60 0.20 26.0 75 0.15 33.5 8. 9 1. 0 2.1!
51 L 45 .121 28.8 201 .45 2 7.8 7.1 .g 14
830 L
T ·'~} "T 'T "l ""'} ,.T 'l ·-r 510 L 16 "'" .121 --; 18.3 ~ 25 "'" .31 ~ 26.6 "' 7 .o ,._ .28 - 10 a>
980 L 22 .231 ..J 20.2 "' 85 .43 66.6 0 5.61 ..J .56 6. 9 510 L 42 ~ .121 ~ 16.4 ~ 30 ~ .49 ;;: 21.3 ';i 3.5 "l .29 : 14 ~ 460 L 16 .111 . 19.2 25 .32 29.6 9.5 CD 9.1 52
63 L 150 .29 15.9 35 1.30 22.2 28.3 8.8 3.9 73 L 50 .17L 17.1 60 .so 29.9 g. 2 1.0 12
66 L 140 .30 22.8 20L 1.50 38.9 72.2 10.8 18
300 45}on .088-~ 9-~}~ 120 }8 -4~}- 15. 7}~ 13.1 }~ 2-8}~ s.5} "': 41 L 70 on .09 q 15.9 - 70 - .36 ": 18.0 - 23.9 - 2.4 "' 3.3 CD 30 L 50 .07L 15.2 40 .zo 1. 8 12.2 2.2 5.0 36 L 40 .OSL 16.7 40 .22 2.2 7. 9 1.9 5. 3 40 35 .09L 17.4 20 • 23 g. 7 s.o 1. 9 6.0 64 20}0 .10 }-' 4.5}~ 50 }on .19}"' 6.3};:J 3.1 }CI! .3},., 13 ~"l 72L 35 "' .16L ~ 25.1 - 55 on .18 --; 23.8 - 4.1 "' .3 . 8.1 a>
77 L 5 .18L 23.2 100 .u 35.2 11.4 .a 5.2 80 L 10 .18L 26.7 115 .17 26.0 12.8 1. 7 3.1 42 L 40 .101 zo.o 50 .23 9.4 7. 2 • 9 5.9
340 L ;}"' .os~~ 9-~}~ 50 }:g .2 ~}-: 15.8}:ri 3-9}rq .6}on ·}~ 660 L • 15L --: 15.2 - 55 .15 . 19.9 - 10.6 "' .5 . 5.0 "'
17 L 2}CD .04~~ 16.1}::::: 20L}iil .04}r-- ~:~}~· 1.6}<1! .3} 3-~~ 21 L 10 .05L ~ 7.2 - 25 "' .og q 5.5 "' 1.1 . 4.6 "'"
69 12 • 08L 12.8 55 .zo 12.8 s. 0 1. 0 7.1
16 L 35 .04L 13.0 20L .39 2.5 13.8 3.0 2.9 650 L 1 .151 24.3 40 .06 30.7 u. 2 .4 7.1
17 L .35 zz.s 55 .02 5.1 5. 7 1.5 2.0
66 L 35 .151 26.8 90 .18 23.7 19.0 1.5 11
1400 90 .291 40.0 330 .26 14.3 28.6 2.1 13 120 50 .181 17.9 80 .28 10.7 35.8 1. 6 4. 9 96 35 .111 13.7 60 .17 4.2 6.3 1.5 4.1
2000 130 .23L 23.3 460 .42 ll.6 69.9 2. 2 12 108 70 .45 32.4 120 .15 11.7 22.5 1.3 4.5 160 40 .30L 29.6 200 .20 29.6 14.8 z.o 3. 9 140 L 35 .32L 32.4 220 .14 48.6 13.0 1.6 4.5 160 L 50 .351 42.6 250 .30 63.9 21.3 2.2 ]. 5 160 L 100 .38L 49.3 210 .57 53.1 30.3 2.6 11 120 300 .15L 7.4 40 • 72 2. 9 25.0 1. 9 7.4
120 8 .17L 27.5 100 .05 32.7 17.2 2. 7 4.5 87 5 .121 33.3 50 .05 21.4 15.5 • 7 8. 2
370 3 .491 34.2 155 .04 122 58.6 .9 13 180 100 .33L 29.5 235 .26 59.0 26.2 2. 9 5.0
99 3 .15L 34.3 60 .03 29.8 17.9 • 7 9.0 32 2 .061 16.0 35 .03 12.8 3. 2 3.8 2. 6
102 ;}"' .13L}~ 13-~}j 75 }I() .04}~ 20.8}ri 22.1 }~ 3.0}~ 4.5}<1! 97 • 161 --: )2.0 N 100 "' .05 . 32.0 "' 14.4 - 2.8 N 5.3 <I"
55 L .121 33.3 35 .03 24.7 11.9 1.4 2. 7
28 L 12 .07L 18.2 40 .05 13.0 12.4 1.1 6.3 34 8 .06L 17.4 40 .12 9.3 g. 9 1.5 4.5
12 L .20 14.6 201 .03 ). 2 6.0 1. 7 1. 7
16 .021 12.5 24 .02 4.0 6.5 .8 4.3
34 .42 18.7 30 .22 g.o 11.1 1. 6 3.5
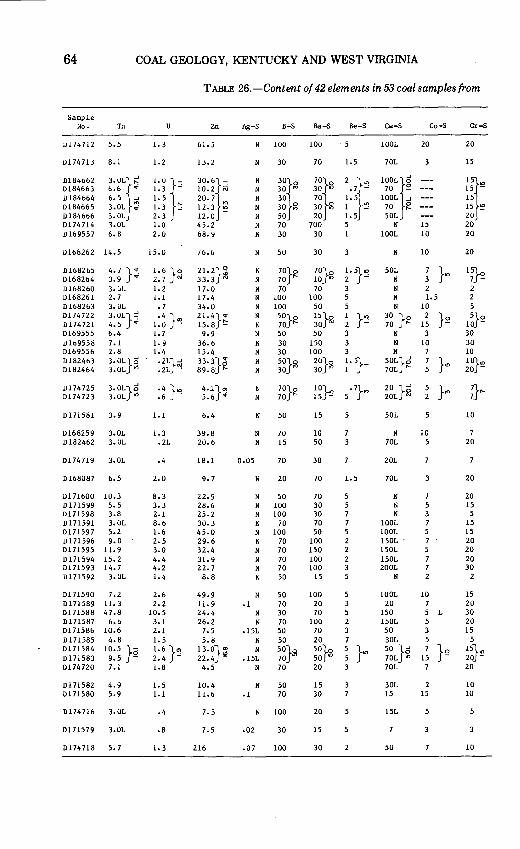
64 COAL GEOLOGY, KENTUCKY AND WEST VIRGINIA
TABLE 26.-Content of 42 elements in 53 coal samples from
Sample No. Th u Zn Ag-S B-S Ba-S Be-S Ce-S Co-S Cr-S
1>174712 s.s 1.3 6l.S 100 100 100L 20 20
Dl747l3 8.1 1.2 13.2 N 30 70 1.S 70L lS
Dl84662 '·T '·T JOT ,r T ,r lOOT T D184663 o.6 """ 1.3 - 10.2 i\i N 30 30 "' 7 --= 70 ~ lS -D184o64 6.S ~ 1. s
:~:~ :2 N 30 70 1. s lOOL ~ 1S
D18466S 3.0L <i 1.3 ~ N 30 ~ 30 ~ 1 ~ 70 g lS ~ D184666 3.0L 2.3 12.0 - N so 20 1. s SOL 20 0174714 3.0L 1.0 4S.2 70 700 s N lS 20 Ol69SS7 6. 8 2.0 68.9 N 30 30 lOOL 10 20
0168262 14.S 1S.o 76.6 so 30 N 10 20
D 1682oS 4. 7} ": 1.6 }'! 21.2}~ N 70}o 70}0 l.S}"'! SOL 7 }"' 1~0 0168264 3.9 """ 2. 7 N 33.3 N N 70 1'- 10 "' 2 - N 3 7 -0168260 3.0L 1. 2 17.0 N 70 70 3 N 2 2 D168261 2. 7 1.1 17.4 N 100 100 s N l.S 2 D1o8263 3.UL • 7 34.0 N 100 so s N 10 s D174722 3.0L}~ .4 }Q) 21.4} ": N SO}o lS}o 1 }~ 30 }0 2 }~ SJo D174721 4.S """ 1.0 . lS. 8 !::: N 70 1'- 30 N 2 70 1'- lS 10 -D 169SSS 6.4 1. 7 9. 9 N so so 3 N 3 30 D 169SS8 7.1 1. 9 36.6 N 30 !SO 3 N 10 30 D169SS6 2.8 1.4 1S.4 N 30 100 3 N 7 10 n 1824o3 3.0L }~ .2L}c;l 33. 3}~ N SO}o 20}0 !•1- SOL }6 7 }"' 1~., Dl82464 3.0L "' .2L . 89.8 1'- N 30 "' 30 "' 70L "" s 20 -
Dl7472S ~
.4 }"' 4.1}~ 70}o lOr- s .7}"' 20} ~ }"' Jl'-3.0L}C! N Dl74723 3.UL "' .6 . S.6 """ N 70 1'- 1S - 20L 2
D171S81 3.9 1.1 6.4 N so 1S SOL 5 10
Dl682S9 3.0L 1.3 39.8 N 70 10 N 10 7 D182462 3.UL .2L 20.6 N lS so 70L s 20
D174719 3.0L .4 18.1 o.os 70 30 20L
D168087 6.S 2.0 9. 7 N 20 70 l.S 70L 20
Dl71600 10.3 8.3 22.9 N so 70 s N 7 20 D171S99 s. s 3. 3 28.6 N 100 30 s N s lS D171S98 3.8 2.1 2S.2 N 100 30 7 N 3 5 D171S91 3.0L 8.6 30.3 N 70 70 7 lOOL 7 15 D17159 7 S.2 1.6 4S.o N 100 so s 100L s 1S D 171S96 9.0 2. s 29.6 N 70 100 2 1SOL 7 20 Dl71S9S 11.9 3.0 32.4 N 70 !SO 2 1SOL s 20 D171S94 1S. 2 4.4 31.9 N 70 100 !SOL 20 D171S93 14.7 4.2 22.7 N 70 100 200L 30 Dl71S92 3.0L 1.4 8.8 N so 1S N
D171S90 7.2 2.6 49.9 N so 100 s 100L 10 lS D171S89 11.3 2. 2 u. 9 .1 70 20 3 20 7 20 Dl71S88 47.8 10.s 24.4 N 30 70 s 1SO s L 30 D171S87 6.b 3.1 26.2 N 70 100 2 !SOL s 20 Dl71S86 10.6 2.1 7.S .lSL so 70 3 so 3 lS D 171S85 4.8 1. s S.8 N so 20 7 30L s s D171S84 lO.S }d 1.6 }~ 13.0}~ N so}~ SO}o s }"' so}~ 7 }e lSJ"' D 171S83 9.S - 2.4 - 22.4 - .lSL 70 so "' s 70L ~ lS 20 -D174720 7.1 1.8 4.S N 70 20 3 70L 7 20
Dl71S82 4.9 1. s 10.4 N so 1S 30L 2 10 D171S80 S.9 1.1 11.6 .1 70 30 1S lS 10
Dl74716 3.0L .4 7. 3 N 100 20 lSL
Dl71S79 3.0L .8 7.S .02 30 lS 5
Dl74718 s. 7 1. 3 216 .07 100 30 so 10
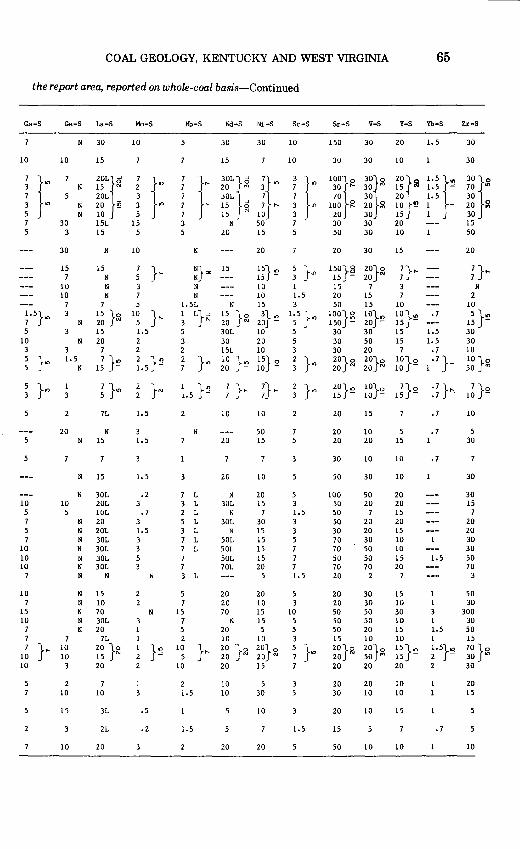
COAL GEOLOGY, KENTUCKY AND WEST VIRGINIA 65
the report area, reported on whole-coal basis-Continued
Ga-S Ge-S La-S Mo-S Nb-S Nd-S Ni-S Sc-S Sr-S v-s Y-S Yb-S Zr-S
N 30 10 30 30 10 150 30 20 1. 5 30
10 10 15 15 10 30 30 10 30
}: 'T 7
}: 7
r JOT r 3
}: lOT T 20r ,.T 'T N 15 "' 2 7 20 "' 7 30 1'- 30 "' 15 1.5 ....: 70 It)
20L ..J 3 7 30L 7 70 30 20 1.5 30 N 20 ~ 3 7 15 6 7 1'- 3 100 g 20 ~ 10 ~ 1 - 20 ~ N 10 5 7 15 N 10 3 20 30 15 1 30
30 15L 15 3 N 50 7 30 30 20 15 3 15 5 5 20 15 5 50 30 10 50
30 N 10 N 20 20 30 15 20
15 15 7 }r-- :}z 15 15} 10 5 }10 150}8 20}0 ;}r-- ;}r--7 N 5 15 - 3 15 - 20 "'
10 N 3 N 10 1 15 7 N 10 N 7 N 10 1.5 20 15 2
7 7 5 1. SL N 15 3 50 15 10 10
~·5}., 3 15 }o 10 }r-- 1 L};;j 15 }0 3} 10 1;5 }10 100}g 10}10 10}., • 7 5 }., N 20 "' 5 3 20 "' 20 - 150 - 20 - 15 - 15 -
5 15 1.5 5 30L 10 5 30 30 15 1.5 30 10 N 20 2 30 20 5 30 50 15 1. 5 30
3 3 7 2 15L 10 3 30 20 7 • 7 10 5
}10 1. 5 7 }10 2 }., }10 10 } 10 15} 0 2 }"' 20}o 20}o 10}Q 1. 7 }- 10 }0
5 N 15 - 1.5 ....: 20 - 10 - 3 20 "' 20 "' 10 50 "'
5 }"' ~ }10 }"' 1 }10 }r-- ;}r-- 2 }"' 20}10 10}0 7}o .7 }r-- 7 }o 3 1.5 ....: 3 15 - 10 - 15 - • 7 . 10 -
7L 1.5 10 10 20 15 • 7 10
20 N 3 N 50 20 10 5 • 7 5 N 15 1. 5 20 15 20 20 15 1 30
30 10 10 • 7
N 15 1. 5 20 10 50 30 10 30
N 30L .2 7 L N 20 5 100 50 20 30 10 10 20L 3 3 L 30L 15 3 50 20 20 15
5 5 10L • 7 2 L N 7 1.5 50 7 15 7 7 N 20 3 5 L 30L 30 3 50 20 20 20 5 N 20L 1.5 3 L N 15 3 30 20 15 20 7 N 30L 3 7 L SOL 15 5 70 30 10 30
10 N 30L 3 7 L SOL 15 7 70 50 10 30 10 N 30L 5 7 SOL 15 7 50 50 15 1.5 50 10 N 30L 3 7 70L 20 7 70 70 20 70
7 N N 3 L 1.5 20 2 7 3
10 N 15 2 5 20 20 5 20 30 15 1 50 7 N 10 2 7 20 10 3 20 30 10 1 30
15 N 70 N 15 70 15 10 50 50 30 3 300 10 N 30L 7 N 15 5 50 50 10 1 30
7 N 20 5 20 5 5 50 20 15 1.5 50 7 7 7L 2 10 10 3 15 10 10 1 15 7 }r-- 10 20 }0 }~ 10 }r-- 20 }~ 20} 0 5
}10 20}2 20}0 15}~ 1.5}"1 70 }0 10 10 15 "' 5 20 20 "' 7 20 50 "' 15 2 - 30 10
10 3 20 10 20 15 7 20 20 20 2 30
2 7 2 10 5 3 20 20 10 20 10 10 1.5 10 30 5 30 10 10 15
15 3L .s 10 20 10 15
2L .2 1.5 1.5 15 • 7
10 20 20 20 50 10 10 10
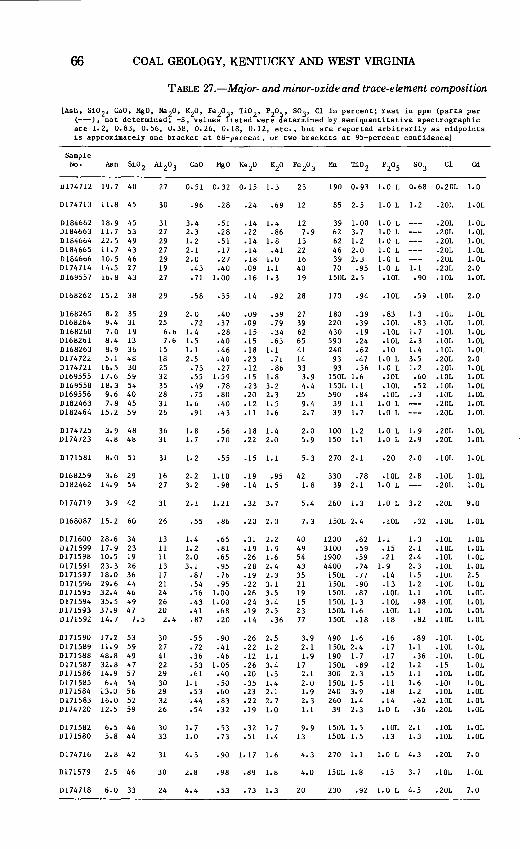
66 COAL GEOLOGY, KENTUCKY AND WEST VIRGINIA
TABLE Z7 .-Major- and minor-oxide and trace-element composition
[Ash, Sio2 , l:aO, MgO, Na 2o, K2o, Fe 2o 3 , Ti0 2 , P2
o 5 , so3 , Cl in percent; rest in ppm (parts per (---), not determined; -s, values listed were determined by semiquantitative spectrographic are 1. 2, o. 83, 0. 56, 0. 38, 0. 26, 0.18, 0.12, etc., but are reported arbitrarily as midpoints is approximately one bracket at 68-percent, or two brackets at 95-percent confidence]
Sample No. Ash Si0 2 Al 2o 3 GaO MgO Na 20 K
20 Fe 2o
3 Mn Ti0 2 P 2o5 S0
3 Cl Cd
JH74712 19.7 40
0174713 l1.8 45
0184662 18.9 45 0184663 ll. 7 53 0184664 22.5 49 0184665 11.7 43 0184666 10.5 46 0174714 14.5 27 0169557 16.8 43
0168262 15.2 38
0168265 0168264 0168260 0168261 0168263 0174722 0174721 0169555 0169558 0169556 0182463 0182464
8.2 35 9.4 31 7. 0 19 8.4 13 8. 9 36 5.1 48
16.5 30 17.6 59 18.3 54 9.6 40 7. 8 45
15.2 59
0174725 3.9 48 0174723 4.8 48
0171581 8.0 51
0168259 3.6 29 0182462 14.9 54
0174719 3.9 42
0168087 15.2 60
0171600 28.6 34 0171599 17.9 23 0171598 10.5 19 0171591 23.3 26 0171597 18.0 36 0171596 29.6 44 0171595 32.4 46 0171594 35.5 49 0171593 37.9 47 0171592 14.7 7.5
0171590 0171589 0171588 0171587 0171586 0171585 0171584 0171583 0174720
17.2 53 11.9 59 48.8 49 32.8 4 7 14.9 57 6.4 54
13.0 56 16.0 52 12.5 59
0171582 6.5 46 0171580 5.8 44
0174716 2.8 42
0171579 2.5 46
0174718 6.0 33
27
30
31 27 29 27 29 19 27
29
29 25
6.6 7. 6
15 18 25 32 35 28 31 26
36 31
31
16 27
31
26
13 11 11 13 17 21 24 26 20
2.4
30 27 41 22 29 30 29 32 26
30 33
31
30
24
0.51 0.32 0.15 1.3 23 190 0.93 1.0 1 0.68 0.201 1.0
.96 .28 .24 .69 12 85 2.5 1.0 1 1.2 .201 1.01
3.4 .51 2.3 .28 1. 2 .51 2.1 .17 2.0 .27
.43 .40 • 71 1. 00
.14 1. 4
.22 .86
.14 1. 8
.14 .41
.18 1. 0
.09 1.1
.16 1. 3
12 7. 9
13 22 16 40 19
39 1.00 1.0 1 62 3.7 1.0 1 62 46 39 70
1. 2 2.0 2·. 3
.95
1.0 1 1.0 1 1. 0 1 1.0 1
1501 2. 5 .101 1.1 .go
.201
.201
.201
.201
.201
.201
.101
1.01 1.01 1. 01 1.01 1.01 2.0 1.01
.58 .35 .14 .92 28 170 .94 .101 .59 .101 2.0
2.0 .72
1. 4 1.5 1. 1 2.5
• 73 .55 .49 • 75
1. 6 .91
1. 8 1. 7
1. 2
.40
.3 7
.28
.40
.46
.40
.27 1.59
• 78 .so .40 .43
.09
.09
.15
.15
.18
.23
.12
.15
.23
.20
.12
.11
.59 • 79 .34 .63
1. 1 .71 .86
1. 8 3. 2 2.3 1. 5 1.6
.56 .18 1.4 • 70 .22 2.0
.55 .15 1.1
27 39 62 65 41 14 33 3.9 4.4
25 9.4 2. 7
180 220 430 590 240 93 93
1501 1501 590
39 39
.39
.39
.19
.24
.62
.47
.56 1.6 1. 1 .84
1.1 1. 7
.83
.101
.101
.101
.10 1.0 1 1.0 1
.101
.101
.101 1.0 1 1.0 1
1. 3 .83
1. 7 2. 3 1. 4 3.5 1. 2 .60 .52
1.3
.101
.101
.101
.101
.101
.201
.201
.101
.101
.101
.201
.201
1. 01 1.01 1.01 1.01 1.01 2.0 1. 01 1.01 1.01 1.01 1.01 1.01
2.0 100 1.2 1.0 1 1.9 .201 1.01 5.9 150 1.1 1.0 1 2.9 .201 1.01
5. 3 270 2. 1 .20 2.0 .101 1.01
2.2 1.10 .19 ,95 42 330 .78 .101 2.8 .101 1.01 3.2 .98 .14 1.5 1.8 39 2.1 1.0 1 .201 1.01
2.1 1.21 .32 3.7
.55 .86 .20 2.0
1.4 1.2 2.0 3.1
.87
.54
.56
.43
.41
.87
.55 ,]2
.36
.53
.61 1.1 .53 .44 .54
1. 7 1.0
4.3
2.8
.65 • 81 .65 .95 • 76 .95
1.00 1. 00
.68
.20
.90
.41
.46 1.05 .40 .so .60 .83 .32
.31 2.2
.19 1. 9
.26 1.6
.28 2.4
.19 2.3
.22 3.1
.26 3.5
.24 3.4
.19 2.5
.14 .36
.26 2.5
.22 1. 2
.12 1.1
.26 3.4
.20 1.3
.35 1. 4
.23 2.1
.22 2. 7
.19 1.0
.53 .32 1.7 • 73 .51 1.4
.90 1.17 1.6
.98 .89 1.8
.53 .73 1.3
5.4 260 1.3 1.0 1 3.2 .201 9.0
7.3 1501 2.4
40 49 54 43 35 21 19 15 23 77
3.9 2.1 1.9
17 2.1 2. 0 1. 9 2. 3 1.1
1200 • 62 3100 • 59 1900 .59 4400 • 74
1501 • 77 1501 • 90 1501 .87 1501 1. 3 1501 1.6 1501 .18
490 1.6 1501 2. 4 190 1. 7 1501 .89 300 2.3 1501 1.5 240 3. 9 260 1. 4 39 2.3
9. 9 1501 1. 5 13 1501 1. 5
.101 .32 .101 1.01
1.1 .15 .21
1. 9 .14 .13 .101 .101 .101 .18
.16
.17
.17
.12
.15
.11
.18
.14 1.0 1
1.3 2.1 2.4 2.3 1.5 1. 2 1.1 .98
1.1 .82
.89 1. 1
.36 1. 2 1.1 1. 6 1.2
.62
.36
.101
.101
.101
.101
.101
.101
.101
.101
.101
.101
.101
.101
.101
.15
.101
.101
.101
.101
.201
1.01 1.01 1.01 1.01 2.5 1.01 1.01 1.01 1.01 1. 01
1.01 1.01 1.01 1.01 1.01 1.01 1.01 1.01 1.01
.101 2.1 .101 1. 01
.13 1. 3 .101 1.01
4.3 270 1.1 1.0 1 4.3 .201 7.0
4.0 1501 1.8 .15 3. 7 .101 1.01
20 230 .92 1.0 1 4,5 .201 7.0
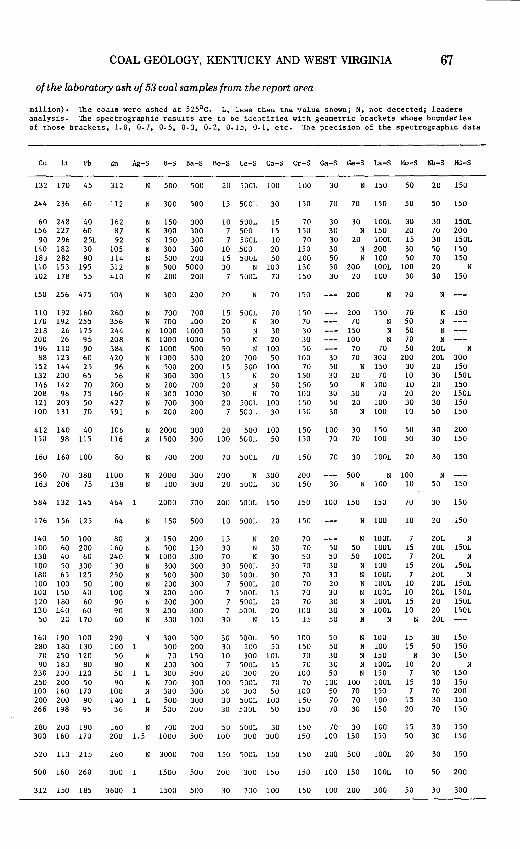
COAL GEOLOGY, KENTUCKY AND WEST VIRGINIA 67
of the laboratory ash of 53 coal samples from the report area
million). The coals were ashed at 525°C. L, less than the value shown; N, not detected; leaders analysis. The spectrographic results are to be identified with geometric brackets whose boundaries of those brackets, 1. 0, 0. 7, 0. 5, o. 3, 0. 2, 0.15, 0. 1, etc. The precision of the spectrographic data
Cu Li Pb Zn Ag-S B-S Ba-S Be-S Ce-S Co-S Cr-S Ga-S Ge-S La-S Mo-S Nb-S Nd-S
132 170 45
244 236 60
60 248 156 227
90 296 140 182 183 282 110 153 102 178
40 60 25L 30 90
195 55
150 256 4 75
110 192 160 170 192 255 218 26 175 200 26 95 196 110 90
88 123 60 152 144 25 132 200 65 146 142 70 208 98 75 121 203 so 100 131 70
412 140 40 150 98 115
160 160 100
312
ll2
162 87 92
105 114 312 410
504
260 356 244 208 384 420
96 56
200 160 427 591
106 116
80
360 70 380 llOO 163 206 75 138
584 132 145
176 156 125
140 so 100 100 60 200 130 40 60 100 so 300 180 65 125 100 100 so 100 150 40 120 180 60 130 140 60
so 20 170
160 190 100 280 180 130
70 250 120 90 180 80
230 200 120 250 200 so 100 160 170 200 200 90 266 198 95
464
64
80 160 240 130 250 100 100
90 90 60
290 100 so 80 50 90
100 140
36
N 500 500
N 300 500
N N N N N N
N
150 300 300 300 150 300 300 300 500 200 500 5000 200 200
N 300 200
N 700 N 700 N 1000 N 1000 N 1000 N 1000
500 300
N 200 N 300 N 700 N 200
700 100
1000 1000
500 300 200 300 700
1000 300 200
20 SOOL 100
15 SOOL 30
10 SOOL 15 7 500 15 7 SOOL 10
10 500 20 15 SOOL 50 30 N 100
7 SOOL 70
20 N 70
15 SOOL 20 N 50 N 50 N 50 N 20 700 15 500 15 20 N 30 N 20 SOOL
7 SOOL
70 30 30 20
100 so
100 20 so 70
100 30
N 2000 300 20 500 100 N 1500 300 100 SOOL 50
N 700 200 70 SOOL 70
N 2000 300 200 N 300 N 100 300 20 SOOL 30
2000 700 200 SOOL 150
N 150 500
N 150 200 N 500 150 N 1000 300 N 300 300 N 500 300 N 200 300 N 200 500 N 200 300 N 200 300 N 300 100
N 300 500 500 200
N 70 150 N 200 300 L 300 500 N 700 300 N 300 300 L 500 300 N 500 200
10 SOOL 20
15 N 20 30 N 30 70 N 30 30 SOOL 30 30 SOOL 30
7 SOOL 20 7 500L 15 7 500L 20 7 500L 20
30 N 15
30 SOOL 50 30 200 50 10 300 10L
7 500L 15 20 300 20
100 500L 70 30 300 50 30 500L 100 30 500L 50
280 200 190 300 160 170
160 N 700 200 50 500L 30 200 1.5 1000 500 100 300 300
520 113 215 260 N 3000 700 150 500L 150
500 160 260 300 1500 500 200 300 150
312 150 185 3600 1500 500 30 700 100
100
150
70 150
70 150 200 150 150
150
150 70 30 30 50
100 70
150 150 100 150 150
30 N 150 so
70 70 150 so
30 30 100L 30 20 15 30 so
30 N 150 30 20 100L 30 N 200 50 N 100 50 200 100L 100
30 30 20 100
30 50 30 50 30 50 30
200 N 70
200 150 70 70 N 50
150 N 50 100 N 70
70 70 50 70 300 200
N 150 30 20 70 10
N 100 10 30 70 20 20 100 30
N 100 10
150 100 30 150 so so 150 70 70 100
150
200 150
70 30 100L 20
500 N 100 30 N 100 10
150 100 150 150 70
150
70 70 so 70 70 70 70 70
100 15
100 150
70 70
100 70
100 150 150
N 100 10
N 100L 7 50 50 100L 15 50 50 100L 7 30 N 100 15 30 N 100L 7 20 N 100L 10 30 N 100L 10 30 N 100L 15 30 N 100L 10 50 N N N
50 N 100 15 50 N 100 15 30 N 150 N 30 N 100L 10 50 N 150 7
100 100 100L 15 so 70 150 7 70 70 100 15 70 30 150 20
150 70 30 100 15 50 150 100 150 150
150 200 500 lOOL 20
150 100 150 100L 10
150 100 200 300 so
20 150
so 150
30 70 30 so 70 20 30
N
150L 200 !SOL 150 150
N 150
N 150 N --N ---N
20L N 20L 300 20 150 30 150L 20 150 20 150L 30 150 50 150
30 200 30 150
30 150
N 50 150
30 150
20 150
20L N 20L 150L 20L N 20L 150L 20L N 20L 150L 20L 150L 20 150L 20 150L 20L
30 150 so 150 30 150 20 N 30 150 30 150 70 200 30 150 70 150
30 150 30 150
30 150
so 200
30 300
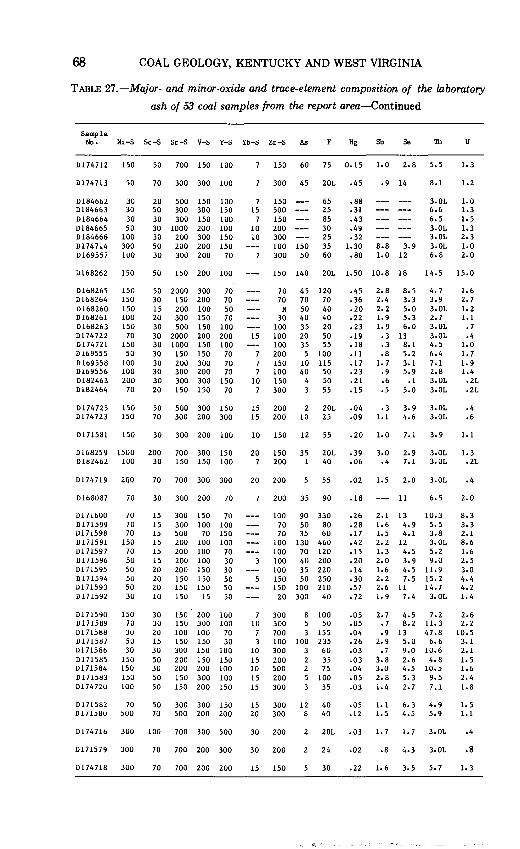
68 COAL GEOLOGY, KENTUCKY AND WEST VIRGINIA
TABLE 27.-Major- and minor-oxide and trace-element composition of the laboratory
ash of 53 coal samples from the report area-Continued
Sample No. Ni-S Sc-S Sr-S V-S Y-S Yb-S Zr-S As F Hg Sb Se Th u
0174712 150
0174 713 so
01a4662 30 01a4663 30 0184664 30 01a4665 50 01a4666 100 0174714 300 0169557 100
016a262 150
0168265 016a264 D16a260 016a261 016a263 0174722 0174721 0169555 0169558 0169556 D1a2463 01a2464
150 150 150 100 150
70 150 so
100 100 200
70
0174725 150 0174723 150
0171Sa1 150
so 700 150 100
70 300 300 100
20 500 150 100 so 300 300 150 30 300 150 100 30 1000 200 100 30 200 300 150 so 200 200 150 30 300 200 70
so 150 200 100
so 2000 300 70 30 150 200 70 15 200 100 so 20 300 150 70 30 500 150 100 30 2000 200 200 30 1000 150 100 30 150 150 70 30 200 300 70 30 300 200 70 30 300 300 150 20 150 150 70
so 500 300 150 70 300 200 300
30 300 200 100
016a259 1500 200 700 300 150 01!12462 100 30 150 150 100
0174719 200
01baOa7
0171600 0171599 017159a 0171591 0171597 0171596 0171595 0171594 0171593 0171592
0171590 0171589 0171Saa 0171587 0171Sa6 D 171585 0171584 0171583 0174720
70
70 70 70
150 70 so so so so 3U
150 70 30 so 30
150 150 150 100
0171582 70 0171Sao 500
70 700 300 300
30 300 200 70
15 15 15 15 15 15 20 20 20 10
30 30 20 15 30 so 30 so so
300 150 300 100 500 70 200 100 200 100 200 100 200 150 150 150 150 150 150 15
150 200 150 300 100 100 150 150 300 150 200 150 200 200 150 300 150 200
70 100 150 100
70 30 30 so so so
100 100
70 30
100 150 100 100 150
so 300 300 150 70 500 200 200
0174716 300 100 700 300 500
0171579 300 70 700 200 300
0174 71a 300 70 700 200 200
150 60 75 0.15 1.0 2.a s.s
300 45 20L .45 .9 14
7 150 65 15 500 25
7 150 as 10 200 30 10 300 25
100 150 35 300 so 60
.aa
.31
.43
.49
.32 1.30 a.a 3.9
• ao 1. 0 12
a.1
3.0L 6.6 6. 5 3.0L 3.0L 3.0L 6.a
1.0 1.3 1. 5 1.3 2.3 1.0 2.0
150 140 20L 1.50 10.a 1a 14.5 15.0
70 70
N 30
100 15 100
100 7 200 7 150 7 100
10 150 7 300
45 120 70 70 so 40 40 40 35 20 20 so 35 55 5 100
10 115 40 so
4 so 3 55
.45
.36
.20
.22
.23
.19
.1a
.11
.17
.23
.21
.15
2. a a.s 2.4 3.3 2.2 s.o 1.9 5.3 1. 9 6. 0 .3 13 .3 a.1 .a s.2
1. 7 3.1 .9 5.9 .6 .1 .s s.o
4. 7 3.9 3.0L 2. 7 3.0L 3.0L 4.5 6.4 7.1 2.a 3.0L 3.0L
1. 6 2. 7 1. 2 1.1 .7 .4
1. 0 1. 7 1. 9 1.4
.2L
.2L
15 200 20L .04 .3 3.9 3.0L .4 15 200 10 25 .09 1.1 4.6 3.0L .6
10 150 12 55 .20 1.0 7.1 3.9 1.1
20 150 35 20L .39 3.0 2.9 3.0L 1.3 7 200 1 40 .06 .4 7.1 3.0L .2L
20 200 55
7 10
7 3
10 15 10 15 15
200 35 90
100 90 330 70 so ao 70 35 60
100 130 460 100 70 120 100 40 200 100 35 220 150 so 250 150 100 210
20 300 40
300 a 100 300 5 so 700 3 155 100 100 235 300 3 60 200 2 35 500 2 75 200 5 100 300 3 35
15 300 12 40 20 300 a 40
.02 1.5 2.0 3.0L
.1a
.26
.2a
.17
.42
.15
.20
.14
.30
.s 7
.]2
.os
.os
.04
.26
.03
.03
.04
.os
.03
2.1 1. 6 1.5 2. 2 1.3 2. 0 1.6 2. 2 2.6 1. 9
2. 7 • 7 .9
2. 9 • 7
3. a 3.0 2. a 1.4
11
13 4.9 4.1
12 4.5 3. 9 4.5 7.5
11 7.4
4.5 a.2
13 s.o 9.0 2.6 4.5 5.3 2. 7
10.3 s.s 3.a 3.0L 5.2 9.0
11.9 15.2 14.7
3.0L
7.2 u. 3 47.a
6.6 10.6 4.a
10.5 9.5 7.1
.os 1.1 6.3 4.9
.12 1.5 4.5 5.9
.4
2.0
a.3 3.3 2.1 a.6 1.6 2. 5 3.0 4.4 4.2 1.4
2.6 2.2
10.5 3.1 2.1 1. 5 1.6 2.4 1.a
1. 5 1.1
30 200 20L .03 1. 7 1. 7 3.0L .4
30 200 24 .02 .a 4.3 3.0L .8
15 150 30 .22 1.6 3.5 5.7 1.3