Embed Size (px)
Citation preview
Coal KillsAn Assessment of Death and Diseasecaused by India’s Dirtiest Energy Source

Founded in 2005, the Conservation Action Trust is a non-profi t organization
dedicated to the protection of the environment through advocacy and action.
5 Sahakar Building, LBS Road, Ghatkopar (West) Mumbai 400 086
T: (91-22) 2512 2422 / 20
www.cat.org.in
Founded in 2007, Urban Emissions (India) program has four objectives (a)
promote the sharing of knowledge base on air pollution analysis (b) analysis based
on science (c) advocacy and awareness raising on air quality management and (d)
building partnerships among local, national, and international stakeholders.
www.UrbanEmissions.info
Greenpeace India was established in 2001 and now has over 1 million supporters
across the country. To maintain its independence, Greenpeace does not accept
donations from governments or corporations but relies on contributions from
individual supporters and foundation grants. Greenpeace exists because the earth
and all life on it deserves a clean and safe environment - now and in the future.
#60, Wellington Street, Richmond Town, Bengaluru 560 025.
T: (080) 4282 1010. F: (080) 4115 4862.
www.greenpeaceindia.org
ACKNOWLEDGEMENTSTh is work was made possible through the pioneering work done by Urban Emissions
in partnership with the Conservation Action Trust and Greenpeace India.
Written By:
Debi Goenka, CAT <[email protected]> and Sarath Guttikunda, Urban Emissions
Edited By: Ashish Fernandes, Greenpeace <[email protected]>
Design By: Mauli (M) 7738100010 <[email protected]>
Cover Image: Tata Power Project, Mumbai.
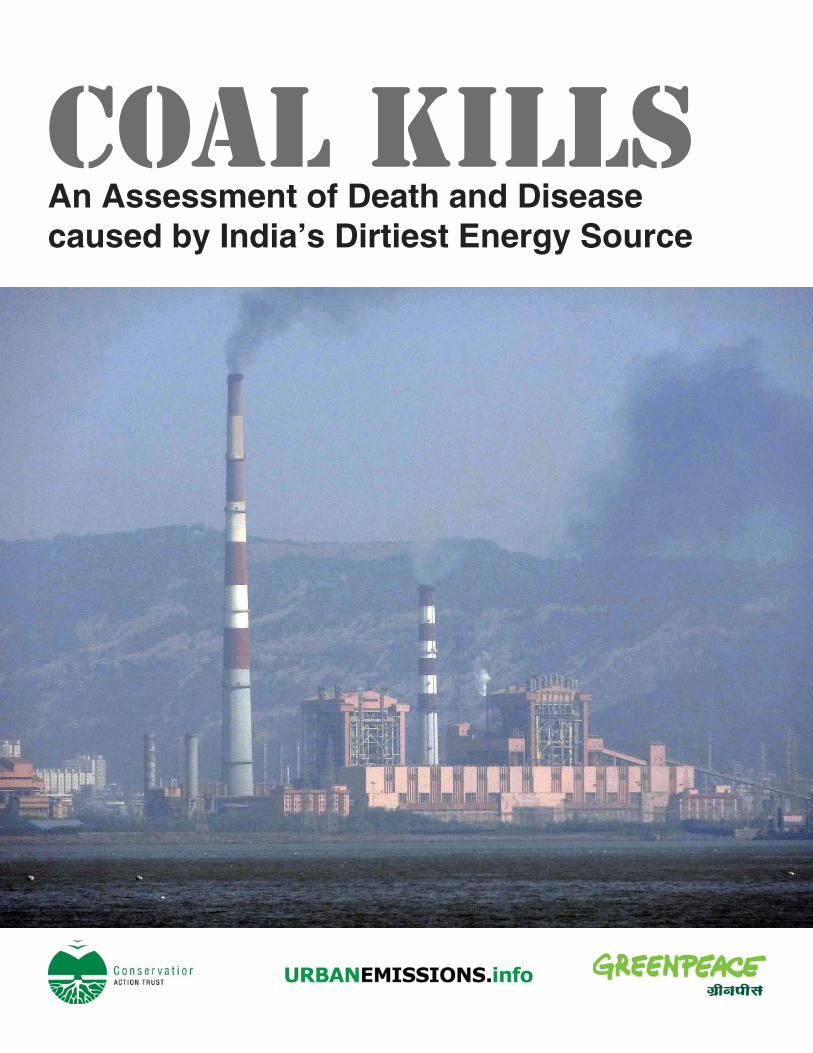
Estimated annual health impacts and health costs due to PM pollution from coal-fi red power plants in India,
2011-12
Eff ect Health impacts Health costs Health costs
(crores of Rupees) a (million USD) b
Total premature mortality 80,000 to 115,000 16,000-23,000 3300-4600
Child mortality (under 5) 10,000 2100 420
Respiratory symptoms 625 million 6200 1200
Chronic bronchitis 170,000 900 170
Chest discomforts 8.4 million 170 35
Asthma attacks 20.9 million 2100 420
Emergency room visits 900,000 320 60
Restricted activity days 160 million 8000 1600
a – one crore = 10 million
b – using conversion rate of 1 USD = 50 Rupees
EXECUTIVE SUMMARYGlobally, it is well established that emissions from coal-fi red power are
responsible for signifi cant levels of illness and premature death. Whilst
comprehensive studies of health impacts caused by particulate air pollution
attributable to coal power plants have been carried out in the USA and parts
of Europe, such data is hard to come by in India. To address this defi ciency,
Conservation Action Trust commissioned Urban Emissions to conduct the
analysis for this study. Urban Emissions developed estimates of health impacts
using a well-established and extensively peer-reviewed methodology based on
concentration-response functions established from epidemiological studies. Th e
technical study is appended, starting page 11.
Th e data in this study is derived from a database of coal-fi red power plants
compiled by Urban Emissions for the operational period of 2011-12 and takes
into account a total of 111 coal-fi red power plants representing a generation
capacity of 121GW. Th e pollution impact generated by this fl eet of coal plants is
summarized below:
Th e results of this analysis show that coal is taking a heavy toll on human life across
large parts of the country:
• Th e study fi nds that in 2011-2012, emissions from Indian coal plants resulted in
80,000 to 115,000 premature deaths and more than 20 million asthma cases from
exposure to total PM10 pollution.
1 Coal Kills
• Th e study quantifi ed additional health impacts such as hundreds of thousands
of heart attacks, emergency room visits, hospital admissions, and lost workdays
caused by coal-based emissions.
• Th e study estimates the monetary cost associated with these health impacts
exceeds Rs.16,000 to 23,000 crores (USD $3.3 to 4.6 billion) per year.
Th is burden is not distributed evenly across the population. Geographically, the
largest impact is felt over the states of Delhi, Haryana, Maharashtra, Madhya Pradesh,
Chhattisgarh, the Indo-Gangetic plain, and most of central India. Demographically,
adverse impacts are especially severe for the elderly, children, and those with respiratory
disease. In addition, the poor, minority groups, and people who live in areas downwind
of multiple power plants are likely to be disproportionately exposed to the health risks
and costs of fi ne particle pollution.
Th ese impacts are likely to increase signifi cantly in the future if Indian
policymakers do not act. At approximately 210 GW, India has the fi ft h largest
electricity generation sector in the world of which 66% comes from coal.1 Current plans
envision deepening this reliance with 76GW planned for the 12th Five Year Plan (2012-
2017) and 93GW for the 13th Five Year Plan (2017-2022). Th e majority of planned
capacity additions are coal-based and according to government projections, coal’s share
in the Indian electricity mix will remain largely constant. Very few require modern
pollution control technologies that would signifi cantly reduce health impacts.
Given the signifi cant impacts associated with coal fi red power plants it is important
that the Indian public, and its policymakers, are well informed. Th is report is the fi rst
attempt to provide policymakers objective information on the morbidity and mortality
caused by coal plants in India. Th e data represents a clarion call to action to avoid the
deadly, and entirely avoidable, impact this pollution is having on India’s population.
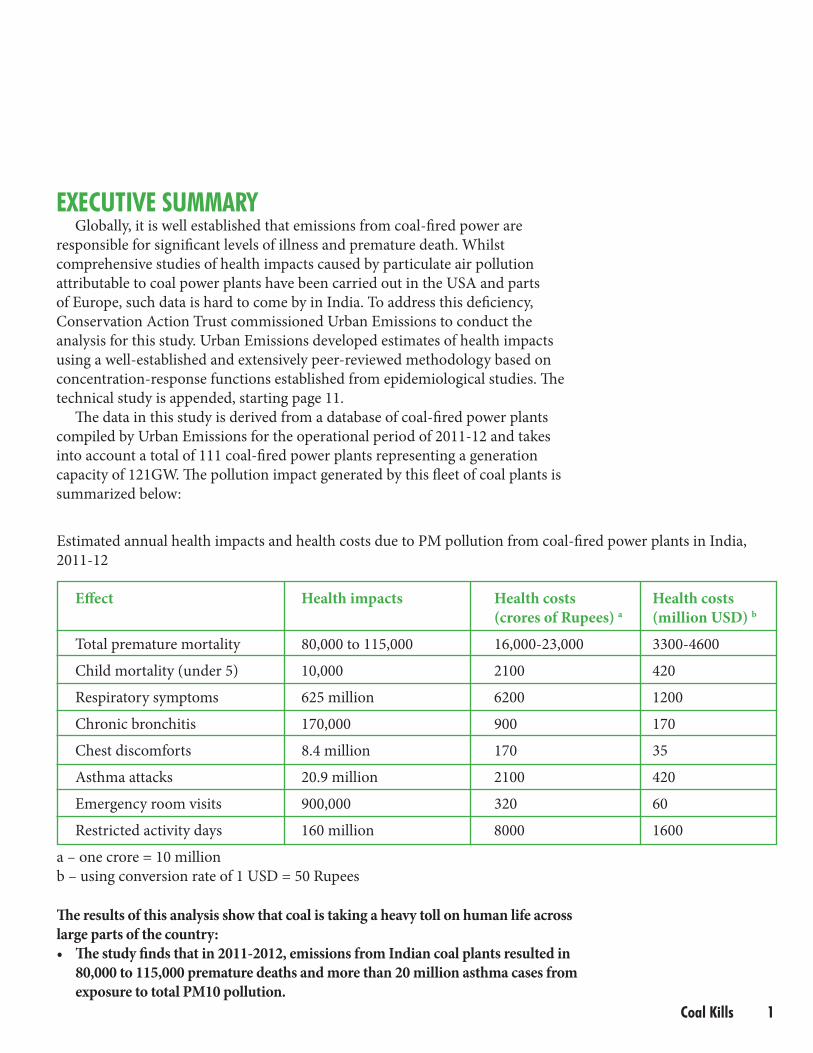
Bhagwat Saw, 69, in the emergency room at Life Line Hospital, Jharia. Bhagwat has been working as a coal loader for over 40 years and is suffering from pneumoconiosis.© Greenpeace / Peter Caton
POLLUTION FROM COAL PLANTS RESULTED IN 85,000-115,000 PREMATURE DEATHS IN 2011-2012.
“
”
2 Coal Kills
THE LINK BETWEEN POLLUTION FROM COAL-FIRED POWER PLANTS AND HUMAN HEALTH
Th e direct link between emissions (from transport, power plants, household
cookstoves, industries, and fugitive dust), outdoor air pollution, and human health
has been extensively documented.2 Most notable of the health impacts resulting in
premature deaths include chronic obstructive pulmonary disease, lower respiratory
infections, cerebrovascular disease, ischemic heart disease, and cancers of trachea,
bronchitis, and lung. Of all the pollutants, the public health concerns in India are
focused on PM that contributes to a host of respiratory and cardiopulmonary
ailments and increasing the risk of premature death. Epidemiological studies
conducted in India (Delhi and Chennai) under the Public Health and Air Pollution in
Asia (PAPA) programme also highlighted the linkages between outdoor air pollution
and premature mortality, hospital admissions, and asthma cases.3
Th e morbidity and mortality burden is particularly costly for governments
in terms of work days lost, lost productivity, and loss in terms of gross domestic
product. Since most PM related deaths occur within a year or two of exposure,
reducing PM pollution from sources like transport and power plants has almost
immediate benefi ts for health and the national economy.
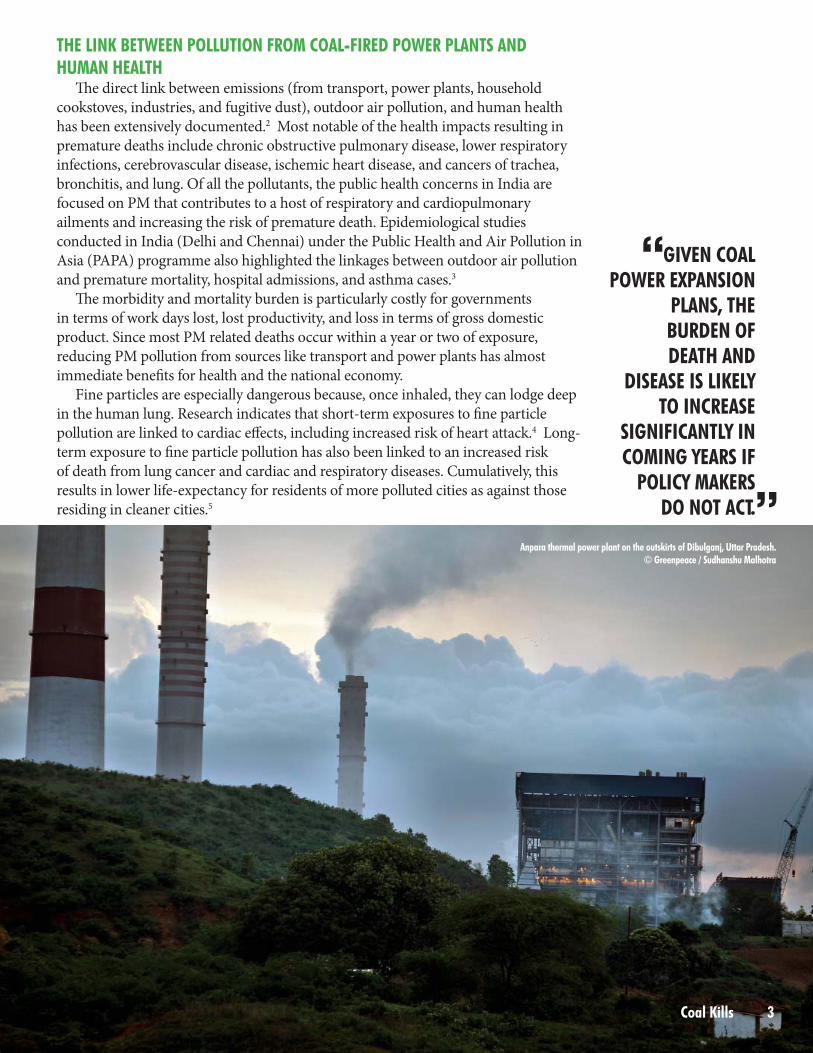
Fine particles are especially dangerous because, once inhaled, they can lodge deep
in the human lung. Research indicates that short-term exposures to fi ne particle
pollution are linked to cardiac eff ects, including increased risk of heart attack.4 Long-
term exposure to fi ne particle pollution has also been linked to an increased risk
of death from lung cancer and cardiac and respiratory diseases. Cumulatively, this
results in lower life-expectancy for residents of more polluted cities as against those
residing in cleaner cities.5
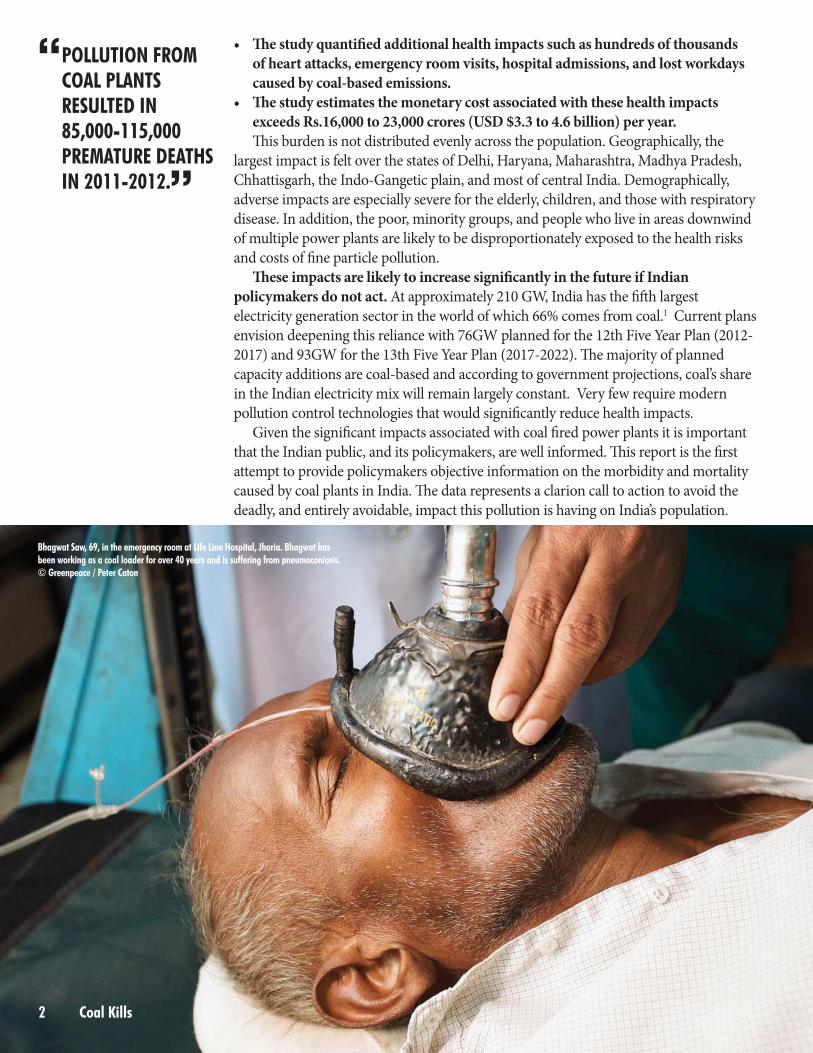
Anpara thermal power plant on the outskirts of Dibulganj, Uttar Pradesh. © Greenpeace / Sudhanshu Malhotra
GIVEN COAL POWER EXPANSION
PLANS, THE BURDEN OF DEATH AND
DISEASE IS LIKELY TO INCREASE
SIGNIFICANTLY IN COMING YEARS IF
POLICY MAKERS DO NOT ACT.
“
”
3 Coal Kills
Coal Kills4
Adverse eff ects of fi ne particle pollution occur even at low ambient concentrations,
suggesting there is no “safe” threshold.6 (REF-9) Studies have also identifi ed plausible
biological mechanisms such as systemic infl ammation, accelerated atherosclerosis,
and altered cardiac function to explain the serious health impacts associated with
exposure to fi ne particles.7 Because most fi ne particle-related deaths are thought
to occur within a year or two of exposure, reducing power plant pollution will have
almost immediate benefi ts.8
Given the country’s dependence on coal for electricity, and the absence of eff ective
pollution controls, persistently elevated levels of fi ne particle pollution are common
across large parts of the country, particularly in Central and Northern India.
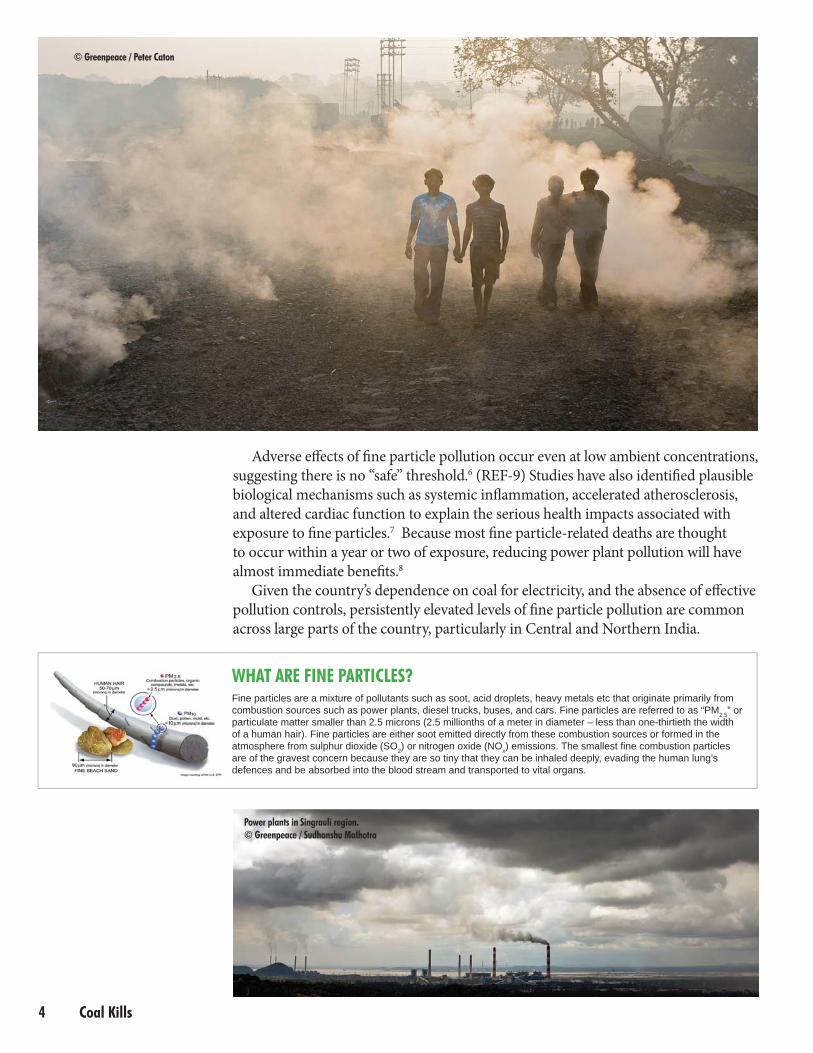
WHAT ARE FINE PARTICLES?Fine particles are a mixture of pollutants such as soot, acid droplets, heavy metals etc that originate primarily from combustion sources such as power plants, diesel trucks, buses, and cars. Fine particles are referred to as “PM2.5” or particulate matter smaller than 2.5 microns (2.5 millionths of a meter in diameter – less than one-thirtieth the width of a human hair). Fine particles are either soot emitted directly from these combustion sources or formed in the atmosphere from sulphur dioxide (SO2) or nitrogen oxide (NOx) emissions. The smallest fi ne combustion particles are of the gravest concern because they are so tiny that they can be inhaled deeply, evading the human lung’s defences and be absorbed into the blood stream and transported to vital organs.
© Greenpeace / Peter Caton
Power plants in Singrauli region. © Greenpeace / Sudhanshu Malhotra
Coal Kills 5
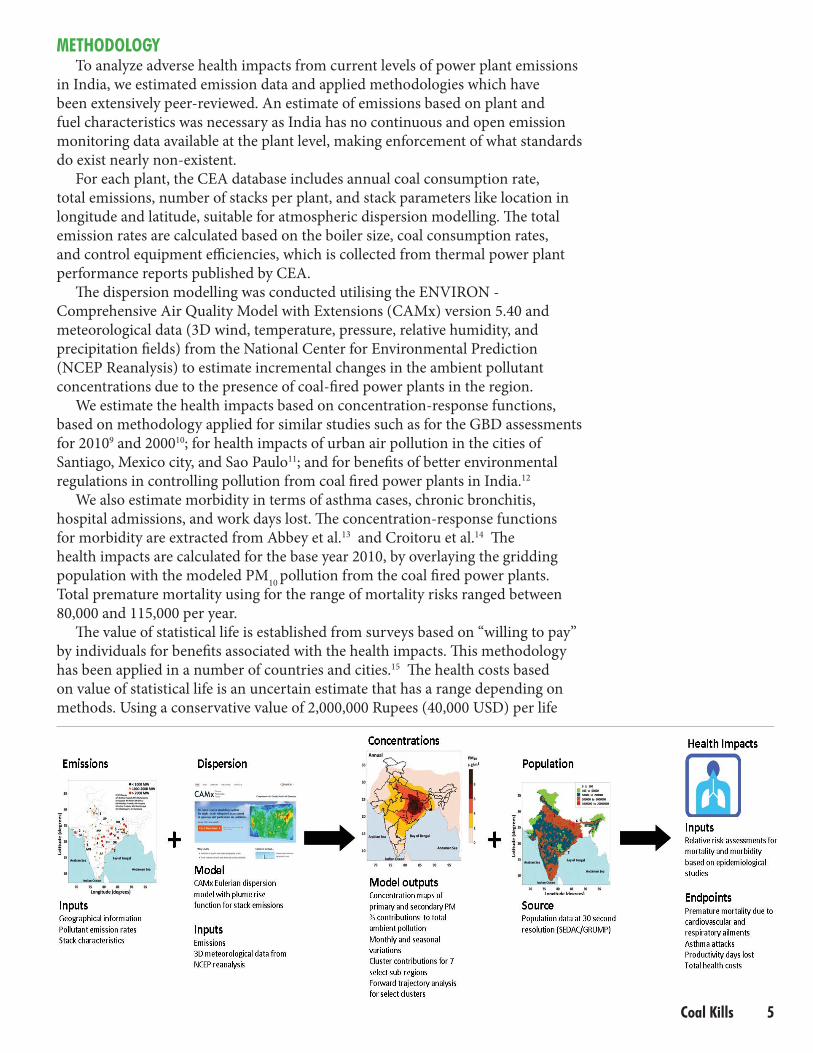
METHODOLOGYTo analyze adverse health impacts from current levels of power plant emissions
in India, we estimated emission data and applied methodologies which have been extensively peer-reviewed. An estimate of emissions based on plant and fuel characteristics was necessary as India has no continuous and open emission monitoring data available at the plant level, making enforcement of what standards do exist nearly non-existent.
For each plant, the CEA database includes annual coal consumption rate, total emissions, number of stacks per plant, and stack parameters like location in longitude and latitude, suitable for atmospheric dispersion modelling. Th e total emission rates are calculated based on the boiler size, coal consumption rates, and control equipment effi ciencies, which is collected from thermal power plant performance reports published by CEA.
Th e dispersion modelling was conducted utilising the ENVIRON - Comprehensive Air Quality Model with Extensions (CAMx) version 5.40 and meteorological data (3D wind, temperature, pressure, relative humidity, and precipitation fi elds) from the National Center for Environmental Prediction (NCEP Reanalysis) to estimate incremental changes in the ambient pollutant concentrations due to the presence of coal-fi red power plants in the region.
We estimate the health impacts based on concentration-response functions, based on methodology applied for similar studies such as for the GBD assessments for 20109 and 200010; for health impacts of urban air pollution in the cities of Santiago, Mexico city, and Sao Paulo11; and for benefi ts of better environmental regulations in controlling pollution from coal fi red power plants in India.12
We also estimate morbidity in terms of asthma cases, chronic bronchitis, hospital admissions, and work days lost. Th e concentration-response functions for morbidity are extracted from Abbey et al.13 and Croitoru et al.14 Th e health impacts are calculated for the base year 2010, by overlaying the gridding population with the modeled PM
10 pollution from the coal fi red power plants.
Total premature mortality using for the range of mortality risks ranged between 80,000 and 115,000 per year.
Th e value of statistical life is established from surveys based on “willing to pay” by individuals for benefi ts associated with the health impacts. Th is methodology has been applied in a number of countries and cities.15 Th e health costs based on value of statistical life is an uncertain estimate that has a range depending on methods. Using a conservative value of 2,000,000 Rupees (40,000 USD) per life
Coal Kills6
lost, the premature mortality estimates from this study would result in a health
cost of 16,000 to 23,000 crores Rupees (USD 3.2 to 4.6 billion) annually.
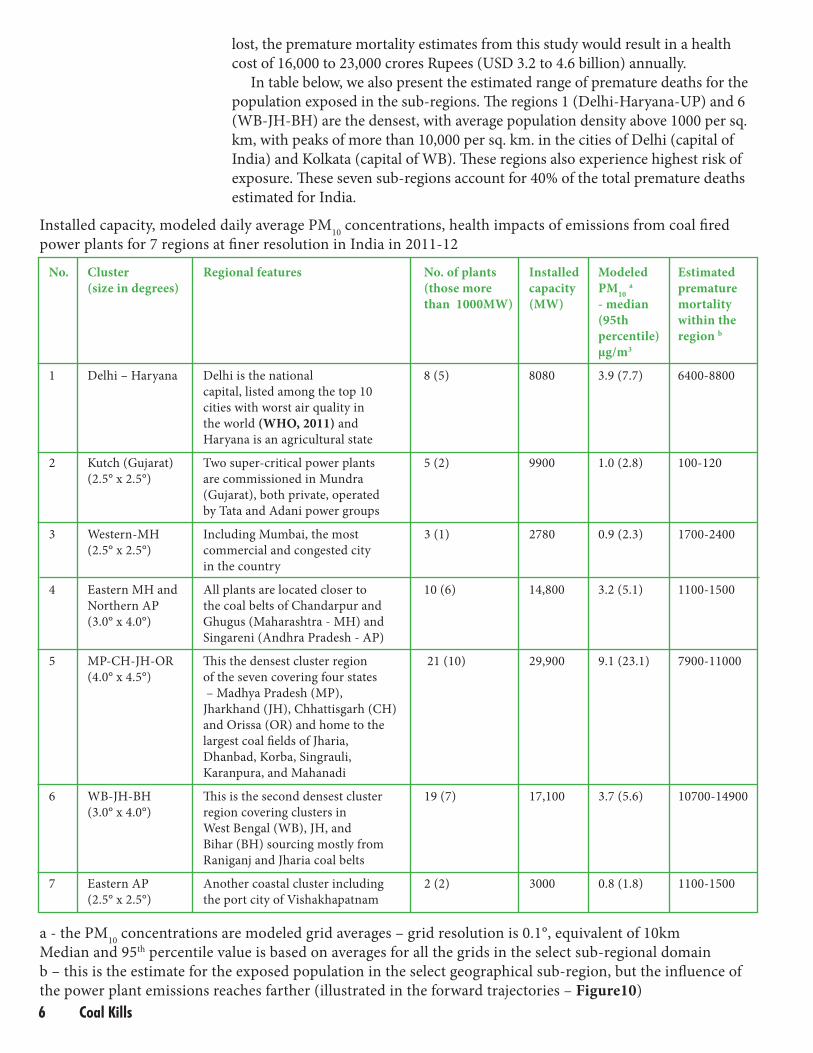
In table below, we also present the estimated range of premature deaths for the
population exposed in the sub-regions. Th e regions 1 (Delhi-Haryana-UP) and 6
(WB-JH-BH) are the densest, with average population density above 1000 per sq.
km, with peaks of more than 10,000 per sq. km. in the cities of Delhi (capital of
India) and Kolkata (capital of WB). Th ese regions also experience highest risk of
exposure. Th ese seven sub-regions account for 40% of the total premature deaths
estimated for India.
Installed capacity, modeled daily average PM10
concentrations, health impacts of emissions from coal fi red
power plants for 7 regions at fi ner resolution in India in 2011-12
No. Cluster Regional features No. of plants Installed Modeled Estimated
(size in degrees) (those more capacity PM10
a premature
than 1000MW) (MW) - median mortality
(95th within the
percentile) region b
μg/m3
1 Delhi – Haryana Delhi is the national 8 (5) 8080 3.9 (7.7) 6400-8800
capital, listed among the top 10
cities with worst air quality in
the world (WHO, 2011) and
Haryana is an agricultural state
2 Kutch (Gujarat) Two super-critical power plants 5 (2) 9900 1.0 (2.8) 100-120
(2.5° x 2.5°) are commissioned in Mundra
(Gujarat), both private, operated
by Tata and Adani power groups
3 Western-MH Including Mumbai, the most 3 (1) 2780 0.9 (2.3) 1700-2400
(2.5° x 2.5°) commercial and congested city
in the country
4 Eastern MH and All plants are located closer to 10 (6) 14,800 3.2 (5.1) 1100-1500
Northern AP the coal belts of Chandarpur and
(3.0° x 4.0°) Ghugus (Maharashtra - MH) and
Singareni (Andhra Pradesh - AP)
5 MP-CH-JH-OR Th is the densest cluster region 21 (10) 29,900 9.1 (23.1) 7900-11000
(4.0° x 4.5°) of the seven covering four states
– Madhya Pradesh (MP),
Jharkhand (JH), Chhattisgarh (CH)
and Orissa (OR) and home to the
largest coal fi elds of Jharia,
Dhanbad, Korba, Singrauli,
Karanpura, and Mahanadi
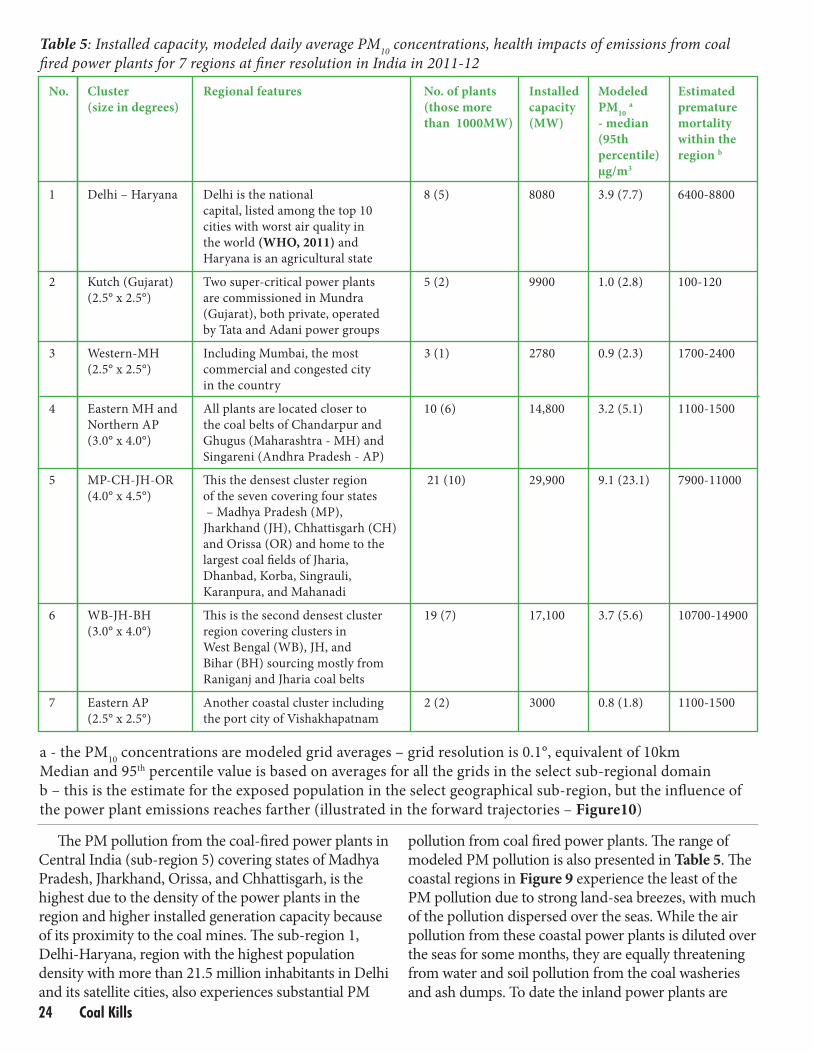
6 WB-JH-BH Th is is the second densest cluster 19 (7) 17,100 3.7 (5.6) 10700-14900
(3.0° x 4.0°) region covering clusters in
West Bengal (WB), JH, and
Bihar (BH) sourcing mostly from
Raniganj and Jharia coal belts
7 Eastern AP Another coastal cluster including 2 (2) 3000 0.8 (1.8) 1100-1500
(2.5° x 2.5°) the port city of Vishakhapatnam
a - the PM10
concentrations are modeled grid averages – grid resolution is 0.1°, equivalent of 10km
Median and 95th percentile value is based on averages for all the grids in the select sub-regional domain
b – this is the estimate for the exposed population in the select geographical sub-region, but the infl uence of
the power plant emissions reaches farther (illustrated in the forward trajectories – Figure10)
Coal Kills 7
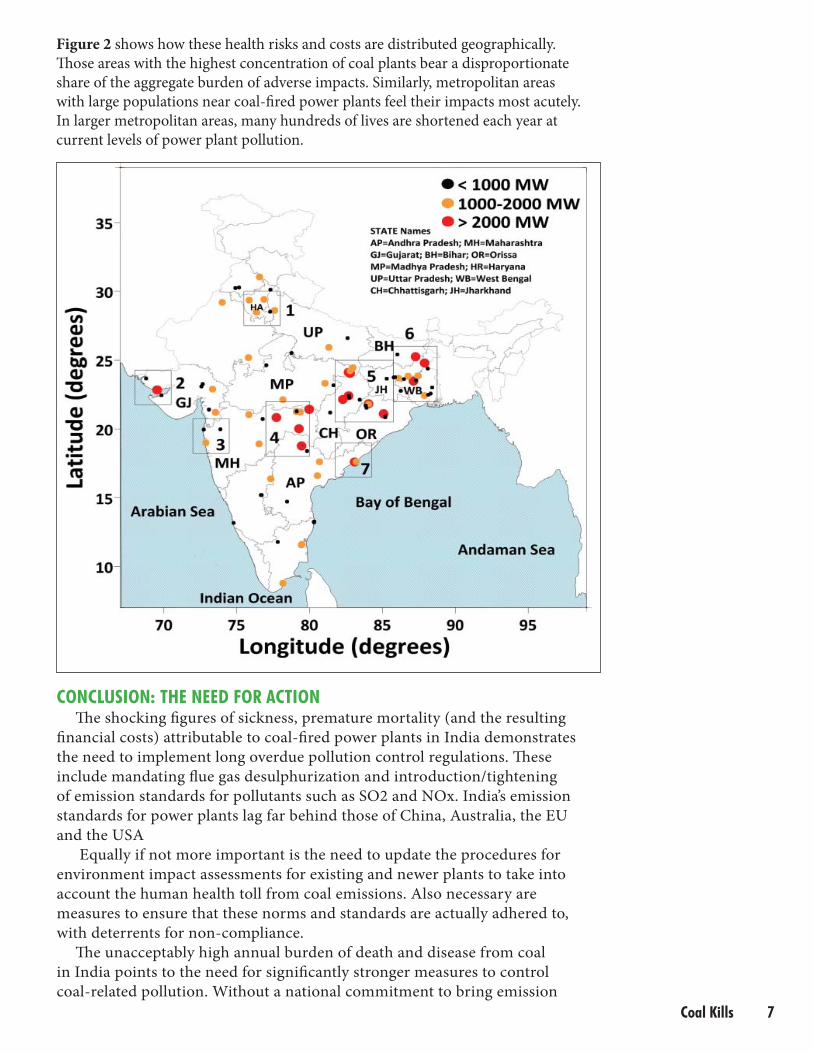
Figure 2 shows how these health risks and costs are distributed geographically.
Th ose areas with the highest concentration of coal plants bear a disproportionate
share of the aggregate burden of adverse impacts. Similarly, metropolitan areas
with large populations near coal-fi red power plants feel their impacts most acutely.
In larger metropolitan areas, many hundreds of lives are shortened each year at
current levels of power plant pollution.
CONCLUSION: THE NEED FOR ACTIONTh e shocking fi gures of sickness, premature mortality (and the resulting
fi nancial costs) attributable to coal-fi red power plants in India demonstrates
the need to implement long overdue pollution control regulations. Th ese
include mandating fl ue gas desulphurization and introduction/tightening
of emission standards for pollutants such as SO2 and NOx. India’s emission
standards for power plants lag far behind those of China, Australia, the EU
and the USA
Equally if not more important is the need to update the procedures for
environment impact assessments for existing and newer plants to take into
account the human health toll from coal emissions. Also necessary are
measures to ensure that these norms and standards are actually adhered to,
with deterrents for non-compliance.
Th e unacceptably high annual burden of death and disease from coal
in India points to the need for signifi cantly stronger measures to control
coal-related pollution. Without a national commitment to bring emission
INDIA’S EMISSIONS STANDARDS LAG BEHIND CHINA, THE US, EU AND AUSTRALIA. HUNDREDS OF THOUSANDS OF LIVES AND CRORES OF RUPEES COULD BE SAVED WITH CLEANER FUELS, STRICTER EMISSIONS STANDARDS AND EMISSION CONTROL TECHNOLOGIES.
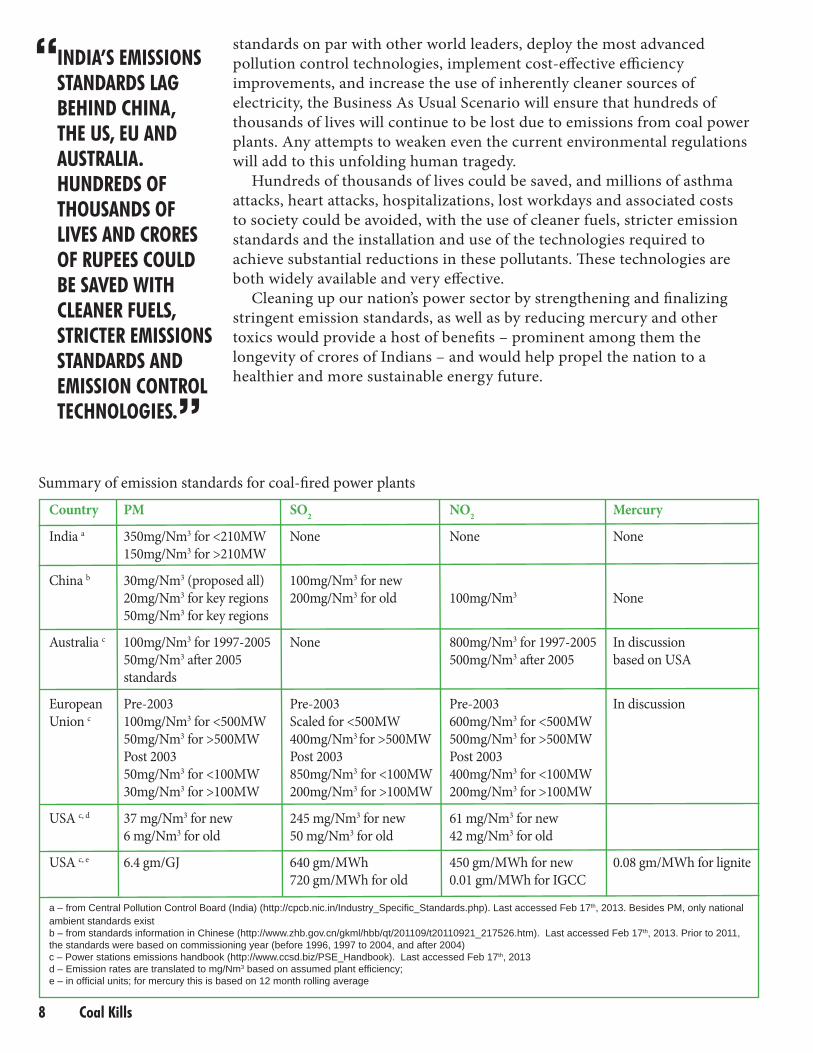
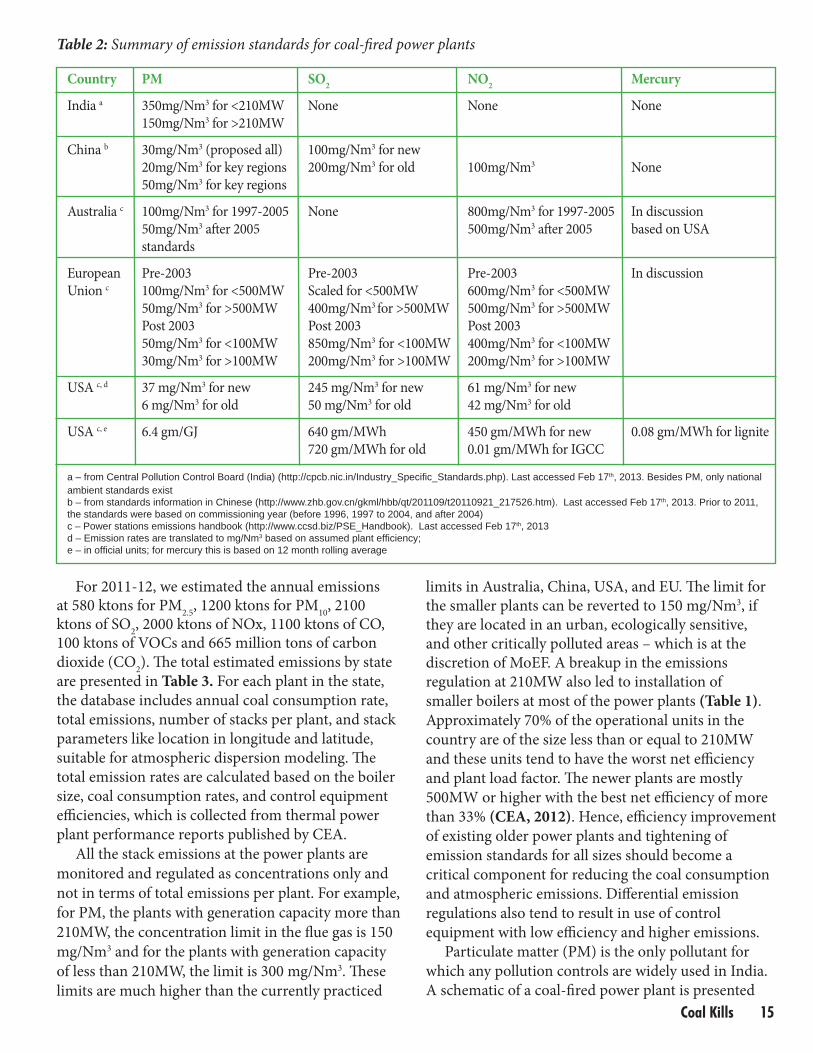
Summary of emission standards for coal-fi red power plants
Country PM SO2 NO
2 Mercury
India a 350mg/Nm3 for <210MW None None None
150mg/Nm3 for >210MW
China b 30mg/Nm3 (proposed all) 100mg/Nm3 for new
20mg/Nm3 for key regions 200mg/Nm3 for old 100mg/Nm3 None
50mg/Nm3 for key regions
Australia c 100mg/Nm3 for 1997-2005 None 800mg/Nm3 for 1997-2005 In discussion
50mg/Nm3 aft er 2005 500mg/Nm3 aft er 2005 based on USA
standards
European Pre-2003 Pre-2003 Pre-2003 In discussion
Union c 100mg/Nm3 for <500MW Scaled for <500MW 600mg/Nm3 for <500MW
50mg/Nm3 for >500MW 400mg/Nm3 for >500MW 500mg/Nm3 for >500MW
Post 2003 Post 2003 Post 2003
50mg/Nm3 for <100MW 850mg/Nm3 for <100MW 400mg/Nm3 for <100MW
30mg/Nm3 for >100MW 200mg/Nm3 for >100MW 200mg/Nm3 for >100MW
USA c, d 37 mg/Nm3 for new 245 mg/Nm3 for new 61 mg/Nm3 for new
6 mg/Nm3 for old 50 mg/Nm3 for old 42 mg/Nm3 for old
USA c, e 6.4 gm/GJ 640 gm/MWh 450 gm/MWh for new 0.08 gm/MWh for lignite
720 gm/MWh for old 0.01 gm/MWh for IGCC
a – from Central Pollution Control Board (India) (http://cpcb.nic.in/Industry_Specifi c_Standards.php). Last accessed Feb 17th, 2013. Besides PM, only national ambient standards exist b – from standards information in Chinese (http://www.zhb.gov.cn/gkml/hbb/qt/201109/t20110921_217526.htm). Last accessed Feb 17th, 2013. Prior to 2011, the standards were based on commissioning year (before 1996, 1997 to 2004, and after 2004) c – Power stations emissions handbook (http://www.ccsd.biz/PSE_Handbook). Last accessed Feb 17th, 2013 d – Emission rates are translated to mg/Nm3 based on assumed plant effi ciency; e – in offi cial units; for mercury this is based on 12 month rolling average
standards on par with other world leaders, deploy the most advanced
pollution control technologies, implement cost-eff ective effi ciency
improvements, and increase the use of inherently cleaner sources of
electricity, the Business As Usual Scenario will ensure that hundreds of
thousands of lives will continue to be lost due to emissions from coal power
plants. Any attempts to weaken even the current environmental regulations
will add to this unfolding human tragedy.
Hundreds of thousands of lives could be saved, and millions of asthma
attacks, heart attacks, hospitalizations, lost workdays and associated costs
to society could be avoided, with the use of cleaner fuels, stricter emission
standards and the installation and use of the technologies required to
achieve substantial reductions in these pollutants. Th ese technologies are
both widely available and very eff ective.
Cleaning up our nation’s power sector by strengthening and fi nalizing
stringent emission standards, as well as by reducing mercury and other
toxics would provide a host of benefi ts – prominent among them the
longevity of crores of Indians – and would help propel the nation to a
healthier and more sustainable energy future.
“
”
Coal Kills8
1 http://cea.nic.in/reports/yearly/energy_generation_11_12.pdf2 For example, Brunekreef, B., 1997. Air pollution and life expectancy: is there a relation? Occupational and Environmental Medicine 54, 781; Pope III, C.A., Burnett, R.T., Thun, M.J., Calle, E.E., Krewski, D., Ito, K., Thurston, G.D., 2002. Lung cancer, cardiopulmonary mortality, and long-term exposure to fi ne particulate air pollution. JAMA: the journal of the American Medical Association 287, 1132-1141; HEI, 2004. Health Effects of Outdoor Air Pollution in Developing Countries of Asia: A Literature Review, Special Report 15, Health Effects Institute, Boston, USA; Laden, F., Schwartz, J., Speizer, F.E., Dockery, D.W., 2006. Reduction in fi ne particulate air pollution and mortality extended follow-up of the Harvard six cities study. American Journal of Respiratory and Critical Care Medicine 173, 667-672.; Schwartz, J., Coull, B., Laden, F., Ryan, L., 2008. The effect of dose and timing of dose on the association between airborne particles and survival. Environ. Health Perspect. 116, 64.; Pope III, C.A., Ezzati, M., Dockery, D.W., 2009. Fine-particulate air pollution and life expectancy in the United States. New England Journal of Medicine 360, 376-386; USEPA, 2009. Integrated Science Assessment for Particulate Matter (Final Report). U.S. Environmental Protection Agency, Report No. EPA/600/R-08/139F, Washington DC, USA; HEI, 2010. Outdoor Air Pollution and Health in the Developing Countries of Asia: A Comprehensive Review, Special Report 18, Health Effects Institute, Boston, USA; Atkinson, R.W., Cohen, A., Mehta, S., Anderson, H.R., 2011. Systematic review and meta-analysis of epidemiological time-series studies on outdoor air pollution and health in Asia. Air Quality, Atmosphere & Health 5, 383-391; Lancet, 2012. Global Burden of Disease Study 2010. The Lancet Series, Published on December 13th, 2012, Elsevier Publishers, London, UK.3 For example, Wong, C.-M., Vichit-Vadakan, N., Kan, H., Qian, Z., 2008. Public Health and Air Pollution in Asia (PAPA): A Multicity Study of Short-Term Effects of Air Pollution on Mortality. Environ Health Perspect 116; Balakrishnan, K., Ganguli, B., Ghosh, S., Sambandam, S., Roy, S., Chatterjee, A., 2011. A spatially disaggregated time-series analysis of the short-term effects of particulate matter exposure on mortality in Chennai, India. Air Quality, Atmosphere & Health, 1-11.4 For example, Robert D. Brook, Barry Franklin, Wayne Cascio, Yuling Hong, George Howard, Michael Lipsett, Russell Luepker, Murray Mittleman, Jonathan Samet, Sidney C. Smith, Jr, and Ira Tager. Air Pollution and Cardiovascular Disease: A Statement for Healthcare Professionals From the Expert Panel on Population and Prevention Science of the American Heart Association, Circulation, Jun 2004; 109: 2655 – 2671; Sun, Q, et al (2005). Long-term air pollution exposure and acceleration of atherosclerosis in an animal model. Journal of the American Medical Association. V. 294, no. 23 p. 3003-3010; Miller, K., Siscovik, D., Sheppard, L., Shepherd, K., Sullivan, J., Anderson, G. and Kaufman, J. (2007). Long-term exposure to air pollution and incidence of cardiovascular events in women. New England Journal of Medicine, v. 356, No. 5, p. 447-458, February 1, 2007; Peters, Annette, and Pope, C.A., Cardiopulmonary Mortality and Air Pollution, 360 The Lancet 1184 (October 19, 2002).5 For example, Laden, F., J. Schwartz, F.E. Speizer, and D.W. Dockery. 2006. Reduction in Fine Particulate Air Pollution and Mortality. American Journal of Respiratory and Critical Care Medicine 173:667-672; Pope, C. A., 3rd, R. T. Burnett, M. J. Thun, E. E. Calle, D. Krewski, K. Ito and G. D. Thurston. 2002. Lung cancer, cardiopulmonary mortality, and long-term exposure to fi ne particulate air pollution. JAMA. Vol. 287 (9): 1132-41; Pope, C.A., Ezzati, M., Dockery, D. (2009). Fine particulate air pollution and life expectancy in the United States. New England Journal of Medicine, v. 360, no. 4, January 23, 2009; Brunekreef, B., Air Pollution and Life Expectancy: Is There a Relation? 54 Occup. Environ. Med. 781–84 (1997). U.S. EPA, OAR, “Final Report to Congress on Benefi ts and Costs of the Clean Air Act, 1970 to 1990”, EPA 410-R-97-002 (October 1997) at I-23.6 For example, Schwartz J; Coull B; Laden F; Ryan L (2008). The effect of dose and timing of dose on the association between airborne particles and survival. Environ Health Perspect, 116: 64- 69; EPA (2009) Integrated Scientifi c Assessment for Particulate Matter, EPA/600/R-08/139F, p. 2- 26. Available at: http://cfpub.epa.gov/ncea/cfm/recordisplay.cfm?deid=216546; Brauer, M., Brumm, J., Vedal, S., and Petkau, A. J. (2002). Exposure misclassifi cation and threshold concentrations in time series analysis of air pollution health effects. Risk Anal. 22, 1183–1193; Vedal, Sverre, Brauer, Michael, White, Richard, and Petkau, John, Air Pollution and Daily Mortality in a City with Low Levels of Pollution, 111 Environ Health Perspectives 45–51 (2003).7 C. Arden Pope, III, Richard T. Burnett, George D. Thurston, Michael J. Thun, Eugenia E. Calle, Daniel Krewski, and John J. Godleski. Cardiovascular Mortality and Long-Term Exposure to Particulate Air Pollution: Epidemiological Evidence of General Pathophysiological Pathways of Disease Circulation, Jan 2004; 109: 71 – 77.8 Schwartz J; Coull B; Laden F; Ryan L (2008). The effect of dose and timing of dose on the association between airborne particles and survival. Environ Health Perspect, 116: 64-69.9 Lancet, 2012. Global Burden of Disease Study 2010. The Lancet Series, Published on December 13th, 2012, Elsevier Publishers, London, UK.10 Ostro, B., 2004. Outdoor air pollution. WHO Environmental Burden of Disease Series.11 Bell, M.L., Davis, D.L., Gouveia, N., Borja-Aburto, V.H., Cifuentes, L.A., 2006. The avoidable health effects of air pollution in three Latin American cities: Santiago, São Paulo, and Mexico City. Environmental Research 100, 431-440.12 Cropper, M., Gamkhar, S., Malik, K., Limonov, A., Partridge, I., 2012. The Health Effects of Coal Electricity Generation in India. Resources for the Future Discussion Paper.13 Abbey, D.E., Lebowitz, M.D., Mills, P.K., Petersen, F.F., Beeson, W.L., Burchette, R.J., 1995. Long-Term Ambient Concentrations of Particulates and Oxidants and Development of Chronic Disease in a Cohort of Nonsmoking California Residents. Inhalation Toxicology 7, 19-34.14 Croitoru, L., Sarraf, M., 2012. Benefi ts and Costs of the Informal Sector: The Case of Brick Kilns in Bangladesh. Journal of Environmental Protection 3, 476-484.15 Bell, M.L., Morgenstern, R.D., Harrington, W., 2011. Quantifying the human health benefi ts of air pollution policies: Review of recent studies and new directions in accountability research. Environmental Science & Policy 14, 357-368.; Chikkatur, A.P., Chaudhary, A., Sagar, A.D., 2011. Coal Power Impacts, Technology, and Policy: Connecting the Dots. Annual Review of Environment and Resources 36, 101-138; Some example studies include: Alberini, A., Cropper, M., Fu, T.-T., Krupnick, A., Liu, J.-T., Shaw, D., Harrington, W., 1997. Valuing Health Effects of Air Pollution in Developing Countries: The Case of Taiwan. Journal of Environmental Economics and Management 34, 107-126;
End Notes:
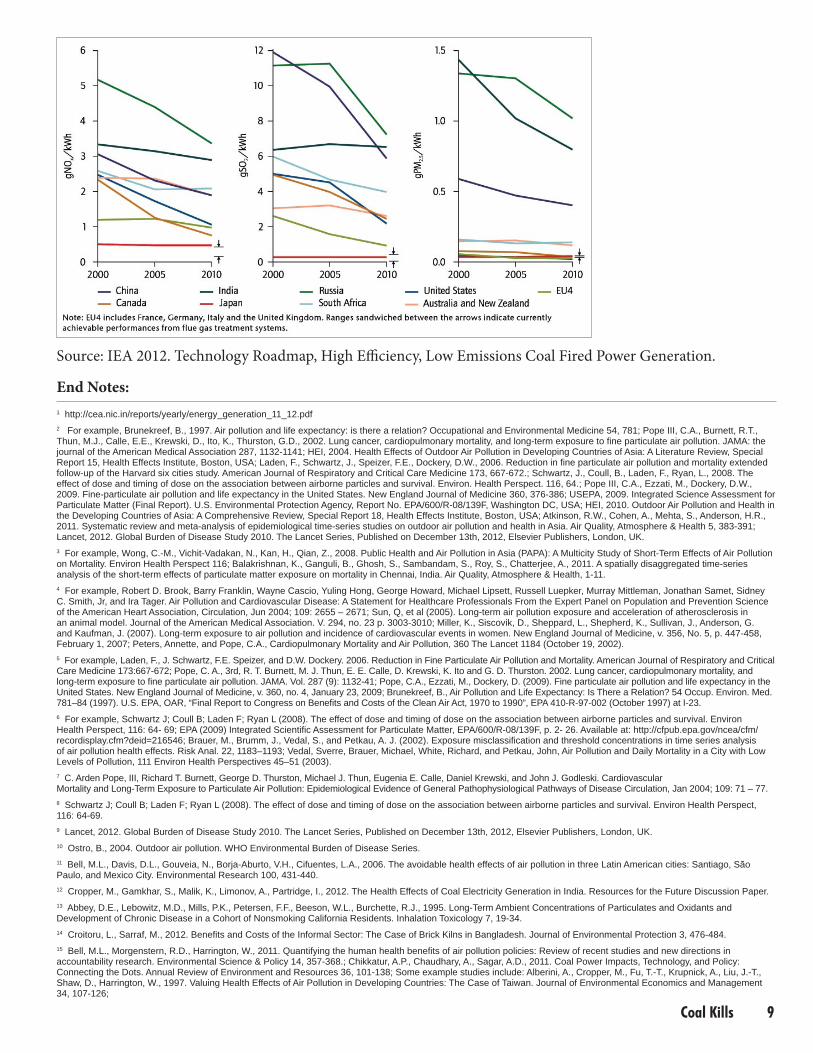
Source: IEA 2012. Technology Roadmap, High Effi ciency, Low Emissions Coal Fired Power Generation.
Coal Kills 9
KEY MESSAGES 66% of India’s power generation is coal-fi red. Th e vast majority of capacity
additions planned are also coal-based - the 12th fi ve year plan (2012-2017) specifi es a total addition of 76GW and the 13th fi ve year plan (2017-2022) is for 93GW.
In 2011-12, particulate emissions from coal-fi red power plants, resulted in an estimated 80,000 to 115,000 premature deaths and more than 20 million asthma cases, which cost the public and the government an estimated 16,000 to 23,000 crores Rupees (USD 3.2 to 4.6 billion). Th e largest impact of these emissions is felt over the states of Delhi, Haryana, Maharashtra, Madhya Pradesh, Chhattisgarh, Indo-Gangetic plain, and most of central-east India
Besides the emissions from the stack, fugitive dust from coal-handling units and ash ponds (aft er the disposal from the plants) is of concern, particularly given the expected increase in coal-fi red power plants
Th e forward trajectory analysis, using 3-dimensional meteorology, of emissions released at the stacks show that the impacts can be observed farther than 50-100km from the source region, increasing not only ambient concentrations at these receptor points, but also the morbidity and mortality risk. Additional impacts include deposition of heavy metals and sulphur oxides on agriculture through dry and wet deposition. Th e environmental impact assessments necessary for commissioning power plants should include long-range transport to account for these impacts.
Th e secondary contributions from sulphur dioxide and nitrogen oxides emissions to the total fi ne particulate matter (with aerodynamic size less than 2.5 micron) varies from 30-60% over Madhya Pradesh, Chhattisgarh, and most of central-eastern India. Th is is primarily due to lack of fl ue gas desulfurization units for most power plants. A mandate to implement this for all new and existing power plants will immediately result in lower ambient particulate pollution, with related health benefi ts. An added important benefi t will be a reduction in the deposition of these substances over rich agricultural lands.
To date, pollution standards exist for ambient air quality only and not for individual power plants, which compromises monitoring and enforcement eff orts. Only aft er standards are set and regulations mandated at the plant level can we proceed to the next steps of monitoring and enforcing policy, so as to have reduce negative environment and health impacts due to coal fi red power plants.
For particulate matter emissions, the emission standards in India lag behind those implemented in China, Australia, the United States and the European Union. For other key pollutants like sulphur dioxide, nitrogen oxides and mercury, there are no prescribed emission standards in India.
Th ere is also no open and continuous emission monitoring data available at the plant level. Th is renders nearly non-existent the enforcement of what standards do exist.
Th e way forward is (a) to revise the emission standards for coal power plants for particulates and introduce new emission standards for other pollutants (b) introduce continuous monitoring at the plant stacks, such that the data is in the public domain in real time and (c) enforce the standards with improved impact assessment methods with human health as the primary indicator
Coal Kills10
11 Coal Kills
ABSTRACTAccess to electricity is a basic requirement to
support a growing economy. Currently coal accounts
for 41% of the world’s electricity generation. At
approximately 210 GW, India is the 5th largest
generator of electricity in the world and will increase
in the future. Currently, 66% of this power generation
capacity is derived from coal with the vast majority
of capacity additions planned - the 12th fi ve year
plan (2012-2017) includes an addition of 76GW and
the 13th fi ve year plan (2017-2022) includes 93GW.
Emissions from coal-fi red power are responsible for
a large mortality and morbidity burden on human
health and this paper assesses the health burden of
emissions from India’s coal fi red power plants. In
2011-12, 111 coal-fi red power plants with a total
generation capacity of 121GW, consumed 503 million
tons of coal, and generated an estimated 580 ktons
of particulates with diameter less than 2.5 μm, 2100
ktons of sulfur dioxides, 2000 ktons of nitrogen
oxides, 1100 ktons of carbon monoxide, 100 ktons of
volatile organic compounds and 665 million tons of
carbon dioxide annually. Th ese emissions resulted in
80,000 to 115,000 premature deaths and more than
20.0 million asthma cases from exposure to total
PM10 pollution in 2011-2012, which cost the public
and the government an estimated 16,000 to 23,000
crores of Rupees (USD 3.2 to 4.6 billion). Th e largest
impact of the coal-fi red power plant emissions is
felt over the states of Delhi, Haryana, Maharashtra,
Madhya Pradesh, Chhattisgarh, Indo-Gangetic
plain, and most of central-east India. Th e dispersion
modeling of emissions was conducted using CAMx
Eulerian model coupled with plume rise functions
for the point sources and meteorological data from
the NCEP reanalysis dataset. Th e analysis shows
that aggressive pollution control regulations such
as mandating fl ue gas desulfurization, introduction
and tightening of emission standards for all
criteria pollutants, and updating the procedures for
environment impact assessments for existing and
newer plants, are imperative to reduce health impacts.
KEYWORDS: Dispersion modeling; emissions
inventory; CAMx; plume rise equation; mortality;
environmental regulations
1.0 POWER GENERATION IN INDIAAccess to electricity is necessary to support
developing economies. Currently coal accounts for
41% of the world’s electricity generation (IEA, 2012).
At approximately 210 GW, India has the 5th largest
electricity generation sector in the world (captive
power plants generate about 31 GW more) with
targets of 76GW of addition in the 12th fi ve year
plan (2012-2017) and 93GW for the 13th fi ve year
plan (Prayas, 2011; Prayas, 2013). Th ermal power
plants account for 66% of generation, hydro for 19%
and the remaining 15% from other sources including
natural gas and nuclear energy. Coal became the fuel
of choice because of its availability, especially during
the oil crisis of the 1970’s when indigenous coal was
a relatively cheap source of energy. Th e government
nationalized coal mines between 1970’s and set up
coal-based power plants close to major mines to
reduce the costs of transporting coal to power plants.
Coal accounts for 50-55% of the power generation
in India and for various reasons discussed below
– is only going to get larger in the coming years
(Chikkatur et al., 2011; WISE, 2012; Prayas, 2013).
In India, the supply of electricity lags behind the
demand from a growing population and economy.
Despite that, India is the 4th largest consumer of
electricity in the world. According to the Central
Electricity Authority (CEA), in 2010-11, of the
122 GW demand for electricity, only 110 GW was
supplied – which amounted to a shortfall of 10%. A
third of the population that lives in rural India does
not have access to electricity. Even those with access
in urban India have to deal with frequent power cuts
and load shedding (CEA, 2012).
COAL BASED THERMAL POWER PLANTS IN INDIA – AN ASSESSMENT OF ATMOSPHERIC EMISSIONS, PARTICULATE POLLUTION, AND HEALTH IMPACTSSarath K. Guttikunda a,* and Puja Jawahar a
a UrbanEmissions.Info, New Delhi, India
*Corresponding author; E-mail – [email protected]
12 Coal Kills
Coal-fi red power comes with signifi cant costs to environment and human health. Th e water runoff from coal washeries carries pollution loads of heavy metals that contaminate ground water, rivers, and lakes - thus aff ecting aquatic fl ora and fauna (Finkelman, 2007). Fly-ash residue and pollutants settle on soil contaminating areas and are especially harmful to agricultural activities. Most importantly for human health, combustion of coal releases emissions of sulfur dioxide (SO
2), nitrogen oxides (NO
x), particulate
matter (PM), carbon monoxide (CO), volatile organic compounds (VOCs), and various trace metals like mercury, into the air through stacks that can disperse this pollution over large areas. Chronic and acute exposure to these pollutants has health impacts that include respiratory illnesses, compromised immune systems, cardiovascular conditions, and premature death (HEI, 2004 and 2010).
Th e global burden of disease (GBD) for 1990-2010 quantifi ed the trends of more than 200 causes of deaths and listed outdoor air pollution among the top 10 causes of deaths for India (Lancet, 2012). For India, total premature mortality due to outdoor particulate matter (PM) pollution is estimated at 627,000. Th is GBD assessment utilized a combination of ground measurements (where available) from the cities and substituted the remaining urban and rural area with data retrieved from satellite measurements for PM2.5 pollution (Van Donkelaar et al., 2010). PM
2.5 refers
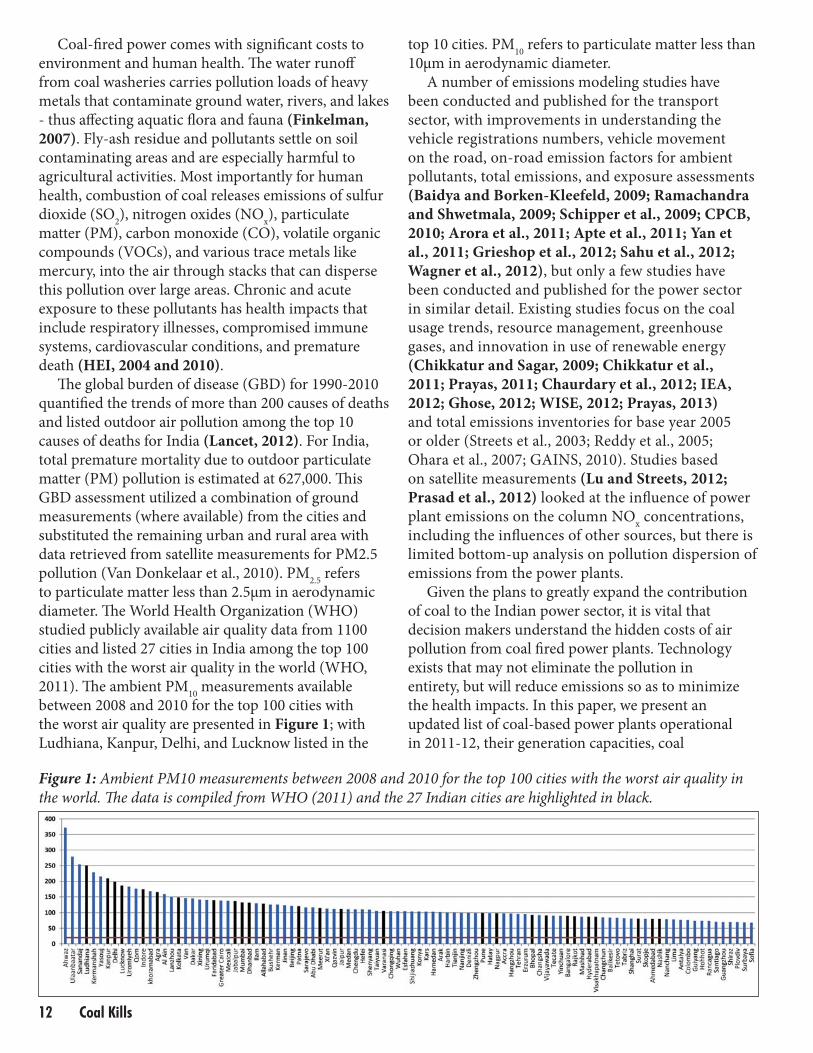
to particulate matter less than 2.5μm in aerodynamic diameter. Th e World Health Organization (WHO) studied publicly available air quality data from 1100 cities and listed 27 cities in India among the top 100 cities with the worst air quality in the world (WHO, 2011). Th e ambient PM
10 measurements available
between 2008 and 2010 for the top 100 cities with the worst air quality are presented in Figure 1; with Ludhiana, Kanpur, Delhi, and Lucknow listed in the
top 10 cities. PM10
refers to particulate matter less than 10μm in aerodynamic diameter.
A number of emissions modeling studies have been conducted and published for the transport sector, with improvements in understanding the vehicle registrations numbers, vehicle movement on the road, on-road emission factors for ambient pollutants, total emissions, and exposure assessments (Baidya and Borken-Kleefeld, 2009; Ramachandra and Shwetmala, 2009; Schipper et al., 2009; CPCB, 2010; Arora et al., 2011; Apte et al., 2011; Yan et al., 2011; Grieshop et al., 2012; Sahu et al., 2012; Wagner et al., 2012), but only a few studies have been conducted and published for the power sector in similar detail. Existing studies focus on the coal usage trends, resource management, greenhouse gases, and innovation in use of renewable energy (Chikkatur and Sagar, 2009; Chikkatur et al., 2011; Prayas, 2011; Chaurdary et al., 2012; IEA, 2012; Ghose, 2012; WISE, 2012; Prayas, 2013) and total emissions inventories for base year 2005 or older (Streets et al., 2003; Reddy et al., 2005; Ohara et al., 2007; GAINS, 2010). Studies based on satellite measurements (Lu and Streets, 2012; Prasad et al., 2012) looked at the infl uence of power plant emissions on the column NO
x concentrations,
including the infl uences of other sources, but there is limited bottom-up analysis on pollution dispersion of emissions from the power plants.
Given the plans to greatly expand the contribution of coal to the Indian power sector, it is vital that decision makers understand the hidden costs of air pollution from coal fi red power plants. Technology exists that may not eliminate the pollution in entirety, but will reduce emissions so as to minimize the health impacts. In this paper, we present an updated list of coal-based power plants operational in 2011-12, their generation capacities, coal
Figure 1: Ambient PM10 measurements between 2008 and 2010 for the top 100 cities with the worst air quality in
the world. Th e data is compiled from WHO (2011) and the 27 Indian cities are highlighted in black.
13 Coal Kills
consumption, and evaluation of the impacts of PM, SO
2, and NO
x, emissions on ambient pollution via
dispersion modeling. We also discuss the current environmental regulation for various pollutants and their implication on health impacts.
2.0 ATMOSPHERIC EMISSIONS2.1 Coal based power plants in India
Th e public sector operates most of the existing
coal-fi red power plants in India. Th e public sector
entity - National Th ermal Power Corporation (NTPC)
was established in 1975 to accelerate the installation
of pithead coal power plants and to supply to regional
grids - installed capacity of coal power grew at an
average annual rate of 8% in the 1970s and at 10% in
the 1980s. (Chikkatur and Sagar, 2009; CEA, 2011;
CEA, 2012; WISE, 2012; Prayas, 2013).
We used the list of thermal power plants
documented by CEA (http://www.cea.nic.in) as a
starting point for building our database of operational
coal-fi red power plants in the country (CEA, 2011;
CEA, 2012). We updated this database for 2011-12
representing a total generation capacity of 121GW.
We also include in the database, geographical location
in latitude and longitude, number of boiler units and
size of all known power plants operated by both public
and private entities. Th e power plant characteristics
by state are presented in Table 1. Th is data was
gathered from websites and annual reports of the
state electricity boards for public and private sectors.
Th e public sector entities include - National Th ermal
Power Corporation; Indraprastha Power Generation
Company; Haryana Power Generation Corporation;
Punjab State Power Corporation; Rajasthan Rajya
Vidyut Utpadan Nigam; Uttar Pradesh Rajya Vidyut
Utpadan Nigam; Gujarat State Electricity Corporation;
Madhya Pradesh Power Generation Company;
Chhattisgarh State Power Generation Company;
Maharashtra State Electricity Board; Andhra Pradesh
Power Generation Corporation; Karnataka Power
Corporation; Tamil Nadu Electricity Board; Th e West
Bengal Power Development Corporation; Orissa
Power Generation Corporation; and Calcutta Electric
Supply Corporation. Th e private sector entities include
– Jindal Power; CPL India; Azure India; Adani Power;
Reliance Power; and Tata Power.
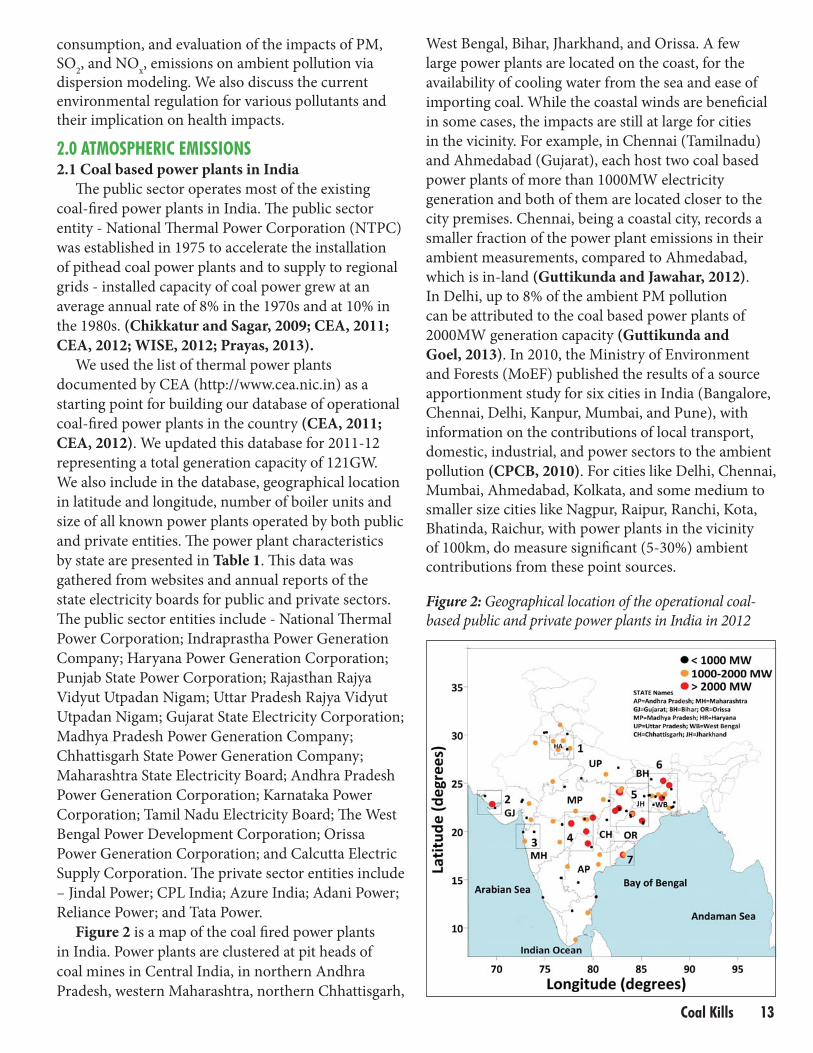
Figure 2 is a map of the coal fi red power plants
in India. Power plants are clustered at pit heads of
coal mines in Central India, in northern Andhra
Pradesh, western Maharashtra, northern Chhattisgarh,
West Bengal, Bihar, Jharkhand, and Orissa. A few
large power plants are located on the coast, for the
availability of cooling water from the sea and ease of
importing coal. While the coastal winds are benefi cial
in some cases, the impacts are still at large for cities
in the vicinity. For example, in Chennai (Tamilnadu)
and Ahmedabad (Gujarat), each host two coal based
power plants of more than 1000MW electricity
generation and both of them are located closer to the
city premises. Chennai, being a coastal city, records a
smaller fraction of the power plant emissions in their
ambient measurements, compared to Ahmedabad,
which is in-land (Guttikunda and Jawahar, 2012).
In Delhi, up to 8% of the ambient PM pollution
can be attributed to the coal based power plants of
2000MW generation capacity (Guttikunda and
Goel, 2013). In 2010, the Ministry of Environment
and Forests (MoEF) published the results of a source
apportionment study for six cities in India (Bangalore,
Chennai, Delhi, Kanpur, Mumbai, and Pune), with
information on the contributions of local transport,
domestic, industrial, and power sectors to the ambient
pollution (CPCB, 2010). For cities like Delhi, Chennai,
Mumbai, Ahmedabad, Kolkata, and some medium to
smaller size cities like Nagpur, Raipur, Ranchi, Kota,
Bhatinda, Raichur, with power plants in the vicinity
of 100km, do measure signifi cant (5-30%) ambient
contributions from these point sources.
Figure 2: Geographical location of the operational coal-
based public and private power plants in India in 2012
14 Coal Kills
2.2 Coal characteristics
Indian coal (Gondwana coal) has high ash content
(35-45%) and low calorifi c value (averaging 3820 kcal/
kg in 2003-04 and 3603 kcal/kg in 2010-11). Th e sulfur
content in Indian coals is lesser than those observed
in the United States (1.0 to 1.8%) and Chinese coals
(0.5 to 1.0%). Th e sulfur content in the Indian coal has
a consumption-weighted average of 0.6% (Reddy and
Venkataraman, 2002).
Th e high ash content and low calorifi c value aff ects
the thermal power plant’s operational effi ciency
and increases emissions per kWh generated. As a
comparison, power plants in India use about 0.72±0.10
kg of coal to generate one kWh, while a power plant in
the USA of the same technology would consume 0.45
kg of coal per kWh (Chikkatur, 2008). Th e estimated
annual coal consumption rates by state are listed in
Table 1. Th e average thermal effi ciency of the coal-fi red
power plants in India between 2004 and 2011 remained
32-33% (CEA, 2012) while this is peaking above 35%
for the power plants in China (Seligsohn et al., 2009).
Th e high silica and alumina content in Indian coal
ash is another problem, as it increases ash resistivity,
which reduces the collection effi ciency of electrostatic
precipitators. To address this issue, the government
has mandated the use of coal whose ash content has
been reduced to at least 34% in power plants in urban, ecologically sensitive, and other critically polluted areas. Th e compliance with this mandate has been uncertain due to lack of continuous monitoring.
Coal obtained from opencast mines has greater ash content – much of India’s coal is mined using open caste methods and is likely to continue as such (MoC, 2006). Another disincentive to use good quality coal is inadequacy of grading systems for diff erential pricing (Chikkatur, 2008). In 2005, about 110MT of coal ash was generated in India from more than 70 thermal power plants. Estimates for 2012 put this at 170 MT per annum (Bhangare et al, 2011). In India, approximately 13% of the fl y ash byproduct is used for brick manufacturing and other construction activities.
2.3 Total Emissions and RegulationsIn India, even though 55% of the installed
capacity is based on coal, there is a conspicuous lack of regulations for power plant stack emissions. China, the United States, the European Union (EU) and Australia have stronger regulations for a variety of pollutants that aff ect human health (Table 2). Th ere is also no continuous and open emission monitoring data available at the plant level. Th e latter makes enforcement of what standards do exist, nearly non-existent.
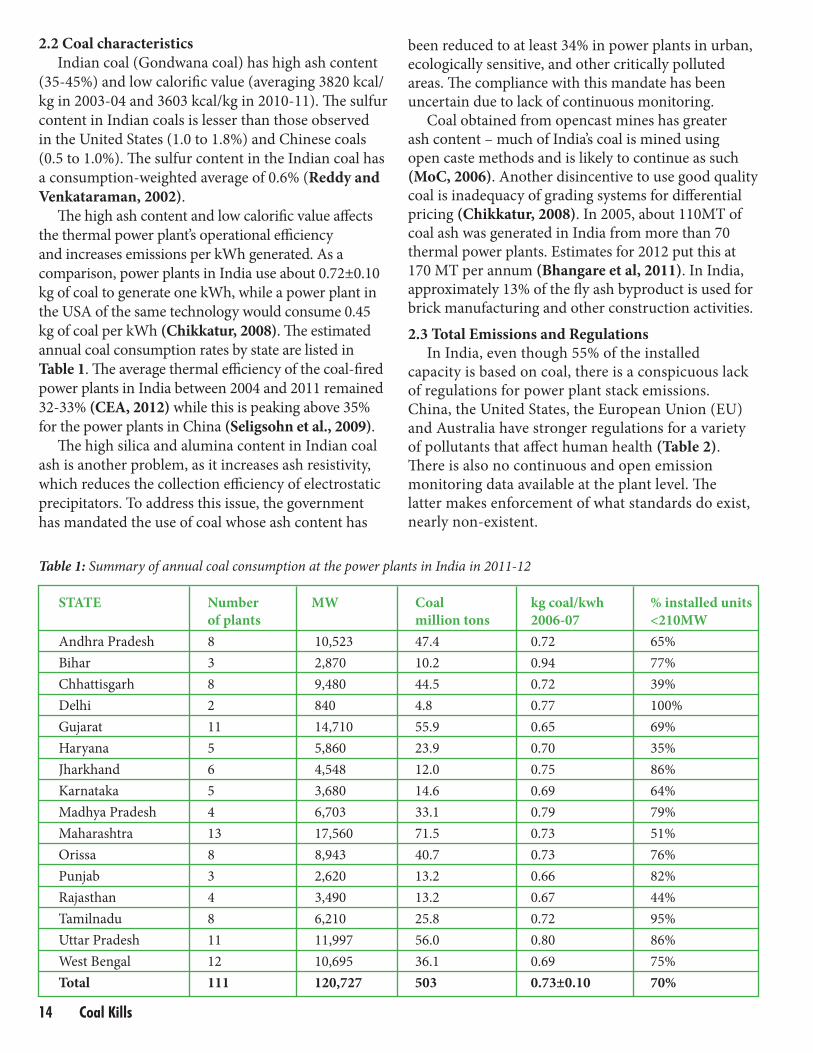
Table 1: Summary of annual coal consumption at the power plants in India in 2011-12
STATE Number MW Coal kg coal/kwh % installed units
of plants million tons 2006-07 <210MW
Andhra Pradesh 8 10,523 47.4 0.72 65%
Bihar 3 2,870 10.2 0.94 77%
Chhattisgarh 8 9,480 44.5 0.72 39%
Delhi 2 840 4.8 0.77 100%
Gujarat 11 14,710 55.9 0.65 69%
Haryana 5 5,860 23.9 0.70 35%
Jharkhand 6 4,548 12.0 0.75 86%
Karnataka 5 3,680 14.6 0.69 64%
Madhya Pradesh 4 6,703 33.1 0.79 79%
Maharashtra 13 17,560 71.5 0.73 51%
Orissa 8 8,943 40.7 0.73 76%
Punjab 3 2,620 13.2 0.66 82%
Rajasthan 4 3,490 13.2 0.67 44%
Tamilnadu 8 6,210 25.8 0.72 95%
Uttar Pradesh 11 11,997 56.0 0.80 86%
West Bengal 12 10,695 36.1 0.69 75%
Total 111 120,727 503 0.73±0.10 70%
15 Coal Kills
Table 2: Summary of emission standards for coal-fi red power plants
Country PM SO2 NO
2 Mercury
India a 350mg/Nm3 for <210MW None None None
150mg/Nm3 for >210MW
China b 30mg/Nm3 (proposed all) 100mg/Nm3 for new
20mg/Nm3 for key regions 200mg/Nm3 for old 100mg/Nm3 None
50mg/Nm3 for key regions
Australia c 100mg/Nm3 for 1997-2005 None 800mg/Nm3 for 1997-2005 In discussion
50mg/Nm3 aft er 2005 500mg/Nm3 aft er 2005 based on USA
standards
European Pre-2003 Pre-2003 Pre-2003 In discussion
Union c 100mg/Nm3 for <500MW Scaled for <500MW 600mg/Nm3 for <500MW
50mg/Nm3 for >500MW 400mg/Nm3 for >500MW 500mg/Nm3 for >500MW
Post 2003 Post 2003 Post 2003
50mg/Nm3 for <100MW 850mg/Nm3 for <100MW 400mg/Nm3 for <100MW
30mg/Nm3 for >100MW 200mg/Nm3 for >100MW 200mg/Nm3 for >100MW
USA c, d 37 mg/Nm3 for new 245 mg/Nm3 for new 61 mg/Nm3 for new
6 mg/Nm3 for old 50 mg/Nm3 for old 42 mg/Nm3 for old
USA c, e 6.4 gm/GJ 640 gm/MWh 450 gm/MWh for new 0.08 gm/MWh for lignite
720 gm/MWh for old 0.01 gm/MWh for IGCC
a – from Central Pollution Control Board (India) (http://cpcb.nic.in/Industry_Specifi c_Standards.php). Last accessed Feb 17th, 2013. Besides PM, only national ambient standards exist b – from standards information in Chinese (http://www.zhb.gov.cn/gkml/hbb/qt/201109/t20110921_217526.htm). Last accessed Feb 17th, 2013. Prior to 2011, the standards were based on commissioning year (before 1996, 1997 to 2004, and after 2004) c – Power stations emissions handbook (http://www.ccsd.biz/PSE_Handbook). Last accessed Feb 17th, 2013 d – Emission rates are translated to mg/Nm3 based on assumed plant effi ciency; e – in offi cial units; for mercury this is based on 12 month rolling average
For 2011-12, we estimated the annual emissions at 580 ktons for PM
2.5, 1200 ktons for PM
10, 2100
ktons of SO2, 2000 ktons of NOx, 1100 ktons of CO,
100 ktons of VOCs and 665 million tons of carbon
dioxide (CO2). Th e total estimated emissions by state
are presented in Table 3. For each plant in the state,
the database includes annual coal consumption rate,
total emissions, number of stacks per plant, and stack
parameters like location in longitude and latitude,
suitable for atmospheric dispersion modeling. Th e
total emission rates are calculated based on the boiler
size, coal consumption rates, and control equipment
effi ciencies, which is collected from thermal power
plant performance reports published by CEA.
All the stack emissions at the power plants are
monitored and regulated as concentrations only and
not in terms of total emissions per plant. For example,
for PM, the plants with generation capacity more than
210MW, the concentration limit in the fl ue gas is 150
mg/Nm3 and for the plants with generation capacity
of less than 210MW, the limit is 300 mg/Nm3. Th ese
limits are much higher than the currently practiced
limits in Australia, China, USA, and EU. Th e limit for the smaller plants can be reverted to 150 mg/Nm3, if they are located in an urban, ecologically sensitive, and other critically polluted areas – which is at the discretion of MoEF. A breakup in the emissions regulation at 210MW also led to installation of
smaller boilers at most of the power plants (Table 1).
Approximately 70% of the operational units in the
country are of the size less than or equal to 210MW
and these units tend to have the worst net effi ciency
and plant load factor. Th e newer plants are mostly
500MW or higher with the best net effi ciency of more
than 33% (CEA, 2012). Hence, effi ciency improvement
of existing older power plants and tightening of
emission standards for all sizes should become a
critical component for reducing the coal consumption
and atmospheric emissions. Diff erential emission
regulations also tend to result in use of control
equipment with low effi ciency and higher emissions.
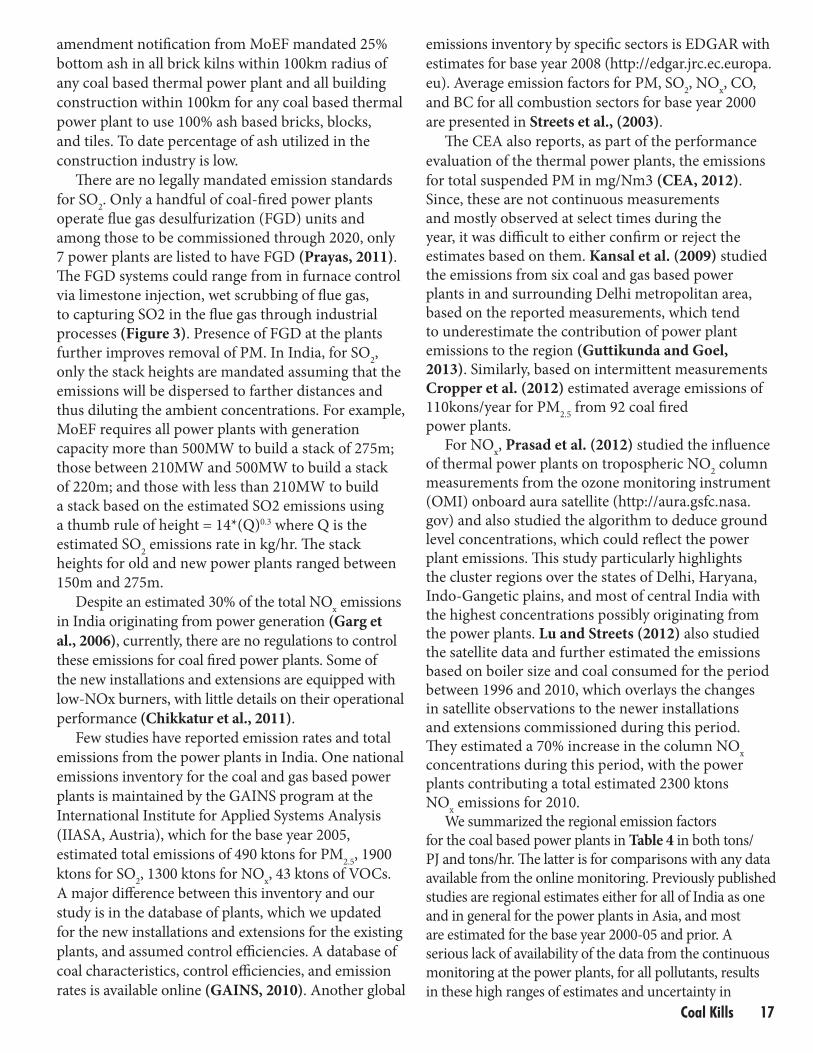
Particulate matter (PM) is the only pollutant for
which any pollution controls are widely used in India.
A schematic of a coal-fi red power plant is presented
16 Coal Kills
in Figure 3 that shows fl ue gas from the boilers at
high temperature and velocity passing through heat
exchangers to recycle the residual energy. Th is then
enters the particulate control equipment (ESP and
cyclone bag fi lters) for removal of entrained ash.
Electrostatic precipitators (ESPs) are installed in all
coal-fi red power plants. As removal effi ciencies at
ESPs are higher for coarse particles, most of the PM
dispersing from the top of the stack is in the size
range of respirable PM (10μm or less). Lu et al. (2010)
measured fractions of 50-60% PM2.5
and 90-95% PM10
in the total fi lterable PM in the fl ue gas at a 660MW
power plant. Th e PM in the fl ue gas also contains
high concentrations of heavy metals such as arsenic,
lead, cadmium, mercury, copper, and zinc, which not
only contributes to potential health hazard than the
bottom ash (Finkelman, 2007), but also increases the
resistivity and reduces the ESP collection effi ciency
to as low as 98%. Reddy et al. (2005) measured the
chemical composition of the bottom ash, fl y ash, and
fl ue gas from a coal fi red power plant in the western
India and estimated 1-7% of zinc, 2-7% of copper,
5-8% of manganese, 7-10% of cobalt, 12-18% of
cadmium, 60-70% of selenium, 70-80% of mercury,
and traces of arsenic, iron, lead, and chromium
contained in the coal was emitted in the fl ue gas.
Similar levels of entrainment were reported in an
estimate of total trace metal emissions from coal fi red
power plants in China (Chen et al., 2013).
Besides fl ue gas PM emissions, fugitive dust from
coal-handling plants and ash ponds (aft er the disposal
from the plants) is a problem. According to CEA, aft er
the combustion and application of control equipment,
ash collection at the power plants ranged 70-80%
of the total ash in the coal. It is assumed that the
remaining ash is dispersed from the stacks. In 2003, an
Figure 3: Simplifi ed schematics of coal-fi red power
plant operations
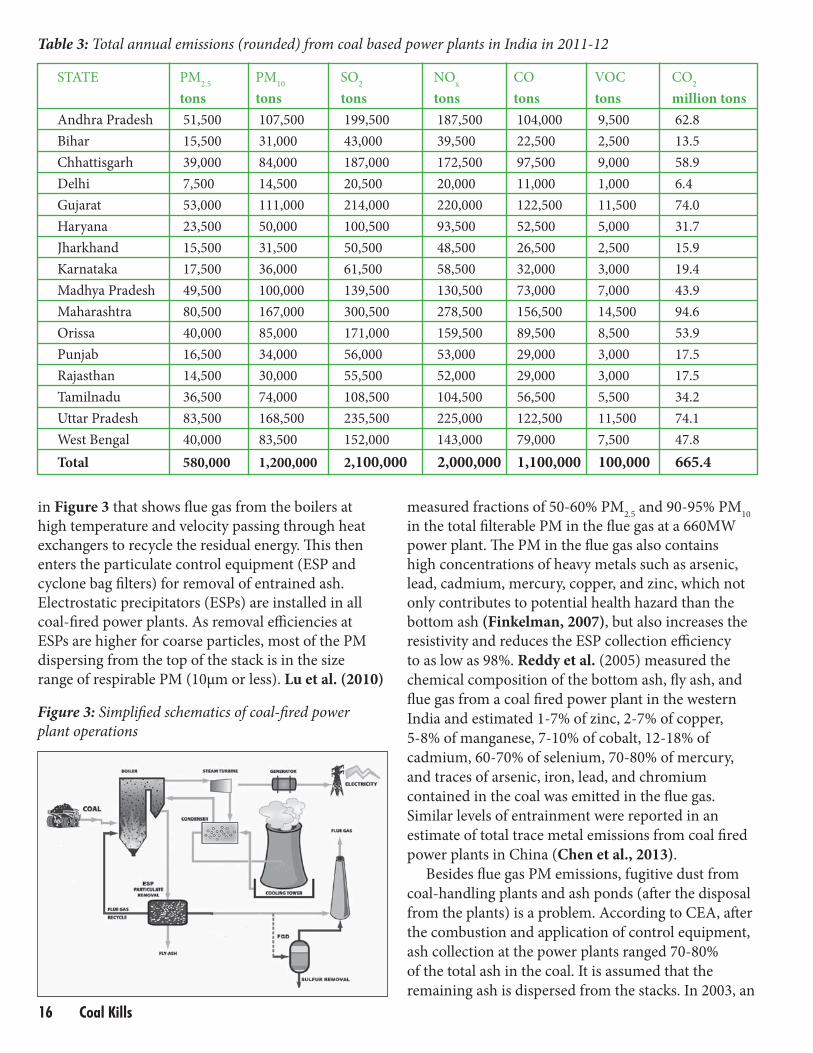
Table 3: Total annual emissions (rounded) from coal based power plants in India in 2011-12
STATE PM2.5
PM10
SO2 NO
x CO VOC CO
2
tons tons tons tons tons tons million tons
Andhra Pradesh 51,500 107,500 199,500 187,500 104,000 9,500 62.8
Bihar 15,500 31,000 43,000 39,500 22,500 2,500 13.5
Chhattisgarh 39,000 84,000 187,000 172,500 97,500 9,000 58.9
Delhi 7,500 14,500 20,500 20,000 11,000 1,000 6.4
Gujarat 53,000 111,000 214,000 220,000 122,500 11,500 74.0
Haryana 23,500 50,000 100,500 93,500 52,500 5,000 31.7
Jharkhand 15,500 31,500 50,500 48,500 26,500 2,500 15.9
Karnataka 17,500 36,000 61,500 58,500 32,000 3,000 19.4
Madhya Pradesh 49,500 100,000 139,500 130,500 73,000 7,000 43.9
Maharashtra 80,500 167,000 300,500 278,500 156,500 14,500 94.6
Orissa 40,000 85,000 171,000 159,500 89,500 8,500 53.9
Punjab 16,500 34,000 56,000 53,000 29,000 3,000 17.5
Rajasthan 14,500 30,000 55,500 52,000 29,000 3,000 17.5
Tamilnadu 36,500 74,000 108,500 104,500 56,500 5,500 34.2
Uttar Pradesh 83,500 168,500 235,500 225,000 122,500 11,500 74.1
West Bengal 40,000 83,500 152,000 143,000 79,000 7,500 47.8
Total 580,000 1,200,000 2,100,000 2,000,000 1,100,000 100,000 665.4
17 Coal Kills
amendment notifi cation from MoEF mandated 25%
bottom ash in all brick kilns within 100km radius of
any coal based thermal power plant and all building
construction within 100km for any coal based thermal
power plant to use 100% ash based bricks, blocks,
and tiles. To date percentage of ash utilized in the
construction industry is low.
Th ere are no legally mandated emission standards
for SO2. Only a handful of coal-fi red power plants
operate fl ue gas desulfurization (FGD) units and
among those to be commissioned through 2020, only
7 power plants are listed to have FGD (Prayas, 2011).
Th e FGD systems could range from in furnace control
via limestone injection, wet scrubbing of fl ue gas,
to capturing SO2 in the fl ue gas through industrial
processes (Figure 3). Presence of FGD at the plants
further improves removal of PM. In India, for SO2,
only the stack heights are mandated assuming that the
emissions will be dispersed to farther distances and
thus diluting the ambient concentrations. For example,
MoEF requires all power plants with generation
capacity more than 500MW to build a stack of 275m;
those between 210MW and 500MW to build a stack
of 220m; and those with less than 210MW to build
a stack based on the estimated SO2 emissions using
a thumb rule of height = 14*(Q)0.3 where Q is the
estimated SO2 emissions rate in kg/hr. Th e stack
heights for old and new power plants ranged between
150m and 275m.
Despite an estimated 30% of the total NOx emissions
in India originating from power generation (Garg et
al., 2006), currently, there are no regulations to control
these emissions for coal fi red power plants. Some of
the new installations and extensions are equipped with
low-NOx burners, with little details on their operational
performance (Chikkatur et al., 2011).
Few studies have reported emission rates and total
emissions from the power plants in India. One national
emissions inventory for the coal and gas based power
plants is maintained by the GAINS program at the
International Institute for Applied Systems Analysis
(IIASA, Austria), which for the base year 2005,
estimated total emissions of 490 ktons for PM2.5
, 1900
ktons for SO2, 1300 ktons for NO
x, 43 ktons of VOCs.
A major diff erence between this inventory and our
study is in the database of plants, which we updated
for the new installations and extensions for the existing
plants, and assumed control effi ciencies. A database of
coal characteristics, control effi ciencies, and emission
rates is available online (GAINS, 2010). Another global
emissions inventory by specifi c sectors is EDGAR with
estimates for base year 2008 (http://edgar.jrc.ec.europa.
eu). Average emission factors for PM, SO2, NO
x, CO,
and BC for all combustion sectors for base year 2000
are presented in Streets et al., (2003).
Th e CEA also reports, as part of the performance
evaluation of the thermal power plants, the emissions
for total suspended PM in mg/Nm3 (CEA, 2012). Since, these are not continuous measurements and mostly observed at select times during the year, it was diffi cult to either confi rm or reject the estimates based on them. Kansal et al. (2009) studied the emissions from six coal and gas based power plants in and surrounding Delhi metropolitan area, based on the reported measurements, which tend to underestimate the contribution of power plant emissions to the region (Guttikunda and Goel, 2013). Similarly, based on intermittent measurements Cropper et al. (2012) estimated average emissions of 110kons/year for PM
2.5 from 92 coal fi red
power plants. For NO
x, Prasad et al. (2012) studied the infl uence
of thermal power plants on tropospheric NO2 column
measurements from the ozone monitoring instrument (OMI) onboard aura satellite (http://aura.gsfc.nasa.gov) and also studied the algorithm to deduce ground level concentrations, which could refl ect the power plant emissions. Th is study particularly highlights the cluster regions over the states of Delhi, Haryana, Indo-Gangetic plains, and most of central India with the highest concentrations possibly originating from the power plants. Lu and Streets (2012) also studied the satellite data and further estimated the emissions based on boiler size and coal consumed for the period between 1996 and 2010, which overlays the changes in satellite observations to the newer installations and extensions commissioned during this period. Th ey estimated a 70% increase in the column NO
x
concentrations during this period, with the power plants contributing a total estimated 2300 ktons NO
x emissions for 2010.
We summarized the regional emission factors for the coal based power plants in Table 4 in both tons/PJ and tons/hr. Th e latter is for comparisons with any data available from the online monitoring. Previously published studies are regional estimates either for all of India as one and in general for the power plants in Asia, and most are estimated for the base year 2000-05 and prior. A serious lack of availability of the data from the continuous monitoring at the power plants, for all pollutants, results
in these high ranges of estimates and uncertainty in
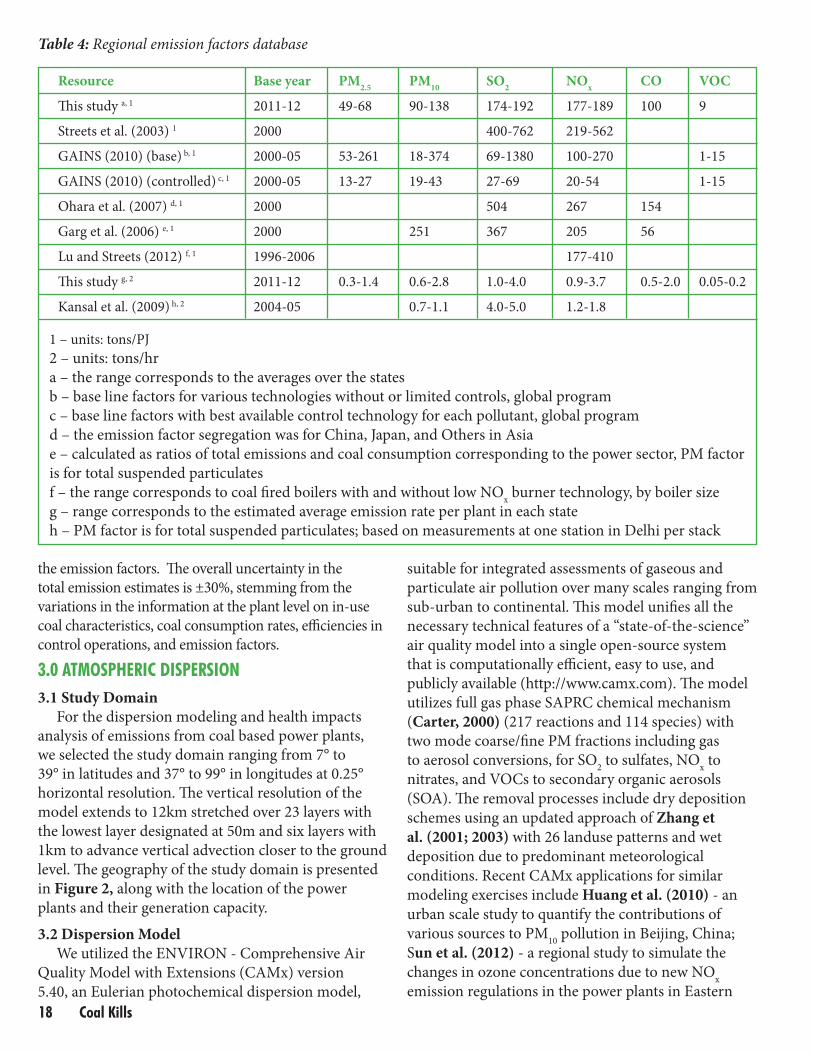
18 Coal Kills
Table 4: Regional emission factors database
Resource Base year PM2.5
PM10
SO2 NO
x CO VOC
Th is study a, 1 2011-12 49-68 90-138 174-192 177-189 100 9
Streets et al. (2003) 1 2000 400-762 219-562
GAINS (2010) (base) b, 1 2000-05 53-261 18-374 69-1380 100-270 1-15
GAINS (2010) (controlled) c, 1 2000-05 13-27 19-43 27-69 20-54 1-15
Ohara et al. (2007) d, 1 2000 504 267 154
Garg et al. (2006) e, 1 2000 251 367 205 56
Lu and Streets (2012) f, 1 1996-2006 177-410
Th is study g, 2 2011-12 0.3-1.4 0.6-2.8 1.0-4.0 0.9-3.7 0.5-2.0 0.05-0.2
Kansal et al. (2009) h, 2 2004-05 0.7-1.1 4.0-5.0 1.2-1.8
1 – units: tons/PJ
2 – units: tons/hr
a – the range corresponds to the averages over the states
b – base line factors for various technologies without or limited controls, global program
c – base line factors with best available control technology for each pollutant, global program
d – the emission factor segregation was for China, Japan, and Others in Asia
e – calculated as ratios of total emissions and coal consumption corresponding to the power sector, PM factor
is for total suspended particulates
f – the range corresponds to coal fi red boilers with and without low NOx burner technology, by boiler size
g – range corresponds to the estimated average emission rate per plant in each state
h – PM factor is for total suspended particulates; based on measurements at one station in Delhi per stack
the emission factors. Th e overall uncertainty in the total emission estimates is ±30%, stemming from the variations in the information at the plant level on in-use coal characteristics, coal consumption rates, effi ciencies in control operations, and emission factors.
3.0 ATMOSPHERIC DISPERSION3.1 Study Domain
For the dispersion modeling and health impacts analysis of emissions from coal based power plants, we selected the study domain ranging from 7° to 39° in latitudes and 37° to 99° in longitudes at 0.25° horizontal resolution. Th e vertical resolution of the
model extends to 12km stretched over 23 layers with
the lowest layer designated at 50m and six layers with
1km to advance vertical advection closer to the ground
level. Th e geography of the study domain is presented
in Figure 2, along with the location of the power
plants and their generation capacity.
3.2 Dispersion Model
We utilized the ENVIRON - Comprehensive Air
Quality Model with Extensions (CAMx) version
5.40, an Eulerian photochemical dispersion model,
suitable for integrated assessments of gaseous and
particulate air pollution over many scales ranging from
sub-urban to continental. Th is model unifi es all the
necessary technical features of a “state-of-the-science”
air quality model into a single open-source system
that is computationally effi cient, easy to use, and
publicly available (http://www.camx.com). Th e model
utilizes full gas phase SAPRC chemical mechanism
(Carter, 2000) (217 reactions and 114 species) with
two mode coarse/fi ne PM fractions including gas
to aerosol conversions, for SO2 to sulfates, NO
x to
nitrates, and VOCs to secondary organic aerosols
(SOA). Th e removal processes include dry deposition
schemes using an updated approach of Zhang et
al. (2001; 2003) with 26 landuse patterns and wet
deposition due to predominant meteorological
conditions. Recent CAMx applications for similar
modeling exercises include Huang et al. (2010) - an
urban scale study to quantify the contributions of
various sources to PM10
pollution in Beijing, China;
Sun et al. (2012) - a regional study to simulate the
changes in ozone concentrations due to new NOx
emission regulations in the power plants in Eastern
19 Coal Kills
which further increasing the vertical release point. Th e
emissions for each stack are released in the vertical
layer corresponding to stack height + plume rise due
to momentum and buoyancy. We did not include
emissions from the other sectors and considered the
results of this exercise as the incremental change in the
ambient concentrations due to the presence of these
coal based power plants in the region.
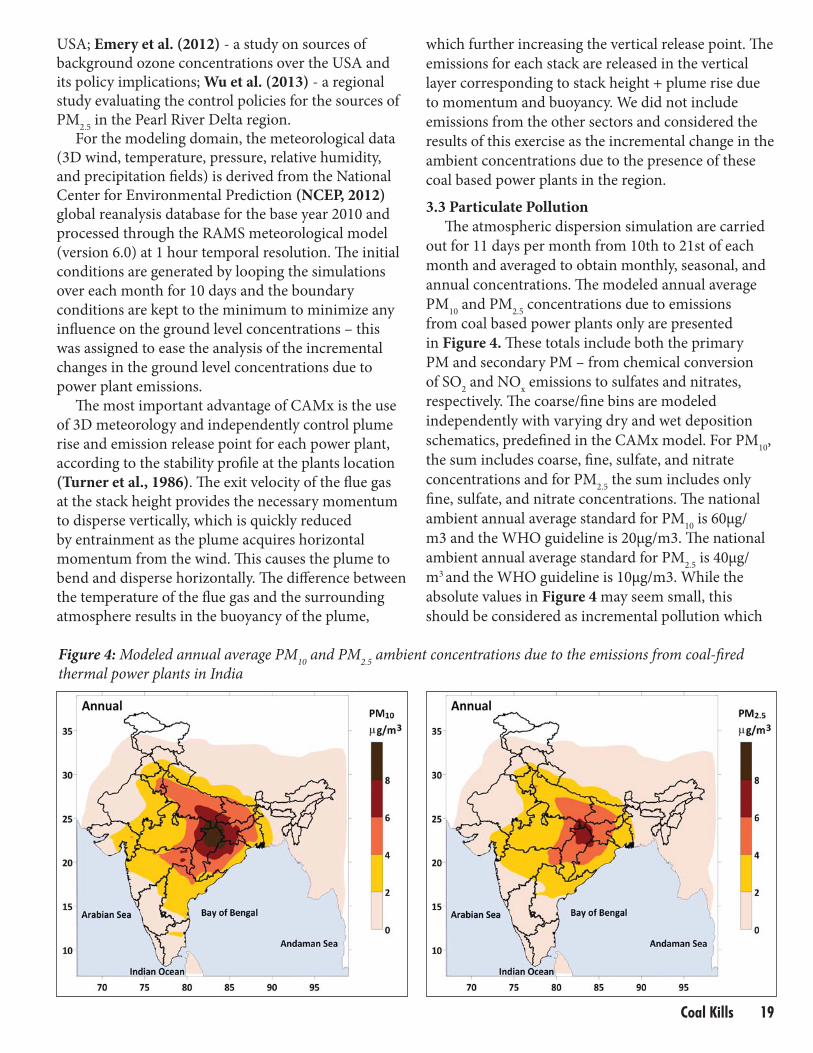
3.3 Particulate Pollution
Th e atmospheric dispersion simulation are carried
out for 11 days per month from 10th to 21st of each
month and averaged to obtain monthly, seasonal, and
annual concentrations. Th e modeled annual average
PM10
and PM2.5
concentrations due to emissions
from coal based power plants only are presented
in Figure 4. Th ese totals include both the primary
PM and secondary PM – from chemical conversion
of SO2 and NO
x emissions to sulfates and nitrates,
respectively. Th e coarse/fi ne bins are modeled
independently with varying dry and wet deposition
schematics, predefi ned in the CAMx model. For PM10
,
the sum includes coarse, fi ne, sulfate, and nitrate
concentrations and for PM2.5
the sum includes only
fi ne, sulfate, and nitrate concentrations. Th e national
ambient annual average standard for PM10
is 60μg/
m3 and the WHO guideline is 20μg/m3. Th e national
ambient annual average standard for PM2.5
is 40μg/
m3 and the WHO guideline is 10μg/m3. While the
absolute values in Figure 4 may seem small, this
should be considered as incremental pollution which
USA; Emery et al. (2012) - a study on sources of background ozone concentrations over the USA and its policy implications; Wu et al. (2013) - a regional study evaluating the control policies for the sources of PM
2.5 in the Pearl River Delta region.
For the modeling domain, the meteorological data (3D wind, temperature, pressure, relative humidity, and precipitation fi elds) is derived from the National Center for Environmental Prediction (NCEP, 2012) global reanalysis database for the base year 2010 and
processed through the RAMS meteorological model
(version 6.0) at 1 hour temporal resolution. Th e initial
conditions are generated by looping the simulations
over each month for 10 days and the boundary
conditions are kept to the minimum to minimize any
infl uence on the ground level concentrations – this
was assigned to ease the analysis of the incremental
changes in the ground level concentrations due to
power plant emissions.
Th e most important advantage of CAMx is the use
of 3D meteorology and independently control plume
rise and emission release point for each power plant,
according to the stability profi le at the plants location
(Turner et al., 1986). Th e exit velocity of the fl ue gas
at the stack height provides the necessary momentum
to disperse vertically, which is quickly reduced
by entrainment as the plume acquires horizontal
momentum from the wind. Th is causes the plume to
bend and disperse horizontally. Th e diff erence between
the temperature of the fl ue gas and the surrounding
atmosphere results in the buoyancy of the plume,
Figure 4: Modeled annual average PM10
and PM2.5
ambient concentrations due to the emissions from coal-fi red
thermal power plants in India
20 Coal Kills
the population in the region is exposed to, besides
the pollution from transport, domestic, and other
industrial activities, on an annual basis.
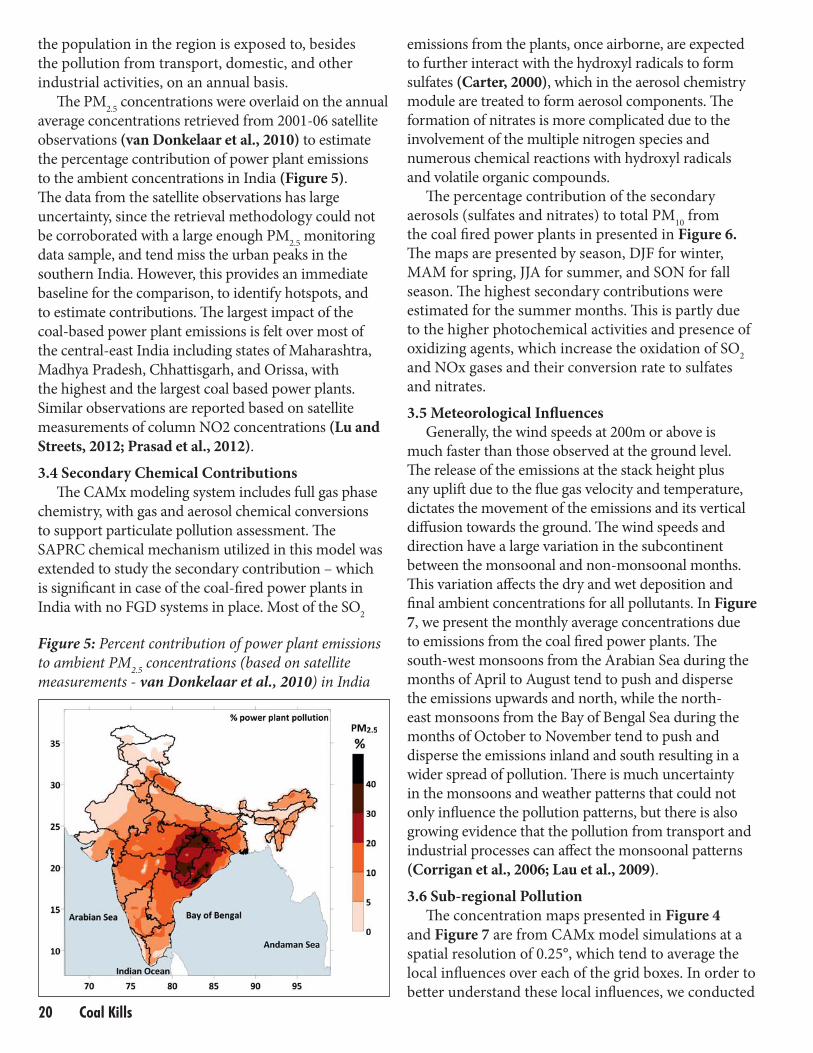
Th e PM2.5
concentrations were overlaid on the annual
average concentrations retrieved from 2001-06 satellite
observations (van Donkelaar et al., 2010) to estimate
the percentage contribution of power plant emissions
to the ambient concentrations in India (Figure 5).
Th e data from the satellite observations has large
uncertainty, since the retrieval methodology could not
be corroborated with a large enough PM2.5
monitoring
data sample, and tend miss the urban peaks in the
southern India. However, this provides an immediate
baseline for the comparison, to identify hotspots, and
to estimate contributions. Th e largest impact of the
coal-based power plant emissions is felt over most of
the central-east India including states of Maharashtra,
Madhya Pradesh, Chhattisgarh, and Orissa, with
the highest and the largest coal based power plants.
Similar observations are reported based on satellite
measurements of column NO2 concentrations (Lu and
Streets, 2012; Prasad et al., 2012).
3.4 Secondary Chemical Contributions
Th e CAMx modeling system includes full gas phase
chemistry, with gas and aerosol chemical conversions
to support particulate pollution assessment. Th e
SAPRC chemical mechanism utilized in this model was
extended to study the secondary contribution – which
is signifi cant in case of the coal-fi red power plants in
India with no FGD systems in place. Most of the SO2
emissions from the plants, once airborne, are expected to further interact with the hydroxyl radicals to form sulfates (Carter, 2000), which in the aerosol chemistry module are treated to form aerosol components. Th e formation of nitrates is more complicated due to the involvement of the multiple nitrogen species and numerous chemical reactions with hydroxyl radicals and volatile organic compounds.
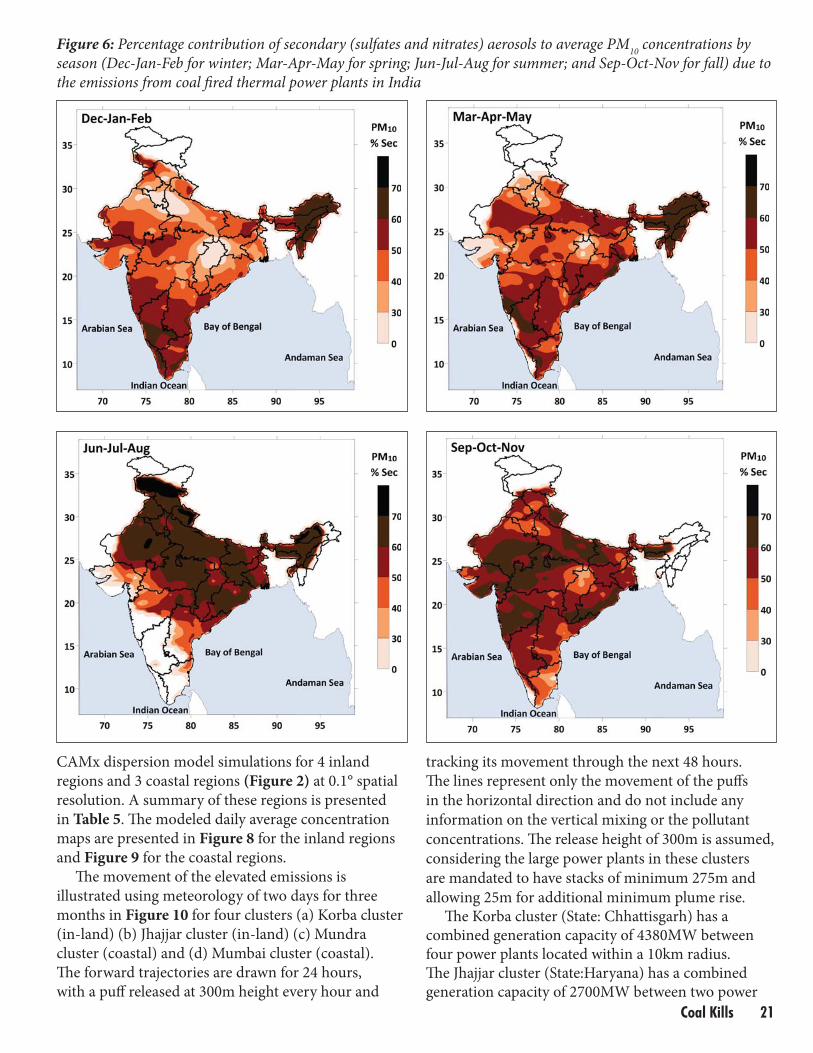
Th e percentage contribution of the secondary aerosols (sulfates and nitrates) to total PM
10 from
the coal fi red power plants in presented in Figure 6. Th e maps are presented by season, DJF for winter, MAM for spring, JJA for summer, and SON for fall season. Th e highest secondary contributions were estimated for the summer months. Th is is partly due to the higher photochemical activities and presence of oxidizing agents, which increase the oxidation of SO
2
and NOx gases and their conversion rate to sulfates and nitrates.
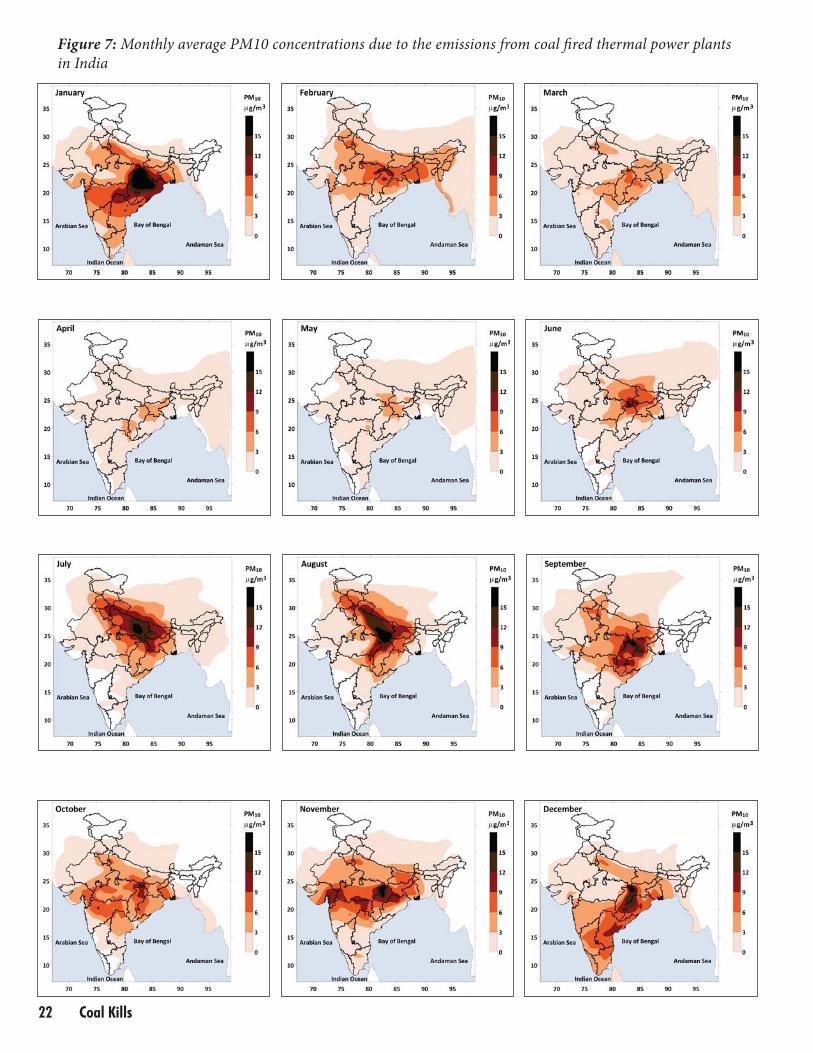
3.5 Meteorological Infl uencesGenerally, the wind speeds at 200m or above is
much faster than those observed at the ground level. Th e release of the emissions at the stack height plus any uplift due to the fl ue gas velocity and temperature, dictates the movement of the emissions and its vertical diff usion towards the ground. Th e wind speeds and direction have a large variation in the subcontinent between the monsoonal and non-monsoonal months. Th is variation aff ects the dry and wet deposition and fi nal ambient concentrations for all pollutants. In Figure 7, we present the monthly average concentrations due to emissions from the coal fi red power plants. Th e south-west monsoons from the Arabian Sea during the months of April to August tend to push and disperse the emissions upwards and north, while the north-east monsoons from the Bay of Bengal Sea during the months of October to November tend to push and disperse the emissions inland and south resulting in a wider spread of pollution. Th ere is much uncertainty in the monsoons and weather patterns that could not only infl uence the pollution patterns, but there is also growing evidence that the pollution from transport and industrial processes can aff ect the monsoonal patterns
(Corrigan et al., 2006; Lau et al., 2009).
3.6 Sub-regional Pollution
Th e concentration maps presented in Figure 4
and Figure 7 are from CAMx model simulations at a
spatial resolution of 0.25°, which tend to average the
local infl uences over each of the grid boxes. In order to
better understand these local infl uences, we conducted
Figure 5: Percent contribution of power plant emissions
to ambient PM2.5
concentrations (based on satellite
measurements - van Donkelaar et al., 2010) in India
21 Coal Kills
CAMx dispersion model simulations for 4 inland
regions and 3 coastal regions (Figure 2) at 0.1° spatial
resolution. A summary of these regions is presented
in Table 5. Th e modeled daily average concentration
maps are presented in Figure 8 for the inland regions
and Figure 9 for the coastal regions.
Th e movement of the elevated emissions is
illustrated using meteorology of two days for three
months in Figure 10 for four clusters (a) Korba cluster
(in-land) (b) Jhajjar cluster (in-land) (c) Mundra
cluster (coastal) and (d) Mumbai cluster (coastal).
Th e forward trajectories are drawn for 24 hours,
with a puff released at 300m height every hour and
Figure 6: Percentage contribution of secondary (sulfates and nitrates) aerosols to average PM10
concentrations by
season (Dec-Jan-Feb for winter; Mar-Apr-May for spring; Jun-Jul-Aug for summer; and Sep-Oct-Nov for fall) due to
the emissions from coal fi red thermal power plants in India
tracking its movement through the next 48 hours.
Th e lines represent only the movement of the puff s
in the horizontal direction and do not include any
information on the vertical mixing or the pollutant
concentrations. Th e release height of 300m is assumed,
considering the large power plants in these clusters
are mandated to have stacks of minimum 275m and
allowing 25m for additional minimum plume rise.Th e Korba cluster (State: Chhattisgarh) has a
combined generation capacity of 4380MW between four power plants located within a 10km radius. Th e Jhajjar cluster (State:Haryana) has a combined generation capacity of 2700MW between two power
22 Coal Kills
Figure 7: Monthly average PM10 concentrations due to the emissions from coal fi red thermal power plants
in India
23 Coal Kills
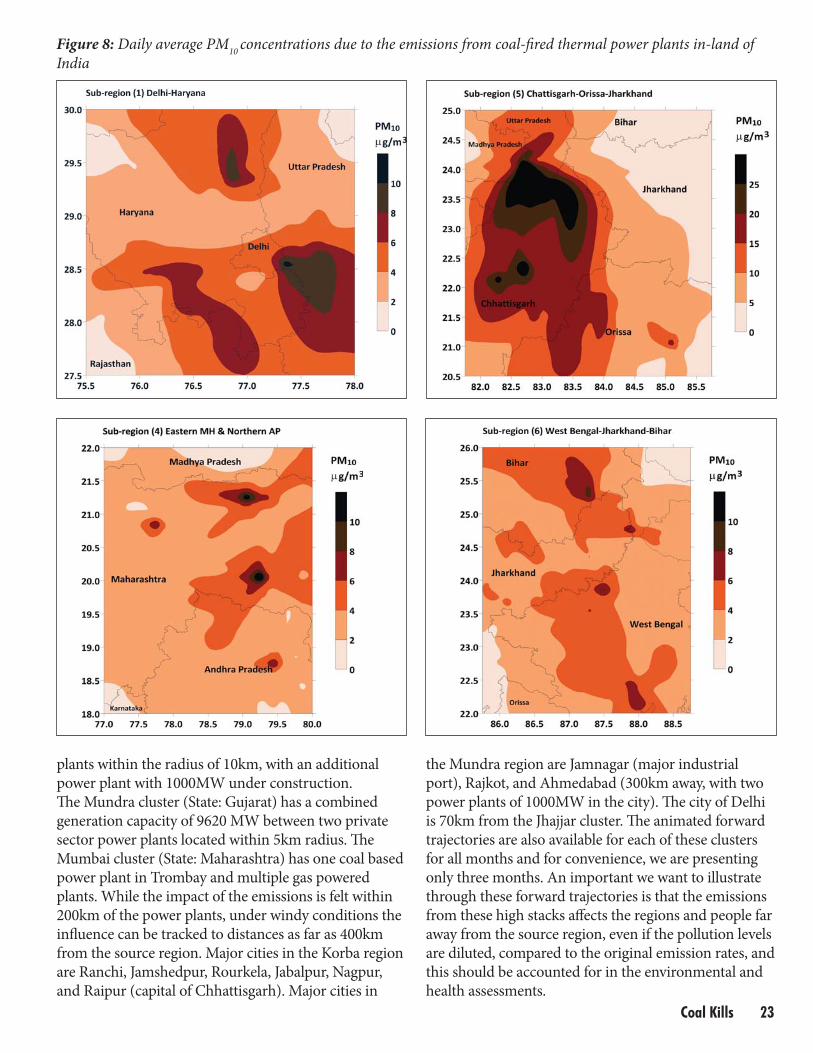
Figure 8: Daily average PM10
concentrations due to the emissions from coal-fi red thermal power plants in-land of
India
plants within the radius of 10km, with an additional power plant with 1000MW under construction. Th e Mundra cluster (State: Gujarat) has a combined generation capacity of 9620 MW between two private sector power plants located within 5km radius. Th e Mumbai cluster (State: Maharashtra) has one coal based power plant in Trombay and multiple gas powered plants. While the impact of the emissions is felt within 200km of the power plants, under windy conditions the infl uence can be tracked to distances as far as 400km from the source region. Major cities in the Korba region are Ranchi, Jamshedpur, Rourkela, Jabalpur, Nagpur, and Raipur (capital of Chhattisgarh). Major cities in
the Mundra region are Jamnagar (major industrial port), Rajkot, and Ahmedabad (300km away, with two power plants of 1000MW in the city). Th e city of Delhi is 70km from the Jhajjar cluster. Th e animated forward trajectories are also available for each of these clusters for all months and for convenience, we are presenting only three months. An important we want to illustrate through these forward trajectories is that the emissions from these high stacks aff ects the regions and people far away from the source region, even if the pollution levels are diluted, compared to the original emission rates, and this should be accounted for in the environmental and health assessments.
24 Coal Kills
Table 5: Installed capacity, modeled daily average PM10
concentrations, health impacts of emissions from coal
fi red power plants for 7 regions at fi ner resolution in India in 2011-12
No. Cluster Regional features No. of plants Installed Modeled Estimated
(size in degrees) (those more capacity PM10
a premature
than 1000MW) (MW) - median mortality
(95th within the
percentile) region b
μg/m3
1 Delhi – Haryana Delhi is the national 8 (5) 8080 3.9 (7.7) 6400-8800
capital, listed among the top 10
cities with worst air quality in
the world (WHO, 2011) and
Haryana is an agricultural state
2 Kutch (Gujarat) Two super-critical power plants 5 (2) 9900 1.0 (2.8) 100-120
(2.5° x 2.5°) are commissioned in Mundra
(Gujarat), both private, operated
by Tata and Adani power groups
3 Western-MH Including Mumbai, the most 3 (1) 2780 0.9 (2.3) 1700-2400
(2.5° x 2.5°) commercial and congested city
in the country
4 Eastern MH and All plants are located closer to 10 (6) 14,800 3.2 (5.1) 1100-1500
Northern AP the coal belts of Chandarpur and
(3.0° x 4.0°) Ghugus (Maharashtra - MH) and
Singareni (Andhra Pradesh - AP)
5 MP-CH-JH-OR Th is the densest cluster region 21 (10) 29,900 9.1 (23.1) 7900-11000
(4.0° x 4.5°) of the seven covering four states
– Madhya Pradesh (MP),
Jharkhand (JH), Chhattisgarh (CH)
and Orissa (OR) and home to the
largest coal fi elds of Jharia,
Dhanbad, Korba, Singrauli,
Karanpura, and Mahanadi
6 WB-JH-BH Th is is the second densest cluster 19 (7) 17,100 3.7 (5.6) 10700-14900
(3.0° x 4.0°) region covering clusters in
West Bengal (WB), JH, and
Bihar (BH) sourcing mostly from
Raniganj and Jharia coal belts
7 Eastern AP Another coastal cluster including 2 (2) 3000 0.8 (1.8) 1100-1500
(2.5° x 2.5°) the port city of Vishakhapatnam
a - the PM10
concentrations are modeled grid averages – grid resolution is 0.1°, equivalent of 10km
Median and 95th percentile value is based on averages for all the grids in the select sub-regional domain
b – this is the estimate for the exposed population in the select geographical sub-region, but the infl uence of
the power plant emissions reaches farther (illustrated in the forward trajectories – Figure10)
Th e PM pollution from the coal-fi red power plants in Central India (sub-region 5) covering states of Madhya Pradesh, Jharkhand, Orissa, and Chhattisgarh, is the highest due to the density of the power plants in the region and higher installed generation capacity because of its proximity to the coal mines. Th e sub-region 1, Delhi-Haryana, region with the highest population density with more than 21.5 million inhabitants in Delhi and its satellite cities, also experiences substantial PM
pollution from coal fi red power plants. Th e range of modeled PM pollution is also presented in Table 5. Th e coastal regions in Figure 9 experience the least of the PM pollution due to strong land-sea breezes, with much of the pollution dispersed over the seas. While the air pollution from these coastal power plants is diluted over the seas for some months, they are equally threatening from water and soil pollution from the coal washeries
and ash dumps. To date the inland power plants are
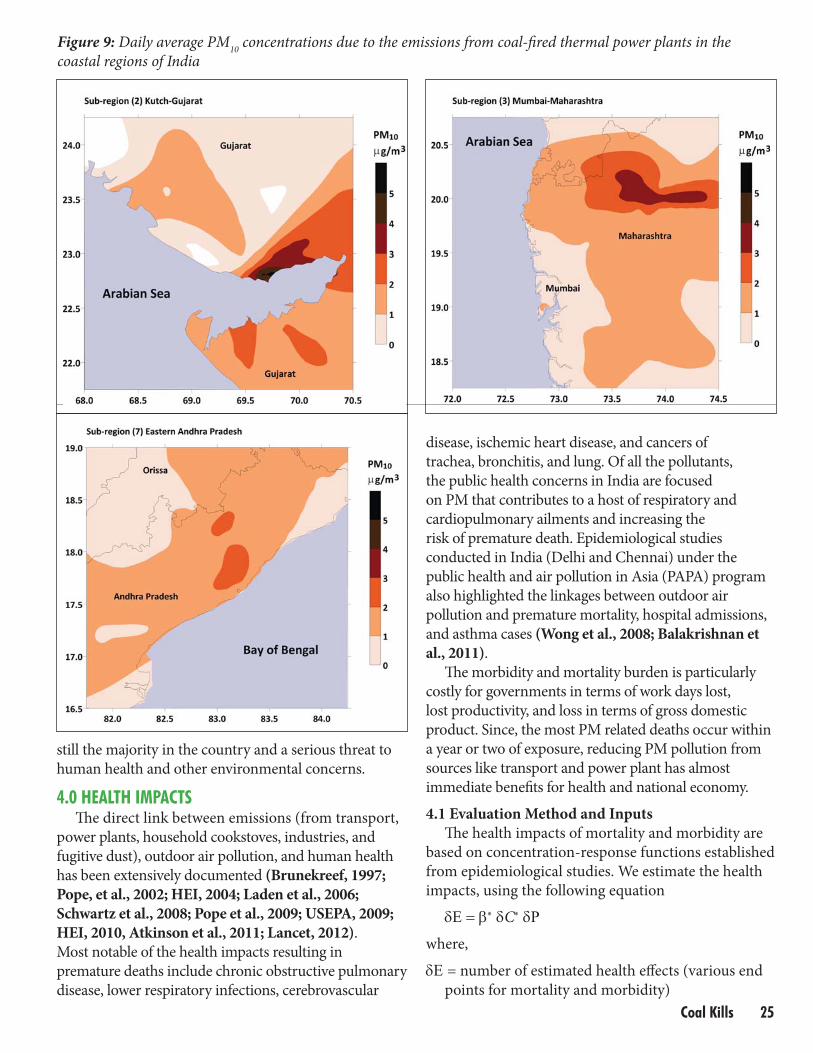
25 Coal Kills
still the majority in the country and a serious threat to
human health and other environmental concerns.
4.0 HEALTH IMPACTSTh e direct link between emissions (from transport,
power plants, household cookstoves, industries, and
fugitive dust), outdoor air pollution, and human health
has been extensively documented (Brunekreef, 1997;
Pope, et al., 2002; HEI, 2004; Laden et al., 2006;
Schwartz et al., 2008; Pope et al., 2009; USEPA, 2009;
HEI, 2010, Atkinson et al., 2011; Lancet, 2012).
Most notable of the health impacts resulting in
premature deaths include chronic obstructive pulmonary
disease, lower respiratory infections, cerebrovascular
disease, ischemic heart disease, and cancers of
trachea, bronchitis, and lung. Of all the pollutants,
the public health concerns in India are focused
on PM that contributes to a host of respiratory and
cardiopulmonary ailments and increasing the
risk of premature death. Epidemiological studies
conducted in India (Delhi and Chennai) under the
public health and air pollution in Asia (PAPA) program
also highlighted the linkages between outdoor air
pollution and premature mortality, hospital admissions,
and asthma cases (Wong et al., 2008; Balakrishnan et
al., 2011).
Th e morbidity and mortality burden is particularly
costly for governments in terms of work days lost,
lost productivity, and loss in terms of gross domestic
product. Since, the most PM related deaths occur within
a year or two of exposure, reducing PM pollution from
sources like transport and power plant has almost
immediate benefi ts for health and national economy.
4.1 Evaluation Method and Inputs
Th e health impacts of mortality and morbidity are
based on concentration-response functions established
from epidemiological studies. We estimate the health
impacts, using the following equation
C
where,
= number of estimated health eff ects (various end
points for mortality and morbidity)
Figure 9: Daily average PM10
concentrations due to the emissions from coal-fi red thermal power plants in the
coastal regions of India
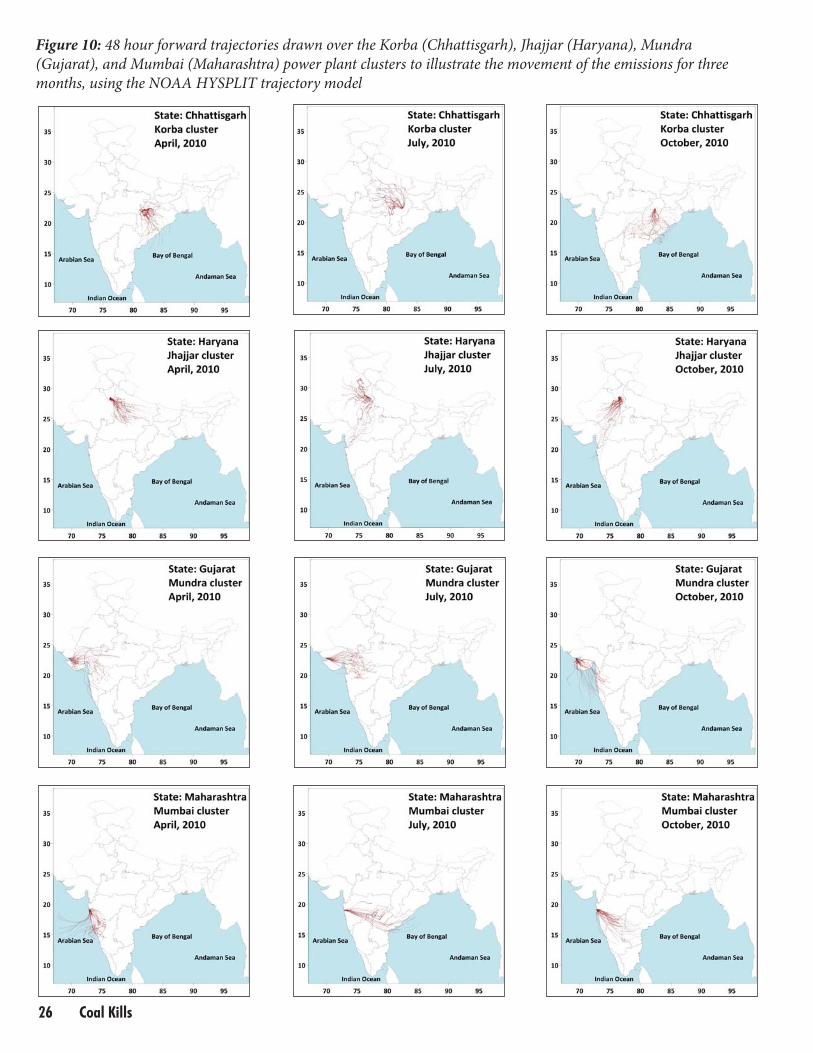
26 Coal Kills
Figure 10: 48 hour forward trajectories drawn over the Korba (Chhattisgarh), Jhajjar (Haryana), Mundra
(Gujarat), and Mumbai (Maharashtra) power plant clusters to illustrate the movement of the emissions for three
months, using the NOAA HYSPLIT trajectory model
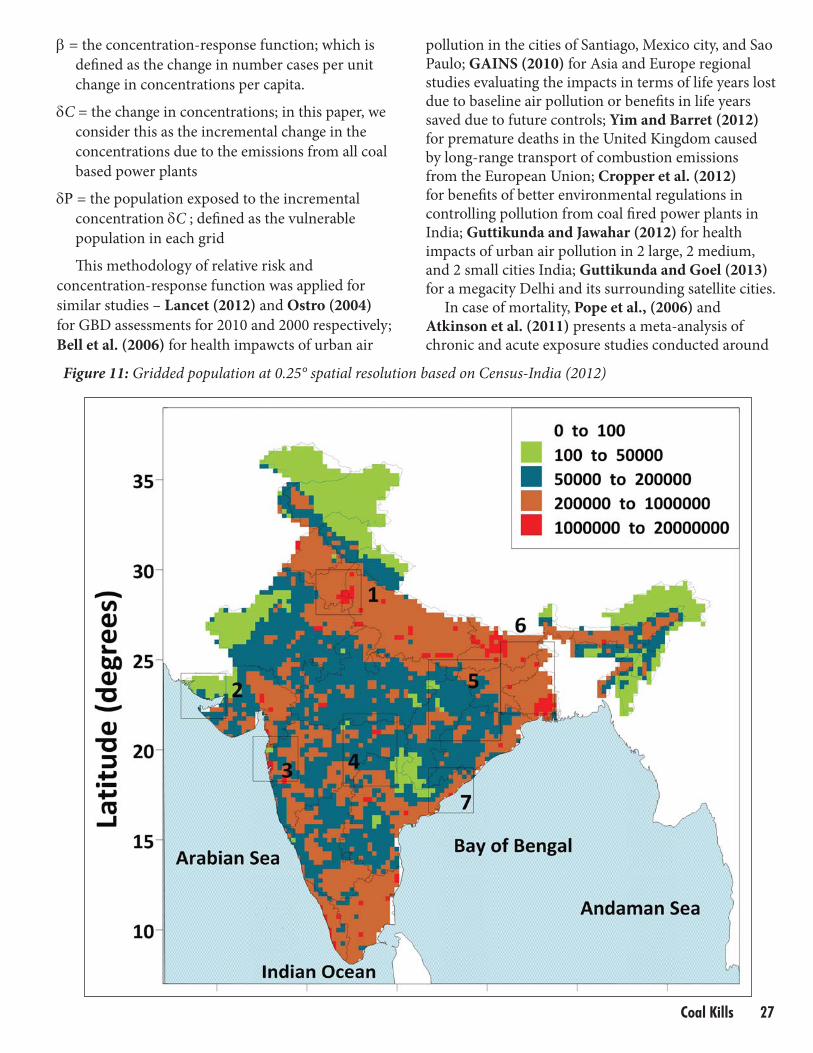
27 Coal Kills
= the concentration-response function; which is
defi ned as the change in number cases per unit
change in concentrations per capita.
C = the change in concentrations; in this paper, we
consider this as the incremental change in the
concentrations due to the emissions from all coal
based power plants
= the population exposed to the incremental
concentration C ; defi ned as the vulnerable
population in each grid
Th is methodology of relative risk and
concentration-response function was applied for
similar studies – Lancet (2012) and Ostro (2004)
for GBD assessments for 2010 and 2000 respectively;
Bell et al. (2006) for health impawcts of urban air
pollution in the cities of Santiago, Mexico city, and Sao Paulo; GAINS (2010) for Asia and Europe regional studies evaluating the impacts in terms of life years lost due to baseline air pollution or benefi ts in life years saved due to future controls; Yim and Barret (2012) for premature deaths in the United Kingdom caused by long-range transport of combustion emissions from the European Union; Cropper et al. (2012) for benefi ts of better environmental regulations in controlling pollution from coal fi red power plants in India; Guttikunda and Jawahar (2012) for health impacts of urban air pollution in 2 large, 2 medium, and 2 small cities India; Guttikunda and Goel (2013) for a megacity Delhi and its surrounding satellite cities.
In case of mortality, Pope et al., (2006) and Atkinson et al. (2011) presents a meta-analysis of chronic and acute exposure studies conducted around
Figure 11: Gridded population at 0.25° spatial resolution based on Census-India (2012)
28 Coal Kills
the world and the range of concentration-response
function for PM pollution, including the results of
Wong et al. (2008) and Balakrishnan et al. (2011)
from PAPA program in Asia. Atkinson et al. (2011)
reported change in all-cause daily mortality per 10 μg/
m3 change in ambient PM10
concentrations for average
and high estimates as 0.55% and 0.8% respectively.
A combined analysis for the 4 cities under the PAPA
program in Asia reported an average value of 0.45%.
We also estimate morbidity in terms of asthma cases,
chronic bronchitis, hospital admissions, and work
days lost. Th e concentration-response functions for
morbidity are extracted from Abbey et al. (1995) and
Croitoru et al. (2012).
Th e following assumptions are applied (a) that
the concentration-response to changing air pollution
is similar to all residents in India and (b) that the
population baseline health status is similar to those
observed at the national level (CBHI, 2010). Krewski
et al. (2009) and Jahn et al. (2012) have explored
in detail the diff erences between the linear (used in
this study) and log-linear concentration-response
functions, which are pertinent to high PM pollution
levels observed in the Asian cities. We explored the
use of both the linear and log-linear forms of the
relative risks presented in these studies and fi nally,
utilized the linear correlation since the analysis is
focused on the incremental changes in concentrations
due to the power plant emissions and the focus of the
analysis is to estimate the burden of the emissions on
the health impacts.
Th e global burden of disease study for 2010
reported an all-cause mortality of 210-320 per 1000
male adults and 140-220 per 1000 female adults for
India (Wang et al., 2012). Th is was adjusted the
mortality rate due to lower and upper respiratory
illnesses (including bronchitis and asthma) and
cardio vascular diseases. Among the reported
number of deaths, these account for 15% of the
annual death rate in India (DoES, 2010).
Th e gridded population is estimated using
GRUMP (2010) for the model resolution of 0.25°.
Th e total population of 1.2 billion is adjusted to
Census-India (2012) by state totals with the urban
centers accounting for more 30% of the total. Th e
gridded population data is presented in Figure 11.
4.2 Mortality and Morbidity Estimates
Th e health impacts are calculated for the base year
2010, by overlaying the gridding population with the
modeled PM10
pollution from the coal fi red power
plants. Total premature mortality using for the
range of mortality risks ranged between 80,000
and 115,000 per year. Th e estimated mortality
and morbidity cases due to these emissions are
summarized in Table 6. We believe that our
estimations of the premature deaths and morbidity
cases are conservative. We have not included in
the analysis the impacts of the trace metals, such
as mercury and impacts due to water and soil
contamination, which could further aggravate the
overall implications of power plants. Th e uncertainties
involved in the risk assessments are detailed in
Atkinson et al. (2011) for the time series and Lancet
(2012) for long term integrated exposures.
In Table 5, we also present the estimated range
of premature deaths for the population exposed in
the sub-regions. Th e regions 1 (Delhi-Haryana-UP)
and 6 (WB-JH-BH) are the densest, with average
population density above 1000 per km2, with peaks
of more than 10,000 per km2 in the cities of Delhi
(capital of India) and Kolkata (capital of WB). Th ese
regions also experience highest risk of exposure. For
the total premature deaths estimated for India, these
seven sub-regions account for 40% of them.
Th e value of statistical life is established from
surveys based on “willing to pay” by individuals for
benefi ts associated with the health impacts. Th is
methodology was applied for assessing the impacts
of current air pollution levels and for future “what-
if ” scenarios in a number of countries and cities, in
spite of known uncertainties in the associated inputs,
such as the relative risk functions for health impacts
of air pollution, spatial resolution of pollution
monitoring, and monetizing impacts based on
surveys (Bell et al., 2011; Chikkatur et al., 2011).
Some example studies include Alberini et al. (1997)
for Taiwan; Kan et al., (2004) for Shanghai; Bell et
al. (2006) for Mexico City, Sao Paulo, and Santiago;
Wang and Mullahy (2006) for Chongqing; Hedley
et al. (2008) for Hong Kong; Desaigues et al. (2011)
for 9 European countries; Patankar and Trivedi
(2011) for Mumbai. Th e health costs based on value
of statistical life is an uncertain estimate that has a
range depending on methods. Using a conservative
value of 2,000,000 Rupees (40,000 USD) per life
lost, the premature mortality estimates from this
study would result in a health cost of 16,000 to
23,000 crores Rupees (USD 3.2 to 4.6 billion)
annually. Th e morbidity impacts and health costs
are listed in Table 6.
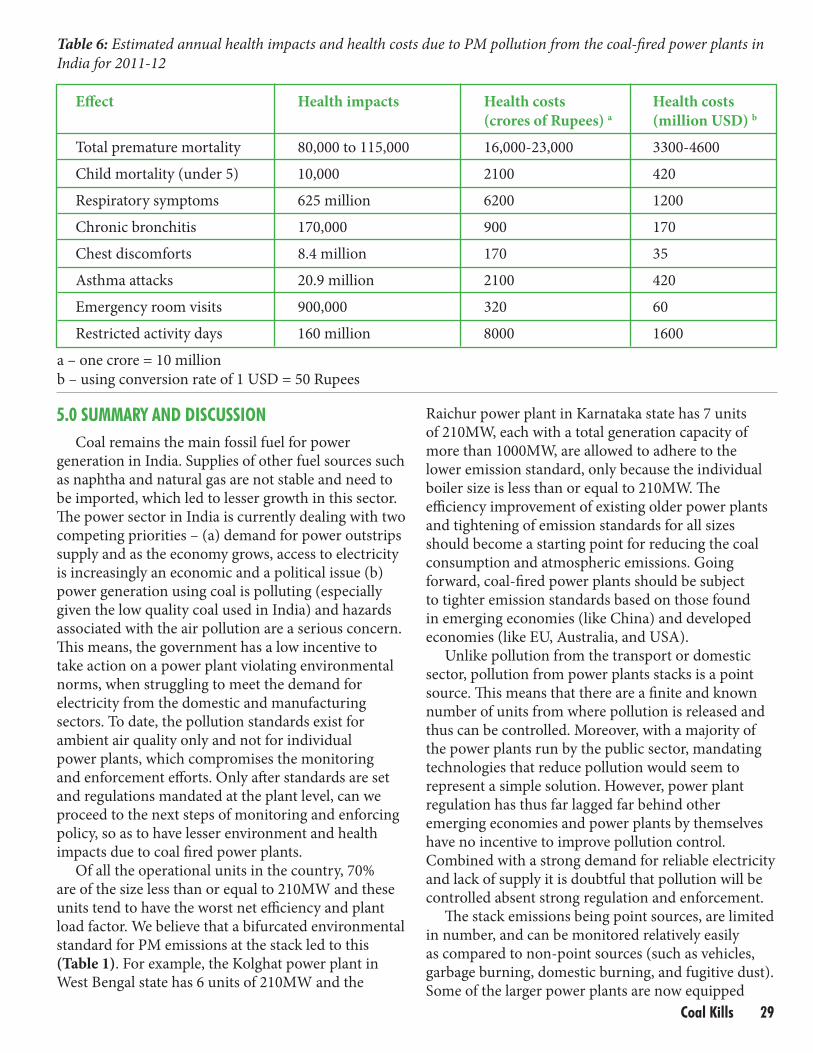
29 Coal Kills
5.0 SUMMARY AND DISCUSSIONCoal remains the main fossil fuel for power
generation in India. Supplies of other fuel sources such as naphtha and natural gas are not stable and need to be imported, which led to lesser growth in this sector. Th e power sector in India is currently dealing with two competing priorities – (a) demand for power outstrips supply and as the economy grows, access to electricity is increasingly an economic and a political issue (b) power generation using coal is polluting (especially given the low quality coal used in India) and hazards associated with the air pollution are a serious concern. Th is means, the government has a low incentive to take action on a power plant violating environmental norms, when struggling to meet the demand for electricity from the domestic and manufacturing sectors. To date, the pollution standards exist for ambient air quality only and not for individual power plants, which compromises the monitoring and enforcement eff orts. Only aft er standards are set and regulations mandated at the plant level, can we proceed to the next steps of monitoring and enforcing policy, so as to have lesser environment and health impacts due to coal fi red power plants.
Of all the operational units in the country, 70% are of the size less than or equal to 210MW and these units tend to have the worst net effi ciency and plant load factor. We believe that a bifurcated environmental standard for PM emissions at the stack led to this (Table 1). For example, the Kolghat power plant in West Bengal state has 6 units of 210MW and the
Raichur power plant in Karnataka state has 7 units of 210MW, each with a total generation capacity of more than 1000MW, are allowed to adhere to the lower emission standard, only because the individual boiler size is less than or equal to 210MW. Th e effi ciency improvement of existing older power plants and tightening of emission standards for all sizes should become a starting point for reducing the coal consumption and atmospheric emissions. Going forward, coal-fi red power plants should be subject to tighter emission standards based on those found in emerging economies (like China) and developed economies (like EU, Australia, and USA).
Unlike pollution from the transport or domestic sector, pollution from power plants stacks is a point source. Th is means that there are a fi nite and known number of units from where pollution is released and thus can be controlled. Moreover, with a majority of the power plants run by the public sector, mandating technologies that reduce pollution would seem to represent a simple solution. However, power plant regulation has thus far lagged far behind other emerging economies and power plants by themselves have no incentive to improve pollution control. Combined with a strong demand for reliable electricity and lack of supply it is doubtful that pollution will be controlled absent strong regulation and enforcement.
Th e stack emissions being point sources, are limited in number, and can be monitored relatively easily as compared to non-point sources (such as vehicles, garbage burning, domestic burning, and fugitive dust). Some of the larger power plants are now equipped
Table 6: Estimated annual health impacts and health costs due to PM pollution from the coal-fi red power plants in
India for 2011-12
Eff ect Health impacts Health costs Health costs
(crores of Rupees) a (million USD) b
Total premature mortality 80,000 to 115,000 16,000-23,000 3300-4600
Child mortality (under 5) 10,000 2100 420
Respiratory symptoms 625 million 6200 1200
Chronic bronchitis 170,000 900 170
Chest discomforts 8.4 million 170 35
Asthma attacks 20.9 million 2100 420
Emergency room visits 900,000 320 60
Restricted activity days 160 million 8000 1600
a – one crore = 10 million
b – using conversion rate of 1 USD = 50 Rupees
30 Coal Kills
with continuous monitoring of the criteria pollutant concentrations. However, this information is not available in the public domain, either for analysis or for scrutiny of the emission loads. Th is adds to the uncertainty of the estimates, for analyzing the impacts of the emissions, understanding the contribution loads, and for planning. Besides, strengthening of emission standards, new policies are required for information dissemination.
From the power plants, we estimate 30-40% of the PM pollution is secondary in nature, with the most coming from chemical conversion of SO2 emissions. Since a majority of the power plants in the country do not operate a dedicated FGD system, most of the SO2 from coal combustion is emitted and ends up in respirable PM fraction, resulting in more health impacts. In the environmental impact assessment studies, required before the commissioning of a power plant, a provision for a FGD for all power plants is discussed for the future years, but not yet mandated. Th e combined benefi ts of a FGD in conjunction with
the already operational ESPs at most of the power
plants will have a signifi cant eff ect on overall health
impacts. We believe that FGD technology should
become mandatory for all new power plants and a
provision should be introduced to implement the same
for the larger and older power plants to control
SO2 emissions.
Air pollution is a complex mixture of pollutants
with sources ranging from fossil fuel burning in
transportation, power generation, industries, and
domestic sectors to natural sources such as dust storms
and forest fi res. In this study, our objective was to
isolate the health impacts of the emissions due to coal-
fi red power plants. We calculate the health impacts for
total PM10
which includes contributions from primary
PM and those from reactions of SO2, NO
x, and VOCs
in the SAPRC chemical mechanism, via CAMx
Eulerian dispersion model. We estimated a premature
mortality rate of 80,000 to 115,000 due to the ambient
particulate pollution from the coal-fi red power plants.
We believe that this is an underestimation, and does
not include the impacts of the water run-off and soil
contamination due to the release of heavy metals like
zinc, copper, manganese, cobalt, cadmium, selenium,
mercury, arsenic, iron, lead, and chromium.
Ultimately, the government and citizen groups
need to demand clean power, keeping in mind the
health impacts of the emissions from power plants
in India. An environmental outlook study concluded
that a least-cost policy mix to reduce air pollution
in the developing economies of Brazil, China, India,
and South Africa is made up of 50% end of pipe
measures and 50% of shift ing to cleaner energy sources
(OECD, 2012). In the future – while the share of
power generation from coal is projected to decline
(IEA, 2012) – the amount of power generated from
coal will remain high at least through 2030, and unless
we fi nd a better way to manage the power plants, the
environmental eff ects due to growing air and CO2
emissions and the human health cost will be high.
ACKNOWLEDGMENTSWe would like to thank the Conservation Action
Trust (Mumbai, India) for their continued support in
this research. Animations of processed meteorological
fi elds for the year 2010, utilized for the CAMx
dispersion modeling are presented @ http://www.
urbanemissions.info/india-meteorology. Th e larger
versions of the forward trajectories in Figure 10, for all
regions, along with the vertical heights, are available
up on request.
REFERENCES
Abbey, D.E., Lebowitz, M.D., Mills, P.K., Petersen, F.F.,
Beeson, W.L., Burchette, R.J., 1995. Long-Term
Ambient Concentrations of Particulates and Oxidants
and Development of Chronic Disease in a Cohort
of Nonsmoking California Residents. Inhalation
Toxicology 7, 19-34.
Alberini, A., Cropper, M., Fu, T.-T., Krupnick, A., Liu, J.-T.,
Shaw, D., Harrington, W., 1997. Valuing Health Eff ects
of Air Pollution in Developing Countries: Th e Case
of Taiwan. Journal of Environmental Economics and
Management 34, 107-126.
Apte, J.S., Kirchstetter, T.W., Reich, A.H., Deshpande, S.J.,
Kaushik, G., Chel, A., Marshall, J.D., Nazaroff , W.W.,
2011. Concentrations of fi ne, ultrafi ne, and black
carbon particles in auto-rickshaws in New Delhi, India.
Atmospheric Environment 45, 4470-4480.
Arora, S., Vyas, A., Johnson, L.R., 2011. Projections of
highway vehicle population, energy demand, and
CO2 emissions in India to 2040. Natural Resources
Forum 35, 49-62.
Atkinson, R.W., Cohen, A., Mehta, S., Anderson,
H.R., 2011. Systematic review and meta-analysis of
epidemiological time-series studies on outdoor air
31 Coal Kills
Chikkatur, A.P., Chaudhary, A., Sagar, A.D., 2011. Coal Power Impacts, Technology, and Policy: Connecting the Dots. Annual Review of Environment and Resources 36, 101-138.
Corrigan, C., Ramanathan, V., Schauer, J., 2006. Impact of monsoon transitions on the physical and optical properties of aerosols. Journal of geophysical research 111, D18208.
CPCB, 2010. Air quality monitoring, emission inventory and source apportionment study for Indian cities, Central Pollution Control Board, Government of India, New Delhi, India.
Croitoru, L., Sarraf, M., 2012. Benefi ts and Costs of the Informal Sector: Th e Case of Brick Kilns in Bangladesh. Journal of Environmental Protection 3, 476-484.
Cropper, M., Gamkhar, S., Malik, K., Limonov, A., Partridge, I., 2012. Th e Health Eff ects of Coal Electricity Generation in India. Resources for the Future Discussion Paper.
Desaigues, B., Ami, D., Bartczak, A., Braun-Kohlová, M., Chilton, S., Czajkowski, M., Farreras, V., Hunt, A., Hutchison, M., Jeanrenaud, C., Kaderjak, P., Máca, V., Markiewicz, O., Markowska, A., Metcalf, H., Navrud, S., Nielsen, J.S., Ortiz, R., Pellegrini, S., Rabl, A., Riera, R., Scasny, M., Stoeckel, M.E., Szántó, R., Urban, J., 2011. Economic valuation of air pollution mortality: A 9-country contingent valuation survey of value of a life year (VOLY). Ecological Indicators 11, 902-910.
DoES, 2010. Annual Report on Registration of Births and Deaths in Delhi. Directorate of Economics and Statistics, Government of Delhi, New Delhi, India.
Emery, C., Jung, J., Downey, N., Johnson, J., Jimenez, M., Yarwood, G., Morris, R., 2012. Regional and global modeling estimates of policy relevant background ozone over the United States. Atmospheric Environment 47, 206-217.
Finkelman, R.B., 2007. Health Impacts of Coal: Facts and Fallacies. AMBIO: A Journal of the Human Environment 36, 103-106.
GAINS, 2010. Greenhouse Gas and Air Pollution Interactions and Synergies - South Asia Program. International Institute of Applied Systems Analysis, Laxenburg, Austria.
Garg, A., Shukla, P.R., Kapshe, M., 2006. Th e sectoral trends of multigas emissions inventory of India. Atmospheric Environment 40, 4608-4620.
Garg, A., Shukla, P.R., Kapshe, M., 2006. Th e sectoral trends of multigas emissions inventory of India. Atmospheric Environment 40, 4608-4620.
George, K.V., Patil, D.D., Alappat, B.J., 2013. PM10 in the ambient air of Chandrapur coal mine and its comparison with other environments. Environmental Monitoring and Assessment 185, 1117-1128.
pollution and health in Asia. Air Quality, Atmosphere &
Health 5, 383-391.
Baidya, S., Borken-Kleefeld, J., 2009. Atmospheric
emissions from road transportation in India. Energy
Policy 37, 3812-3822.
Balakrishnan, K., Ganguli, B., Ghosh, S., Sambandam, S.,
Roy, S., Chatterjee, A., 2011. A spatially disaggregated
time-series analysis of the short-term eff ects of
particulate matter exposure on mortality in Chennai,
India. Air Quality, Atmosphere & Health, 1-11.
Bell, M.L., Davis, D.L., Gouveia, N., Borja-Aburto, V.H.,
Cifuentes, L.A., 2006. Th e avoidable health eff ects of air
pollution in three Latin American cities: Santiago, São
Paulo, and Mexico City. Environmental Research 100,
431-440.
Bell, M.L., Morgenstern, R.D., Harrington, W., 2011.
Quantifying the human health benefi ts of air pollution
policies: Review of recent studies and new directions in
accountability research. Environmental Science & Policy
14, 357-368.
Brunekreef, B., 1997. Air pollution and life expectancy:
is there a relation? Occupational and environmental
medicine 54, 781.
Carter, W.P.L., Luo, D., Malkina, I.L., 2000. Documentation
of the SAPRC-99 chemical mechanism for VOC
reactivity assessment. California Environmental
Protection Agency, Air Resources Board, Research
Division.
CBHI, 2010. National Health Profi le 2010, Central Bureau
of Health Intelligence, Government of India, New Delhi,
India.
CEA, 2011. Review of Performance of Th ermal Power
Stations, Central Electricity Authority, Ministry of
Power, Government of India, New Delhi, India.
CEA, 2012. All India Electricity Statistics - General Review
2012, Central Electricity Authority, Ministry of Power,
Government of India, New Delhi, India.
Census-India, 2012. Census of India, 2011. Th e
Governement of India, New Delhi, India.
Chaudhary, A., Sagar, A.D., Mathur, A., 2012. Innovating
for energy effi ciency: a perspective from India.
Innovation and Development 2, 45-66.
Chen, J., Liu, G., Kang, Y., Wu, B., Sun, R., Zhou, C., Wu,
D., 2013. Atmospheric emissions of F, As, Se, Hg, and
Sb from coal-fi red power and heat generation in China.
Chemosphere.
Chikkatur, A., Sagar, A., 2009. Rethinking India’s Coal
Power Technology Trajectory. Economic and Political
Weekly 14.
Chikkatur, A.P., 2008. A resource and technology
assessment of coal utilization in India. Pew Center on
Global Climate Change, Arlington, VA (United States).
32 Coal Kills
Ghose, M.K., 2012. Climate Change and Energy Demands
in India: Alternative Coal Technologies. Environmental
Quality Management 22, 49-67.
Grieshop, A.P., Boland, D., Reynolds, C.C.O., Gouge, B.,
Apte, J.S., Rogak, S.N., Kandlikar, M., 2012. Modeling air
pollutant emissions from Indian auto-rickshaws: Model
development and implications for fl eet emission rate
estimates. Atmospheric Environment 50, 148-156.
GRUMP, 2010. Gridded Population of the World and
Global Rural and Urban Mapping Project. Center for
International Earth Science Information Network
(CIESIN) of the Earth Institute, Columbia University,
New York, U. S. A.
Guttikunda, S.K., Goel, R., 2013. Health impacts of
particulate pollution in a megacity—Delhi, India.
Environmental Development.
Guttikunda, S.K., Jawahar, P., 2012. Application of SIM-
air modeling tools to assess air quality in Indian cities.
Atmospheric Environment 62, 551-561.
Hedley, A.J., McGhee, S.M., Barron, B., Chau, P., Chau,
J., Th ach, T.Q., Wong, T.-W., Loh, C., Wong, C.-M.,
2008. Air Pollution: Costs and Paths to a Solution in
Hong Kong—Understanding the Connections Among
Visibility, Air Pollution, and Health Costs in Pursuit
of Accountability, Environmental Justice, and Health
Protection. Journal of Toxicology and Environmental
Health, Part A 71, 544-554.
HEI, 2004. Health Eff ects of Outdoor Air Pollution in
Developing Countries of Asia: A Literature Review,
Special Report 15, Health Eff ects Institute, Boston, USA.
HEI, 2010. Outdoor Air Pollution and Health in the
Developing Countries of Asia: A Comprehensive
Review, Special Report 18, Health Eff ects Institute,
Boston, USA.
Hewitt, C.N., 2001. Th e atmospheric chemistry of sulphur
and nitrogen in power station plumes. Atmospheric
Environment 35, 1155-1170.
Huang, Q., Cheng, S., Li, Y., Li, J., Chen, D., Wang, H.,
Chen, Z., Xia, X., Tang, H., Li, S., 2010. An Integrated
MM5-CAMx Modeling Approach for Assessing PM10
Contribution from Diff erent Sources in Beijing, China.
Journal of Environemental Informatics 15, 47-61.
IEA, 2012. World Energy Outlook 2012. International
Energy Agency (IEA), Paris, France.
Jahn, H.J., Schneider, A., Breitner, S., Eißner, R., Wendisch,
M., Krämer, A., 2011. Particulate matter pollution
in the megacities of the Pearl River Delta, China–A
systematic literature review and health risk assessment.
International journal of hygiene and environmental
health 214, 281-295.
Kan, H., Chen, B., Chen, C., Fu, Q., Chen, M., 2004. An
evaluation of public health impact of ambient air
pollution under various energy scenarios in Shanghai,
China. Atmospheric Environment 38, 95-102.
Kansal, A., Khare, M., Sharma, C.S., 2009. Health benefi ts
valuation of regulatory intervention for air pollution
control in thermal power plants in Delhi, India. Journal of
Environmental Planning and Management 52, 881-899.
Krewski, D., Jerrett, M., Burnett, R.T., Ma, R., Hughes, E.,
Shi, Y., Turner, M.C., Pope III, C.A., Th urston, G., Calle,
E.E., 2009. Extended follow-up and spatial analysis of
the American Cancer Society study linking particulate
air pollution and mortality. Health Eff ects Institute
Cambridge, MA, USA.
Laden, F., Schwartz, J., Speizer, F.E., Dockery, D.W., 2006.
Reduction in fi ne particulate air pollution and mortality
extended follow-up of the Harvard six cities study.
American Journal of Respiratory and Critical Care
Medicine 173, 667-672.
Lancet, 2012. Global Burden of Disease Study 2010. Th e
Lancet Series, Published on December 13th, 2012,
Elsevier Publishers, London, UK.
Lau, W.K.M., Kim, K.M., Hsu, C.N., Holben, B.N., 2009.
Possible infl uences of air pollution, dust-and sandstorms
on the Indian monsoon. World Meteorological
Organization (WMO) Bulletin 58, 22.
Lu, P., Wu, J., Pan, W.-P., 2010. Particulate Matter Emissions
from a Coal-Fired Power Plant, Bioinformatics and
Biomedical Engineering (iCBBE), 2010 4th International
Conference on. IEEE, pp. 1-4.
Lu, Z., Streets, D.G., 2012. Increase in NOx Emissions
from Indian Th ermal Power Plants during 1996–2010:
Unit-Based Inventories and Multisatellite Observations.
Environmental Science & Technology 46, 7463-7470.
NCEP, 2012. National Centers for Environmental
Prediction. National Oceanic and Atmospheric
Administration, Maryland, U. S. A.
OECD, 2012. Environmental Outlook to 2050: Th e
Consequences of Inaction. Organisation for Economic
Co-operation and Development (OECD), Paris, France.
Ohara, T., Akimoto, H., Kurokawa, J.-i., Horii, N., Yamaji,
K., Yan, X., Hayasaka, T., 2007. An Asian emission
inventory of anthropogenic emission sources for the
period 1980? 2020. Atmospheric Chemistry and Physics
Discussions 7, 6843-6902.
Ostro, B., 2004. Outdoor air pollution. WHO
Environmental Burden of Disease Series.
Patankar, A.M., Trivedi, P.L., 2011. Monetary burden
of health impacts of air pollution in Mumbai, India:
Implications for public health policy. Public Health 125,
157-164.
Pope, C.A., Dockery, D.W., 2006. Health Eff ects of Fine
Particulate Air Pollution: Lines that Connect. Journal of
the Air & Waste Management Association 56, 709-742.
33 Coal Kills
Pope III, C.A., Burnett, R.T., Th un, M.J., Calle, E.E., Krewski, D., Ito, K., Th urston, G.D., 2002. Lung cancer, cardiopulmonary mortality, and long-term exposure to fi ne particulate air pollution. JAMA: the journal of the American Medical Association 287, 1132-1141.
Pope III, C.A., Ezzati, M., Dockery, D.W., 2009. Fine-particulate air pollution and life expectancy in the United States. New England Journal of Medicine 360, 376-386.
Prasad, A., Singh, R., Kafatos, M., 2012. Infl uence of coal-based thermal power plants on the spatial–temporal variability of tropospheric NO 2 column over India. Environmental Monitoring and Assessment 184, 1891-1907.
Prayas, 2011. Th ermal Power Plants on Th e Anvil : Implications And Need For Rationalisation. Prayas Energy Group, Pune, India.
Prayas, 2013. Black and Dirty - Th e Real Challenges Facing India’s Coal Sector. Prayas Energy Group, Pune, India.
Ramachandra, T.V., Shwetmala, 2009. Emissions from India’s transport sector: Statewise synthesis. Atmospheric Environment 43, 5510-5517.
Reddy, M.S., Basha, S., Joshi, H.V., Jha, B., 2005. Evaluation of the emission characteristics of trace metals from coal and fuel oil fi red power plants and their fate during combustion. Journal of Hazardous Materials 123, 242-249.
Sahu, S., Beig, G., Parkhi, N., 2012. Emerging pattern of anthropogenic NOx emission over Indian subcontinent during 1990s and 2000s. Atmospheric Pollution Research 3, 262-269.
Schipper, L., Banerjee, I., Ng, W.-S., 2009. Carbon Dioxide Emissions from Land Transport in India. Transportation Research Record: Journal of the Transportation Research Board 2114, 28-37.
Schwartz, J., Coull, B., Laden, F., Ryan, L., 2008. Th e eff ect of dose and timing of dose on the association between airborne particles and survival. Environ. Health Perspect. 116, 64.
Seligsohn, D., Heilmayr, R., Tan, X., Weischer, L., 2009. China, the United States and the Climate Change Challenge, World Resources Institute, Washington DC, USA.
Streets, D., Bond, T., Carmichael, G., Fernandes, S., Fu, Q., He, D., Klimont, Z., Nelson, S., Tsai, N., Wang, M.Q., 2003. An inventory of gaseous and primary aerosol emissions in Asia in the year 2000. Journal of geophysical research 108, 8809.
Sun, L., Webster, M., McGaughey, G., McDonald-Buller, E.C., Th ompson, T., Prinn, R., Ellerman, A.D., Allen, D.T., 2012. Flexible NOx Abatement from Power Plants in the Eastern United States. Environmental Science and Technology-Columbus 46, 5607.
Turner, D.B., Chico, T., Catalano, J., 1986. TUPOS: A multiple source Gaussian dispersion algorithm using
on-site turbulence data. U.S Environmental Protection Agency, Research Triangle Park, North Carolina (EPA600/886/010).
USEPA, 2009. Integrated Science Assessment for Particulate Matter (Final Report). U.S. Environmental Protection Agency, Report No. EPA/600/R-08/139F, Washington DC, U. S. A.
Van Donkelaar, A., Martin, R.V., Brauer, M., Kahn, R., Levy, R., Verduzco, C., Villeneuve, P.J., 2010. Global estimates of ambient fi ne particulate matter concentrations from satellite-based aerosol optical depth: development and application. Environ. Health Perspect. 118, 847.
Wagner, F., Amann, M., Borken-Kleefeld, J., Cofala, J., Höglund-Isaksson, L., Purohit, P., Rafaj, P., Schöpp, W., Winiwarter, W., 2012. Sectoral marginal abatement cost curves: implications for mitigation pledges and air pollution co-benefi ts for Annex I countries. Sustain Sci 7, 169-184.
Wang, H., Dwyer-Lindgren, L., Lofgren, K.T., Rajaratnam, J.K., Marcus, J.R., Levin-Rector, A., Levitz, C.E., Lopez, A.D., Murray, C.J.L., 2012. Age-specifi c and sex-specifi c mortality in 187 countries, 1970-2010: a systematic analysis for the Global Burden of Disease Study 2010. Th e Lancet 380, 2071-2094.
Wang, H., Mullahy, J., 2006. Willingness to pay for reducing fatal risk by improving air quality: A contingent valuation study in Chongqing, China. Science of Th e Total Environment 367, 50-57.
WHO, 2011. Outdoor Air Pollution in the World Cities. World Health Organization, Geneva, Switzerland.
WISE, 2012. Risks of Coal Based Electricity Generation in India. World Institute of Sustainable Energy, Pune, India.
Wong, C.-M., Vichit-Vadakan, N., Kan, H., Qian, Z., 2008. Public Health and Air Pollution in Asia (PAPA): A Multicity Study of Short-Term Eff ects of Air Pollution on Mortality. Environ Health Perspect 116.
Wu, D., Hung Fung, J.C., Yao, T., Kai Hon Lau, A., 2013. A Study of control policy in the Pearl River Delta region by using the particulate matter source apportionment method. Atmospheric Environment.
Yan, F., Winijkul, E., Jung, S., Bond, T.C., Streets, D.G., 2011. Global emission projections of particulate matter (PM): I. Exhaust emissions from on-road vehicles. Atmospheric Environment 45, 4830-4844.
Yim, S.H.L., Barrett, S.R.H., 2012. Public Health Impacts of Combustion Emissions in the United Kingdom. Environmental Science & Technology 46, 4291-4296.
Zhang, L., Brook, J., Vet, R., 2003. A revised parameterization for gaseous dry deposition in air-quality models. Atmospheric Chemistry and Physics 3, 2067-2082.
Zhang, L., Gong, S., Padro, J., Barrie, L., 2001. A size-segregated particle dry deposition scheme for an atmospheric aerosol module. Atmospheric Environment
35, 549-560.
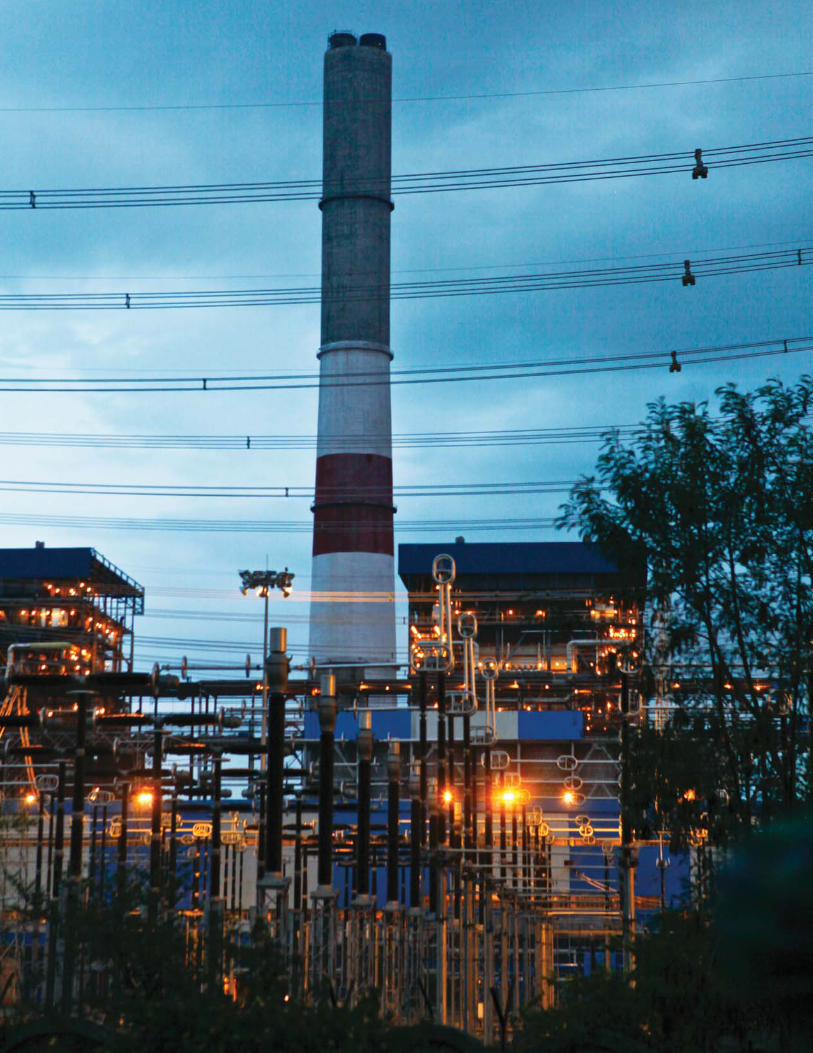
34 Coal Kills