Embed Size (px)
Citation preview
Available online at www.sciencedirect.com
www.elsevier.com/locate/jphysparis
Journal of Physiology - Paris 101 (2007) 22–31
Coding processes involved in the cortical representation ofcomplex tactile stimuli
Jean-Luc Blanc *, Jacques-Olivier Coq
UMR 6149, CNRS – Aix-Marseille Universite, Centre St. Charles, Pole 3C, case B, 13331 Marseille Cedex 03, France
Abstract
To understand how information is coded in the primary somatosensory cortex (S1) we need to decipher the relationship between neu-ral activity and tactile stimuli. Such a relationship can be formally measured by mutual information. The present study was designed todetermine how S1 neuronal populations code for the multidimensional kinetic features (i.e. random, time-varying patterns of force) ofcomplex tactile stimuli, applied at different locations of the rat forepaw. More precisely, the stimulus localization and feature extractionwere analyzed as two independent processes, using both rate coding and temporal coding strategies. To model the process of stimuluskinetic feature extraction, multidimensional stimuli were projected onto lower dimensional subspace and then clustered according totheir similarity. Different combinations of stimuli clustering were applied to differentiate each stimulus identification process. Informa-tion analyses show that both processes are synergistic, this synergy is enhanced within the temporal coding framework. The stimuluslocalization process is faster than the stimulus feature extraction process. The latter provides more information quantity with rate codingstrategy, whereas the localization process maximizes the mutual information within the temporal coding framework. Therefore, combin-ing mutual information analysis with robust clustering of complex stimuli provides a framework to study neural coding mechanismsrelated to complex stimuli discrimination.� 2007 Elsevier Ltd. All rights reserved.
Keywords: Information theory; Neural coding; Stimulus feature extraction; Primary somatosensory cortex
1. Introduction
A major challenge in Neuroscience is to decipher howneural activity represents the physical features of objectswith which animals interact. For instance, each degree ofroughness scanned by whiskers corresponds both to aunique kinetic signature defined by a temporal profile ofwhisker velocity and to a distinct firing pattern, based onspike counts (Arabzadeh et al., 2005, 2006). Although mostof the studies to date have used rate coding, several authorshave emphasized the key role of spike timing in neural pop-ulation coding (Borst and Theunissen, 1999). Using precisespike timing, the first spikes have been shown to transmitlarger quantities of information about stimuli than thesame spikes in rate coding, either in the barrel cortex (Pan-
0928-4257/$ - see front matter � 2007 Elsevier Ltd. All rights reserved.doi:10.1016/j.jphysparis.2007.10.004
* Corresponding author.E-mail address: [email protected] (J.-L. Blanc).
zeri et al., 2001) or in the cortical forepaw representation(Foffani et al., 2004).
Instead of whiskers, rats can use their forepaws to per-ceive object features, such as location, size, shape and tex-ture (Bourgeon et al., 2004; Iwaniuk and Whishaw, 2000).We know that the forepaw representation in the S1 cortexis topographically organized (Coq and Xerri, 1998). Thistopographic organization provides a spatial frame of refer-ence for location detection of stimuli applied on differentforepaw locations. However, the large range of spatiotem-poral responses in the S1 forepaw cortex (Tutunculer et al.,2006), such as found in the barrel cortex, may allow theextraction of the multidimensional kinetic features ofobjects or complex tactile stimuli.
Neural coding refers to how the central nervous systemrepresents sensory information as patterns of action poten-tials emitted by neuronal populations. The neural codingproblem is often formulated in terms of quantitizing a joint
J.-L. Blanc, J.-O. Coq / Journal of Physiology - Paris 101 (2007) 22–31 23
space (R;S) (Mumey et al., 2004; Slonim et al., 2006;Nadal, 2002) where S represents the input sensory stimuliand R the set of possible neural activity patterns. Both ofthese spaces are high-dimensional and complex. We con-sider the sensory system robust and adaptive, in that itmust represent similar stimuli in similar ways. Thus, indi-vidual input stimuli are not important for understandingneural function, but rather classes of input stimuli and theircorrespondence are the key to decipher the neural represen-tation of complex stimuli. Following this idea, this studyrefers to a model in which neurons are selective for a smallnumber of stimulus dimensions out of a high-dimensionalstimulus space, and within this subspace similar sensorysignals are clustered. The idea that Shannon’s InformationTheory (Shannon, 1948) is relevant for studying neuralcoding goes back to Attaneve (1954) and has received con-siderable attention these last few years (Bialek et al., 1991;Atick, 1992; Borst and Theunissen, 1999). In this paperfirst of all, we report generality on information theory inthe neural coding context. Secondly, we present anotherinformation quantity: the ‘‘multi-information’’, useful tostudy neural representations of complex stimuli.
In this paper the simultaneous activity of S1 neuronalpopulations was recorded to explore the neural coding oflocation detection and kinetic feature extraction of com-plex stimuli, based on either spike count or spike timing.Location detection is related to the different sites of fore-paw stimulation, while feature extraction refers to a com-pression process of the high-dimensional kinetic values(i.e. random, time-varying patterns of force) of complextactile stimuli, as encountered in the natural environment.Are stimulus localization and feature extraction indepen-dent processes? What is the time course of these processesafter stimulus onset, depending on rate or temporal cod-ing? We used mutual information (MI) to measure thestimulus-response relationship, and different stimuli clus-tering strategies to separate each neural process. To ourknowledge, this study is the first attempt to compare thesetwo neural processes of stimulus identification and to use‘‘multi-information’’ in the neural context.
2. Methods
2.1. Information theoretic framework
2.1.1. Information carried by neuronal population response
Mutual information is a rigorous criterion to quantify how muchinformation the neural responses convey about a sensory stimuli set (Bia-lek et al., 1991). We consider a time window T, associated with a sensorystimulus s chosen with a probability p(s) from a stimulus set S = {s1,s2,. . .,sm}, during which the activity of C neurons is recorded. The neuronalpopulation response is denoted by the random variable R = {r1,r2,. . .,rn},where each component of the vector rn ¼ ½r1
n; r2n; . . . ; rC
n � is the response ofone neuron of the population within the time window T. Each neuronalresponse can be differently described depending on the coding framework.In a spike count code, the response is the number of spikes within the timewindow T. In a spike timing code, the response is a sequence of spike firingtimes. The MI between R and S is defined as the difference between theShannon response entropy and the noise entropy (Shannon, 1948).
IðR; SÞ ¼ HðRÞ � HðRjSÞ ð1Þ
where the entropy is
HðRÞ ¼ �X
r2R
pðrÞ log pðrÞ
and the noise entropy
HðRjSÞ ¼ �X
s2S
pðsÞX
r2R
pðrjsÞ log pðrjsÞ
The mutual information can be written as
IðR; SÞ ¼X
s2S
pðsÞX
r2R
pðrjsÞ logpðrjsÞpðrÞ ð2Þ
p(rjs) is the probability of simultaneously observing a particular response r
conditional to the stimulus s, and pðrÞ ¼P
s2SpðsÞpðrjsÞ is its averageacross all stimuli.
2.1.2. Mutual information for three random variables
In this section we address inequalities involved in Shannon’s informa-tion measures, for three discrete random variables. A region in R2n�1,denoted by C*, is identified to be the origin of all information inequalitiesinvolving n random variables in the sense that all such inequalities are par-tial characterizations of C*. Further theoretical precisions can be foundelsewhere (Yeung, 1997).
In this study we address the issue of dependence between two pro-cesses: stimulus feature extraction and stimulus localization. Within thisframework, we introduce two other variables K,L describing the stimulusset S (i.e. K = f(S) and L = g(S)). K is the random variable which describesthe stimulus kinetic features extraction K = {k1,k2,. . .,kK} and L is the ran-dom variable which describes the different stimuli locationsL = {l1,l2,. . .,lL}. Using the chain-rule of information (Cover and Thomas,1991) we can develop the MI
IðR; K;LÞ ¼ IðR; KÞ þ IðR; LjKÞ;IðR; K;LÞ ¼ IðR; LÞ þ IðR; KjLÞ
ð3Þ
where I(R;K,L) is the MI between the neural response R and the intersec-tion of both stimuli sets K and L (Fig. 1). This quantity can be rewrittenusing the mutual information definition equation (1)
IðR; K; LÞ ¼X
k2K
X
l2L
pðk; lÞX
r2R
pðrjk; lÞ logpðrjk; lÞ
pðrÞ ð4Þ
where pðrÞ ¼P
k2K pðkÞP
l2LpðlÞpðrjk; lÞ
I(R;K) is the MI between the neural response and the stimulus, consid-ering only the kinetic features, so that the stimuli are clustered accordingto their time-varying intensity. I(R;L) is the MI between the neuralresponse and the stimulus, considering only its location. I(R;LjK) isthe MI between the neural response and the stimulus location knowingits kinetic features. I(R;KjL) is the MI between the response and thestimulus kinetic features knowing its location.
The non-negativity property of the MI (Cover and Thomas, 1991),gives the following expressions
IðR; K;LÞP IðR; KÞ;IðR; K;LÞP IðR; LÞ
ð5Þ
From these inequalities we can write a lower bound of the MI between theneural response and both the stimulus kinetic feature extraction and stim-ulus localization
IðR; K; LÞP 1
2IðR; KÞ þ IðR; LÞ½ � ð6Þ
Suppose the random variables R! K! L form a Markov chain, then thedata-processing inequality (Cover and Thomas, 1991) gives
IðR; KjLÞ 6 IðR; KÞIðR; LjKÞ 6 IðR; LÞ
ð7Þ
I (R;L)I (R;K)
H (L)H (K)
H (R)
H (L)H (K)
H (R)
I (R;L)I (R;K)
I(K;L)
I (R;K;L)
I (R;K,L)
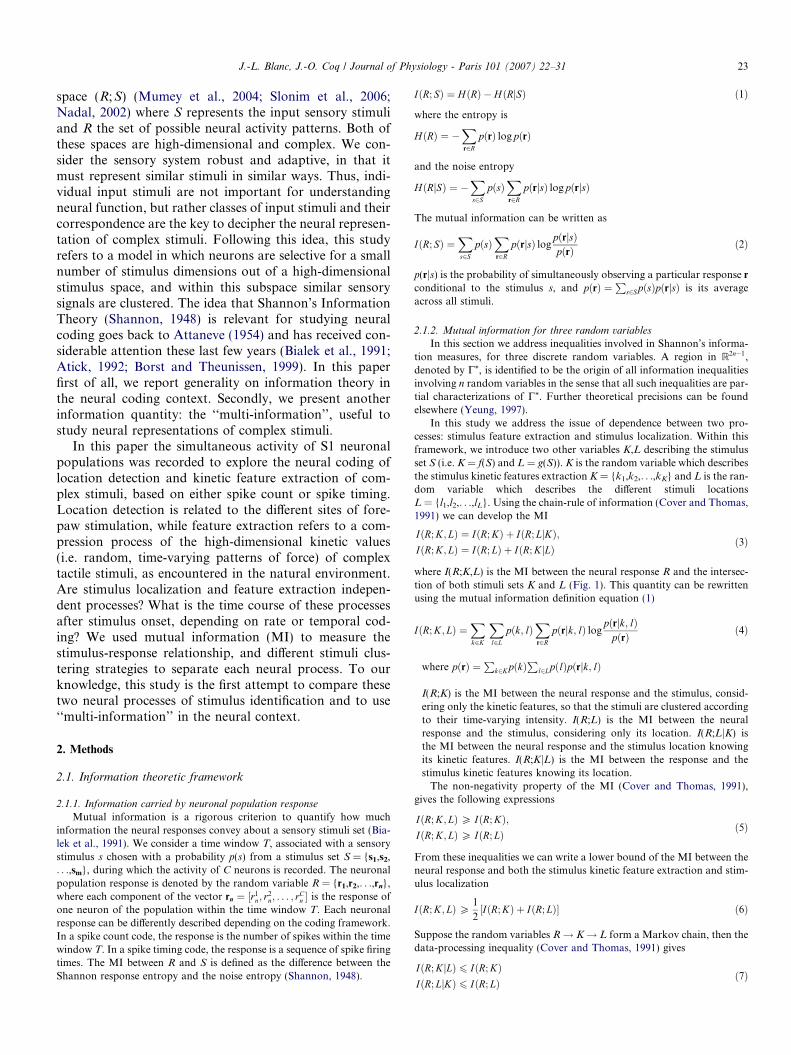
Fig. 1. Venn diagrams that explain the introduction of variables k and l describing each stimulus s. Left panel. The random variables K and L areindependent. Right panel. The variables K and L are dependent or synergistic. I(R;K,L) is the mutual information between the neural responses (variableR) and the intersection of sets K and L with the set R.The ‘‘multi-information’’ I(R;K;L) corresponds to the intersection between the sets R, K and L.
24 J.-L. Blanc, J.-O. Coq / Journal of Physiology - Paris 101 (2007) 22–31
Note that these information inequalities are symmetric. We can now writean upper bound of the MI using the definition (3) and (7)
IðR; K;LÞ 6 IðR; KÞ þ IðR; LÞ ð8Þ
With equality only if the random variables K and L are independent. Thus,under this regime the mutual information is framed by
1
2IðR; KÞ þ IðR; LÞ½ � 6 IðR; K; LÞ 6 IðR; KÞ þ IðR; LÞ ð9Þ
Note that if R,K,L do not form a Markov chain, then it is also possiblethat
IðR; KjLÞP IðR; KÞ;IðR; LjKÞP IðR; LÞ
ð10Þ
Based on this assumption, for this special case we can write a lower boundof the mutual information
IðR; K;LÞP IðR; KÞ þ IðR; LÞ ð11Þ
Using the Venn diagrams in Fig. 1 we defined the information quantity forthree random variables as
IðR; K; LÞ ¼ IðR; KÞ � IðR; KjLÞ;IðR; K; LÞ ¼ IðR; LÞ � IðR; LjKÞ
ð12Þ
We preferred to call this measure ‘‘multi-information’’ rather than mutualinformation because in contrast to mutual information, which is alwayspositive, multi-information can be either positive or negative. This is pos-sible since the effect of holding one of the variables may increase or de-crease the dependency between the others. As a trivial case, consider thesituation in the trivariate product where variables K and L are indepen-dent when R is not known, but become dependent given R, in this case,I(R;K;L) is clearly negative. Han (1980) has shown that multi-informationneed not be always positive, by expanding it in terms of parameters ofprobability up to the second order.
In this study we define a ‘‘synergy threshold’’ as
IðR; K; LÞ 6 0 ð13Þ
With I(R;K;L) = 0, if R, K and L are mutually independent.
The larger the negativity of the quantity I(R;K;L) the stronger the syn-ergy between the localization and kinetic feature extraction processes.We then explore this hypothesis estimating the different informationquantities from neuronal responses to complex tactile stimuli.
2.2. Experimental data acquisition
Multi-unit neuronal activity was recorded in the S1 cortex and com-plex tactile stimuli were applied to the forepaw in four anesthetized rats.
All experiments were carried out in accordance with National Institutesof Health Guidelines for the Care and Use of Laboratory Animals. Thedetails of the surgical preparation and multi-unit recordings are describedelsewhere (Coq and Xerri, 1998). Briefly, adult Long-Evans rats were anes-thetized with pentobarbital sodium with an initial dose of 50 mg kg�1
(i.p.). Supplementary doses (5 mg kg�1 i.p.) were given as needed to keepthe rats at an areflexive level of anesthesia throughout the experiments bymonitoring the heart rate, spontaneous whisker movements, eye-blinkingand paw-withdrawal reflexes. The core temperature was continuouslymonitored by a rectal thermistor probe and was maintained at around38 �C by a heating pad. A craniotomy (about 16 mm2) was done withbregma as the initial point of reference (ant. 3.0 mm; post. 1.0 mm; lat.3–6 mm) to expose the somatosensory cortex. The dura was incised andresected. The exposed somatosensory cortex surface was covered withwarm silicone fluid (30,000 cs) to prevent drying and oedema. At theend of the experiment, the animal received a lethal injection of pentobar-bital sodium (150 mg kg�1 i.p.).
Multi-unit activity was recorded with parylene-coated tungsten elec-trodes (1 MX at 100 Hz) in layer III-IV of the S1 cortex at a depth of600–700 lm. A single electrode was moved perpendicular to the corticalsurface at different locations to map the S1 forepaw representation ofinterest: from palmar pad 1–digit 5 (about 1.6 mm in length) in the rostro-caudal direction. A digitized image of the cortex was used to place themicroelectrode penetrations which were identified relative to the corticalvasculature. The multi-unit signal was preamplified, filtered (bandwidth0.5–5 kHz) and displayed on an oscilloscope. Under our recording condi-tions, the amplitude of the background noise usually ranged from 10 to20 lV, with a signal-to-noise ratio of 5–10.
After the S1 area of interest was located and roughly mapped usingsingle electrodes, the activity of neuronal populations was then simulta-neously recorded in layers III–IV using one row-arrays of eight electrodes(MicroProbe, MD) and a multichannel acquisition system at a frequencyof 20 kHz (Plexon, TX). The array was made of eight platinium/irridiumelectrodes (2 MX at 100 Hz) spaced by 200 lm from each other. The elec-trode array was inserted along the rostrocaudal axis of the S1 forepaw rep-resentation to sample neurons whose receptive fields were located fromdigits 2–5 and from palmar pads 1–3 (Fig. 2), according to the single elec-trode mapping described above. The activity signal recorded with the elec-trode array was processed and monitored as well as the single electrodeactivity and its quality was equivalent to what was described above. Wegenerally recorded 2–5 units simultaneously for each electrode of thearray. Two neurons per electrode with well-separated spikes were sortedusing Offline Sorter (Plexon), so that we obtained 16 neurons per animal.In this paper, MI estimations were based on eight sets of eight neurons:one neuron out of the two recorded with each electrode of the array,and two sets of eight neurons pseudo-randomly chosen from the 16 neu-rons for each rat. To calculate MI, the spike trains of each neuron in a150 ms time window for each trial, were represented in 4 ms bins, withones for each spike and zeros elsewhere.
S1 forepaw cortex Forepaw
d1 d2 d3 d4 d5
P1
8-electrode array
P2 P3d2
d3
d4d5
P1
P2P3
Medial
Rostral
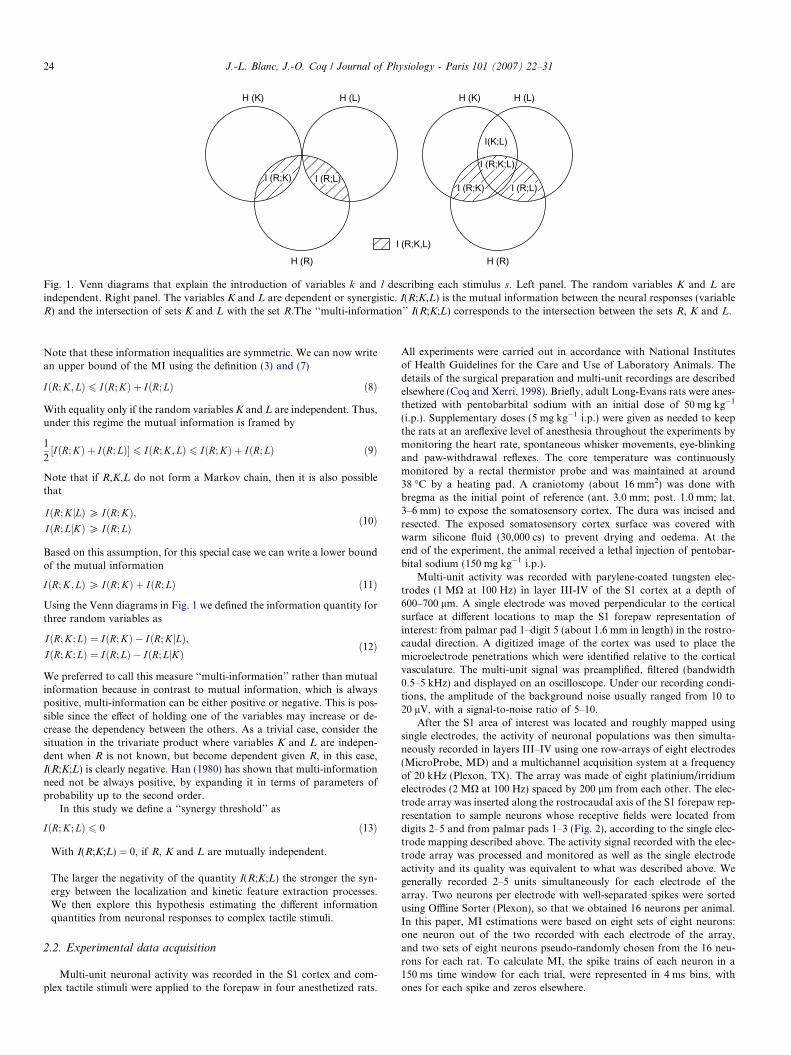
Fig. 2. The activity of S1 neuronal populations was recorded simulta-neously in response to single complex tactile stimuli applied to the ratforepaw. Left panel. Schematic drawing of the topographic organizationof the S1 cortical representation of the glabrous forepaw skin surfaces onwhich has been superimposed the implantation location of the 8-electrodearray. Right panel. Schematic drawing of the rat forepaw with thelocations (black symbols) of single stimuli applied on digit tips 2–5 (d2–d5)and palmar pads 1–3 (P1–P3). The recorded neurons had their receptivefield distributed along the 7-forepaw locations of stimulation.
J.-L. Blanc, J.-O. Coq / Journal of Physiology - Paris 101 (2007) 22–31 25
Simultaneous neuronal responses were recorded while single complexstimuli (or trials) were successively applied on each of seven different loca-tions (from digit tip 2–5 and from palmar pad 1–3) of the rat forepaw(Fig. 2). These stimulus locations corresponded to the recorded neurons’receptive fields. The complex stimuli were applied using a hand-held elec-tronic Von-Frey device, designed in our laboratory to apply single, punc-tuate stimuli through a probe (0.8 mm in diameter) onto the forepaw skinsurfaces. Usually, Von-Frey hairs are used to determine stimulus detectionthresholds on the skin. The force envelope randomly applied (mN) byhand on the skin was converted by the electronic Von-Frey into a potentialvariation (1 mN corresponded to 10 mV) which was recorded at 1 kHzwith the Plexon multichannel acquisition system. Stimuli and neuronalresponses were synchronized using a TTL signal emitted by the Von-Freyat the onset of the skin contact. The force pattern, shape and duration(ranging from 130 to 250 ms) of the complex stimuli varied for each trial(Fig. 3, left panels). The pseudo-random variability of our stimuli wasassumed to reproduce the ethological variability of stimulation in the nat-ural environment. Neuronal activity was recorded in a 150 ms time win-dow which started from the trial onset. Stimuli shorter than 150 mswere discarded from analyses. We elicited about 1300 trials on each ofthe seven forepaw locations and we finally obtained a stimuli set S ofn = 9100 trials in each animal.
2.3. Clustering of complex tactile stimuli
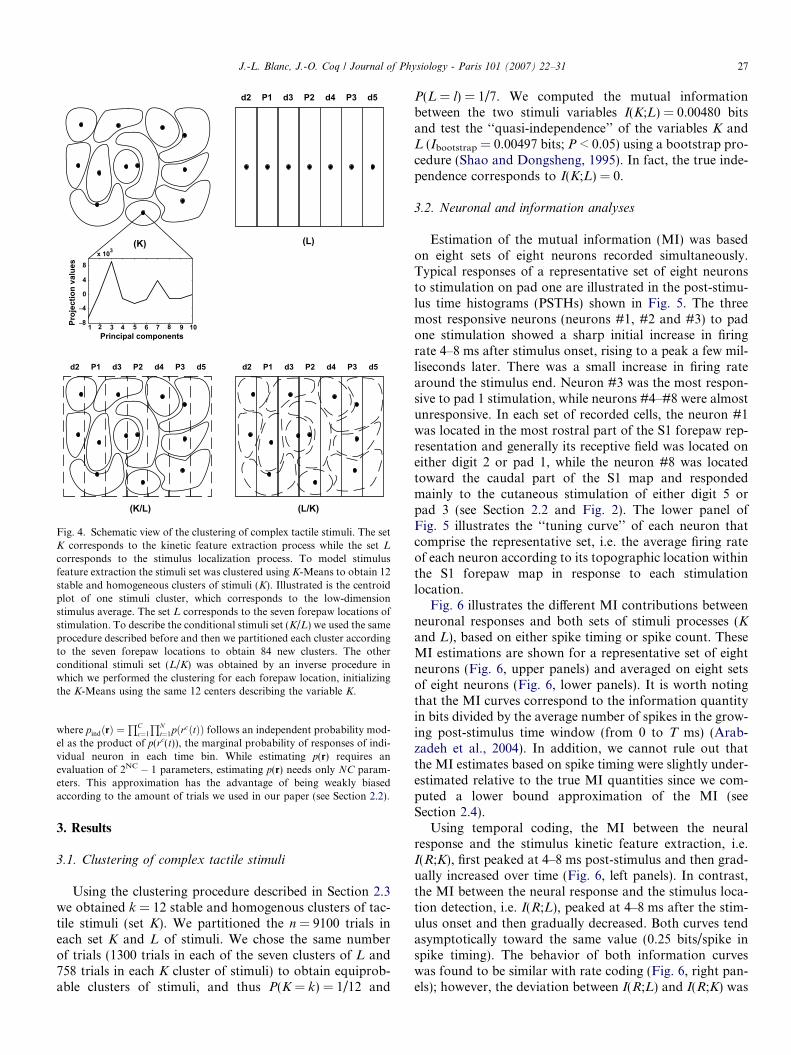
To address the issue of the relative independence between the processesof location detection and kinetic feature extraction of complex stimuli, twosets of variables L and K were introduced to describe the set S of stimuli.The sets L and K were respectively attributed to the processes of stimuluslocalization and feature extraction. The seven clusters of stimuli from thevariable L corresponded to the seven locations of the forepaw stimulation(Fig. 4, right upper panel). These stimulations were applied from the digittip 2–5 and from the palmar pad 1–3 (Fig. 2, right panel).
We assume that the natural environment produces at each instant oftime a new stimulus with some probability. This complex stimulus resultsfrom the combination of multidimensional features. In our case, thekinetic features of complex tactile stimuli correspond to random, time-varying patterns of force applied onto the rat forepaw skin. As a robustsystem the central nervous system is able to extract the kinetic featuresof sensory inputs and then to make clusters of stimuli with similarfeatures.
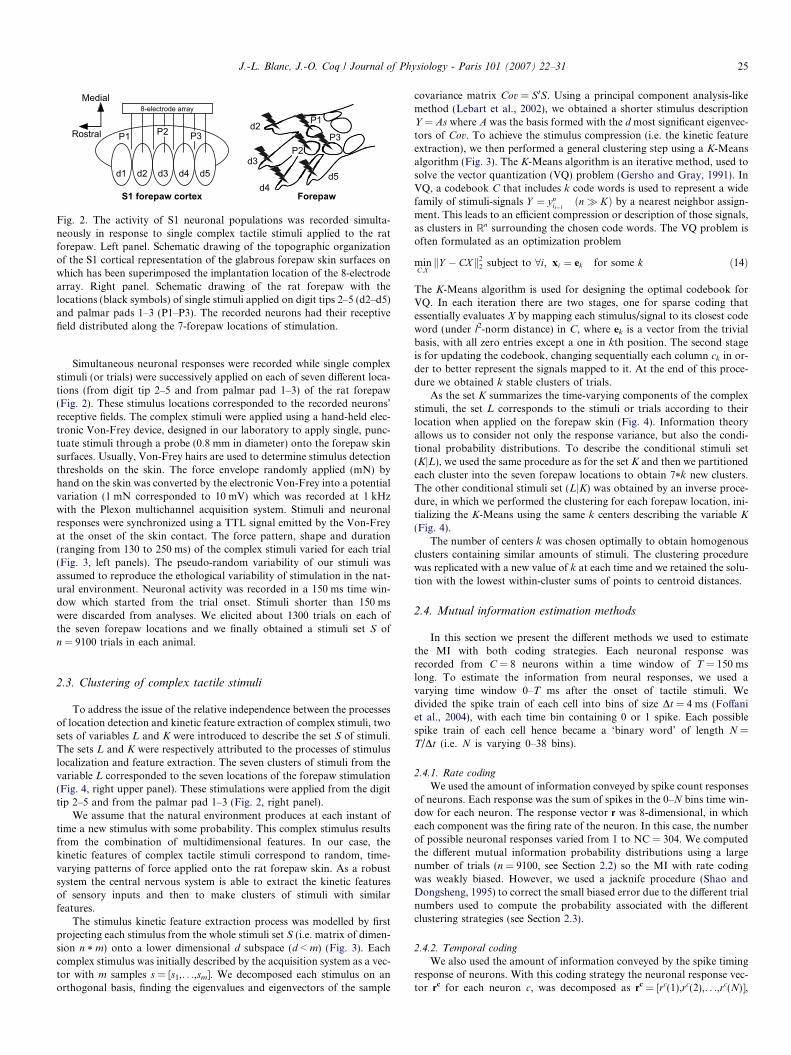
The stimulus kinetic feature extraction process was modelled by firstprojecting each stimulus from the whole stimuli set S (i.e. matrix of dimen-sion n * m) onto a lower dimensional d subspace (d < m) (Fig. 3). Eachcomplex stimulus was initially described by the acquisition system as a vec-tor with m samples s = [s1,. . .,sm]. We decomposed each stimulus on anorthogonal basis, finding the eigenvalues and eigenvectors of the sample
covariance matrix Cov = StS. Using a principal component analysis-likemethod (Lebart et al., 2002), we obtained a shorter stimulus descriptionY = As where A was the basis formed with the d most significant eigenvec-tors of Cov. To achieve the stimulus compression (i.e. the kinetic featureextraction), we then performed a general clustering step using a K-Meansalgorithm (Fig. 3). The K-Means algorithm is an iterative method, used tosolve the vector quantization (VQ) problem (Gersho and Gray, 1991). InVQ, a codebook C that includes k code words is used to represent a widefamily of stimuli-signals Y ¼ yn
ii¼1ðn� KÞ by a nearest neighbor assign-
ment. This leads to an efficient compression or description of those signals,as clusters in Rn surrounding the chosen code words. The VQ problem isoften formulated as an optimization problem
minC;XkY � CXk2
2 subject to 8i; xi ¼ ek for some k ð14Þ
The K-Means algorithm is used for designing the optimal codebook forVQ. In each iteration there are two stages, one for sparse coding thatessentially evaluates X by mapping each stimulus/signal to its closest codeword (under l2-norm distance) in C, where ek is a vector from the trivialbasis, with all zero entries except a one in kth position. The second stageis for updating the codebook, changing sequentially each column ck in or-der to better represent the signals mapped to it. At the end of this proce-dure we obtained k stable clusters of trials.
As the set K summarizes the time-varying components of the complexstimuli, the set L corresponds to the stimuli or trials according to theirlocation when applied on the forepaw skin (Fig. 4). Information theoryallows us to consider not only the response variance, but also the condi-tional probability distributions. To describe the conditional stimuli set(KjL), we used the same procedure as for the set K and then we partitionedeach cluster into the seven forepaw locations to obtain 7*k new clusters.The other conditional stimuli set (LjK) was obtained by an inverse proce-dure, in which we performed the clustering for each forepaw location, ini-tializing the K-Means using the same k centers describing the variable K
(Fig. 4).The number of centers k was chosen optimally to obtain homogenous
clusters containing similar amounts of stimuli. The clustering procedurewas replicated with a new value of k at each time and we retained the solu-tion with the lowest within-cluster sums of points to centroid distances.
2.4. Mutual information estimation methods
In this section we present the different methods we used to estimatethe MI with both coding strategies. Each neuronal response wasrecorded from C = 8 neurons within a time window of T = 150 mslong. To estimate the information from neural responses, we used avarying time window 0–T ms after the onset of tactile stimuli. Wedivided the spike train of each cell into bins of size Dt = 4 ms (Foffaniet al., 2004), with each time bin containing 0 or 1 spike. Each possiblespike train of each cell hence became a ‘binary word’ of length N =T/Dt (i.e. N is varying 0–38 bins).
2.4.1. Rate coding
We used the amount of information conveyed by spike count responsesof neurons. Each response was the sum of spikes in the 0–N bins time win-dow for each neuron. The response vector r was 8-dimensional, in whicheach component was the firing rate of the neuron. In this case, the numberof possible neuronal responses varied from 1 to NC = 304. We computedthe different mutual information probability distributions using a largenumber of trials (n = 9100, see Section 2.2) so the MI with rate codingwas weakly biased. However, we used a jacknife procedure (Shao andDongsheng, 1995) to correct the small biased error due to the different trialnumbers used to compute the probability associated with the differentclustering strategies (see Section 2.3).
2.4.2. Temporal coding
We also used the amount of information conveyed by the spike timingresponse of neurons. With this coding strategy the neuronal response vec-tor rc for each neuron c, was decomposed as rc = [rc(1),rc(2),. . .,rc(N)],
−0.025
−0.015
−0.005
0.005
Principal components
Proj
ectio
n va
lues
PCA K-Meansalgorithm
Complex tactile stimuli OrthogonalProjections
Stimuli cluster centers
0 50 100 150 2000
1.5
1
1.5
Time (ms)
Forc
e (m
N)
Stimulus # 61 (d2 tip)
0
−0.01
−0.005
0.005
0 50 100 150 2000
0.51
1.52
2.53
Stimulus # 3871 (d5 tip)
−0.015
−0.005
0.005
0.015
1 2 3 4 5 6 7 8 9 10−8−6−4−202468
10x 10−3 Center #6
00.5
11.5
22.5
3
0 50 100 150 200
3.5Stimulus # 1267 (d3 tip)
−0.005
−0.005
0.015
−0.0150 50 100 150 200
0
0.5
1
1.5
2
2.5Stimulus # 6448 (P2)
−0.015
−0.005
0.005
0.015
1 2 3 4 5 6 7 8 9 10−5
0
5
10x 10−3 Center #12
Principal components
Proj
ectio
n va
lues
0
0.5
1
1.5
2
0 50 100 150 200
Stimulus # 2513 (d4 tip)
−8
−4
0
4
1 3 9 10Principal components
Proj
ectio
n va
lues
0 50 100 150 2000
0.5
1
1.5
2
Time (ms)
Forc
e (m
N)
Stimulus # 7627 (P3)
1 2 3 4 5 6 7 8 9 10−12−10
−8
−6
−4
−2
0
2 x 10⁻³
Principal components
Proj
ectio
n va
lues
Center #1
2 87654
1 3 9 102 87654
1 3 9 102 87654
1 3 9 102 87654
1 3 9 102 87654
1 3 9 102 87654
Fig. 3. Schematic view of the stimulus clustering corresponding to the kinetic feature extraction process. The left panels show the force envelope of severalcomplex tactile stimuli, along with their location on the forepaw. The middle panels correspond to the orthogonal projections of the complex stimuli aftera principal component analysis (PCA) to reduce the high-dimensionality of these stimuli. The right panels illustrate the centroid plots of some low-dimension stimulus average after the clustering procedure with a K-Means algorithm (see text).
26 J.-L. Blanc, J.-O. Coq / Journal of Physiology - Paris 101 (2007) 22–31
where rc(t) was the response (i.e. 0 or 1 spike) in the time bin t. To computethe MI from the full responses was considered too complex because of thehigh-dimensionality of the space and of all the possible patterns ofresponses. Such a high-dimensionality leads to large undersampled prob-ability distributions and to large biases (Panzeri and Treves, 1996; Panin-ski, 2003).
Numerous approaches have been suggested for the MI estimation. Oneof them consists of expanding the MI in terms of moments of the proba-bility distribution, until the second order (Panzeri and Schultz, 2001). Thisapproximation has the advantage of clearly separating the different infor-mation sources as a sum of components.
IðR; SÞ ¼ I lin þ I sig-sim þ Icor-ind þ Icor-dep ð15Þ
The components of this approximation have different magnitudes andsampling properties, and are discussed elsewhere (Pola et al., 2003). Herewe briefly resume the definition of each components.
Ilin the ‘‘linear’’ component, is the information conveyed by spikesemitted in different time bins and cells independently. Isig-sim the ‘‘signalsimilarity’’ component quantifies the redundancy arising from similarityacross stimuli of the mean response in each time bin. Icor-ind the ‘‘stimulusindependent correlation’’ component is the information associated withcorrelations in neural responses not modulated by the stimulus. Icor-dep
the ‘‘stimulus-dependent correlation’’ component is associated with stim-ulus modulation of correlation.
In our paper, a lower bound approximation of the spike timing infor-mation was used. This lower bound (Pola et al., 2005) removes the contri-bution related to the stimulus-dependent correlations in neural responsesfrom the previous information expansion (15).
IB ¼ I lin þ I sig-sim þ Icor-ind
IB ¼ �X
r2R
pðrÞlog2pindðrÞ �X
s2S
pðsÞX
r2R
pindðrjsÞlog2pindðrjsÞ ð16Þ
d2 P1 d3 P2 d4 P3 d5
(K) (L)
d2 P1 d3 P2 d4 P3 d5 d2 P1 d3 P2 d4 P3 d5
(K/L) (L/K)
1 3 9 10−8
−4
0
4
8x 10³
Principal components
Proj
ectio
n va
lues
876542
Fig. 4. Schematic view of the clustering of complex tactile stimuli. The setK corresponds to the kinetic feature extraction process while the set L
corresponds to the stimulus localization process. To model stimulusfeature extraction the stimuli set was clustered using K-Means to obtain 12stable and homogeneous clusters of stimuli (K). Illustrated is the centroidplot of one stimuli cluster, which corresponds to the low-dimensionstimulus average. The set L corresponds to the seven forepaw locations ofstimulation. To describe the conditional stimuli set (K/L) we used the sameprocedure described before and then we partitioned each cluster accordingto the seven forepaw locations to obtain 84 new clusters. The otherconditional stimuli set (L/K) was obtained by an inverse procedure inwhich we performed the clustering for each forepaw location, initializingthe K-Means using the same 12 centers describing the variable K.
J.-L. Blanc, J.-O. Coq / Journal of Physiology - Paris 101 (2007) 22–31 27
where pindðrÞ ¼QC
c¼1
QNt¼1pðrcðtÞÞ follows an independent probability mod-
el as the product of p(rc(t)), the marginal probability of responses of indi-vidual neuron in each time bin. While estimating p(r) requires anevaluation of 2NC � 1 parameters, estimating p(r) needs only NC param-eters. This approximation has the advantage of being weakly biasedaccording to the amount of trials we used in our paper (see Section 2.2).
3. Results
3.1. Clustering of complex tactile stimuli
Using the clustering procedure described in Section 2.3we obtained k = 12 stable and homogenous clusters of tac-tile stimuli (set K). We partitioned the n = 9100 trials ineach set K and L of stimuli. We chose the same numberof trials (1300 trials in each of the seven clusters of L and758 trials in each K cluster of stimuli) to obtain equiprob-able clusters of stimuli, and thus P(K = k) = 1/12 and
P(L = l) = 1/7. We computed the mutual informationbetween the two stimuli variables I(K;L) = 0.00480 bitsand test the ‘‘quasi-independence’’ of the variables K andL (Ibootstrap = 0.00497 bits; P < 0.05) using a bootstrap pro-cedure (Shao and Dongsheng, 1995). In fact, the true inde-pendence corresponds to I(K;L) = 0.
3.2. Neuronal and information analyses
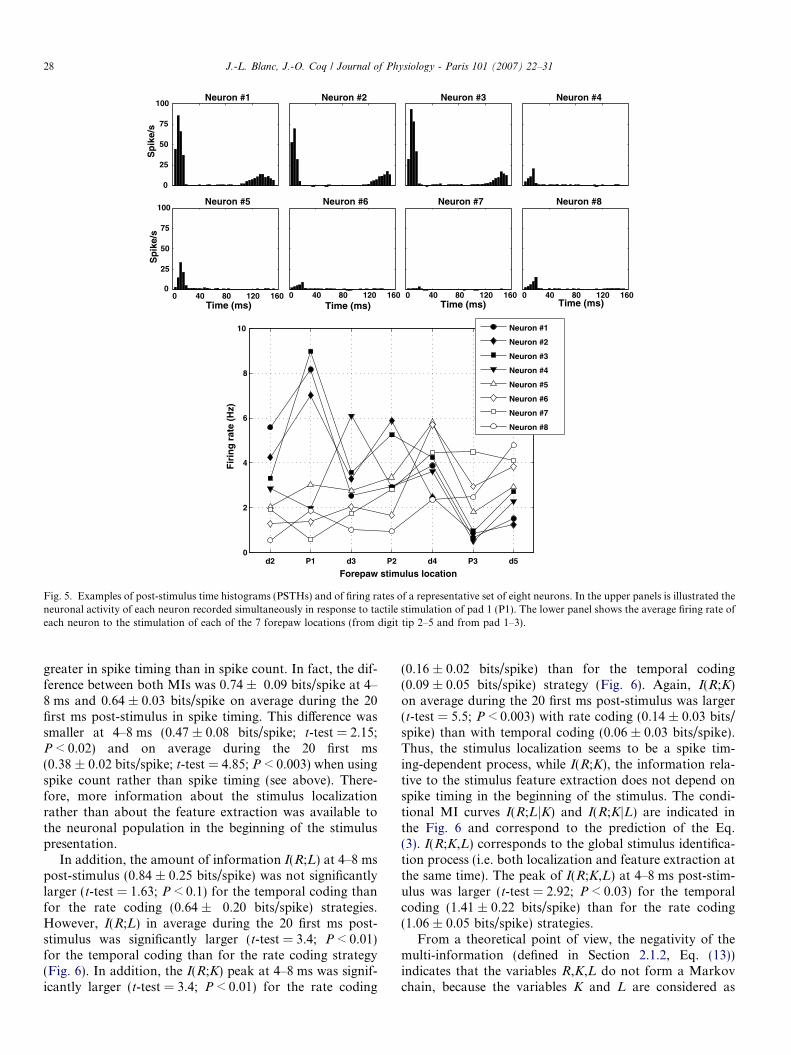
Estimation of the mutual information (MI) was basedon eight sets of eight neurons recorded simultaneously.Typical responses of a representative set of eight neuronsto stimulation on pad one are illustrated in the post-stimu-lus time histograms (PSTHs) shown in Fig. 5. The threemost responsive neurons (neurons #1, #2 and #3) to padone stimulation showed a sharp initial increase in firingrate 4–8 ms after stimulus onset, rising to a peak a few mil-liseconds later. There was a small increase in firing ratearound the stimulus end. Neuron #3 was the most respon-sive to pad 1 stimulation, while neurons #4–#8 were almostunresponsive. In each set of recorded cells, the neuron #1was located in the most rostral part of the S1 forepaw rep-resentation and generally its receptive field was located oneither digit 2 or pad 1, while the neuron #8 was locatedtoward the caudal part of the S1 map and respondedmainly to the cutaneous stimulation of either digit 5 orpad 3 (see Section 2.2 and Fig. 2). The lower panel ofFig. 5 illustrates the ‘‘tuning curve’’ of each neuron thatcomprise the representative set, i.e. the average firing rateof each neuron according to its topographic location withinthe S1 forepaw map in response to each stimulationlocation.
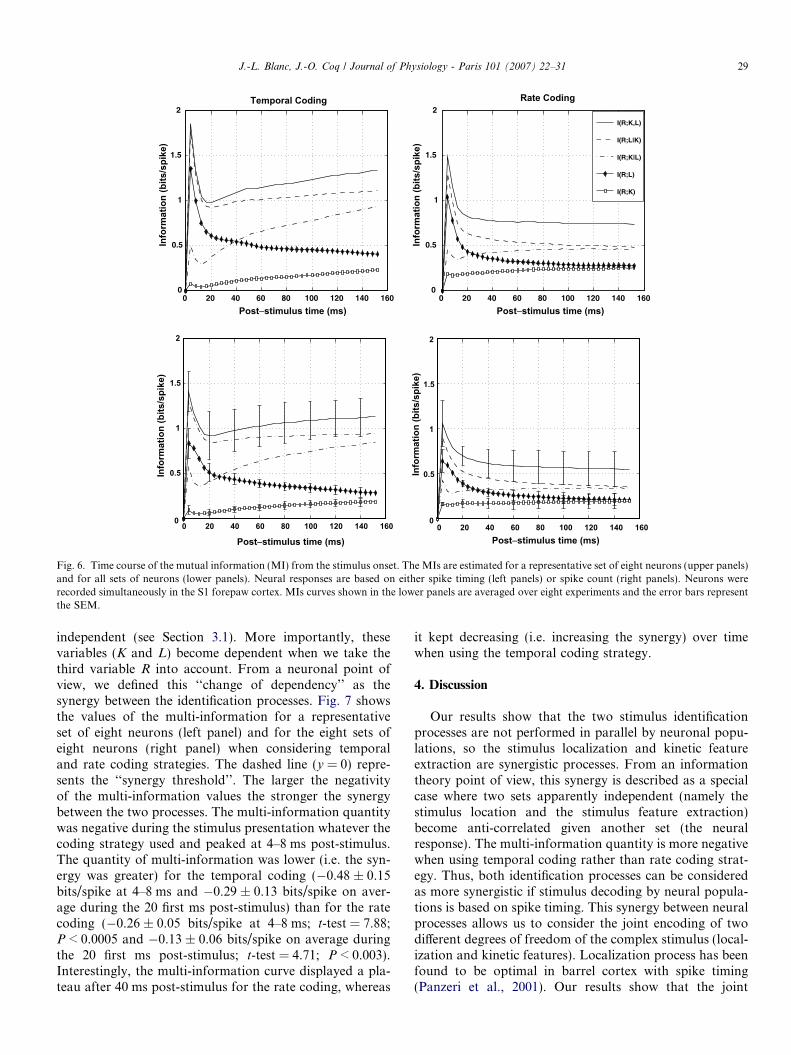
Fig. 6 illustrates the different MI contributions betweenneuronal responses and both sets of stimuli processes (Kand L), based on either spike timing or spike count. TheseMI estimations are shown for a representative set of eightneurons (Fig. 6, upper panels) and averaged on eight setsof eight neurons (Fig. 6, lower panels). It is worth notingthat the MI curves correspond to the information quantityin bits divided by the average number of spikes in the grow-ing post-stimulus time window (from 0 to T ms) (Arab-zadeh et al., 2004). In addition, we cannot rule out thatthe MI estimates based on spike timing were slightly under-estimated relative to the true MI quantities since we com-puted a lower bound approximation of the MI (seeSection 2.4).
Using temporal coding, the MI between the neuralresponse and the stimulus kinetic feature extraction, i.e.I(R;K), first peaked at 4–8 ms post-stimulus and then grad-ually increased over time (Fig. 6, left panels). In contrast,the MI between the neural response and the stimulus loca-tion detection, i.e. I(R;L), peaked at 4–8 ms after the stim-ulus onset and then gradually decreased. Both curves tendasymptotically toward the same value (0.25 bits/spike inspike timing). The behavior of both information curveswas found to be similar with rate coding (Fig. 6, right pan-els); however, the deviation between I(R;L) and I(R;K) was
0
25
50
75
100
Sp
ike/
s
Neuron #1 Neuron #2 Neuron #3 Neuron #4
0 40 80 120 1600
25
50
75
100
Time (ms)0 40 80 120 160
Time (ms)0 40 80 120 160
Time (ms)0 40 80 120 160
Time (ms)
Sp
ike/
s
Neuron #5 Neuron #6 Neuron #7 Neuron #8
d2 P1 d3 P2 d4 P3 d50
2
4
6
8
10
Forepaw stimulus location
Fir
ing
rat
e (H
z)
Neuron #1
Neuron #2
Neuron #3
Neuron #4
Neuron #5
Neuron #6
Neuron #7
Neuron #8
Fig. 5. Examples of post-stimulus time histograms (PSTHs) and of firing rates of a representative set of eight neurons. In the upper panels is illustrated theneuronal activity of each neuron recorded simultaneously in response to tactile stimulation of pad 1 (P1). The lower panel shows the average firing rate ofeach neuron to the stimulation of each of the 7 forepaw locations (from digit tip 2–5 and from pad 1–3).
28 J.-L. Blanc, J.-O. Coq / Journal of Physiology - Paris 101 (2007) 22–31
greater in spike timing than in spike count. In fact, the dif-ference between both MIs was 0.74 ± 0.09 bits/spike at 4–8 ms and 0.64 ± 0.03 bits/spike on average during the 20first ms post-stimulus in spike timing. This difference wassmaller at 4–8 ms (0.47 ± 0.08 bits/spike; t-test = 2.15;P < 0.02) and on average during the 20 first ms(0.38 ± 0.02 bits/spike; t-test = 4.85; P < 0.003) when usingspike count rather than spike timing (see above). There-fore, more information about the stimulus localizationrather than about the feature extraction was available tothe neuronal population in the beginning of the stimuluspresentation.
In addition, the amount of information I(R;L) at 4–8 mspost-stimulus (0.84 ± 0.25 bits/spike) was not significantlylarger (t-test = 1.63; P < 0.1) for the temporal coding thanfor the rate coding (0.64 ± 0.20 bits/spike) strategies.However, I(R;L) in average during the 20 first ms post-stimulus was significantly larger (t-test = 3.4; P < 0.01)for the temporal coding than for the rate coding strategy(Fig. 6). In addition, the I(R;K) peak at 4–8 ms was signif-icantly larger (t-test = 3.4; P < 0.01) for the rate coding
(0.16 ± 0.02 bits/spike) than for the temporal coding(0.09 ± 0.05 bits/spike) strategy (Fig. 6). Again, I(R;K)on average during the 20 first ms post-stimulus was larger(t-test = 5.5; P < 0.003) with rate coding (0.14 ± 0.03 bits/spike) than with temporal coding (0.06 ± 0.03 bits/spike).Thus, the stimulus localization seems to be a spike tim-ing-dependent process, while I(R;K), the information rela-tive to the stimulus feature extraction does not depend onspike timing in the beginning of the stimulus. The condi-tional MI curves I(R;LjK) and I(R;KjL) are indicated inthe Fig. 6 and correspond to the prediction of the Eq.(3). I(R;K,L) corresponds to the global stimulus identifica-tion process (i.e. both localization and feature extraction atthe same time). The peak of I(R;K,L) at 4–8 ms post-stim-ulus was larger (t-test = 2.92; P < 0.03) for the temporalcoding (1.41 ± 0.22 bits/spike) than for the rate coding(1.06 ± 0.05 bits/spike) strategies.
From a theoretical point of view, the negativity of themulti-information (defined in Section 2.1.2, Eq. (13))indicates that the variables R,K,L do not form a Markovchain, because the variables K and L are considered as
0 20 40 60 80 100 120 140 1600
0.5
1
1.5
2
Post−stimulus time (ms)
Info
rmat
ion
(bits
/spi
ke)
0 20 40 60 80 100 120 140 1600
0.5
1
1.5
2
Post−stimulus time (ms)
Info
rmat
ion
(bits
/spi
ke)
0 20 40 60 80 100 120 140 1600
0.5
1
1.5
2
Post−stimulus time (ms)
Info
rmat
ion
(bits
/spi
ke)
Temporal Coding
0 20 40 60 80 100 120 140 1600
0.5
1
1.5
2
Post−stimulus time (ms)
Info
rmat
ion
(bits
/spi
ke)
Rate Coding
I(R;K,L)
I(R;L|K)
I(R;K|L)
I(R;L)
I(R;K)
Fig. 6. Time course of the mutual information (MI) from the stimulus onset. The MIs are estimated for a representative set of eight neurons (upper panels)and for all sets of neurons (lower panels). Neural responses are based on either spike timing (left panels) or spike count (right panels). Neurons wererecorded simultaneously in the S1 forepaw cortex. MIs curves shown in the lower panels are averaged over eight experiments and the error bars representthe SEM.
J.-L. Blanc, J.-O. Coq / Journal of Physiology - Paris 101 (2007) 22–31 29
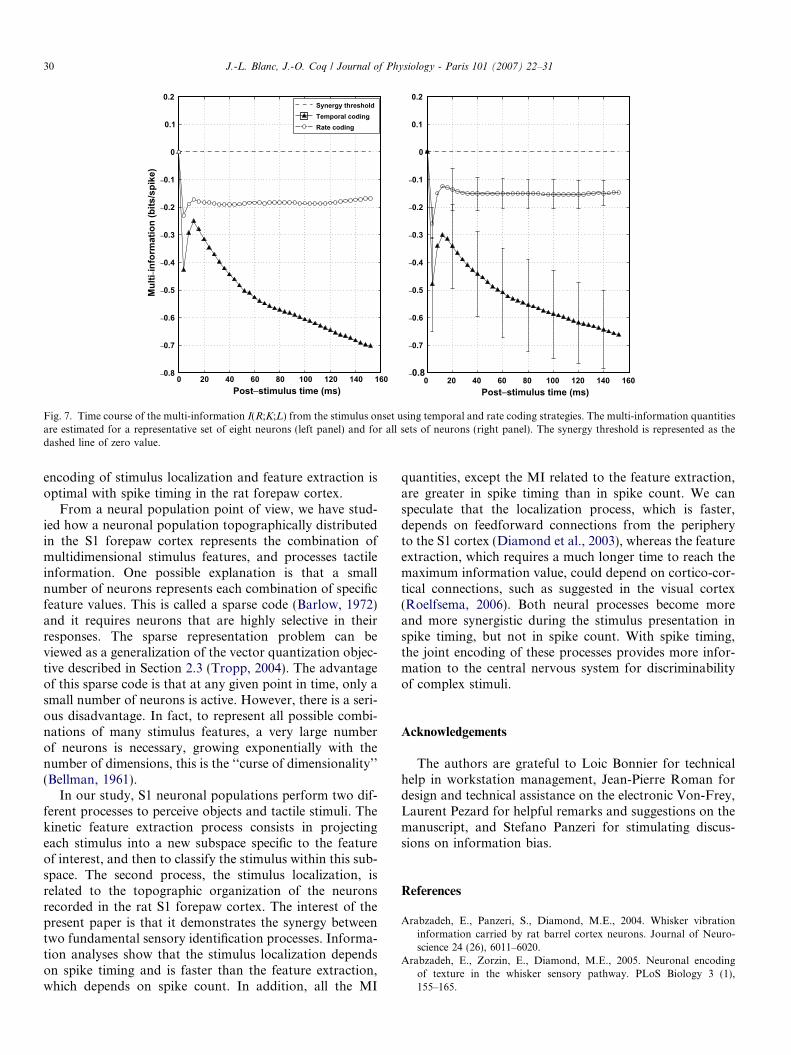
independent (see Section 3.1). More importantly, thesevariables (K and L) become dependent when we take thethird variable R into account. From a neuronal point ofview, we defined this ‘‘change of dependency’’ as thesynergy between the identification processes. Fig. 7 showsthe values of the multi-information for a representativeset of eight neurons (left panel) and for the eight sets ofeight neurons (right panel) when considering temporaland rate coding strategies. The dashed line (y = 0) repre-sents the ‘‘synergy threshold’’. The larger the negativityof the multi-information values the stronger the synergybetween the two processes. The multi-information quantitywas negative during the stimulus presentation whatever thecoding strategy used and peaked at 4–8 ms post-stimulus.The quantity of multi-information was lower (i.e. the syn-ergy was greater) for the temporal coding (�0.48 ± 0.15bits/spike at 4–8 ms and �0.29 ± 0.13 bits/spike on aver-age during the 20 first ms post-stimulus) than for the ratecoding (�0.26 ± 0.05 bits/spike at 4–8 ms; t-test = 7.88;P < 0.0005 and �0.13 ± 0.06 bits/spike on average duringthe 20 first ms post-stimulus; t-test = 4.71; P < 0.003).Interestingly, the multi-information curve displayed a pla-teau after 40 ms post-stimulus for the rate coding, whereas
it kept decreasing (i.e. increasing the synergy) over timewhen using the temporal coding strategy.
4. Discussion
Our results show that the two stimulus identificationprocesses are not performed in parallel by neuronal popu-lations, so the stimulus localization and kinetic featureextraction are synergistic processes. From an informationtheory point of view, this synergy is described as a specialcase where two sets apparently independent (namely thestimulus location and the stimulus feature extraction)become anti-correlated given another set (the neuralresponse). The multi-information quantity is more negativewhen using temporal coding rather than rate coding strat-egy. Thus, both identification processes can be consideredas more synergistic if stimulus decoding by neural popula-tions is based on spike timing. This synergy between neuralprocesses allows us to consider the joint encoding of twodifferent degrees of freedom of the complex stimulus (local-ization and kinetic features). Localization process has beenfound to be optimal in barrel cortex with spike timing(Panzeri et al., 2001). Our results show that the joint
0 20 40 60 80 100 120 140 160−0.8
−0.7
−0.6
−0.5
−0.4
−0.3
−0.2
−0.1
0
0.1
0.2
Post−stimulus time (ms)0 20 40 60 80 100 120 140 160
−0.8
−0.7
−0.6
−0.5
−0.4
−0.3
−0.2
−0.1
0
0.1
0.2
Post−stimulus time (ms)
Mul
ti−in
form
atio
n (b
its/s
pike
)
Synergy thresholdTemporal codingRate coding
Fig. 7. Time course of the multi-information I(R;K;L) from the stimulus onset using temporal and rate coding strategies. The multi-information quantitiesare estimated for a representative set of eight neurons (left panel) and for all sets of neurons (right panel). The synergy threshold is represented as thedashed line of zero value.
30 J.-L. Blanc, J.-O. Coq / Journal of Physiology - Paris 101 (2007) 22–31
encoding of stimulus localization and feature extraction isoptimal with spike timing in the rat forepaw cortex.
From a neural population point of view, we have stud-ied how a neuronal population topographically distributedin the S1 forepaw cortex represents the combination ofmultidimensional stimulus features, and processes tactileinformation. One possible explanation is that a smallnumber of neurons represents each combination of specificfeature values. This is called a sparse code (Barlow, 1972)and it requires neurons that are highly selective in theirresponses. The sparse representation problem can beviewed as a generalization of the vector quantization objec-tive described in Section 2.3 (Tropp, 2004). The advantageof this sparse code is that at any given point in time, only asmall number of neurons is active. However, there is a seri-ous disadvantage. In fact, to represent all possible combi-nations of many stimulus features, a very large numberof neurons is necessary, growing exponentially with thenumber of dimensions, this is the ‘‘curse of dimensionality’’(Bellman, 1961).
In our study, S1 neuronal populations perform two dif-ferent processes to perceive objects and tactile stimuli. Thekinetic feature extraction process consists in projectingeach stimulus into a new subspace specific to the featureof interest, and then to classify the stimulus within this sub-space. The second process, the stimulus localization, isrelated to the topographic organization of the neuronsrecorded in the rat S1 forepaw cortex. The interest of thepresent paper is that it demonstrates the synergy betweentwo fundamental sensory identification processes. Informa-tion analyses show that the stimulus localization dependson spike timing and is faster than the feature extraction,which depends on spike count. In addition, all the MI
quantities, except the MI related to the feature extraction,are greater in spike timing than in spike count. We canspeculate that the localization process, which is faster,depends on feedforward connections from the peripheryto the S1 cortex (Diamond et al., 2003), whereas the featureextraction, which requires a much longer time to reach themaximum information value, could depend on cortico-cor-tical connections, such as suggested in the visual cortex(Roelfsema, 2006). Both neural processes become moreand more synergistic during the stimulus presentation inspike timing, but not in spike count. With spike timing,the joint encoding of these processes provides more infor-mation to the central nervous system for discriminabilityof complex stimuli.
Acknowledgements
The authors are grateful to Loic Bonnier for technicalhelp in workstation management, Jean-Pierre Roman fordesign and technical assistance on the electronic Von-Frey,Laurent Pezard for helpful remarks and suggestions on themanuscript, and Stefano Panzeri for stimulating discus-sions on information bias.
References
Arabzadeh, E., Panzeri, S., Diamond, M.E., 2004. Whisker vibrationinformation carried by rat barrel cortex neurons. Journal of Neuro-science 24 (26), 6011–6020.
Arabzadeh, E., Zorzin, E., Diamond, M.E., 2005. Neuronal encodingof texture in the whisker sensory pathway. PLoS Biology 3 (1),155–165.
J.-L. Blanc, J.-O. Coq / Journal of Physiology - Paris 101 (2007) 22–31 31
Arabzadeh, E., Panzeri, S., Diamond, M.E., 2006. Deciphering the spiketrain of a sensory neuron: counts and temporal patterns in the ratwhisker pathway. Journal of Neuroscience 26 (36), 9216–9220.
Atick, J.J., 1992. Could information theory provide an ecological theoryof sensory processing. Network 3, 213–251.
Attaneve, F., 1954. Informational aspects of visual perception. Psycho-logical Review 61, 183–193.
Barlow, H., 1972. Single units and sensation: a neuron doctrine forperceptual psychology? Perception 1, 371–394.
Bellman, R., 1961. Adaptive Control Processes. Princeton UniversityPress.
Bialek, W., Rieke, F., de Ruyter, van Steveninck, R., Warland, D., 1991.Reading the neural code. Science 252, 1854–1857.
Borst, A., Theunissen, F.E., 1999. Information theory and neural coding.Nature Neuroscience 2 (11), 947–950.
Bourgeon, S., Xerri, C., Coq, J.O., 2004. Abilities in tactile discriminationof textures in adult rats exposed to enriched or impoverishedenvironments. Behavioral Brain Research 153 (1), 217–231.
Coq, J.O., Xerri, C., 1998. Environmental enrichment alters organiza-tional features of the forepaw representation in the primary somato-sensory cortex of adult rats. Experimental Brain Research 121 (2),191–204.
Cover, T., Thomas, J., 1991. Elements of Information Theory. Wiley, NewYork.
Diamond, M.E., Petersen, R.S., Harris, J.A., Panzeri, S., 2003. Investi-gations into the organization of information in sensory cortex. Journalof Physiology (Paris) 97, 529–536.
Foffani, G., Tutucunler, B., Moxon, K.A., 2004. Role of spike timing inthe forelimb somatosensory cortex of the rat. Journal of Neuroscience24 (33), 7266–7271.
Gersho, A., Gray, R., 1991. Vector Quantization and Signal Compression.Kluwer Academic Publishers, USA.
Han, T.S., 1980. Multiple mutual informations and multiple interactionsin frequency data. Information and Control 46 (1), 26–45.
Iwaniuk, N., Whishaw, I.Q., 2000. On the origin of skilled forelimbmovements. Trends in Neuroscience 23 (8), 372–376.
Lebart, L., Morineau, M., Piron, M., 2002. Multidimensional exploratorystatistics. Dunod.
Mumey, B., Sarkar, A., Gedeon, T., Dimitrov, A., Miller, J., 2004.Finding neural codes using random projections. Neurocomputing 25(19), 58–60.
Nadal, J.-P., 2002. Information theoretic approach to neural coding andparameter estimation: a perspective. In: Probabilistic Models of theBrain: Perception and Neural Function. MIT Press.
Paninski, L., 2003. Estimation of entropy and mutual information. NeuralComputation 15, 1191–1253.
Panzeri, S., Schultz, S., 2001. A unified approach to the study oftemporal, correlational and rate coding. Neural Computation 13(6), 1311–1349.
Panzeri, S., Treves, A., 1996. Analytical estimates of limited samplingbiases in different information measures. Network 7 (2), 87–107.
Panzeri, S., Petersen, R.S., Schultz, S.R., Lebedev, M., Diamond, M.E.,2001. The role of spike timing of stimulus location in rat somatosen-sory cortex. Neuron 29 (3), 769–777.
Pola, G., Thiele, A., Hoffmann, K.P., Panzeri, S., 2003. An exact methodto quantify the information transmitted by different mechanisms ofcorrelational coding. Network 14 (1), 35–60.
Pola, G., Petersen, R., Thiele, A., Young, M., Panzeri, S., 2005. Data-robust tight lower bounds to the information carried by spike times ofa neuronal population. Neural Computation 17 (9), 1962–2005.
Roelfsema, P.R., 2006. Cortical algorithms for perceptual grouping.Annual Review of Neuroscience 29, 203–227.
Shannon, C., 1948. A mathematical theory of communication. Bell SystemTechnical Journal (27), 379–423.
Shao, J., Dongsheng, T., 1995. The Jacknife and Bootstrap. SpringerSeries in Statistics. Springer-Verlag.
Slonim, N., Friedman, N., Tishby, N., 2006. Multivariate informationbottleneck. Neural Computation 8 (18), 1739–1789.
Tropp, J., 2004. Greed is good: algorithmic result for sparse approxima-tion. IEEE Transactions on Information Theory 10 (50), 2231–2242.
Tutunculer, B., Foffani, G., Himes, B.T., Moxon, K.A., 2006. Structure ofthe excitatory receptive fields of infragranular forelimb neurons in therat primary somatosensory cortex responding to touch. CerebralCortex 16 (6), 791–810.
Yeung, R., 1997. A framework for linear information inequalities. IEEETransactions on Information Theory 43 (6), 1924–1934.


![Behavioural Brain Research · presentations of body parts (i.e., somatotopic organization) have been established in mammals and humans [33–35]. In the tactile domain, the cortical](https://img.pdfslide.net/doc/110x75/5f8daeb8de58b554b0742e49/behavioural-brain-research-presentations-of-body-parts-ie-somatotopic-organization.jpg)