Embed Size (px)
Citation preview

Cognos 111 Report Writer Basics
April 2019
Page 2
copy 2019 Kent State University This information is provided by the Division of Information Technology Kent State University and is proprietary and confidential These materials are made available for the exclusive use of Kent State University employees and shall not be duplicated published or disclosed for other purposes without written permission
Table of Contents
Introduction 4
Accessing Cognos Report Studio5
Report Writer User Interface8
Building a Report9
Adding Data Items 9
Validate the Report10
Running a Report10
Report Display 11
Saving Reports 12
Opening Saved Reports 12
Customizing the Report Display13
Edit a Report Title 13
Edit a Column Name14
Grouping Results16
Aggregation 17
Adding Filters20 Pre-Defined Filters 20 Custom Filters 21
Prompts and Prompt Pages26
Prompt Pages 27
Additional Prompts 31
Prompt User Interface35 Prompt Sorting 35 Multi-Select 36 Select UI (User Interface for thePrompt List) 37 Prompt Required 37
For additional information regarding Cognos policies and access or modifications to the ODS contact the Business Intelligence Team at cognoskentedu For technical assistance contact the Help Desk at 330-672-HELP (4357) or supportkentedu Additional Cognos training materials are available at wwwkenteduitcognos-resources
Page 3
Introduction
Agenda
Cognos report Studio is a web-based application designed to allow users to easily create complex reports utilizing many different sources of data
The purpose of this training guide is to introduce Report Studio The course objectives are
Access Report Studio
Identify key areas in Cognos Consumer
Explore Report Studio
Build and format queries in Report Studio
Accessing Cognos Report Studio
Cognos Report Studio is used in both test and production instances to allow for practice in creating reports and designing tested and approved reports for public use
Navigating Report Studio
Cognos Report Studio navigation consists of a selection of Menus Tools and Windows to aid the writing and design of reports
Report Studios Toolbar
Insertable Objects Window
Work Area
Properties Pane
Creating and Modifying Reports
Creating a Report
Editing Titles
Filters
Prompt Pages
Sorting
Page 4
Accessing Cognos Report Studio
If Report Writer access has been granted users will be able to create new reports and edit personally saved reports from Cognos as accessed through FlashLine
On the Home screen a button labeled ldquoNewrdquo is located in the bottom of the Navigation Menu panel on the left
Page 5
Clicking this button opens a selection panel for choosing what Cognos item is to be created
Clicking on the desired item will display the Templates and themes window for selection from a listing of available preset layout templates and color themes A blank template will allow for a custom layout
Page 6
After selecting a report layout a page will open prompting users to Select sources from which
to retrieve data for the report
Clicking the Select source button allows users to choose from the data packages available to
them as granted by the Security Access Group
Selecting the data package and clicking the Open button will create the report page and allow
for adding objects to build the report
Page 7
Report Writer User Interface
The working page is designed in several sections Across the top of the page is a function banner Directly below is a Navigation Menu banner To the left is the Insertable Objects pane and to the right is the Canvas with an additional toolbar specifically for items placed on the report canvas
The function banner across the top of the page includes several action buttons used in creating a report in Cognos
On the left are buttons to save edit undo redo and run In the center of the menu banner is a drop-down navigation tool to toggle between documents On the right is a More button to select additional options related to the current page as well as a button to access notifications
Below the menu banner of action buttons is a navigation banner offering access to different pages and views of the report Included on the left are a home button previous and next buttons and a breadcrumb trail Further to the right are buttons to lock or unlock items in the work area change the page view manage items in the report and set properties
The Insertable Objects pane offers access to data items to be included in the report through the data sources data items and report toolbox
The report Canvas on the right is the building space for the report items to be added A set of design tools is located in a toolbar at the top of the canvas to design create and edit the report items and format
Page 8
Building a Report
The next section contains information on how to build a report The formatting options that will be covered in this section include inserting data items adding a title changing column names adding filters and prompts grouping and aggregation
The first step is deciding what information needs to be displayed in the report Then as the report is created additional items may be added to enhance the usability of the report
For this example we will create a report of a Student Count by College and Major
Adding Data Items
There are two methods for adding data items to a report double click or drag and drop
Either of the following steps may be used to add a data item to a report 1 Double click on the data item to insert it into the report If there are data items in the
report the data item will be added to the right of a selected column 2 To drag a drop a data item click on the item from the Insertable Objects Pane and drag it
to the right of where the item should be placed
NOTE The item is in the correct spot when the thin line starts flashing
Page 9
Page 10
Example
Add the following data items to the report from the INSERTABLE OBJECTS PANE in the SOURCE TAB
1 College 2 College Description 3 Major 4 Major Description 5 Personal University ID (or PIDM) ndash (Person_UID = PIDM the ID = KSU ID)
NOTE When adding data items the Code item is more efficient for a query than the Description It is best to sort and retrieve data using the Code and display using the Description
Validate the Report
Before a report is run it is suggested to validate the report to ensure it contains no errors
Clicking the Manage Report button opens a drop-down selection panel to access the Validate option
If no errors are present the report can be run to view the results in a report format
Running a Report
Because the report data is used at the university in many different ways various report formats are often desired For this reports can be produced in a variety of formats depending on the need of the user
Clicking on the Run Options button opens a menu of report format options to be retrieved A saved report may be rerun in a different format at any time
Additionally at the bottom of the run menu is a selection noted as Show Run Options which will allow users to set default settings for the output of a report
Report Display
Links at the bottom allow for navigation through the pages of the report
The report retrieves the data based upon the report page
Though the Code Items work best for retrieving data they may not be helpful being displayed
on the report itself These items can be removed from the Report Page without being removed
completely from the report
CLICK in the column body to select the entire column and reveal a pop-up options window Select CUT from the options
Using the Cut feature will remove the Code Item only from
the Report Page Using the Delete function would remove the
query from the report entirely
Page 11
Saving Reports
Saving report versions allows report writers to revisit previous levels of report creation without the need to develop reports from step one
Clicking on the Save icon and selecting Save As allows users to save the current report view in a specified location It is recommended to save items in the My content folder and naming the report for future access
Opening Saved Reports
Once a report has been saved to the My Folders tab it can be easily accessed to be run based on updated data or opened to be edited or modified among other options by clicking the more options or 3-ellipses button and selecting from the dropdown list
Page 12
Customizing the Report Display
Edit a Report Title
Report Studio allows the author to add and format report titles and column headers for a customized report view that is easier to read The report title is referred to as the Page Header and can be added by clicking the Page Ellipses button choosing the Headers amp footers option and selecting Page header amp footer
If a pop-up window appears the check box can be selected for Header and clicking the OK button will create the Title Header on the report page
A Header Insert button will appear at the top of the report page The type of header can be chosen by clicking the button
Page 13
A variety of items will appear for selection Most commonly the Text item is used and a Heading can be typed in
Edit a Column Name
To make the data more professional column headers may be changed to reflect the data
Click on the column header to be changed The properties for the cell will appear in the Properties Window
In the Source Type selection click on the label to reveal the options drop-down box and select the option for Text
Page 14
The column heading will change to a message
indicating to double-click to edit the text
A Text box will open for the entry of the new
column heading
Continue through the remaining column
headings as necessary
It may also be helpful to organize the Report Page Selecting the column body clicking on the SORT BUTTON in the Toolbar and choosing ASCENDING wil assure the column is presented in alphabetical order
This yields a more easily readable report
Page 15
Grouping Results
Grouping data in the Report page simplifies the report by showing each item only one time
Click in the column for the data group item Use the Structure option in the Menu Bar or click on the GroupUngroup button in the toolbar to show the same items together
Continue to group additional data items as needed to create sub-groups
The page is now grouped first by College and then each College is grouped by Major When the report is run the results will display the grouping
Page 16
Aggregation
One of the features of Cognos Report Studio is the ability to Aggregate or summarize data from grouped items This helps the user more easily analyze the data
Some of the more common types of aggregation are
1 Total Sums the items in the group 2 Average Averages the items in the group 3 Minimum Displays the lowest number in the group 4 Maximum Displays the highest number in the group 5 Count counts the number of items in the group
One way to add aggregation is to edit the properties of the data in the e Properties Pane
Click in the column body of the selected item to be counted
In the Properties Pane and the DATA ITEM section the drop-down selection button for Detail aggregation can be used to choose Count from the list
Page 17
Example
The report now displays a count of the number of students in each major by college
To make the report more useful Totals can be added by group
Again returning to the report page the Count column can be clicked to select the data Then clicking the Sum button in the toolbar which is the Greek letter Sigma a drop-down list appears Choosing Total will deliver the total of the selected data
Page 18
This will create a Total Student Count at the bottom of the report as well as Sub-Totals for each College and Sub-Totals for each Major
Running the report at this point will display a much more useful report
Page 19
For Example
Adding Filters
Adding a filter to a report will aid in assuring that the results retrieved include or omit certain parameters such as an academic period The author can build a custom filter or pre-defined filters may be available
A filter is built in terms of an Expression comprised of 1 A data item to be the filter subject 2 An operator showing how to compare 3 Object data or value
[Admission Application][Admissions Application][ACADEMIC_PERIOD] = 201480
Namespace Query Subject Query Item Operator Value
Common operators are
= (Equal to) - Precise match
ltgt (Not equal to) - Shows everything EXCEPT the match
IN - Matches a list of items
NOT IN ndash Shows everything EXCEPT the matches
STARTS WITH ndash Retrieves everything that begins with the characters
CONTAINS ndash Retrieves everything that includes the characters
IS MISSING ndash Retrieves blanks
Pre-Defined Filters
Pre-defined filters will be located in the Insertable Objects pane 1 Locate the pre-defined filters in
the Insertable Objects to which you have access
2 Double-Click on the desired filter to limit the report results
3 A message will appear stating that the pre-defined filter has been added
4 Click OK
Page 20
Custom Filters
If greater filtering is desired a custom filter can be created to further limit the data retrieved
Additional filters may be added from the Toolbar via the Filter Icon and selecting EDIT FILTERS
The Create Filters window will appear displaying any current Detail Filters or Summary Filters
Detail Filters will affect what data is retrieved to create or the rows of the report
Summary Filters affect the grouped or aggregated data of the report once it is written
Three buttons at the bottom of the Filters window allow the author to
Create New Filters
Delete a filter
Edit a current filter
Choosing Create a New filter offers options of
Custom based on data items that have been chosen from the insertable objects pane
Combined if multiple filter conditions are required
Advanced if a singular custom filter is desired
Selecting Advanced allows the author to build a filter with a wide range of parameter options
Page 21
With Advanced chosen components can be added to create the filter either by typing the code into the Expression Definition pane or by using the Component Selection Tools to aid in building the filter
Source The Source tab allows for the filter based on any item in the package
Data Items The Data Items tab allows for filtering by items in the report
Queries The Query Items tab allows filters based on items from other queries in the report
Functions The Functions tab allows for the creation of filter calculations
Parameters The Parameters tab allows the use of the input derived from users based upon answer the parameter
Macros use Macros or condensed instructions as filters
Page 22
In the SOURCE tab a data subject can be selected to use as a filter Double click or drag-and-drop the item to add it to the EXPRESSION DEFINITION
The Function tab can be used to select an operator
Page 23
From the Operators List several comparative options are available A double click on the desired operator will add it to the equation
Finally a comparative value must be entered to complete the filter equation The value may be typed into the equation or selected from the Tools tab in the Available Components pane
For this example 1 Select the Source tab 2 Click once on the COLLEGE item 3 Click on the SELECT VALUE button to see the options for the chosen data item 4 Select ldquoACrdquo to choose the Ashtabula Campus 5 Click Insert to add the filter for the Ashtabula Campus
The equation should read [Admission Application][Admissions Application][COLLEGE]=rsquoACrsquo
Page 24
The Validate button can be used to verify no errors are present in the expression
Please note For the ldquo = ldquo operator the value is contained in single quotation marks If expressions are being manually typed other operators require different punctuation
Tw filters have now been added to the data query Academic Admissions as well as the Ashtabula Campus Clicking the OK button will close the filters window and allow the report to be run based on the limited request for data
The Usage field allows the report author to mark a filter as Required Optional or Disabled
Please note For this exercise please mark the COLLEGE filter as disabled and click OK
The report should be saved after making changes
Page 25
Prompts and Prompt Pages
When filters are used in a report the filtering criteria remain static This may be useful for a basic report that is run based on simple data Prompts are filters that allow the user to select the refining criteria each time the report is run They allow for dynamic changes to the report based upon the user response
A Prompt Page can be created as part of the report to guide the user through filtering options that will generate a more customized report as defined by the user choices to request more specific information
From the Report option of the pages banner clicking the drop-down menu and selecting Prompt Pages will display applicable items for the report
Double-clicking on the Page tool in the insertable object pane opens the Prompt Page selections to be opened
Double-clicking on Prompt Page 1 will open the prompt page for customization
Page 26
Prompt Pages
To build a prompt page a table is needed to create spaces to hold the prompts
Prompts are located in the TOOLBOX tab of the Insertable Objects window The author can insert any of the prompt types that are needed to allow the user to filter the data for the report
From the Layout options dragging the Table item onto the canvas will display a selection window to select the layout of the prompt page table Most commonly Prompt Pages are designed with 2 columns The number of rows depends upon how many prompts will be added For this example select 2 columns and 10 rows
Page 27
Items from the Insertable Object window are added to the Prompt Page via drag-and-drop Usually the first column is used for Text Items designating what the user will select and the second column houses a prompt for a selection from the user based on desired criteria
In the TEXTUAL objects the Text Item option may be dragged and dropped into the first cell of the table In the text item window type a description or direction for the user
In the second column a corresponding Value Prompt located in the PROMPTING objects should be added to designate the filter parameters of the prompt This will start the Prompt Wizard to aid in setting the parameters
Page 28
Name the new parameter consistent to the corresponding description from column 1 This will help with navigation should modifications be needed at a later time Click NEXT to continue
In the Create Filter window click on the ellipses button to select the Package Item from which to retrieve the data
Select the desired item and click OK
Page 29
Using the Drop-Down arrow select the Operator with which to filter the data For this exercise select ldquoinrdquo Click the NEXT button
Recall Adding Filters on PAGE 21
Finish the prompt filter
1 Name the query for consistency 2 Select values to use for data retrieval 3 Select the display values for the Prompt Page
Please Note When adding data items the Code item is more efficient for a query than the Description It is best to sort and retrieve data using the Code and display using the Description
For this exercise 1 CollegeQuery 2 [Admission Application][Admissions Application][COLLEGE] 3 [Admission Application][Admissions Application][COLLEGE_DESC]
Click FINISH
The Prompt Page has now been created with a single prompt that will allow the user to select one or more options from the list of colleges to retrieve data in populating the report
Page 30
Additional Prompts
Additional prompts may be added to allow the user to filter even further Following similar steps a filter for the Academic Period can be offered Note there will be an additional step in the process
Add the descriptive text in column 1
Add the Value Prompt in Column 2 to display the Prompt Wizard
Page 31
As before name the new parameter and click the Next button
Select the Package Item and the Operator
Select Academic_Period for the Package Item
Select the equals sign as the operator to allow only one term to be selected by the user
With multiple prompts an additional window will appear for the author to designate which queries to filter In most cases you will use a prompt to filter the query for the entire report by having the check-box selected for ldquoQuery 1rdquo
Click NEXT to continue
Page 32
Finish the prompt filter
1 Name the query for consistency
2 Select values to use for data retrieval
3 Select the display values for the Prompt Page
For this exercise
1 AcademicPeriodQuery 2 [Admission Application][Admissions Application][ACADEMIC_PERIOD] 3 [Admission Application][Admissions Application][ACADEMIC_PERIOD_DESC]
Click FINISH
The Prompt Page now has two prompts for the user to utilize for filtering when creating the report The first will direct them to choose at least one College with the option of selecting several The second guides the user to select only one Academic Period
Page 33
Running the report requires the user to use the prompts to decide on the filters to be added to the data to restrict the retrieved information and narrow the results
Modifications to queries and prompts can be completed by using the Report drop-down menu to select the appropriate item to navigate to a window for each
Page 34
Prompt User Interface
Many options are available for how the prompts are displayed to the report user These can be accessed by selecting the data item and clicking the Properties button to edit the preference
Prompt Sorting
Selecting the College Description data item in the prompt page and clicking the Properties button displays the specifics for the selected data
Page 35
Properties can be edited by changed by using selection menus in the field to the right of the specific property
Sort gives the option of alphabetizing the Prompt filter for College Description making it easier for the user to locate the appropriate information
Multi-Select
Click on the COLLEGE VALUE field to select the item and display the Properties Pane The Multi-Select option will allow the author to easily change whether the user can select one item or more than one item through the Prompt Page when running the report
Page 36
Select UI (User Interface for thePrompt List)
Select UI options with multi select allow the writer to choose whether the user chooses filter options in the Prompt Page by clicking on the selections or marking a check box
Prompt Required
The Required option allows the author to designate whether or not a particular prompt Filter is required to be chosen in order to run the report
Page 37
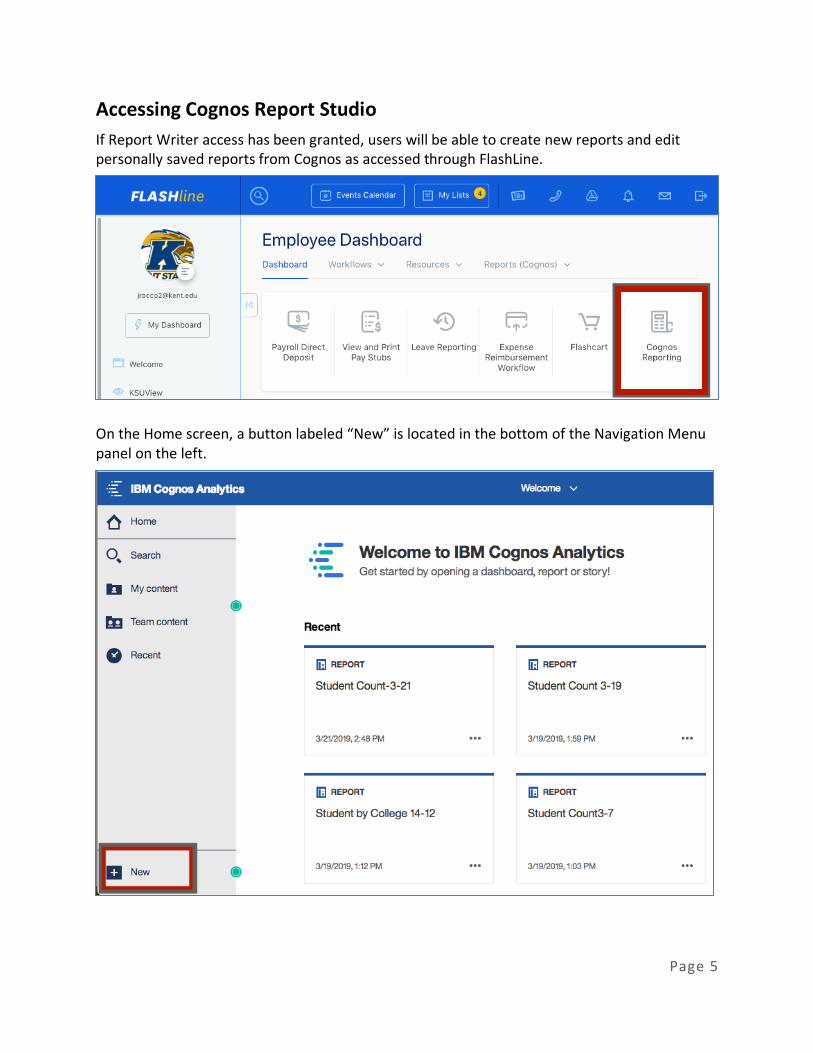
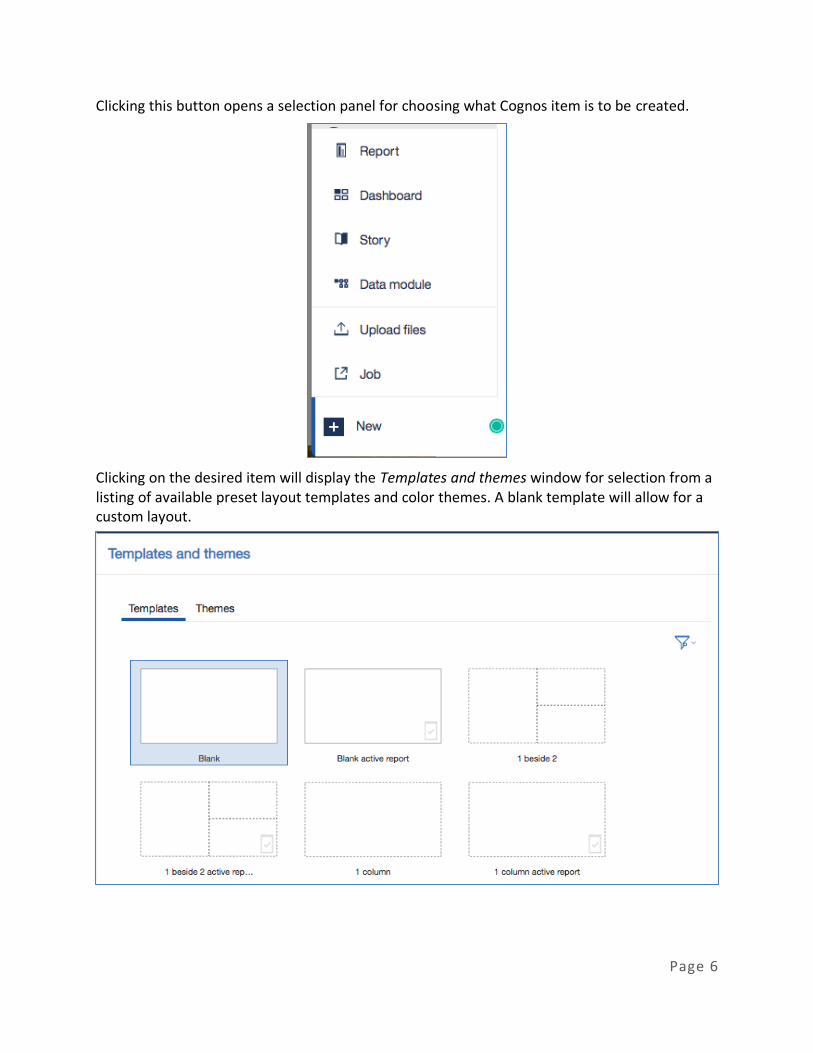
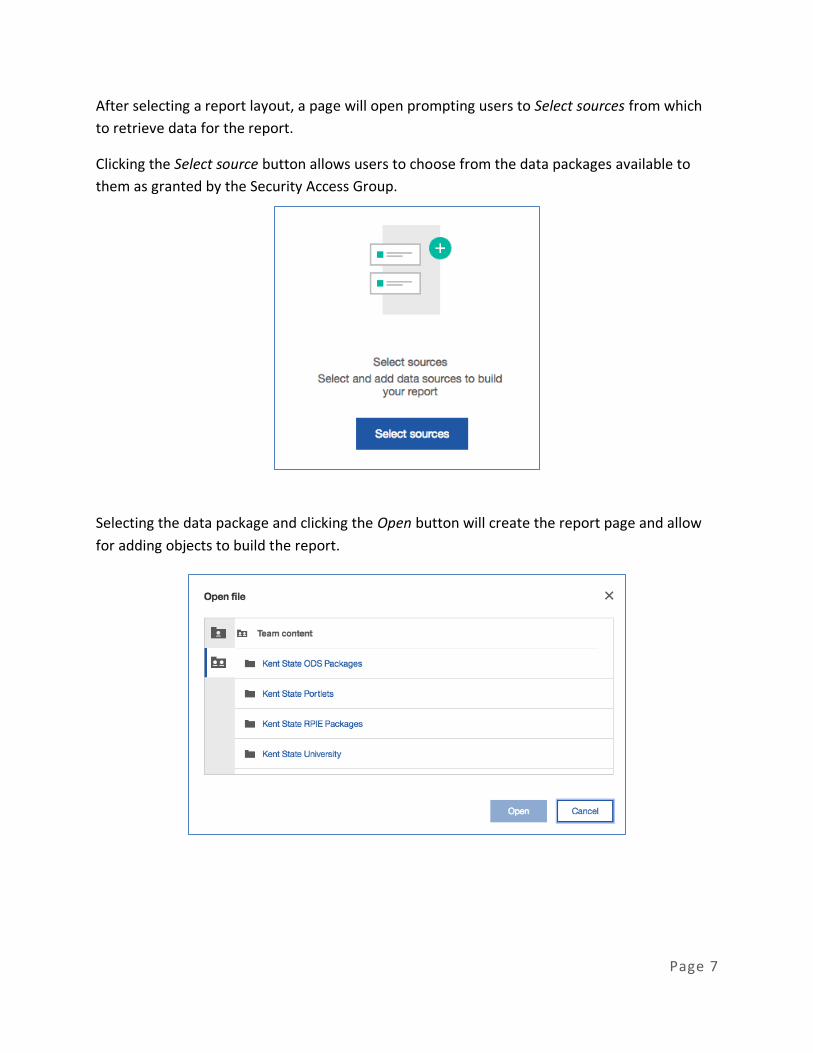
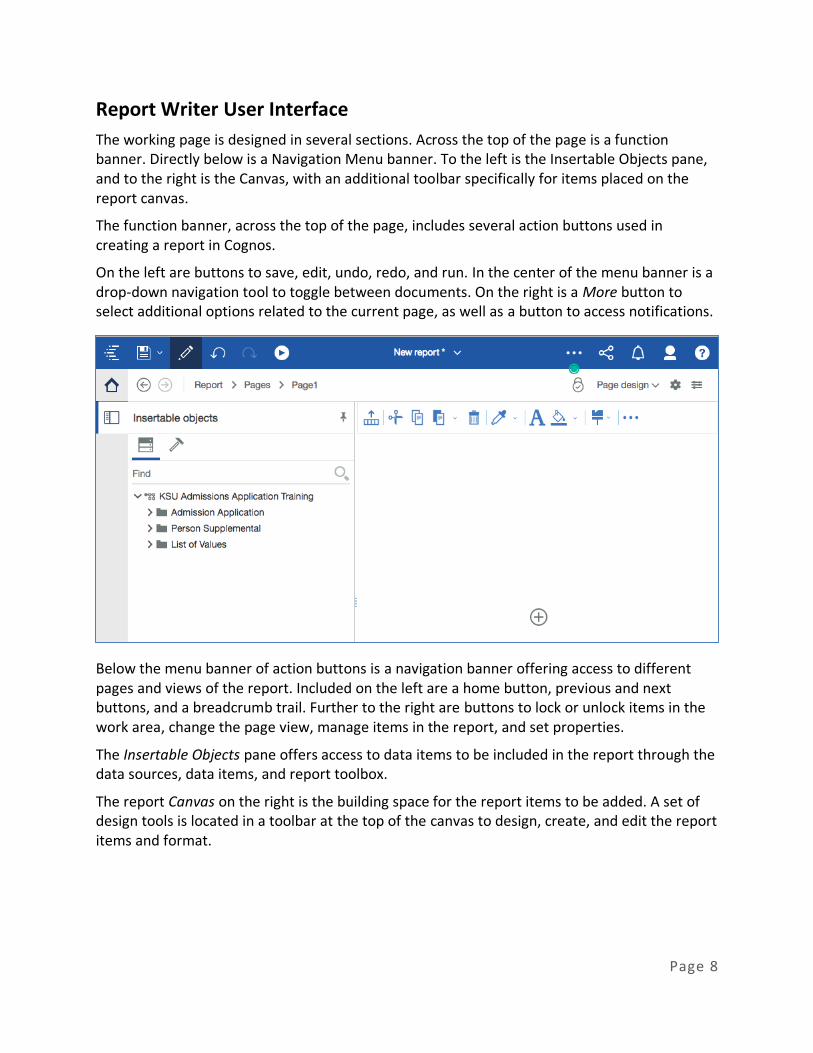
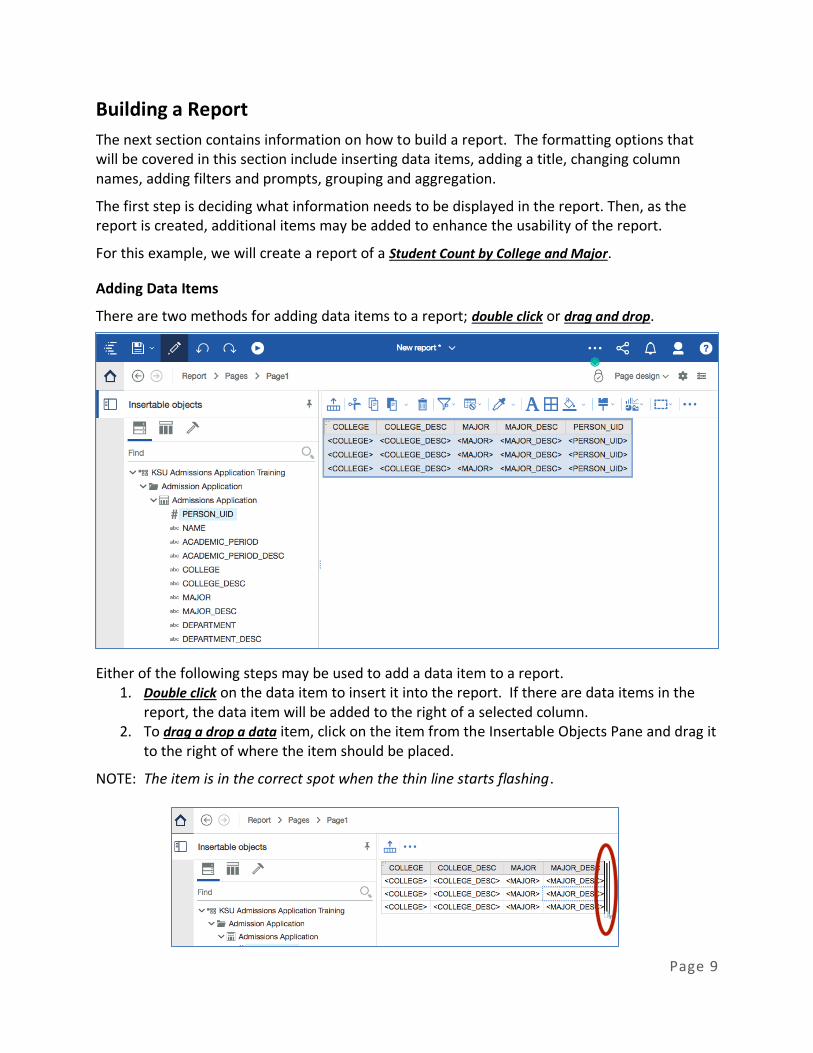
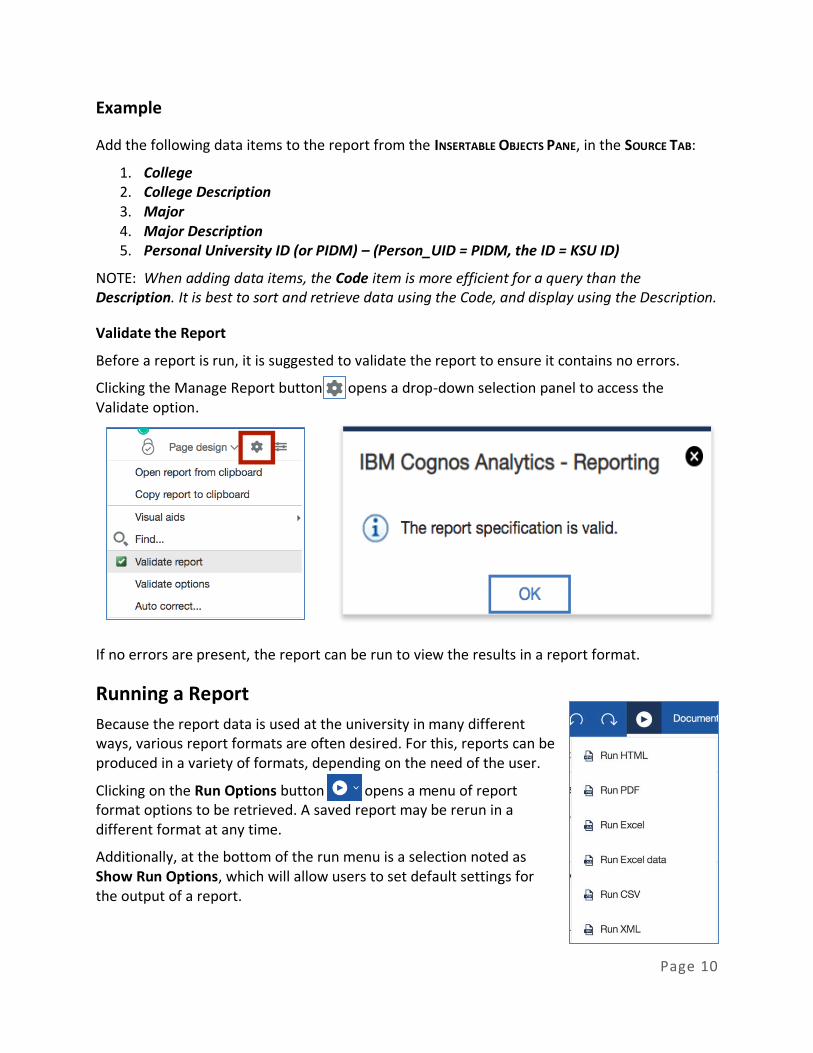
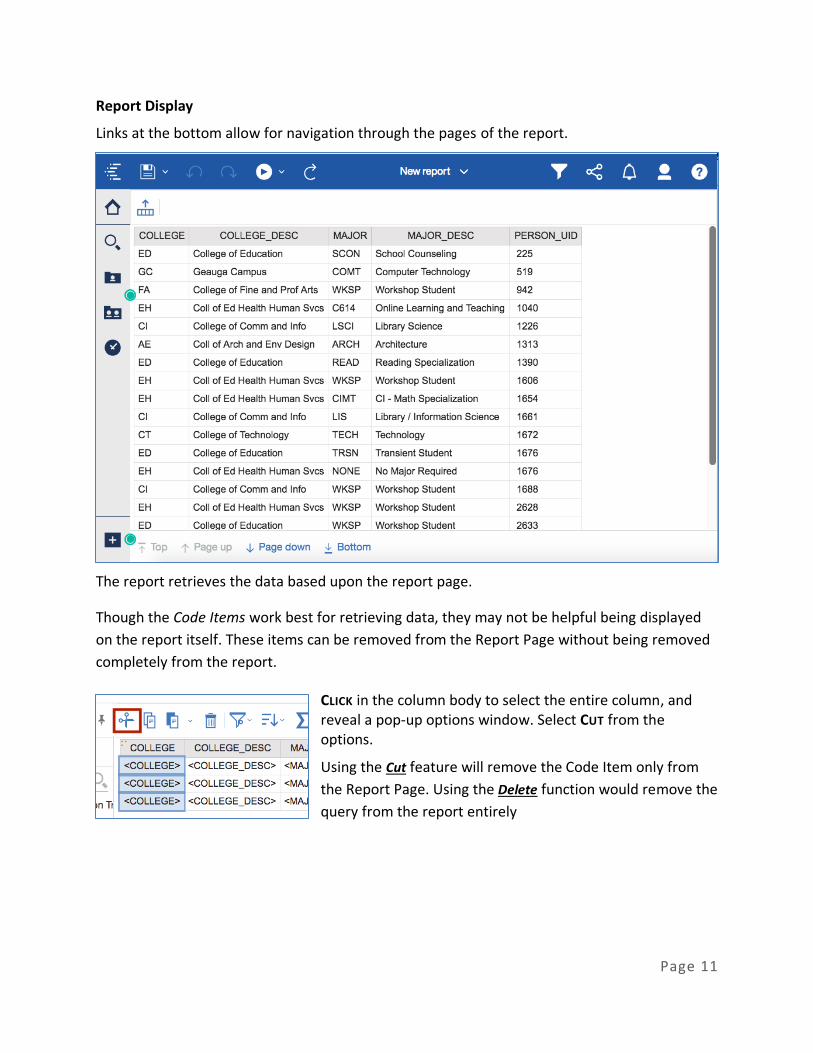
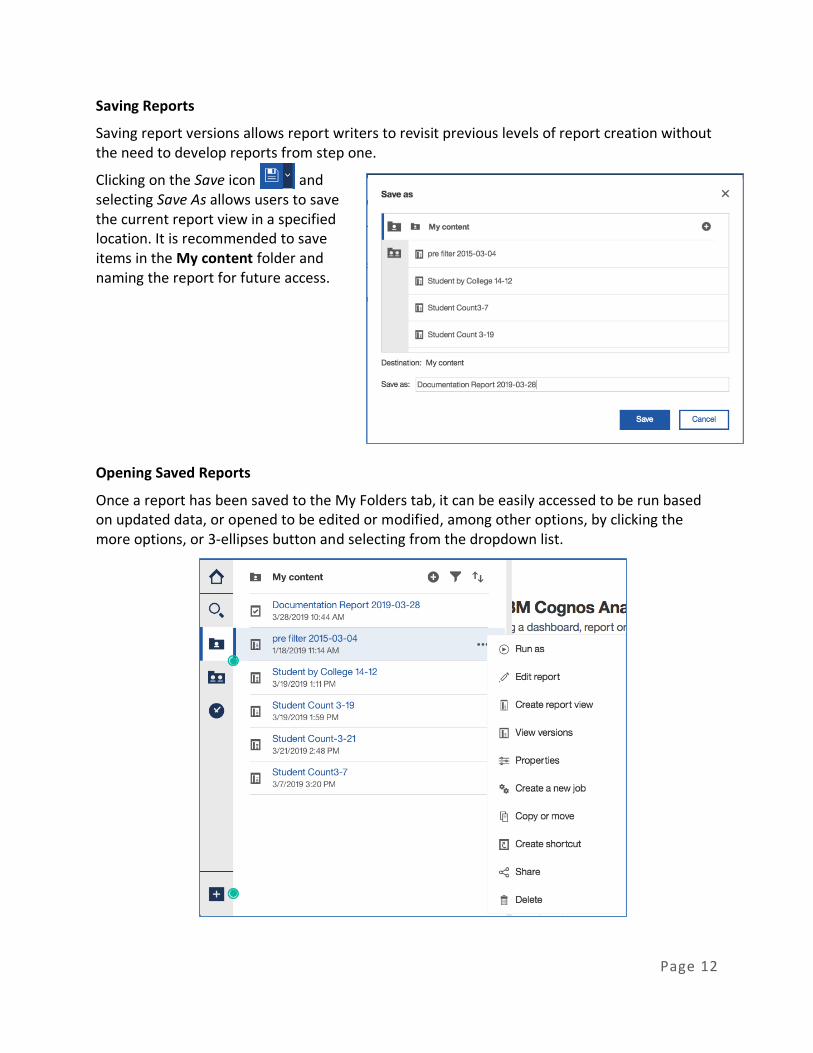
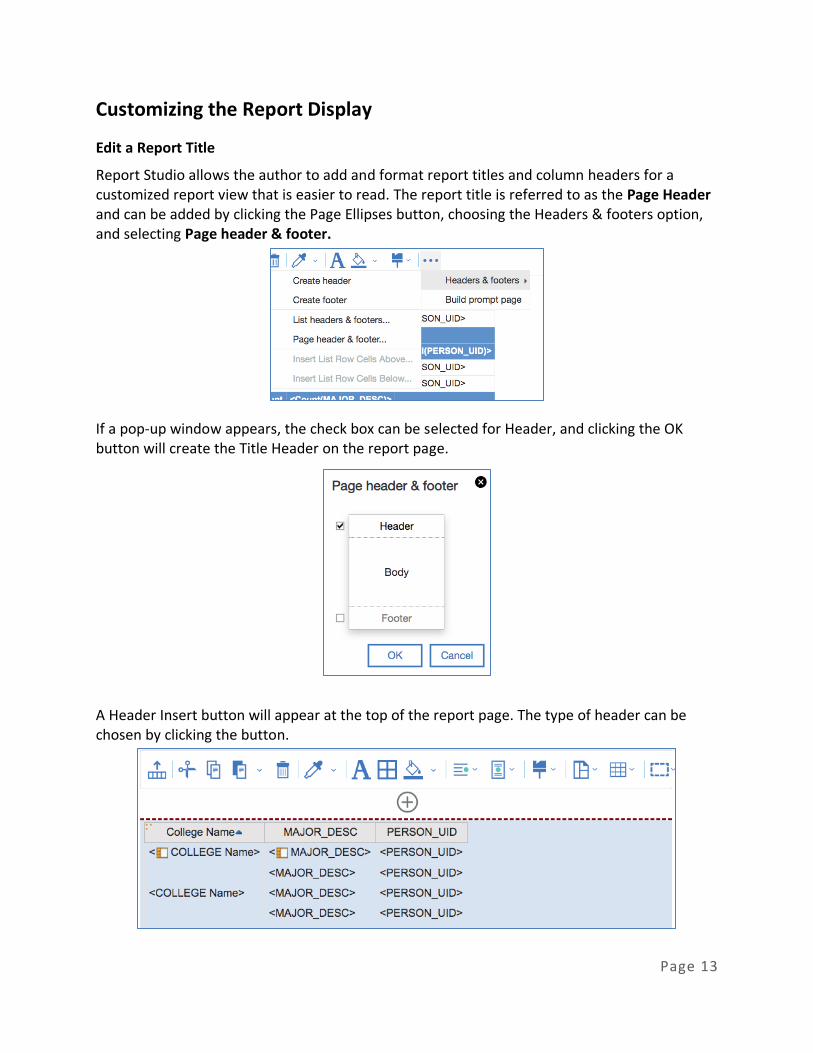
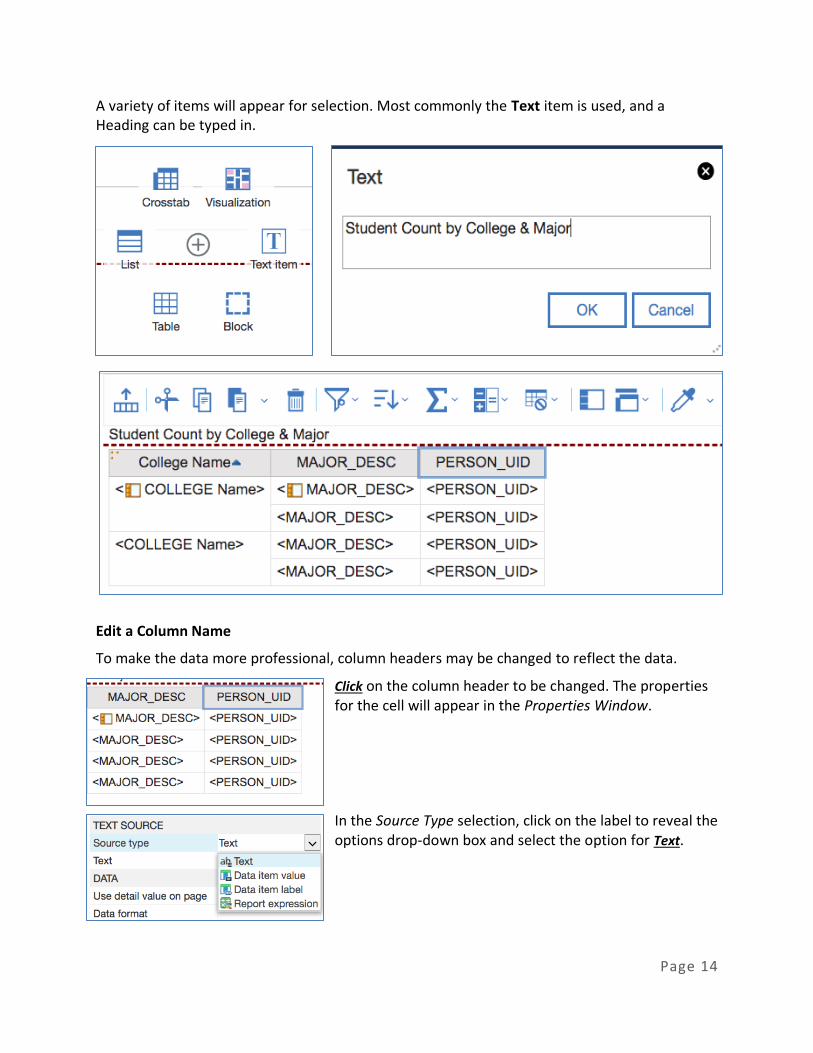
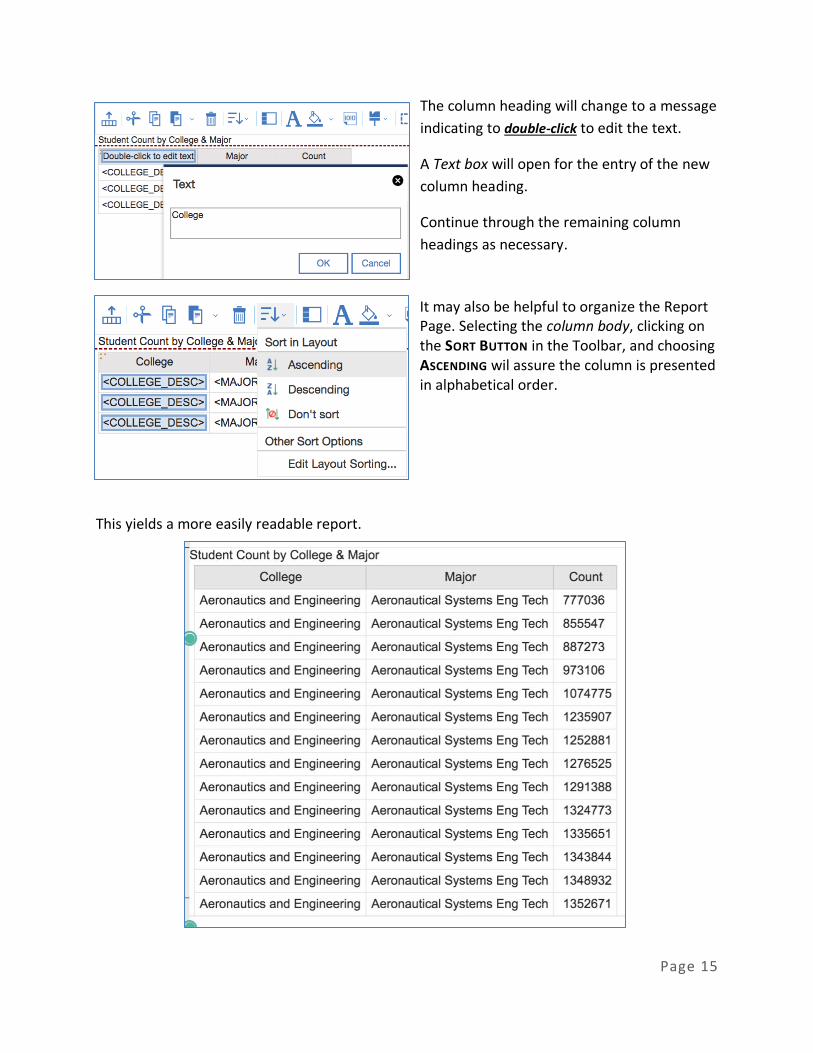
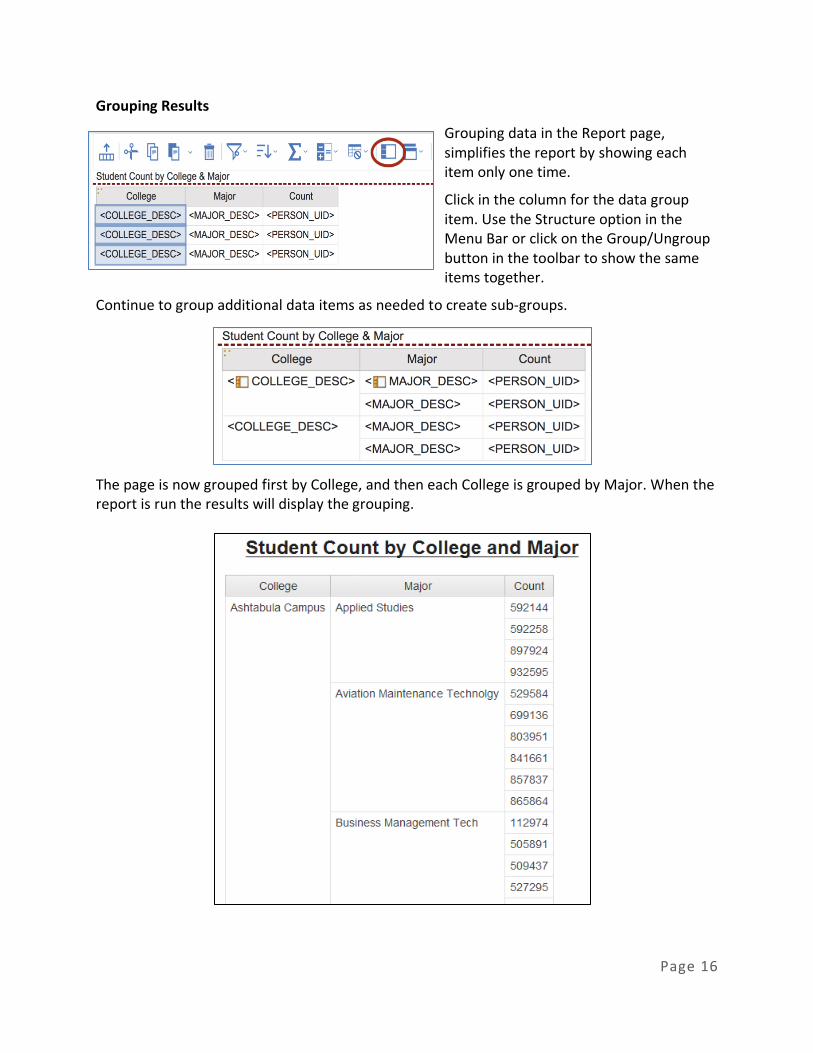
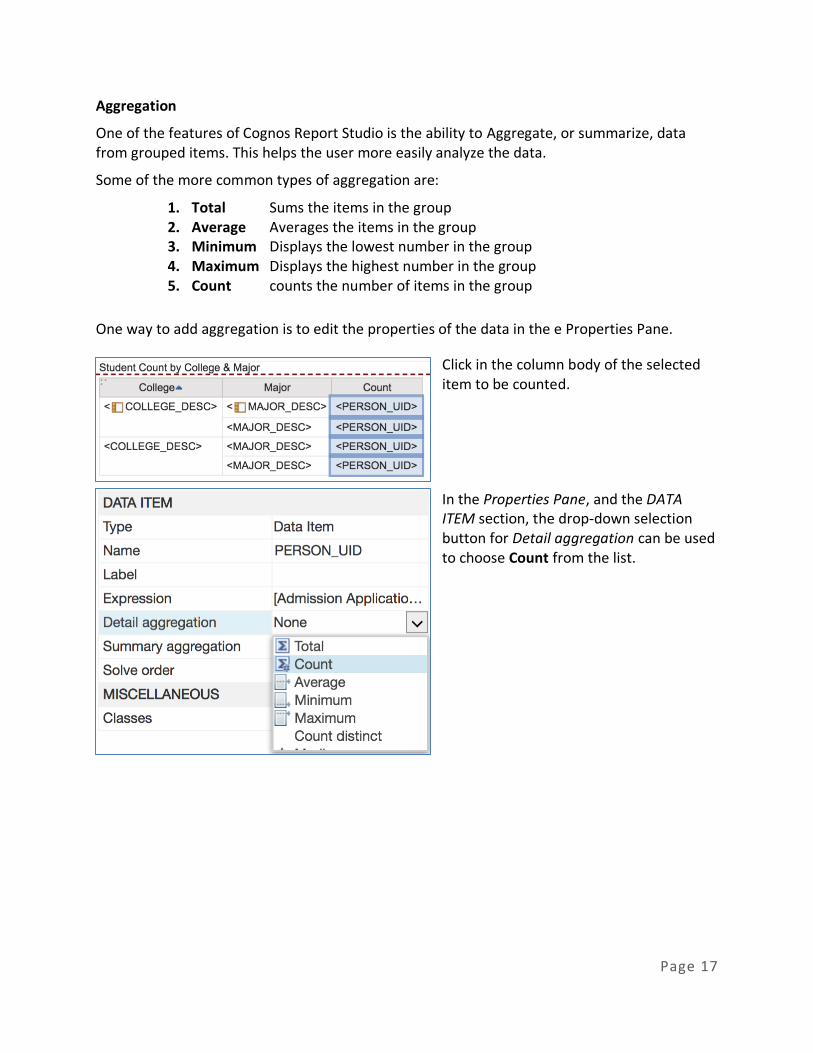
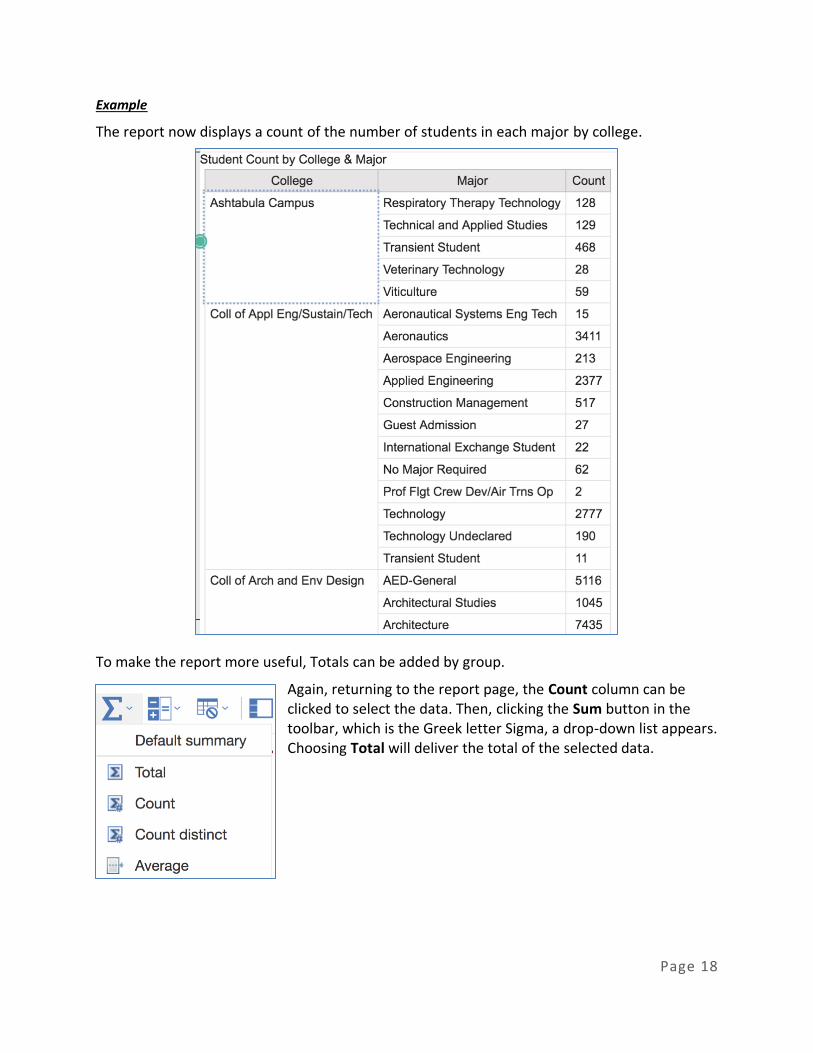
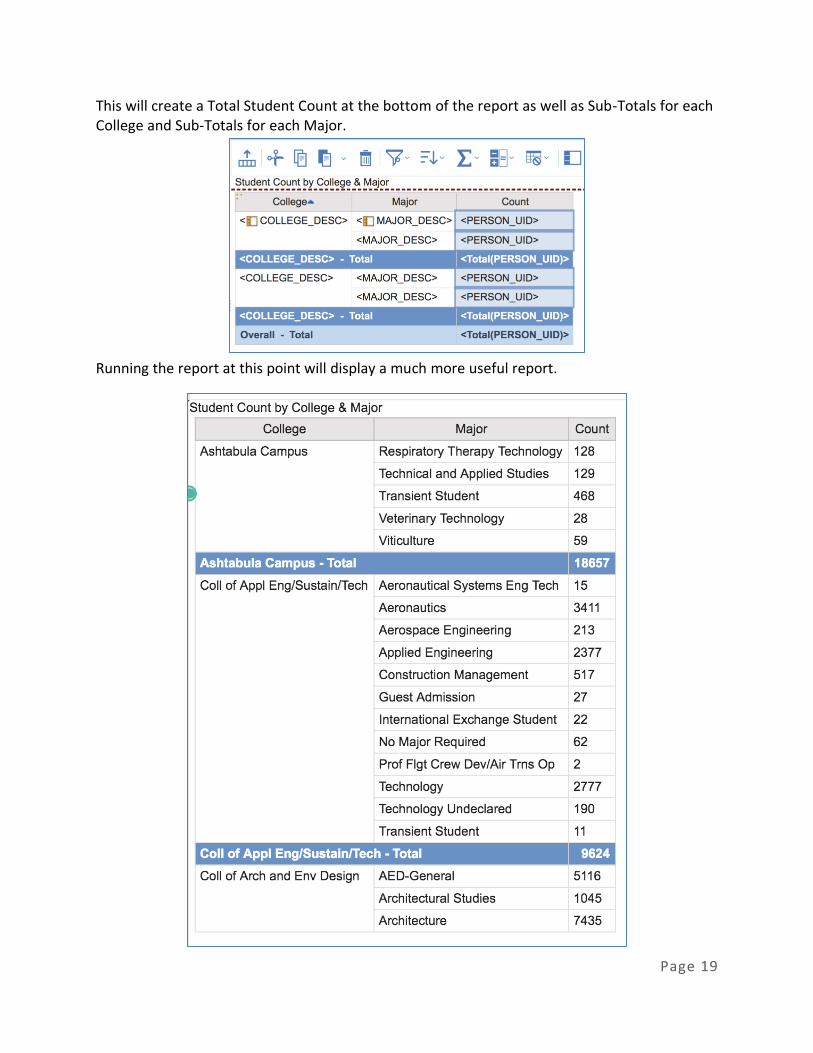
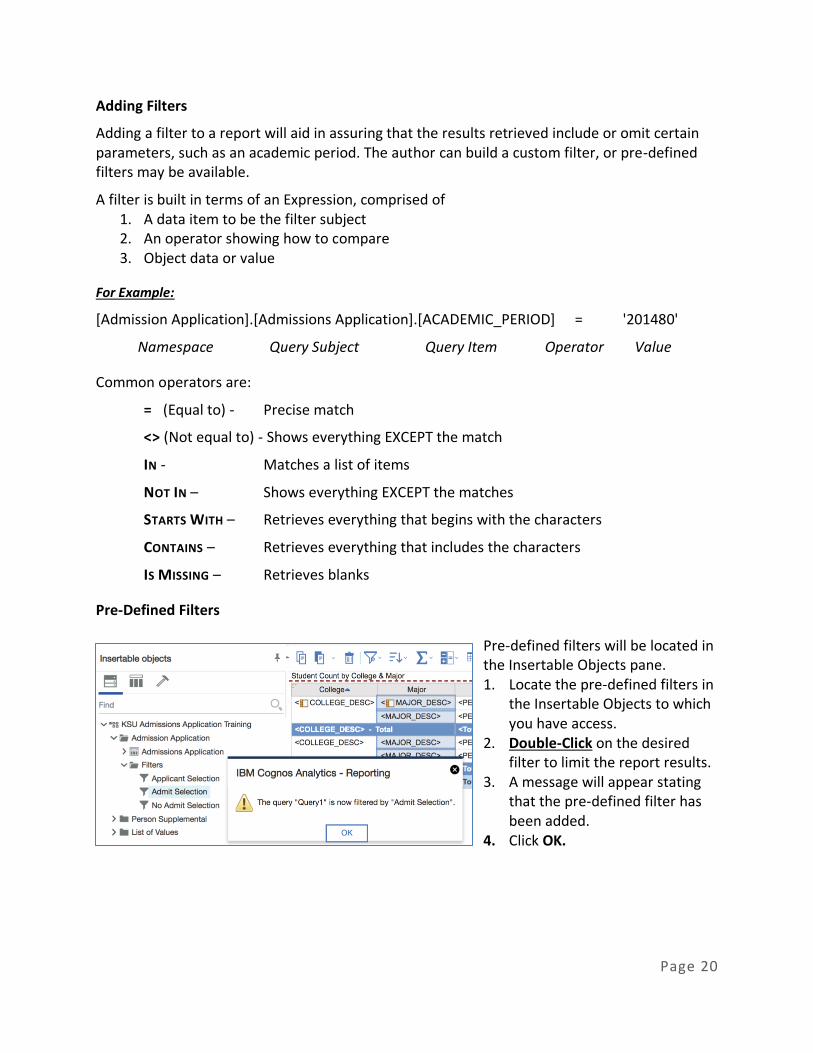
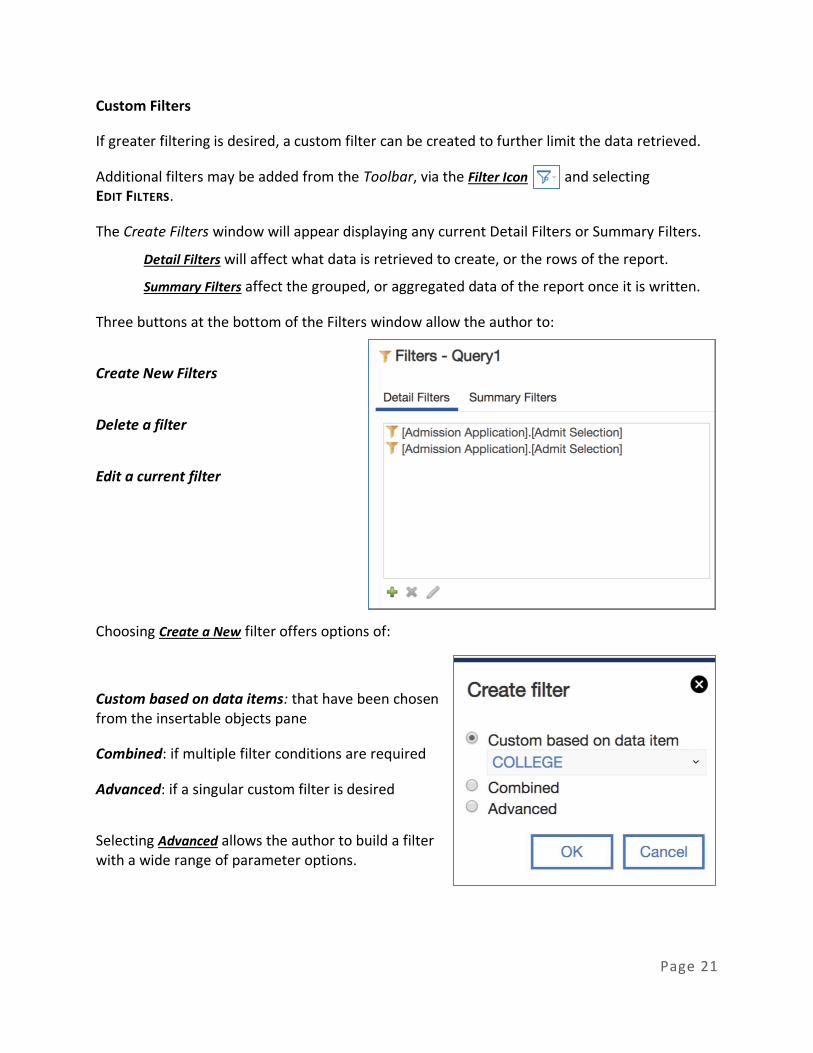
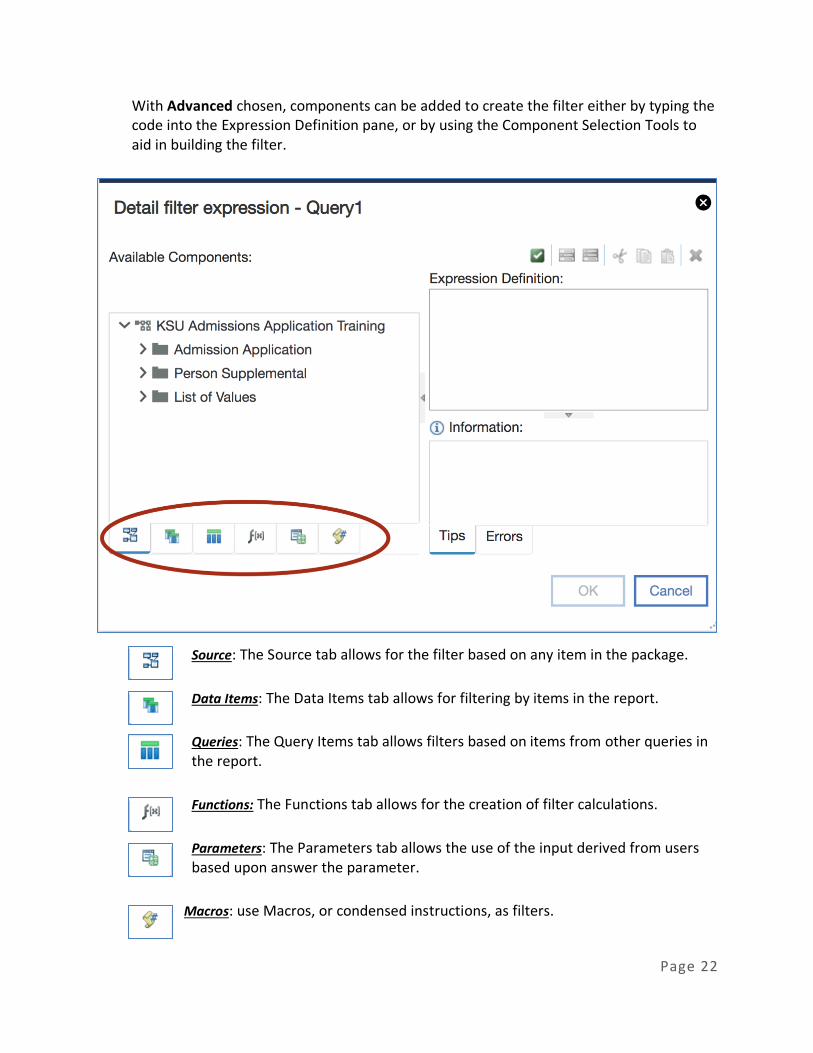
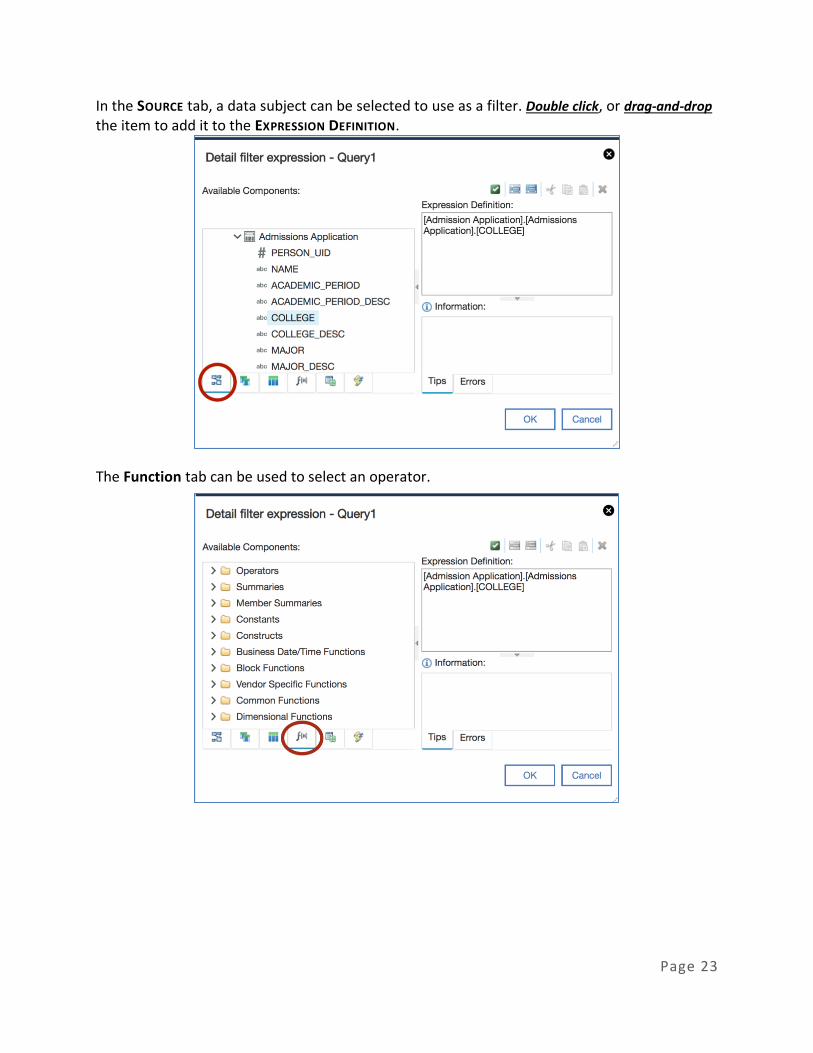
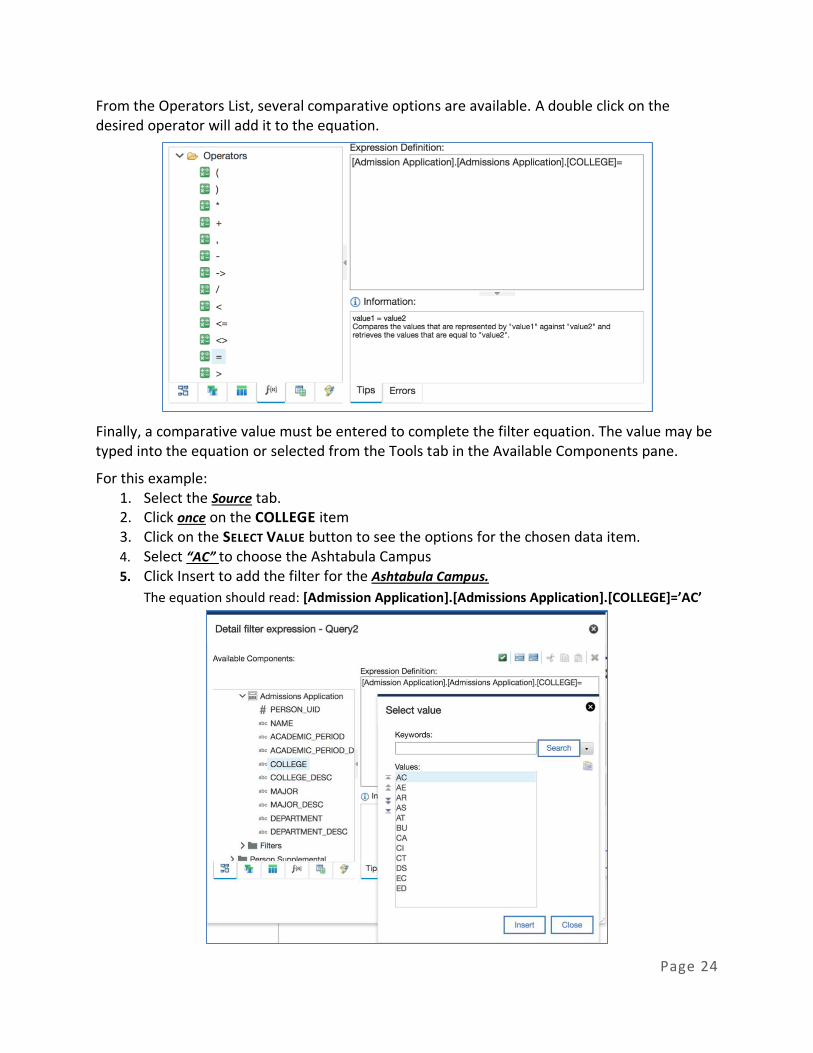
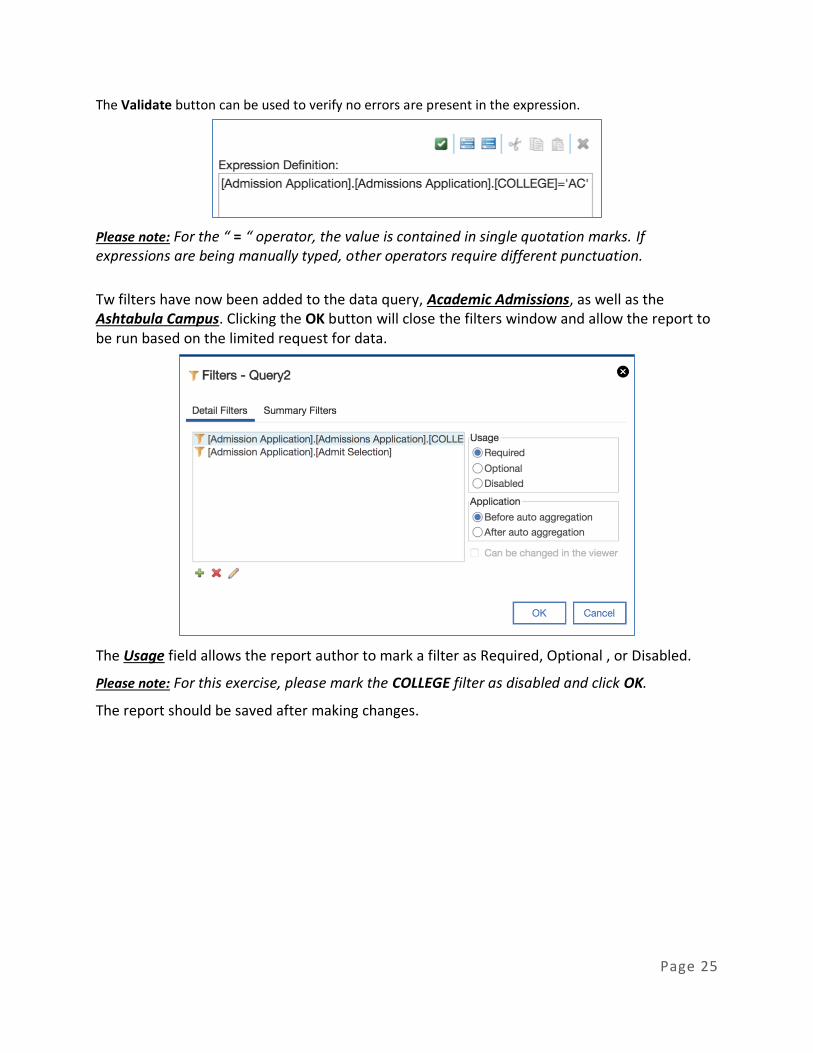
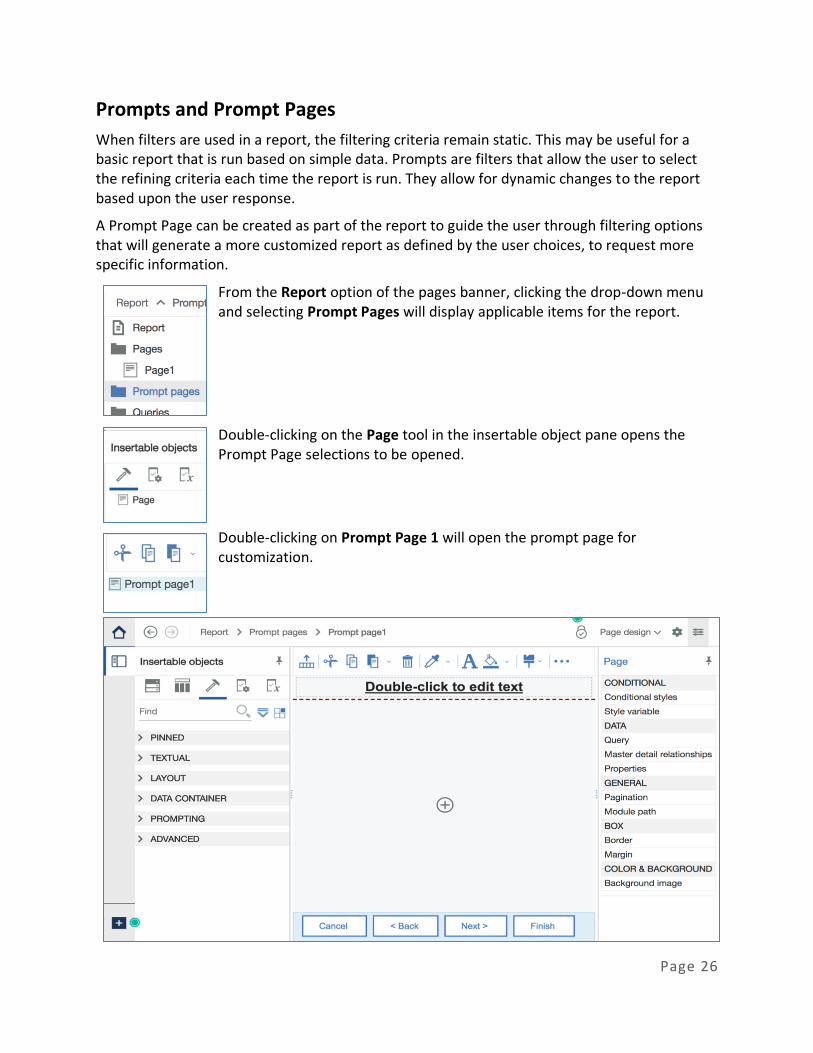
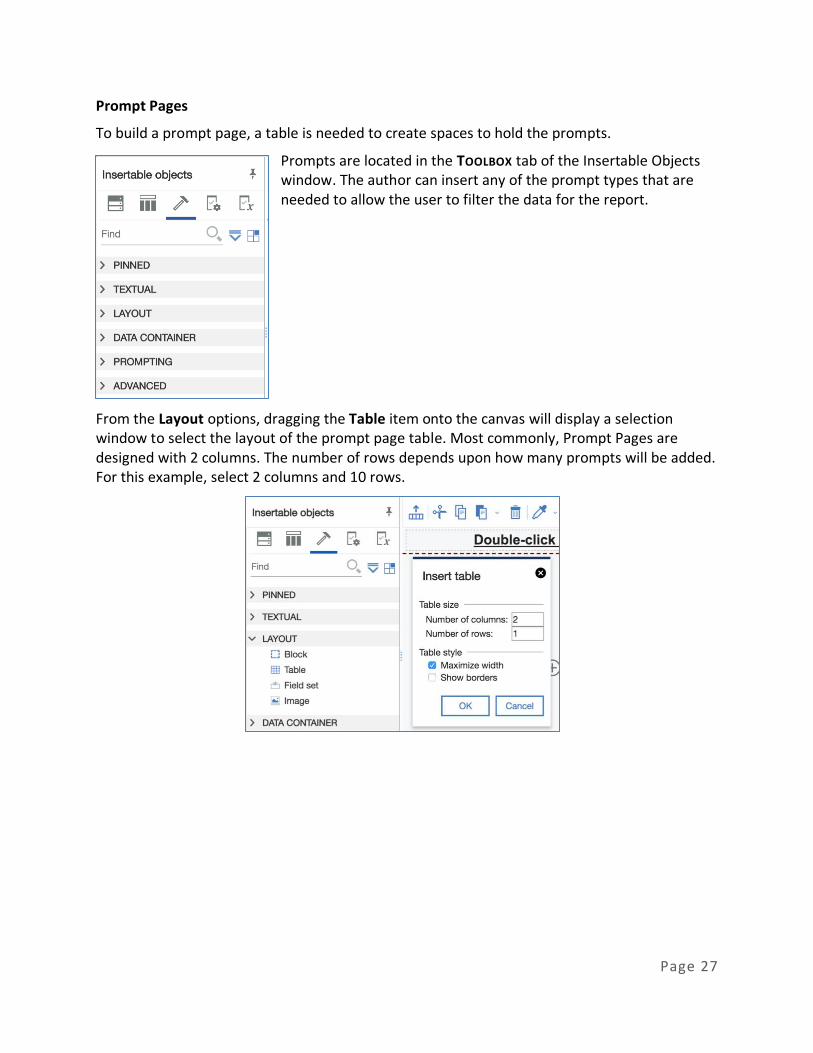
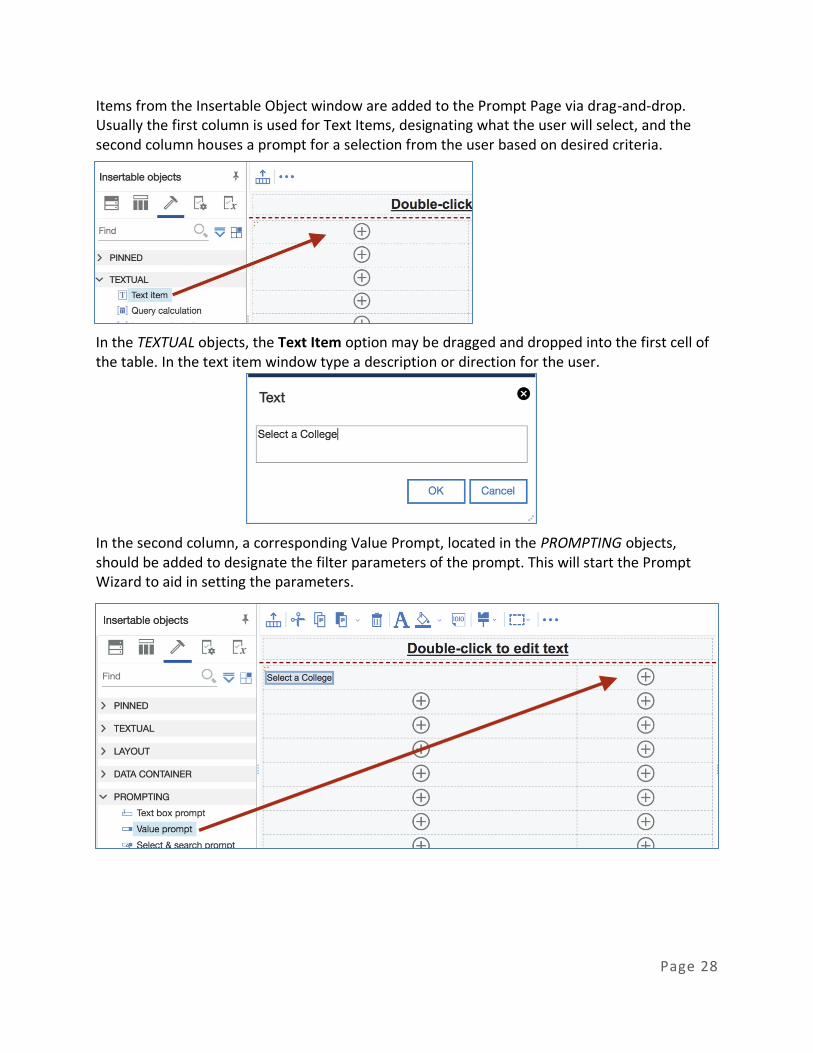
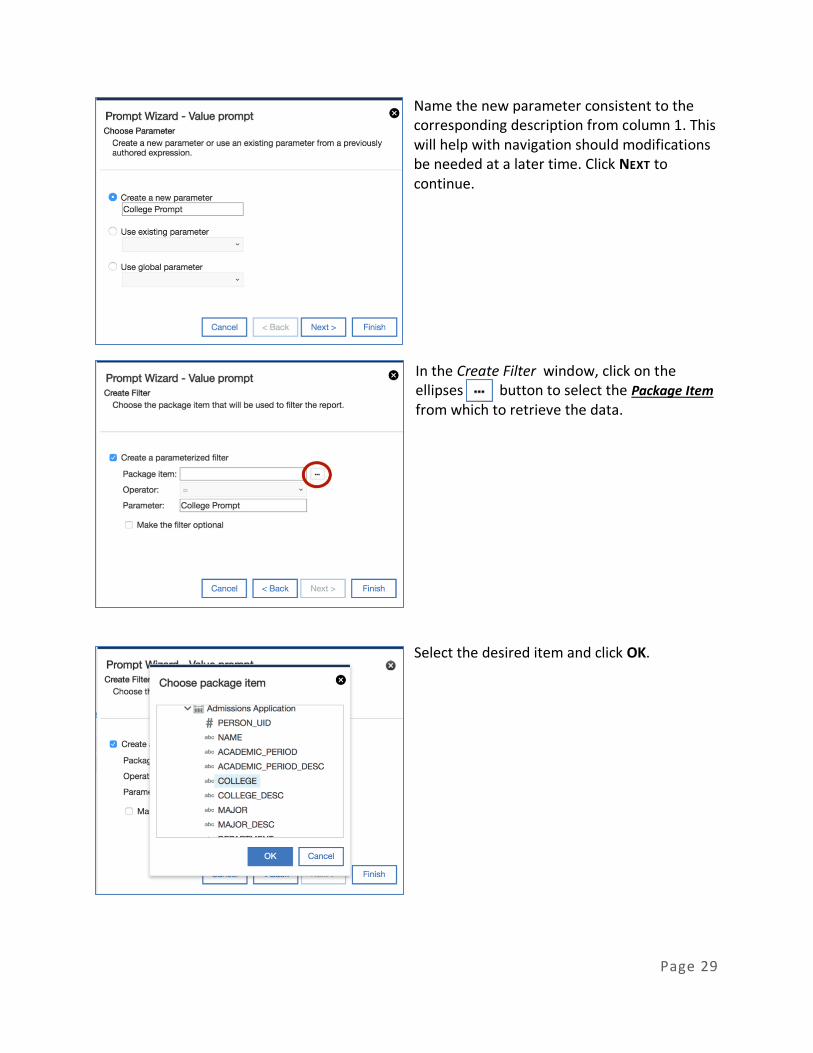
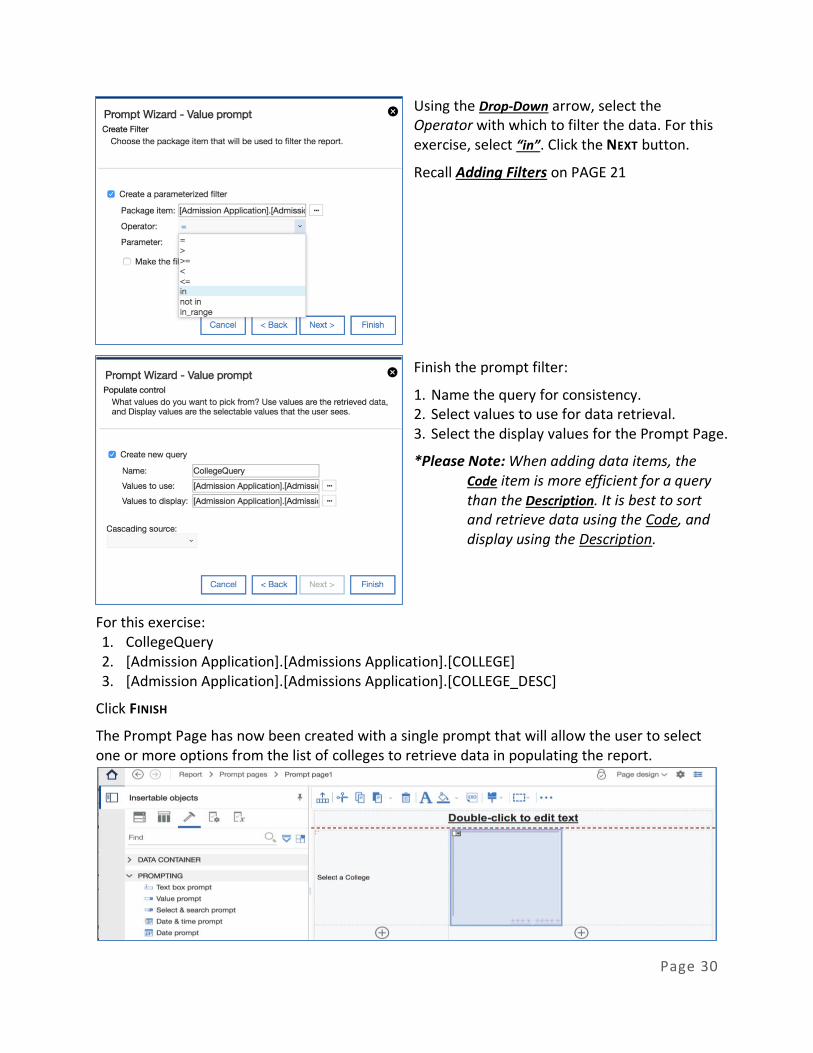
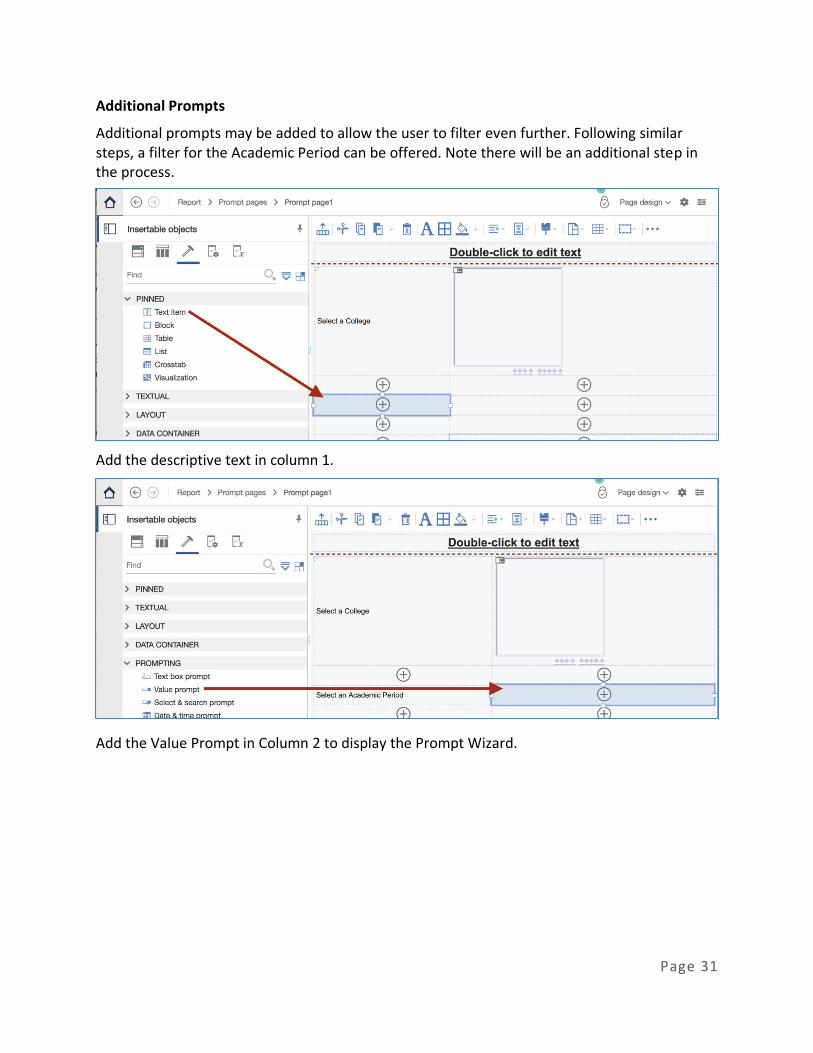
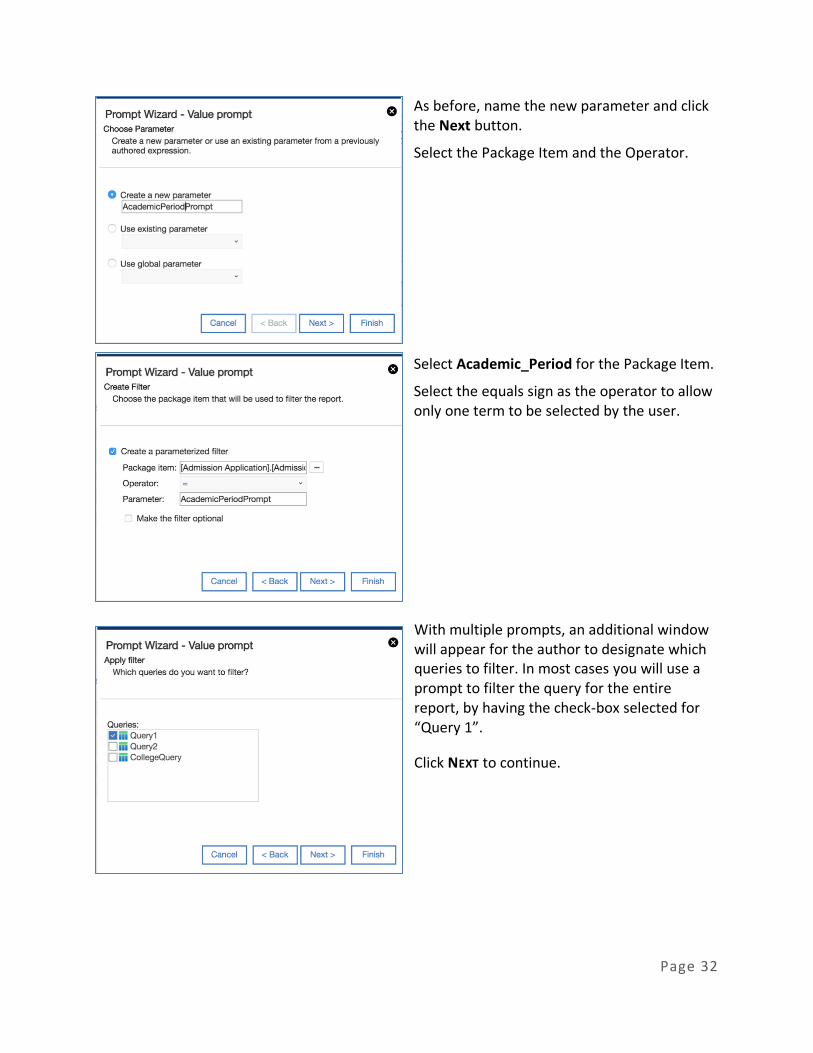
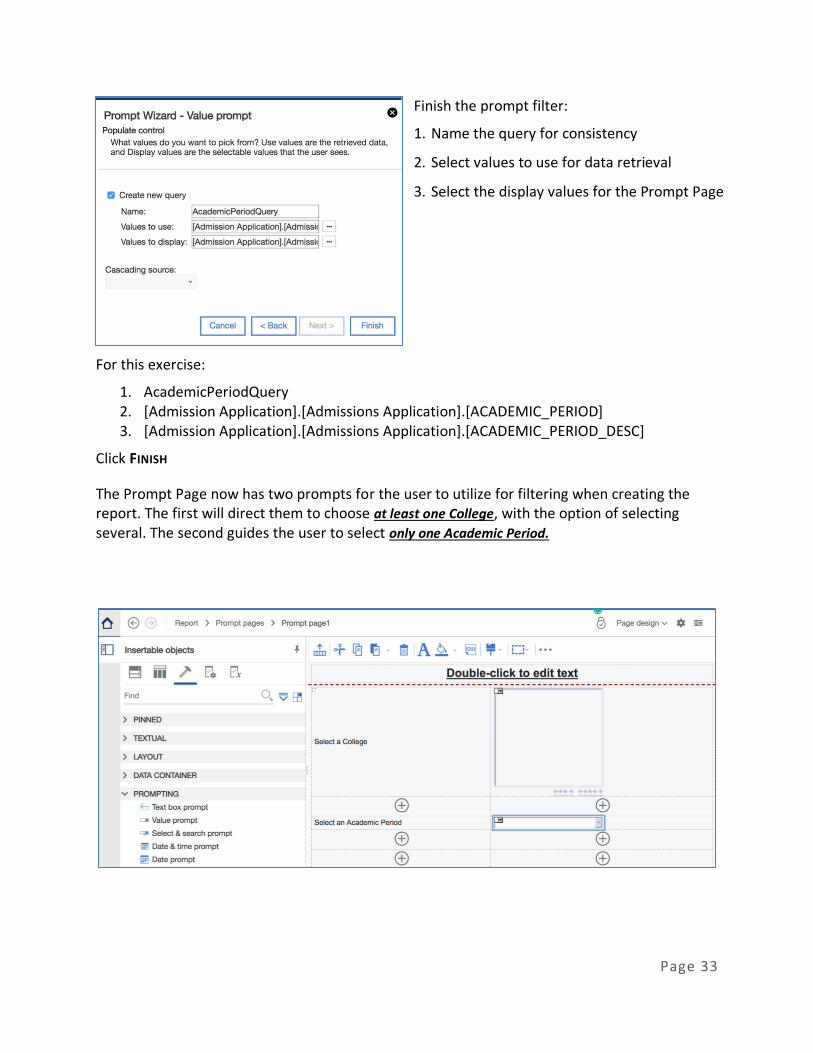
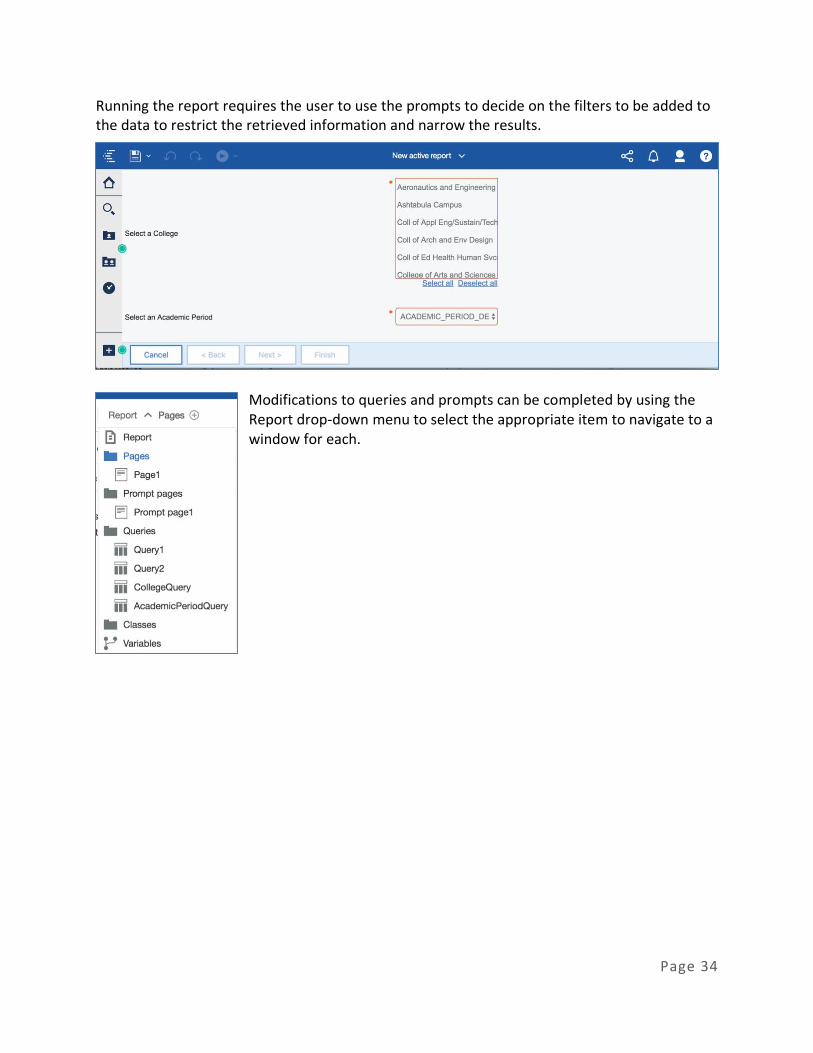
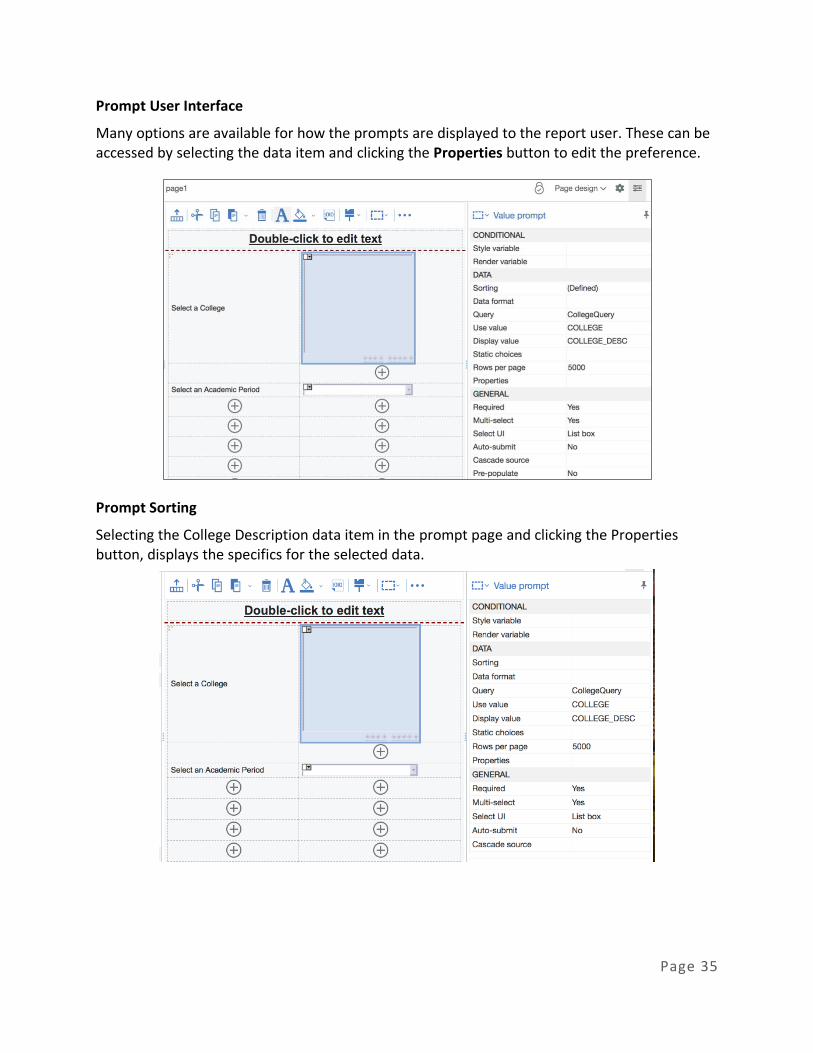
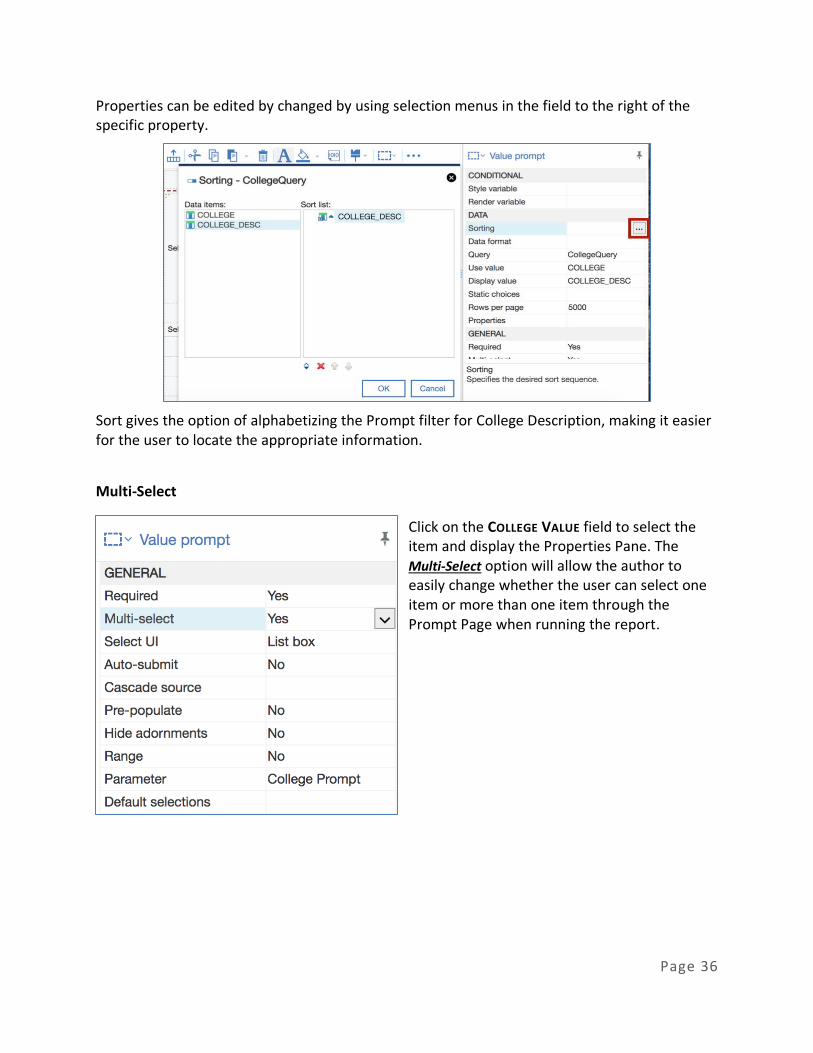
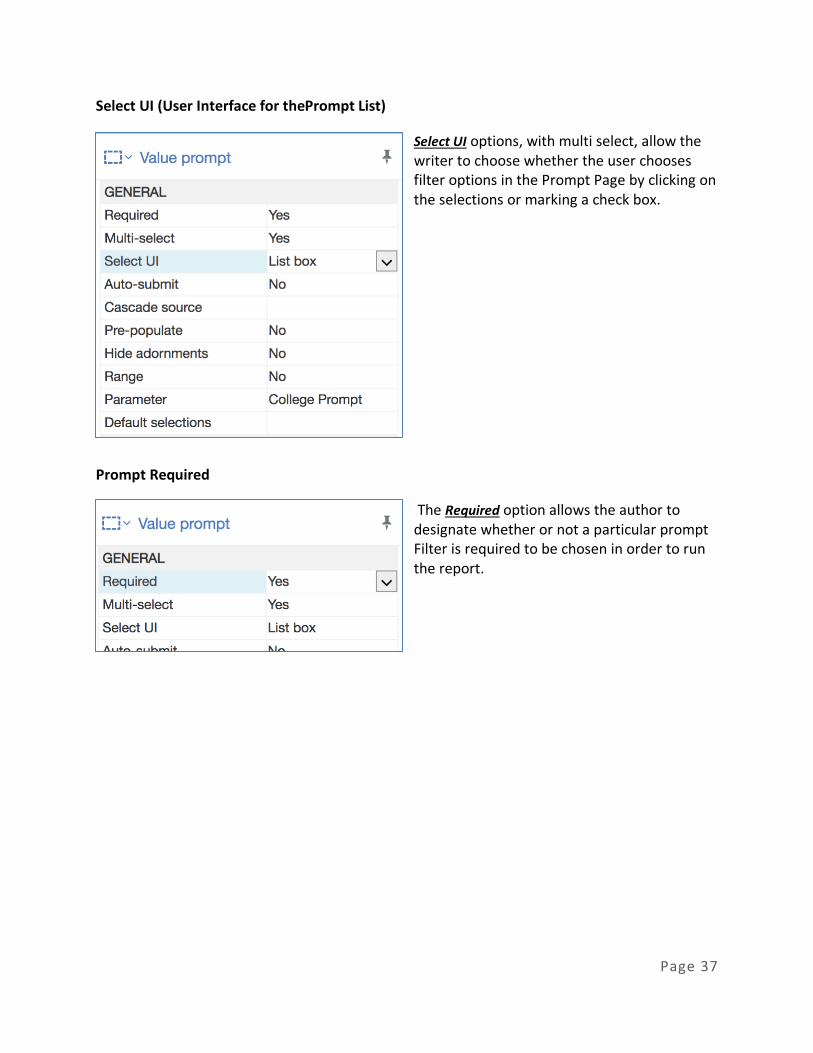