Embed Size (px)
Citation preview

ePM Quick Reference Guide #75
QRG.075 Ad-Hoc Reporting Page 1
ePM 6.0 January 2016
Cognos – Ad-Hoc Reporting (Basics)
What is Cognos – Ad-Hoc Reporting?
Who Will Use This?
Ad-Hoc reporting refers to the capability within Cognos to develop easily list style reports by dragging and dropping query items from the metamodel onto a design surface. In addition , the ePM metamodel includes a number of dimensions, measures and metrics to provide ad-hoc report writers to slice and dice financial, cost and project data to extract relevant information. Cognos Query Studio is designed to allow this quick, ad-hoc reporting.
√ Program Manager √ Project Manager
Types of Reports:
Simple List Report In Query Studio, you begin a new report by inserting columns into a report area.
Grouped List Report: In Query Studio, you group on a column to remove duplicate values. A grouped column automatically sorts the column values and generates summary information for the numeric data to which it refers.
Crosstab: In Query Studio, you can organize your report in a crosstab format. Crosstab reports summarize data so that you can analyze it in relation to both rows and columns.
Charts:
In Query Studio, you create a chart from an existing report. Query Studio includes a selection of chart types that work with one or more columns of numeric data. You can view charts with or without the report information.
Location of Reports:
Public Folders: Contain reports that are of interest to many users. Reports saved in this folder are accessible by other users. PBS standard reports are located in the Public Folder.
My Folders: Reports saved in this folder are only accessible by the logged-in user.
ePM Quick Reference Guide #75
QRG.075 Ad-Hoc Reporting Page 2
ePM 6.0 January 2016
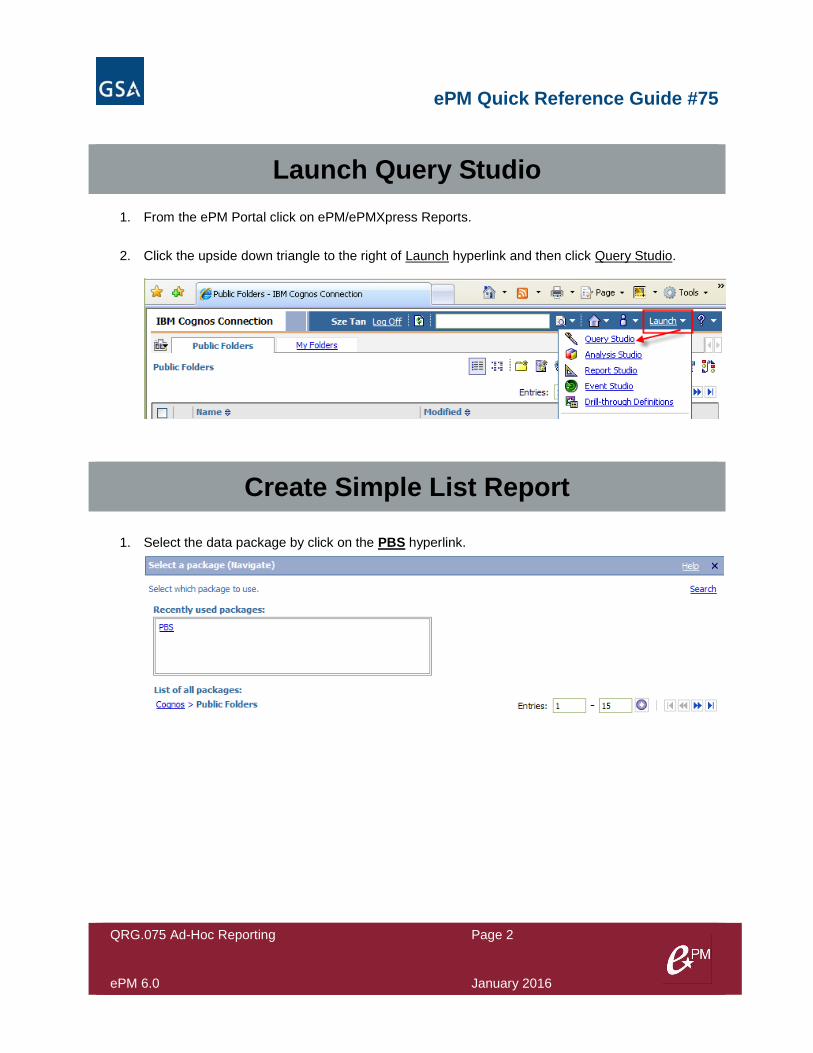
Launch Query Studio 1. From the ePM Portal click on ePM/ePMXpress Reports.
2. Click the upside down triangle to the right of Launch hyperlink and then click Query Studio.
Create Simple List Report
1. Select the data package by click on the PBS hyperlink.
ePM Quick Reference Guide #75
QRG.075 Ad-Hoc Reporting Page 3
ePM 6.0 January 2016
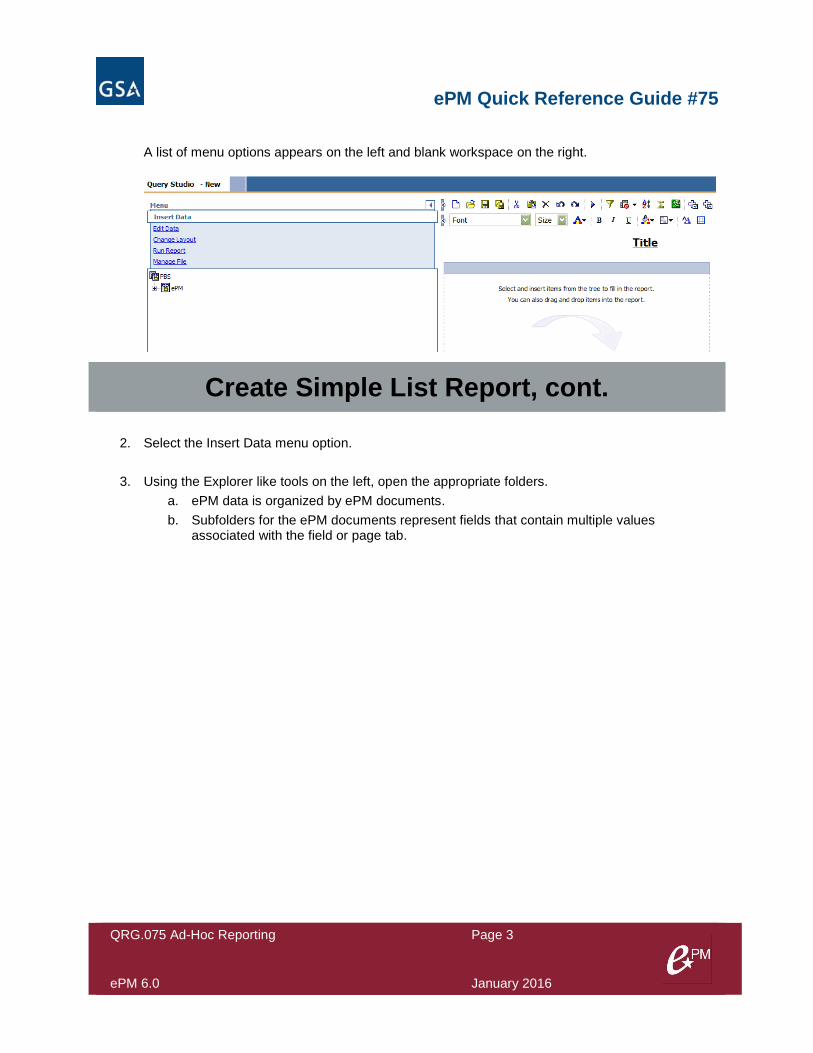
A list of menu options appears on the left and blank workspace on the right.
Create Simple List Report, cont.
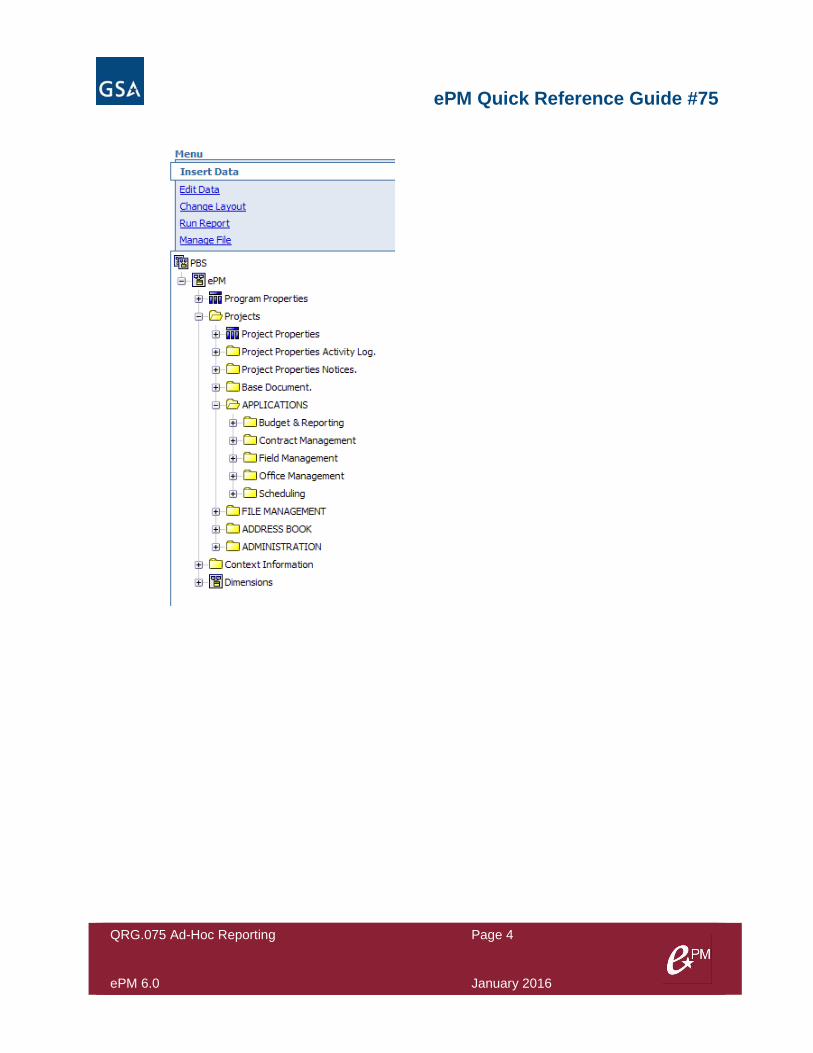
2. Select the Insert Data menu option.
3. Using the Explorer like tools on the left, open the appropriate folders.
a. ePM data is organized by ePM documents.
b. Subfolders for the ePM documents represent fields that contain multiple values associated with the field or page tab.
ePM Quick Reference Guide #75
QRG.075 Ad-Hoc Reporting Page 4
ePM 6.0 January 2016
ePM Quick Reference Guide #75
QRG.075 Ad-Hoc Reporting Page 5
ePM 6.0 January 2016
Create Simple List Report, cont.
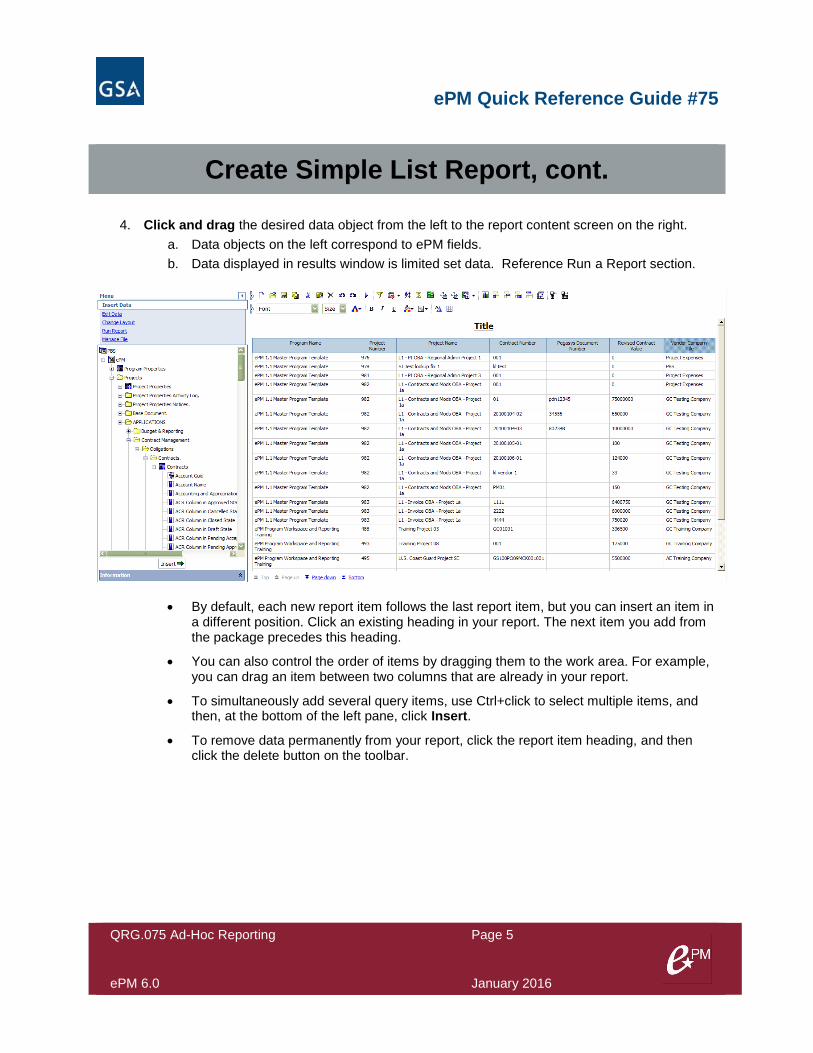
4. Click and drag the desired data object from the left to the report content screen on the right.
a. Data objects on the left correspond to ePM fields.
b. Data displayed in results window is limited set data. Reference Run a Report section.
By default, each new report item follows the last report item, but you can insert an item in a different position. Click an existing heading in your report. The next item you add from the package precedes this heading.
You can also control the order of items by dragging them to the work area. For example, you can drag an item between two columns that are already in your report.
To simultaneously add several query items, use Ctrl+click to select multiple items, and then, at the bottom of the left pane, click Insert.
To remove data permanently from your report, click the report item heading, and then click the delete button on the toolbar.
ePM Quick Reference Guide #75
QRG.075 Ad-Hoc Reporting Page 6
ePM 6.0 January 2016
Create Simple List Report, cont.
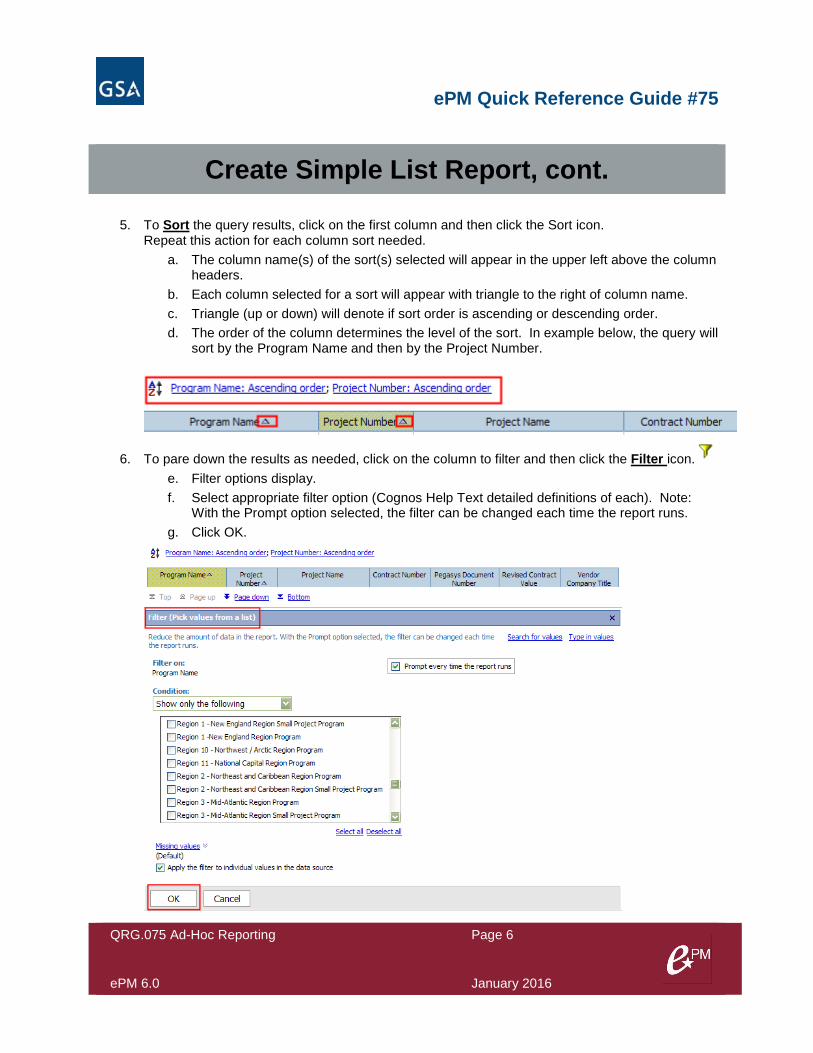
5. To Sort the query results, click on the first column and then click the Sort icon. Repeat this action for each column sort needed.
a. The column name(s) of the sort(s) selected will appear in the upper left above the column headers.
b. Each column selected for a sort will appear with triangle to the right of column name.
c. Triangle (up or down) will denote if sort order is ascending or descending order.
d. The order of the column determines the level of the sort. In example below, the query will sort by the Program Name and then by the Project Number.
6. To pare down the results as needed, click on the column to filter and then click the Filter icon.
e. Filter options display.
f. Select appropriate filter option (Cognos Help Text detailed definitions of each). Note: With the Prompt option selected, the filter can be changed each time the report runs.
g. Click OK.
ePM Quick Reference Guide #75
QRG.075 Ad-Hoc Reporting Page 7
ePM 6.0 January 2016
Create Simple List Report, cont.
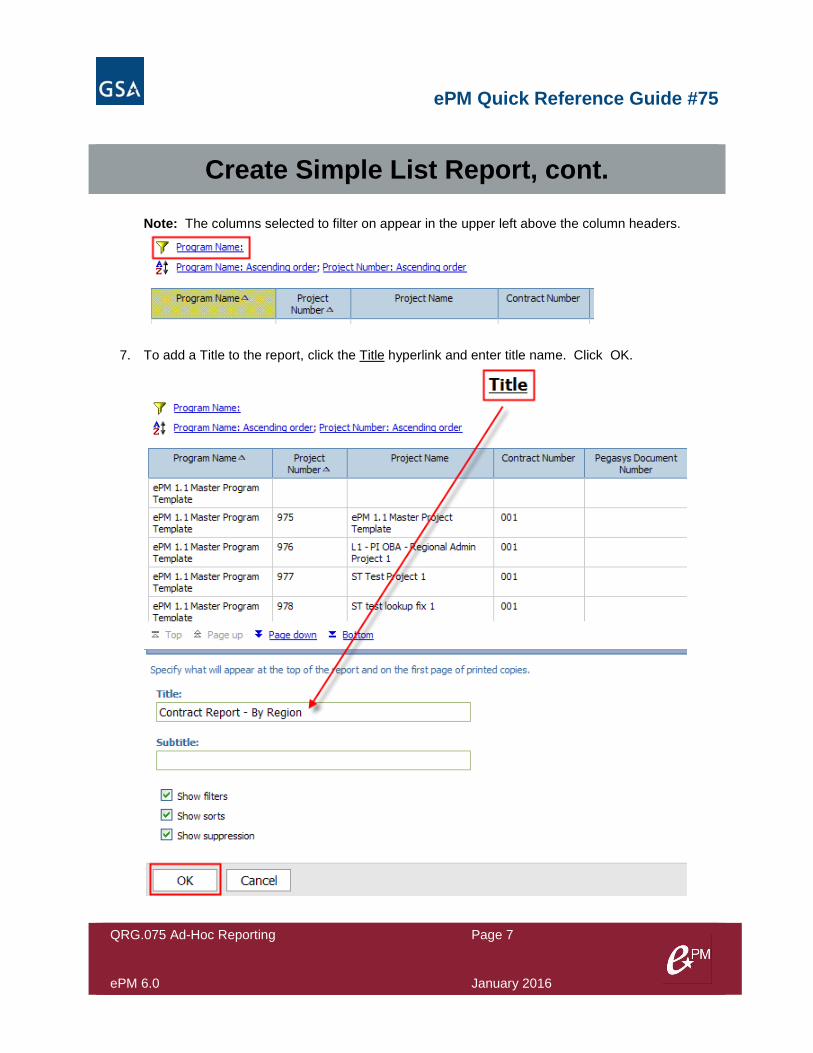
Note: The columns selected to filter on appear in the upper left above the column headers.
7. To add a Title to the report, click the Title hyperlink and enter title name. Click OK.
ePM Quick Reference Guide #75
QRG.075 Ad-Hoc Reporting Page 8
ePM 6.0 January 2016
Create Simple List Report, cont.
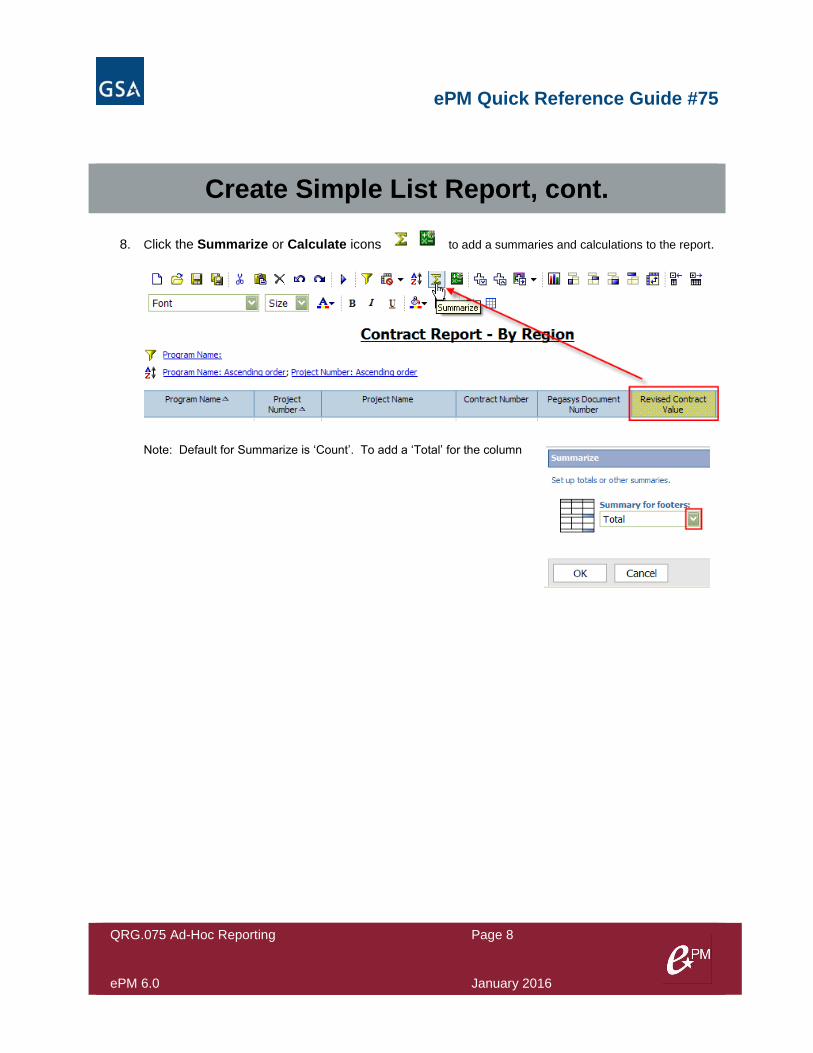
8. Click the Summarize or Calculate icons to add a summaries and calculations to the report.
Note: Default for Summarize is ‘Count’. To add a ‘Total’ for the column
ePM Quick Reference Guide #75
QRG.075 Ad-Hoc Reporting Page 9
ePM 6.0 January 2016
Save Report
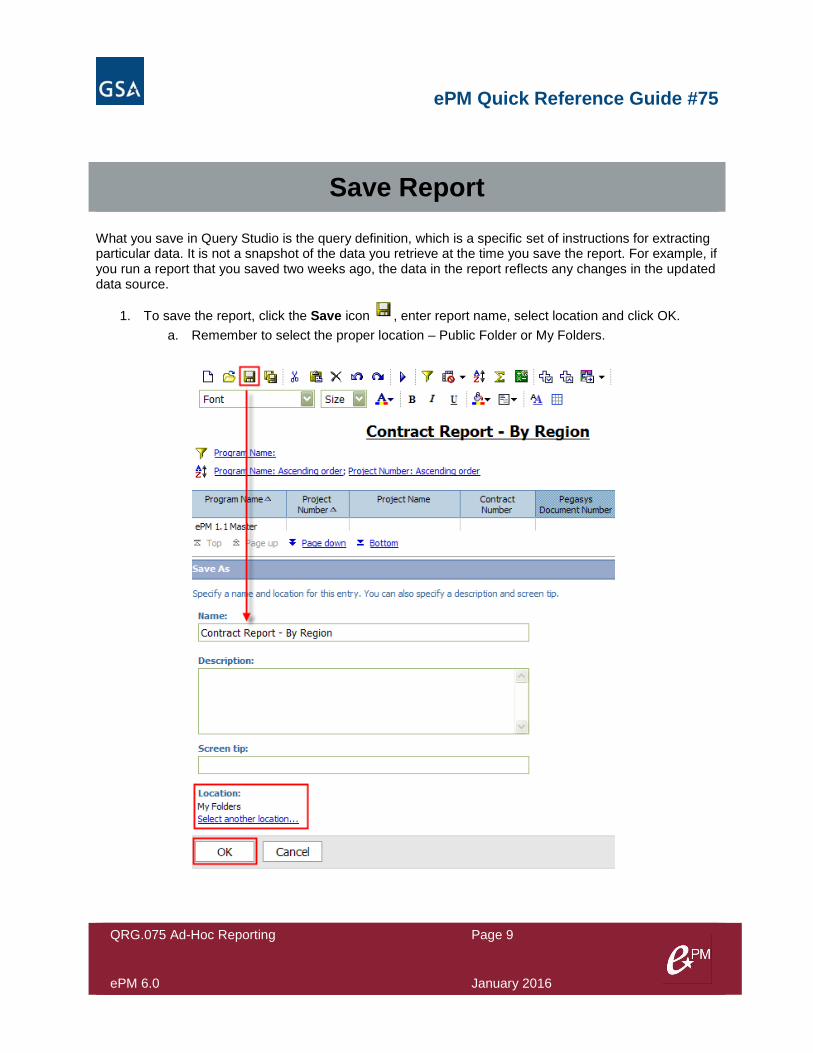
What you save in Query Studio is the query definition, which is a specific set of instructions for extracting particular data. It is not a snapshot of the data you retrieve at the time you save the report. For example, if you run a report that you saved two weeks ago, the data in the report reflects any changes in the updated data source.
1. To save the report, click the Save icon , enter report name, select location and click OK.
a. Remember to select the proper location – Public Folder or My Folders.
ePM Quick Reference Guide #75
QRG.075 Ad-Hoc Reporting Page 10
ePM 6.0 January 2016
Open Existing Report
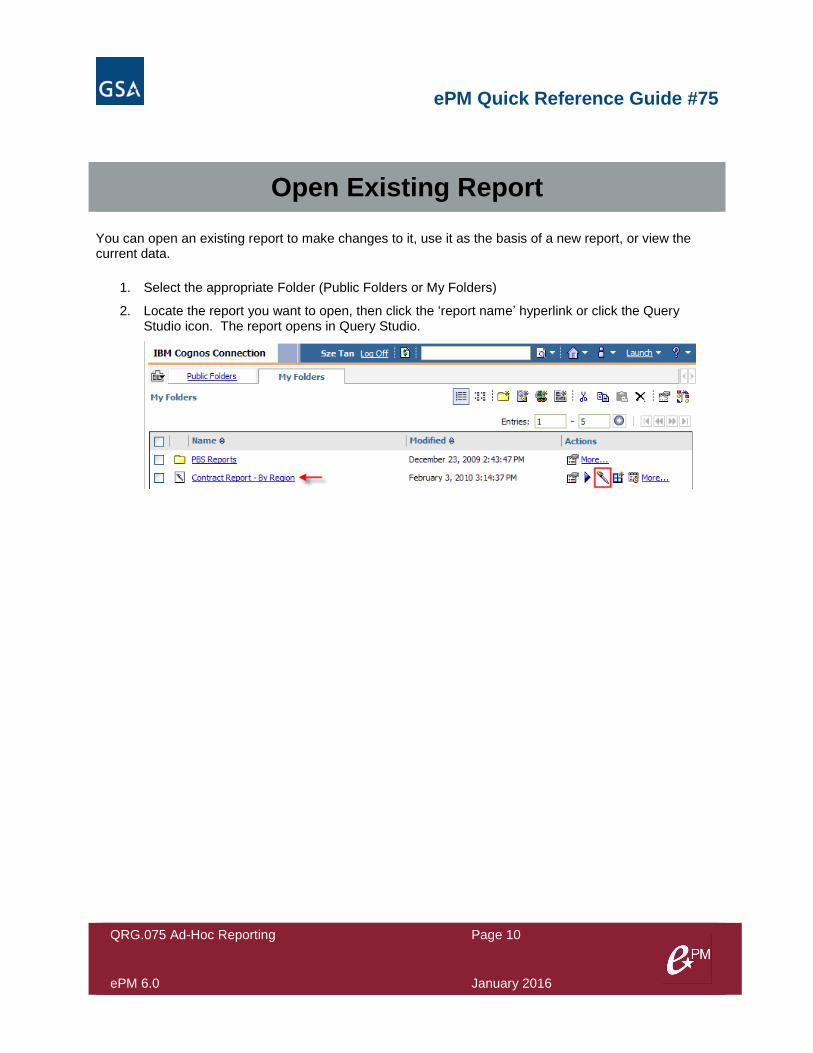
You can open an existing report to make changes to it, use it as the basis of a new report, or view the current data.
1. Select the appropriate Folder (Public Folders or My Folders)
2. Locate the report you want to open, then click the ‘report name’ hyperlink or click the Query Studio icon. The report opens in Query Studio.
ePM Quick Reference Guide #75
QRG.075 Ad-Hoc Reporting Page 11
ePM 6.0 January 2016
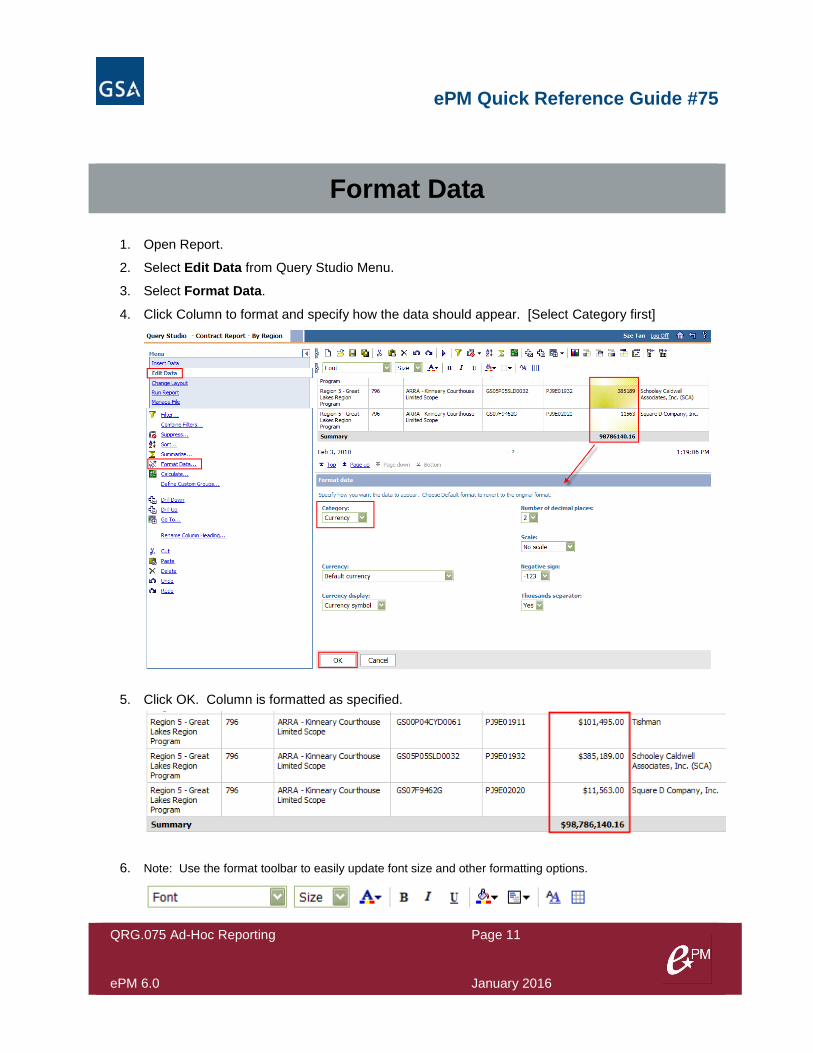
Format Data
1. Open Report.
2. Select Edit Data from Query Studio Menu.
3. Select Format Data.
4. Click Column to format and specify how the data should appear. [Select Category first]
5. Click OK. Column is formatted as specified.
6. Note: Use the format toolbar to easily update font size and other formatting options.
ePM Quick Reference Guide #75
QRG.075 Ad-Hoc Reporting Page 12
ePM 6.0 January 2016
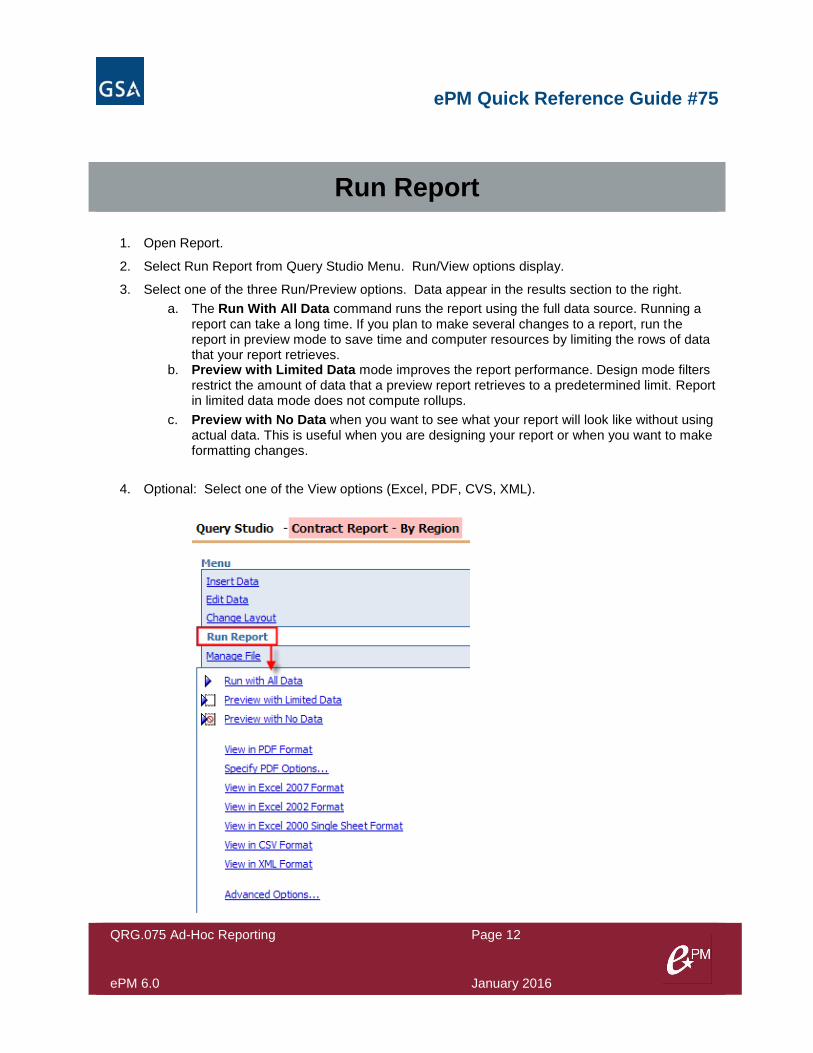
Run Report
1. Open Report.
2. Select Run Report from Query Studio Menu. Run/View options display.
3. Select one of the three Run/Preview options. Data appear in the results section to the right.
a. The Run With All Data command runs the report using the full data source. Running a report can take a long time. If you plan to make several changes to a report, run the report in preview mode to save time and computer resources by limiting the rows of data that your report retrieves.
b. Preview with Limited Data mode improves the report performance. Design mode filters restrict the amount of data that a preview report retrieves to a predetermined limit. Report in limited data mode does not compute rollups.
c. Preview with No Data when you want to see what your report will look like without using actual data. This is useful when you are designing your report or when you want to make formatting changes.
4. Optional: Select one of the View options (Excel, PDF, CVS, XML).
ePM Quick Reference Guide #75
QRG.075 Ad-Hoc Reporting Page 13
ePM 6.0 January 2016
Print Report
Print your report to obtain a paper copy.
For best results, use the PDF format when you want to print a report.
1. Open a report in Query Studio.
2. From the Run Report menu, click View in PDF Format . The report opens in PDF format.
3. On the Acrobat Reader toolbar, click print.
4. Select the print options you want and click OK.
Tips
1. If you want to use the report as the basis of a new report, save it using a different name.
2. To browse through the pages of a report, use the links at the bottom of the page.
3. To increase the available space for viewing reports, click the hide menu button in the top right corner of the menu.
4. To view the menu, click the show menu button in the top left corner of the report.
5. You can also resize the menu, and hide/show toolbars .