Embed Size (px)
Citation preview
ieee transactions on ultrasonics, ferroelectrics, and frequency control, vol. 52, no. 1, january 2005 51
Coherent Array Imaging Using PhasedSubarrays. Part II: Simulations and
Experimental ResultsJeremy A. Johnson, Student Member, IEEE, Omer Oralkan, Student Member, IEEE,
Sanlı Ergun, Member, IEEE, Utkan Demirci, Student Member, IEEE, Mustafa Karaman, Member, IEEE,and Butrus T. Khuri-Yakub, Fellow, IEEE
Abstract—The basic principles and theory of phased sub-array (PSA) imaging imaging provides the flexibility of re-ducing the number of front-end hardware channels betweenthat of classical synthetic aperture (CSA) imaging—whichuses only one element per firing event—and full-phased ar-ray (FPA) imaging—which uses all elements for each firing.The performance of PSA generally ranges between that ob-tained by CSA and FPA using the same array, and dependson the amount of hardware complexity reduction. For thework described in this paper, we performed FPA, CSA, andPSA imaging of a resolution phantom using both simulatedand experimental data from a 3-MHz, 3.2-cm, 128-elementcapacitive micromachined ultrasound transducer (CMUT)array. The simulated system point responses in the spatialand frequency domains are presented as a means of study-ing the effects of signal bandwidth, reconstruction filter size,and subsampling rate on the PSA system performance. ThePSA and FPA sector-scanned images were reconstructedusing the wideband experimental data with 80% fractionalbandwidth, with seven 32-element subarrays used for PSAimaging. The measurements on the experimental sector im-ages indicate that, at the transmit focal zone, the PSAmethod provides a 10% improvement in the 6-dB lateralresolution, and the axial point resolution of PSA imagingis identical to that of FPA imaging. The signal-to-noise ra-tio (SNR) of PSA image was 58.3 dB, 4.9 dB below thatof the FPA image, and the contrast-to-noise ratio (CNR)is reduced by 10%. The simulated and experimental testresults presented in this paper validate theoretical expecta-tions and illustrate the flexibility of PSA imaging as a wayto exchange SNR and frame rate for simplified front-endhardware.
I. Introduction
In the companion paper [1], phased subarray imagingwas presented as a method for significantly reducing
the number of costly and bulky front-end electronic chan-nels in a phased-array imaging system. Conventional full-phased array (FPA) imaging transmits and receives on alltransducer elements simultaneously to form each beam of
Manuscript received July 8, 2003; accepted August 11, 2004.J. A. Johnson, O. Oralkan, S. Ergun, U. Demirci, and B. T. Khuri-
Yakub are with Stanford University, Edward L. Ginzton Laboratory,Stanford, CA (e-mail: [email protected]).
J. A. Johnson is also with Stanford University, Image GuidanceLaboratory, Stanford, CA.
M. Karaman is with Isık University, Department of ElectronicsEngineering, Istanbul, Turkey.
a sector scan. The number of front-end electronic chan-nels required is equal to the number of transducer ele-ments. On the other extreme, classical synthetic aperture(CSA) imaging transmits and receives on only one ele-ment at a time. Phased subarray (PSA) performs consec-utive transmit and receive acquisitions on a number ofsmall subarrays that span the full array. The number offront-end electronic channels required for the PSA sys-tem is reduced to the number of elements per subarray.Due to the reduced transmit and receive aperture size, asmaller number of beams need be acquired as determinedby the Nyquist sampling criteria. The unacquired beamsare reconstructed by upsampling and interpolating witha subarray-dependent digital filter. The weighted coher-ent sum of the subarray responses equals that of an FPAsystem. Because FPA imaging uses all elements simulta-neously during both transmit and receive, we use it as thegold-standard imaging method to which we compare PSAimaging.
The remainder of the paper is organized as follows: Sec-tion II describes the methods used to acquire the exper-imental pulse-echo data, generate the simulated A-scandata, and process the data to form images. Section III de-scribes the results obtained using a narrowband and wide-band PSA reconstruction filter and compares the resultsto an FPA system. Concluding remarks are given in Sec-tion IV.
II. Methods
A. Experimental Data
The experimental setup and methods used to acquirethe raw radio frequency (RF) pulse-echo data for thiswork was reported in detail by Oralkan et al. [2]. The ex-perimental A-scans were acquired with a one-dimensional(1-D), linear, capacitive micromachined ultrasound trans-ducer array. The array consisted of 128 elements with apitch of 250 µm. Each element was 6 mm × 0.2 mm in sizeand consisted of 750 capacitive micromachined ultrasoundtransducer (CMUT) cells electrically connected in paral-lel. Custom front-end hardware was designed and built foracquiring pulse-echo data. A 40-V direct current (DC) bias
0885–3010/$20.00 c© 2005 IEEE
52 ieee transactions on ultrasonics, ferroelectrics, and frequency control, vol. 52, no. 1, january 2005
TABLE ISystem Parameters.
Parameter Experimental Simulated
Number of array elements (N) 128 128Element pitch (d) 250 µm 250 µmCenter frequency (f0) 3.0 MHz 3.0 MHz6-dB Bandwidth (narrowband) 5% 5%6-dB Bandwidth (wideband) 80% 80%Sampling frequency (fs) 50 MHz 96 MHzVelocity of sound (c) 1430 m/s 1430 m/sLocation of point reflector 13.1 cm1 13.1 cm
1Fourth wire target.
was applied to the array, and a 15-V, 100-ns unipolar pulsewas applied to generate the transmit pulse. The receivedsignals were amplified with a fixed gain of 60 dB, thensampled at 50 MHz. In general, sampling at a rate of 32times the center frequency eliminates delay quantizationerrors. Because 50 MHz represents sampling at roughly16 times the center frequency, there is a possibility thatthe delay quantization error will affect the reconstructedimages of all imaging methods. The A-scans were formedby transmitting on a single element, then receiving fromall other elements and storing the received signals indi-vidually. The weak transmit power due to transmitting ononly a single element was compensated for by recordingthe average of 100 received signals with 12-bit resolution,resulting in a 20-dB signal-to-noise ratio (SNR) gain. Inaddition, a 1–5 MHz digital bandpass filter was applied toall A-scans.
The test phantom consisted of seven parallel steel wiressubmersed in vegetable oil, which protects the array elec-tronic wiring from corrosion and mimics the acoustic prop-erties of tissue better than water [2]. The wires had a diam-eter of 0.38 mm and were uniformly spaced with a separa-tion of 2.85 cm. We analyzed the reflected signal from oneof the wire targets; the center frequency of the responsewas 3.0 MHz, with a 6-dB bandwidth of 80%, which wasnot compensated for diffraction or attenuation losses [2].The parameters for the experimental system are listed inTable I.
B. A-Scan Simulations
A computer program was written to generate A-scanssimilar to those acquired from the experimental setup, sim-ulating both the transducer array and wire phantom ge-ometries. A point reflector was located 13.1 cm (f/# = 4.1)from the array, the distance to the fourth wire target inthe experimental setup. The excitation pulse used was amodulated Gaussian. Loss due to radiation was includedin the model; attenuation and electronic noise were notincluded. As with the experimental A-scans, a 1–5 MHzdigital bandpass filter was applied. Unless otherwise men-tioned, the settings used to generate the simulated A-scansare as listed in Table I.
TABLE IIBeamformer Settings.
Parameter Narrowband Wideband
Number of FPA/CSA beams (QFPA) 185 361Number of PSA beams (QPSA) 47 91Scan angle (Θ) 90◦ 90◦
Number of subarrays (K) 7 7Number of elements per subarray (M) 32 32Upsampling rate 4 4Sampling frequency (output beams) 12 MHz 12 MHzTransmit focal depth 13.1 cm 13.1 cm
C. Beamformer
Custom RF beamforming software was written to gen-erate all images. The RF beamformer used the stan-dard delay-and-sum method to calculate the image inten-sity, and applied fixed transmit focusing and dynamic re-ceive focusing. The transmit focal distance was 13.1 cm(f/# = 4.1). The image intensity was calculated at uni-formly spaced points along each of Q beams with an out-put sampling rate of 12 MHz. The beams all radiated fromthe center of the array and were evenly spaced in sin θand spanned a sector angle of Θ. Nearest-neighbor inter-polation was used to determine which A-scan sample con-tributed to each image sample. A minimum f/# of 2 wasused for both the transmit and receive apertures, althoughall image targets used in this study are beyond this range.Unless otherwise specified, the beamformer settings usedto produce the results reported in this paper are listed inTable II.
D. Image Formation
The remaining steps used to form the ultrasound im-ages were performed using Matlab (The Mathworks, Nat-ick, MA). The beams were treated as the real part of ananalytic signal. The complex signal was generated by ap-plying the Hilbert transform [3]. For FPA and CSA imag-ing, these beams were immediately envelope detected toform the final image. The PSA imaging required addi-tional reconstruction steps prior to envelope detection, asdescribed below. Envelope detection of the beams was per-formed by calculating the magnitude of the complex ana-lytic signal. For images in r − sin θ format, the beams aredisplayed directly without scan conversion. Bilinear inter-polation was used to scan convert the experimental imagedata displayed in rectangular coordinates [4].
The details of PSA image formation and reconstruc-tion filter design were previously described [1], and thesteps taken are summarized here. Each low-resolution sub-array image was first laterally upsampled by L by insertingzero-sampled beams. To reconstruct the beams, a 1-D (fornarrowband systems) or 2-D (for wideband systems) finite-impulse response (FIR) filter was convolved with each sub-array image, producing the high-resolution subarray im-ages. The 2-D filters have Nq taps in the lateral dimension
johnson et al.: designs for filters in phased subarray systems 53
TABLE IIIPSA Imaging Parameters.
Parameter Value
PSA upsampling rate (L) 4Filter lateral width (Nq) (narrow- and
wide-band filters) 31Filter axial height (Nr) (wideband filter only) 31Window function (lateral and axial) Hamming
and Nr taps in the axial dimension. In the lateral dimen-sion, this corresponds to using the nearest eight acquiredbeams to reconstruct the others. The high-resolution sub-array images are coherently weighted and summed to formthe final PSA image. Unless otherwise specified, the PSAsystem parameters used to produce the results reported inthis paper are listed in Table III.
E. Spatial Resolution
Spatial resolution measurements were made using r −sin θ images of each wire target. Sampling rates were in-creased by 4 laterally and 10 axially, resulting in samplespacing of ∆ sin θ = 0.001 (∆θ = 0.05◦ at θ = 0◦) lat-erally and 6 µm axially. Spline interpolation was used tocalculate the spatial resolution along both axes.
F. Image Signal-to-Noise Ratio
The SNR measurements were made using experimentalimages after scan conversion. The SNR was calculated foreach of the six targets. An r− sin θ image centered aroundthe target was formed with dimensions of 45◦ laterally and2.6 cm axially. The signal power (s2) was calculated asthe square of the maximum point-spread function (PSF)magnitude, and the noise power (σ2) was calculated asthe variance of the noise in the area around the PSF. Theimage SNR then was calculated as SNR = 10 log
(s2/σ2
).
G. Contrast-to-Noise Ratio
The contrast-to-noise ratio (CNR) of an imaging sys-tem indicates how well it can distinguish regions with dif-ferent densities of scatterers. Two cysts were simulatedfor CNR measurements: one with a 4-mm diameter andthe other with an 8-mm diameter. Each was placed alongthe normal of a 120-element array at a depth of 10 cm.Point reflectors were randomly distributed with a densityof 15-points/mm2 in the region surrounding the cyst. 30◦-lateral × 2-cm-axial images were used for CNR measure-ments. The transmit focal distance was located at the cen-ter of the cyst.
The CNR was calculated from 60-dB images as CNR =|µc − µs| /σs, where µc and µs are the mean image intensi-ties of the cyst and speckle regions, respectively, and σs isthe standard deviation of the image intensity in the speckleregion [5]. For the 4-mm cyst, the central 3-mm diameterportion was used to calculate the mean, and all points
beyond a 5-mm diameter were used as the speckle region.For the 8-mm cyst, these boundaries were defined by 6-mmand 10-mm diameters.
III. Results
A. Narrowband Reconstruction
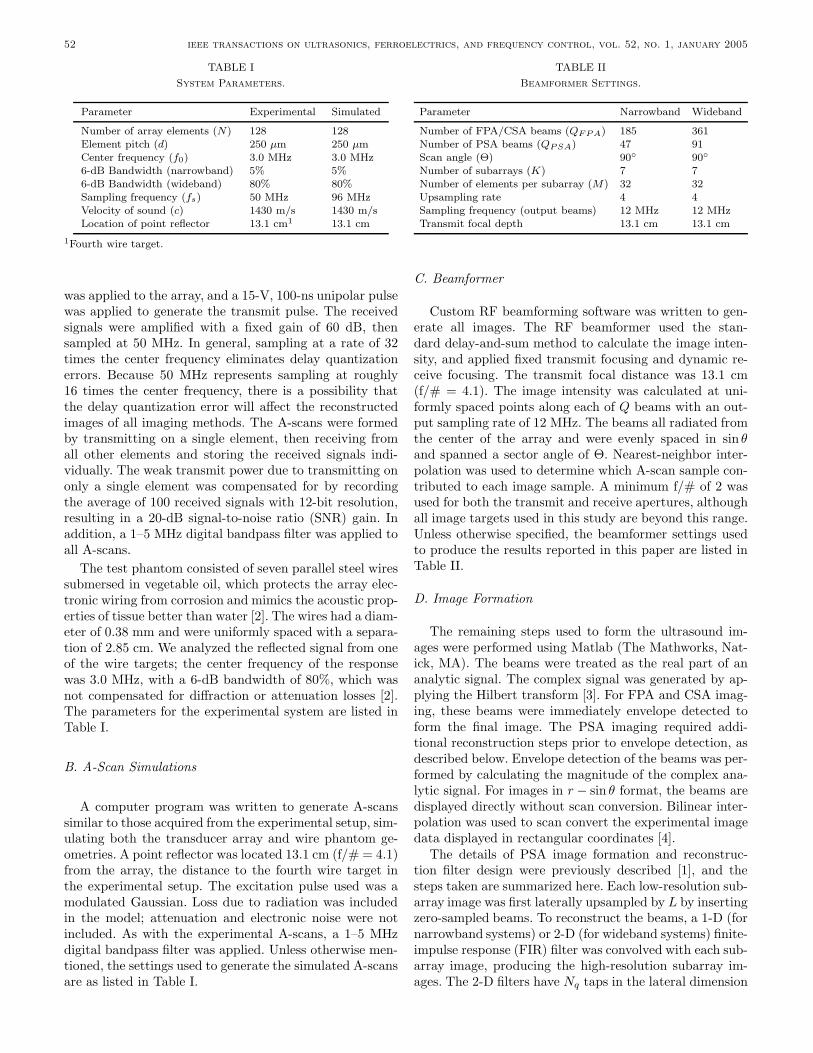
The parameters used for simulated and experimentalnarrowband images are given in Tables I, II, and III. Fig. 1outlines the cosubarray responses at each step of a simu-lated narrowband system. The response at each stage wassimilar to the theoretical response shown in Fig. 8 of [1].The cosubarray responses are given in Fig. 1(a); the co-subarrays filled the range of lateral spatial frequency, in-dicating that beamspace was critically sampled. Upsam-pling the beams in the spatial domain by four led to thedesired response and three aliases, as shown in Fig. 1(b).Due to the truncation and windowing of the reconstruc-tion filter in the spatial domain, the PSA reconstructionfilters (dashed line) had a smooth roll-off that limited theirability to perfectly suppress the aliases. Energy from ad-jacent aliases was evident in the cosubarray response afterreconstruction [Fig. 1(c)], resulting in ripples in the finalcoarray response [Fig. 1(d)]. Regardless, the final PSA re-sponse closely resembled the FPA response.
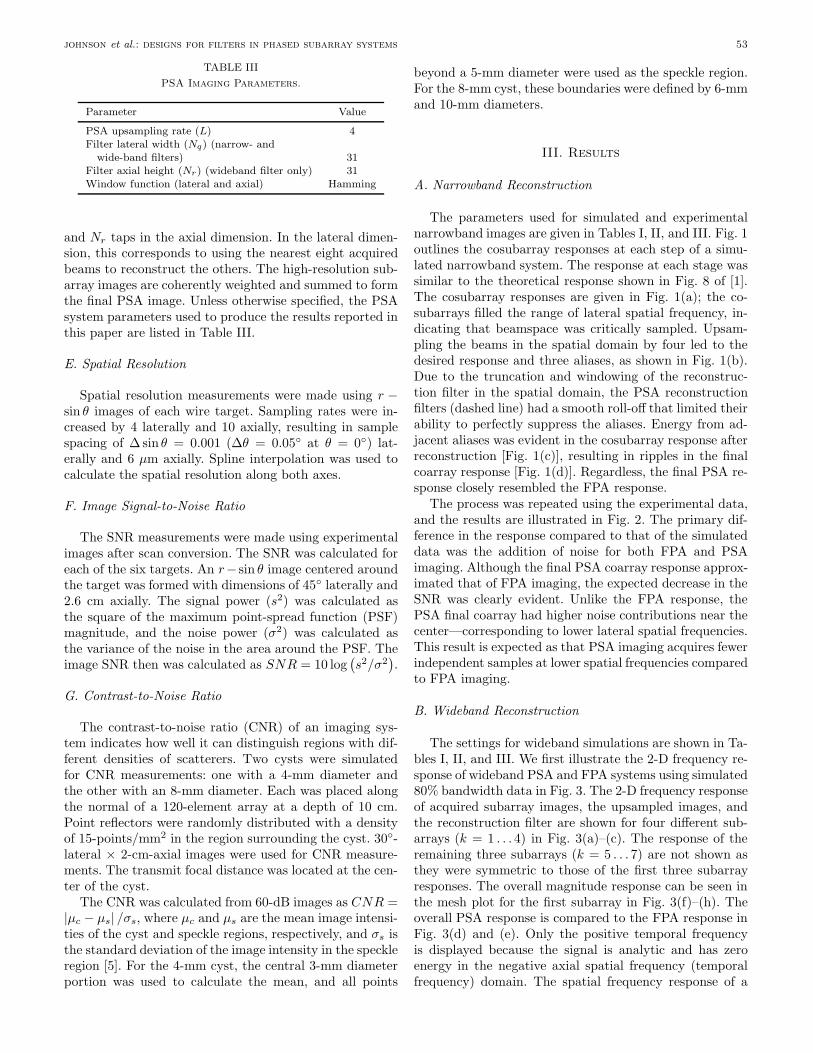
The process was repeated using the experimental data,and the results are illustrated in Fig. 2. The primary dif-ference in the response compared to that of the simulateddata was the addition of noise for both FPA and PSAimaging. Although the final PSA coarray response approx-imated that of FPA imaging, the expected decrease in theSNR was clearly evident. Unlike the FPA response, thePSA final coarray had higher noise contributions near thecenter—corresponding to lower lateral spatial frequencies.This result is expected as that PSA imaging acquires fewerindependent samples at lower spatial frequencies comparedto FPA imaging.
B. Wideband Reconstruction
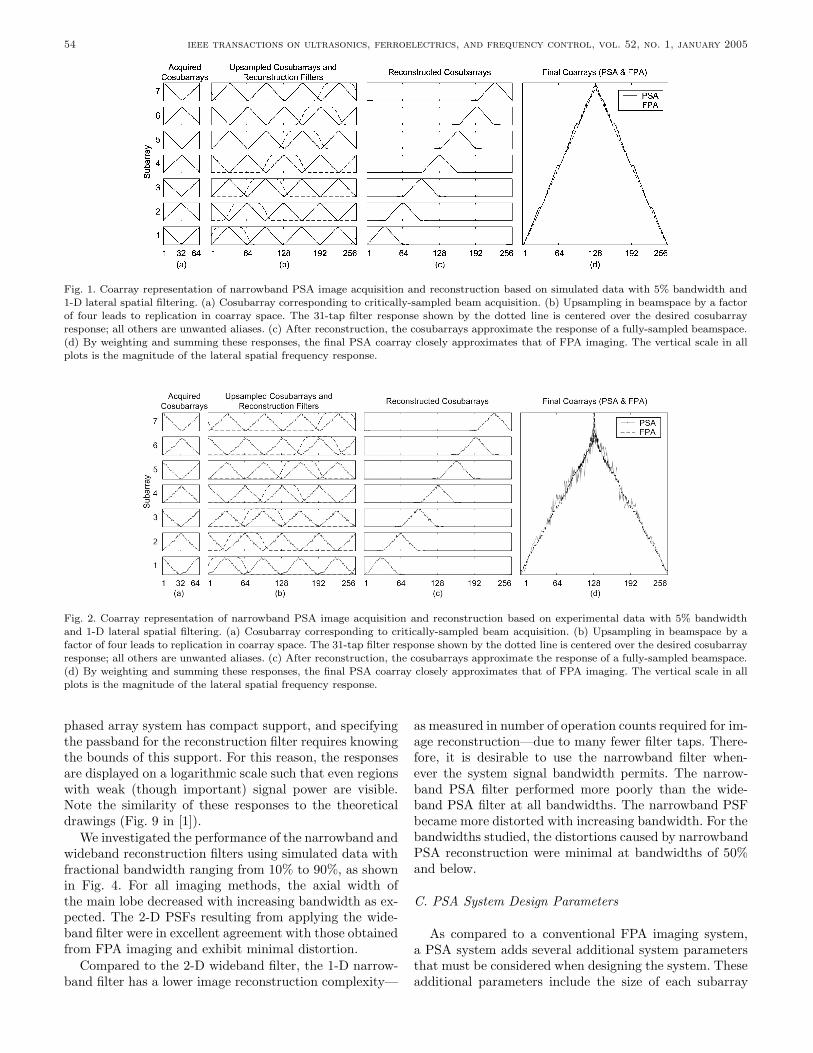
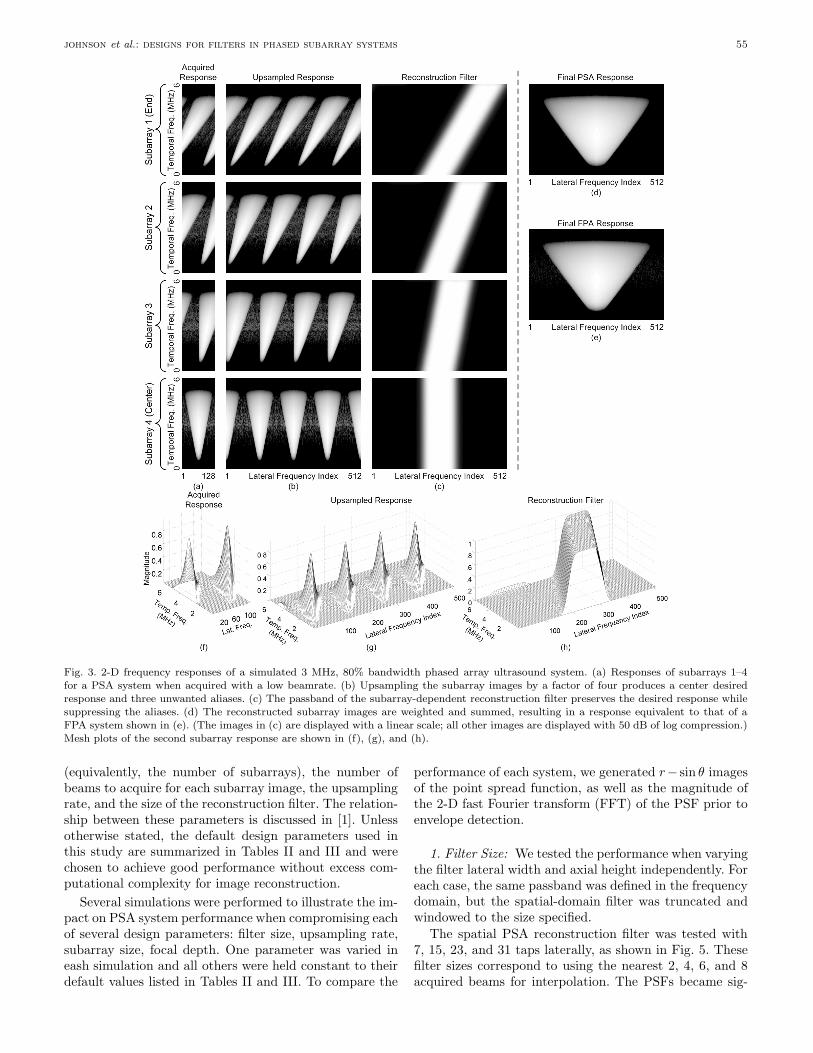
The settings for wideband simulations are shown in Ta-bles I, II, and III. We first illustrate the 2-D frequency re-sponse of wideband PSA and FPA systems using simulated80% bandwidth data in Fig. 3. The 2-D frequency responseof acquired subarray images, the upsampled images, andthe reconstruction filter are shown for four different sub-arrays (k = 1 . . . 4) in Fig. 3(a)–(c). The response of theremaining three subarrays (k = 5 . . . 7) are not shown asthey were symmetric to those of the first three subarrayresponses. The overall magnitude response can be seen inthe mesh plot for the first subarray in Fig. 3(f)–(h). Theoverall PSA response is compared to the FPA response inFig. 3(d) and (e). Only the positive temporal frequencyis displayed because the signal is analytic and has zeroenergy in the negative axial spatial frequency (temporalfrequency) domain. The spatial frequency response of a
54 ieee transactions on ultrasonics, ferroelectrics, and frequency control, vol. 52, no. 1, january 2005
Fig. 1. Coarray representation of narrowband PSA image acquisition and reconstruction based on simulated data with 5% bandwidth and1-D lateral spatial filtering. (a) Cosubarray corresponding to critically-sampled beam acquisition. (b) Upsampling in beamspace by a factorof four leads to replication in coarray space. The 31-tap filter response shown by the dotted line is centered over the desired cosubarrayresponse; all others are unwanted aliases. (c) After reconstruction, the cosubarrays approximate the response of a fully-sampled beamspace.(d) By weighting and summing these responses, the final PSA coarray closely approximates that of FPA imaging. The vertical scale in allplots is the magnitude of the lateral spatial frequency response.
Fig. 2. Coarray representation of narrowband PSA image acquisition and reconstruction based on experimental data with 5% bandwidthand 1-D lateral spatial filtering. (a) Cosubarray corresponding to critically-sampled beam acquisition. (b) Upsampling in beamspace by afactor of four leads to replication in coarray space. The 31-tap filter response shown by the dotted line is centered over the desired cosubarrayresponse; all others are unwanted aliases. (c) After reconstruction, the cosubarrays approximate the response of a fully-sampled beamspace.(d) By weighting and summing these responses, the final PSA coarray closely approximates that of FPA imaging. The vertical scale in allplots is the magnitude of the lateral spatial frequency response.
phased array system has compact support, and specifyingthe passband for the reconstruction filter requires knowingthe bounds of this support. For this reason, the responsesare displayed on a logarithmic scale such that even regionswith weak (though important) signal power are visible.Note the similarity of these responses to the theoreticaldrawings (Fig. 9 in [1]).
We investigated the performance of the narrowband andwideband reconstruction filters using simulated data withfractional bandwidth ranging from 10% to 90%, as shownin Fig. 4. For all imaging methods, the axial width ofthe main lobe decreased with increasing bandwidth as ex-pected. The 2-D PSFs resulting from applying the wide-band filter were in excellent agreement with those obtainedfrom FPA imaging and exhibit minimal distortion.
Compared to the 2-D wideband filter, the 1-D narrow-band filter has a lower image reconstruction complexity—
as measured in number of operation counts required for im-age reconstruction—due to many fewer filter taps. There-fore, it is desirable to use the narrowband filter when-ever the system signal bandwidth permits. The narrow-band PSA filter performed more poorly than the wide-band PSA filter at all bandwidths. The narrowband PSFbecame more distorted with increasing bandwidth. For thebandwidths studied, the distortions caused by narrowbandPSA reconstruction were minimal at bandwidths of 50%and below.
C. PSA System Design Parameters
As compared to a conventional FPA imaging system,a PSA system adds several additional system parametersthat must be considered when designing the system. Theseadditional parameters include the size of each subarray
johnson et al.: designs for filters in phased subarray systems 55
Fig. 3. 2-D frequency responses of a simulated 3 MHz, 80% bandwidth phased array ultrasound system. (a) Responses of subarrays 1–4for a PSA system when acquired with a low beamrate. (b) Upsampling the subarray images by a factor of four produces a center desiredresponse and three unwanted aliases. (c) The passband of the subarray-dependent reconstruction filter preserves the desired response whilesuppressing the aliases. (d) The reconstructed subarray images are weighted and summed, resulting in a response equivalent to that of aFPA system shown in (e). (The images in (c) are displayed with a linear scale; all other images are displayed with 50 dB of log compression.)Mesh plots of the second subarray response are shown in (f), (g), and (h).
(equivalently, the number of subarrays), the number ofbeams to acquire for each subarray image, the upsamplingrate, and the size of the reconstruction filter. The relation-ship between these parameters is discussed in [1]. Unlessotherwise stated, the default design parameters used inthis study are summarized in Tables II and III and werechosen to achieve good performance without excess com-putational complexity for image reconstruction.
Several simulations were performed to illustrate the im-pact on PSA system performance when compromising eachof several design parameters: filter size, upsampling rate,subarray size, focal depth. One parameter was varied ineash simulation and all others were held constant to theirdefault values listed in Tables II and III. To compare the
performance of each system, we generated r− sin θ imagesof the point spread function, as well as the magnitude ofthe 2-D fast Fourier transform (FFT) of the PSF prior toenvelope detection.
1. Filter Size: We tested the performance when varyingthe filter lateral width and axial height independently. Foreach case, the same passband was defined in the frequencydomain, but the spatial-domain filter was truncated andwindowed to the size specified.
The spatial PSA reconstruction filter was tested with7, 15, 23, and 31 taps laterally, as shown in Fig. 5. Thesefilter sizes correspond to using the nearest 2, 4, 6, and 8acquired beams for interpolation. The PSFs became sig-
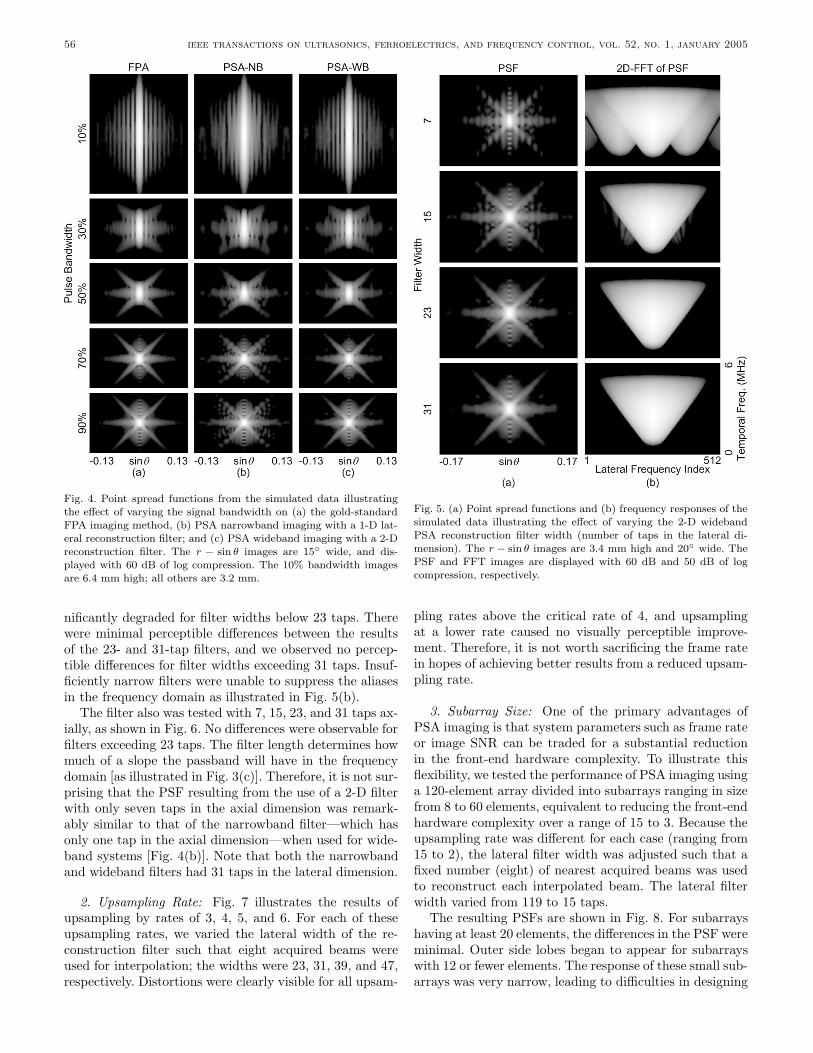
56 ieee transactions on ultrasonics, ferroelectrics, and frequency control, vol. 52, no. 1, january 2005
Fig. 4. Point spread functions from the simulated data illustratingthe effect of varying the signal bandwidth on (a) the gold-standardFPA imaging method, (b) PSA narrowband imaging with a 1-D lat-eral reconstruction filter; and (c) PSA wideband imaging with a 2-Dreconstruction filter. The r − sin θ images are 15◦ wide, and dis-played with 60 dB of log compression. The 10% bandwidth imagesare 6.4 mm high; all others are 3.2 mm.
nificantly degraded for filter widths below 23 taps. Therewere minimal perceptible differences between the resultsof the 23- and 31-tap filters, and we observed no percep-tible differences for filter widths exceeding 31 taps. Insuf-ficiently narrow filters were unable to suppress the aliasesin the frequency domain as illustrated in Fig. 5(b).
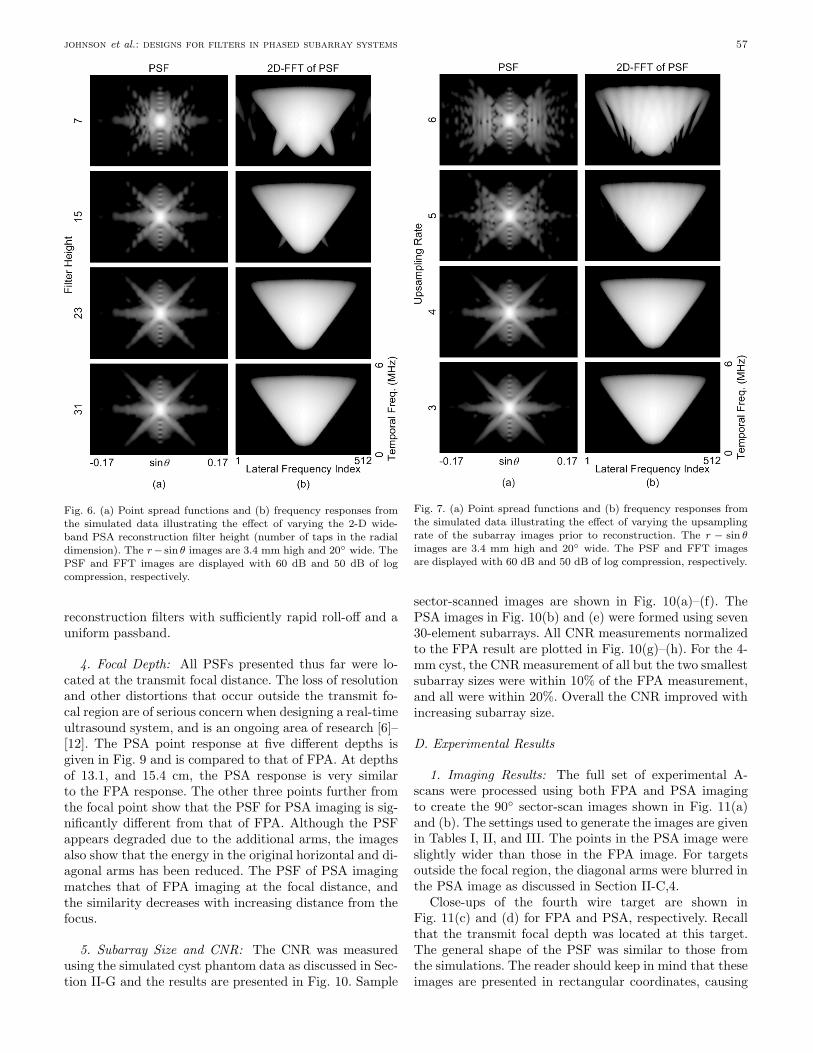
The filter also was tested with 7, 15, 23, and 31 taps ax-ially, as shown in Fig. 6. No differences were observable forfilters exceeding 23 taps. The filter length determines howmuch of a slope the passband will have in the frequencydomain [as illustrated in Fig. 3(c)]. Therefore, it is not sur-prising that the PSF resulting from the use of a 2-D filterwith only seven taps in the axial dimension was remark-ably similar to that of the narrowband filter—which hasonly one tap in the axial dimension—when used for wide-band systems [Fig. 4(b)]. Note that both the narrowbandand wideband filters had 31 taps in the lateral dimension.
2. Upsampling Rate: Fig. 7 illustrates the results ofupsampling by rates of 3, 4, 5, and 6. For each of theseupsampling rates, we varied the lateral width of the re-construction filter such that eight acquired beams wereused for interpolation; the widths were 23, 31, 39, and 47,respectively. Distortions were clearly visible for all upsam-
Fig. 5. (a) Point spread functions and (b) frequency responses of thesimulated data illustrating the effect of varying the 2-D widebandPSA reconstruction filter width (number of taps in the lateral di-mension). The r − sin θ images are 3.4 mm high and 20◦ wide. ThePSF and FFT images are displayed with 60 dB and 50 dB of logcompression, respectively.
pling rates above the critical rate of 4, and upsamplingat a lower rate caused no visually perceptible improve-ment. Therefore, it is not worth sacrificing the frame ratein hopes of achieving better results from a reduced upsam-pling rate.
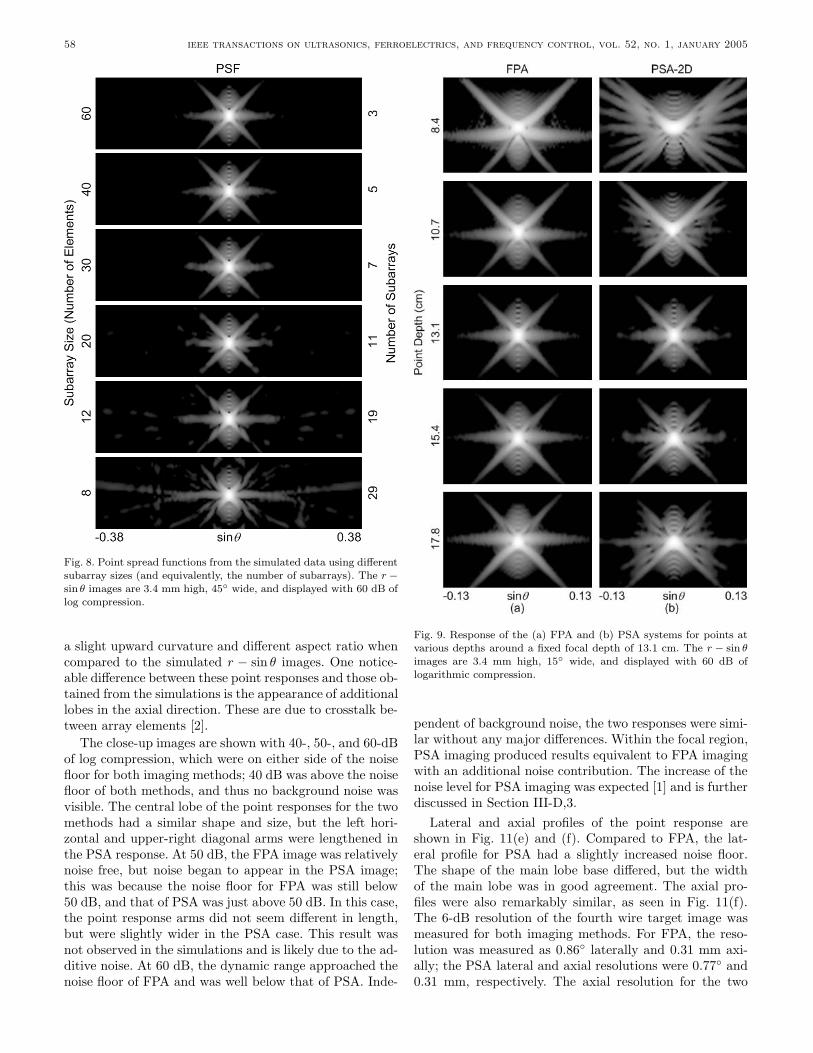
3. Subarray Size: One of the primary advantages ofPSA imaging is that system parameters such as frame rateor image SNR can be traded for a substantial reductionin the front-end hardware complexity. To illustrate thisflexibility, we tested the performance of PSA imaging usinga 120-element array divided into subarrays ranging in sizefrom 8 to 60 elements, equivalent to reducing the front-endhardware complexity over a range of 15 to 3. Because theupsampling rate was different for each case (ranging from15 to 2), the lateral filter width was adjusted such that afixed number (eight) of nearest acquired beams was usedto reconstruct each interpolated beam. The lateral filterwidth varied from 119 to 15 taps.
The resulting PSFs are shown in Fig. 8. For subarrayshaving at least 20 elements, the differences in the PSF wereminimal. Outer side lobes began to appear for subarrayswith 12 or fewer elements. The response of these small sub-arrays was very narrow, leading to difficulties in designing
johnson et al.: designs for filters in phased subarray systems 57
Fig. 6. (a) Point spread functions and (b) frequency responses fromthe simulated data illustrating the effect of varying the 2-D wide-band PSA reconstruction filter height (number of taps in the radialdimension). The r− sin θ images are 3.4 mm high and 20◦ wide. ThePSF and FFT images are displayed with 60 dB and 50 dB of logcompression, respectively.
reconstruction filters with sufficiently rapid roll-off and auniform passband.
4. Focal Depth: All PSFs presented thus far were lo-cated at the transmit focal distance. The loss of resolutionand other distortions that occur outside the transmit fo-cal region are of serious concern when designing a real-timeultrasound system, and is an ongoing area of research [6]–[12]. The PSA point response at five different depths isgiven in Fig. 9 and is compared to that of FPA. At depthsof 13.1, and 15.4 cm, the PSA response is very similarto the FPA response. The other three points further fromthe focal point show that the PSF for PSA imaging is sig-nificantly different from that of FPA. Although the PSFappears degraded due to the additional arms, the imagesalso show that the energy in the original horizontal and di-agonal arms has been reduced. The PSF of PSA imagingmatches that of FPA imaging at the focal distance, andthe similarity decreases with increasing distance from thefocus.
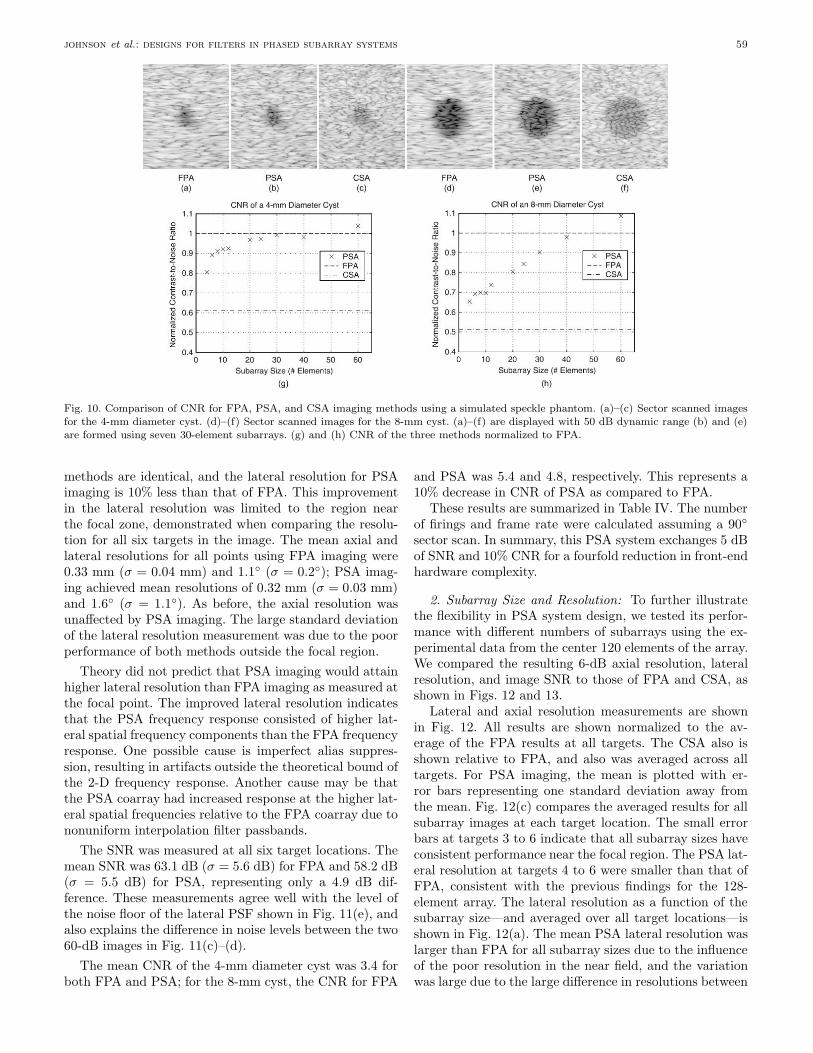
5. Subarray Size and CNR: The CNR was measuredusing the simulated cyst phantom data as discussed in Sec-tion II-G and the results are presented in Fig. 10. Sample
Fig. 7. (a) Point spread functions and (b) frequency responses fromthe simulated data illustrating the effect of varying the upsamplingrate of the subarray images prior to reconstruction. The r − sin θimages are 3.4 mm high and 20◦ wide. The PSF and FFT imagesare displayed with 60 dB and 50 dB of log compression, respectively.
sector-scanned images are shown in Fig. 10(a)–(f). ThePSA images in Fig. 10(b) and (e) were formed using seven30-element subarrays. All CNR measurements normalizedto the FPA result are plotted in Fig. 10(g)–(h). For the 4-mm cyst, the CNR measurement of all but the two smallestsubarray sizes were within 10% of the FPA measurement,and all were within 20%. Overall the CNR improved withincreasing subarray size.
D. Experimental Results
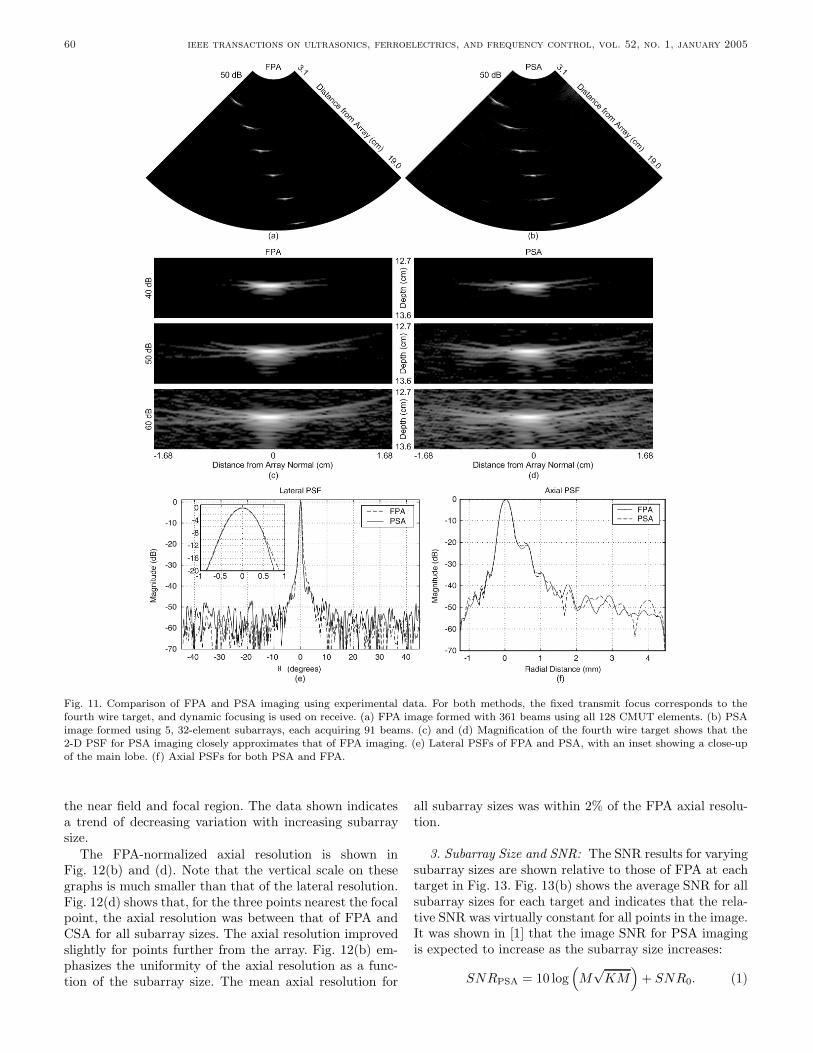
1. Imaging Results: The full set of experimental A-scans were processed using both FPA and PSA imagingto create the 90◦ sector-scan images shown in Fig. 11(a)and (b). The settings used to generate the images are givenin Tables I, II, and III. The points in the PSA image wereslightly wider than those in the FPA image. For targetsoutside the focal region, the diagonal arms were blurred inthe PSA image as discussed in Section II-C,4.
Close-ups of the fourth wire target are shown inFig. 11(c) and (d) for FPA and PSA, respectively. Recallthat the transmit focal depth was located at this target.The general shape of the PSF was similar to those fromthe simulations. The reader should keep in mind that theseimages are presented in rectangular coordinates, causing
58 ieee transactions on ultrasonics, ferroelectrics, and frequency control, vol. 52, no. 1, january 2005
Fig. 8. Point spread functions from the simulated data using differentsubarray sizes (and equivalently, the number of subarrays). The r −sin θ images are 3.4 mm high, 45◦ wide, and displayed with 60 dB oflog compression.
a slight upward curvature and different aspect ratio whencompared to the simulated r − sin θ images. One notice-able difference between these point responses and those ob-tained from the simulations is the appearance of additionallobes in the axial direction. These are due to crosstalk be-tween array elements [2].
The close-up images are shown with 40-, 50-, and 60-dBof log compression, which were on either side of the noisefloor for both imaging methods; 40 dB was above the noisefloor of both methods, and thus no background noise wasvisible. The central lobe of the point responses for the twomethods had a similar shape and size, but the left hori-zontal and upper-right diagonal arms were lengthened inthe PSA response. At 50 dB, the FPA image was relativelynoise free, but noise began to appear in the PSA image;this was because the noise floor for FPA was still below50 dB, and that of PSA was just above 50 dB. In this case,the point response arms did not seem different in length,but were slightly wider in the PSA case. This result wasnot observed in the simulations and is likely due to the ad-ditive noise. At 60 dB, the dynamic range approached thenoise floor of FPA and was well below that of PSA. Inde-
Fig. 9. Response of the (a) FPA and (b) PSA systems for points atvarious depths around a fixed focal depth of 13.1 cm. The r − sin θimages are 3.4 mm high, 15◦ wide, and displayed with 60 dB oflogarithmic compression.
pendent of background noise, the two responses were simi-lar without any major differences. Within the focal region,PSA imaging produced results equivalent to FPA imagingwith an additional noise contribution. The increase of thenoise level for PSA imaging was expected [1] and is furtherdiscussed in Section III-D,3.
Lateral and axial profiles of the point response areshown in Fig. 11(e) and (f). Compared to FPA, the lat-eral profile for PSA had a slightly increased noise floor.The shape of the main lobe base differed, but the widthof the main lobe was in good agreement. The axial pro-files were also remarkably similar, as seen in Fig. 11(f).The 6-dB resolution of the fourth wire target image wasmeasured for both imaging methods. For FPA, the reso-lution was measured as 0.86◦ laterally and 0.31 mm axi-ally; the PSA lateral and axial resolutions were 0.77◦ and0.31 mm, respectively. The axial resolution for the two
johnson et al.: designs for filters in phased subarray systems 59
Fig. 10. Comparison of CNR for FPA, PSA, and CSA imaging methods using a simulated speckle phantom. (a)–(c) Sector scanned imagesfor the 4-mm diameter cyst. (d)–(f) Sector scanned images for the 8-mm cyst. (a)–(f) are displayed with 50 dB dynamic range (b) and (e)are formed using seven 30-element subarrays. (g) and (h) CNR of the three methods normalized to FPA.
methods are identical, and the lateral resolution for PSAimaging is 10% less than that of FPA. This improvementin the lateral resolution was limited to the region nearthe focal zone, demonstrated when comparing the resolu-tion for all six targets in the image. The mean axial andlateral resolutions for all points using FPA imaging were0.33 mm (σ = 0.04 mm) and 1.1◦ (σ = 0.2◦); PSA imag-ing achieved mean resolutions of 0.32 mm (σ = 0.03 mm)and 1.6◦ (σ = 1.1◦). As before, the axial resolution wasunaffected by PSA imaging. The large standard deviationof the lateral resolution measurement was due to the poorperformance of both methods outside the focal region.
Theory did not predict that PSA imaging would attainhigher lateral resolution than FPA imaging as measured atthe focal point. The improved lateral resolution indicatesthat the PSA frequency response consisted of higher lat-eral spatial frequency components than the FPA frequencyresponse. One possible cause is imperfect alias suppres-sion, resulting in artifacts outside the theoretical bound ofthe 2-D frequency response. Another cause may be thatthe PSA coarray had increased response at the higher lat-eral spatial frequencies relative to the FPA coarray due tononuniform interpolation filter passbands.
The SNR was measured at all six target locations. Themean SNR was 63.1 dB (σ = 5.6 dB) for FPA and 58.2 dB(σ = 5.5 dB) for PSA, representing only a 4.9 dB dif-ference. These measurements agree well with the level ofthe noise floor of the lateral PSF shown in Fig. 11(e), andalso explains the difference in noise levels between the two60-dB images in Fig. 11(c)–(d).
The mean CNR of the 4-mm diameter cyst was 3.4 forboth FPA and PSA; for the 8-mm cyst, the CNR for FPA
and PSA was 5.4 and 4.8, respectively. This represents a10% decrease in CNR of PSA as compared to FPA.
These results are summarized in Table IV. The numberof firings and frame rate were calculated assuming a 90◦
sector scan. In summary, this PSA system exchanges 5 dBof SNR and 10% CNR for a fourfold reduction in front-endhardware complexity.
2. Subarray Size and Resolution: To further illustratethe flexibility in PSA system design, we tested its perfor-mance with different numbers of subarrays using the ex-perimental data from the center 120 elements of the array.We compared the resulting 6-dB axial resolution, lateralresolution, and image SNR to those of FPA and CSA, asshown in Figs. 12 and 13.
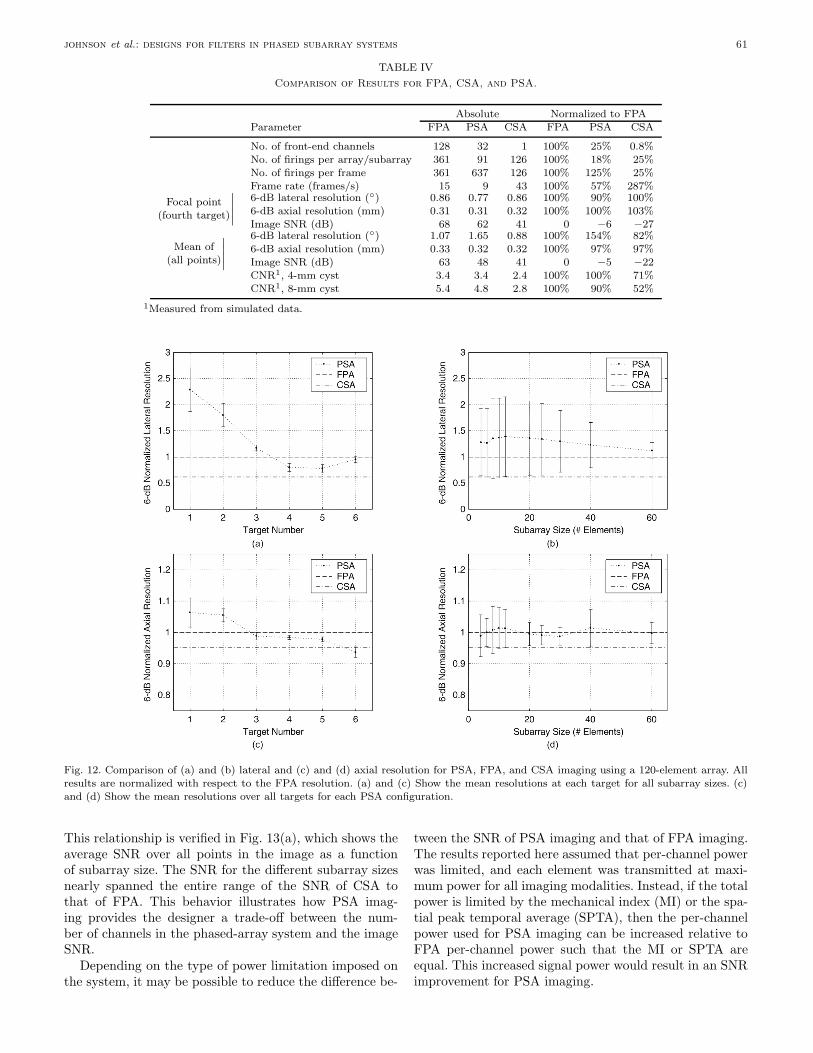
Lateral and axial resolution measurements are shownin Fig. 12. All results are shown normalized to the av-erage of the FPA results at all targets. The CSA also isshown relative to FPA, and also was averaged across alltargets. For PSA imaging, the mean is plotted with er-ror bars representing one standard deviation away fromthe mean. Fig. 12(c) compares the averaged results for allsubarray images at each target location. The small errorbars at targets 3 to 6 indicate that all subarray sizes haveconsistent performance near the focal region. The PSA lat-eral resolution at targets 4 to 6 were smaller than that ofFPA, consistent with the previous findings for the 128-element array. The lateral resolution as a function of thesubarray size—and averaged over all target locations—isshown in Fig. 12(a). The mean PSA lateral resolution waslarger than FPA for all subarray sizes due to the influenceof the poor resolution in the near field, and the variationwas large due to the large difference in resolutions between
60 ieee transactions on ultrasonics, ferroelectrics, and frequency control, vol. 52, no. 1, january 2005
Fig. 11. Comparison of FPA and PSA imaging using experimental data. For both methods, the fixed transmit focus corresponds to thefourth wire target, and dynamic focusing is used on receive. (a) FPA image formed with 361 beams using all 128 CMUT elements. (b) PSAimage formed using 5, 32-element subarrays, each acquiring 91 beams. (c) and (d) Magnification of the fourth wire target shows that the2-D PSF for PSA imaging closely approximates that of FPA imaging. (e) Lateral PSFs of FPA and PSA, with an inset showing a close-upof the main lobe. (f) Axial PSFs for both PSA and FPA.
the near field and focal region. The data shown indicatesa trend of decreasing variation with increasing subarraysize.
The FPA-normalized axial resolution is shown inFig. 12(b) and (d). Note that the vertical scale on thesegraphs is much smaller than that of the lateral resolution.Fig. 12(d) shows that, for the three points nearest the focalpoint, the axial resolution was between that of FPA andCSA for all subarray sizes. The axial resolution improvedslightly for points further from the array. Fig. 12(b) em-phasizes the uniformity of the axial resolution as a func-tion of the subarray size. The mean axial resolution for
all subarray sizes was within 2% of the FPA axial resolu-tion.
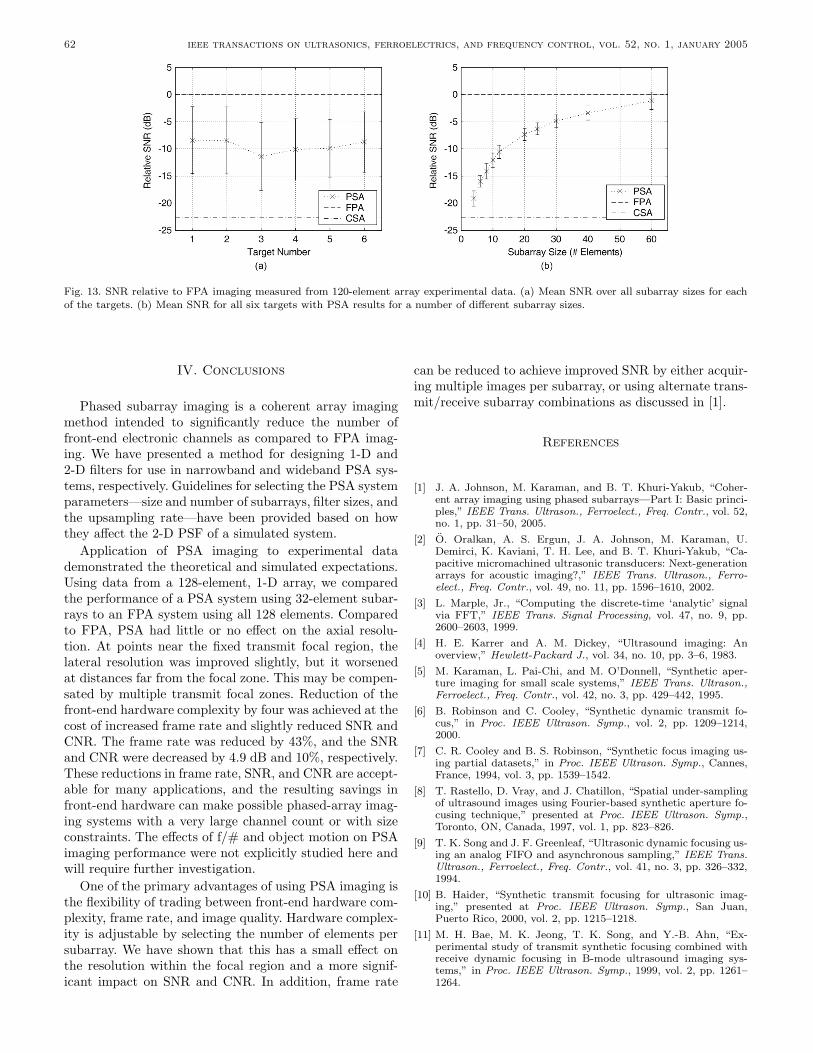
3. Subarray Size and SNR: The SNR results for varyingsubarray sizes are shown relative to those of FPA at eachtarget in Fig. 13. Fig. 13(b) shows the average SNR for allsubarray sizes for each target and indicates that the rela-tive SNR was virtually constant for all points in the image.It was shown in [1] that the image SNR for PSA imagingis expected to increase as the subarray size increases:
SNRPSA = 10 log(M
√KM
)+ SNR0. (1)
johnson et al.: designs for filters in phased subarray systems 61
TABLE IVComparison of Results for FPA, CSA, and PSA.
Absolute Normalized to FPAParameter FPA PSA CSA FPA PSA CSA
No. of front-end channels 128 32 1 100% 25% 0.8%No. of firings per array/subarray 361 91 126 100% 18% 25%No. of firings per frame 361 637 126 100% 125% 25%Frame rate (frames/s) 15 9 43 100% 57% 287%
Focal point(fourth target)
∣∣∣∣6-dB lateral resolution (◦) 0.86 0.77 0.86 100% 90% 100%6-dB axial resolution (mm) 0.31 0.31 0.32 100% 100% 103%Image SNR (dB) 68 62 41 0 −6 −27
Mean of(all points)
∣∣∣∣6-dB lateral resolution (◦) 1.07 1.65 0.88 100% 154% 82%6-dB axial resolution (mm) 0.33 0.32 0.32 100% 97% 97%Image SNR (dB) 63 48 41 0 −5 −22CNR1, 4-mm cyst 3.4 3.4 2.4 100% 100% 71%CNR1, 8-mm cyst 5.4 4.8 2.8 100% 90% 52%
1Measured from simulated data.
Fig. 12. Comparison of (a) and (b) lateral and (c) and (d) axial resolution for PSA, FPA, and CSA imaging using a 120-element array. Allresults are normalized with respect to the FPA resolution. (a) and (c) Show the mean resolutions at each target for all subarray sizes. (c)and (d) Show the mean resolutions over all targets for each PSA configuration.
This relationship is verified in Fig. 13(a), which shows theaverage SNR over all points in the image as a functionof subarray size. The SNR for the different subarray sizesnearly spanned the entire range of the SNR of CSA tothat of FPA. This behavior illustrates how PSA imag-ing provides the designer a trade-off between the num-ber of channels in the phased-array system and the imageSNR.
Depending on the type of power limitation imposed onthe system, it may be possible to reduce the difference be-
tween the SNR of PSA imaging and that of FPA imaging.The results reported here assumed that per-channel powerwas limited, and each element was transmitted at maxi-mum power for all imaging modalities. Instead, if the totalpower is limited by the mechanical index (MI) or the spa-tial peak temporal average (SPTA), then the per-channelpower used for PSA imaging can be increased relative toFPA per-channel power such that the MI or SPTA areequal. This increased signal power would result in an SNRimprovement for PSA imaging.
62 ieee transactions on ultrasonics, ferroelectrics, and frequency control, vol. 52, no. 1, january 2005
Fig. 13. SNR relative to FPA imaging measured from 120-element array experimental data. (a) Mean SNR over all subarray sizes for eachof the targets. (b) Mean SNR for all six targets with PSA results for a number of different subarray sizes.
IV. Conclusions
Phased subarray imaging is a coherent array imagingmethod intended to significantly reduce the number offront-end electronic channels as compared to FPA imag-ing. We have presented a method for designing 1-D and2-D filters for use in narrowband and wideband PSA sys-tems, respectively. Guidelines for selecting the PSA systemparameters—size and number of subarrays, filter sizes, andthe upsampling rate—have been provided based on howthey affect the 2-D PSF of a simulated system.
Application of PSA imaging to experimental datademonstrated the theoretical and simulated expectations.Using data from a 128-element, 1-D array, we comparedthe performance of a PSA system using 32-element subar-rays to an FPA system using all 128 elements. Comparedto FPA, PSA had little or no effect on the axial resolu-tion. At points near the fixed transmit focal region, thelateral resolution was improved slightly, but it worsenedat distances far from the focal zone. This may be compen-sated by multiple transmit focal zones. Reduction of thefront-end hardware complexity by four was achieved at thecost of increased frame rate and slightly reduced SNR andCNR. The frame rate was reduced by 43%, and the SNRand CNR were decreased by 4.9 dB and 10%, respectively.These reductions in frame rate, SNR, and CNR are accept-able for many applications, and the resulting savings infront-end hardware can make possible phased-array imag-ing systems with a very large channel count or with sizeconstraints. The effects of f/# and object motion on PSAimaging performance were not explicitly studied here andwill require further investigation.
One of the primary advantages of using PSA imaging isthe flexibility of trading between front-end hardware com-plexity, frame rate, and image quality. Hardware complex-ity is adjustable by selecting the number of elements persubarray. We have shown that this has a small effect onthe resolution within the focal region and a more signif-icant impact on SNR and CNR. In addition, frame rate
can be reduced to achieve improved SNR by either acquir-ing multiple images per subarray, or using alternate trans-mit/receive subarray combinations as discussed in [1].
References
[1] J. A. Johnson, M. Karaman, and B. T. Khuri-Yakub, “Coher-ent array imaging using phased subarrays—Part I: Basic princi-ples,” IEEE Trans. Ultrason., Ferroelect., Freq. Contr., vol. 52,no. 1, pp. 31–50, 2005.
[2] O. Oralkan, A. S. Ergun, J. A. Johnson, M. Karaman, U.Demirci, K. Kaviani, T. H. Lee, and B. T. Khuri-Yakub, “Ca-pacitive micromachined ultrasonic transducers: Next-generationarrays for acoustic imaging?,” IEEE Trans. Ultrason., Ferro-elect., Freq. Contr., vol. 49, no. 11, pp. 1596–1610, 2002.
[3] L. Marple, Jr., “Computing the discrete-time ‘analytic’ signalvia FFT,” IEEE Trans. Signal Processing, vol. 47, no. 9, pp.2600–2603, 1999.
[4] H. E. Karrer and A. M. Dickey, “Ultrasound imaging: Anoverview,” Hewlett-Packard J., vol. 34, no. 10, pp. 3–6, 1983.
[5] M. Karaman, L. Pai-Chi, and M. O’Donnell, “Synthetic aper-ture imaging for small scale systems,” IEEE Trans. Ultrason.,Ferroelect., Freq. Contr., vol. 42, no. 3, pp. 429–442, 1995.
[6] B. Robinson and C. Cooley, “Synthetic dynamic transmit fo-cus,” in Proc. IEEE Ultrason. Symp., vol. 2, pp. 1209–1214,2000.
[7] C. R. Cooley and B. S. Robinson, “Synthetic focus imaging us-ing partial datasets,” in Proc. IEEE Ultrason. Symp., Cannes,France, 1994, vol. 3, pp. 1539–1542.
[8] T. Rastello, D. Vray, and J. Chatillon, “Spatial under-samplingof ultrasound images using Fourier-based synthetic aperture fo-cusing technique,” presented at Proc. IEEE Ultrason. Symp.,Toronto, ON, Canada, 1997, vol. 1, pp. 823–826.
[9] T. K. Song and J. F. Greenleaf, “Ultrasonic dynamic focusing us-ing an analog FIFO and asynchronous sampling,” IEEE Trans.Ultrason., Ferroelect., Freq. Contr., vol. 41, no. 3, pp. 326–332,1994.
[10] B. Haider, “Synthetic transmit focusing for ultrasonic imag-ing,” presented at Proc. IEEE Ultrason. Symp., San Juan,Puerto Rico, 2000, vol. 2, pp. 1215–1218.
[11] M. H. Bae, M. K. Jeong, T. K. Song, and Y.-B. Ahn, “Ex-perimental study of transmit synthetic focusing combined withreceive dynamic focusing in B-mode ultrasound imaging sys-tems,” in Proc. IEEE Ultrason. Symp., 1999, vol. 2, pp. 1261–1264.
johnson et al.: designs for filters in phased subarray systems 63
[12] S. Freeman, L. Pai-Chi, and M. O’Donnell, “Retrospective dy-namic transmit focusing,” Ultrason. Imag., vol. 17, no. 3, pp.173–196, 1995.
Jeremy A. Johnson (S’92) received his B.S.in electrical engineering and a minor in math-ematics with honors from Walla Walla Col-lege, College Place, Washington, in 1997. Hereceived his M.S. and Ph.D. in 1999 and 2003,respectively, in electrical engineering fromStanford University, Stanford, California. Hecompleted the Biodesign Innovation Fellow-ship at Stanford University in 2004. Jeremy isa Senior R&D Engineer at Medtronic Vascu-lar, Santa Rosa, CA.
He has several summers of industry experi-ence. He worked as a software engineer at Interactive Northwest, Inc.,Tualatin, OR, during the summer of 1995; worked as an ASIC designengineer at Intel, Inc., Hillsboro, OR, during the summers of 1996and 1997; performed research in color science at Sony Research Lab-oratories, San Jose, CA, during the summer of 1998; performed re-search in computer vision at Hughes Research Laboratories, Malibu,CA, during the summer of 1999; and developed an endoscopic cali-bration routine for image-enhanced endoscopy at Cbyon, Inc., PaloAlto, CA, during the summer of 2000. His research interests includemedical imaging, computer-aided diagnosis, and surgical navigationsystems.
Omer Oralkan (S’93) was born in Izmit,Turkey, in 1973. He received the B.S. degreefrom Bilkent University, Ankara, Turkey, in1995, and the M.S. degree from Clemson Uni-versity, Clemson, SC, in 1997, and a Ph.D. de-gree from Stanford University, Stanford, CA,in 2004, all in electrical engineering.
From 1995 to 1996, he was a hardware andnetwork engineer at Bilkent University Com-puter Center, Ankara, Turkey. In the summerof 1997, he worked as a process engineer atthe National Semiconductor Research Labo-
ratories, Santa Clara, CA. Currently, he is an engineering researchassociate at the Edward L. Ginzton Laboratory at Stanford Univer-sity, Stanford, CA. His past and present research interests includeanalog and digital circuit design, micromachined sensors and actua-tors, and semiconductor device physics and fabrication. His currentresearch focuses on the design and implementation of integrated ul-trasonic imaging systems.
He is a corecipient of the Best Paper award presented at theIEEE International Symposium on the Physical and Failure Analy-sis (IPFA). He also received the 2002 Outstanding Paper Award ofthe IEEE Ultrasonics, Ferroelectrics, and Frequency Control Society.Dr. Oralkan is a member of the IEEE.
A. Sanlı Ergun (S’96–A’98–M’99) was bornin Ankara, Turkey, in 1969. He received hisB.Sc., M.Sc., and Ph.D. degrees in 1991, 1994,and 1999, respectively, all in electrical andelectronics engineering, from Bilkent Univer-sity, Ankara, Turkey.
He was a research assistant in Bilkent Uni-versity, Ankara, Turkey, between 1991 and1999. He now is in the E. L. Ginzton Labo-ratory, Stanford University, Stanford, CA, asan engineering research associate. His researchinterests are microwave electronics, ultrason-
ics, microelectricalmechanical systems (MEMS), and specifically ca-pacitive micromachined ultrasound transducers (CMUTs). He is amember of the IEEE and the Electron Devices Society.
Utkan Demirci (S’01) received his B.S. de-gree from the University of Michigan, Ann Ar-bor, in 1999 with Summa Cum Laude, sup-ported by the Full Presidential Scholarshipfrom Turkish Ministry of Education, and theM.S. degree from Stanford University, Stan-ford, CA, in 2001, both in electrical engineer-ing. He currently is pursuing a Ph.D. degreein electrical engineering from Stanford Uni-versity.
His research interests are design of 1-Dand 2-D capacitive micromachined ultrasound
transducer (CMUT) arrays for medical ultrasound imaging, and mi-cromachined flextensional transducers for high resolution printingand ejection applications.
Mustafa Karaman (S’88–S’89–M’89–M’93–M’97) was born in Balıkesir, Turkey, in 1964.He received the B.Sc. degree from the MiddleEast Technical University, Ankara, Turkey,and the M.Sc. and Ph.D. degrees from BilkentUniversity, Ankara, Turkey, in 1986, 1988, and1992, respectively, all in electrical and elec-tronics engineering.
From 1993 to 1994, he was a post-doctoralfellow in the Biomedical Ultrasonics Labora-tory in the Bioengineering Department, Uni-versity of Michigan, Ann Arbor. From 1995
to 1996, he was on the faculty with the Electrical and ElectronicsEngineering Department of Kırıkkale University, Kırıkkale, Turkey,first as assistant professor and later as associate professor. In 1996,he joined Baskent University, Ankara, Turkey, as the Chairman ofthe Electrical and Electronics Engineering and Acting Chairman ofthe Computer Engineering Department and served in founding thesedepartments. He was a visiting scholar in the Biomedical UltrasonicsLaboratory at the University of Michigan, Ann Arbor, and in theE. L. Ginzton Laboratory at Stanford University, Stanford, CA, inthe summer terms of 1996–1997 and 1999, respectively.
Between 2000–2002, he was with the E. L. Ginzton Laboratoryat Stanford University as a visiting faculty in electrical engineering.In 2002, he joined Isık University, Istanbul, Turkey, where he is cur-rently working as faculty in electronics engineering.
In 1996, he was awarded H. Tugac Foundation Research Award ofTurkish Scientific and Technical Research Council for his contribu-tions to ultrasonic imaging. His research interests include signal andimage processing, ultrasonic imaging and integrated circuit design.Dr. Karaman is a member of the IEEE.
Butrus T. Khuri-Yakub (S’70–S’73–M’76–SM’87–F’95) was born in Beirut, Lebanon.He received the B.S. degree in 1970 fromthe American University of Beirut, Beirut,Lebanon, the M.S. degree in 1972 from Dart-mouth College, Hanover, NH, and the Ph.D.degree in 1975 from Stanford University, Stan-ford, CA, all in elecrical engineering.
He joined the research staff at the E. L.Ginzton Laboratory of Stanford University in1976 as a research associate. He was promotedto a senior research associate in 1978 and to a
professor of electrical engineering (research) in 1982. He has served onmany university committees in the School of Engineering and the De-partment of Electrical Engineering at Stanford University. Presently,he is the Deputy Director of the E. L. Ginzton Laboratory.
Dr. Khuri-Yakub has been teaching at both the graduate and un-dergraduate levels for over 15 years. His current research interestsinclude in situ acoustic sensors (temperature, .1m thickness, resistcure, etc.) for monitoring and control of integrated circuits manu-facturing processes, micromaching silicon to make acoustic materialsand devices such as airborne and water immersion ultrasonic trans-ducers and arrays, and fluid ejectors, and in the field of ultrasonicnondestructive evaluation and acoustic imaging and microscopy.

64 ieee transactions on ultrasonics, ferroelectrics, and frequency control, vol. 52, no. 1, january 2005
Dr. Khuri-Yakub is a fellow of the IEEE, a senior member of theAcoustic Society of America, and a member of Tau Beta Pi. He isassociate editor of Research in Nondestructive Evaluation, a Journalof the American Society for Nondestructive Testing. He has authoredover 400 publications and has been principal inventor or coinventorof 61 issued patents. He received the Stanford University School ofEngineering Distinguished Advisor Award, June 1987, and the Medalof the City of Bordeaux for contributions to NDE, 1983.