Embed Size (px)
Citation preview
COKE OVEN AREA INTERIM MEASURES
PROGRESS REPORT (MAY 2011)
Prepared for
RG Steel Sparrows Point, LLC
Sparrows Point, Maryland
June 30, 2011
URS Corporation 200 Orchard Ridge Drive, Suite 101 Gaithersburg, MD 20878 Project no. 15302745
Coke Oven Area Interim Remedial Measures Progress Report
Page 1 of 9
Introduction
In accordance with the United States Environmental Protection Agency’s (US EPA)’s September
2, 2010 letter, this document is the monthly progress report for May 2011 for the US EPA-
approved interim measures (IMs) that have been developed to address identified environmental
conditions at the Coke Oven Area (COA) Special Study Area at the RG Steel Sparrows Point
Facility (formerly Severstal Sparrows Point Facility) located in Sparrows Point, Maryland. This
progress report summarizes IM progress for May 2011.
For mutual ease of understanding, and as agreed during the June 3, 2010 teleconference with US
EPA, the following designations are applied in this document to the six (6) IM ”Cells” (Figure
1) at the COA:
• Cell 1: Prototype Air Sparge/Soil Vapor Extraction (AS/SVE) System in the Former
Benzol Processing Area,
• Cell 2: AS/SVE and Dual Phase Groundwater Extraction System in Former Coal Storage
Area,
• Cell 3: AS/SVE System in “Cove” Area,
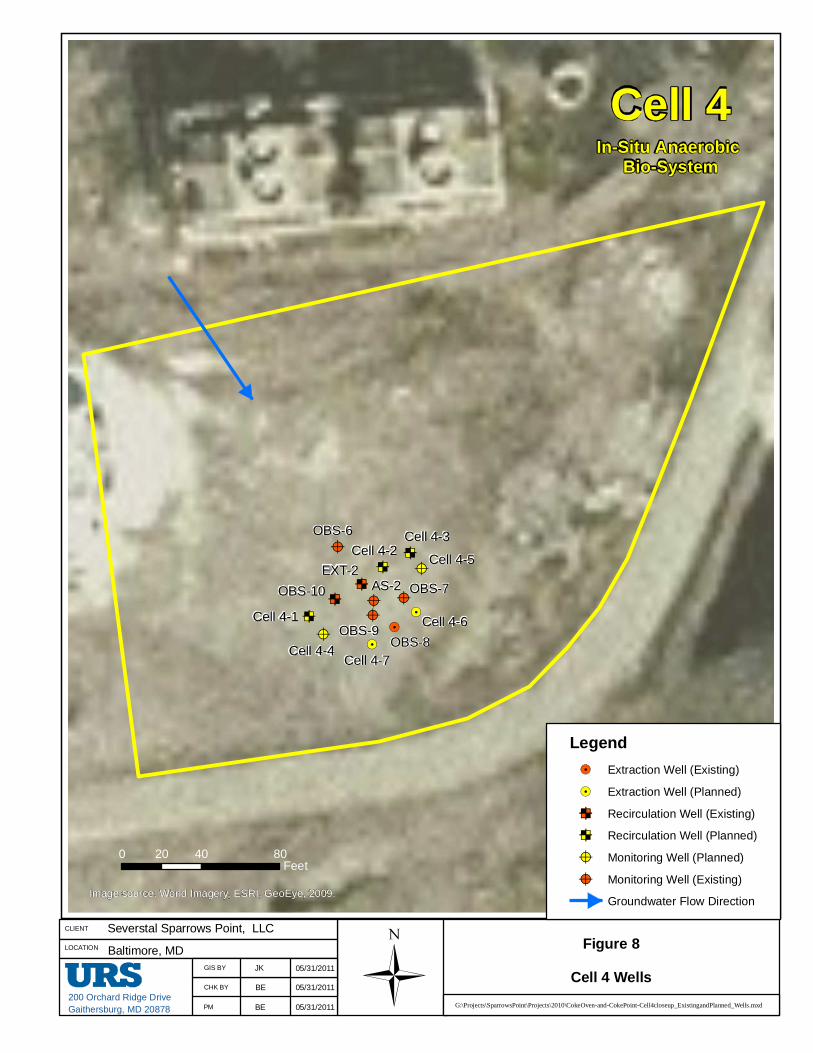
• Cell 4: In-Situ Anaerobic Bio-treatment Area,
• Cell 5: Groundwater Extraction at the Turning Basin Area, and
• Cell 6: Light Non-Aqueous Phase Liquid (LNAPL) Recovery at the Former Benzol
Processing Area.
As of May 31, 2011, Cell 1 and Cell 6 are operational. A final design report for the AS/SVE
system at Cell 3 was submitted on February 28, 2011. In addition, a final design report for the
in-situ anaerobic bio-treatment system at Cell 4 was submitted on March 31, 2011. US EPA has
approved the submitted designs for Cells 3 and 4. Construction of the AS/SVE system at Cell 3
began on May 23, 2011 and was substantially completed on June 23, 2011. Startup/shakedown
operations were initiated at Cell 3 on June 23, 2011.
Construction of groundwater treatment facilities for the in-situ anaerobic bio-treatment system at
Cell 4 were completed in May 2011. Operation of Cell 4 will begin in July 2011. The remaining
Coke Oven Area Interim Remedial Measures Progress Report
Page 2 of 9
Cells (Cells 2 and 5) are in various stages of evaluation, design, and under permitting
considerations by Maryland Department of the Environment (MDE).
Coke Oven Area Interim Remedial Measures Progress Report
Page 3 of 9
Cell 1: Prototype AS/SVE System in the Former Benzol Processing Area
Cell 1 consists of a prototype IM, which includes AS/SVE coupled with vapor destruction via an
electric catalytic oxidation (CATOX) unit (formerly an ICE unit, the function of which was
replaced by a temporary CATOX unit on May 3, 2011). The temporary CATOX unit was
installed to improve operational efficiency of the Cell 1 AS/SVE system while new CATOX/AS
systems for both Cell 1 and Cell 3 were being fabricated. The new, permanent CATOX system
was delivered and installed during the week of June 20, 2011. Startup/shakedown of the new
Cell 1 components began on June 23, 2011.
MDE received RG Steel’s Air and Radiation Management Administration (ARMA) permit-to-
construct application for the new Cell 1 and Cell 3 CATOX units on April 20, 2011 and issued
the modified permit-to-construct for the CATOX units (for both Cell 1 and Cell 3) on May 20,
2011. In accordance with the modified permit-to-construct conditions, the CATOX units are
operated in accordance with the manufacturer’s specifications.
Design of the Cell 1 system includes air sparging groundwater wells and vapor collection
trenches as shown schematically on Figure 2.
Figure 3 shows the system layout of Cell 1, which consists of the following major components:
• Three (3) generally parallel and interconnected vapor collection trenches approximately
500 feet long and 60 feet apart, fitted with perforated 4-inch SDR-17 high-density
polyethylene (HDPE) pipe. 15 vertical extraction risers are connected to a common
suction header.
• 16 air sparge wells located between the trenches.
• 4-inch SDR-17 HDPE sparge and suction headers fitted with control valves for 2-inch
SDR-17 HDPE sparge and suction laterals.
• One (1) trailer-mounted electric CATOX unit for extraction vacuum and vapor
destruction, which is accompanied by a separate air compressor for sparge air.
• Perimeter slag berm for system demarcation and protection from vehicular traffic.
Coke Oven Area Interim Remedial Measures Progress Report
Page 4 of 9
May 2011 Operational Performance
Operational performance of Cell 1 during this reporting period is summarized in Table 1. In
summary, the CATOX unit operated for 686 hours (92.2 %) during this reporting period.
Hydrocarbon removal rates ranged from approximately 0.4 to 1.9 pounds per operating hour
(approximately 10 to 46 pounds per operating day for an estimated total of 987 pounds). The
average CATOX destruction efficiency exceeded 99 %. Table 1 also includes a cumulative
summary of operational performance since system startup on August 3, 2010. In total, Cell 1 has
destroyed approximately 6,977 pounds of recovered hydrocarbons. Figure 4 presents a graph of
the cumulative estimated hydrocarbon recovery in Cell 1 by month since the startup of the IM
system.
Soil gas and CATOX exhaust gas samples were collected to confirm system performance within
the manufacturer’s specifications. Calibrated field instruments (e.g., photoionization detector
[PID]) were also used to evaluate system performance. The untreated soil gas samples and
CATOX exhaust samples were collected in Tedlar®
bags. All gas samples were submitted to
TestAmerica Laboratories, Inc. Knoxville, Tennessee laboratory for analysis by US EPA Method
TO-15. These data are summarized in Table 2.
Hydrocarbon removal calculations were based entirely on the analytical results and the
corresponding field-measured influent flow rate at the time of sampling. Calculations were
based on the following two (2) assumptions:
• The analytical sample from May 11, 2011 is representative of soil vapor concentrations
during the first nine (9) operating days of May because, in general, the same extraction
wells (V-1 through V-8) were online and CATOX operational temperatures were
generally stable within normal ranges.
• The analytical sample from May 25, 2011 represents soil vapor concentrations during the
last 20 operating days of May because, in general, the same extraction wells (V-1 thru V-
6) were online and CATOX operational temperatures were generally stable within normal
ranges
From Table 2, influent soil gas hydrocarbon concentrations, collected on May 11 and 25, 2011,
were 275 and 1,167 parts per million by volume (ppmv), respectively. The CATOX exhaust
samples, also collected on May 11 and 25, 2011, exhibited hydrocarbon concentrations of 1.8
and 3.3 ppmv, respectively; demonstrating hydrocarbon destruction efficiency greater than 99 %.
Coke Oven Area Interim Remedial Measures Progress Report
Page 5 of 9
In accordance with the May 20, 2011 modified permit-to-construct, the electric catalytic
oxidation unit was operational at all times that soil gases were collected.
May 2011 Groundwater Monitoring Results
Groundwater samples were collected on May 5, 2011 from the following wells:
• BP-MW-09 (upgradient of Cell 1),
• CO18-PZM006 (upgradient of Cell 1 at edge of berm), and
• CO02-PZM006 (downgradient of Cell 1).
The groundwater samples were submitted to Microbac Laboratories, Inc. of Baltimore, Maryland
(Microbac) for the analyses shown in Table 3. These data indicate benzene is the most prevalent
volatile organic compound (VOC) constituent.
Figure 5 presents a graph of the total measured VOC concentration in Cell 1 groundwater for
each well by month since the startup of the IM system. A decreasing total VOC concentration
trend is documented since system startup in August 2010. The identified trend for these
monitoring wells will continue to be monitored and assessed during system operation in future
months.
Coke Oven Area Interim Remedial Measures Progress Report
Page 6 of 9
Cell 3: AS/SVE System in the “Cove” Area
Construction of the Cell 3 AS/SVE system began May 23, 2011 and was substantially complete
on June 23, 2011. Operation of Cell 3 was initiated on June 23, 2011 when preliminary
startup/shakedown of the system was initiated. MDE issued a modified permit-to-construct for
the Cell 3 CATOX system on May 20, 2011.
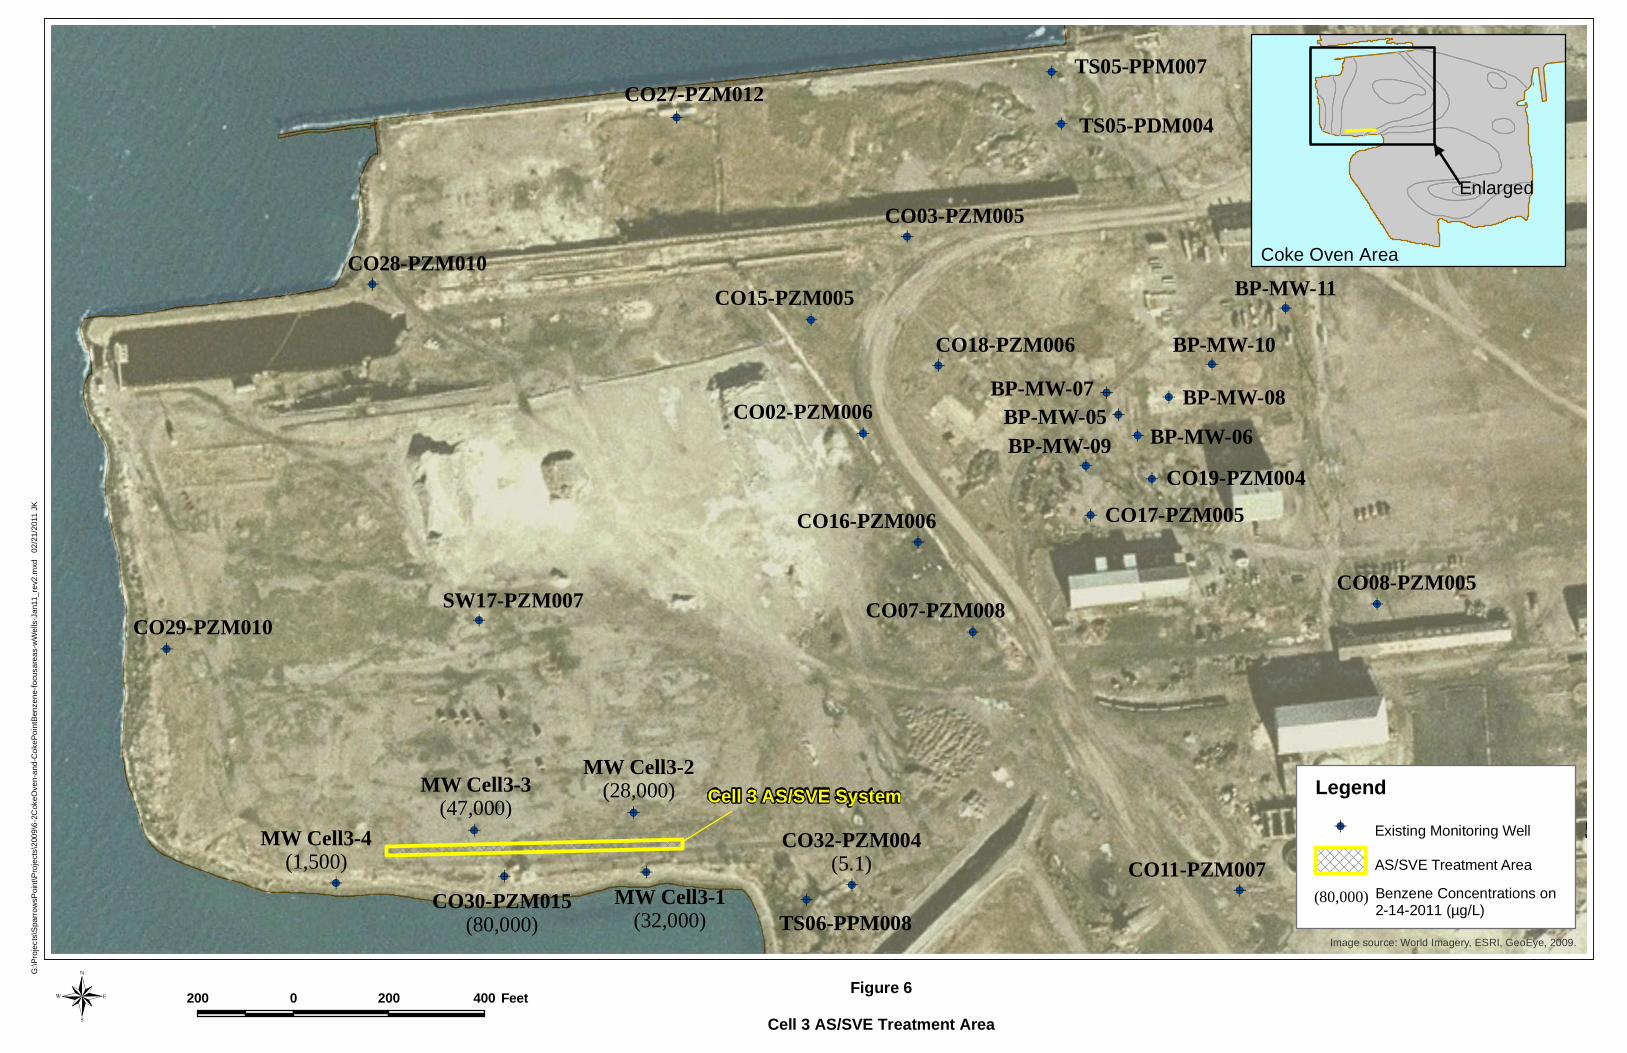
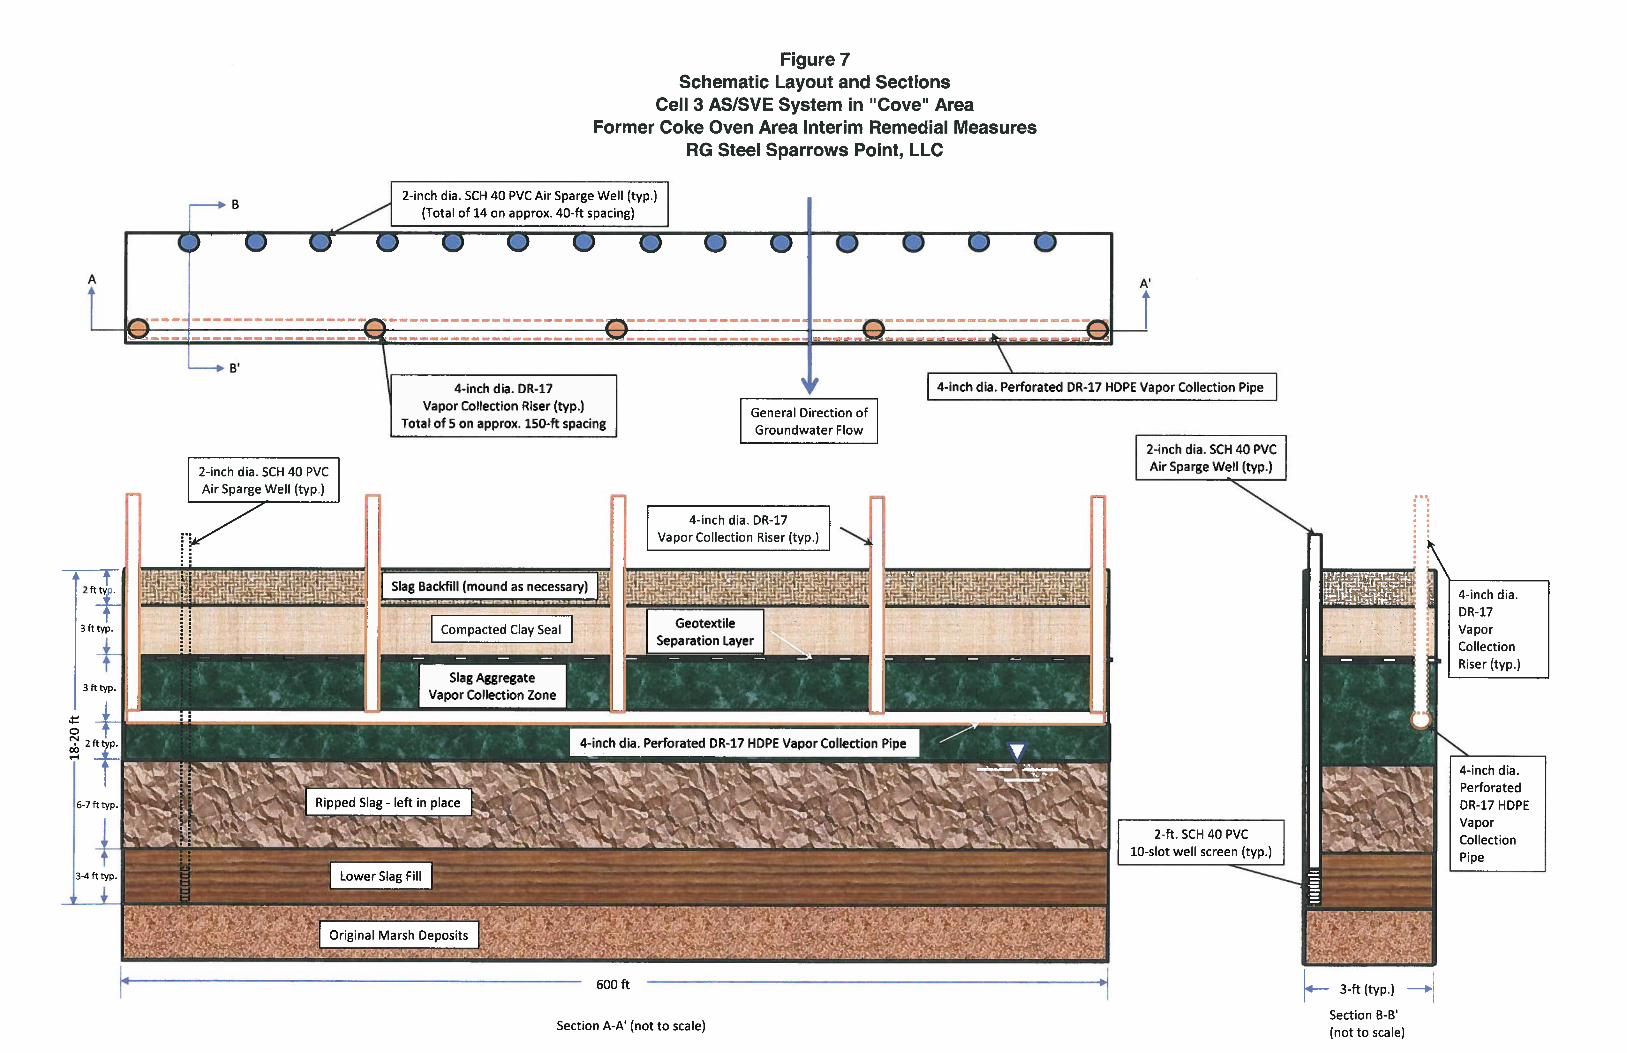
Figure 6 shows the location of the Cell 3 AS/SVE treatment area at the COA. A system
schematic of the Cell 3 system layout is shown on Figure 7, which consists of the following
major components:
• One (1) vapor collection trench (generally parallel to the cove shoreline) approximately
600 feet long and 3 feet wide fitted with a horizontal perforated 4-inch diameter SDR-17
HDPE vapor collection pipe locate on the cove-side of the trench. Five (5) vertical
vapor-extraction risers are connected to a common suction header.
• 14 air sparge wells located within the trench, opposite the vapor collection pipe. These
14 air sparge wells, each spaced approximately 40 feet apart, are constructed of 2-inch,
schedule 40 PVC with a 2-foot screen of the appropriate slot size and sand pack.
• 4-inch SDR-17 HDPE sparge and suction headers fitted with control valves for 2-inch
sparge and suction laterals.
• One (1) electric CATOX unit for extraction vacuum and vapor destruction. The CATOX
unit is sized to handle at least the volume of sparge air delivered to the subsurface.
• One (1) electric air compressor for sparge air sized to have the capability to activate all
sparge wells.
• Perimeter slag berm for system demarcation and protection from vehicular traffic.
Coke Oven Area Interim Remedial Measures Progress Report
Page 7 of 9
Cell 4: In-Situ Anaerobic Bio-treatment System
Cell 4 IM construction activities were initiated in May 2011, beginning with installation of the
seven (7) additional groundwater wells as specified in the design well network (Figure 8).
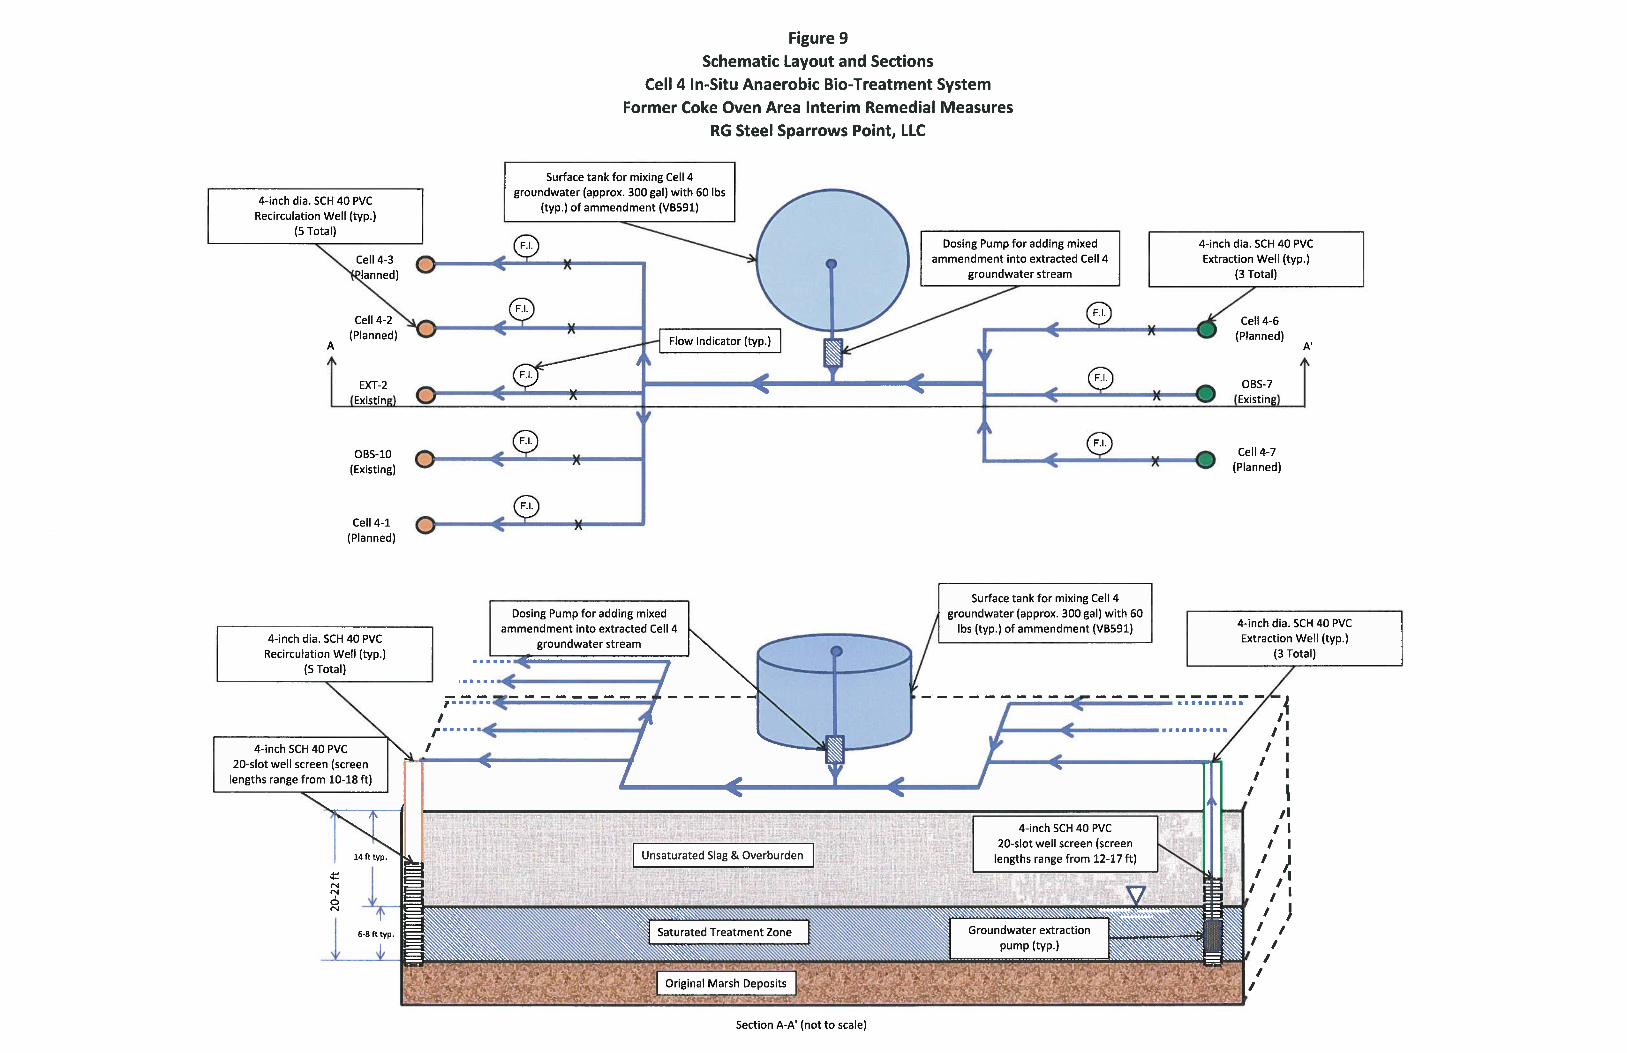
Figure 9 illustrates the extraction and recirculation system that will be used to dose and circulate
groundwater to disperse the nutrient amendment. Groundwater dosing and circulation will not
be continuous, but will periodically be repeated to maintain groundwater nutrient levels. The
first round of groundwater dosing and circulation will be completed in July 2011.
Coke Oven Area Interim Remedial Measures Progress Report
Page 8 of 9
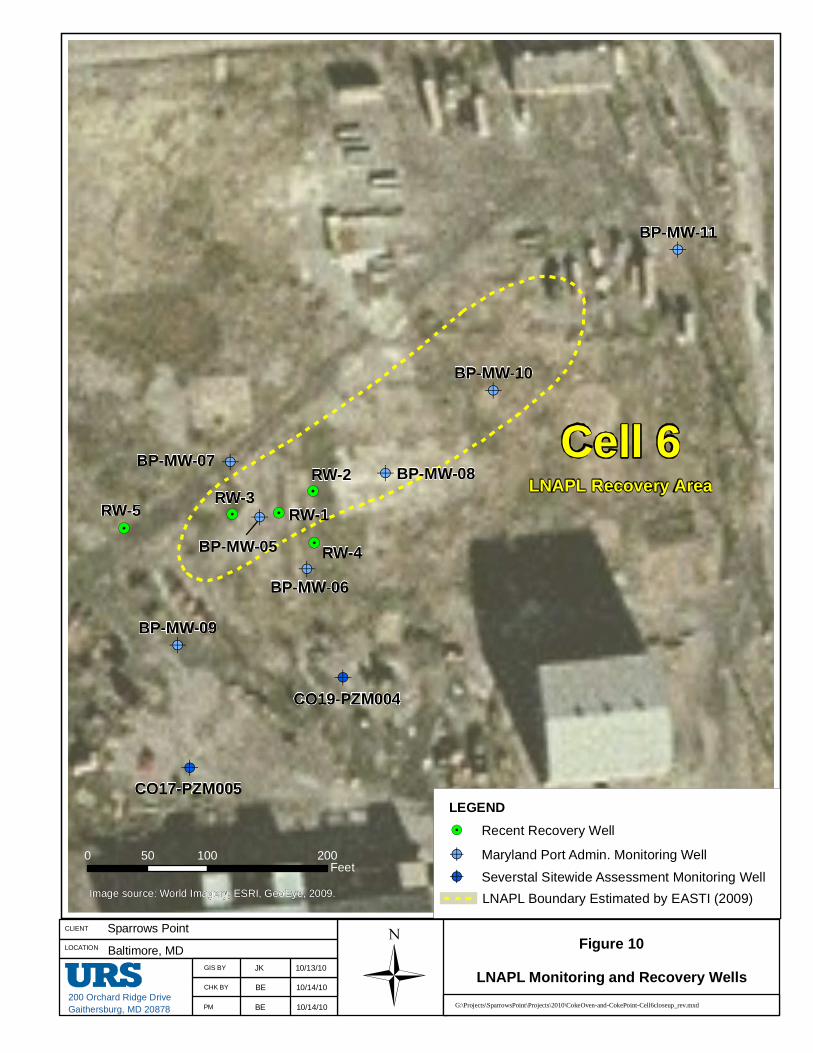
Cell 6: LNAPL Extraction at the Former Benzol Processing Area
The Cell 6 LNAPL monitoring and recovery system was monitored approximately weekly
during May 2011 (four [4] site visits). Table 4 summarizes LNAPL occurrence and recovery
observed during the reporting period along with the cumulative LNAPL recovery since the
beginning of the project. Figure 4 presents a graph of the cumulative estimated hydrocarbon
recovery in Cell 6 by month since the startup of the IM system. Figure 10 illustrates the well
locations.
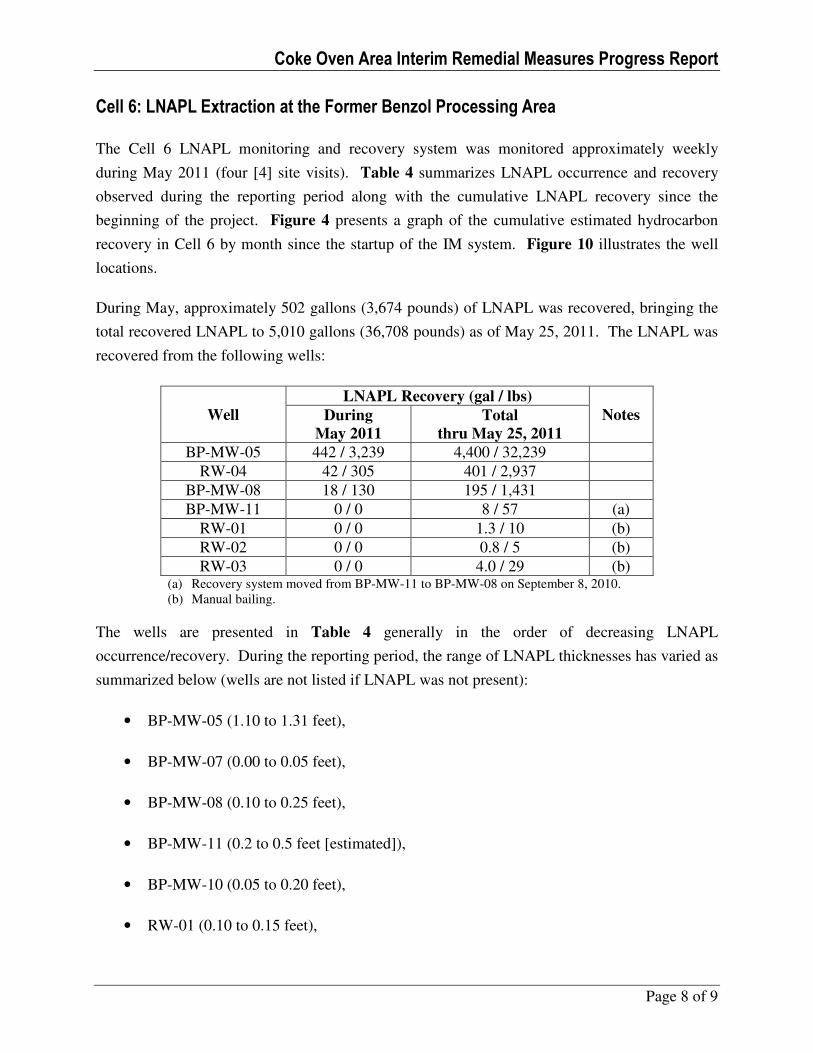
During May, approximately 502 gallons (3,674 pounds) of LNAPL was recovered, bringing the
total recovered LNAPL to 5,010 gallons (36,708 pounds) as of May 25, 2011. The LNAPL was
recovered from the following wells:
Well
LNAPL Recovery (gal / lbs)
Notes During
May 2011
Total
thru May 25, 2011
BP-MW-05 442 / 3,239 4,400 / 32,239
RW-04 42 / 305 401 / 2,937
BP-MW-08 18 / 130 195 / 1,431
BP-MW-11 0 / 0 8 / 57 (a)
RW-01 0 / 0 1.3 / 10 (b)
RW-02 0 / 0 0.8 / 5 (b)
RW-03 0 / 0 4.0 / 29 (b) (a) Recovery system moved from BP-MW-11 to BP-MW-08 on September 8, 2010.
(b) Manual bailing.
The wells are presented in Table 4 generally in the order of decreasing LNAPL
occurrence/recovery. During the reporting period, the range of LNAPL thicknesses has varied as
summarized below (wells are not listed if LNAPL was not present):
• BP-MW-05 (1.10 to 1.31 feet),
• BP-MW-07 (0.00 to 0.05 feet),
• BP-MW-08 (0.10 to 0.25 feet),
• BP-MW-11 (0.2 to 0.5 feet [estimated]),
• BP-MW-10 (0.05 to 0.20 feet),
• RW-01 (0.10 to 0.15 feet),
Coke Oven Area Interim Remedial Measures Progress Report
Page 9 of 9
• RW-02 (0.12 to 0.23 feet),
• RW-03 (0.13 to 0.18 feet), and
• RW-04 (0.60 to 0.94 feet).
LNAPL was not observed in wells RW-05, BP-MW-06, BP-MW-09, or CO19-PZM004 during
this reporting period.
For all wells in which LNAPL accumulated, Table 5 provides well-specific details concerning
the measured depths to LNAPL, the water table, and calculated LNAPL thicknesses.

Tables
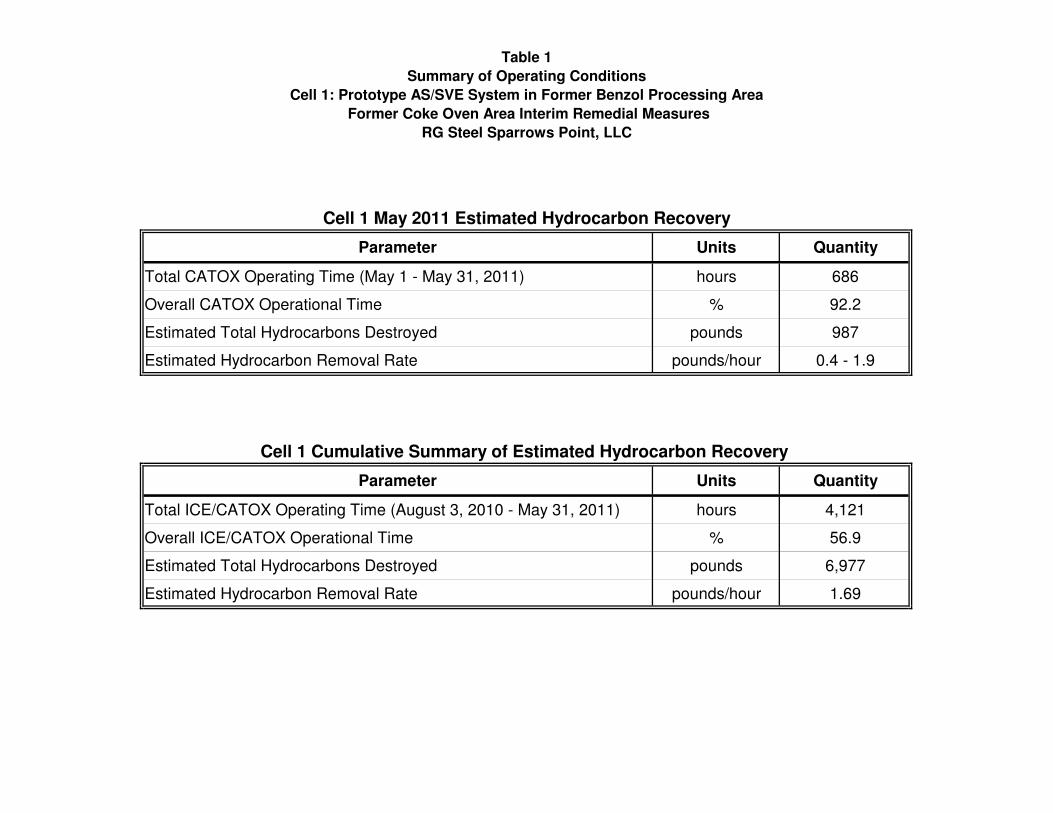
Table 1
Summary of Operating Conditions
Cell 1: Prototype AS/SVE System in Former Benzol Processing Area
Former Coke Oven Area Interim Remedial Measures
RG Steel Sparrows Point, LLC
Parameter Units Quantity
Total CATOX Operating Time (May 1 - May 31, 2011) hours 686
Overall CATOX Operational Time % 92.2
Estimated Total Hydrocarbons Destroyed pounds 987
Estimated Hydrocarbon Removal Rate pounds/hour 0.4 - 1.9
Parameter Units Quantity
Total ICE/CATOX Operating Time (August 3, 2010 - May 31, 2011) hours 4,121
Overall ICE/CATOX Operational Time % 56.9
Estimated Total Hydrocarbons Destroyed pounds 6,977
Estimated Hydrocarbon Removal Rate pounds/hour 1.69
Cell 1 Cumulative Summary of Estimated Hydrocarbon Recovery
Cell 1 May 2011 Estimated Hydrocarbon Recovery
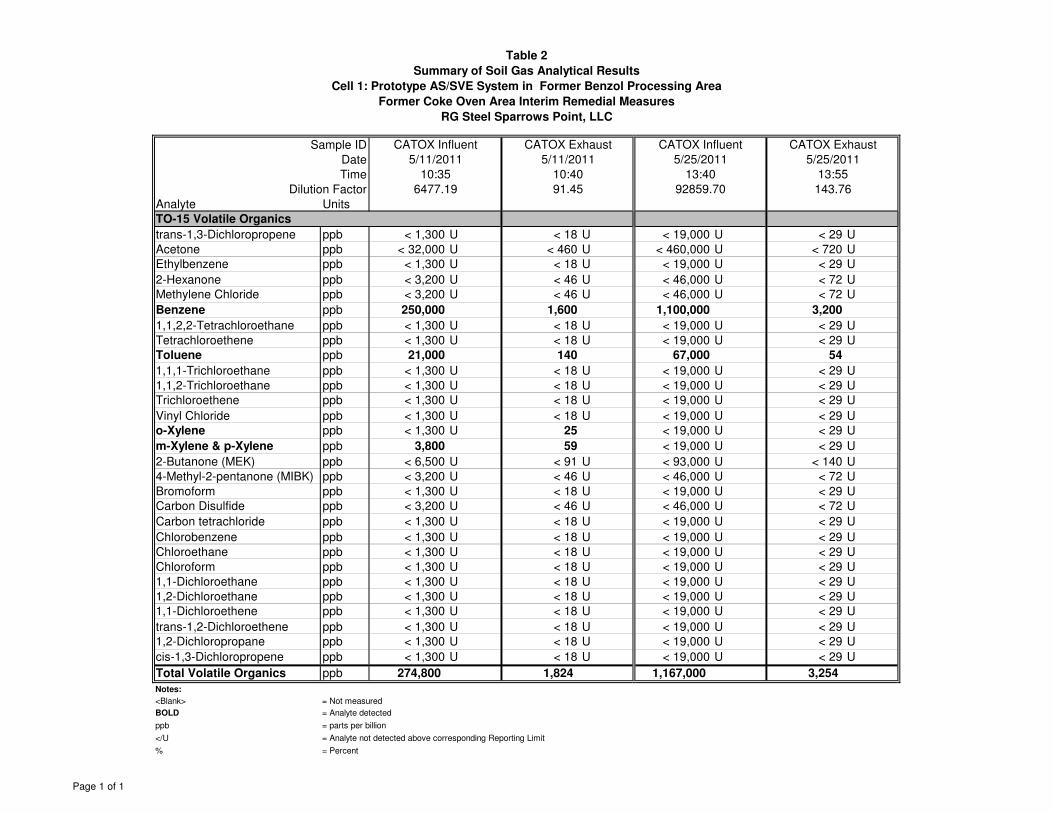
Table 2
Summary of Soil Gas Analytical Results
Cell 1: Prototype AS/SVE System in Former Benzol Processing Area
Former Coke Oven Area Interim Remedial Measures
RG Steel Sparrows Point, LLC
Sample ID
Date
Time
Dilution Factor
Analyte Units
TO-15 Volatile Organics
trans-1,3-Dichloropropene ppb < 1,300 U < 18 U < 19,000 U < 29 U
Acetone ppb < 32,000 U < 460 U < 460,000 U < 720 U
Ethylbenzene ppb < 1,300 U < 18 U < 19,000 U < 29 U
2-Hexanone ppb < 3,200 U < 46 U < 46,000 U < 72 U
Methylene Chloride ppb < 3,200 U < 46 U < 46,000 U < 72 U
Benzene ppb 250,000 1,600 1,100,000 3,200
1,1,2,2-Tetrachloroethane ppb < 1,300 U < 18 U < 19,000 U < 29 U
Tetrachloroethene ppb < 1,300 U < 18 U < 19,000 U < 29 U
Toluene ppb 21,000 140 67,000 54
1,1,1-Trichloroethane ppb < 1,300 U < 18 U < 19,000 U < 29 U
1,1,2-Trichloroethane ppb < 1,300 U < 18 U < 19,000 U < 29 U
Trichloroethene ppb < 1,300 U < 18 U < 19,000 U < 29 U
Vinyl Chloride ppb < 1,300 U < 18 U < 19,000 U < 29 U
o-Xylene ppb < 1,300 U 25 < 19,000 U < 29 U
m-Xylene & p-Xylene ppb 3,800 59 < 19,000 U < 29 U
2-Butanone (MEK) ppb < 6,500 U < 91 U < 93,000 U < 140 U
4-Methyl-2-pentanone (MIBK) ppb < 3,200 U < 46 U < 46,000 U < 72 U
Bromoform ppb < 1,300 U < 18 U < 19,000 U < 29 U
Carbon Disulfide ppb < 3,200 U < 46 U < 46,000 U < 72 U
Carbon tetrachloride ppb < 1,300 U < 18 U < 19,000 U < 29 U
Chlorobenzene ppb < 1,300 U < 18 U < 19,000 U < 29 U
Chloroethane ppb < 1,300 U < 18 U < 19,000 U < 29 U
Chloroform ppb < 1,300 U < 18 U < 19,000 U < 29 U
1,1-Dichloroethane ppb < 1,300 U < 18 U < 19,000 U < 29 U
1,2-Dichloroethane ppb < 1,300 U < 18 U < 19,000 U < 29 U
1,1-Dichloroethene ppb < 1,300 U < 18 U < 19,000 U < 29 U
trans-1,2-Dichloroethene ppb < 1,300 U < 18 U < 19,000 U < 29 U
1,2-Dichloropropane ppb < 1,300 U < 18 U < 19,000 U < 29 U
cis-1,3-Dichloropropene ppb < 1,300 U < 18 U < 19,000 U < 29 U
Total Volatile Organics ppb 274,800 1,824 1,167,000 3,254
Notes:
<Blank> = Not measured
BOLD = Analyte detected
ppb = parts per billion
</U = Analyte not detected above corresponding Reporting Limit
% = Percent
CATOX Influent CATOX Exhaust
5/11/2011 5/11/2011
10:35 10:40
6477.19 91.45
CATOX Influent CATOX Exhaust
5/25/2011 5/25/2011
13:40 13:55
92859.70 143.76
Page 1 of 1
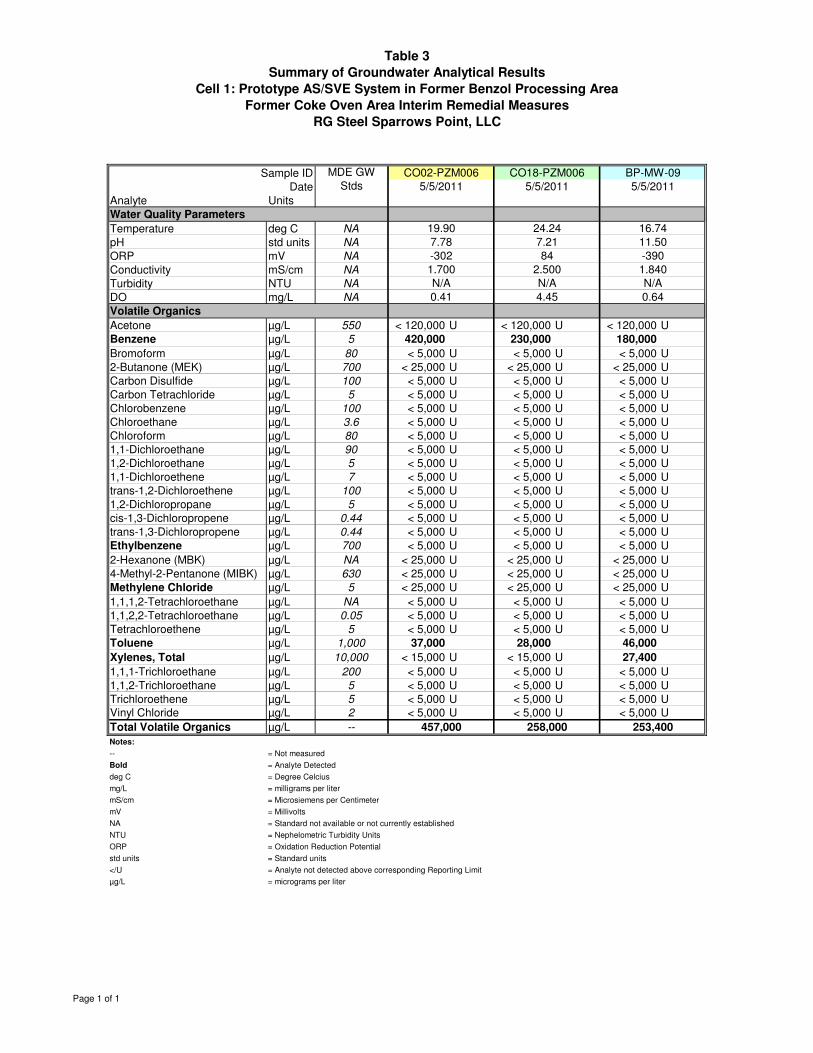
Table 3
Summary of Groundwater Analytical Results
Cell 1: Prototype AS/SVE System in Former Benzol Processing Area
Former Coke Oven Area Interim Remedial Measures
RG Steel Sparrows Point, LLC
Sample ID
Date
Analyte Units
Water Quality Parameters
Temperature deg C NA
pH std units NA
ORP mV NA
Conductivity mS/cm NA
Turbidity NTU NA
DO mg/L NA
Volatile Organics
Acetone µg/L 550 < 120,000 U < 120,000 U < 120,000 U
Benzene µg/L 5 420,000 230,000 180,000
Bromoform µg/L 80 < 5,000 U < 5,000 U < 5,000 U
2-Butanone (MEK) µg/L 700 < 25,000 U < 25,000 U < 25,000 U
Carbon Disulfide µg/L 100 < 5,000 U < 5,000 U < 5,000 U
Carbon Tetrachloride µg/L 5 < 5,000 U < 5,000 U < 5,000 U
Chlorobenzene µg/L 100 < 5,000 U < 5,000 U < 5,000 U
Chloroethane µg/L 3.6 < 5,000 U < 5,000 U < 5,000 U
Chloroform µg/L 80 < 5,000 U < 5,000 U < 5,000 U
1,1-Dichloroethane µg/L 90 < 5,000 U < 5,000 U < 5,000 U
1,2-Dichloroethane µg/L 5 < 5,000 U < 5,000 U < 5,000 U
1,1-Dichloroethene µg/L 7 < 5,000 U < 5,000 U < 5,000 U
trans-1,2-Dichloroethene µg/L 100 < 5,000 U < 5,000 U < 5,000 U
1,2-Dichloropropane µg/L 5 < 5,000 U < 5,000 U < 5,000 U
cis-1,3-Dichloropropene µg/L 0.44 < 5,000 U < 5,000 U < 5,000 U
trans-1,3-Dichloropropene µg/L 0.44 < 5,000 U < 5,000 U < 5,000 U
Ethylbenzene µg/L 700 < 5,000 U < 5,000 U < 5,000 U
2-Hexanone (MBK) µg/L NA < 25,000 U < 25,000 U < 25,000 U
4-Methyl-2-Pentanone (MIBK) µg/L 630 < 25,000 U < 25,000 U < 25,000 U
Methylene Chloride µg/L 5 < 25,000 U < 25,000 U < 25,000 U
1,1,1,2-Tetrachloroethane µg/L NA < 5,000 U < 5,000 U < 5,000 U
1,1,2,2-Tetrachloroethane µg/L 0.05 < 5,000 U < 5,000 U < 5,000 U
Tetrachloroethene µg/L 5 < 5,000 U < 5,000 U < 5,000 U
Toluene µg/L 1,000 37,000 28,000 46,000
Xylenes, Total µg/L 10,000 < 15,000 U < 15,000 U 27,400
1,1,1-Trichloroethane µg/L 200 < 5,000 U < 5,000 U < 5,000 U
1,1,2-Trichloroethane µg/L 5 < 5,000 U < 5,000 U < 5,000 U
Trichloroethene µg/L 5 < 5,000 U < 5,000 U < 5,000 U
Vinyl Chloride µg/L 2 < 5,000 U < 5,000 U < 5,000 U
Total Volatile Organics µg/L --
Notes:
-- = Not measured
Bold = Analyte Detected
deg C = Degree Celcius
mg/L = milligrams per liter
mS/cm = Microsiemens per Centimeter
mV = Millivolts
NA = Standard not available or not currently established
NTU = Nephelometric Turbidity Units
ORP = Oxidation Reduction Potential
std units = Standard units
</U = Analyte not detected above corresponding Reporting Limit
µg/L = micrograms per liter
BP-MW-09
5/5/2011
16.74
11.50
-390
1.840
N/A
0.64
253,400
84
2.500
4.45
258,000457,000
N/A
-302
1.700
0.41
CO02-PZM006
5/5/2011
MDE GW
Stds 5/5/2011
19.90
7.78
24.24
7.21
N/A
CO18-PZM006
Page 1 of 1
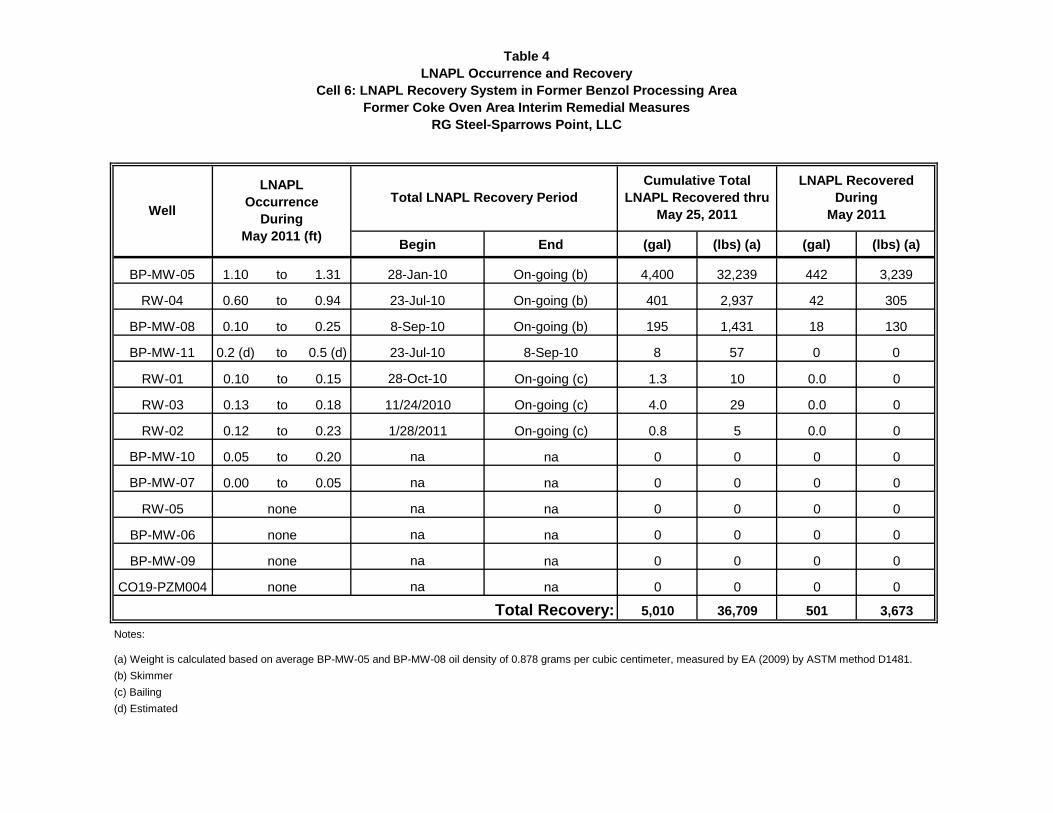
Table 4LNAPL Occurrence and Recovery
Cell 6: LNAPL Recovery System in Former Benzol Processing AreaFormer Coke Oven Area Interim Remedial Measures
RG Steel-Sparrows Point, LLC
Begin End (gal) (lbs) (a) (gal) (lbs) (a)
BP-MW-05 1.10 to 1.31 28-Jan-10 On-going (b) 4,400 32,239 442 3,239
RW-04 0.60 to 0.94 23-Jul-10 On-going (b) 401 2,937 42 305
BP-MW-08 0.10 to 0.25 8-Sep-10 On-going (b) 195 1,431 18 130
BP-MW-11 0.2 (d) to 0.5 (d) 23-Jul-10 8-Sep-10 8 57 0 0
RW-01 0.10 to 0.15 28-Oct-10 On-going (c) 1.3 10 0.0 0
RW-03 0.13 to 0.18 11/24/2010 On-going (c) 4.0 29 0.0 0
RW-02 0.12 to 0.23 1/28/2011 On-going (c) 0.8 5 0.0 0
BP-MW-10 0.05 to 0.20 na na 0 0 0 0
BP-MW-07 0.00 to 0.05 na na 0 0 0 0
RW-05 na na 0 0 0 0
BP-MW-06 na na 0 0 0 0
BP-MW-09 na na 0 0 0 0
CO19-PZM004 na na 0 0 0 0
5,010 36,709 501 3,673Total Recovery:
none
Cumulative Total LNAPL Recovered thru
May 25, 2011
LNAPL Recovered During
May 2011Total LNAPL Recovery Period
(d) Estimated
(a) Weight is calculated based on average BP-MW-05 and BP-MW-08 oil density of 0.878 grams per cubic centimeter, measured by EA (2009) by ASTM method D1481.
(b) Skimmer
(c) Bailing
Notes:
Well
LNAPLOccurrence
DuringMay 2011 (ft)
none
none
none
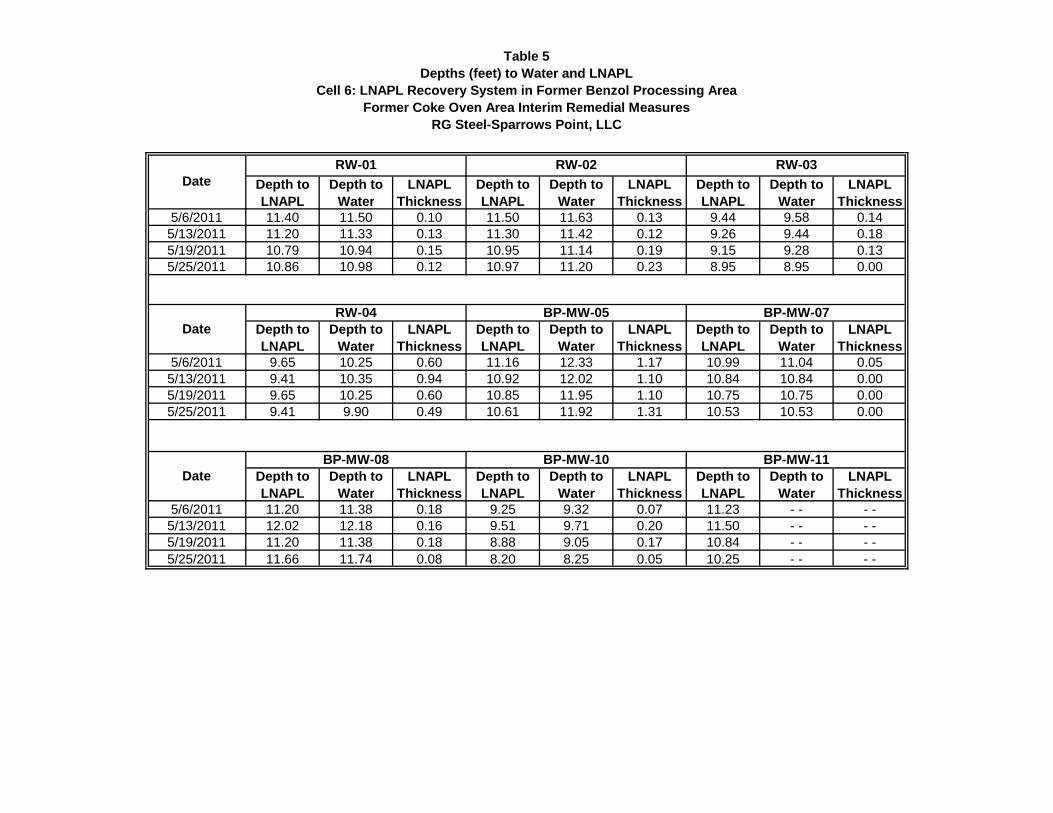
Table 5Depths (feet) to Water and LNAPL
Cell 6: LNAPL Recovery System in Former Benzol Processing AreaFormer Coke Oven Area Interim Remedial Measures
RG Steel-Sparrows Point, LLC
Depth to LNAPL
Depth to Water
LNAPL Thickness
Depth to LNAPL
Depth to Water
LNAPL Thickness
Depth to LNAPL
Depth to Water
LNAPL Thickness
5/6/2011 11.40 11.50 0.10 11.50 11.63 0.13 9.44 9.58 0.145/13/2011 11.20 11.33 0.13 11.30 11.42 0.12 9.26 9.44 0.185/19/2011 10.79 10.94 0.15 10.95 11.14 0.19 9.15 9.28 0.135/25/2011 10.86 10.98 0.12 10.97 11.20 0.23 8.95 8.95 0.00
Depth to LNAPL
Depth to Water
LNAPL Thickness
Depth to LNAPL
Depth to Water
LNAPL Thickness
Depth to LNAPL
Depth to Water
LNAPL Thickness
5/6/2011 9.65 10.25 0.60 11.16 12.33 1.17 10.99 11.04 0.055/13/2011 9.41 10.35 0.94 10.92 12.02 1.10 10.84 10.84 0.005/19/2011 9.65 10.25 0.60 10.85 11.95 1.10 10.75 10.75 0.005/25/2011 9.41 9.90 0.49 10.61 11.92 1.31 10.53 10.53 0.00
Depth to LNAPL
Depth to Water
LNAPL Thickness
Depth to LNAPL
Depth to Water
LNAPL Thickness
Depth to LNAPL
Depth to Water
LNAPL Thickness
5/6/2011 11.20 11.38 0.18 9.25 9.32 0.07 11.23 - - - -5/13/2011 12.02 12.18 0.16 9.51 9.71 0.20 11.50 - - - -5/19/2011 11.20 11.38 0.18 8.88 9.05 0.17 10.84 - - - -5/25/2011 11.66 11.74 0.08 8.20 8.25 0.05 10.25 - - - -
BP-MW-07
BP-MW-11
DateRW-03
BP-MW-05RW-04
BP-MW-08
Date
Date
RW-01 RW-02
BP-MW-10

Figures
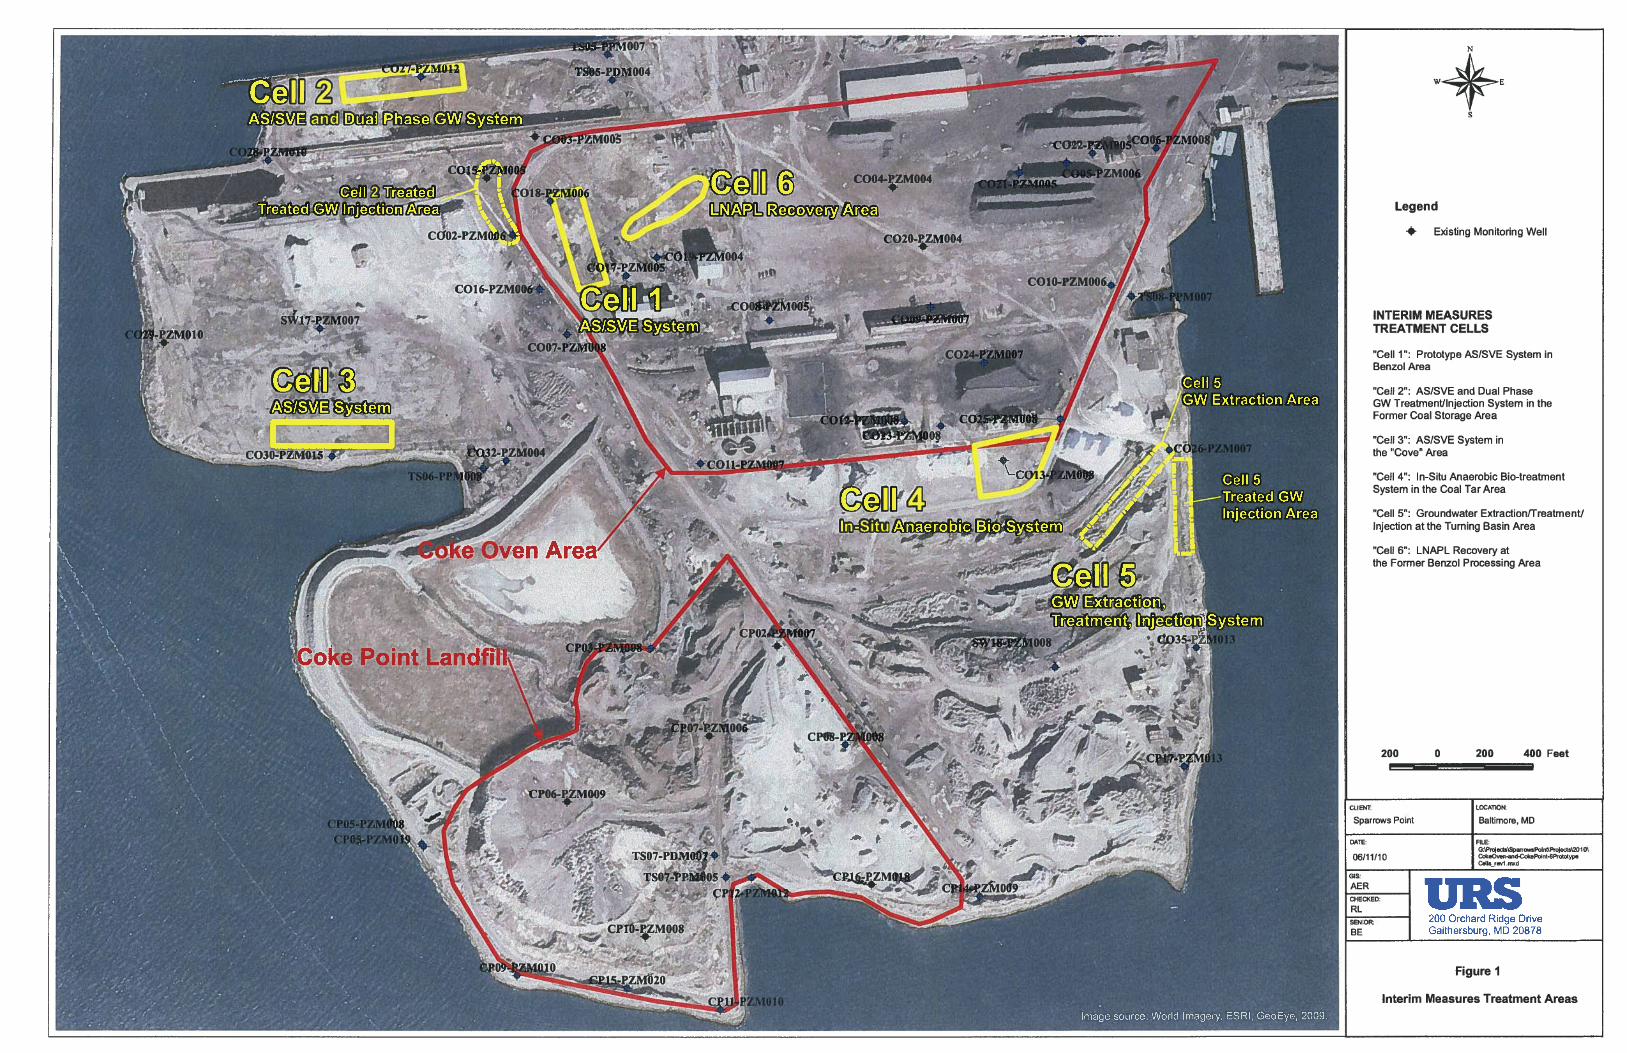
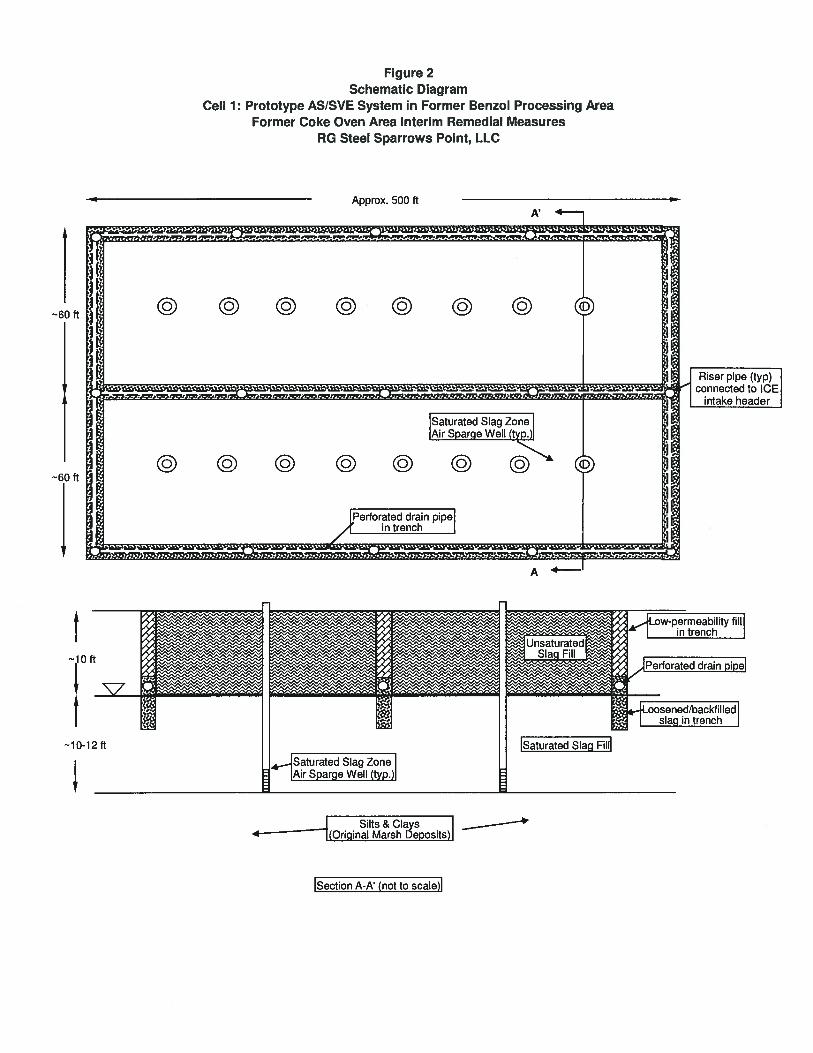
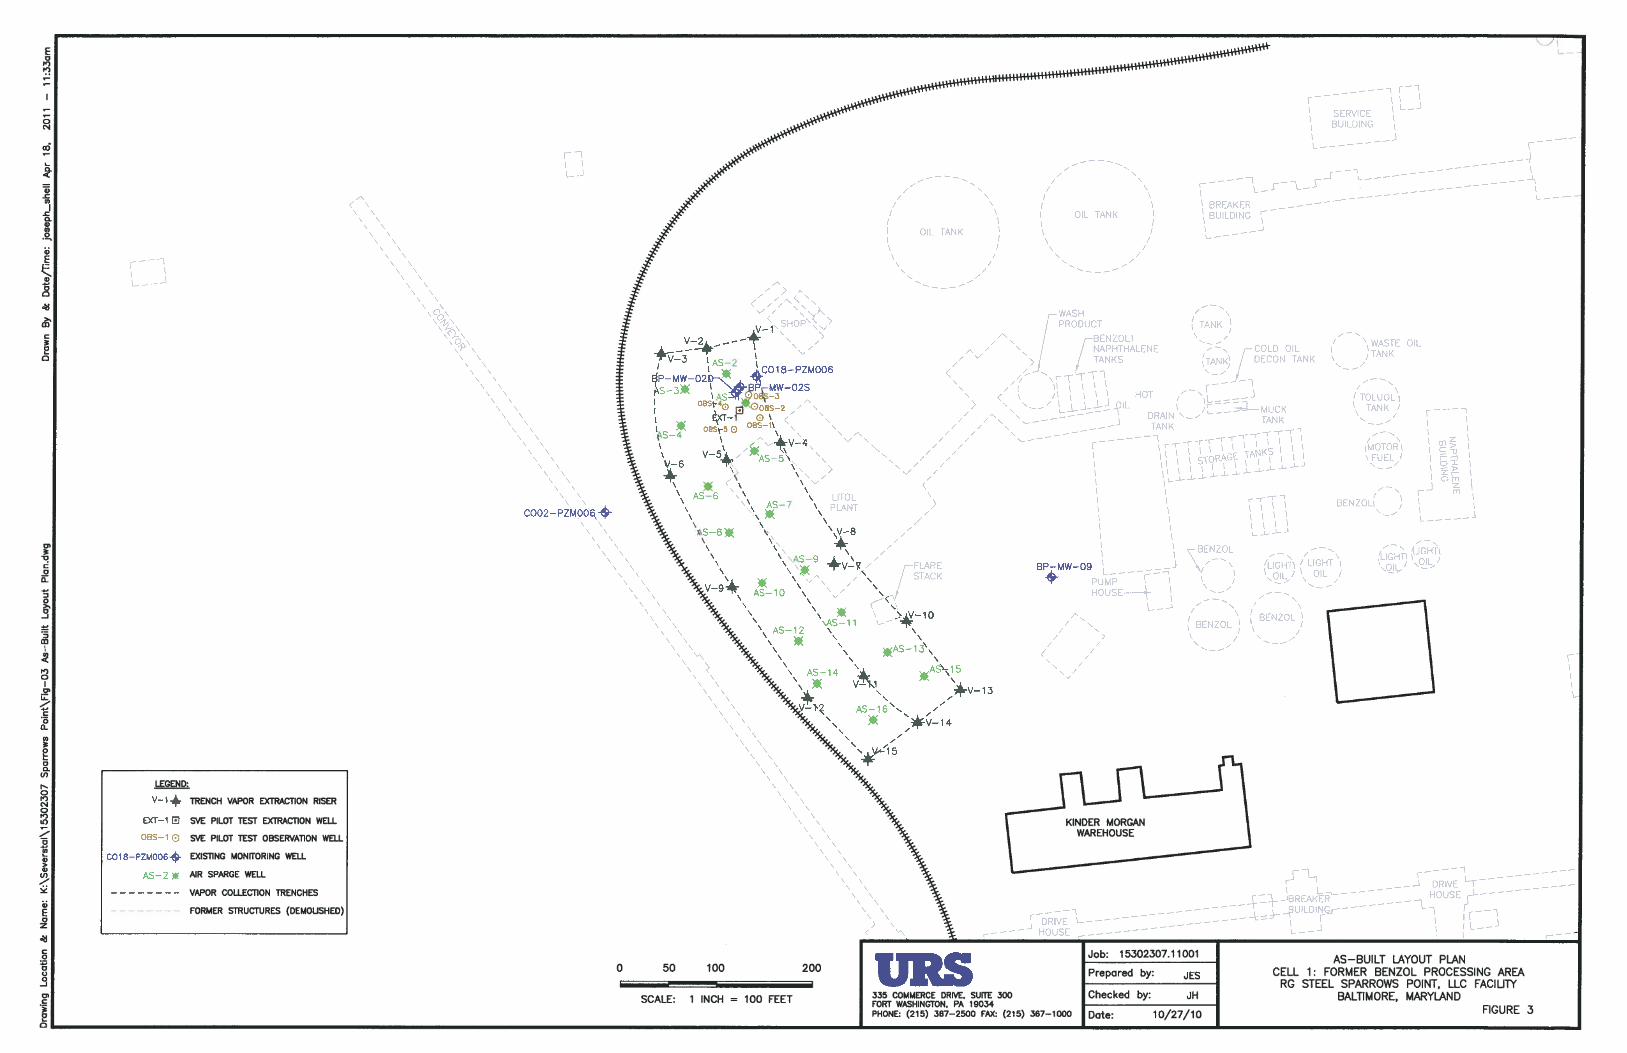
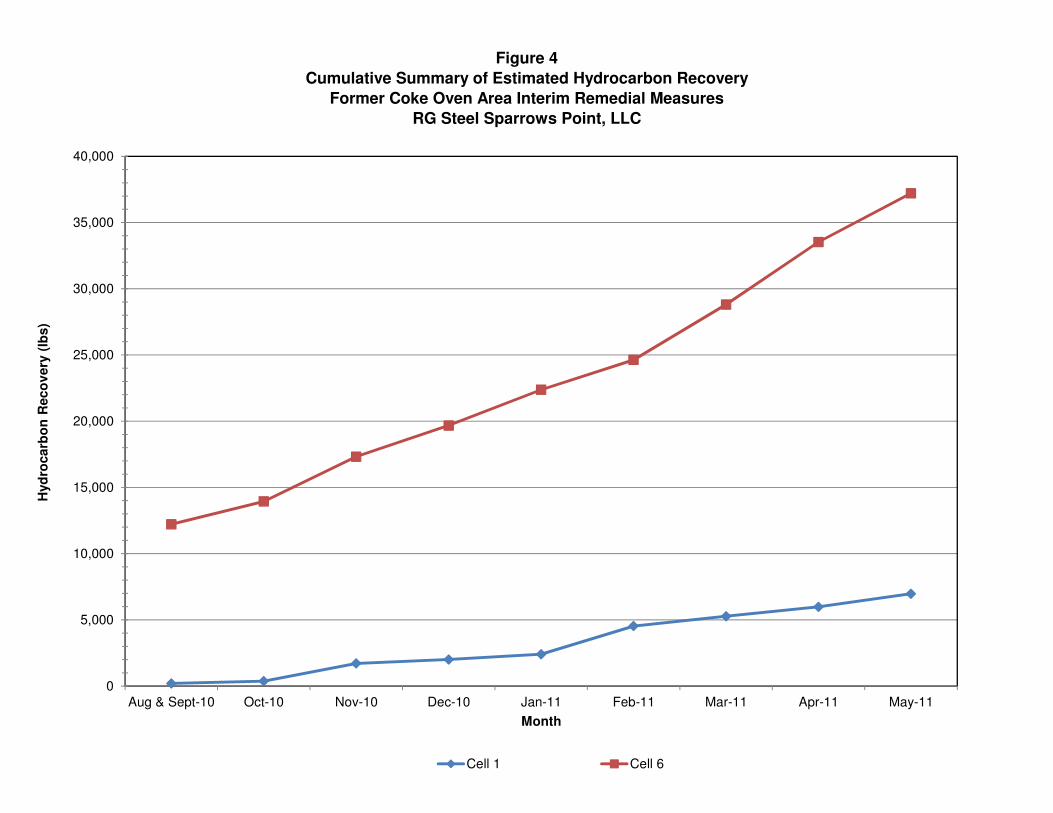
Figure 4
Cumulative Summary of Estimated Hydrocarbon Recovery
Former Coke Oven Area Interim Remedial Measures
RG Steel Sparrows Point, LLC
0
5,000
10,000
15,000
20,000
25,000
30,000
35,000
40,000
Aug & Sept-10 Oct-10 Nov-10 Dec-10 Jan-11 Feb-11 Mar-11 Apr-11 May-11
Hyd
rocarb
on
Reco
very
(lb
s)
Month
Cell 1 Cell 6
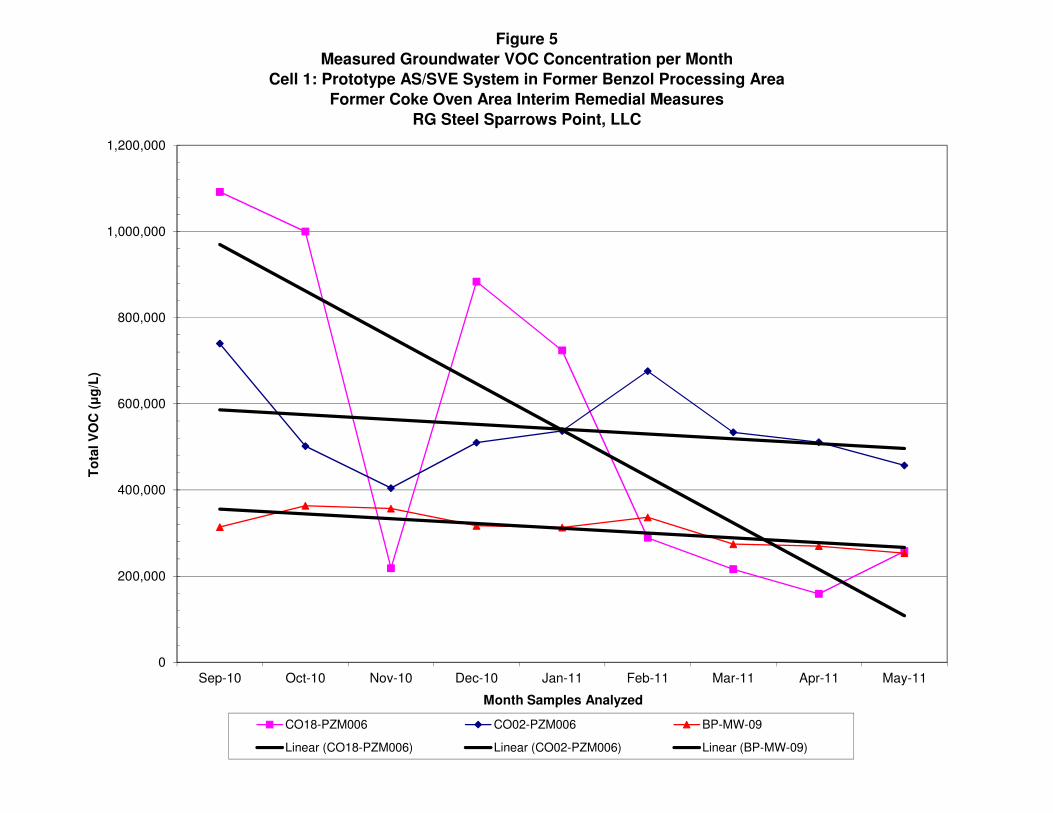
Figure 5
Measured Groundwater VOC Concentration per Month
Cell 1: Prototype AS/SVE System in Former Benzol Processing Area
Former Coke Oven Area Interim Remedial Measures
RG Steel Sparrows Point, LLC
0
200,000
400,000
600,000
800,000
1,000,000
1,200,000
Sep-10 Oct-10 Nov-10 Dec-10 Jan-11 Feb-11 Mar-11 Apr-11 May-11
To
tal V
OC
(µ
g/L
)
Month Samples Analyzed
CO18-PZM006 CO02-PZM006 BP-MW-09
Linear (CO18-PZM006) Linear (CO02-PZM006) Linear (BP-MW-09)
!!
!!
!!
!!
!!
!!
!!
!!
!!
!!
!!
!!
!!
!!
!!
!!
!!
!!
!!
!!
!!
!!
!!
!!
!!
!!
!!
!!
!!
!!
!!
!!
!!
!!
!!
!!
!!
!!
!A
!A
!A !A
!A
!A
!A
!A!A
!A
!A
!A
!A
!A
!A
!A
!A
!A
!A
!A
!A
!A
!A
!A
!A
!A
!A
!A
!A
!A
CO32-PZM004(5.1)
TS06-PPM008
TS05-PPM007
TS05-PDM004
SW17-PZM007
CO30-PZM015(80,000)
CO29-PZM010
CO28-PZM010
CO27-PZM012
CO19-PZM004
CO18-PZM006
CO17-PZM005CO16-PZM006
CO15-PZM005
CO11-PZM007
CO08-PZM005CO07-PZM008
CO03-PZM005
CO02-PZM006
590
Cell 3 AS/SVE System
MW Cell3-2(28,000)MW Cell3-3
(47,000)
MW Cell3-1(32,000)
MW Cell3-4(1,500)
BP-MW-11
BP-MW-10
BP-MW-09
BP-MW-08BP-MW-07
BP-MW-06BP-MW-05
!!
!!
!!
!!
!!
!!
!!
!!
!!
!!
!!
!!
!!
!!
!!
!!
!!
!!
!!
!!
!!
!!
!!
!!
!!
!!
!!
!!
!!
!!
!!
!!
!!
!!
!!
!!
!!
!!
!A
!A
!A !A
!A
!A
!A
!A!A
!A
!A
!A
!A
!A
!A
!A
!A
!A
!A
!A
!A
!A
!A
!A
!A
!A
!A
!A
!A
!A
CO32-PZM004(5.1)
TS06-PPM008
TS05-PPM007
TS05-PDM004
SW17-PZM007
CO30-PZM015(80,000)
CO29-PZM010
CO28-PZM010
CO27-PZM012
CO19-PZM004
CO18-PZM006
CO17-PZM005CO16-PZM006
CO15-PZM005
CO11-PZM007
CO08-PZM005CO07-PZM008
CO03-PZM005
CO02-PZM006
590
Cell 3 AS/SVE System
MW Cell3-2(28,000)MW Cell3-3
(47,000)
MW Cell3-1(32,000)
MW Cell3-4(1,500)
BP-MW-11
BP-MW-10
BP-MW-09
BP-MW-08BP-MW-07
BP-MW-06BP-MW-05
G:\P
roje
cts\
Spa
rrow
sPoi
nt\P
roje
cts\
2009
\6-2
Cok
eOve
n-an
d-C
okeP
oint
Ben
zene
-foc
usar
eas-
wW
ells
-Jan
11_r
ev2.
mxd
02
/21/
2011
JK
Figure 6
Cell 3 AS/SVE Treatment Area® 200 0 200 400 Feet
Coke Oven Area
Enlarged
Image source: World Imagery, ESRI, GeoEye, 2009.
Legend
!A Existing Monitoring Well
AS/SVE Treatment Area
(80,000) Benzene Concentrations on2-14-2011 (µg/L)
@?
@?
@?
@?
@?
@?
ED
ED
ED
ED
ED
!.
!.
!.
AS-2EXT-2
OBS-9
OBS-7
OBS-8
OBS-6
OBS-10
Cell 4-3
Cell 4-4
Cell 4-6
Cell 4-7
Cell 4-1
Cell 4-2Cell 4-5
@?
@?
@?
@?
@?
@?
ED
ED
ED
ED
ED
!.
!.
!.
AS-2EXT-2
OBS-9
OBS-7
OBS-8
OBS-6
OBS-10
Cell 4-3
Cell 4-4
Cell 4-6
Cell 4-7
Cell 4-1
Cell 4-2Cell 4-5
Image source: World Imagery, ESRI, GeoEye, 2009.
CLIENT
LOCATION
Severstal Sparrows Point, LLC
Baltimore, MDGIS BY
CHK BY
PM
JK
BE
BE
05/31/2011
05/31/2011
05/31/2011
Figure 8
Cell 4 Wells200 Orchard Ridge DriveGaithersburg, MD 20878 G:\Projects\SparrowsPoint\Projects\2010\CokeOven-and-CokePoint-Cell4closeup_ExistingandPlanned_Wells.mxdÜ
0 40 8020Feet
Cell 4In-Situ Anaerobic
Bio-System
Legend
!. Extraction Well (Existing)
!. Extraction Well (Planned)
ED Recirculation Well (Existing)
ED Recirculation Well (Planned)
@? Monitoring Well (Planned)
@? Monitoring Well (Existing)
Groundwater Flow Direction
!A
!A
!A
!A
!A!A
!A
!A
!A
!.
!.
!.
!.
!.
CO19-PZM004
CO17-PZM005
BP-MW-11
BP-MW-10
BP-MW-09
BP-MW-08BP-MW-07
BP-MW-06
BP-MW-05
RW-2
RW-1RW-5
RW-4
RW-3
!A
!A
!A
!A
!A!A
!A
!A
!A
!.
!.
!.
!.
!.
CO19-PZM004
CO17-PZM005
BP-MW-11
BP-MW-10
BP-MW-09
BP-MW-08BP-MW-07
BP-MW-06
BP-MW-05
RW-2
RW-1RW-5
RW-4
RW-3
Image source: World Imagery, ESRI, GeoEye, 2009.
CLIENT
LOCATION
Sparrows Point
Baltimore, MDGIS BY
CHK BY
PM
JK
BE
BE
10/13/10
10/14/10
10/14/10
Figure 10
LNAPL Monitoring and Recovery Wells200 Orchard Ridge DriveGaithersburg, MD 20878 G:\Projects\SparrowsPoint\Projects\2010\CokeOven-and-CokePoint-Cell6closeup_rev.mxdÜ
0 100 20050Feet
Cell 6LNAPL Recovery Area
LEGEND
!. Recent Recovery Well
Maryland Port Admin. Monitoring Well@?
Severstal Sitewide Assessment Monitoring Well@?
LNAPL Boundary Estimated by EASTI (2009)


![COKE PRODUCTION · coke oven: a topside air-particulate sample and a coke-oven main sample. The coke-oven topside sample was found to contain 478 mg/kg benzo[a] pyrene (Nesnow et](https://img.pdfslide.net/doc/110x75/610765e0cb8ebe39b05a5c13/coke-production-coke-oven-a-topside-air-particulate-sample-and-a-coke-oven-main.jpg)