Embed Size (px)
Citation preview
Cold Fusion at SRIAn 18 Year Retrospective
(and brief Prospective)
Michael McKubre
Director of the Energy Research Center
Principal Staff Scientist in the
Materials Research Laboratory
SRI International, Menlo Park, California.
Presented at the APS meeting, Denver CO, March 5, 2007.
1989A Series of Unanswered Questions
Q1 Is there unexplained heat?
Q2 Is the heat output sensibly correlated with inputs?
Q3 Is the heat derived from a nuclear process?
Q4 Nuclear ash correlated with the excess heat?
Q5 Are their other nuclear effects?
Q6 What is the nuclear process?
Q7 What is the future?
1992Q1 Unexplained heat source? YES!!!
• Effect Evidenced on numerous occasions (>70 at SRI)
• Typical Pxs 3 - 30% (±0.5%) of Total Pin (340%)
• Up to 90 observation of excess power effect
• Duration several hours to 1 week
• Sustained, unidirectional heat burst exhibit an integratedenergy at least 100 times greater than conceivable energystorage effects
• Heat production observed for over half the operationtime of one cell (C1).
• Similar heat production observed using 4 differentcalorimetric methods.
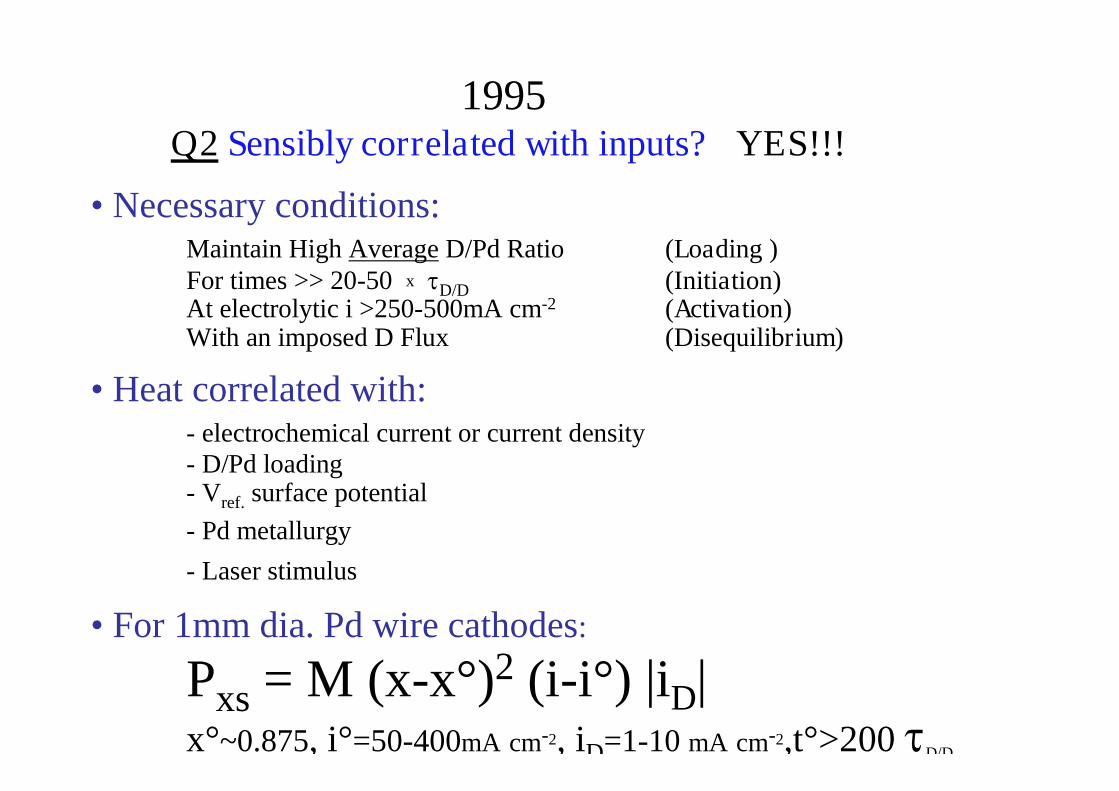
1995Q2 Sensibly correlated with inputs? YES!!!
• Necessary conditions:Maintain High Average D/Pd Ratio (Loading )For times >> 20-50 x D/D (Initiation)At electrolytic i >250-500mA cm-2 (Activation)With an imposed D Flux (Disequilibrium)
• Heat correlated with:- electrochemical current or current density- D/Pd loading- Vref. surface potential
- Pd metallurgy
- Laser stimulus
• For 1mm dia. Pd wire cathodes:
Pxs = M (x-x°)2 (i-i°) |iD|x°~0.875, i°=50-400mA cm-2, iD=1-10 mA cm-2,t°>200 D/D
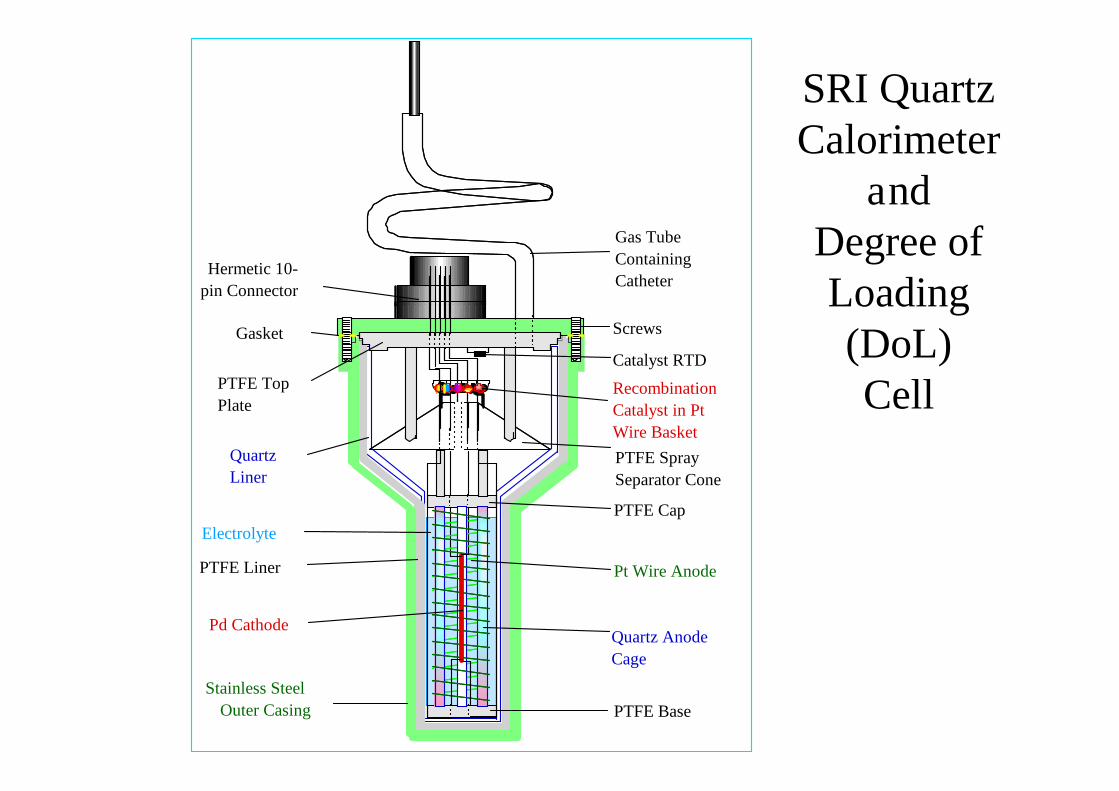
SRI QuartzCalorimeter
andDegree ofLoading(DoL)Cell
Quartz Anode
Cage
PTFE Spray
Separator Cone
Recombination
Catalyst in Pt
Wire Basket
Gas Tube
Containing
Catheter
PTFE Cap
PTFE Base
Pt Wire Anode
Catalyst RTD
PTFE Top
Plate
Hermetic 10-
pin Connector
Stainless Steel
Outer Casing
PTFE Liner
Quartz
Liner
Gasket Screws
Pd Cathode
Electrolyte
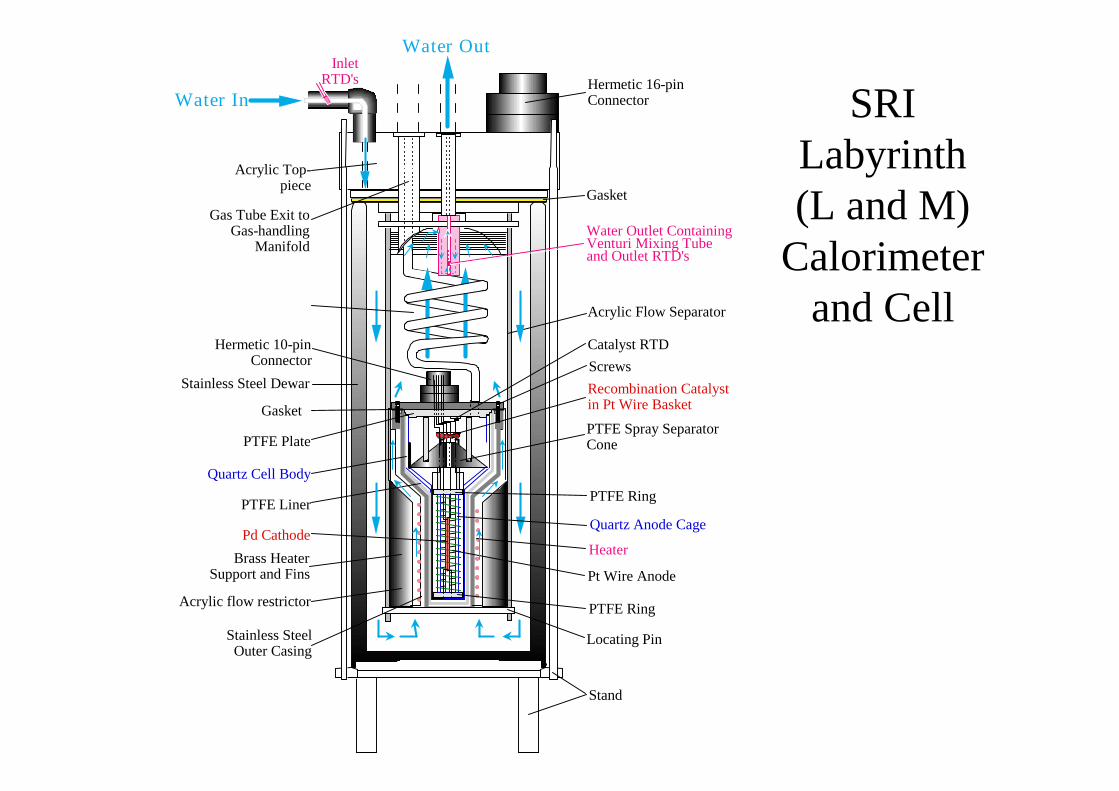
SRILabyrinth(L and M)
Calorimeterand Cell
Brass HeaterSupport and Fins
Water Outlet ContainingVenturi Mixing Tubeand Outlet RTD's
Acrylic Flow Separator
Stainless Steel Dewar
Heater
Locating Pin
Acrylic flow restrictor
Gas Tube Exit toGas-handling
Manifold
Acrylic Top-piece
Water In
Water Out
Hermetic 16-pinConnector
Gasket
Quartz Anode Cage
PTFE Ring
PTFE Ring
PTFE Spray SeparatorCone
Recombination Catalystin Pt Wire Basket
Pt Wire Anode
Catalyst RTD
PTFE Plate
Hermetic 10-pinConnector
Stainless SteelOuter Casing
PTFE Liner
Quartz Cell Body
Gasket
Screws
Pd Cathode
Stand
InletRTD's
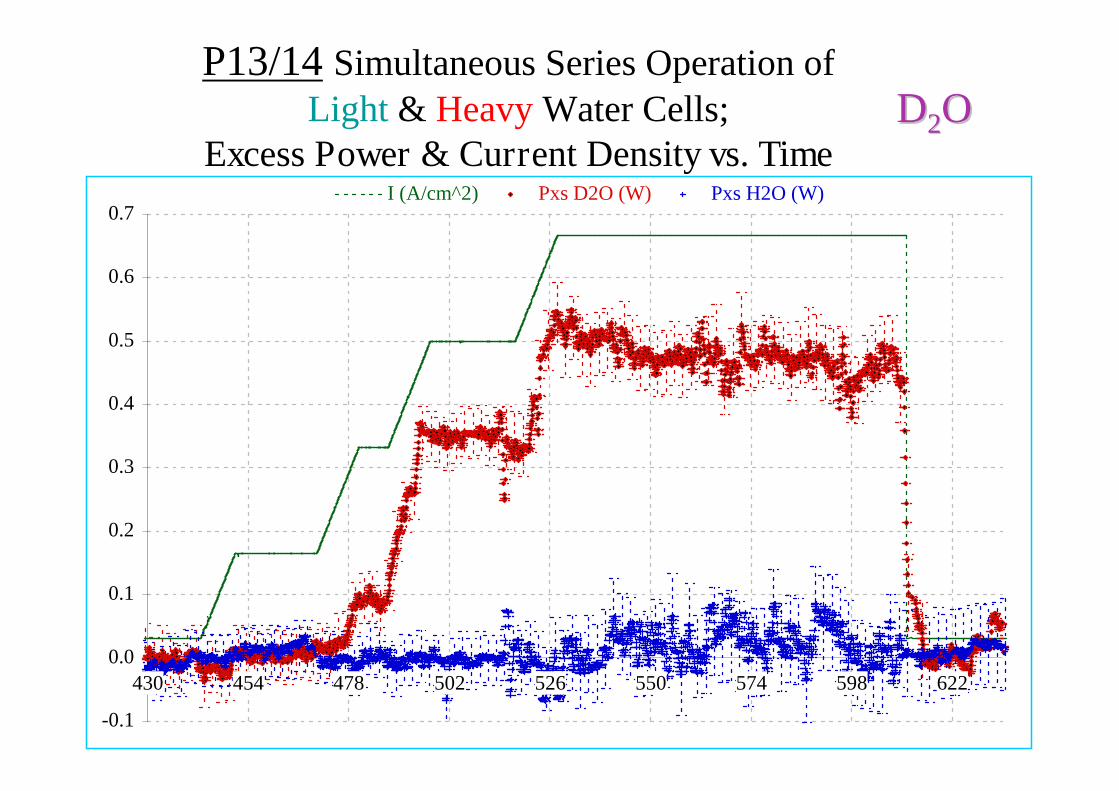
P13/14 Simultaneous Series Operation ofLight & Heavy Water Cells;
Excess Power & Current Density vs. Time
-0.1
0.0
0.1
0.2
0.3
0.4
0.5
0.6
0.7
430 454 478 502 526 550 574 598 622
I (A/cm^2) Pxs D2O (W) Pxs H2O (W)
DD22OO
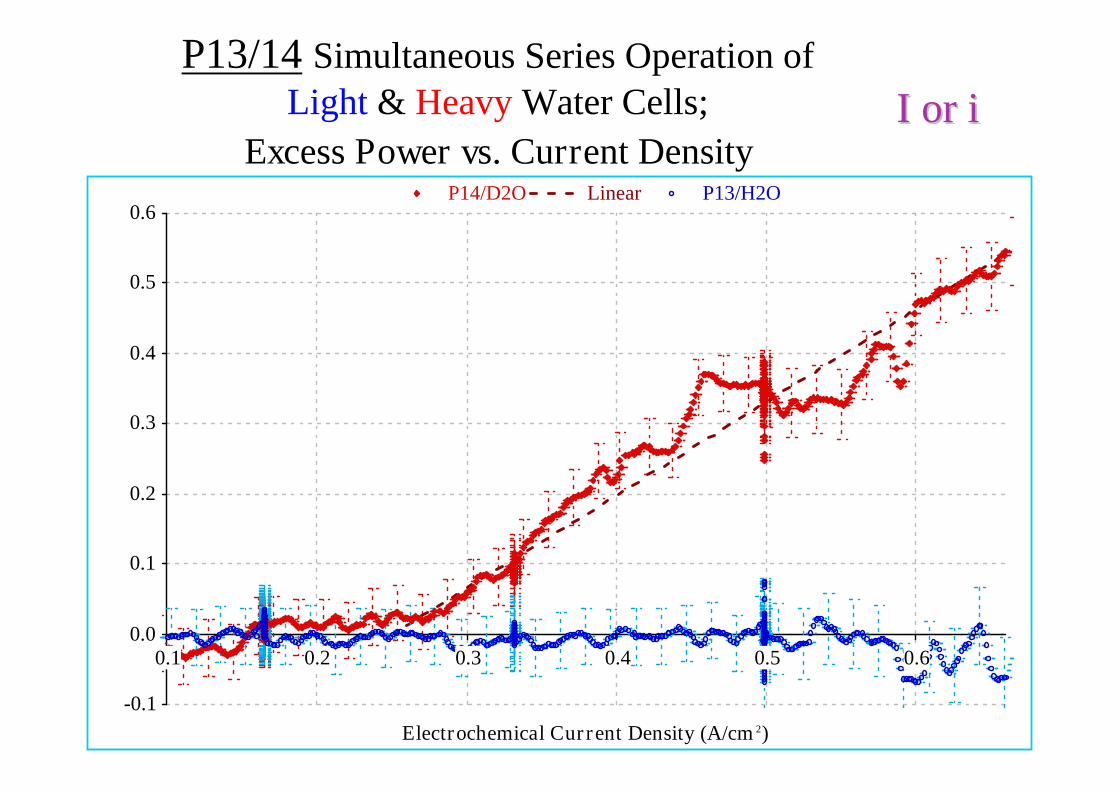
P13/14 Simultaneous Series Operation ofLight & Heavy Water Cells;
Excess Power vs. Current Density
-0.1
0.0
0.1
0.2
0.3
0.4
0.5
0.6
0.1 0.2 0.3 0.4 0.5 0.6
Electrochemical Current Density (A/cm 2)
P14/D2O Linear P13/H2O
I or iI or i
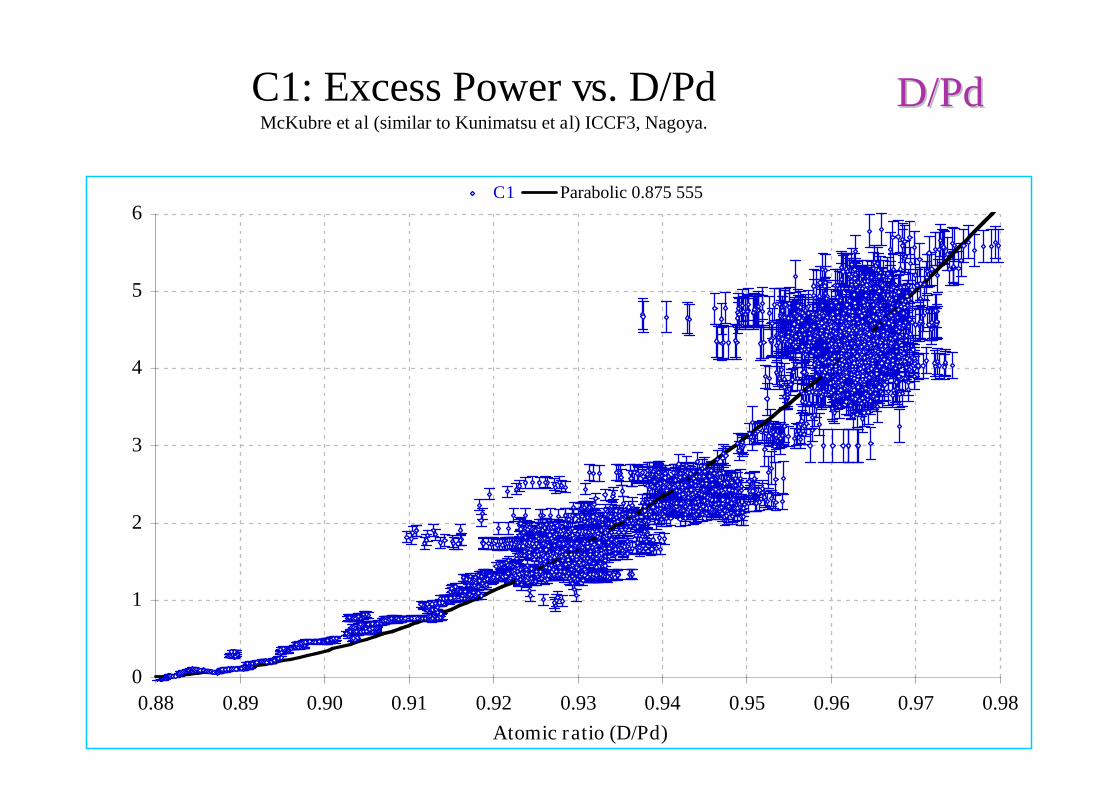
C1: Excess Power vs. D/PdMcKubre et al (similar to Kunimatsu et al) ICCF3, Nagoya.
0
1
2
3
4
5
6
0.88 0.89 0.90 0.91 0.92 0.93 0.94 0.95 0.96 0.97 0.98
Atomic ratio (D/Pd)
C1 Parabolic 0.875 555
D/PdD/Pd
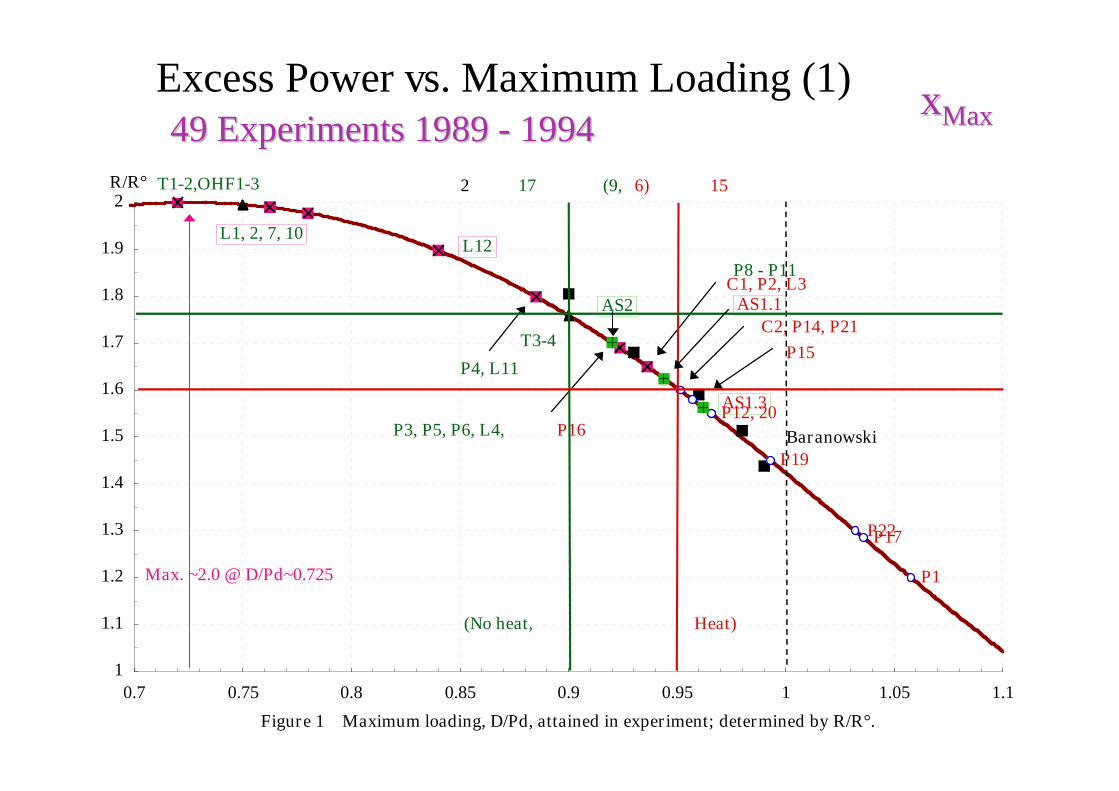
Excess Power vs. Maximum Loading (1)
P12, 20
P19
P17
P1
1
1.1
1.2
1.3
1.4
1.5
1.6
1.7
1.8
1.9
2
0.7 0.75 0.8 0.85 0.9 0.95 1 1.05 1.1
Figure 1 Maximum loading, D/Pd, attained in experiment; determined by R/R°.
R/R°
P4, L11
C2, P14, P21
C1, P2, L3
P3, P5, P6, L4,
Max. ~2.0 @ D/Pd~0.725
(9,17 15
P8 - P11
6)
P22
P16
P15
T1-2,OHF1-3
T3-4
(No heat, Heat)
L1, 2, 7, 10
2
AS1.1
AS1.3
AS2
L12
Baranowski
xxMaxMax49 Experiments 198949 Experiments 1989 -- 19941994
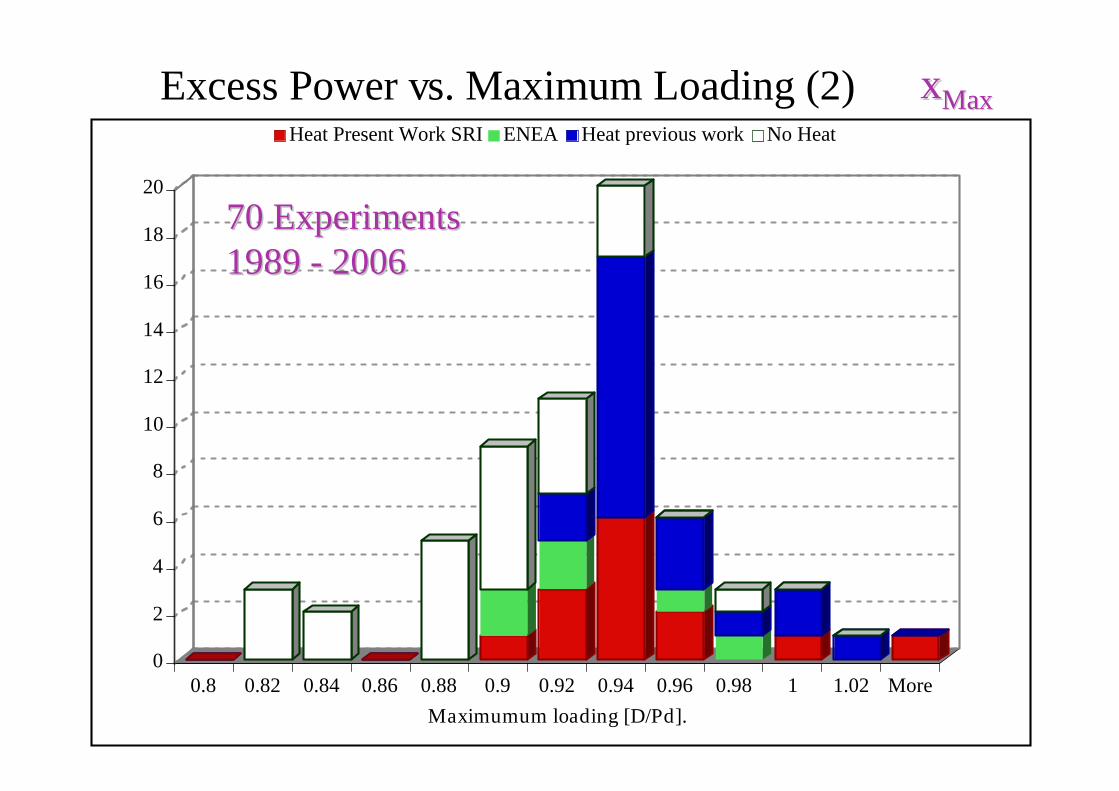
Excess Power vs. Maximum Loading (2) xxMaxMax
0
2
4
6
8
10
12
14
16
18
20
0.8 0.82 0.84 0.86 0.88 0.9 0.92 0.94 0.96 0.98 1 1.02 More
Maximumum loading [D/Pd].
Heat Present Work SRI ENEA Heat previous work No Heat
70 Experiments70 Experiments19891989 -- 20062006
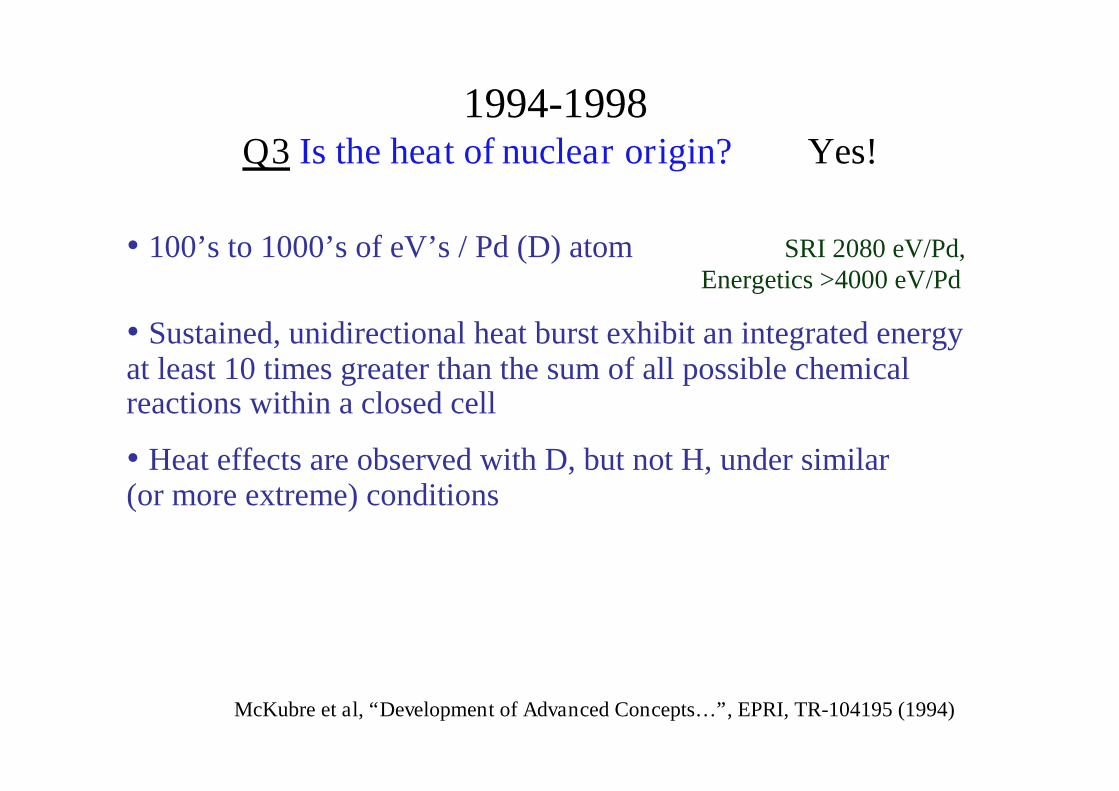
1994-1998Q3 Is the heat of nuclear origin? Yes!
• 100’s to 1000’s of eV’s / Pd (D) atom SRI 2080 eV/Pd,Energetics >4000 eV/Pd
• Sustained, unidirectional heat burst exhibit an integrated energyat least 10 times greater than the sum of all possible chemicalreactions within a closed cell
• Heat effects are observed with D, but not H, under similar(or more extreme) conditions
McKubre et al, “Development of Advanced Concepts…”, EPRI, TR-104195 (1994)
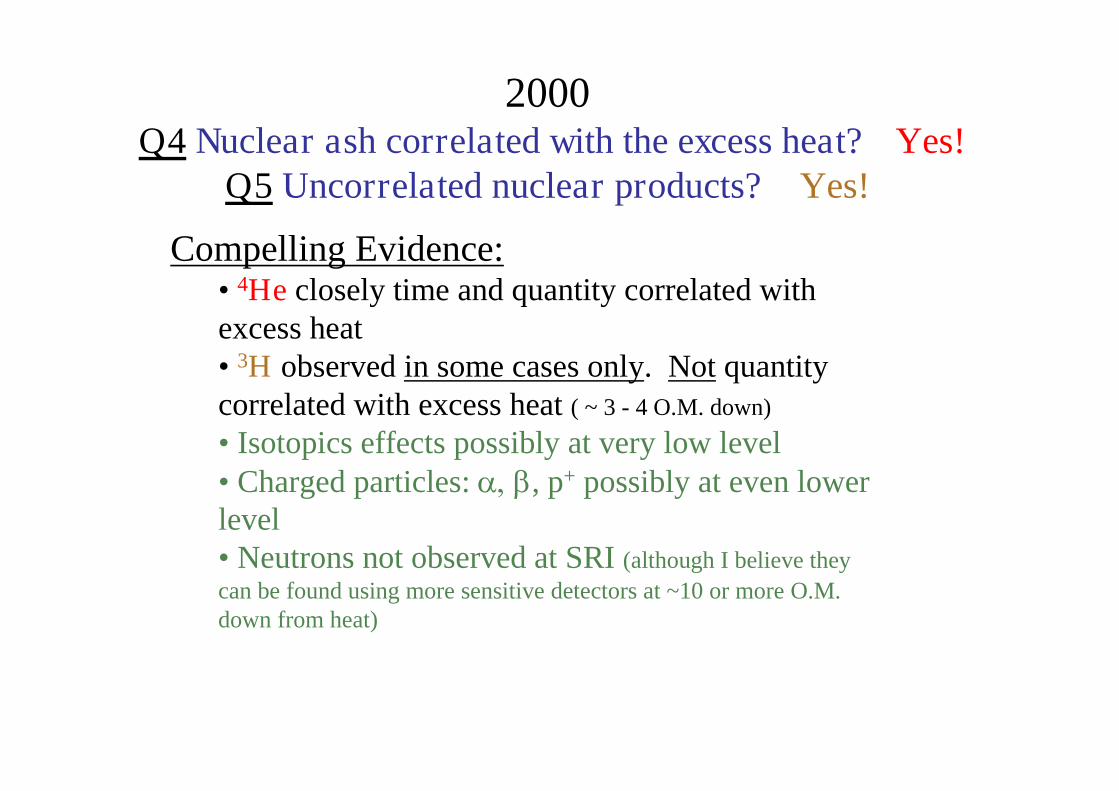
2000Q4 Nuclear ash correlated with the excess heat? Yes!
Q5 Uncorrelated nuclear products? Yes!
Compelling Evidence:• 4He closely time and quantity correlated withexcess heat• 3H observed in some cases only. Not quantitycorrelated with excess heat ( ~ 3 - 4 O.M. down)
• Isotopics effects possibly at very low level• Charged particles: , p+ possibly at even lowerlevel• Neutrons not observed at SRI (although I believe they
can be found using more sensitive detectors at ~10 or more O.M.down from heat)
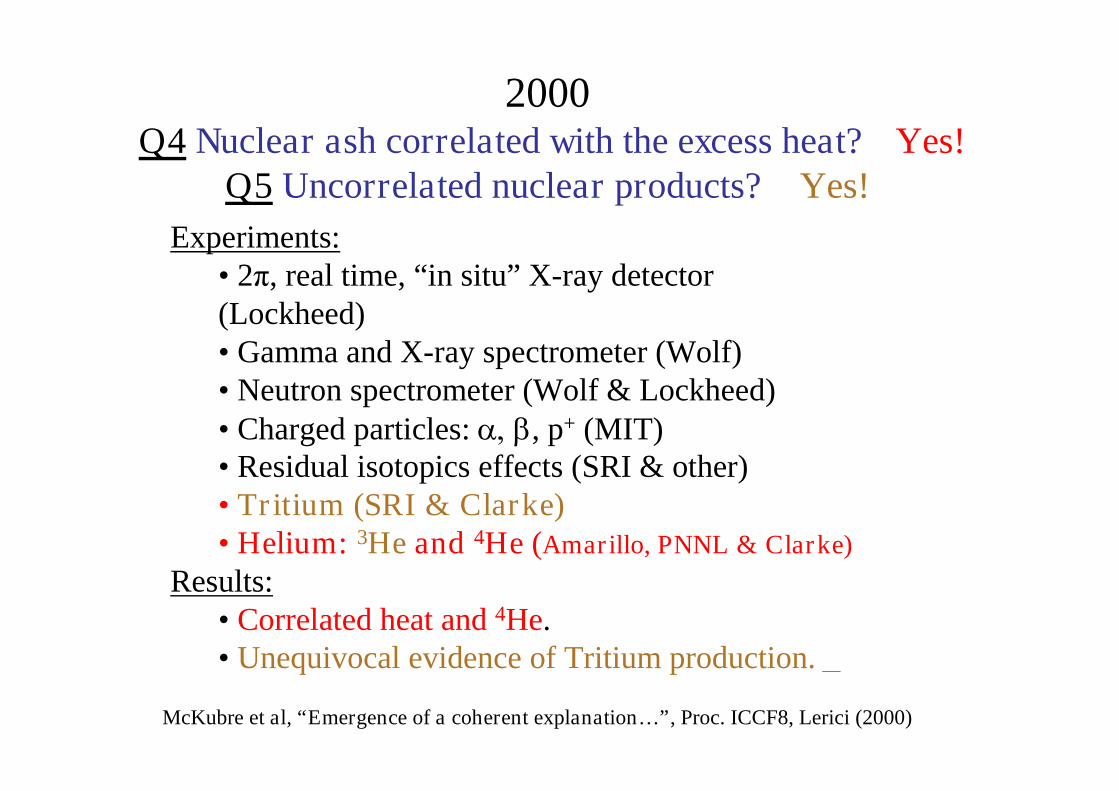
2000Q4 Nuclear ash correlated with the excess heat? Yes!
Q5 Uncorrelated nuclear products? Yes!
Experiments:• 2π, real time, “in situ” X-ray detector(Lockheed)• Gamma and X-ray spectrometer (Wolf)• Neutron spectrometer (Wolf & Lockheed)• Charged particles: , p+ (MIT)• Residual isotopics effects (SRI & other)• Tritium (SRI & Clarke)• Helium: 3He and 4He (Amarillo, PNNL & Clarke)
Results:• Correlated heat and 4He.• Unequivocal evidence of Tritium production.
McKubre et al, “Emergence of a coherent explanation…”, Proc. ICCF8, Lerici (2000)
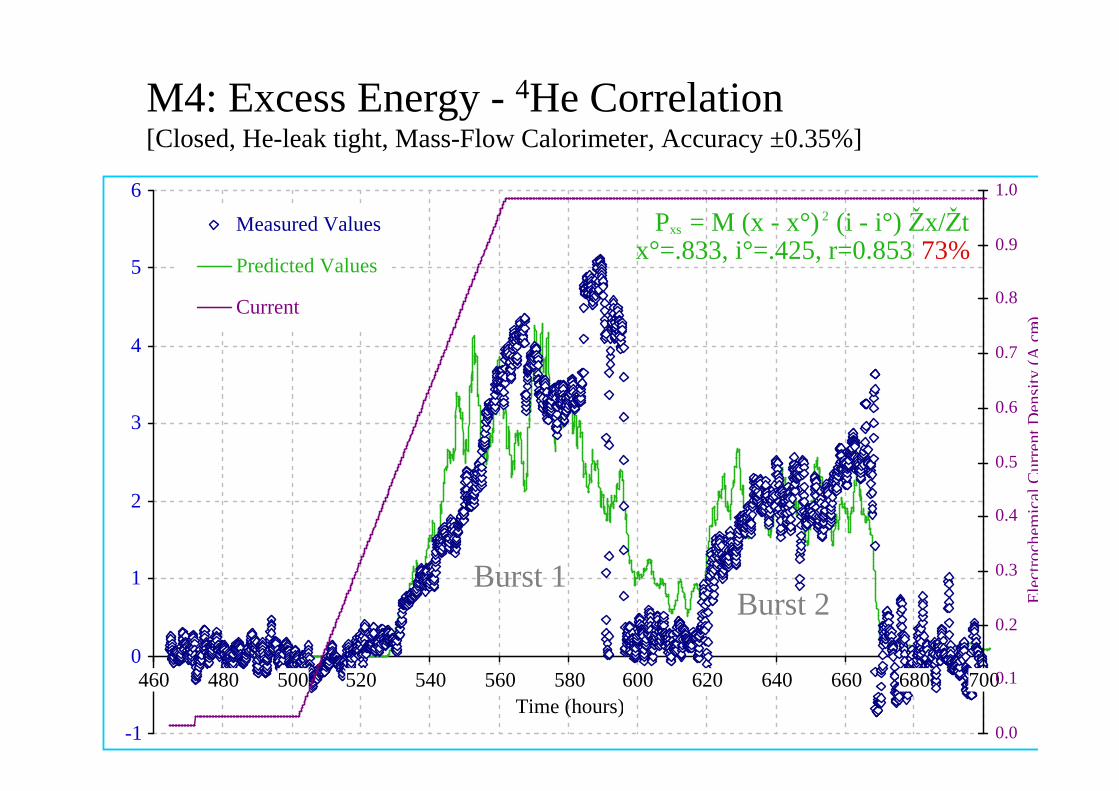
M4: Excess Energy - 4He Correlation[Closed, He-leak tight, Mass-Flow Calorimeter, Accuracy ±0.35%]
-1
0
1
2
3
4
5
6
460 480 500 520 540 560 580 600 620 640 660 680 700
Time (hours)0.0
0.1
0.2
0.3
0.4
0.5
0.6
0.7
0.8
0.9
1.0
Ele
ctro
chem
ical
Cu
rren
tD
ensi
ty(A
cm-2)
Measured Values
Predicted Values
Current
Pxs = M (x - x°) 2 (i - i°) Žx/Žtx°=.833, i°=.425, r=0.853 73%
Burst 1Burst 2
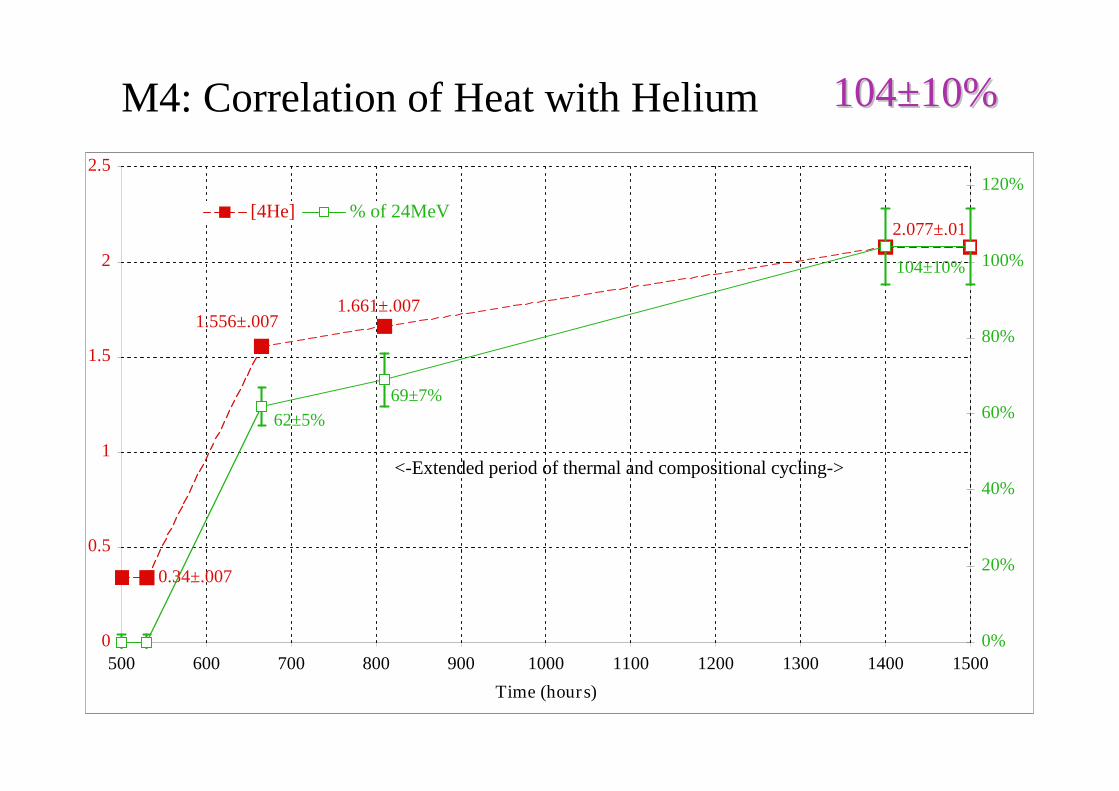
M4: Correlation of Heat with Helium
1.556±.007
0.34±.007
1.661±.007
2.077±.01
62±5%
69±7%
104±10%
0
0.5
1
1.5
2
2.5
500 600 700 800 900 1000 1100 1200 1300 1400 1500
Time (hours)
0%
20%
40%
60%
80%
100%
120%
[4He] % of 24MeV
<-Extended period of thermal and compositional cycling->
104104±±10%10%
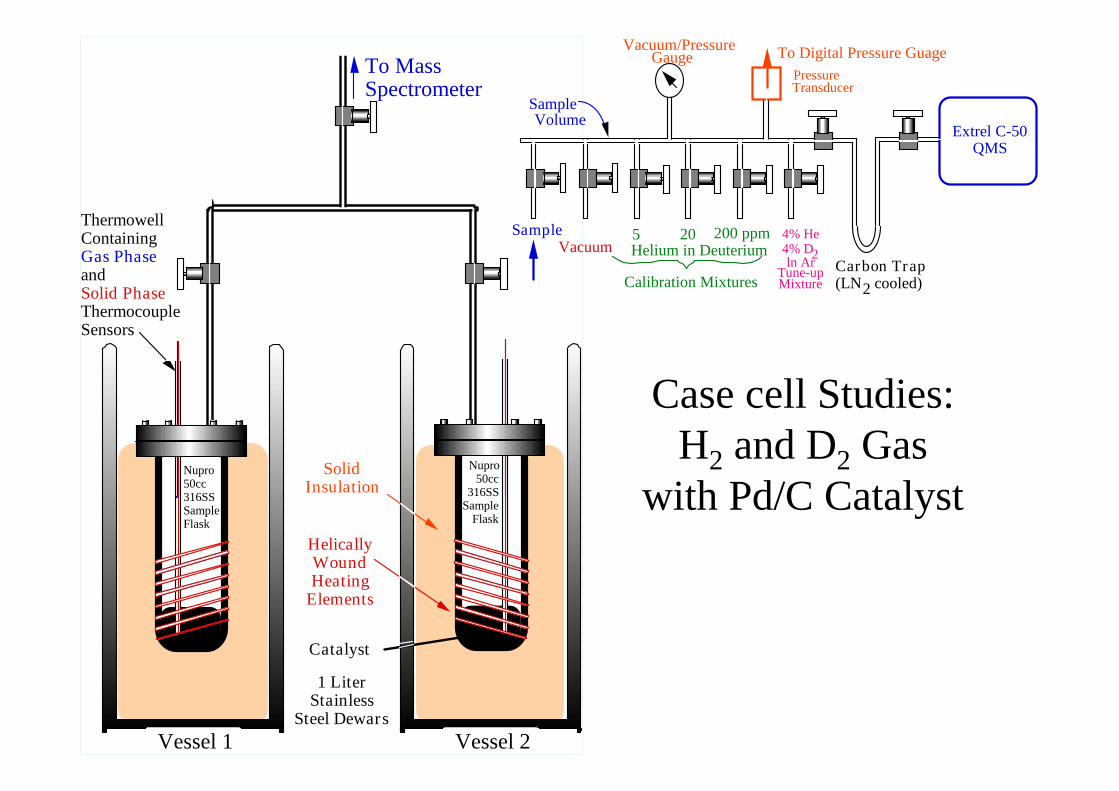
Case cell Studies:H2 and D2 Gas
with Pd/C Catalyst
Vessel 1 Vessel 2
HelicallyWoundHeating
Elements
SolidInsulation
1 LiterStainless
Steel Dewars
ThermowellContainingGas PhaseandSolid PhaseThermocoupleSensors
Catalyst
To MassSpectrometer
Nupro50cc316SSSampleFlask
Nupro50cc
316SSSample
Flask
To Digital Pressure Guage
PressureTransducer
SampleVolume
Calibration Mixtures
5 20 200 ppm
Extrel C-50QMS
SampleVacuum
Vacuum/PressureGauge
4% He4% D2ln Ar
Tune-upMixture
Carbon Trap(LN2 cooled)
Helium in Deuterium
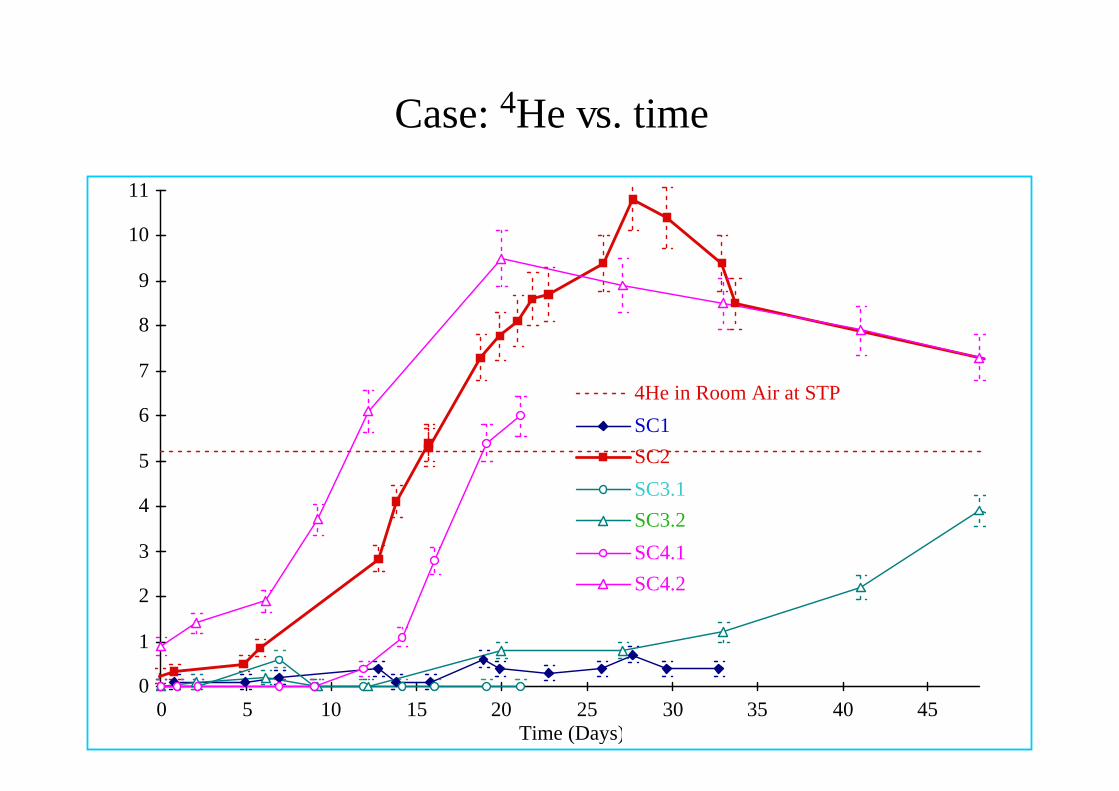
Case: 4He vs. time
0
1
2
3
4
5
6
7
8
9
10
11
0 5 10 15 20 25 30 35 40 45Time (Days)
4He in Room Air at STP
SC1
SC2
SC3.1
SC3.2
SC4.1
SC4.2
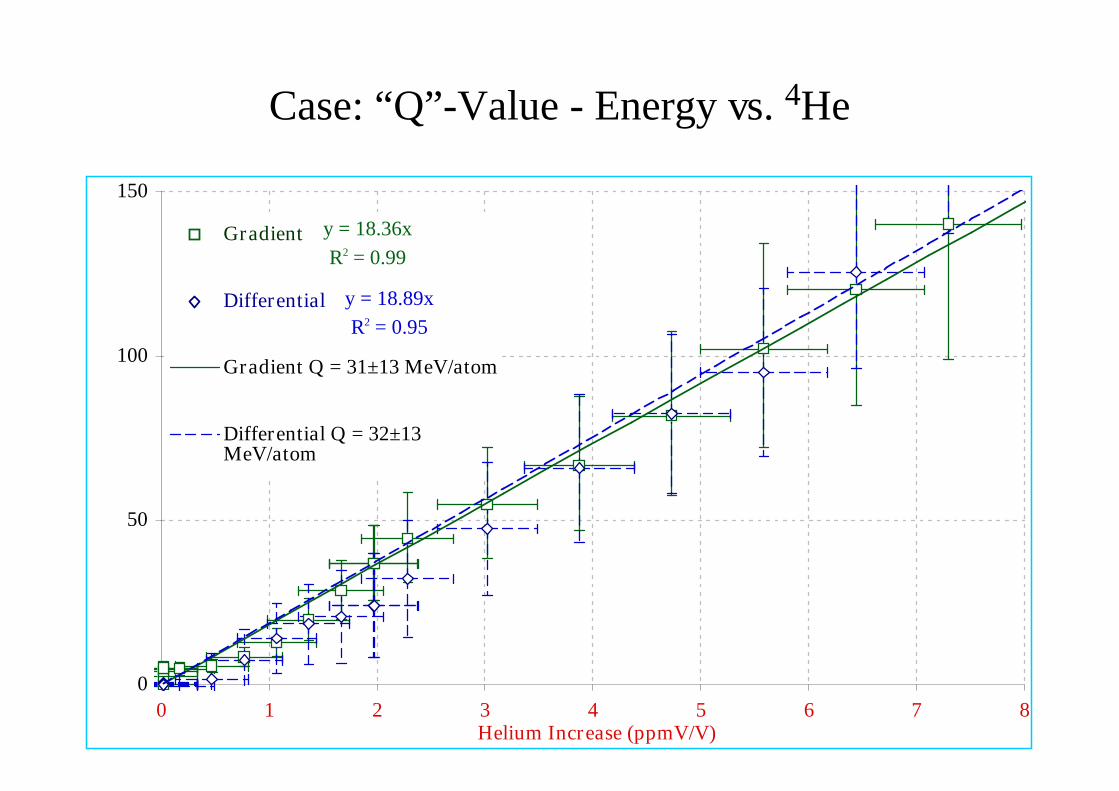
Case: “Q”-Value - Energy vs. 4He
y = 18.36x
R2 = 0.99
y = 18.89x
R2 = 0.95
0
50
100
150
0 1 2 3 4 5 6 7 8Helium Increase (ppmV/V)
Gradient
Differential
Gradient Q = 31±13 MeV/atom
Differential Q = 32±13MeV/atom
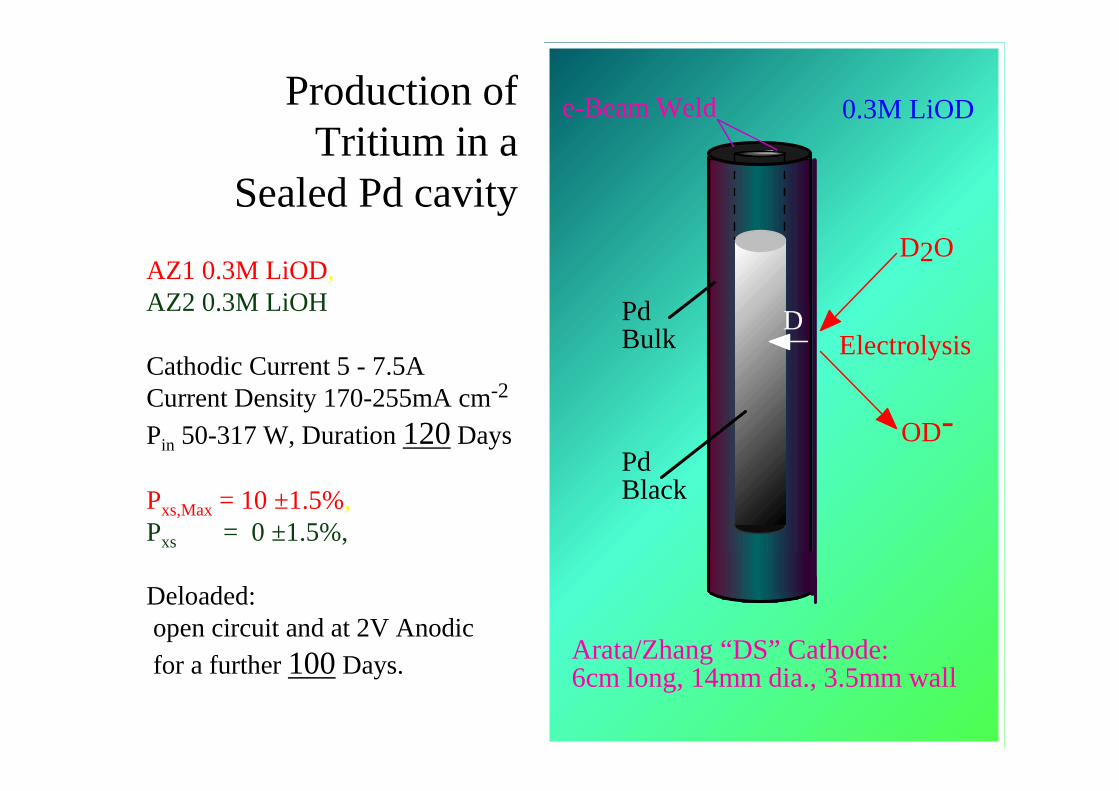
Production ofTritium in a
Sealed Pd cavity
Electrolysis
D2O
OD-PdBlack
e-Beam Weld
Arata/Zhang “DS” Cathode:6cm long, 14mm dia., 3.5mm wall
PdBulk
D
0.3M LiOD
AZ1 0.3M LiOD,AZ2 0.3M LiOH
Cathodic Current 5 - 7.5ACurrent Density 170-255mA cm-2
Pin 50-317 W, Duration 120 Days
Pxs,Max = 10 ±1.5%,Pxs = 0 ±1.5%,
Deloaded:open circuit and at 2V Anodic
for a further 100 Days.
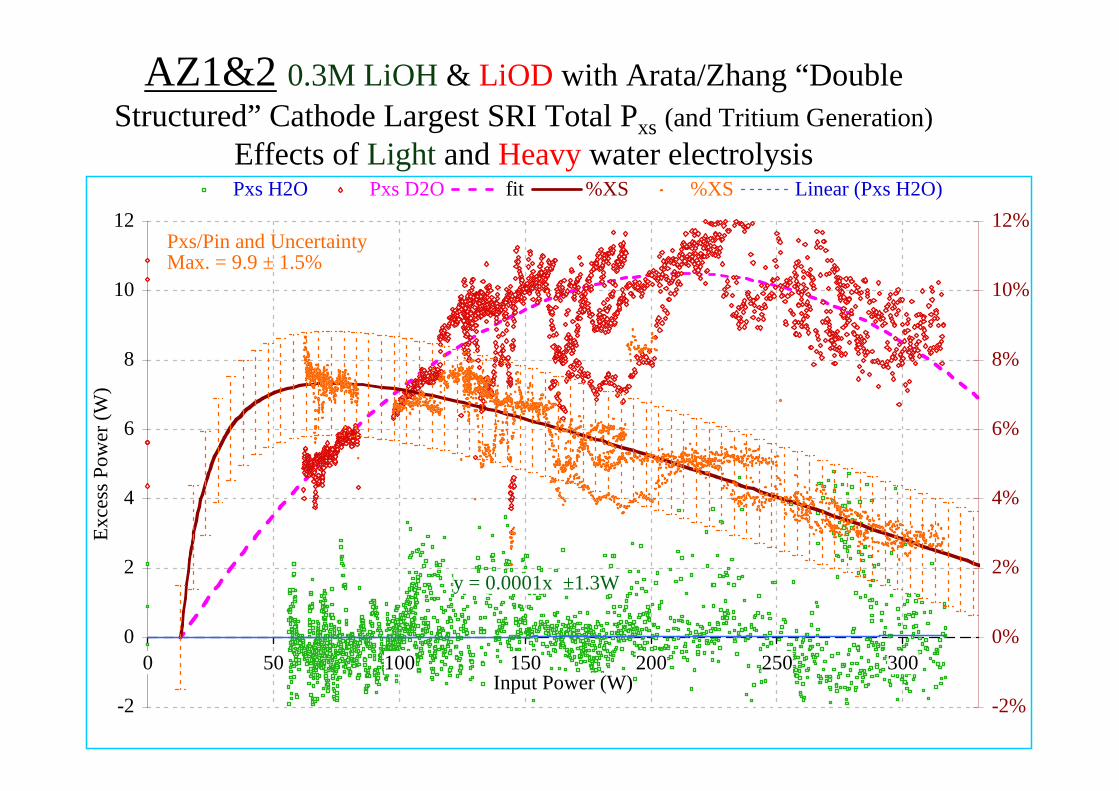
AZ1&2 0.3M LiOH & LiOD with Arata/Zhang “Double
Structured” Cathode Largest SRI Total Pxs (and Tritium Generation)
Effects of Light and Heavy water electrolysis
y = 0.0001x ±1.3W
-2
0
2
4
6
8
10
12
0 50 100 150 200 250 300Input Power (W)
Ex
cess
Po
wer
(W)
-2%
0%
2%
4%
6%
8%
10%
12%
Pxs H2O Pxs D2O fit %XS %XS Linear (Pxs H2O)
Pxs/Pin and UncertaintyMax. = 9.9 ± 1.5%
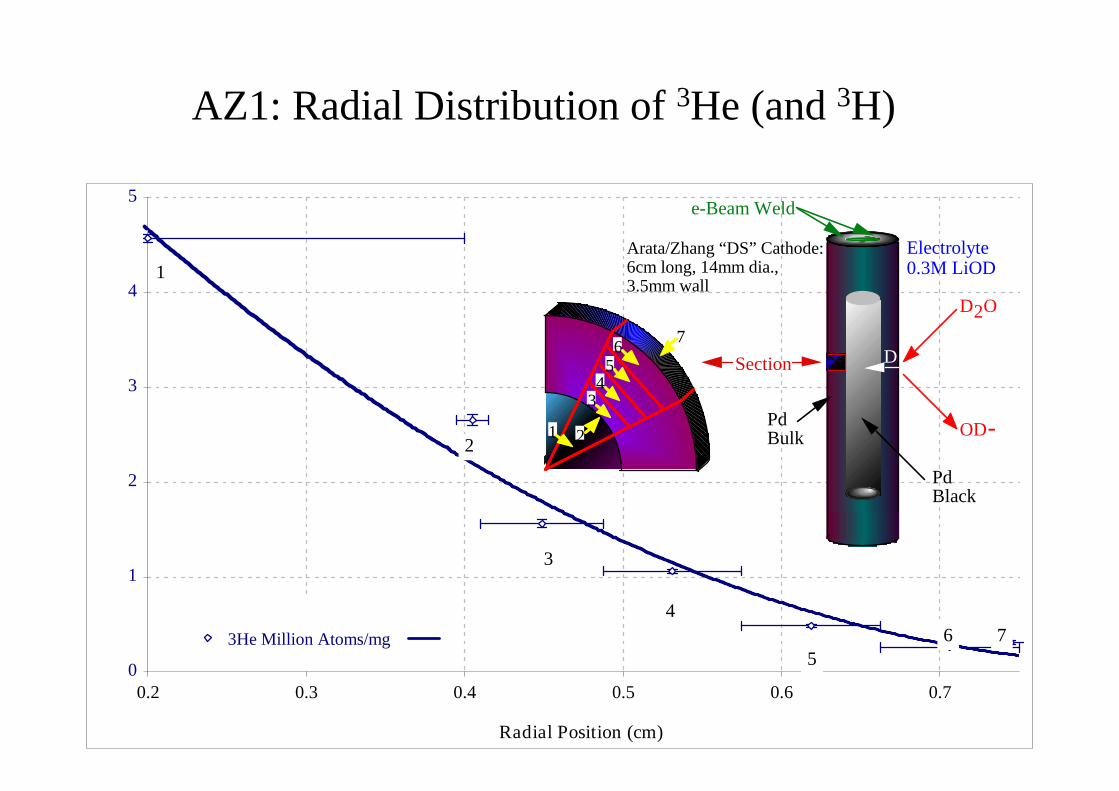
AZ1: Radial Distribution of 3He (and 3H)
0
1
2
3
4
5
0.2 0.3 0.4 0.5 0.6 0.7
Radial Position (cm)
3He Million Atoms/mg
D2O
OD-
PdBlack
e-Beam Weld
Arata/Zhang “DS” Cathode:6cm long, 14mm dia.,3.5mm wall
PdBulk
D
Electrolyte0.3M LiOD
Section
1
76
54
3
2
6
5
4
3
2
1
7
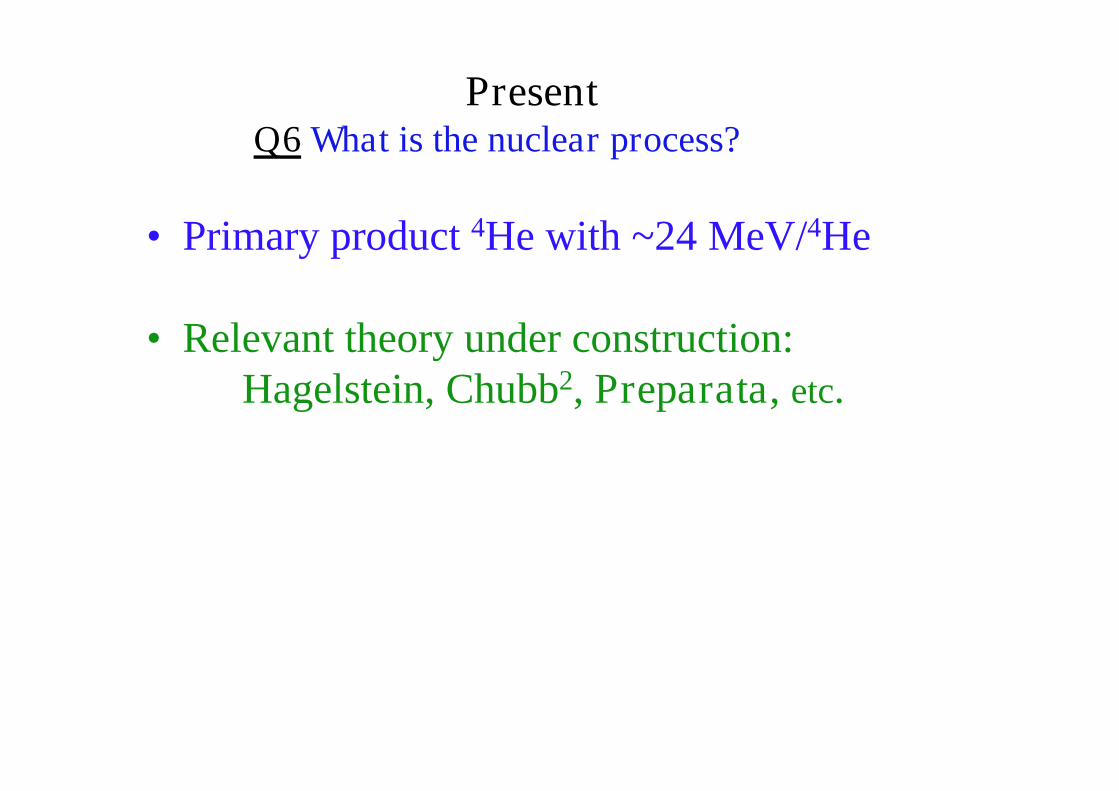
• Primary product 4He with ~24 MeV/4He
• Relevant theory under construction:Hagelstein, Chubb2, Preparata, etc.
PresentQ6 What is the nuclear process?
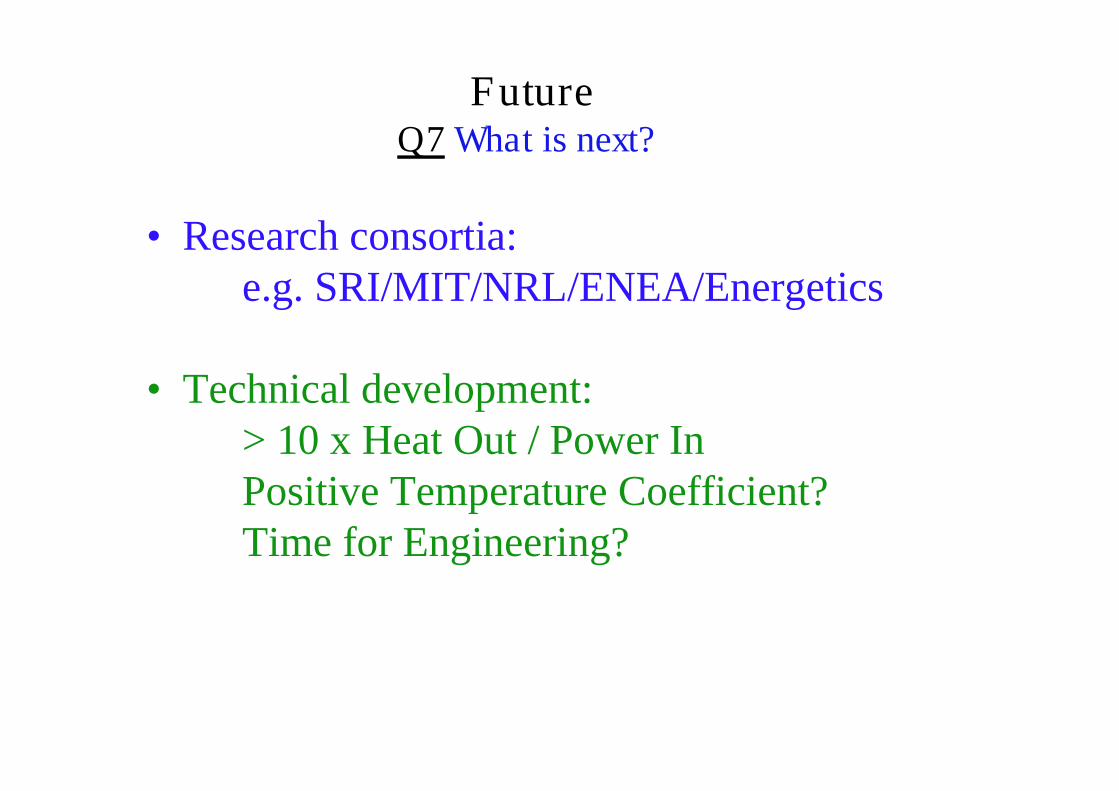
• Research consortia:e.g. SRI/MIT/NRL/ENEA/Energetics
• Technical development:> 10 x Heat Out / Power InPositive Temperature Coefficient?Time for Engineering?
FutureQ7 What is next?
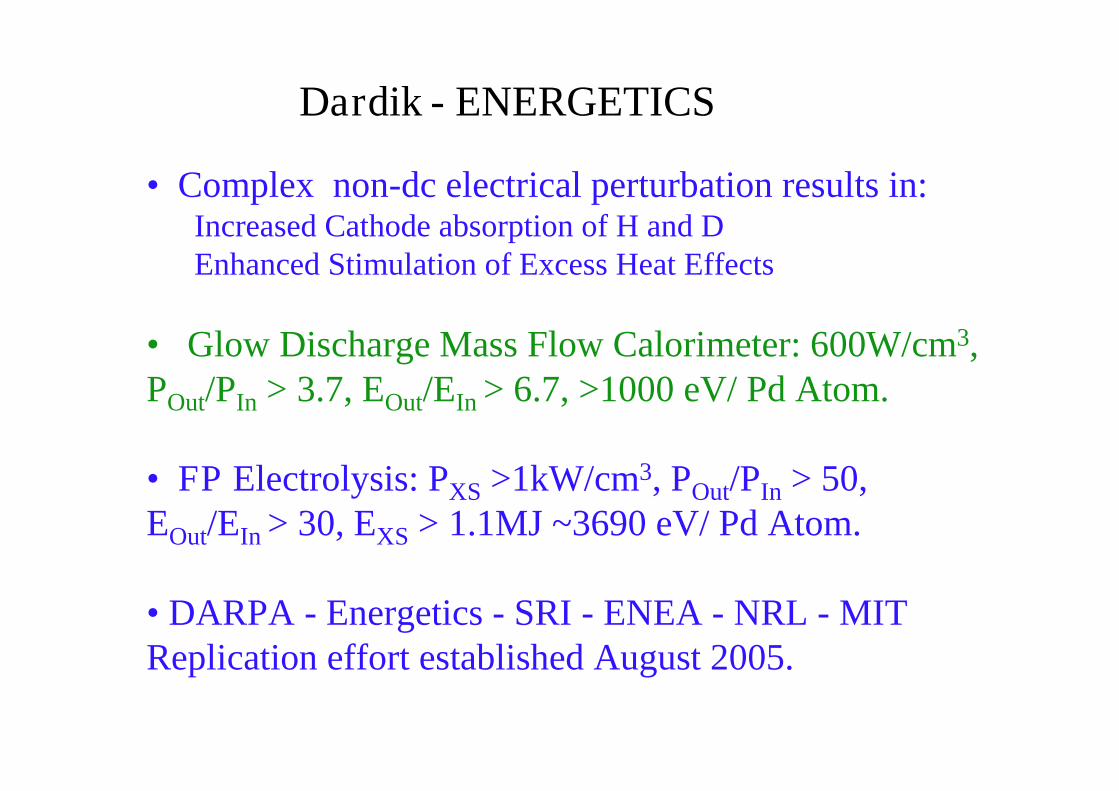
Dardik - ENERGETICS
• Complex non-dc electrical perturbation results in:Increased Cathode absorption of H and DEnhanced Stimulation of Excess Heat Effects
• Glow Discharge Mass Flow Calorimeter: 600W/cm3,POut/PIn > 3.7, EOut/EIn > 6.7, >1000 eV/ Pd Atom.
• FP Electrolysis: PXS >1kW/cm3, POut/PIn > 50,EOut/EIn > 30, EXS > 1.1MJ ~3690 eV/ Pd Atom.
• DARPA - Energetics - SRI - ENEA - NRL - MITReplication effort established August 2005.
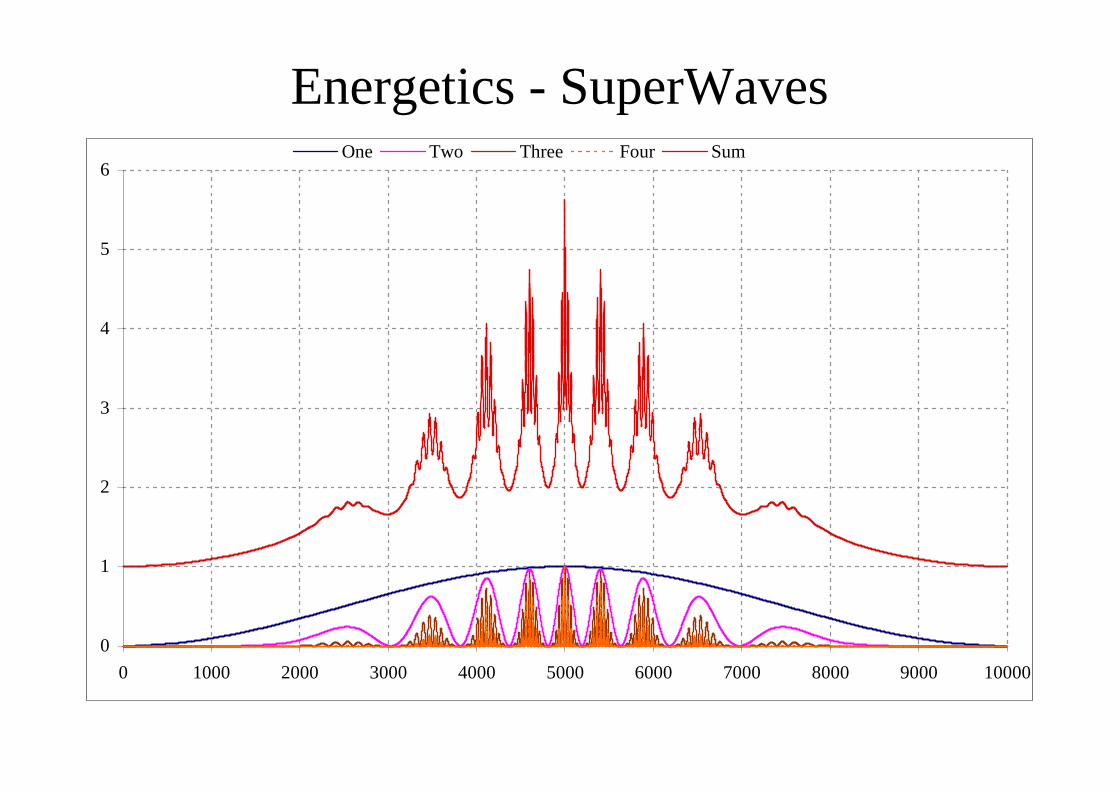
Energetics - SuperWaves
0
1
2
3
4
5
6
0 1000 2000 3000 4000 5000 6000 7000 8000 9000 10000
One Two Three Four Sum
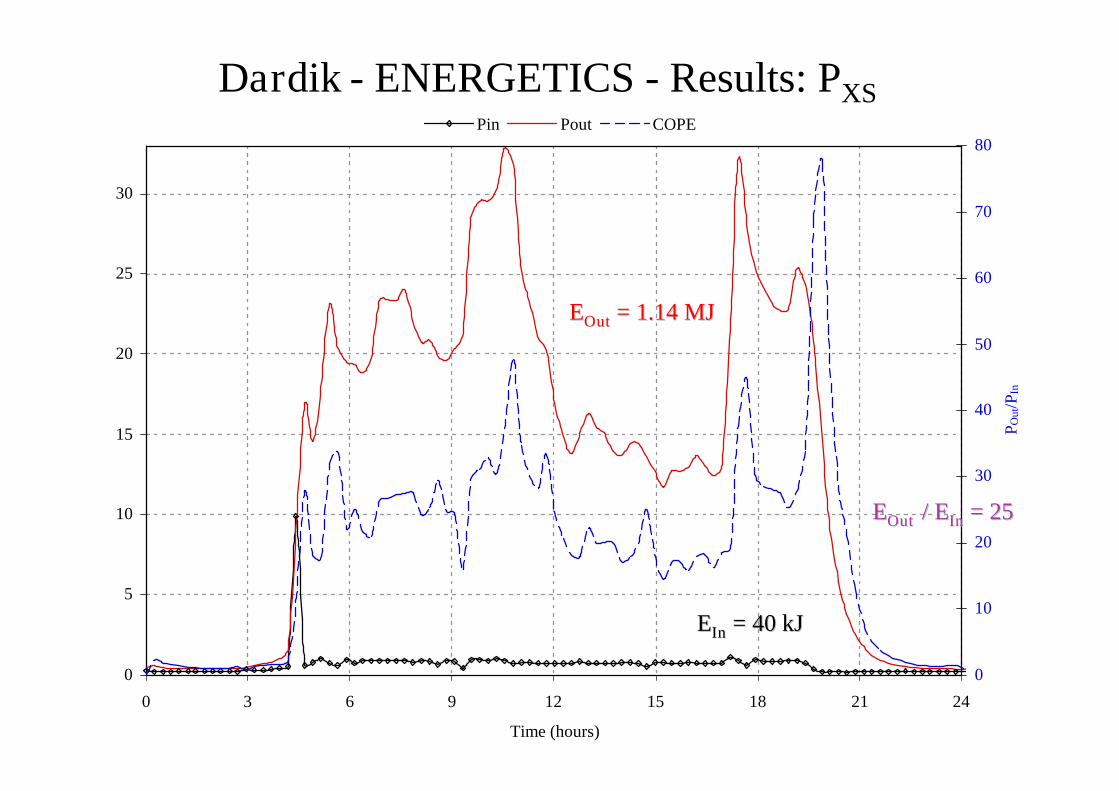
Dardik - ENERGETICS - Results: PXS
0
5
10
15
20
25
30
0 3 6 9 12 15 18 21 24
Time (hours)
0
10
20
30
40
50
60
70
80
PO
ut/P
In
Pin Pout COPE
EEOutOut = 1.14 MJ= 1.14 MJ
EEOutOut // EEInIn = 25= 25
EEInIn = 40 kJ= 40 kJ